Article

Switching Coal-Fired Thermal Power Plant to Composite Fuel for Recovering Industrial and Municipal Waste: Combustion Characteristics, Emissions, and Economic Effect

Heat and Mass Transfer Simulation Laboratory, National Research Tomsk Polytechnic University, Tomsk 634050, Russia
*
Author to whom correspondence should be addressed.
Submission received: 15 October 2019 / Revised: 31 December 2019 / Accepted: 2 January 2020 / Published: 4 January 2020

Abstract

:
Combustion characteristics were studied experimentally for single droplets of fuel slurries based on wet coal processing waste with municipal solid waste components (cardboard, plastic, rubber, and wood) and used turbine oil. We established the ignition delay time for three various groups of fuel compositions in motionless air at 600–1000 °C. The minimum values are 3 s, and the maximum ones are 25 s. The maximum temperatures in the droplet vicinity reach 1300 °C during fuel combustion for compositions with 10% of used oil. The combustion temperatures of fuel compositions without oil are 200–300 °C lower. The concentrations of anthropogenic emissions in flue gases do not exceed those from dry coal combustion. Adding used oils to composite fuels reduces the concentrations of dioxins and furans in flue gases when municipal solid waste in the fuel burns out due to high combustion temperatures. Based on the experimental research findings, we have elaborated a strategy of combined industrial and municipal waste recovery by burning it as part of composite fuels, as illustrated by three neighboring regions of the Russian Federation with different industrial structures and levels of social development. This strategy suggests switching three typical coal-fired thermal power plants (one in each of the regions) to composite liquid fuel. It will reduce the hazard of waste to the environment and decrease the consumption of high-quality coals for power generation. Implementing the developed strategy for 25 years will save 145 Mt of coal and recover 190–260 Mt of waste. The positive economic effect, considering the modernization of fuel handling systems at thermal power plants and the construction of a fuel preparation plant, will make up 5.7 to 6.9 billion dollars, or 65–78%, respectively, of the main costs of three thermal power plants operating on coal within the identical period.

Graphical Abstract

1. Introduction

One of the most important global environmental problems nowadays is processing and recovery of various waste [1,2]. Vast areas are excluded from agricultural use due to the arrangement of landfill sites for industrial and municipal waste [1,3,4]. Apart from the above factors, each particular type of waste is characterized by a certain group of factors hazardous for the environment. For instance, typical coal mining and coal processing waste is fire-hazardous and contains heavy metals and acid-forming substances that become sources of integrated environmental pollution under severe exposure to natural factors [2]: solar energy, water, and air. Oil and petroleum waste are toxic. Storing such liquids under the conditions that do not comply with regulatory requirements leads to water pollution and acid rains as well as enhances the greenhouse effect [5]. Landfill storage of untreated municipal solid waste (MSW) can be the cause of pollution ground waters and air by bacterial flora as well as a source of dioxins and furans (PCDD/Fs) in case uncontrollable local combustion occurs at a landfill [4,6].
There is an urgent need for an effective solution to the problem of waste treatment in the short term if the global environmental situation is to be preserved at the same level at least [4]. Experts estimate [7,8] that, despite the advances in waste management, the technologies now widely used for the treatment of waste (primarily and municipal) will not completely solve the issue of environmental pollution. Table 1 illustrates waste generation in 2018 and projections for the near future by country [4]. It is shown (Table 1) that waste generation all over the world grows rapidly. Therefore, the problem of waste recovery calls for the development of drastic solutions.
Nowadays, countries that stockpile their waste mainly at landfill sites (75–95%) take considerable efforts to develop waste management (regarding MSW). However, a low dynamics of waste management system transformation does not lead to a substantial improvement of the environmental situation. These countries are [4] the Russian Federation (MSW dumping at landfill sites is 95.0% of the total amount of annual waste generation), Turkey (98.0%), Ukraine (94.1%), Chile (93.7%), Mongolia (93.5%), Belarus (84.0%), Thailand (80.5%), Greece (80.0%), and India (77.0%).
The Russian Federation can be used as an example to provide the following typical statistical data that characterize quite a low level of waste management and common waste treatment technology development. As reported by the Russian Federal State Statistics Service, 6220.6 Mt of municipal and industrial waste were accumulated in Russia during 2017, which is 14.32% more than the statistical data for 2016 [9]. About 50% of such waste is recovered, while the rest is buried in the soil (about 13%) and stored at open-air disposal sites (about 37%). So far, more than 94 billion t of industrial waste have been collected in Russia; more than a half of it comes from the extraction and processing of solid and liquid hydrocarbons. Due to a low level of recycling and decontamination of industrial waste, a great amount of it (28.4 billion t) is stockpiled at open sites of industrial enterprises, which take up about 1 Mha of land.
The situation is much more critical with MSW. The level of its processing in Russia does not exceed 5%. The main method of treatment is sorting and separation of recyclables. The rest of the waste is usually stored at open-air disposal sites [10,11]. Although the share of MSW in the total volume of Russia’s waste is about 1% (or 57 Mt in 2017), it is this type of waste that poses the greatest threat to the population, as large disposal sites of MSW are located close to where most of the population resides (in the suburbs of large cities and megalopolises). The low level of MSW recovery is explained by the undeveloped waste management infrastructure. In Russia, it is represented by about 240 MSW treatment facilities; about 50 sorting complexes; and 3 incineration plants with annual capacities of 75, 200, and 750 t of MSW recovery by burning.
Thus, the share of recoverable waste is less than 50% on average, which is only provided by the industrial use of bulk waste to fill up mined-out spaces in the natural raw material extraction and to rehabilitate disturbed lands. In Russia, the level of manufacturing waste recovery does not exceed 30–60%, whereas that of MSW recovery is just about 5%. The experience of countries with a high level of MSW management development [12] (Germany’s MSW recovery is 67.6% of the total amount of annual waste generation, that of South Korea is 59.0%, that of Slovenia is 57.8%, that of Austria is 57.7%, that of the Netherlands is 54.2%, that of Belgium is 53.7%, and that of Switzerland is 52.5%) shows that the rational organization of waste recycling can boost these indicators to 50–70% [13,14].
Modernizing waste management and giving up the accumulation and burial of waste in favor of its processing and reuse requires an intermediate stage of waste treatment in the next 20–30 years. Within this period, the technologies of industrial recovery of waste by burning it for the production of electricity and heat will be in high demand [15,16,17,18]. Implementing such technologies will reduce the growing amount of waste at landfills. This will preserve the boundaries of landfill sites or, in some cases, even shrink them due to the combustion of waste that is unsuitable for recycling.
Therefore, it is a relevant task to develop industrial technologies to recover large amounts of MSW. The most efficient solution to this task is combustion of waste to produce power [16,17,19,20], e.g., at trash incineration plants. However, the construction and operation of technically sophisticated industrial facilities using MSW direct combustion are commercially unviable [21]. Moreover, electricity generation also requires extra investments in the development of new modifications of steam turbines, designed for relatively low parameters of water vapor [22,23]. Another technical problem, involving large investments, is strict flue gas cleaning requirements. Nowadays, there are rather tough legal restrictions [10,24,25] on the content of harmful substances in the flue gases of MSW incineration plants (EU 94/67/EEC), which will entail additional installation and maintenance expenses for costly gas filtration systems.
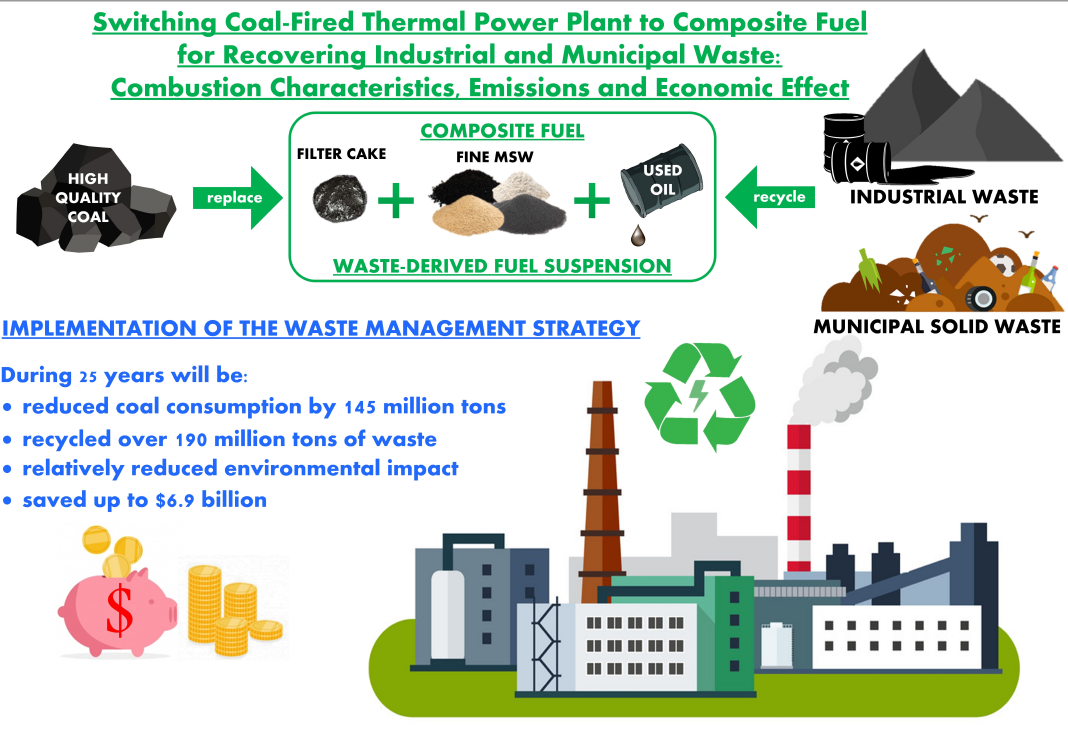
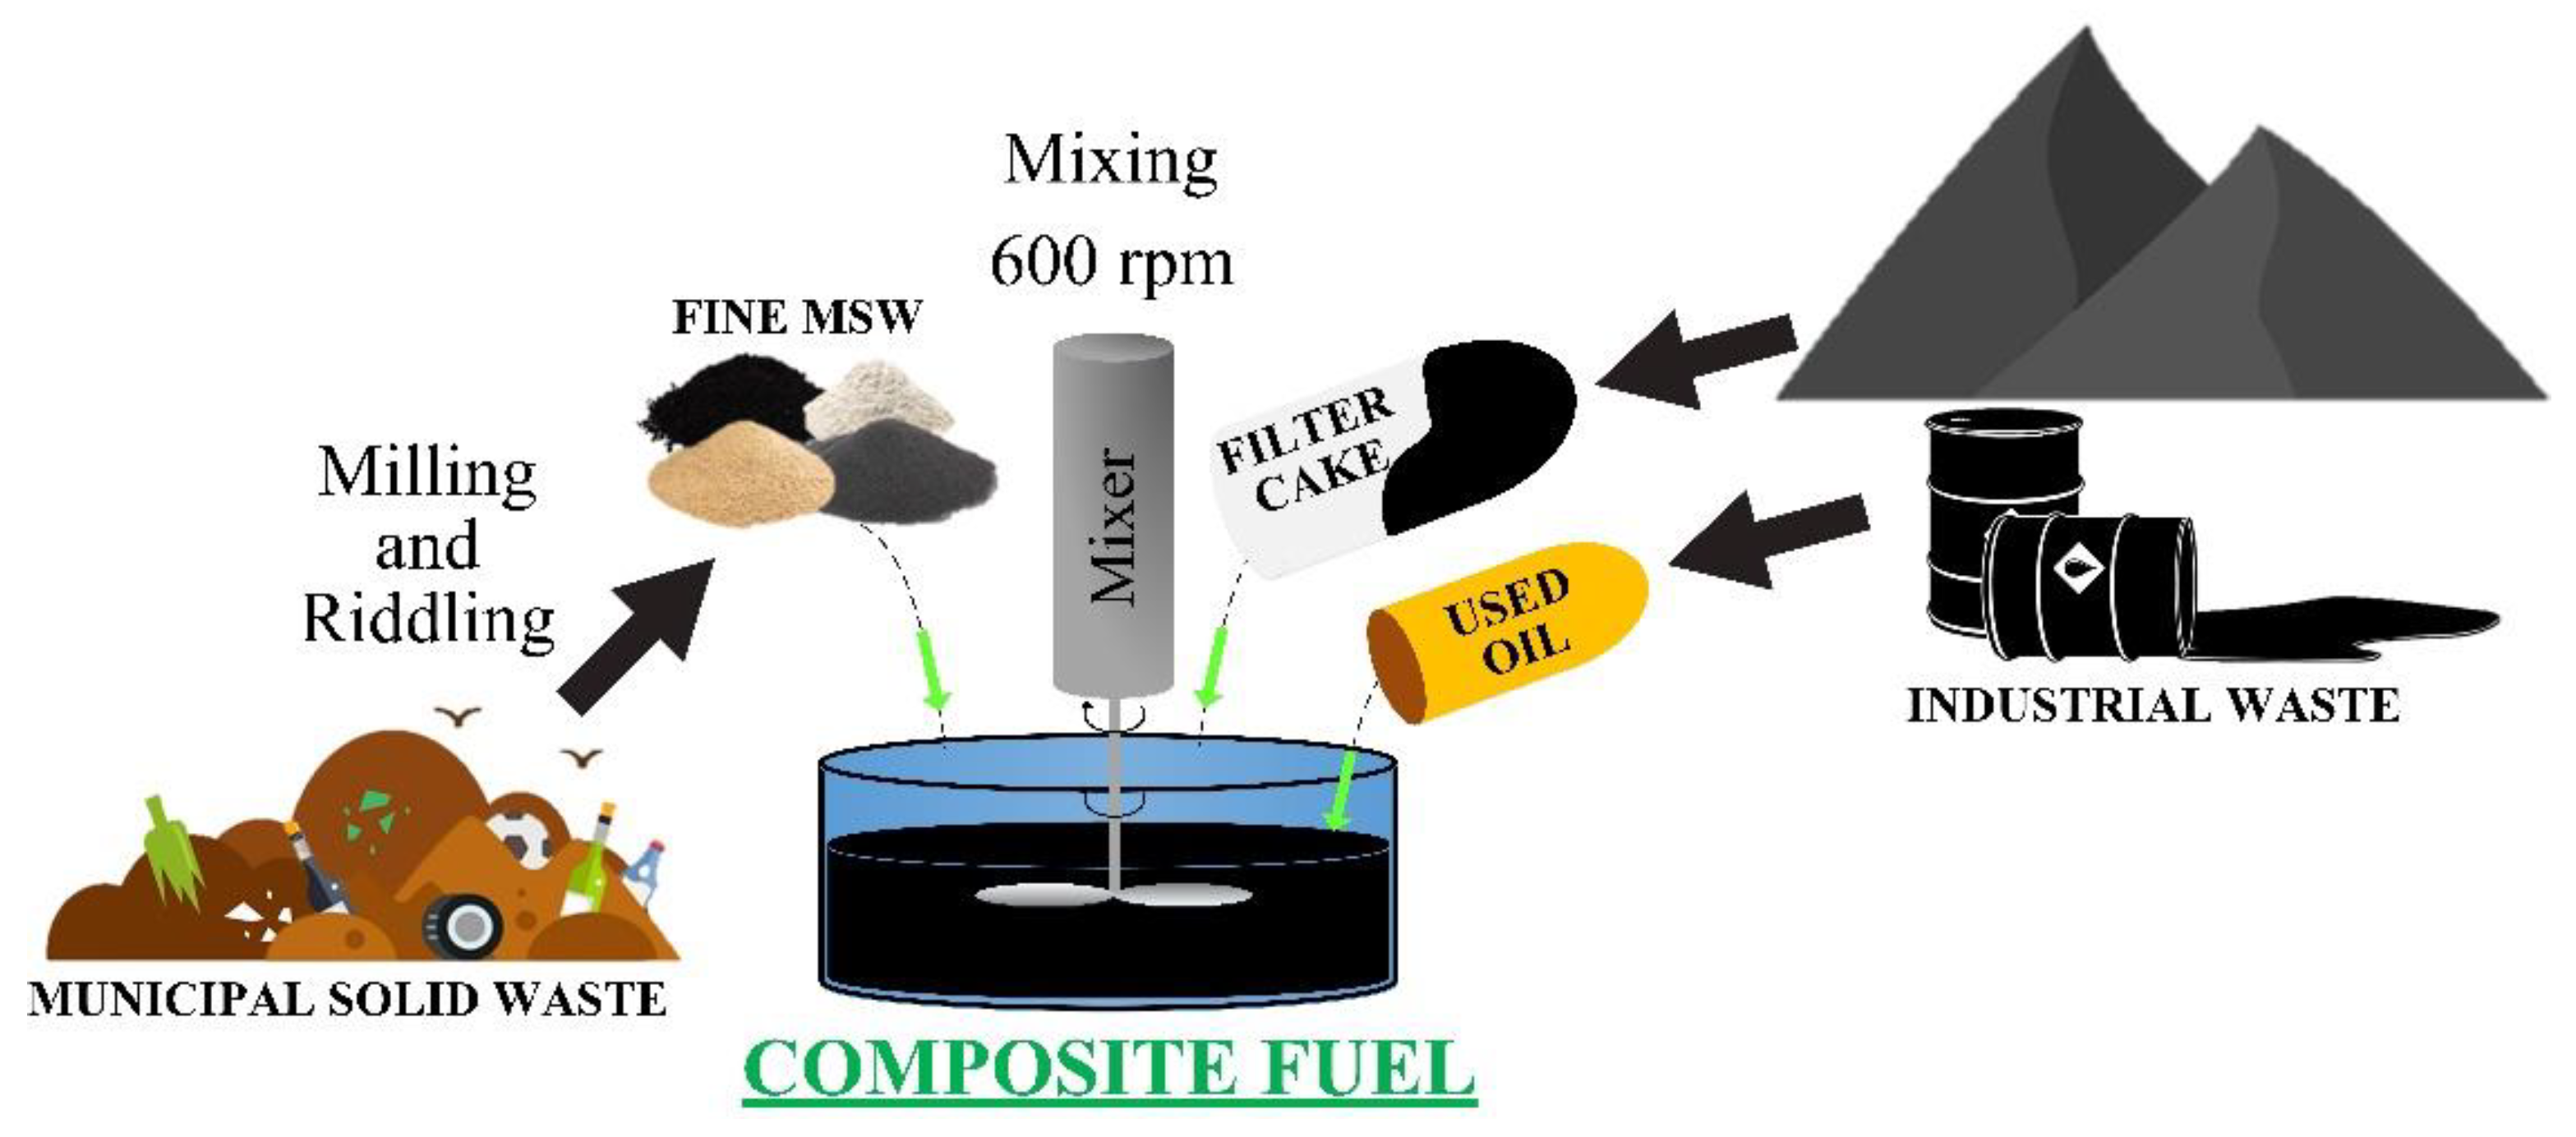
One of the alternative approaches to solving this problem is adding fine particles of MSW to composite liquid fuel based on a mixture of wet coal with a combustible liquid. Typical components are coal processing waste and used oils (engine, turbine, transformer, and other). According to a theoretical analysis [26], burning composite fuels containing 10–20% of MSW make it possible to decrease the area of territories for MSW disposal by 20–30%. The above approach is economically efficient because free combustible waste will replace costly fossil fuels to produce electrical and thermal energy.
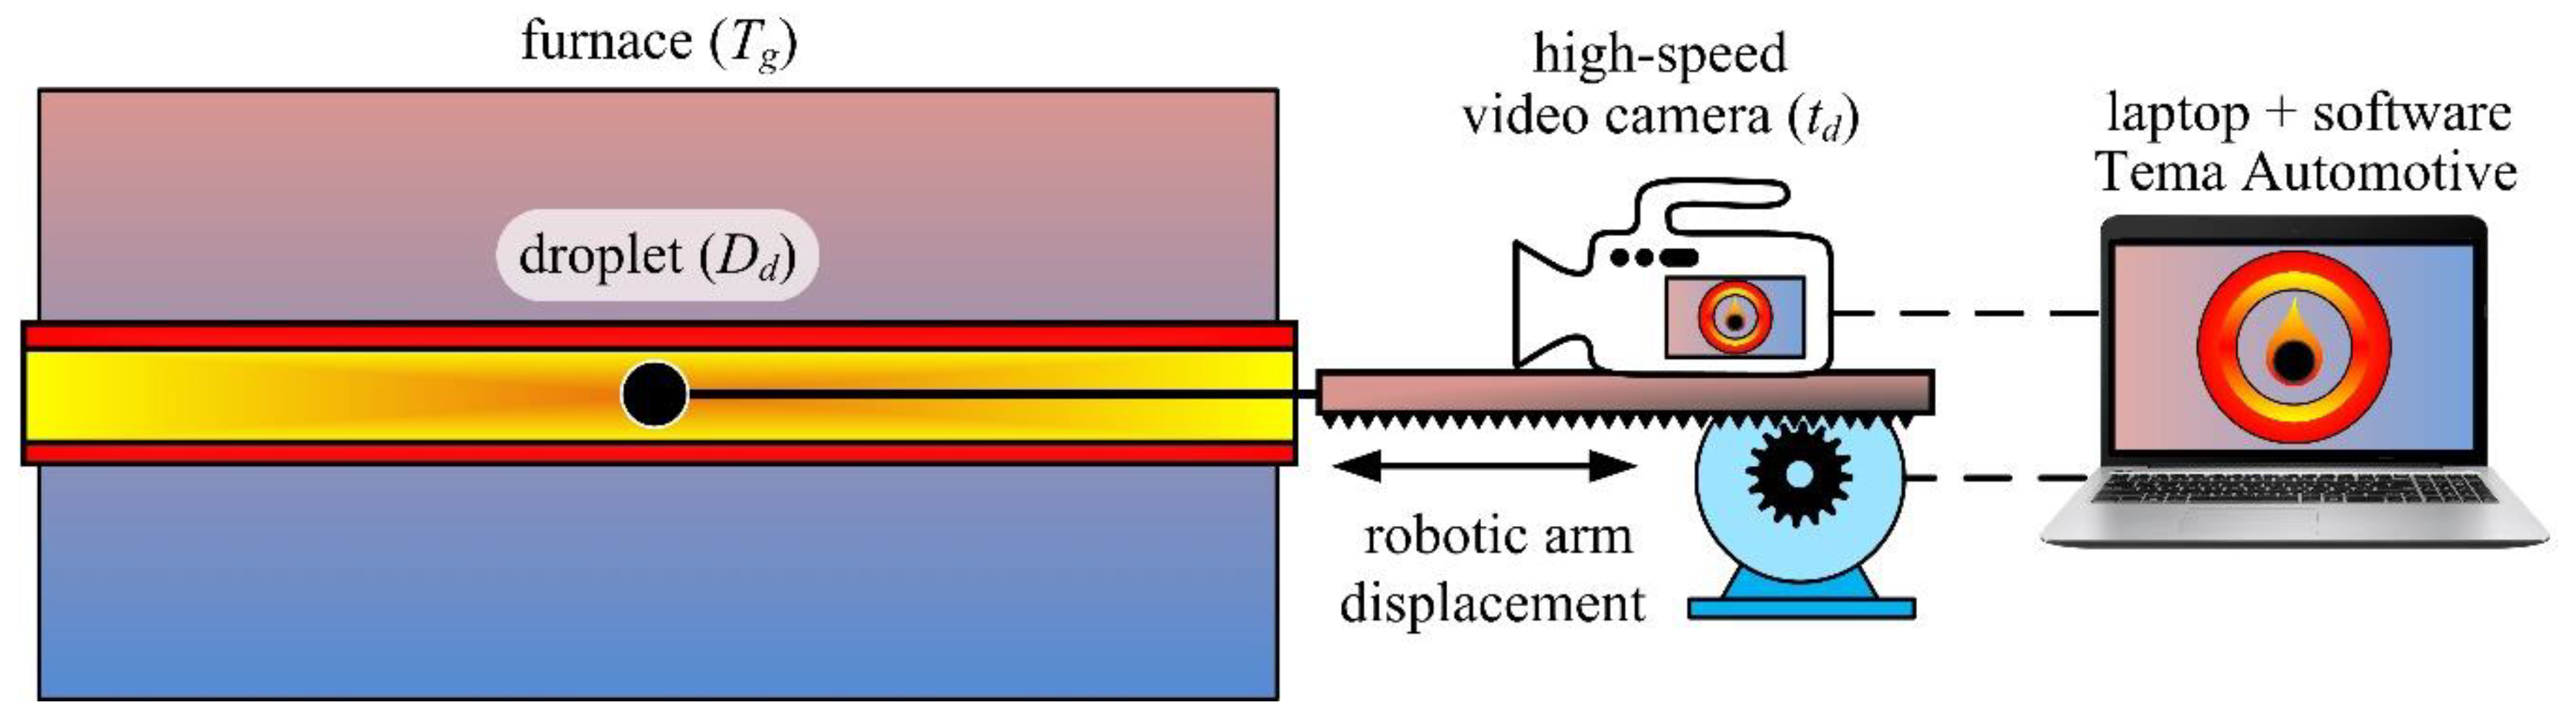
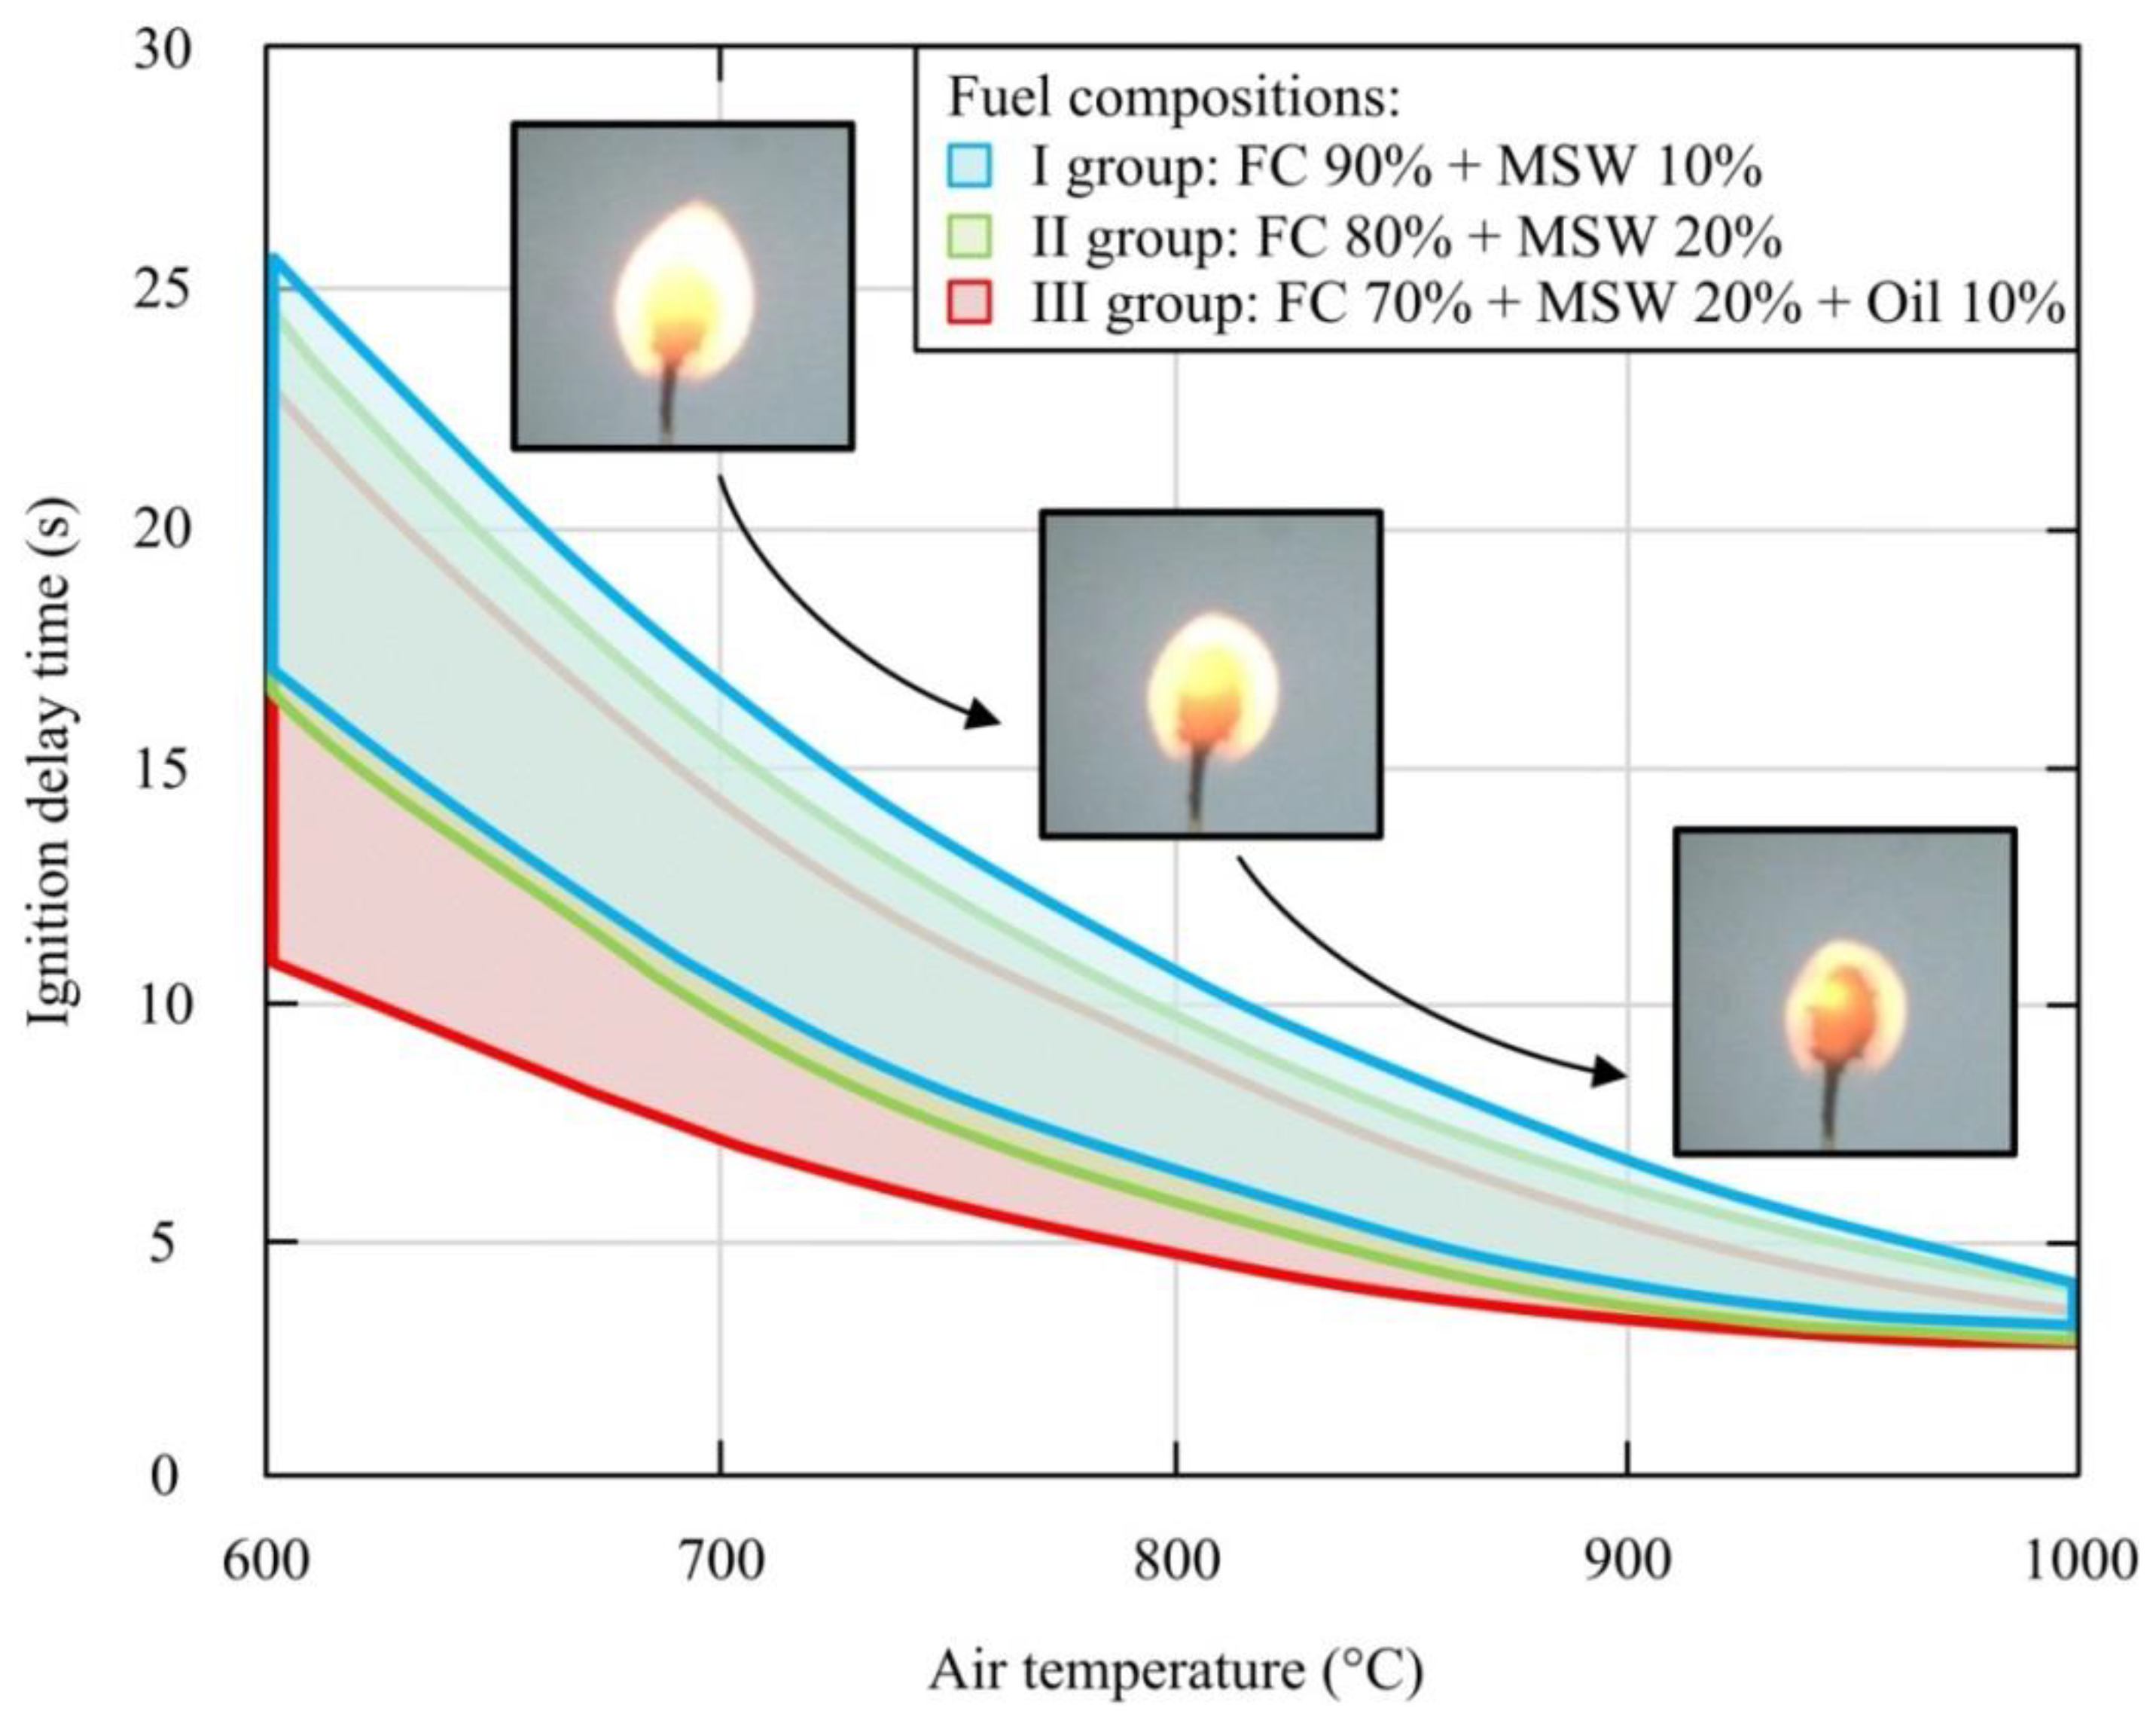
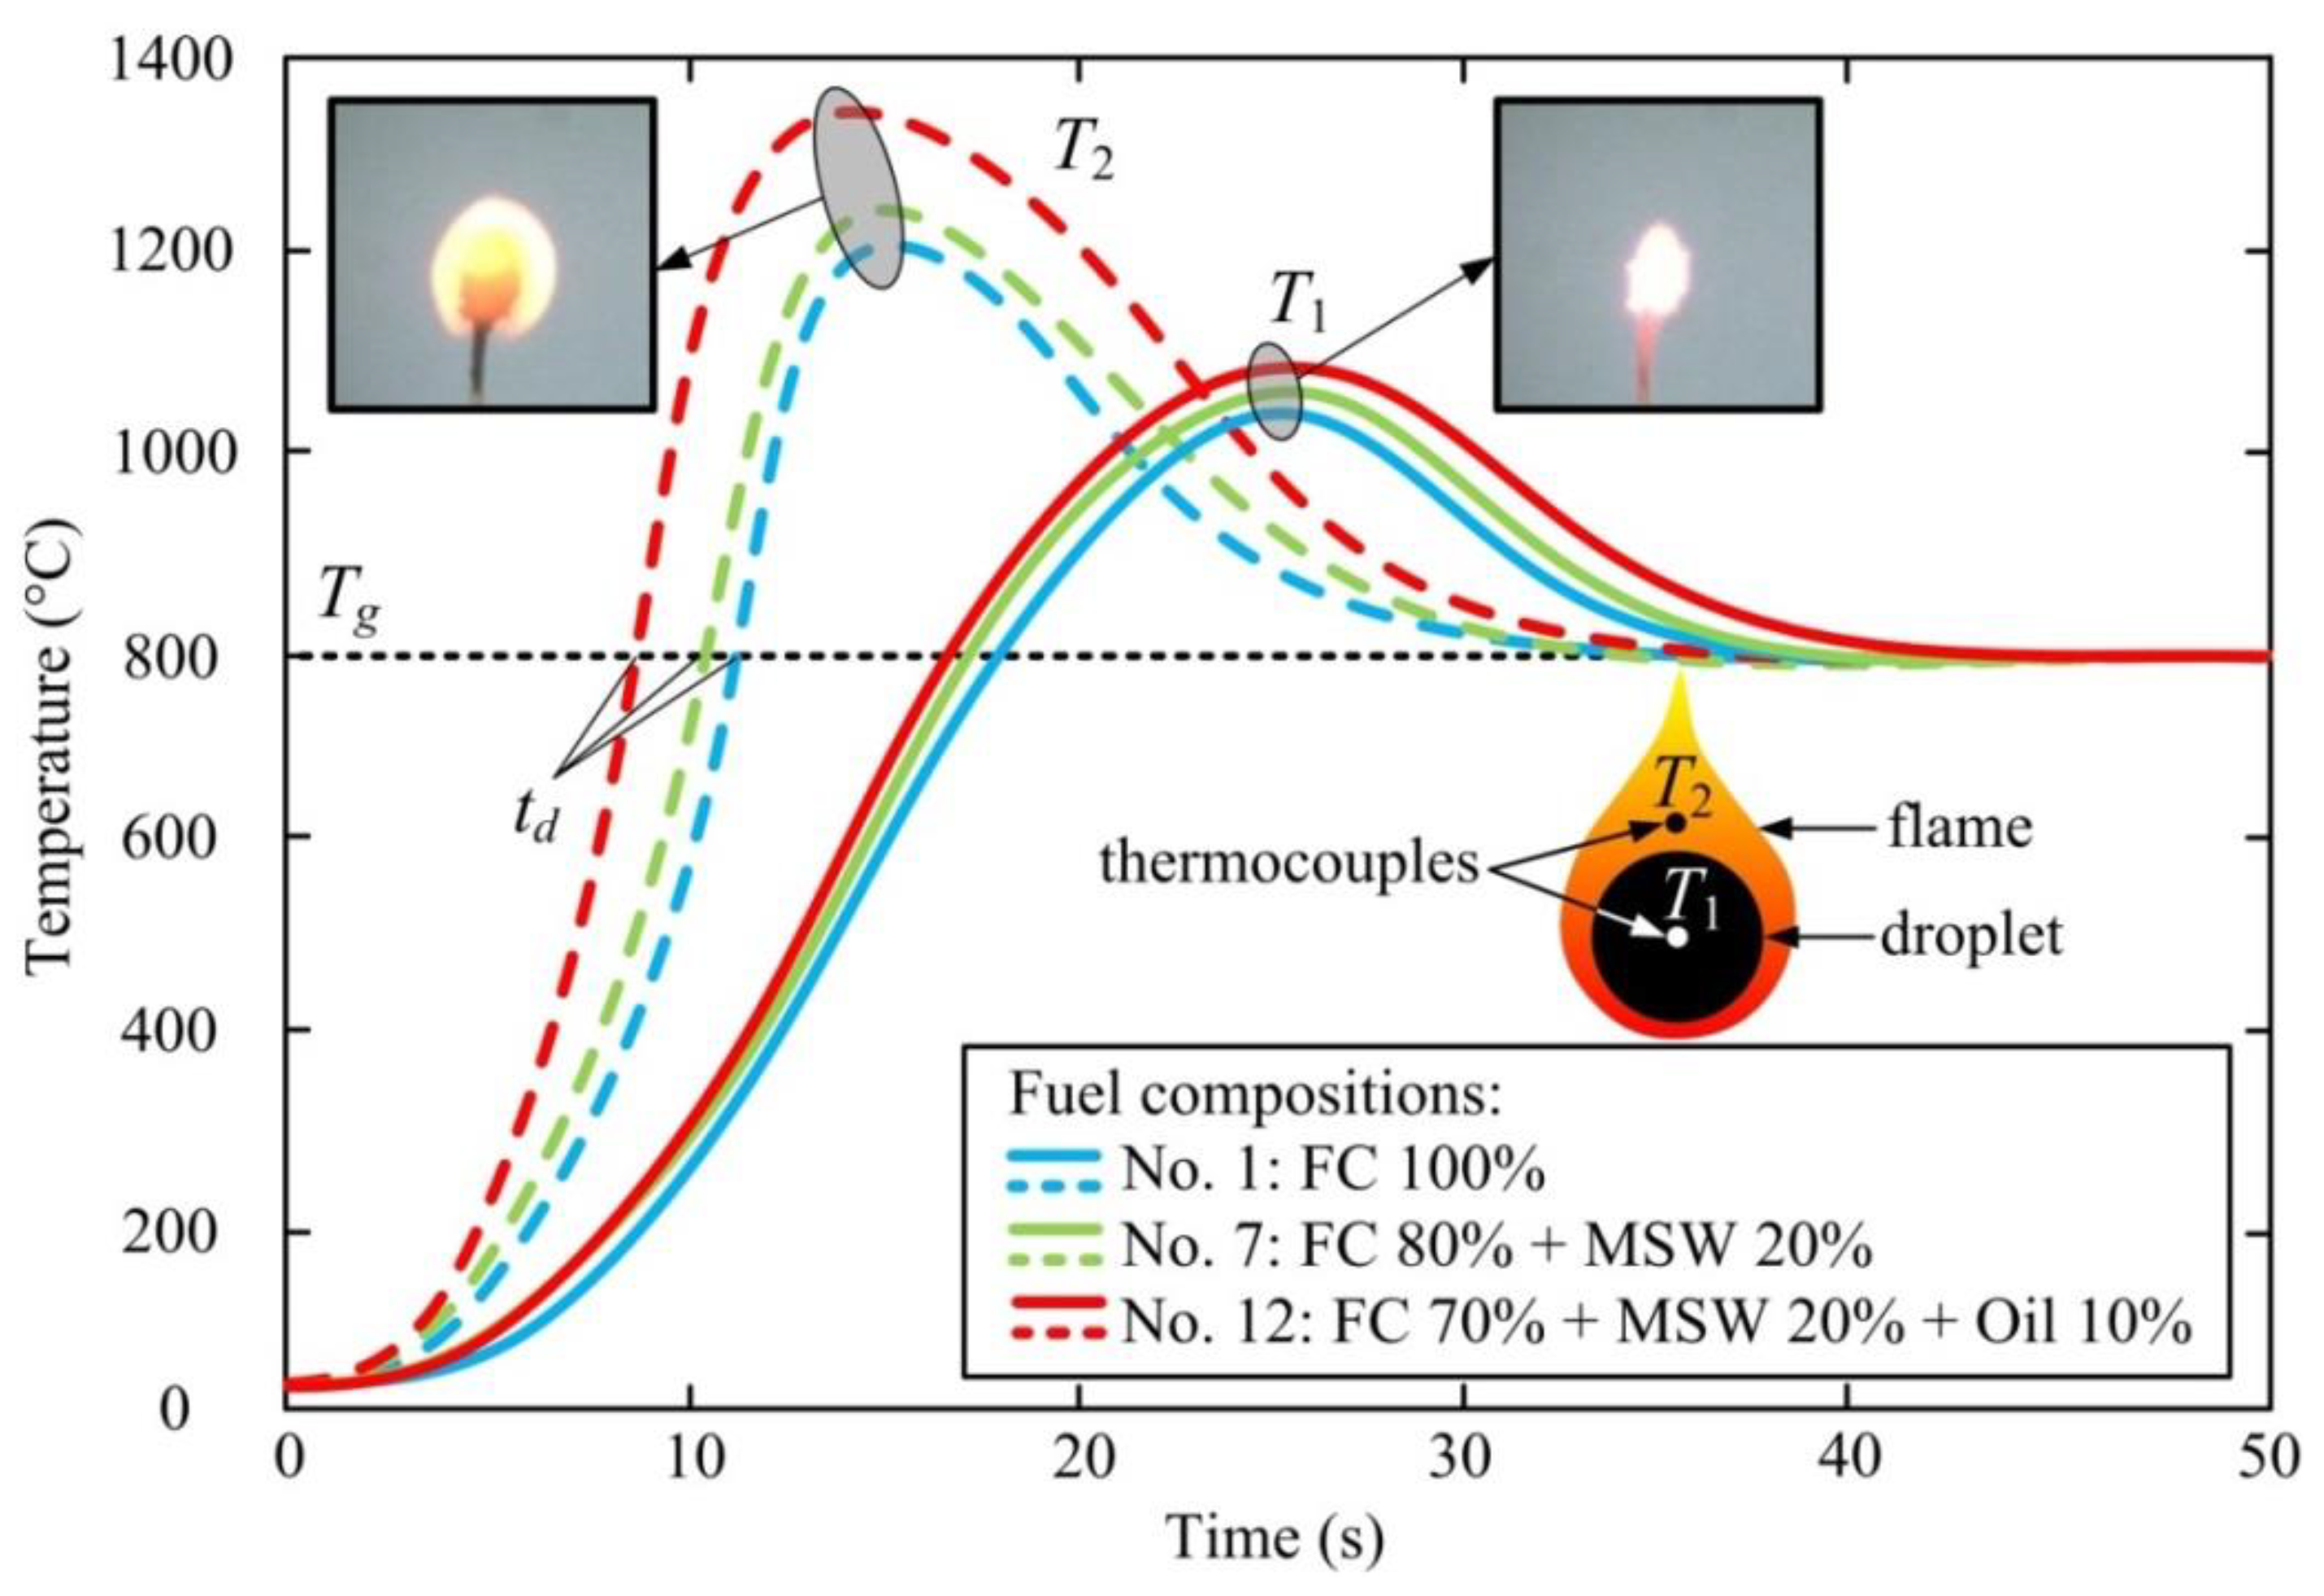
The design, development, and implementation of promising technologies require an in-depth study of technical, environmental, and economic aspects of a new approach to waste disposal. Therefore, the purpose of this study is to experimentally investigate the mechanism, conditions, and characteristics of composite liquid fuel combustion; to investigate the concentration of anthropogenic emissions in flue gases; as well as to analyze the economic effect of switching coal-fired thermal power plants (TPPs) to composite fuel based on industrial and municipal waste, when three neighboring industrialized regions of the Russian Federation employ the strategy to recover various combustible waste.

2. Experimental Research

2.1. Fuel Preparation and Fuel Characteristics

Three groups of fuel compositions were prepared in the present work. One of the main components is filter cake (FC) of coking coal (the Severnaya coal washing plant, Kemerovo region, Russian Federation). Such coal slurry is a combustible by-product of coal processing. It can be widely used as fuel in TPPs [27]. FC is a mixture of coal dust (particle size about 100 µm) with water (mass fraction about 50%). The first and second groups of fuel compositions consisted of FC and typical MSW (cardboard, wood, rubber, and plastic). The concentrations of the latter are 10 and 20% for groups I and II of fuel compositions, respectively. The last (third) group of fuel compositions included 10% of used turbine oil in addition to FC and MSW, which was intended to increase the temperature and thermal effect of combustion. The fuel compositions, their main characteristics, and the characteristics of separate components are presented in Table 2, Table 3 and Table 4. The heat of combustion for various fuel compositions was calculated analytically [28] using a method based on the mass fractions of fuel components and their higher heating values determined from the proximate analysis. Proximate and ultimate analyses were performed using standard methods of International Organization for Standardization (ISO 17246:2010 and ISO 17247:2013): ash, volatile, and moisture content were determined by ISO 1171, ISO 562, and ISO 11722, respectively; higher heating value was determined by ISO 1928; the fractions of carbon, hydrogen, nitrogen, and sulfur in fuel components were determined by ISO 17246, ISO 625, ISO 333, and ISO 351, respectively; the fraction of oxygen was calculated using the equation Odaf = 100 − (Wa + Ad + Cdaf + Hdaf + Ndaf + Sdaf) according to ISO 17247:2013.

2.2. Experimental Techniques

A well-tested technique was used to prepare fuel slurries [30]. MSW (cardboard, wood, rubber, and plastic) was ground separately and sieved through a sifter (mesh size of 140 µm according to ISO 3310:2000). Different compositions were obtained by mixing wet FC, MSW, and oil (Figure 1) with the component concentration presented in Table 2. A DC-600RM mixer (HT Machinery, Japan-Taiwan) and a steel vessel (volume of 0.2 L) were used. The basic compositions (Table 2) were also burned: No. 1—wet FC without any additives; No. 10—wet FC mixed with used turbine oil.
The fuel ignition and combustion characteristics were investigated using an experimental setup (Figure 2) [30], featuring a Loiplf50/500–1200 (Laboratory Equipment&Instruments, Russia) tube muffle furnace with diameter and length of the tube at 50 mm and 500 mm, respectively, and the temperature variation range at 20–1200 °C. In each set of experiments, the furnace was preheated to a given temperature. After temperature stabilization, a fuel droplet (Dd = 2 mm) was introduced into the furnace along the symmetry axis of the ceramic tube. The processes were recorded by a Phantom V411 (Vision Research, USA) high-speed color video camera with a maximum filming rate of 4200 fps at resolution 1280 × 800 pixels. The values of ignition delay times (td) were calculated by Tema Automotive software (Image Systems AB, Sweden) that analyze the evolution of the droplet luminance over time [29,30]. The systematic error when calculating td did not exceed 3%. Random errors for sets of 5–7 experiments under identical conditions were no more than 10%.
A Testo 340 (Testo, Germany) gas analyzer was used to analyze the main anthropogenic emission concentrations (carbon monoxide (CO), carbon dioxide (CO2), nitrogen oxide (NOx), and sulfur oxide (SOx)) from the fuel composition combustion at Tg = 1000 °C, employing the methods from References [29,31]. It was put in place of the high-speed video camera. The fuel sample (with a mass of about 1 g) was introduced into the preheated furnace. A gas analyzer sensor was introduced into the furnace together with the fuel sample to collect flue gases. Series of 3–5 experiments were conducted under identical initial conditions. The research findings were averaged. Random errors did not exceed 5% for the experiments conducted under identical initial conditions.

3. Results

3.1. Ignition Delay Time and Combustion Temperature

The three regions (highlighted in different colors) in Figure 3 correspond to three fuel compositions (Table 2). They illustrate the conditions (the ambient air temperatures) and characteristics (delay times) of guaranteed ignition of 2-mm droplets of composite fuels considered in this study (Table 5). The ambient air temperature at Tg = 600 °C is the minimum required for composite fuel ignition. The maximum difference in td for the three composition groups is no more than 25% at 600–1000 °C. The ignition delay times of fuel compositions differ insignificantly (by less than 5%) in the conditions of Tg > 1000 °C.
In Figure 3, the maximum ignition delay times (the curve demarcating the blue area above for group I of fuel compositions) correspond to td of composition No. 1 (wet FC). Fuel composition No. 12 (FC 70% + cardboard 20% + oil 10%) has the lowest ignition delay times in the range of Tg = 600–1000 °C (the curve demarcating the red area below for group III of fuel compositions). For other compositions under study, the td values lie in between these two curves. The fuel compositions have been sorted in descending order in accordance with their ignition delay times: group I—FC 90% + MSW 10%; group II—FC 80% + MSW 20%; and group III—FC 70% + MSW 20% + oil 10%. Thus, the latter compositions have the lowest ignition delay times. Adding 10% of MSW to the FC, increasing MSW content to 20%, and adding 10% of used oil lead to a decrease in the ignition delay time (Figure 3). It can be explained by lower moisture concentration (chemically inert and heat-absorbing component at the initial stage of the induction period) in the fuel slurry containing MSW, as compared with composition No. 1. Another reason for enhanced ignition is the presence of combustible liquid (used oil) in the fuel slurry.
In addition to ignition delay times, another important characteristic of the fuel is combustion temperature, which influences not only the thermotechnical properties of energy-generating equipment but also the characteristics of gaseous product combustion. Figure 4 presents the curves of temperature change during the combustion of three various fuel compositions at Tg = 800 °C. T1 is the droplet temperature (solid lines), and T2 is the gas temperature (dashed lines) in the droplet vicinity at a distance Dd from T1 (Figure 4), where the gas mixture burns out.
In Figure 4, the points of intersection of the corresponding dashed curves with a line at Tg = 800 °C correspond to the ignition moment (td) of different fuel compositions. The heat input at t = td in the area of rapid exothermic reaction (ignition zone) exceeds the heat outflow from this area into the environment. During the burnout of the gaseous mixture, the maximum values of T2 reach 1300 °C for group III of the fuel compositions with used oil. The maximum droplet temperatures T1 for different fuel compositions have similar values and do not exceed 1150 °C (Figure 4). Under the heterogeneous combustion conditions, the droplet burns out layer by layer. The process duration from the gas-phase ignition moment up to the solid residue burnout at Tg = 600–1000 °C is 15–35 s (Figure 4) for droplets of 2 mm in diameter.

3.2. Environmental Emissions

According to Reference [10], when MSW is burned at 1300 °C and above, the harmful gases (PCDD/Fs) released break down into safe simple compounds that do not pose any threat to the environment. Adding carbamide into the boiler furnace and a mixture of activated carbon and alkaline sorbent Ca(OH)2 into the absorber also reduces the concentration of hazardous substances to regulatory limits in flue gases [10]. We can conclude that adding 10–20% of used oils to the fuel slurry (compositions with industrial waste and MSW), on the one hand, reduces the concentration of dioxins and furans in flue gases [10] due to an increase in the combustion temperature by 200–300 °C and, on the other hand, increases the concentration of the main anthropogenic emissions (carbon, nitrogen, and sulfur oxides) as compared with the same characteristics for burning fuel compositions without combustible liquids.
In this research, we analyzed the concentrations of anthropogenic emissions in flue gases for two main components (Figure 5): NOx and SOx. The concentrations of carbon oxides in composite fuel combustion products were not so different when the fuel with typical MSW was burned: CO2 was 16–18%, and CO had no more than 370 ppm. These values do not exceed the identical characteristics of dry coal combustion. All the measurements were performed when fuel compositions were burned separately in the muffle furnace at Tg = 1000 °C. It is a typical operating temperature for steam boiler furnaces. Figure 5 shows the maximum concentrations of nitrogen and sulfur oxides in the flue gases of fuel slurries for combustion process occurring at air temperatures 600–1000 °C.
As for the significantly lower concentrations of NOx and SOx in the flue gases of composite liquid fuels as compared with those from dry coal combustion (Figure 5), they are explained by the following [27,29,31]. When dry coal is burned, the emissions of NOx and SOx are related to the nitrogen and sulfur content in the fuel. Adding water to the fuel slurry leads to a decrease in the total content of such components in the fuel composition. It positively affects a decrease in the concentrations of the corresponding oxides in flue gases. Moreover, during fuel combustion, the water in the slurry fuel (about 50%) is an oxidizer source, which enhances the process of coal burning. The rapid evaporation of water contributes to finer pulverization of the carbon component due to droplet microexplosions. As a result of these factors, the surface of oxidation reaction grows significantly for fuel components, which provides the 1.4- and 2.8-fold differences in the concentrations of nitrogen and sulfur oxides in the flue gases of dry coal and wet FC combustion (Figure 5a).
The MSW fuel components we added to the FC have been sorted in descending order (according to the NOx and SOx concentrations in combustion products (Figure 5)): rubber, cardboard, wood, and plastic. The content of nitrogen and sulfur in MSW is 2–10 times as low as that in the initial FC according to the element composition of the fuel components (Table 4). Thus, in the preparation of groups I and II of fuel compositions, the mass fraction of FC is reduced because a solid combustible component is added (cardboard, plastic, rubber, and wood) with lower nitrogen and sulfur content. Consequently, as a result of burning such fuel compositions in the conditions identical to the combustion conditions of composition No. 1 (wet FC 100%), the concentration of NOx and SOx decreases (Figure 5a,b). The concentrations of these anthropogenic emissions are 5–10% lower for the compositions with 20% of MSW (group II) than they are for the compositions with 10% of MSW (group I).
When we added used oil to the fuel slurry (group III), the concentrations of sulfur and nitrogen oxides were 18–22% and 10–12% higher, respectively (Figure 5c), than they were for the fuel compositions (Figure 5b) not containing oil (group II). The negative ecological effect of adding oil to composite fuel is explained by the chemical composition of the combustible liquid of petroleum origin: a relatively high concentration of sulfur and nitrogen compounds. Moreover, an increase in the combustion temperature enhances the formation of sulfur and nitrogen oxides in the oxidation reactions. However, adding a liquid combustible component increases the combustion temperature. It is a positive factor for the reduction of PCDD/Fs concentration in flue gases as well as for the improvement of the characteristics of the ash residue.
It can be concluded that adding a combustible liquid of petroleum origin (used oil) to the fuel slurry promotes the growth of NOx and SOx (sometimes by 30–40% as compared with fuels based on the coal and water composition). Even though the environmental characteristics of the composite fuel are worse after adding used oils, the increase in the nitrogen and sulfur oxide concentrations in flue gases is within the regulatory limits of the corresponding pollutants from dry fuel combustion (Figure 5 and Table 6). Therefore, composite liquid fuels are promising energy resources that can be used in thermal power engineering instead of solid fossil fuels.

4. Discussion

4.1. Combined Recovery of Industrial and Municipal Waste

This research offers a technological strategy to reduce the harmful effect of industrial waste and MSW on the environment and to cut down the consumption of high-grade coal for power generation. The strategy proposes combined waste (municipal and industrial) recovery by burning in fuel compositions at local coal-fired TPPs.
The main elements of the strategy were developed previously [16] for three neighboring regions of the Russian Federation located in Western Siberia. They are Kemerovo (No. 1), Novosibirsk (No. 2), and Tomsk (No. 3) regions. The strategy of co-combustion of industrial and municipal waste suggests switching three typical coal-fired TPPs (at least one in each of the regions) to composite liquid fuel. The preparation of fuel slurries and their transportation to consumers requires the construction of a corresponding plant and pipelines.
Below, we will consider the technical and economic aspects of implementing the designed strategy for three scenarios, each of them suggesting the combustion of one of three groups of fuel compositions under study by TPPs (Table 2): group I—FC 90% + MSW 10%; group II—FC 80% + MSW 20%; and group III—FC 70% + MSW 20% + oil 10%. The obtained results will be a basis for the development of waste management strategies in other regions of the world, with due regard to their peculiar characteristics (amount and structure of waste).

4.2. Structure and Amount of Industrial and Municipal Solid Waste

Table 7 presents statistics for the amount and structure of industrial and municipal waste produced as well as methods of their current treatment.

4.3. Need for Energy Resources of Coal-Fired Thermal Power Plants

The needs of regions No. 1–No. 3 for their own thermal and electrical energy are satisfied primarily by local thermal power plants. Combined heat and electricity in each of the three regions are generated by a group of TPPs, some of them operating on solid fossil fuel and others on natural gas. Table 8 presents the main characteristics of coal-fired TPPs typical of each of the regions.
Flame coal (the coal-bearing rock of Kuznetsk Basin, Russian Federation) was used as the main fuel at the TPPs under study. It has the following specifications: heat of combustion Qas,V = 21.4 MJ/kg; moisture Wa = 14.1%; ash Ad = 13.1%; and volatile content Vdaf = 41.2%.
Analyzing the amount of thermal energy produced from burning coals in boiler furnaces (Table 8) and the thermotechnical properties of the solid fuel (heat of combustion Qas,V = 21.4 MJ/kg) enabled us to determine the amount of coal consumed by three TPPs to produce electricity and heat. The consumption of high-quality solid fossil fuel [16] is 5.75 Mt (TPP 1—1.64 Mt, TPP 2—3.69 Mt, and TPP 3—0.42 Mt). About 123 PJ of heat (Table 8) is released from the combustion of said coal amount. The released energy is converted into heat and electricity with 70% efficiency of typical TPPs. The relatively low efficiency leads to irrecoverable conversion process losses of large amounts of thermal energy released in the boiler furnace from coal combustion. High-quality coal is used inefficiently. Using composite fuels from combustible solid and liquid waste rather than coals can significantly reduce the consumption of nonrenewable hydrocarbons.

4.4. Waste-to-Energy Strategy

It is believed that all the energy (about 123 PJ/y) released from the combustion of coal by three TPPs (Table 8) will be generated by the combustion of one of the three groups of fuel compositions (Table 2): group I—FC 90% + MSW 10%; group II—FC 80% + MSW 20%; and group III—FC 70% + MSW 20% + oil 10%. Due to differences in the characteristics of fuel compositions (Table 2), they will require different components if coal is to be replaced by fuel compositions with the equivalent energy yield. Table 9 presents the consumption of different groups of fuel compositions and their separate components within a year and within 25 years (the period of implementation of the proposed strategy) at average values of combustion heat for each group of fuel compositions, according to the data from Table 2: group I—11.91 MJ/kg; group II—13.04 MJ/kg; and group III—16.36 MJ/kg.
The 25-year implementation of a promising waste management strategy by three TPPs will allow for the total disposal (Table 9) of 130–260 Mt of FC, 25–38 Mt of MSW, and up to 19 Mt of used oils. The measures proposed for the three municipal regions in Western Siberia of the Russian Federation will completely solve the problem of recovering the accumulated waste petroleum oils and annually produced coal processing waste. Adding MSW to the fuel composition will eliminate the problem of its industrial disposal until the transition affects a new system of waste management with a high share of MSW recycling and reuse [16].

4.5. Economic Effect

The economic effect of implementing the abovementioned strategy can be divided into two parts: (i) revenue—savings from the combustion of a cheap fuel based on industrial and municipal waste instead of costly high-quality coal—and (ii) expenditure—costs of constructing a central plant for fuel preparation and modernization of the process equipment of TPPs (fuel handling systems) when switching from solid fossil fuel to slurry composite fuel.
The economic effect has been evaluated using the algorithm from Reference [32], which was developed for the analysis of prospects of switching coal-fired TPPs to composite liquid fuels. The results of this research and of the previously conducted studies [16,29,30] make it possible to conclude that the combustion mechanisms and characteristics are similar for solid fossil fuels and composite fuels (mixture of industrial waste, MSW, and waste oil). Therefore, the latter can be burned using operating coal-fired boilers. Substantial modernization is mainly necessary for fuel feedstock storing, fuel preparation, and fuel handling systems. To cut down the modernization costs of these systems of operating coal-fired TPPs, we suggest building a central fuel preparation plant for the three TPPs located in the neighboring regions to transport fuel slurries through pipelines to the consumers [26]. This plant would be engineered to store sufficient reserves of initial fuel components, to prepare fuel compositions, and to distribute the ready-made fuel slurries between the three TPPs as required, including the conditions of supplying their 100% loads. Only tanks with homogenizers are to be located on the territory of TPPs to provide the required reserve of the fuel for 5 days and to maintain its performance characteristics when it is fed to the boiler furnace.
The analysis of performance characteristics using the algorithm from Reference [32], which takes into account the source data about the fuel composition, its energy performance indicators, consumption, and cost, suggests that it is economically viable to switch a coal-fired TPP to composite liquid fuel, comparing the following main costs:
(i) Fuel costs (S1) are estimated by the cost of composite fuel components (assuming the prospective costs of transporting to the fuel preparation site). The comparative cost of different waste (FC, MSW, and used oils) may vary depending on the region and the supplier. In this study, we assume the following fuel costs [32]: 60 $/t for coal; 8.11 $/t for group I of composite fuel, 7.42 $/t for group II of composite fuel; and 15.71 $/t for group III of composite fuel. The equation for fuel cost calculation is as follows:
S 1 = C f u e l B f u e l ,
where Cfuel is the comparative cost of fuel, $/t, and Bfuel is the amount of fuel burnt (Table 9), t.
(ii) The capital cost of constructing a central plant for fuel preparation (S2) is one of the main nonrecurring costs when switching coal-fired TPPs to composite fuel. It takes into account the price of the process equipment necessary for putting the new fuel preparation system into operation [32]. This item of expenditure also includes the cost of storing the initial fuel components with due consideration of the necessary stock for 5 d [32] on the territory of the central fuel preparation plant. The main expenses of the process equipment acquisition and installation as well as the construction costs are presented in Table 10.
(iii) Modernization costs of fuel handling system of TPP (S3): Based on the data (Table 8) about the number of boilers at each of the three TPPs (TPP 1—9 boilers, TPP 2—6 boilers, and TPP 3—10 boilers) and the design of typical fuel preparation systems (coal-fired TPPs normally use individual systems of fuel preparation with ball mills and an intermediate bin with coal dust for each boiler), we estimated the modernization costs for the corresponding process equipment [32]. The results (Table 11) were obtained with due consideration of the reuse of some auxiliary equipment (pipelines, valves, and pumps) in the new systems when switching boilers to composite liquid fuel as well as when storing the necessary stock of the prepared composite fuel on the territory of TPPs for 5 d [32].
(iv) Operating costs (S4) involve the cost of electricity consumed for fuel preparation system operation. They have been calculated on the basis of the average price [32] of electricity and its consumption per a unit of fuel ready to be combusted in the boiler furnace:
S 4 = С e l e c t r i c i t y G e l e c t r i s i t y B f u e l
where Celectricity is the cost of electricity, 0.052 $/(kW·h); Gelectricity is power consumed for fuel preparation, 38.58 (kW·h)/t for coal and 21.55 (kW·h)/t for composite fuel; and Bfuel is amount of fuel combusted (Table 9), t.
(v) Ash and slag waste storage and recovery costs (S5): Based on the analysis results [32], the transition to composite fuel does not lead to increasing volumes of slag and ash waste. Therefore, these costs, S5, do not influence the analyzed economic effect. Ash removal costs make up 0.5% of the total operating costs of coal-fired TPPs. When switching them to composite liquid fuel of one of the three suggested compositions, the ash and slag removal costs will increase due to a higher ash content of the fuel, though for the most promising composition (group III), they will not exceed 1.9% of the total operating costs of TPPs.
(vi) Environmental costs and payment of fines (S6): The research findings (Figure 5) and the results from Reference [26] show that the main anthropogenic emission concentrations from composite fuel combustion do not exceed the corresponding regulatory characteristics for the flue gases of coal-fired boilers (Table 6). Therefore, these costs do not influence the analyzed economic effect.
The summary results of the calculations made are presented in Table 12. The economic effect (for 25 years) was estimated as a difference between the total costs over 25 years, when all the three existing coal-fired TPPs are operated, and the total costs within the same period, when those are switched to composite liquid fuel from industrial and municipal waste.
The data from Table 12 clearly demonstrate a decisive impact (85–95%) of the fuel constituent in the typical structure of total costs for 25 years. The total costs of constructing an advanced central plant for fuel preparation and of modernizing the fuel feeding systems for three TPPs are incomparably smaller than the costs of energy resource acquisition to generate heat and electricity. Thus, switching coal-fired TPPs to composite liquid fuel is known to have a positive economic effect even in the short term, as the cost of energy resources (coal and waste-based composite fuel) differs 2.5–3.5 times on average (in terms of a unit of energy released during fuel combustion). During the 25-year realization of the developed strategy of industrial and municipal waste recovery, the economic effect will make up from 5.7 to 6.9 billion dollars, depending on the composite fuel composition (Table 12). The economic effect vs. operating costs of coal-fired TPPs will be from 65% to 78%, respectively. It makes sense to invest the money saved into the development of thermal power engineering to carry out R&D activities for the development of advanced technologies and modernization of TPPs to boost their efficiency. Enhancing the performance of TPPs will make it possible to rationally use nonrenewable hydrocarbons to generate heat and electricity.

5. Conclusions

This paper suggests switching three typical coal-fired TPPs to composite liquid fuel, as illustrated by three neighboring regions of the Russian Federation to implement the developed strategy of industrial and municipal waste recovery. Thermal and electrical energy will be produced by these TPPs on a full scale from the composite liquid fuel combustion. Fuel slurries will be produced and transported to consumers through pipelines from the central fuel preparation plant.
Over 25 years of putting the suggested strategy into practice, 145 Mt of high-quality coal is to be saved. About 10.1 TW·h of electricity and 9.7 Pcal of heat will be generated by the recovery of 190–260 Mt of industrial and municipal waste: 130–260 Mt of FC, 25–38 Mt of MSW, and up to 19 Mt of used oils. The measures proposed for the three municipal regions will solve the problems of recovering used oils and coal processing waste. Burning MSW as a composite fuel component will solve the problem of its landfill disposal until the waste management system has been transferred to MSW recovery and reuse.
The positive economic effect with due consideration of modernizing the fuel feeding systems of the three TPPs and of constructing a central fuel preparation plant will make up 5.7 to 6.9 billion dollars, or 65–78%, respectively, of the main costs of TPPs operating on coal for 25 years. This is attributed to a decisive impact (85–95%) of the fuel constituent (energy resource acquisition) in a typical structure of total costs and to the cost of energy resources, which differs 2.5–3.5 times for coals and waste-based composite fuel (in terms of a unit of energy released during fuel combustion).
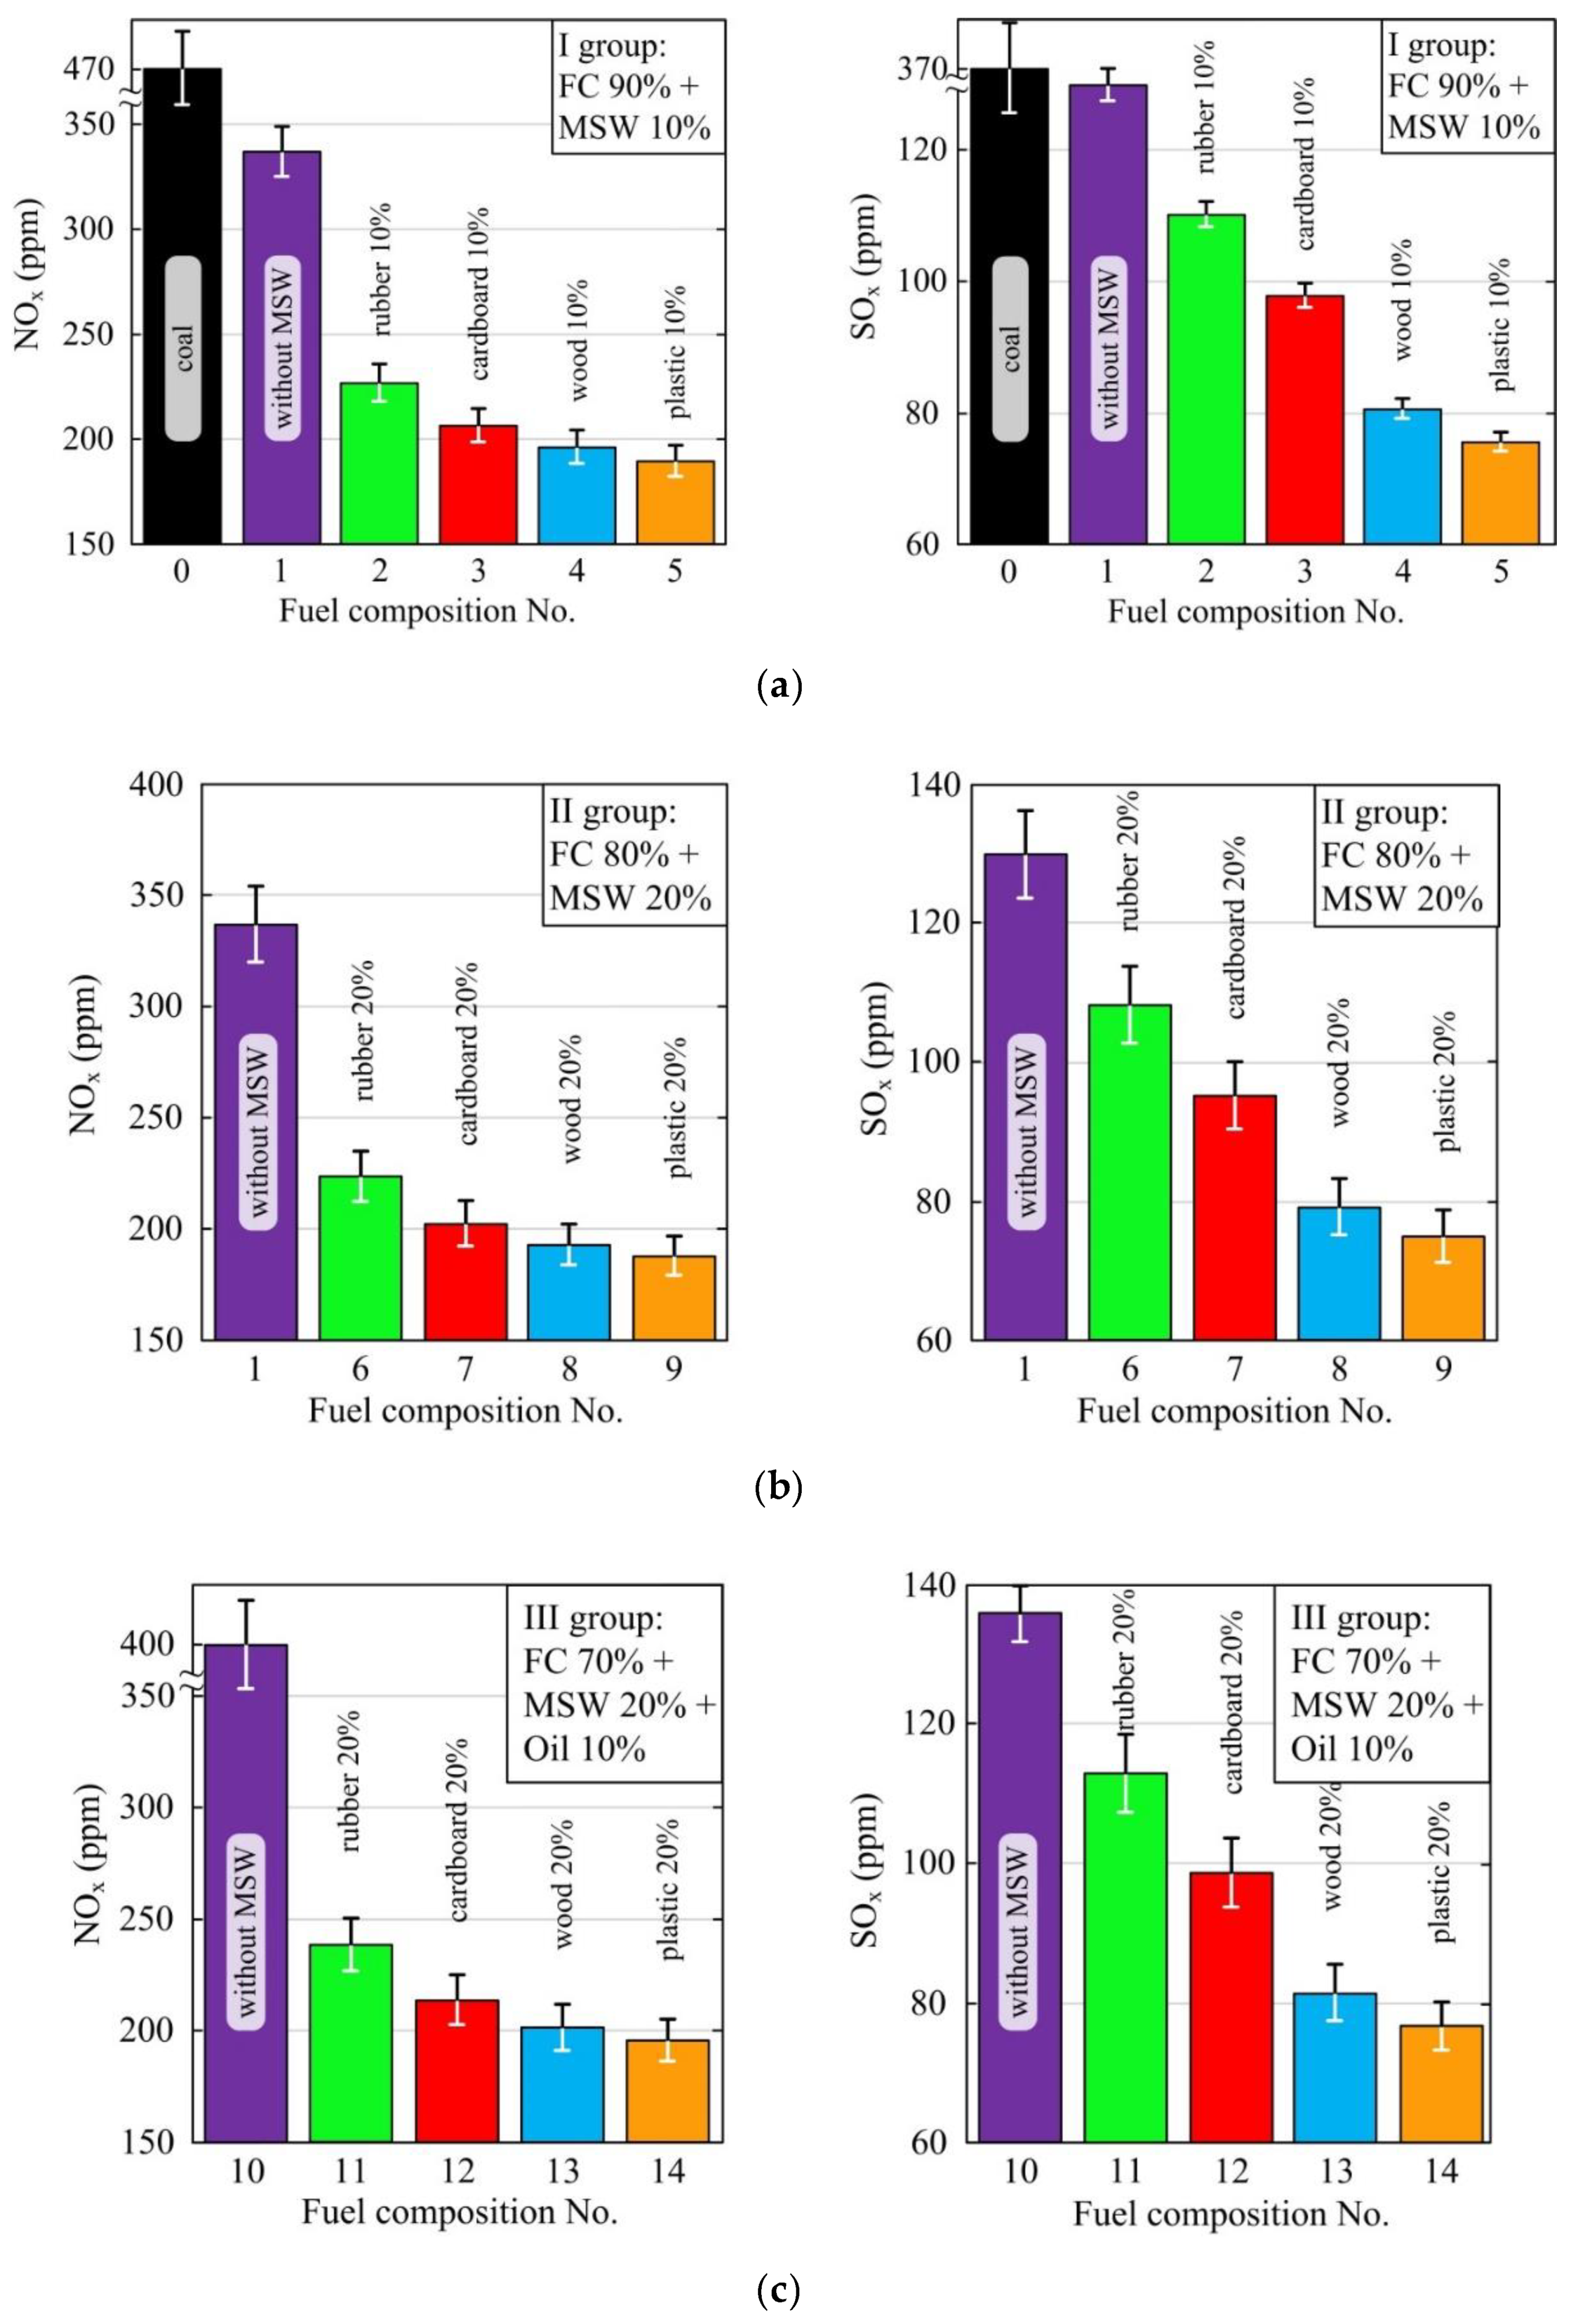
The maximum concentrations of the main anthropogenic emissions (CO2 at 16–18%; CO at 180–370 ppm; NOx at 190–400 ppm; and SOx at 75–135 ppm) in the flue gases of composite fuel do not exceed those from dry coal combustion (CO2 at 16–18%; CO at 258–344 ppm; NOx at 340–513 ppm; and SOx at 450–526 ppm).

Author Contributions

Conceptualization, D.G.; funding acquisition, G.K.; investigation, D.G. and K.P.; methodology, D.G. and G.K.; software, K.P.; visualization, K.P.; writing—original draft, D.G.; writing—review and editing, G.K. All authors have read and agreed to the published version of the manuscript.

Funding

This research was funded by Russian Foundation for Basic Research, grant number [18-43-700001].

Conflicts of Interest

The authors declare no conflict of interest.

References

  1. Funari, V.; Braga, R.; Bokhari, S.N.H.; Dinelli, E.; Meisel, T. Solid residues from Italian municipal solid waste incinerators: A source for “‘critical’” raw materials. Waste Manag. 2015, 45, 206–216. [Google Scholar] [CrossRef]
  2. Terent’yev, B.D.; Mukhin, S.E. Problem of the coal industry wastes in terms of the east Donbass and the problem resolution trends. Min. Inf. Anal. Bull. (Sci. Tech. J.) 2013, 2, 356–361. [Google Scholar]
  3. Jimenez, L.; Mate, M.J.; Lopez-Arevalo, I.; Oms, T.M. Operational predictive model for a municipal waste incinerator: A spanish case study. Int. J. Environ. Res. 2011, 5, 639–650. [Google Scholar]
  4. Kaza, S.; Yao, L.; Bhada-Tata, P.; Van Woerden, F. What a Waste 2.0: A Global Snapshot of Solid Waste Management to 2050; The World Bank: Washington, DC, USA, 2018; ISBN 9781464813290. [Google Scholar] [CrossRef]
  5. Anifowose, B.A.; Odubela, M.T. Oil facility operations: A multivariate analyses of water pollution parameters. J. Clean. Prod. 2018, 187, 180–189. [Google Scholar] [CrossRef]
  6. Soltani, A.; Sadiq, R.; Hewage, K. The impacts of decision uncertainty on municipal solid waste management. J. Environ. Manag. 2017, 197, 305–315. [Google Scholar] [CrossRef]
  7. Cimpan, C.; Maul, A.; Jansen, M.; Pretz, T.; Wenzel, H. Central sorting and recovery of MSW recyclable materials: A review of technological state-of-the-art, cases, practice and implications for materials recycling. J. Environ. Manag. 2015, 156, 181–199. [Google Scholar] [CrossRef]
  8. Zaman, A.U. A comprehensive review of the development of zero waste management: Lessons learned and guidelines. J. Clean. Prod. 2015, 91, 12–25. [Google Scholar] [CrossRef]
  9. Ministry of Natural Resources and Environment of the Russian Federation. State Report “About State and Protection of the Environment in Russian Federation in 2013”; Ministry of Natural Resources and the Environment of the Russian Federation: Moscow, Russian, 2013.
  10. Tugov, A.N. Experience of using municipal solid waste in the energy industry (An Overview). Therm. Eng. 2015, 62, 853–861. [Google Scholar] [CrossRef]
  11. Moskvichev, V.F.; Tugov, A.N. Analysis of operating experience with steam air preheaters at Russian municipal solid waste thermal power plants. Power Technol. Eng. 2012, 46, 46–51. [Google Scholar] [CrossRef]
  12. EEA. Municipal Waste Management across European Countries. Available online: https://www.eea.europa.eu/themes/waste/waste-management/municipal-waste-management-across-european-countries (accessed on 15 July 2019).
  13. Dahlbo, H.; Poliakova, V.; Mylläri, V.; Sahimaa, O.; Anderson, R. Recycling potential of post-consumer plastic packaging waste in Finland. Waste Manag. 2018, 71, 52–61. [Google Scholar] [CrossRef]
  14. Nelles, M.; Grünes, J.; Morscheck, G. Waste Management in Germany—Development to a Sustainable Circular Economy? Procedia Environ. Sci. 2016, 35, 6–14. [Google Scholar] [CrossRef]
  15. Sun, R.; Ismail, T.M.; Ren, X.; Abd El-Salam, M. Numerical simulation of gas concentration and dioxin formation for MSW combustion in a fixed bed. J. Environ. Manag. 2015, 157, 111–117. [Google Scholar] [CrossRef] [PubMed]
  16. Glushkov, D.O.; Kuznetsov, G.V.; Paushkina, K.K.; Shabardin, D.P. The main elements of a strategy for combined utilization of industrial and municipal waste from neighboring regions by burning it as part of composite fuels. Energies 2018, 11, 2534. [Google Scholar] [CrossRef] [Green Version]
  17. Puig-Gamero, M.; Lara-Díaz, J.; Valverde, J.L.; Sánchez, P.; Sanchez-Silva, L. Synergestic effect in the steam co-gasification of olive pomace, coal and petcoke: Thermogravimetric-mass spectrometric analysis. Energy Convers. Manag. 2018, 159, 140–150. [Google Scholar] [CrossRef]
  18. Maqhuzu, A.B.; Yoshikawa, K.; Takahashi, F. The effect of coal alternative fuel from municipal solid wastes employing hydrothermal carbonization on atmospheric pollutant emissions in Zimbabwe. Sci. Total Environ. 2019, 668, 743–759. [Google Scholar] [CrossRef] [PubMed]
  19. Touš, M.; Pavlas, M.; Putna, O.; Stehlík, P.; Crha, L. Combined heat and power production planning in a waste-to-energy plant on a short-term basis. Energy 2015, 90, 137–147. [Google Scholar] [CrossRef]
  20. Wang, G.; Zhang, J.; Shao, J.; Liu, Z.; Zhang, G.; Xu, T.; Guo, J.; Wang, H.; Xu, R.; Lin, H. Thermal behavior and kinetic analysis of co-combustion of waste biomass/low rank coal blends. Energy Convers. Manag. 2016, 124, 414–426. [Google Scholar] [CrossRef]
  21. Zagrutdinov, R.S.; Negutorov, V.N.; Malykhin, D.G.; Senachin, P.; Nikishanin, M.S.; Filipchenko, S.A. Preparation and Gasification of Solid Household Waste in Two-zone Direct-gas Process Gas Generators Operating as Part of Mini-CHP Plants and Complexes for the Production of Synthetic Liquid Fuels. Polzunovskiy Vestn. 2013, 4-3, 47–62. [Google Scholar]
  22. Istrate, I.R.; García-Gusano, D.; Iribarren, D.; Dufour, J. Long-term opportunities for electricity production through municipal solid waste incineration when internalising external costs. J. Clean. Prod. 2019, 215, 870–877. [Google Scholar] [CrossRef]
  23. Dos Santos, R.E.; dos Santos, I.F.S.; Barros, R.M.; Bernal, A.P.; Tiago Filho, G.L.; da Silva, F.D. Generating electrical energy through urban solid waste in Brazil: An economic and energy comparative analysis. J. Environ. Manag. 2019, 231, 198–206. [Google Scholar] [CrossRef]
  24. Chen, Y.C. Evaluating greenhouse gas emissions and energy recovery from municipal and industrial solid waste using waste-to-energy technology. J. Clean. Prod. 2018, 192, 262–269. [Google Scholar] [CrossRef]
  25. Xu, P.; Chen, Z.; Wu, L.; Chen, Y.; Xu, D.; Shen, H.; Han, J.; Wang, X.; Lou, X. Health risk of childhood exposure to PCDD/Fs emitted from a municipal waste incinerator in Zhejiang, China. Sci. Total Environ. 2019, 689, 937–944. [Google Scholar] [CrossRef] [PubMed]
  26. Glushkov, D.O.; Strizhak, P.A.; Chernetskii, M.Y. Organic coal-water fuel: Problems and advances (Review). Therm. Eng. 2016, 63, 707–717. [Google Scholar] [CrossRef]
  27. Nyashina, G.S.; Legros, J.C.; Strizhak, P.A. Environmental potential of using coal-processing waste as the primary and secondary fuel for energy providers. Energies 2017, 10, 405. [Google Scholar] [CrossRef] [Green Version]
  28. McAllister, S.; Chen, J.-Y.; Fernandez-Pello, A.C. Fundamentals of Combustion Processes; Springer: New York, NY, USA, 2011; pp. 23–31. [Google Scholar] [CrossRef]
  29. Glushkov, D.O.; Paushkina, K.K.; Shabardin, D.P.; Strizhak, P.A. Environmental aspects of converting municipal solid waste into energy as part of composite fuels. J. Clean. Prod. 2018, 201, 1029–1042. [Google Scholar] [CrossRef]
  30. Glushkov, D.O.; Paushkina, K.K.; Shabardin, D.P.; Strizhak, P.A.; Gutareva, N.Y. Municipal solid waste recycling by burning it as part of composite fuel with energy generation. J. Environ. Manag. 2019, 231, 896–904. [Google Scholar] [CrossRef]
  31. Nyashina, G.S.; Legros, J.C.; Strizhak, P.A. Impact of forest fuels on gas emissions in coal slurry fuel combustion. Energies 2018, 11, 2491. [Google Scholar] [CrossRef] [Green Version]
  32. Dmitrienko, M.A.; Strizhak, P.A. Coal-water slurries containing petrochemicals to solve problems of air pollution by coal thermal power stations and boiler plants: An introductory review. Sci. Total Environ. 2018, 613–614, 1117–1129. [Google Scholar] [CrossRef]
Figure 1. Scheme of fuel slurry preparation.
Energies 13 00259 g001
Figure 2. Scheme of experimental setup.
Energies 13 00259 g002
Figure 3. Regions of ignition delay times (highlighted in color) for composite fuels.
Energies 13 00259 g003
Figure 4. Temperature change of composite liquid fuel droplets of different compositions with initial diameter of 2 mm during the induction period at Tg = 800 °C.
Energies 13 00259 g004
Figure 5. Concentrations of nitrogen and sulfur oxides in flue gases of dry coal and fuel slurries: (a) group I; (b) group II; and (c) group III (composition No. 0—data [31] for coking coal).
Energies 13 00259 g005
Table 1. Waste generation and projections by country [4].
Country2018 Year2030 Year Projected2050 Year Projected
MSW *, MtPopulation, mln.MSW, MtPopulation, mln.MSW, MtPopulation, mln.
Argentina17.9142.9823.7449.32331.0955.229
Australia13.358.6316.9728.2421.3833.19
Brazil79.89205.9696.69225.47114.3232.69
Canada25.135.5430.3840.6236.1744.95
China220.41403.5295.041441.18335.791364.46
France33.466.6236.0267.8940.8670.61
Germany51.0581.6954.482.1957.0579.24
India168.41071.48387.771512.99543.281658.98
Indonesia65.2261.1287.96295.6118.55321.55
Japan43.98127.1445.02121.5843.32108.79
Korea, Rep.18.2250.7522.4452.724.6250.46
Mexico53.1125.8969.64147.5490.44164.28
Nigeria27.61154.454.81264.07107.08410.64
Pakistan30.76193.242.43244.2566.38306.94
Russian Federation60143.267140.5471.57132.73
Saudi Arabia16.1331.5620.9739.4825.1845.06
South Africa18.4651.7327.0964.4736.7772.76
Turkey31.2878.2739.9888.4248.7895.63
UK31.5765.1336.7270.5842.8275.38
USA258318.56311.04354.71359.89389.59
World202073802590855034009770
* Municipal solid waste.
Table 2. Fuel compositions.
NumberFC *OilRubberCardboardWoodPlasticHeat of Combustion ** (MJ/kg)
Group I of fuel compositions
1100%10.78
290%10%13.05
390%10%11.43
490%10%11.29
590%10%11.88
Group II of fuel compositions
680%20%15.31
780%20%12.07
880%20%11.80
980%20%12.98
Group III of fuel compositions
1090%10%14.11
1170%10%20%18.64
1270%10%20%15.40
1370%10%20%15.12
1470%10%20%16.30
* Filter cake (FC) in initial wet state (moisture content 50%); ** calculated analytically [28].
Table 3. Characteristics of fuel components: Proximate analysis [16,29].
ComponentWa (%)Ad (%)Vdaf (%)Qas,V (MJ/kg)
FC *26.523.124.83
Wood20.02.016.45
Rubber2.01.833.50
Plastic2.00.222.00
Cardboard5.03.017.50
Oil0.30.8100.044.02
* FC in dry state (before the analysis, it was dried at about 105 °C until full evaporation of moisture); Ad, Vdaf, and Wa are ash, volatile, and moisture content; Qas,V is higher heating value.
Table 4. Ultimate analysis of fuel components [16,29].
ComponentCdaf (%)Hdaf (%)Ndaf (%)Sdaf (%)Odaf (%)
FC87.25.12.11.14.5
Wood50.36.00.20.143.4
Rubber97.91.20.30.6
Plastic66.77.925.4
Cardboard46.36.30.30.246.9
Cdaf, Hdaf, Ndaf, Odaf, and Sdaf are fractions of carbon, hydrogen, nitrogen, oxygen, and sulfur in the fuel component converted to a dry ash-free state.
Table 5. Ignition delay times (s) of composite fuels.
Number of Fuel CompositionTemperature in Furnace
600 °C700 °C800 °C900 °C1000 °C
Group I of fuel compositions
125.7916.8210.796.734.21
221.3113.048.415.473.71
319.2111.927.294.843.47
423.4115.149.816.103.96
517.0510.516.734.213.22
Group II of fuel compositions
622.1513.608.695.303.71
719.3511.217.434.433.50
824.5315.569.816.173.93
916.549.815.753.563.08
Group III of fuel compositions
1022.8514.308.835.473.50
1116.1210.095.614.353.08
1213.408.835.473.792.87
1318.9311.926.874.913.29
1410.937.014.633.222.66
Table 6. Emission limits for power plants [10] and research findings.
EmissionPower Plants for MSW Combustion (EU 94/67/EEC), Daily Average ValuesPower Plants for Coal Combustion (the Russian Federation State Standard GOST ** 50831-95), Values at α = 1.4Research Findings *
Solid particles10 mg/m3150–250 mg/m3not studied
CO50 mg/m3 (43 ppm)300–400 mg/m3 (258–344 ppm)180–370 ppm
NOx200 mg/m3 (160 ppm)300–640 mg/m3 (340–513 ppm)190–400 ppm
SOx50 mg/m3 (19 ppm)1200–1400 mg/m3 (450–526 ppm)75–135 ppm
* The ranges correspond to the results in Figure 5. ** GOST (rus) or SUST (eng) is a State Standard of the Soviet Union.
Table 7. Characteristics of waste in each of three regions [16].
CharacteristicsRegion No. 1 (Kemerovo)Region No. 2 (Novosibirsk)Region No. 3 (Tomsk)
Total volume of waste, Mt/y28013.91.3
Industrial waste, Mt/y28002.60.9
Structure of industrial waste:
- fossil fuel extraction waste99.5%43.8%17.2%
- manufacturing industry waste0.2%8.1%32.8%
- waste related to generation and distribution of power, gas, and water0.1%24.5%7.2%
- construction and repair waste<0.01%0.1%1.0%
- agricultural, forestry, fish-farming, and fishing waste0.04%16.0%32.9%
- other waste0.15%7.5%8.9%
Reuse/recovery, Mt/y1876.0 (67.0%)0.9 (34.1%)0.3 (28.0%)
Burial/stockpiling at disposal sites, Mt/y924.0 (33.0%)1.7 (65.9%)0.6 (72.0%)
MSW, Mt/y0.91.30.4
Structure of MSW:
- food waste45%35%47%
- paper29%32%19%
- plastic13%6%6%
- metal2%4%9%
- leather, rubber, and textiles2%6%5%
- glass1%6%8%
- wood5%2.5%1%
- other3%8.5%5%
Reuse/recovery, Mt/y0.02 (1.9%)0.3 (22%)0.008 (2.0%)
Burial/stockpiling at disposal sites, Mt/y0.88 (98.1%)1.0 (78%)0.392 (98.0%)
Table 8. Characteristics of typical coal-fired thermal power plants (TPPs) in each of three regions.
Plant *Number of Boiler UnitsInstalled CapacityInstalled Heat PowerElectrical Energy GenerationThermal Energy GenerationSpecific Consumption of Fuel Equivalent per Electrical Energy SupplySpecific Consumption of Fuel Equivalent per Thermal Energy SupplyProduced Thermal Energy from Burning Coals in Boiler Furnace
pcs.MWGcal/hGW·hTcalg of Fuel Equivalent/(kW·h)kg of Fuel Equivalent/GcalPJ
TPP 1956514491946291137016035.0
TPP 261200273070654652292.913879.0
TPP 31033181511042154249159.69.0
Total252096499410,1159717911.9457.6123.0
* The indexing of TPPs corresponds to the numbers of the regions in Table 7.
Table 9. Consumption of composite fuel and its components.
Period1 Year25 Years
TPPTPP 1TPP 2TPP 3TotalTPP 1TPP 2TPP 3Total
Energy released from burning coals in boiler furnace *, PJ35.079.09.0123.0875.01975.0225.03075.0
Coal consumption **, Mt1.643.690.425.7540.8992.2910.51143.69
Fuel consumption ***, MtGroup I:2.946.630.7610.3373.45165.7918.89258.13
FC2.655.970.689.3066.10149.2117.00232.31
MSW0.290.660.081.037.3516.581.8925.82
Group II:2.686.060.699.4367.1151.4517.25235.80
FC2.144.850.557.5453.68121.1613.80188.64
MSW0.541.210.141.8913.4230.293.4547.16
Group III:2.144.830.557.5253.47120.6913.75187.91
FC1.503.380.395.2737.4384.489.63131.54
MSW0.430.970.111.5110.6924.142.7537.58
Oil0.210.480.060.755.3512.071.3818.80
* Data from Table 8 for 1 year was multiplied by 25 for 25 years; ** deviation of energy released from burning coals in boiler furnace to heat of coal combustion Qas,V = 21.4 MJ/kg; ***for groups I, II, and III, coal consumption was multiplied by deviation heat of coal combustion to heat of combustion for each group of fuel compositions; for fuel components: fuel consumption for groups I, II, and III was multiplied by component concentrations.
Table 10. Construction costs of central fuel preparation plant.
UnitQuantityUnitary Cost, $Total, $
Storage tank for FC1424,757424,757
Storage tank for used oil *1849,515849,515
Tank with homogenizer3379,2481,137,744
Mill for MSW133,00033,000
Tank with a mixer150,91050,910
Building and assembly works1230,000230,000
Total2,725,926
*Taken into account for group III of composite fuel only (FC 70% + MSW 20% + oil 10%).
Table 11. Modernization costs of TPPs.
UnitQuantityUnitary Cost, $Total, $
TPP 1
Tank with homogenizer945,510409,590
Extended furnace922,755204,795
Fuel feeding device (burners, pump, and pipeline)953,095477,855
Total for TPP 11,092,240
TPP 2
Tank with homogenizer645,510273,060
Extended furnace622,755136,530
Fuel feeding device (burners, pump, and pipeline)653,095318,570
Total for TPP 2728,160
TPP 3
Tank with homogenizer1045,510455,100
Extended furnace1022,755227,550
Fuel feeding device (burners, pump, and pipeline)1053,095530,950
Total for TPP 31,213,600
Total for all TPPs3,034,000
Table 12. Economic effect of switching coal-fired TPPs to composite liquid fuel.
CostsList of Expenses, mln. $
CoalGroup I of Fuel CompositionsGroup II of Fuel CompositionsGroup III of Fuel Compositions
Fuel costs (S1) for 1 year/25 years:344/860084/210070/1750119/2975
TPP 198/245024/60020/50034/850
TPP 2221/552554/135045/112576/1900
TPP 325/6256/1505/1259/225
Nonrecurring capital costs of constructing a central plant for fuel preparation (S2)1.8761.8762.726
Nonrecurring modernization costs of fuel handling system of TPP (S3):3.0343.0343.034
TPP 11.0921.0921.092
TPP 20.7280.7280.728
TPP 31.2141.2141.214
Operating costs (S4) for 1 year/25 years:11.5/28811.5/28810.6/2658.4/210
TPP 13.3/833.3/833.0/752.4/60
TPP 27.4/1857.4/1856.8/1705.4/135
TPP 30.8/200.8/200.8/200.6/15
Total costs for 25 years8888239320203191
Savings for 25 years649568685697

