A Novel Assisted Gas–Oil Countercurrent EOR Technique for Attic Oil in Fault-Block Reservoirs

State Key Laboratory of Petroleum Resources and Prospecting, China University of Petroleum, Beijing 102249, China
*
Author to whom correspondence should be addressed.
Energies 2020, 13(2), 402; https://0-doi-org.brum.beds.ac.uk/10.3390/en13020402
Submission received: 30 November 2019
/
Revised: 5 January 2020
/
Accepted: 13 January 2020
/
Published: 14 January 2020
(This article belongs to the Special Issue Enhanced Oil Recovery 2020)
Abstract
:As the mature oil fields have stepped into the high water cut stage, the remaining oil is considered as potential reserves, especially the attic oil in the inclined fault-block reservoirs. A novel assisted gas–oil countercurrent technique utilizing gas oil countercurrent (GOC) and water flooding assistance (WFA) is proposed in this study to enhance the remaining oil recovery in sealed fault-block reservoirs. WFA is applied in our model to accelerate the countercurrent process and inhibit the gas channeling during the production process. Four comparative experiments are conducted to illustrate enhanced oil recovery (EOR) mechanisms and compare the production efficiency of assisted GOC under different assistance conditions. The results show that WFA has different functions at different stages of the development process. In the gas injection process, WFA forces the injected gas to migrate upward and shortens the shut-in time by approximately 50% and the production efficiency improves accordingly. Compared with the basic GOC process, the attic oil swept area is extended 60% at the same shut-in time condition and secondary gas cap forms under the influence of WFA. At the production stage, the WFA and secondary gas cap expansion form the bi-directional flooding. The bi-directional flooding also displaces the bypassed oil and replaced attic oil located below the production well, which cannot be swept by the gas cap expansion. WFA inhibits the gas channeling effectively and increases the sweep factor by 26.14% in the production stage. The oil production increases nearly nine times compared with the basic GOC production process. The proposed technique is significant for the development of attic oil in the mature oil field at the high water cut stage.
1. Introduction
Fault-block reservoirs are widely distributed in eastern China and the reservoir characteristics are generally expressed in terms of the large dip angle, small oil-bearing area, good sealing ability, and complex fault structure [1,2,3,4]. In order to ensure the fault sealing ability, the production well is generally drilled 50–80 m away from the top fault boundary [5,6]. The attic oil is consequently formed due to the lack of water flooding control in the top structure at the high water cut stage [7]. Attic oil is considered as the remaining oil located at the top of a reservoir, which is above the structurally highest well in a dipping reservoir [8,9]. During the water flooding process, the gravity and viscous force also cause the water transport along the bottom of the structure and the bypassed oil forms along the top of the water flooded area [10,11,12]. The reservoir statistics show that the attic oil and the bypassed oil are the main types of remaining oil in the fault block reservoir [4]. The high drilling cost and complexity of drilling a horizontal well to recover the attic oil hinders the economic benefit [13,14,15,16,17]. Therefore, it is more preferable to use gas–oil countercurrent to achieve the recovery of attic oil.
The gravitational differentiation caused by density differences is the main mechanism of the gas–oil countercurrent process in reservoirs [18,19]. The countercurrent continuously proceeds until reaching vertically equilibrium under the impact of gravity, capillarity, and viscosity [12,20,21,22]. Templeton et al. [23] and Briggs et al. [24] conducted the countercurrent flow experiment in glass beads packed tube. The brass electrodes were used to analyze the saturation distribution and migration velocity of the vertical flow. They found the “fluid bank” existed at the top of the tube. Karpyn et al. [25] investigated factors that affect the formation of “fluid bank” in the countercurrent flow process by CT scan and reservoir simulation. Base on the conventional reservoir type classification, the “gas bank” located at the top of the model is called the secondary gas cap in this paper [26].
The basic gas–oil countercurrent production mode in reservoirs with strong bottom water deriving was proposed by Combs and Knezekl [9]. The mode is conducted by a cyclical operation with three distinct procedures: (1) Inject gas into the inclined reservoir; (2) shut-in wells and sufficient time is allowed for gas to migrate up-dip by gravity segregation; (3) the gas injection well is converted to produce until the production well is gas flooded. The production mode is similar to the Huff ‘n’ Puff process [27,28,29,30]. Based on the production mode, Kimbrell et al. [31] designed a sand pack model with the gas injection (oil production) well in the middle to conduct an attic oil development experiment. Results show nitrogen and flue gas recovered more oil than methane due to the dissolution of methane. The prerequisite for successful implementation of the production mode is proved to be the replacement of attic oil during the shut-in stage. However, there are limitations to their experimental process. In the gas injection process, water was produced from the bottom of the model to provide space for the injected gas which cannot be feasible in the oil field operation. The experimental apparatus cannot detect the movement of the countercurrent process in the wells shut-in stage which caused additional shut-in time and the secondary gas cap expansion energy cannot be utilized due to the stable model pressure in the production stage.
The production mode proposed by Combs and Knezekl [9] was not applicable to fault-block reservoirs in China which are sealed and have lower formation energy without strong water driving [32,33]. In order to recover the attic oil in this type of reservoir, a new modified development mode needs to be established. The purpose of this study is to propose a novel development mode and evaluate the enhanced oil recovery (EOR) performance and efficiency. A new long sand pack model equipped with sampling probes is designed to identify the migration of gas at high pressure and high temperature. Four control experiments are designed to investigate the EOR mechanism and illuminate the function of water flooding assistance (WFA) at different stages of the process.
2. Experimental Procedure and Materials
2.1. Experimental Model Design
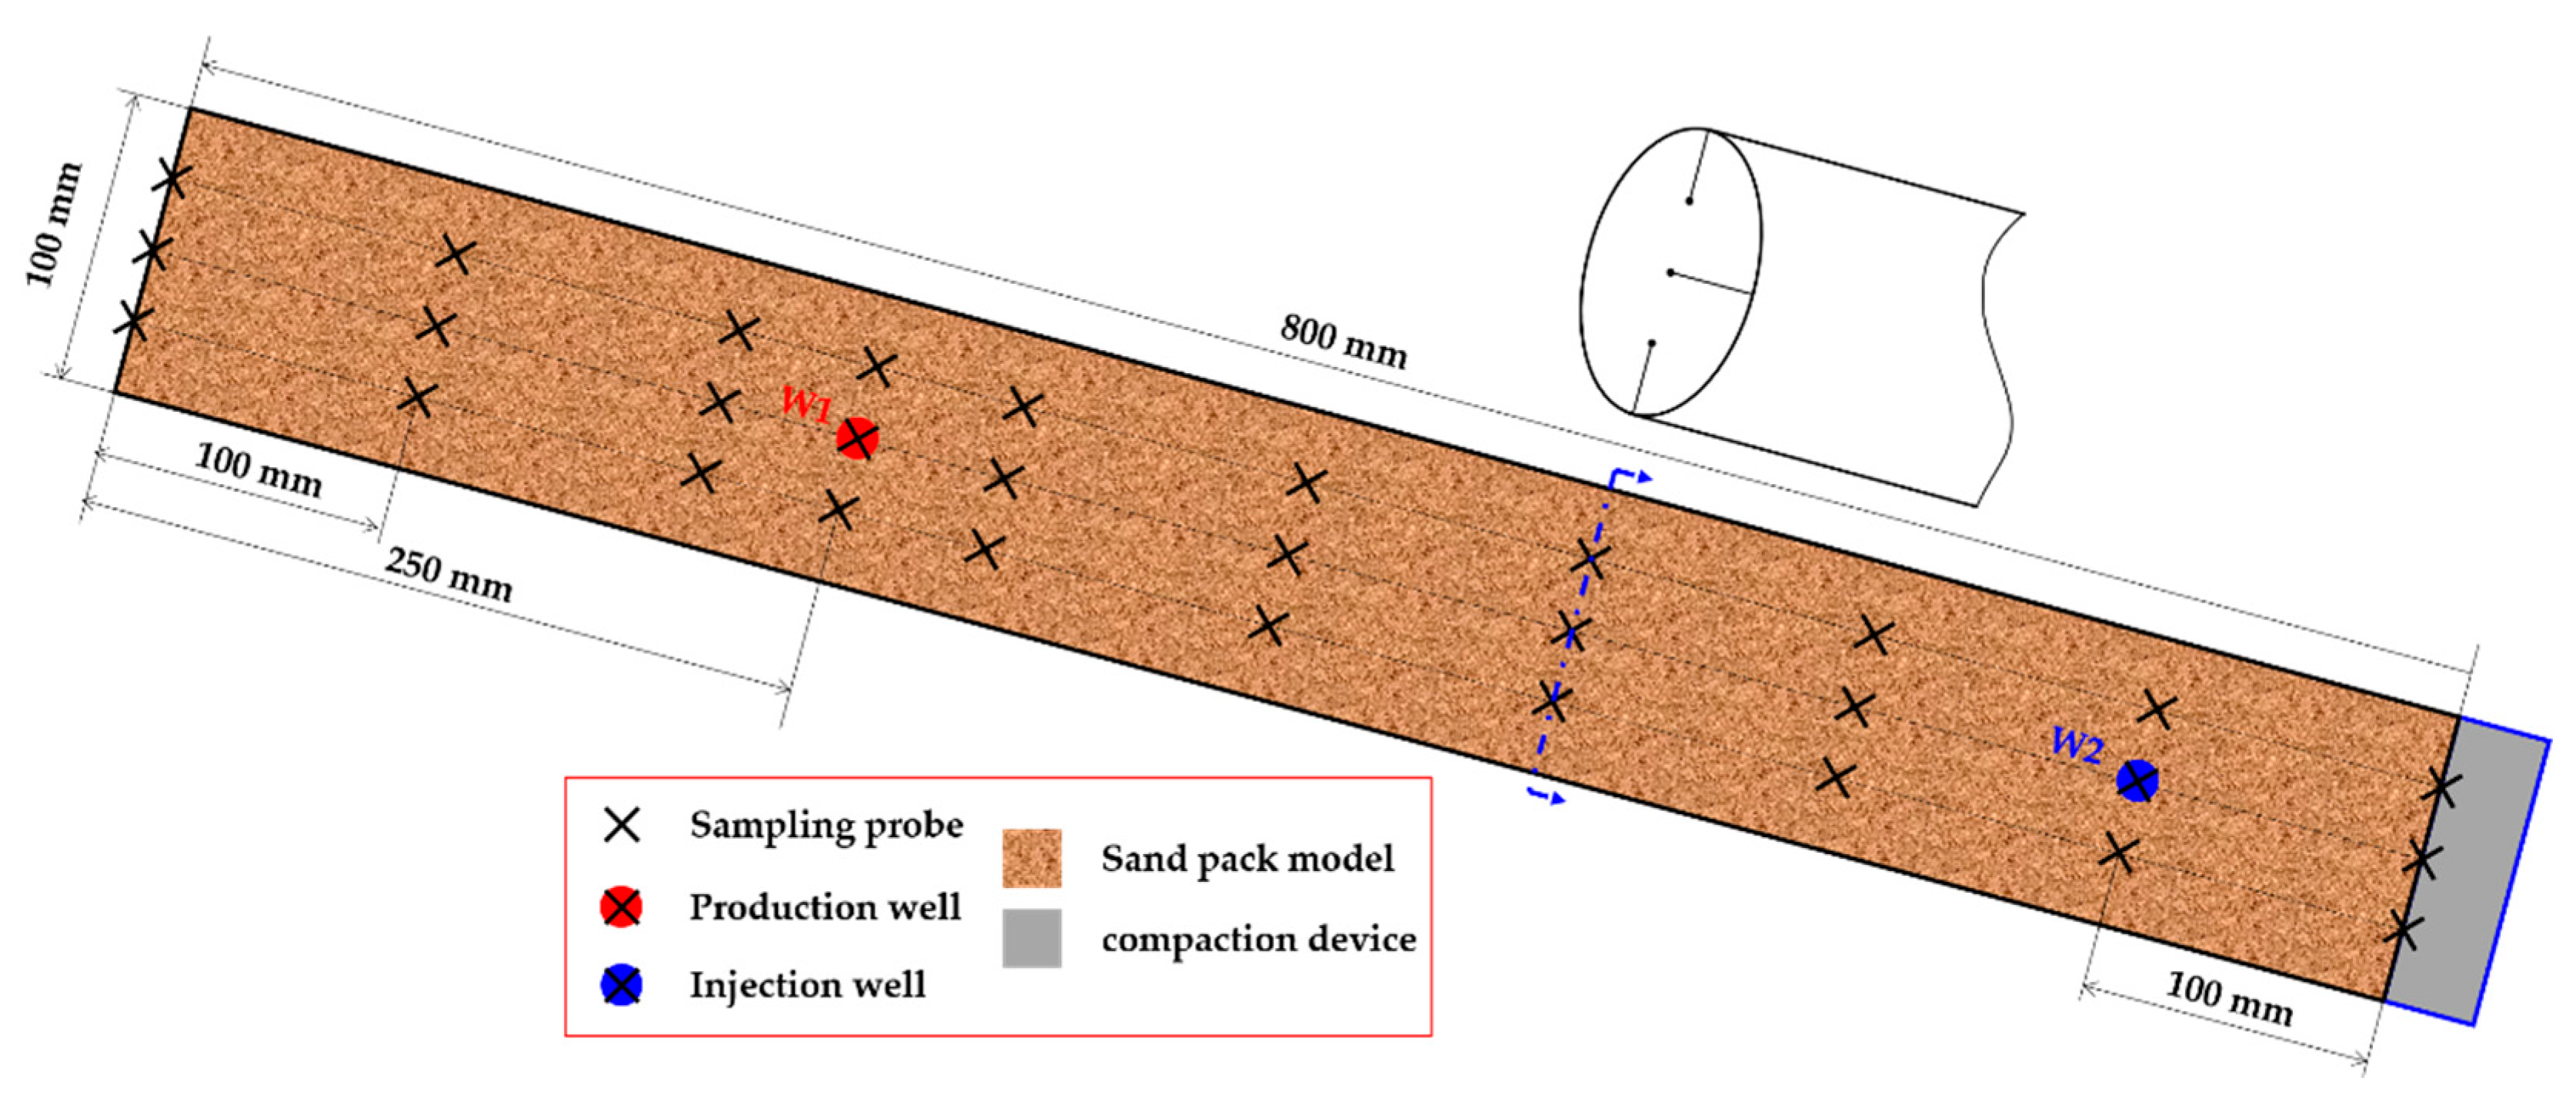
Based on the production process of gas–oil countercurrent (GOC), the long rotatable sand pack model is utilized to observe the migration of gas and evaluate production efficiency. The basic characteristic parameters of the model are shown in Table 1. In order to illustrate the expansion energy of secondary gas cap, the experiment is designed to conduct under high-pressure and high-temperature conditions. Due to the constraint of material pressure capacity, it is difficult to observe the entire gas migration directly. Sampling tubes are designed for better observation of gas migration as the downhole fluid sampling equipment [34,35]. The sampling probes are inserted at a specific location with designed depth in the longitudinal section. The sampling interval is set as 10 cm to avoid affecting flow by the number of sampling tubes. The distribution of sampling probes and the inserted radial depths of different monitoring points are shown in Figure 1. Two wells are chosen as the oil production (gas injection) and the water injection well respectively as shown in Figure 1. A compaction device located at the bottom of the model is designed to simulate reservoir skeleton pressure and ensure the consistency of the sand pack model in different experiments. The model is equipped with a self-limiting temperature electric heating belt. The heating temperature ranges from 30–150 °C.
The sampling probe with the inner diameter of 0.1 cm and an outer diameter of 0.2 cm is transparent. The total length of the sampling fluid extracted from the corresponding point is 10 cm and the sampling fluid volume is 0.1 mL to avoid influencing the distribution of oil and gas. The sampling process conforms to the well production at a low rate and lasts for a short time. In the oil field development, the interpolation map of well production data could represent the fluid distribution trend such as the water cut map and the gas–oil ratio map [26,36]. Baker et al. [26] used the gas–oil ratio interpolation map of different production wells to evaluate the gas–oil segregation and the formation of a secondary gas cap in Pine Creek Cardium oil field at Alberta, Canada. In this work, the length of different phases is measured and the fraction of different phases in the sampling tube is calculated by Equation (1). According to the drawing method of the interpolation map, the distribution of a specific phase could be obtained. The sampling test is conducted in laboratory conditions, which is totally different from the experimental conditions in the model. Therefore, the formation volume factor of different fluid should be considered, especially sampling after gas injection. The formation volume factor is defined as the ratio of the volume of fluid at the experimental conditions to the volume in laboratory conditions. The formation volume factor of gas is far less than the oil in the experimental condition. In other words, less gas under the experimental conditions expands considerably than in the laboratory conditions. In some areas swept by injected gas, even though the oil saturation is still higher than the gas phase, the sampling result showed the gas phase ratio was higher than oil. The ratio of the gas phase at different sampling tubes can represent the variation of gas volume around the sampling point. The variation of different phases in the model during the wells shut-in stage are clarified based on the maps.
where fwi is the fraction of water phase in the ith sampling tube, foi is the fraction of oil phase in the ith sampling tube, fgi is the fraction of gas phase in the ith sampling tube, Lwi is the length of water phase in the ith sampling tube, Loi is the length of oil phase in the ith sampling tube, Lgi is the length of gas phase in the ith sampling tube.
A schematic diagram of the experimental setup is shown in Figure 2. The apparatus consists of six parts: sand packed porous medium section, gas injection section, production section, water injection section, compaction section, and sampling analysis section. The entire experimental setup is connected via stainless steel tubes with an outer diameter of 3 mm.
2.2. Materials and Experimental Preparation
The mineral oil was used as simulated oil and dyed by Sudan red suitable for measuring and statistics analysis. The abraded quartz sand was used with the diameter ranging from 80–120 μm. Deionized water and N2 with 99.99% purity were used for water and gas injection, respectively. The properties of fluid viscosity and density under experimental conditions are listed in Table 2. Before the displacement experiment, the primary preparation process is listed as follows: (1) Equip sampling probes and wells with sand filter into the model. (2) Pack dried quartz sand into the model and heat the model to 90 °C. (3) Vacuum the entire apparatus for 24 h. (4) Exert skeleton pressure using the compaction part. (5) Saturate the model with water and measure the model’s permeability and porosity. (6) Saturate the model with simulated oil using the ISCO pump with the injection rate of 0.5 mL/min. (7) Continue inject oil to increase the model pressure to 16 MPa after the model is uniformly saturated. (8) Tilt the model to 30° to simulate the dip angle of reservoirs.
A physical model consistent with the geological characteristics of the inclined fault-block reservoirs is constructed through the preparation above. Next, the model is used to simulate the whole development process of water flooding and gas–oil countercurrent experiment.
2.3. Experimental Design
The experimental process is divided into two parts: creating the attic oil by water flooding and recovering the attic oil by assisted GOC. The assisted GOC experiment begins when the water cut of the production well reaches 90% in the water flooding experiment.
2.3.1. Experimental Design of Water Flooding
The capillary number has been reported in the range of 10−6 to 10−7 for waterflooding processes [37]. The capillary number is defined as Equation (2). In order to model the remaining oil distribution after water flooding, the water injection rate is designed as 4 mL/min in this experiment. Under these conditions, the capillary number is 3.42 × 10⁻⁵ approximately. As the injection rate is slightly larger than the normal water flooding experiment, the non-piston of water flooding is strengthened and the bypassed oil forms on the top layer of the water flooded area. The residual oil saturation decreases as the Nc increases with an order of magnitude of 10−5 [38]. In this experiment, the water flooding rate is high enough to drive the oil saturation down to residual oil saturation in the water flooding swept area. The injection production ratio is set at approximately 0.9:1. The pressure depletion process of water flooding not only models the actual development process but also provides space for the following gas injection process.
where is the viscosity of the displacing fluid, is the flow rate, is the interfacial tension between oil and the displacing fluid, and is the effective porosity.
2.3.2. Experimental Design of the Assisted GOC under Different Conditions
The experimental process of gas–oil countercurrent can be divided into three parts: fluid injection, wells shut-in, and production. The whole process and injection parameters are designed to evaluate the performance of assisted GOC at different conditions. The same gas injection rate is chosen to compare the effect of WFA. The contrast experiments are designed at different gas water injection ratio including 0, 2.5, and 4. Considering the experimental operation and precision, the gas injection rate was designed as 2 mL/min. In the production, the production rate should be small to prevent gas channeling. The gas channeling can be inhibited when the gravity is the predominant force. The gravity number and mobility ratio are combined as to describe the ratio of gravity and viscous force as shown in Equations (3)–(5) [39]. When the gravity gradually becomes the dominant force. In order to illustrate the feasibility of assisted GOC and the function of water flooding assistance, the experiments are designed at slightly gravity dominated conditions with the production rate of 1 mL/min corresponding to .
where N’g is the combination of gravity number and mobility ratio, Ng is the gravity number, Δρ is the density difference between oil and gas, g is the acceleration of gravity, L is the length of the model, k is the permeability of the model, H is the height of the model, v is the flow rate, μo is the viscosity of oil, M is the mobility ratio, krg is the relative permeability of gas phase, kro is the relative permeability of oil, μg is the viscosity of gas.
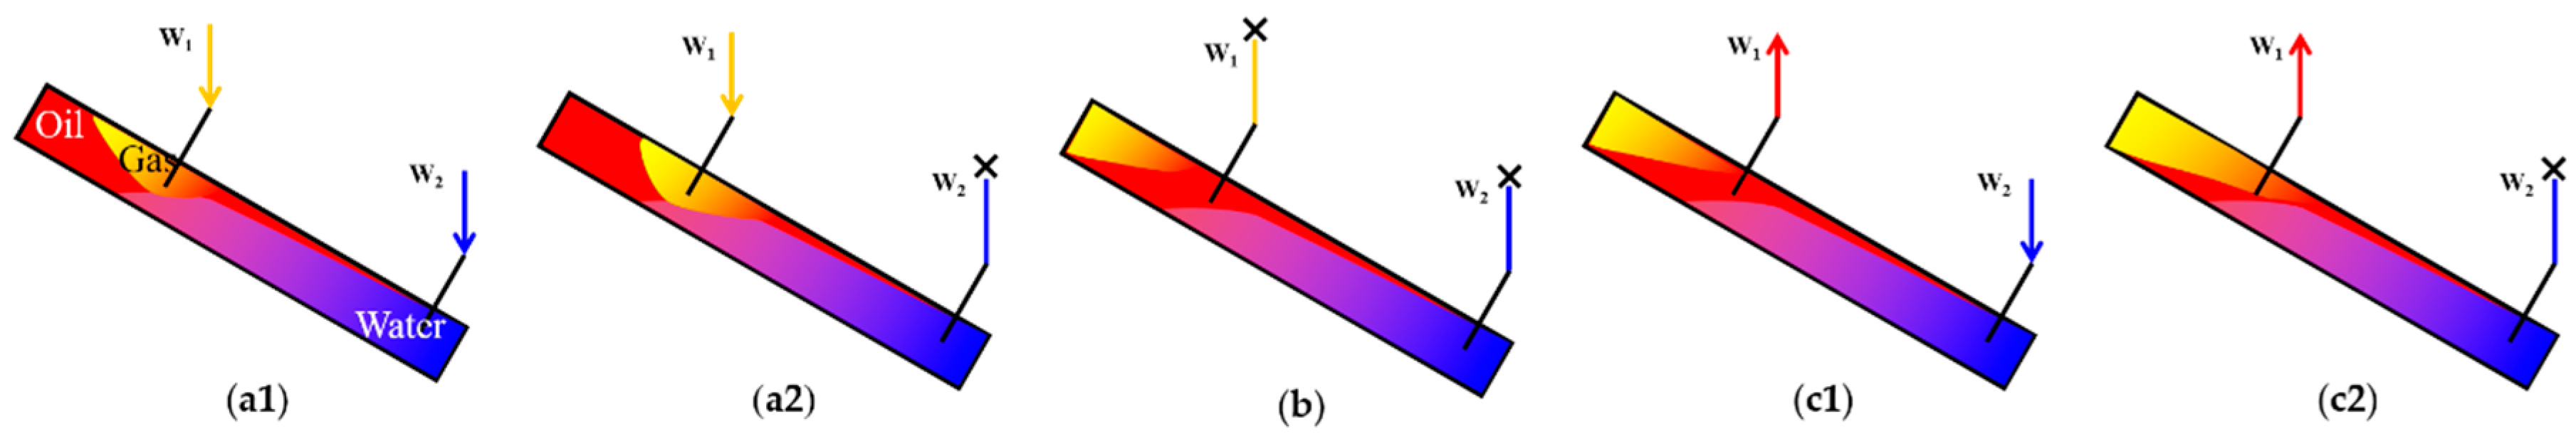
The contrast experimental process and parameters are shown in Figure 3 and Table 3. Exp1 is the basic flooding method without WFA in the whole process of gas injection and production. Exp2 is the experiment with WFA only in the process of gas injection. Exp3 and Exp4 are under different levels of WFA during the whole process. Because there is no WFA in the production process of Exp1 and Exp2, the lower production rate is adopted to avoid premature gas channeling. In order to evaluate the gas–oil separation rate, fluid sampling is conducted every 24 h. The wells shut-in time is designed as 96 h. The experiment completes when the production gas–oil ratio reaches 1000 cm3/cm3 in the production process.
3. Results and Discussion
The sand pack models used for the performance comparison are compacted under the pressure of 5 MPa. The basic properties of sand pack models are shown in Table 4. The models used to compare the EOR performance of assisted GOC under different water flooding assistance, by contrast, are within the allowable error range of similarity in terms of porosity, permeability, and oil reverses. Therefore, the EOR performance of experimental data is comparable.
3.1. The Attic Oil Evaluation after Water Flooding
Four models were prepared with very similar initial oil saturation to be used in the later experiments. In the water flooding process, Exp1 is taken as an example to demonstrate the oil recovery performance of water flooding. Figure 4 shows the production performance at the water flooding stage. Due to the density difference and faster injection rate, water flooding is a non-piston displacement process, where a certain degree of channeling exists. W1 begins to produce water when 0.43 pore volume (PV) water is injected, and the model’s water flooding recovery is 46.73% at the water flooding stage. The remaining reserves of the model is 1079.05 mL after water flooding, with the pressure dropping to 10.10 MPa.
The overall situation of four experiments after water flooding is shown in Table 5. The production data and development potential of remaining oil are similar after water flooding in different models.
The oil distribution after water flooding is evaluated by sampling results. Figure 5 shows the oil distribution in the longitudinal section of Exp1. The sweep efficiency of water flooding is 75.54% and the injected water is difficult to spread to the high part of the structure where the attic oil is abundant. The bypassed oil also remains in the model. The remaining oil distribution characteristics in the model are similar to those in the fault-block reservoirs after water flooding. Comparative experiments of gas–oil countercurrent are performed based on the water flooded models.
3.2. The Production Efficiency Evaluation of the Assisted GOC
Gravitational differentiation is an essential factor that facilitates injected gas to move upward in the shut-in stage. The upward migration speed of the gas–oil interface is the critical parameter to evaluate the EOR efficiency of the countercurrent process. In this work, the efficiency of gas–oil replacement is evaluated by the quality of the secondary gas cap within specific shut-in time. The gas distribution of Exp1, Exp2, and Exp4 at different shut-in stages is chosen to illustrate the WFA effect on the secondary gas cap formation. The gas distribution in the model is obtained by interpolation from the gas fraction in the sampling tube. Due to no gas being detected in the lower half of the model, only the upper half part of the model is displayed.
The gas distributions of Exp1, Exp2, and Exp4 during the shut-in stage are shown in Figure 6, Figure 7 and Figure 8, respectively. In Exp1 without WFA, the gas accumulates at the gas injection point after the gas injected into the model as shown in Figure 6a. As the figure shows, 39.61% of injected gas migrates downward of the injection well, which could cause the longer shut-in time to achieve gas–oil replacement. In the migration process, the leading-edge forms as shown in Figure 6b. The migration speed of the leading is 3 mm/h. When the leading edge reaches the top of the model most of the gas is still in the injection point as shown in Figure 6c. The injected gas gradually moves upward along the path of the leading edge. The replaced attic oil flows downward below the gas–oil interface. Compared with Exp2 and Exp4, in the Exp1, 54.15% of the injected gas does not migrate to the top of the model under the same amount of shut-in time as shown in Figure 6d.
With the assistance of water flooding in Exp2 and Exp4, the upward migration of the leading edge forms during the gas injection process as shown in Figure 7a and Figure 8a. The initial distribution of gas is affected by water flooding. With slight WFA in Exp3, 10.32% of injected gas is detected reaching the lower part of the gas injection point. Under stronger WFA influence in Exp4, only 5.44% of injected gas detected at the lower part. Most of the injection gas migrates to the high part of the structure. The secondary gas cap forms when gas assembles at the top of the structure. The gas increases gradually at the top as the wells shut-in time grows longer. The upward movement of the gas phase gradually replaces the attic oil, which indicates the effective replacement of attic oil is realized.
In the Exp4 with a higher water injection rate, the effect of water assistance is more obvious. According to the gas distribution at 24 h after gas injection as shown in Figure 8a, the injected gas begins to assemble at the top of the model. Compared to Exp1, the shut-in time shortens by approximately 50% to form the similar gas distribution condition. At the end of the wells shut-in stage, the swept volume of the attic oil is the largest in Exp4 as shown in Figure 8d. The swept area is extended 60% compared to Exp1 with the basic GOC process. However, with a larger amount of water injected, the volume of injected gas decreases 16.08 mL in experimental conditions compared to Exp1. The efficiency of gas–oil replacement process is notably improved under the assistance of water flooding. At the same shut-in time, without WFA in Exp1, the injected gas does not form an effective secondary gas cap. The experimental result shows that WFA has an obvious impact on inhibiting of gas downward flooding, promoting the upward migration, and shortening the shut-in time.
The oil distribution of Exp1, Exp2, and Exp4 after the shut-in stage is shown in Figure 9. Compared to the oil distribution after water flooding, the replaced attic oil and the reassembled bypassed oil in the shut-in stage lower the oil–water interface and the remaining oil resembles at the production well. The contrast result illustrates that the main function of WFA at the gas injection stage is to inhibit the gas downward and accelerate gas migration upward to form the secondary gas cap. At the experimental conditions, the higher the water flooding rate, the more obvious the assisted effect. However, restricted by the formation pressure, excessive water injection rate leads to less gas injected which causes the small volume of the secondary gas cap.
3.3. The Production Performance Evaluation of the Assisted GOC
After the secondary gas cap forms and the remaining oil resembles around the production well, we conducted the experiment of production by utilizing the gas cap expansion energy and water flooding assistance. The pressure, cumulative oil production, and gas–oil ratio are recorded to compare the assistance effect of WFA during the production stage.
The model pressure during the production process is shown in Figure 10. Even though the production rate is lower in the Exp1 and Exp2, the pressure of the models dropped quickly at 4.68 MPa/h in Exp1. Due to the bad condition of the secondary gas cap in Exp1, the injected gas is produced shortly after the beginning of production causing gas expansion energy loss. The model pressure fluctuates when gas begins to produce. Compared to Exp1, an effective secondary gas cap forms in Exp2. When producing at the lower production rate the gas channeling weakens and the production time extended. However, only with the expansion energy of the secondary gas cap, premature gas channeling occurred and the gas–oil ratio reached the termination condition. In Exp3 and Exp4 the pressure drop rate is slower under the influence of WFA after the production well begins to produce gas. The energy of the secondary gas cap releases gradually in the process. The pressure drop rate is 1.14 MPa/h in Exp4 which is smaller than that in Exp3 of 1.72 MPa/h. Due to the slow release of gas cap energy, gas channeling is prohibited, and the production duration is extended. The lower pressure drop rate caused by the effect of WFA is one of the conditions for the successful utilization of the secondary gas cap.
The relationship between the gas–oil ratio and cumulative oil production during the production process is shown in Figure 11. Base on the range of the gas–oil ratio, the production process is divided into 4 stages: (a) production without gas produced, (b) production under low gas–oil ratio, (c) production at high gas–oil ratio, and (d) production under gas flow driven. Due to the gas–oil contact being closer to the production well in Exp1, only 11.68 mL oil was produced at stage (a). When the production well is under gas flow driven condition the total cumulative oil is 32.55 mL. In Exp2, the oil production is stable at the beginning of the process. However, when the gas–oil interface reaches the production well the rapid production was driven by the gas flow.
Under the effect of WFA, stage (a) is extended. In Exp4, 113.56 mL oil is produced without gas production. With the WFA in Exp3 and Exp4, the stage (b) exists which indicates the gas–oil interface moves downward without gas channeling. This stage extends the production time and produced most of the total oil. Compared to the Exp3, the water injection rate is higher in Exp4 which could make a more favorable impact on gas channeling control in the period of the production process. However, water produces when the production process steps into the last period of production which causes a reduction in oil production.
The performance of different experiments is compared inTable 6. In Exp1 without the assistance of water flooding, the gas injection volume is the largest, but the oil production was the lowest. With the similar condition of the secondary gas cap in Exp2 and Exp3, the oil produced in Exp3 is nearly three times that in Exp2. The WFA makes a great effect on the oil production stage. In Exp4 with higher water flooding assistance the EOR performance is the best in the contrast experiments. The oil production volume in Exp4 is nearly nine times as much as the oil produced in Exp1 with basic production mode. However, water is produced during the process which leads to the decline of production. With the WFA, the ultimate oil recovery is enhanced, and the preferable economic benefits are achieved. However, the production datum show there is still productive potential after one cycle of the process.
3.4. The Evaluation of Remaining Oil Distribution after the Assisted GOC Process
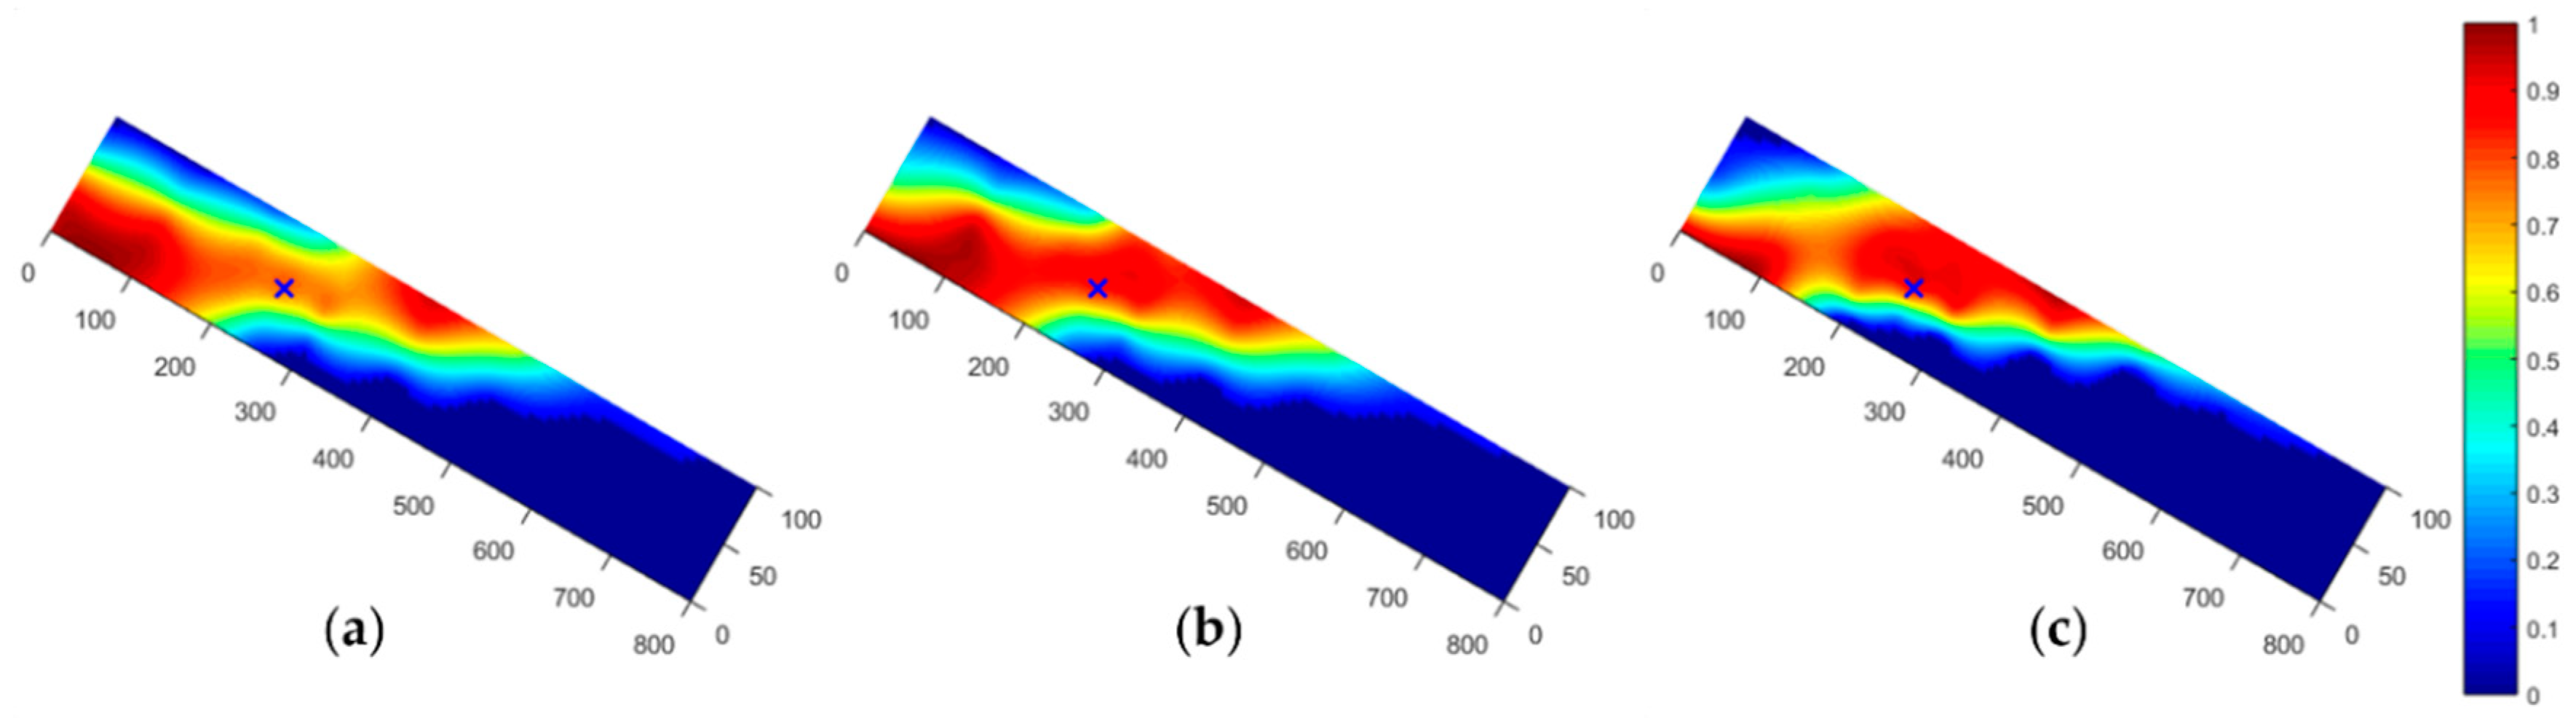
After the completion of development, we performed sampling to evaluate the assisted GOC displacement effect. The oil distribution base on the interpolation of the sampling result is shown in Figure 12. The map illustrates the spread condition of injected gas after the experiment completed. Compared to the oil distribution after water flooding, the attic oil decreases in the four experiments due to the replacement of injected gas. In the Exp1, the sweep efficiency of the secondary gas cap is 42.39%. The gas channeling notably affects the swept volume of gas expansion. Most of the attic oil is still located at the top of the model which indicates poorly oil displacement during the production stage. In Exp2, part of the attic oil is replaced by the injected gas, however, most of the replaced attic oil under the production well is not produced at the production stage due to the gas channeling. In the Exp3, with the WFA the sweep efficiency of secondary gas cap expansion is enhanced to 56.95%. In Exp4 the gas–oil contact downward movement is relatively stable. The gas channeling is effectively suppressed with the sweep efficiency of 68.53%.
Compared to the conventional waterflooding development, the water injection rate of WFA is much lower in the production process. Low water injection rate enables more uniform displacement and the water flooding sweep efficiency increases by 26.14%. Therefore, the attic oil replaced below the production wells and the resembled bypassed oil can be displaced in the process, which cannot be swept by the downward expansion of gas cap. The bi-directional flooding combining the gas expansion and water flooding assistance in the production process enables the goal of EOR for the reservoir at the high water cut stage. Based on the oil distribution after bi-directional flooding, there is still some production potential after one cycle of gas–oil replacement production. In order to highly recover the attic oil in an oil field, more cycles of replacement production are needed.
4. Conclusions
This study proposes a novel EOR method of assisted GOC based on the remaining oil distribution in fault-block reservoirs at the high water cut stage. The experimental models and procedures were designed to conduct control experiments. The gas–liquid interface migration and EOR performance were compared to illustrate the function of WFA during the process. From the comparison and analysis, the following conclusions can be drawn from the experimental results:
- The injected gas migrates upward to replace the attic oil which cannot be swept by the water flooding under the influence of GOC and WFA. The gas–oil countercurrent is the primary EOR mechanism of the proposed method.
- The gas upward migration speed is low, and the distribution of the gas phase is dispersive when only utilizing GOC to produce the attic oil. In this case, gas channeling can form easily in the production process, which can cause great loss of the gas cap energy. The production performance is very poor with only limited oil production.
- The function of WFA varies during different stages of the process. In the gas injection stage, the water flooding can block access to the downward migration and accelerate the migration speed which can improve production efficiency. The wells shut-in time shortens by 50% approximately. At the production stage, combining the expansion of the secondary gas cap, the bi-directional flooding forms. The water flooding can inhibit the gas channeling during the gas cap expansion and decrease the pressure decline rate. The water flooding can also displace the attic oil replaced under the production well and the resembled bypassed oil which cannot be swept by gas expansion.
- With the higher assisted effect in Exp4, the production duration can be extended four times with 223.86 mL more oil produced compared to the basic GOC production process in Exp1. However, excessive WFA can also cause water breakthrough which reduces oil production.
- Even for the best assisted GOC performance in Exp4, there is still production potential after one cycle of the process. This is caused by the limitation of the volume of injected gas. In practical production, more cycles are needed to achieve better production performance.
Author Contributions
Conceptualization, K.M., H.J., and J.L.; investigation, K.M., R.Z., and Y.Z.; methodology, K.M., K.S., and R.Z.; writing—original draft, K.M., H.J., and R.Z.; writing—review and editing, J.L. and Y.Z. All authors have read and agreed to the published version of the manuscript.
Funding
This research was funded by the National Science and Technology of Major Project, grant number 2016ZX05011-002-002.
Acknowledgments
The authors wish to appreciate the State Key Laboratory of Petroleum Resources and Prospecting, China University of Petroleum-Beijing for the permission to publish this paper.
Conflicts of Interest
The authors declare no conflicts of interest.
References
- Jiang, S.; Wang, W.; Zhang, A.; Zhou, W. Genetic mechanism and evolution of the covert fault zone and its oil-controlling mode in qikou sag, eastern China. Energies 2019, 12, 98. [Google Scholar] [CrossRef] [Green Version]
- Wang, J.; Cao, Y.; Liu, K.; Costanzo, A.; Feely, M. Diagenesis and evolution of the lower Eocene red-bed sandstone reservoirs in the Dongying Depression, China. Mar. Pet. Geol. 2018, 94, 230–245. [Google Scholar] [CrossRef]
- Yuan, S.; Wang, Q. New progress and prospect of oilfields development technologies in China. Pet. Explor. Dev. 2018, 45, 698–711. [Google Scholar] [CrossRef]
- Ma, K.; Jiang, H.Q.; Li, J.J.; Chang, Y.H.; Zhao, L.; Yang, H.X.; Yan, Q. A New Method of Bidirectional Displacement to Enhance Oil Recovery in Fault-block Reservoirs at High Water Cut Stage. In Proceedings of the IOR 2017—19th European Symposium Improved Oil Recovery, Stavanger, Norway, 24 April 2017. [Google Scholar]
- Yahong, W.; Xingfang, W.; Mengya, X.; Shengtao, G. Study of early dynamic evaluation methods in complex small fault-block reservoirs. Energy Procedia 2012, 14, 689–694. [Google Scholar] [CrossRef] [Green Version]
- Strickland, R.F.; Morse, R.A. Gas Injection for Upstructure Oil Drainage. J. Pet. Technol. 1979, 31, 1323–1331. [Google Scholar] [CrossRef]
- Yuan, D.; Hou, J.; Song, Z.; Wang, Y.; Luo, M.; Zheng, Z. Residual oil distribution characteristic of fractured-cavity carbonate reservoir after water flooding and enhanced oil recovery by N2 flooding of fractured-cavity carbonate reservoir. J. Pet. Sci. Eng. 2015, 129, 15–22. [Google Scholar] [CrossRef]
- Van der Poel, C.; Killian, J.W. Attic Oil. In Proceedings of the Fall Meeting of the Society of Petroleum Engineers of AIME, Society of Petroleum Engineers, Dallas, TX, USA, 28 September 1975. [Google Scholar]
- Combs, G.D.; Knezek, R.B. Gas Injection for Upstructure Oil Drainage. J. Pet. Technol. 1971, 23, 361–372. [Google Scholar] [CrossRef]
- Richardson, J.G.; Blackwell, R.J. Use of Simple Mathematical Models for Predicting Reservoir Behavior. J. Pet. Technol. 2007, 23, 1145–1154. [Google Scholar] [CrossRef]
- Juan, C. Hernandez Oil Bypassing By Water Invasion to Wells: Mechanisms and Remediation. Ph.D. Thesis, Louisiana State University, Baton Rouge, LA, USA, 2007. [Google Scholar]
- Luo, H.; Delshad, M.; Pope, G.A.; Mohanty, K.K. Scaling up the interplay of fingering and channeling for unstable water/polymer floods in viscous-oil reservoirs. J. Pet. Sci. Eng. 2018, 165, 332–346. [Google Scholar] [CrossRef]
- Loro, R.; Hill, R.; Jackson, M.; Slate, T. Technologies that have transformed the Exmouth into Australia. APPEA J. 2017, 55, 233. [Google Scholar] [CrossRef]
- Martins, E.J.; Larez, N.J.; Lesso, W.G., Jr. Recovery of Attic Oil Through Horizontal Drilling. In Proceedings of the SPE Annual Technical Conference and Exhibition, Society of Petroleum Engineers, Houston, CA, USA, 8–10 November 1993; pp. 1–11. [Google Scholar]
- Vo, D.T.; Marsh, E.L.; Sienkiewicz, L.J.; Mueller, M.D.; May, R.S. Gulf of Mexico Horizontal Well Improves Attic-Oil Recovery in Active Waterdrive Reservoir. SPE Reserv. Eng. 2007, 12, 163–168. [Google Scholar] [CrossRef]
- Lyngra, S.; Al-Sofi, A.; Al-Otaibi, U.; Al-Shakhs, M.; Al-Alawi, A. New Technology Applications For Improved Attic Oil Recovery: The World’s First Slim Smart Completions. In Proceedings of the International Petroleum Technology Conference, Society of Petroleum Engineers, Kuala Lumpur, Malaysia, 3–5 December 2008; pp. 1–6. [Google Scholar]
- Sun, Z.; Espinoza, D.N.; Balhoff, M.T.; Dewers, T.A. Discrete Element Modeling of Micro-scratch Tests: Investigation of Mechanisms of CO2 Alteration in Reservoir Rocks. Rock Mech. Rock Eng. 2017, 50, 3337–3348. [Google Scholar] [CrossRef]
- De Loubens, R.; Ramakrishnan, T.S. Analysis and computation of gravity-induced migration in porous media. J. Fluid Mech. 2011, 675, 60–86. [Google Scholar] [CrossRef]
- Jadhawar, P.S.; Sarma, H.K. Effect of well pattern and injection well type on the CO2-assisted gravity drainage enhanced oil recovery. J. Pet. Sci. Eng. 2012, 98–99, 83–94. [Google Scholar] [CrossRef]
- Nordbotten, J.M.; Celia, M.A.; Bachu, S.; Dahle, H.K. Semianalytical solution for CO2 leakage through an abandoned well. Environ. Sci. Technol. 2005, 39, 602–611. [Google Scholar] [CrossRef]
- Sherafati, M.; Jessen, K. Dynamic Relative Permeability and Simulation of WAG Injection Processes. Transp. Porous Media 2017, 117, 125–147. [Google Scholar] [CrossRef]
- Al-Mudhafar, W.J.; Rao, D.N.; Srinivasan, S. Robust Optimization of Cyclic CO2 flooding through the Gas-Assisted Gravity Drainage process under geological uncertainties. J. Pet. Sci. Eng. 2018, 166, 490–509. [Google Scholar] [CrossRef]
- Templeton, E.E.; Nielsen, R.F.; Stahl, C.D. A Study of Gravity Counterflow Segregation. Soc. Pet. Eng. J. 1961, 2, 185–193. [Google Scholar] [CrossRef]
- Briggs, J.E.; Katz, D.L. Drainage of Water from Sand in Developing Aquifer Storage. In Proceedings of the Fall Meeting of the Society of Petroleum Engineers of AIME, Society of Petroleum Engineers, Dallas, TX, USA, 2–5 October 1966. [Google Scholar]
- Karpyn, Z.T.; Li, G.; Grader, A.S.; Halleck, P.M. Experimental conditions favoring the formation of fluid banks during counter-current flow in porous media. Transp. Porous Media 2006, 62, 109–124. [Google Scholar] [CrossRef]
- Baker, R.O.; Yarranton, H.W.; Jensen, J.L. Practical Reservoir Engineering and Characterization; Elsevier: Amsterdam, The Netherlands, 2015; ISBN 978-0-12-801811-8. [Google Scholar]
- Zhang, Y.; Hu, J.; Zhang, Q. Simulation study of CO2 Huff-n-Puff in tight oil reservoirs considering molecular diffusion and adsorption. Energies 2019, 12, 2136. [Google Scholar] [CrossRef] [Green Version]
- Chen, Z.; Lin, M.; Wang, S.; Chen, S.; Cheng, L. Impact of un-propped fracture conductivity on produced gas huff-n-puff performance in Montney liquid rich tight reservoirs. J. Pet. Sci. Eng. 2019, 181, 106234. [Google Scholar] [CrossRef]
- Bai, H.; Zhang, Q.; Li, Z.; Li, B.; Zhu, D.; Zhang, L.; Lv, G. Effect of fracture on production characteristics and oil distribution during CO2 huff-n-puff under tight and low-permeability conditions. Fuel 2019, 246, 117–125. [Google Scholar] [CrossRef]
- Zhou, X.; Yuan, Q.; Rui, Z.; Wang, H.; Feng, J.; Zhang, L.; Zeng, F. Feasibility study of CO2 huff ‘n’ puff process to enhance heavy oil recovery via long core experiments. Appl. Energy 2019, 236, 526–539. [Google Scholar] [CrossRef]
- Kimbrell, W.C.; Allison, E.C. Improved Recovery from Gulf of Mexico Reservoirs: Comparison of Methane, Nitrogen and Flue Gas for Attic Oil. Final Report; Louisiana State University: Baton Rouge, LA, USA, 1996; Volume IV. [Google Scholar]
- Bai, B.; Hu, Q.; Li, Z.; Lü, G.; Li, X. Evaluating the sealing effectiveness of a caprock-fault system for CO2-EOR storage: A case study of the Shengli oilfield. Geofluids 2017, 2017, 17. [Google Scholar] [CrossRef] [Green Version]
- Liu, D.; Sun, J. The Control Theory and Application for Well Pattern Optimization of Heterogeneous Sandstone Reservoirs; Springer: Berlin/Heidelberg, Germany, 2017; ISBN 978-3-662-53285-0. [Google Scholar]
- Akkurt, R.; Bowcock, M.; Davies, J.; Del Campo, C.; Hill, B.; Joshi, S.; Kundu, D.; Kumar, S.; O’Keefe, M.; Samir, M.; et al. Focusing on downhole fluid sampling and analysis. Oilf. Rev. 2006, 18, 4–19. [Google Scholar]
- Zuo, J.Y.; Zhang, D.; Dubost, F.X.; Dong, C.; Mullins, O.; O’Keefe, M.; Betancourt, S. Equation-of-State-Based Downhole Fluid Characterization. SPE J. 2011, 16, 115–124. [Google Scholar] [CrossRef]
- Mayerhofer, M.; Oduba, O.; Agarwal, K.; Melcher, H.; Lolon, E.; Bartell, J.; Weijers, L. A Cost/Benefit Review of Completion Choices in the Williston Basin Using a Hybrid Physics-Based-Modeling/Multivariate-Analysis Approach. SPE Prod. Oper. 2018, 34, 024–040. [Google Scholar] [CrossRef]
- Donaldson, E.C.; Chilingarian, G.V.; Yen, T.F. Enhanced Oil Recovery, II: Processes and Operations; Elsevier: Amsterdam, The Netherlands, 1989. [Google Scholar]
- Melrose, J.C. Role of Capillary Forces In Detennining Microscopic Displacement Efficiency For Oil Recovery By Waterflooding. J. Can. Pet. Technol. 1974, 13, 12. [Google Scholar] [CrossRef]
- Zhou, D.; Fayers, F.J.; Orr, F.M. Scaling of multiphase flow in simple heterogeneous porous media. Proc. SPE Symp. Improv. Oil Recover. 1994, 2, 559–569. [Google Scholar] [CrossRef]
Figure 1.
The distribution of sampling probes in the longitudinal section.

Figure 2.
A schematic diagram of the experimental setup for assistant gas–oil countercurrent production.
Figure 2.
A schematic diagram of the experimental setup for assistant gas–oil countercurrent production.

Figure 3.
Schematic diagrams of the assisted gas–oil countercurrent (GOC) experiment. (a1) Gas injection with water injected simultaneously; (a2) gas injection without water injected; (b) wells shut-in; (c1) production with water injected simultaneously; (c2) production without water injected.
Figure 3.
Schematic diagrams of the assisted gas–oil countercurrent (GOC) experiment. (a1) Gas injection with water injected simultaneously; (a2) gas injection without water injected; (b) wells shut-in; (c1) production with water injected simultaneously; (c2) production without water injected.

Figure 4.
Dynamic characteristics of oil recovery performance in Exp1.

Figure 5.
The oil distribution after water flooding in the longitudinal section.

Figure 6.
The gas distribution at different shut-in times of Exp1. (a) 24 h after shut-in; (b) 48 h after shut-in; (c) 72 h after shut-in; (d) 96 h after shut-in.
Figure 6.
The gas distribution at different shut-in times of Exp1. (a) 24 h after shut-in; (b) 48 h after shut-in; (c) 72 h after shut-in; (d) 96 h after shut-in.

Figure 7.
The gas distribution at different shut-in times of Exp2. (a) 24 h after shut-in; (b) 48 h after shut-in; (c) 72 h after shut-in; (d) 96 h after shut-in.
Figure 7.
The gas distribution at different shut-in times of Exp2. (a) 24 h after shut-in; (b) 48 h after shut-in; (c) 72 h after shut-in; (d) 96 h after shut-in.

Figure 8.
The gas distribution at different shut-in times of Exp4. (a) 24 h after shut-in; (b) 48 h after shut-in; (c) 72 h after shut-in; (d) 96 h after shut-in.
Figure 8.
The gas distribution at different shut-in times of Exp4. (a) 24 h after shut-in; (b) 48 h after shut-in; (c) 72 h after shut-in; (d) 96 h after shut-in.

Figure 9.
The oil distribution of different models after the shut-in stage. (a) Oil distribution of Exp1; (b) oil distribution of Exp2; (c) oil distribution of Exp4.
Figure 9.
The oil distribution of different models after the shut-in stage. (a) Oil distribution of Exp1; (b) oil distribution of Exp2; (c) oil distribution of Exp4.

Figure 10.
The model pressure of different experiments during the production process.

Figure 11.
The cumulative oil production varies with the gas–oil ratio of different experiments: (a) production without gas produced; (b) production under low gas–oil ratio; (c) production at high gas–oil ratio; (d) production driven by the gas flow.
Figure 11.
The cumulative oil production varies with the gas–oil ratio of different experiments: (a) production without gas produced; (b) production under low gas–oil ratio; (c) production at high gas–oil ratio; (d) production driven by the gas flow.

Figure 12.
The oil distribution of different models after the development: (a) oil distribution of Exp1; (b) oil distribution of Exp2; (c) oil distribution of Exp3; (d) oil distribution of Exp4.
Figure 12.
The oil distribution of different models after the development: (a) oil distribution of Exp1; (b) oil distribution of Exp2; (c) oil distribution of Exp3; (d) oil distribution of Exp4.


Table 1.
Basic characteristic parameters of the experimental model.
| Characteristic Parameters | Value | Characteristic Parameters | Value |
|---|---|---|---|
| Length (cm) | 80 | Number of sampling probes | 30 |
| Diameter (cm) | 10 | Dip angle (°) | 0–90 |
| Cross-sectional area (cm2) | 79 | Withstand pressure (MPa) | 30 |
| Model volume (mL) | 6283 | Withstand temperature (°C) | 150 |
Table 2.
Properties of experimental fluids under experimental conditions (90 °C and 16 MPa).
| Fluid | Viscosity (cP) | Density (g/cm3) |
|---|---|---|
| Mineral oil | 10 | 0.8 |
| Water | 1 | 1 |
| Gas | 0.02 | 0.2 |
Table 3.
The parameter of different gas–oil countercurrent experiments.
| NO. | Schematic Diagram of Experiment as Shown in Figure 3 | Injection Stage | Sampling Time during Wells Shut-in (Hours) | Production Stage | ||
|---|---|---|---|---|---|---|
| Gas Injection Rate (mL/min) | Water Injection Rate (mL/min) | Production Rate (mL/min) | Water Injection Rate (mL/min) | |||
| Exp1 | a2-b-c2 | 2 | 0 | 24, 48, 72, 96 | 0.5 | 0 |
| Exp2 | a1-b-c2 | 2 | 0.5 | 0.5 | 0 | |
| Exp3 | a1-b-c1 | 2 | 0.5 | 1 | 0.5 | |
| Exp4 | a1-b-c1 | 2 | 0.8 | 1 | 0.8 | |
Table 4.
Physical properties comparison of the sand pack models.
| NO. | Sand Volume (cm3) | Permeability (mD) | Porosity (%) | Oil Reverses (mL) |
|---|---|---|---|---|
| Exp1 | 6205.30 | 1308.26 | 37.24 | 2025.62 |
| Exp2 | 6251.50 | 1272.73 | 36.73 | 1992.37 |
| Exp3 | 6242.10 | 1293.41 | 37.08 | 2013.46 |
| Exp4 | 6271.60 | 1246.55 | 36.61 | 1980.51 |
Table 5.
Production data comparison of water flooding in different experiments.
| NO. | Cumulative Water Injection (PV) | Oil Recovery Factor of Water Flooding (%) | Model Pressure after Water Flooding (MPa) | Remaining Reserves after Water Flooding (mL) |
|---|---|---|---|---|
| Exp1 | 0.58 | 46.73 | 10.10 | 1079.05 |
| Exp2 | 0.57 | 45.92 | 10.08 | 1077.47 |
| Exp3 | 0.58 | 46.11 | 10.03 | 1085.05 |
| Exp4 | 0.56 | 45.37 | 10.20 | 1081.95 |
Table 6.
Production dynamic data summary of different experiments.
| NO. | Gas Injection Volume (mL) | Oil Increment Volume (mL) | Water Production Volume (mL) |
|---|---|---|---|
| Exp1 | 65.45 | 32.55 | 5.47 |
| Exp2 | 56.74 | 63.38 | 8.63 |
| Exp3 | 55.82 | 174.34 | 12.15 |
| Exp4 | 49.37 | 256.41 | 44.31 |
© 2020 by the authors. Licensee MDPI, Basel, Switzerland. This article is an open access article distributed under the terms and conditions of the Creative Commons Attribution (CC BY) license (http://creativecommons.org/licenses/by/4.0/).
Share and Cite
MDPI and ACS Style
Ma, K.; Jiang, H.; Li, J.; Zhang, R.; Shen, K.; Zhou, Y. A Novel Assisted Gas–Oil Countercurrent EOR Technique for Attic Oil in Fault-Block Reservoirs. Energies 2020, 13, 402. https://0-doi-org.brum.beds.ac.uk/10.3390/en13020402
AMA Style
Ma K, Jiang H, Li J, Zhang R, Shen K, Zhou Y. A Novel Assisted Gas–Oil Countercurrent EOR Technique for Attic Oil in Fault-Block Reservoirs. Energies. 2020; 13(2):402. https://0-doi-org.brum.beds.ac.uk/10.3390/en13020402
Chicago/Turabian StyleMa, Kang, Hanqiao Jiang, Junjian Li, Rongda Zhang, Kangqi Shen, and Yu Zhou. 2020. "A Novel Assisted Gas–Oil Countercurrent EOR Technique for Attic Oil in Fault-Block Reservoirs" Energies 13, no. 2: 402. https://0-doi-org.brum.beds.ac.uk/10.3390/en13020402
Note that from the first issue of 2016, this journal uses article numbers instead of page numbers. See further details here.