A Review of Strategies to Increase PV Penetration Level in Smart Grids


1
Department of Electrical and Electronics Engineering, Jawaharlal Nehru Technological University Anantapur, Pulivendula 516390, India
2
Fukushima Renewable Energy Institute, AIST (FREA), Koriyama 963-0298, Japan
*
Author to whom correspondence should be addressed.
Energies 2020, 13(3), 636; https://0-doi-org.brum.beds.ac.uk/10.3390/en13030636
Submission received: 27 December 2019
/
Revised: 29 January 2020
/
Accepted: 31 January 2020
/
Published: 3 February 2020
(This article belongs to the Section A1: Smart Grids and Microgrids)
Abstract
:Due to environmental concerns, power system generation is shifting from traditional fossil-fuel resources to renewable energy such as wind, solar and geothermal. Some of these technologies are very location specific while others require high upfront costs. Photovoltaic (PV) generation has become the rising star of this pack, thanks to its versatility. It can be implemented with very little upfront costs, e.g., small solar home systems, or large solar power plants can be developed to generate MWs of power. In contrast with wind or tidal generation, PV can be deployed all around the globe, albeit with varying potentials. These merits have made PV the renewable energy technology with highest installed capacity around the globe. However, PV penetration into the grid comes with its drawbacks. The inverter-interfaced nature of the PV systems significantly impacts the power system operation from protection, power flow and stability perspectives. There must be strategies to mitigate these negative impacts so that PV penetration into the grid can continue. This paper gives a thorough overview of such strategies from different research fields: such as communication, artificial intelligence, power electronics and electric vehicle charging coordination. In addition, possible research directions are given for future work.
1. Introduction
Increased demand in the grid necessitates development of new strategies for power generation. Preferably, clean energy sources are utilized to mitigate the environmental effects of fossil fuels. Renewable energy resources (RES) like wind and photovoltaic (PV) are substantially used for power generation as an alternative to the conventional ones. Carbon footprint of power generation is reduced as a result [1]. Installation of PV systems has significantly increased increase in the global market, making it one of the major sources of power generation [2]. In the current global scenario, PV has a greater installed capacity than any other RES such as hydro and wind [3]. Figure 1 shows the cumulative installed PV capacity in the world for the period of 2012-2018. PV modules have become the most common distributed energy resources (DER) at household level since other DERs like wind, geothermal, biogas are location-specific. The availability of PV panels and its financial reachability has encouraged household installations that can electrify rural areas like in sub-Sahara regions of Africa [4,5]. PV, on the other hand, can be installed at every household to meet the energy demand of the house and sell excess energy to the grid when more energy is available. Such use of PV modules at residential level can reduce the power bills of the owner and also support the grid with local generation. Accordingly, it is one of the fastest growing RES-based generation technologies [6]. In addition, countries that are dependent on imported energy resources are looking at ways to increase their energy independence [7]. To increase the adoption of RES, incentives like reduction in taxes, pay back schemes, feed in tariffs and subsidized capital costs for installments are encouraged globally [8,9,10,11,12]. Furthermore, countries are largely concentrating to reducing the greenhouse gases (GHG) emissions by setting Targets such as EU 2020 [13].
However, there is a major drawback with PV systems as they are time dependent and maximum generation occurs at noon, which does not coincide with the peak demand hours. The transition from excess energy with little load to little generation with heavy load creates a peculiar profile called the duck curve [14]. Optimal and coordinated operation of the alternate sources with thermal generation, wind or storage systems is significantly needed for balancing the load [15]. Coordinated operation between different DERs, bulk thermal generation and loads require bi-directional communication. With the introduction of information and communication technologies (ICT) for monitoring and controlling has evolved the legacy power system as smart grid [16]. A smart grid is an electrical power network integrated with different types and scales of generation sources along with ICT for enhanced monitoring and control. Smart grids considerably improve the efficiency, reduce energy consumption and cost, and maximize the transparency and reliability of the power network.
As the demand is low during day when there are ample solar resources available, generation cannot be absorbed or utilized by the grid. In order to mitigate the adverse impacts of excessive PV-based generation, the output is curtailed [17,18,19,20]. There has been substantial research work on the impacts of the integration of renewable resources into distribution networks [21,22,23].
Several techniques for harnessing the maximum PV power has been identified through maximum power point tracking (MPPT) algorithms [24]. Advanced tracking techniques with Artificial Neural Networks (ANN) [25] and Adaptive Neuro Fuzzy Inference System (ANFIS) [26] based controllers have been developed for increased generation from PV modules [27]. Furthermore, the maximum capacity of DERs that can be hosted in the grid, also known as Feeder Hosting Capacity (FHC) has been studies [28]. For increasing the hosting levels novel measures using passive harmonic filtering and probabilistic approach are determined in literature [29,30]. Damping of sub synchronous resonance has also been studied using high penetration of PV power [31]. However, increased level of PV penetration in the distribution networks resulted in rise of power quality issues like voltage variations and reversal of power flow direction in the network [20,32]. Several concerns related to power system stability such as oscillatory instability, small signal stability issues have severely impacted high levels of PV penetrations [33,34,35]. These anomalies directly impact network equipment like load tap changers (LTCs), line voltage regulators (LVRs) and voltage-controlled capacitor banks, as they operate frequently to maintain the feeder voltages. Hence, higher levels of PV penetration shorten system life cycle shortens and increase maintenance costs [22].
To overcome these issues, research has focused on novel techniques for mitigating the impacts of high PV penetration [36]. These techniques vary from coordinating between voltage and frequency controllers to developing novel schemes for integrating Electric Vehicles (EVs) to increase PV generation amount. This paper presents a comprehensive review of such strategies. The rest of the paper is organized as follows: Section 2 presents different strategies to increase PV penetration levels in smart grids. Section 3 presents a review of different PV integration strategies in conjunction with EVs. After reviewing the state of the literature, Section 4 provides a discussion and gives future research directions for researchers working in this field. Finally, Section 5 draws the conclusions.
2. Strategies for Increasing PV Penetration Level in Smart Grids
There are different definitions for the term ‘PV penetration’ in the literature [37,38,39,40]. PV penetration is defined as the ratio PV generation to total energy generation. Various works in literature suggest that the challenges and effects of PV penetration become evident when it reaches beyond 15% [41]. This section focuses on review of different strategies for achieving high penetration of PV generation in the smart grids. Some studies on DC grid and DC microgrids for increasing PV penetration have been reported in the literature [42,43,44]. However, DC grids are limited to small islands or standalone systems whereas majority of studies focus on integrating PV generation to existing AC grids, both at transmission and distribution level. Hence, this paper focuses on PV penetration strategies for AC grids.
There are different works that focus on different aspects of this field. For instance, some researchers focused on increasing the PV hosting capacity at roof tops. Authors in [45] developed a software that can overcome the traditional way of PV planning for rooftop systems which attracts more costs. Solar forecasting one of most important component for economical roof top PV planning [46,47]. This [45] automated system can decrease the cost of PV planning installations [48], and assist the urban/suburban regions to end the energy crisis and aid the economic development [49]. Similarly, in [50] authors developed high-resolution geospatial assessment of roof top PV potential in European Union using satellite-based and statistical data sources with machine learning algorithms. Hence, this strategy validates the high PV generation by increasing the PV hosting capacity at the rooftops. This work is especially noteworthy as it targets increase of PV deployments in both ongrid and offgrid applications. While some researchers focused on control approaches, others investigated different system topologies, demand management techniques as well as the development of new equipment such as smart inverters. Coordinated control of system equipment like LVRs, SVCs, OLTCs in combination with hybrid energy storage is also implemented. Some stated novel approaches for increasing PV capture, e.g., integration of PV generation planning with EV charging. Some of these novel approaches involve optimization techniques such as swarm optimization for estimation generation and load in a more accurate fashion.
2.1. Voltage Control Strategies for Increasing PV Penetration Level
2.1.1. Upgraded Voltage Control Strategy
Akagi et al. [51] has proposed a comprehensive approach to determine the appropriate voltage control method for upgrades based on the limit of penetration rate. The process involves upgrading scalar line drop compensation (LDC) to Vector LDC/centralized Control method and then to on-line tap changer (OLTC). In addition, the former is upgraded by installing Static Var Compensator (SVC) or Step Voltage Regulator (SVR) at the certain locations of the network.
Authors had evaluated the strategy by performing numerical simulations. In addition to that a series of experiments are conducted with an active network simulator with energy resources software (ANSWER) [52] to validate the strategy. ANSWER was used to model the experimental distribution system of a residential area, the model created is of an actual 6.6 kV distribution system which was scaled down to 200 volts.
Among the conventional voltage control methods of OLTC by using scalar LDC method, tap position is changed to maintain the calculated voltage of the reference point Vref in the limits of dead band (DB) that can be obtained from Equation (1) using the secondary side voltage of OLTC, , the current passing through OLTC, , and the line resistance and reactance, Rref and Xref, respectively. The deviation Dev(t) of voltage can be calculated as shown in Equation (2). when the reference voltage deviates from the dead band, the voltage deviation quantity Dev(t) gets integrated and becomes zero when the reference voltage is within the dead band. Where DBup and DBlow are the upper and lower margins of DB and was set to 60 sec for numerical simulations. The tap position is controlled based on Equation (2) that if the deviation Dev is more than the lower tap position of OLTC, then the tap position is raised, while if the Dev is less, the tap is lowered to new position. In the Vector LDC method, the calculation of reference voltage point as in Equation (3) is more accurate as it considers the dynamic changes in the power factor of the system, which was fixed in scalar LDC. The vector LDC technique offers a more precise calculation, since the calculation of the vector takes dynamic changes in power factor.
In centralized control method, the distribution voltage reference is kept within the permissible range using the voltage measured at the switches. The tap changing of the OLTC and SVR is modeled as shown in Equation (4). It can be observed that it uses the maximum and minimum limits of the measured voltage Vmin and Vmax as well as the limits of dead band VTCup and VTClow. The tap position is altered when deviation changes beyond the limits of dead band according to (4). Upgrading the former by connecting the SVC, it delivers reactive power to maintain the voltage profile at the interconnection of lines to be within permissible limits of the dead band region. SVC output reactive power is based on the Proportional Integral (PI) control.
This upgrade of voltage control method follows the selection of the control parameters to obtain the limit of PV penetration rate. Initially scalar control method is altered to vector LDC method for upgradation, the parameters for vector LDC method are defined as follows, at first the control parameters are calculated for scalar LDC according to Equation (1) using load current without PV systems. Secondly, the conventional control parameters are revised to avoid voltage deviation in the event of increased penetration of PV which results in alterations of voltage levels in scalar LDC method. The control parameters of the scalar and vector LDC methods are determined as in Equation (5) such that the sum of the deviations is minimized. In Equation (5), Vdev is voltage deviation, Vtar is the target voltage and the parameters Ndate is number of simulation dates, Nnode is number of nodes, T is the length of simulation time and Tstep is simulation time step of 60s. The optimal value of Vdev is 0, which represents no voltage deviation.
For performance evaluation of the voltage control method, numerical simulations are performed as per the desired settings. In the study, six types of PV profiles and two types of load profiles are used. These are provided by New Energy and Industrial Technology Development Organization (NEDO) [53]. Under certain features and period of time reference with seasons, the PV penetration rate is increased at a rate of 5% increments starting from zero for the all control methods up to 100% penetration limit.
The results obtained show that the OLTC control with scalar LDC have managed to increase the PV penetration limit to 40% only, whereas on upgrade to vector LDC the penetration limit has increased to 55% and the deviation is surpassed. On the other hand, simulation results with SVC and SVR shows that the penetration rate is increased to 95–100%. SVR increased penetration rate more than that of SVC and is selected as most suitable method for high PV penetration rate. In addition to that it can prevent voltage deviations for 30 min on average. In contrast, SVC increases penetration rate by preventing instantaneous voltage deviations. Further work may be required to achieve an optimum mix between SVR and SVC for instantaneous and average voltage deviation control.
2.1.2. Economical Distributed Voltage Control Strategy
Authors in [54] have drawn attention towards the control strategy for the high penetration of PV generation in low voltage networks. This method aims to keep the bus voltage within permissible limits and uses Battery Energy Storage System (BESS) to recharge during high power generation conditions instead of curtailment. When BESS is fully charged, the method switches to reactive power compensation. Traditional control methods [51] have been adopted for the high penetration of PV power into the grids but the SVCs and OLTCs are often exposed to high stress causing degradation and reduction in lifetime [55]. Incorporating the BESS in low-voltage networks is found to be a promising solution against the over voltages and address these issues.
The control scheme involves management of the network voltages under the designated limits. The controllers are installed at the nodes where the PV modules are deployed. One of the advantages of this strategy is that there is no possibility of failure as it is adhered to centralized control scheme, and it does not depend on local measurements other than voltages at the nodes of PV. The distribution control algorithm developed in [54] is as shown in Figure 2. Under normal operation of the scheme when PV generation is less than power demand Pdem (Ppv < Pdem), then measured voltage Vmeas at the PV terminals is below the set voltage limit Vlim (Vmeas < Vlim). Hence no action is required. In the second case, if Ppv > Pdem which may cause (Vmeas ≥ Vlim) then the controller action instructs BESS to charge with the excess power generated by PV. In this case, controllers are switched into two conditions. First, when the PV generation is more than the Pbatt and Pdem, then PV curtailment algorithm is run to determine the amount to mitigate the over voltage issue. In the second condition, if the BESS system is fully charged and still overvoltage exists, reactive power operation is done to improve the power quality of the network. The PV inverters supply ancillary service such as reactive power management based on the inverters rated apparent power.
The performance of the scheme is evaluated with simulation works. The algorithm is designed in MATLAB and the network system is developed in open source distribution network system tools (OpenDSS). Simulations for different cases were tested on certain demand data and period for a single feeder distribution system. The controller actions for the different cases in [54] concluded that scheme successfully keeps the voltages in prescribed limits by mitigating the over voltages. The operation of BESS systems at critical nodes had achieved a greater reliability than the BESS installments at the all the nodes, this makes the control strategy more economical.
2.2. Coordinated Control Strategies to Increase PV Penetration Level
2.2.1. Optimal Coordination Strategy
An optimal coordination strategy is proposed in [56] where LTCs, switched shunt capacitors (SCs), step voltage regulators (StVRs) and Energy storage devices (ESDs) are managed and coordinated for ensuring high PV penetration, voltage regulation and power loss minimization. In [56] authors developed an algorithm, shown in Figure 3, to identify the settings for the operation of LTCs, SCs, SVRs and dispatch rate of Energy storage from ESDs.
LTCs are mechanical equipment that prevents voltage changes due to any temporary voltage fluctuations. However, rapid fluctuations of voltages due to integrated intermittent RES may not be mitigated by LTCs due to time delay [57]. Capacitors are also used to maintain the voltage profile by providing reactive support to the network [58], ESDs provide fast frequency response, short term power reserve reducing the peak demand of the utility and supporting the load growth in the future [59,60,61]. There are significant anomalies in the individual operation of the said devices, although, optimal coordination strategy developed by genetic algorithm has provided a robust and reliable operation with high PV penetration in the grid by mitigating the voltage and other stability issues.
In this scheme voltage regulation problem is formulated as there is a large impact of intermittent RES connected to the network, which are sources of voltage irregularities. VAR devices are connected at the point of common coupling of RES including ESDs to minimize the overall losses and regulating the voltage profile under the prescribed limits. If the former fails, then optimal scheduling of LTCs, SCs and ESDs are modelled as a multi period optimization problem.
All the parameters of the devices used are constituted at the distribution network operator (DNO) where all the operations and the maintenance of all the configurations of the connected devices and the limits range are recorded. All this data is used as input to the GA, the optimization process initiated by the randomly populating functions with their individual solutions called chromosomes. Each chromosome is assigned with a fitness function evaluating the cost. Chromosomes with higher costs are not processed and can be used in next generation data through elitism. The small subset of chromosomes is picked up from mating pool. These form a parent which are of low cost. Which is said to be as tournament selection process. These parents are then processed /paired and recombined using genetic operators like cross over and mutation for the production of next generation offspring. This cycle is repeated for number of generations [62]. When the generated offspring are not in constraints, penalty function is introduced to weigh out the solutions by increasing their fitness function [63]. A fitness function is a sum of voltage deviations in the network and loss in active energy of the system as shown in Equation (6). Where Vi,t is voltage of bus i at time t, Vref is the magnitude of reference voltage, Pi,t is net active power injection at bus i at time t, ℑ is weighted-coefficient of voltage minimization, ℜ is weighted-coefficient of loss minimization and N is the number of buses.
Individual fitness of the population can be calculated using the Equation (6). All parameters of LTCs tap positions, SVR tap steps, State of charge of ESDs, status of charge in SCs are taken as input to the GA constitutes the population for the algorithm. The genetic algorithm framework solves for the solution of best optimal settings of the LTCs, SCs, SVRs control switches. For the controlled coordination the control flowchart is as shown in Figure 3. The control strategy is defined as in no peak load period, the tap changers operate when a voltage rise happens. Then a centralized controller updates the information to SOC controller through coordination signal which results in EDS controller initiates the of charging of batteries in ESDs to decrease the stress at transformer due to reverse power flow. In peak load hours the coordination controller updates the EDS controller to discharge the battery to compensate the grid peak load. The control variable ‘Flag’ is used as an indicator for any difference in voltage. If any changes happen the transformer regulates the bus I voltage to be in limit. Hence through this coordination control is fulfilled.
This solution is evaluated on IEEE 123 bus feeder system, the efficacy of the coordinated control strategy is tested and examined under various operating conditions and test scenarios. Results obtained from five test scenarios suggested that the VAR control devices reduce the system losses and boost the system capability for voltage regulation. The capacitors influence the reactive power flow compensation, the voltage drops and the integration of ESDs warrants the voltage profile improvement in night hours and the recorded voltage deviation is lowered. This, in turn, eases the high penetration of PV power into the grid.
2.2.2. Coordinated Hybrid Energy Storage Control Strategy
The work in [64] focuses on coordinated operation of Hybrid Energy Storage System (HESS) that can improve the utilization rate of PV for increased penetration. A particle swarm optimization (PSO) algorithm has been implemented. The coordinated control strategy involves sliding average control time windows for optimizing particles. PSO has many advantages over other conventional optimization techniques as it is more reliable and can enhance the stability of the system, it has quick tracking record of maximum power point in PV [65]. It is enhanced to multi objective PSO for efficient energy management in smart grids as in [66]. The PSO technique is applied to multivariable functions that have many local points inspired by observations on natural social behavior of bird flocking and fish schooling [67]. Sticking to its flocking analogy, PSO models several birds, also called particles, that form a flock (swarm). Each particle has its own fitness function with a velocity to determine its distance direction for information exchange by search processes. Authors reviewed the strategy for different time resolutions such as 1 min and 1 h. HESS utilizes supercapacitor for quick response and high-power density also used to smoothen the short term fluctuation in PV [68]. In addition to that it used lithium ion battery (LiB) for higher energy density [69].
The sliding average method is a mathematical model for selecting a fixed length window that takes all the particle values in a window as mean and average as the center of the window. If the time window equals to three then the reference center is Equation (7).
The average means are similar as the weights of points are same. It eases the calculation, but the time consumption is more for long windows. In order to accommodate it, the calculation of the next window is taken from new measured value leaving the previous one for smoothening the PV fluctuations. Hence, the improved sliding average becomes as Equation (8).
where N is time window length which represents the size of window, if the time window is long, the PV generating power is free from fluctuations and the size of SC is large, in contrary if the time window is small leads to PV power cannot maintain the grid standards.
The solution for the optimization problem through PSO is as follows.
- Step 1:
- Define the PV predicted power and load demand with electricity price at time of use.
- Step 2:
- Initialize Variable count in the objective function, i.e., dimension D, iteration count M and calculation precision N.
- Step 3:
- Initialize the particle velocity and position and calculate the particle fitness based on fitness function.
- Step 4:
- Assess fitness value of each particle with its extremes and update the current individuals if appropriate. Compare them with global value and update the current global extreme if needed.
- Step 5:
- Update the location and velocity of each particle and update the extremes under constraints.
- Step 6:
- Repeat step 4 and 5 until they are under constraint conditions.
- Step 7:
- Determine whether the iteration count and error value meet the requirement, if not repeat step 7. Otherwise, the calculation is terminated, and result is obtained.
The algorithm is evaluated using simulation studies with different time scale windows. The results show that the developed strategy achieves 15 min of charge–discharge for LiB making use of the smoothing in different price periods. This improves the grid stability and increases the amount of PV capacity that can be accommodated.
2.2.3. Hierarchical Controls Selection Approach
The work in [70] discussed a coordinated hierarchal control of penetration of PV modules with mitigation of voltage peaks using STATCOM and BESS. Smart control systems such as PV with Voltage Source Inverter (VSI) that can also perform reactive power compensation have been utilized. The objective is to define the distribution network works as a voltage regulator, which on failure due to high voltages is controlled from STATCOM or BES devices. Ultimately, using smart VSI for regulating local parameters.
Different modes of operations are performed for the evaluation of the coordinated scheme before that modeling of the DERs and the LV network with STATCOM and BES as defined. The voltage rise is considered to occur as a result of the high PV generation with a low demand case, which resembles typical residential area characteristics during the daytime. Therefore, the first priority for the control selection is given to the condition of total PV generation (RPpv) and the total load demand (RPdemand) monitoring. The developed selection algorithm in [70] is shown in Figure 4.
The voltage rises issues at the farthest point (consumer levels) of distribution transformer are mitigated using this approach when PV penetration levels are increased. Economics are also justified for the coordinated approach are presented by authors that instead of installing dynamic compensators all along the testing locations only specific critical points are to be considered which enables the lower use of equipment and maintenance costs.
2.2.4. Enhanced Reactive Power Management for PV–Grid Interaction
PV modules not only act as source of real power generation to balance the demand, but also provide the ancillary services like reactive power injection [71]. Authors in [72] propose a new system configuration as shown in Figure 5. For increased PV generation during high solar radiation periods, the switching operation of the Reactive Power Banks (RPB) is combined with the control strategy of the PV inverter to generate controlled reactive power over the generation period. Auxiliary converter is connected to overcome the transient issues that may arise due to incompatibility or maloperation of line and bank terminal voltages due to switching or faults [73]. The scheme has the following advantages:
- 1)
- The strategy incorporates Static Synchronous Compensator (STATCOM) functionality through the PV inverter itself, it works in a dedicated fashion to provide ancillary service viz. reactive power compensation without increasing the power capacity.
- 2)
- Reactive power reserve can be enhanced up to 300% for the PV Inverter.
- 3)
- This enables complete controllable range of reactive power compensation despite using discrete banks for dedicated voltage regulation.
- 4)
- Dynamic behavior of the system is improved due to better controllability of reactive power ancillary service
- 5)
- Power system can be relieved with compensating reactive power support and its capability can be used for mitigating voltage drops and over voltages. This approach can be utilized for increasing PV penetration in both distribution and transmission systems.
The modelling and design of the controllers VSC1 and VSC2, as shown in Figure 5, is based on synchronous rotating frame of reference. Current control is achieved with indirect current control scheme, i.e., by controlling the terminal voltages of the two inverters and grid tied VSCs. The DC link voltage Vdc is regulated by outer voltage regulation loop which is, in turn, maintained by voltage of reactive power bank that is equal to grid voltage.
Performance evaluation of the scheme is performed with MATLAB-Simulink models by the authors. The performance of the VSC2-RBP configuration is studied from the inner current control and outer voltage control of VSC2. The d-q components of the output voltages prove that the inner current control loops are working without any deviation. The DC link of the VSC2 is stabilized through the reference value set by DC link of the VSC1. To synchronize the reactive bank voltages with the grid parameters the d-q components of the grid frequency are assigned as the reference to the VSC2 voltage control loop.
VSC2 gets activated when the Cp and Lp banks are supplying only the loss component which is the difference between the reactive values of Cp and Lp. This operation is explained from the state diagram by the authors in [72], enhancing the reactive power support by switching on/off at the required phases as per the state diagram.
2.2.5. Sensorless Power Reserve Control Strategy
Advanced active power control strategies are introduced to grid codes for increasing PV penetration levels [74,75]. In [76], a cost-effective solution is introduced to realize power reserve for two-stage grid-connected PV systems in addition to MPPT control for the estimation of available maximum power and constant power generation (CPG) control [77] to achieve the power reserve. A sensor-less module is developed, backdropping the solar irradiance and temperature measurements that are used in regular conventional methods.
The strategy is composed of two operational modes: MPPT and CPG, performing different –control objectives. MPPT’s purpose is to estimate the available PV power for penetration when the PV arrays operate at the maximum power point, the available power Pave of the PV arrays is estimated from the measured PV output power Ppv. With MPPT operation, the available power can continuously be recorded during operation similar to “Sample and Hold (S&H)” process in digital control. With a similar operation, the error between them can be easily estimated and reduced for the frequent change of sampling frequencies. The other mode CPG control is intended for the regulation of the PV output power to follow the reserve demand of power generated. Thanks to combined operation of these methods, the corresponding extracted PV power from the proposed strategy can be summarized as Equation (9). The excess energy stored at the grid side, DC link, is controlled for reducing the fluctuations during the estimation process.
2.3. PV Inverter and Smart Inverter Strategies
Smart Inverters (SI) can operate in all four quadrants of P-Q plane. Hence, capable of providing frequency and voltage support which conventional inverters cannot due to its constraints. With this capabilities SI can play an important role in increasing PV penetration in grids. Furthermore, the revised version of IEEE 1547a (2014) standard allows SI deployment for voltage regulation. In literature several works have been reported on using SI along with PV to mitigate the effect of PV intermittency and pave way for high PV penetration [78,79,80]. Further, the practical experiences of deploying SI-PV smart grid system and performance of PV topologies from different parts of the world such as in Japan [81,82], Taiwan [83], Costa Rica [84], Hawaii [85], California [86], have been reported. Further, studies on dynamic behavior of SI under different scenarios of PV penetration is reported in [87,88].
2.3.1. Microinverter Curtailment Strategy
Evolution of microinverters has gradually taken over the string inverters in residential as well as commercial applications due to its resiliency and increased energy harvesting. The work in [89] has presented a microinverter paralleled topology for curtailment applications in order to increase PV penetration without changing the grid infrastructure.
A microinverter is technically represented as a single source of generation unit apart from its PV module contributing the control and dispatch section of generated power source. This allows the part of PV array remains connected while the other regulates the voltage. This method can be called as a sequential, module level tripping. Generator tripping has been widely employed on the transmission as well as distribution levels which is recognized as most effective way of resolving transient stability and overloading issues [90]. In order to restrict unwanted fault currents and ensure reliable operation of circuit breaker sequential breaker tripping strategies are used in transmission/ distribution networks [91]. In most PV inverters, the trip function already exists as anti-islanding/overvoltage protection. Normally, a generator trip means an instant 100% loss of its generation, but module level tripping is a partial reduction in capacity which creates the opportunity for the implementation of curtailment applications. The operation of strategy involves decision and execution levels where decision to initiate the trip. While execution creates the sample and hold strategy for turning on/off the inverter. For gradual or partial cut off, the sequential mode of tripping was applied to each microinverter with a trip time delay. The tripping can be carried out by inverter restart with which increased energy output is obtained.
2.3.2. Enhancement of Solar Farm Connectivity with Smart PV Inverter PV-STATCOM
A smart PV inverter control which resembles a STATCOM is presented by authors in [92]. Instead of installing a physical STATCOM [93]. A PV inverter control is designed such that it can operate for controlling steady state voltages and temporary over/peak voltages (TOVs) resulting from network faults. Thus, reducing the costs by a huge margin, up to 50 times. This smart PV inverter operation ensures mitigation of problems raised due to high penetration ultimately increasing the hosting levels PV as well as feeders more than the limits of magnitude in same network conditions. Authors developed the test system in PSCAD for simulations which is replicated from a solar project of 10 MW in utility distribution network in Ontario, Canada. A STATCOM is installed to mitigate the over voltages caused due to reverse power flow at point of common coupling (PCC) [94]. However, authors have designed the smart PV inverter, i.e., PV-STATCOM controller which enables the similar functionalities that of the installed STATCOM. In addition, this novel methodology can support grid functionalities and enabling new revenue opportunities and enhanced solar farms connectivity [82,95].
The smart PV inverter controller design, given in [92], consists of d-q frame with abc transformation blocks, PLL units extracting phases from PCC voltages, current controllers regulating the ac current component to a reference value, AC voltage controllers, DC controllers which regulates the DC link voltages to a reference value frame, temporary overvoltage (TOV) detectors and PWM units. While operating during daytime, the smart PV operates in only full PV mode generating PV power, partial STATCOM mode is activated when steady state over voltage control is required. When an unsymmetrical fault is encountered which causes TOVs, full STATCOM mode is enabled to mitigate it. In mode 1 and 2, MPPT based on increment- conductance scheme is employed to maximize generation [96]. While in full STATCOM mode the total real power generation is made zero by making the PV voltage to its open circuit voltage. The whole inverter is used to absorb reactive power to balance the phase voltages. When voltages are balanced, PV generation is enabled and control mode is changed to partial STATCOM mode. The control algorithm for selection of control modes is as shown in the Figure 6.
Through this control methodology authors has demonstrated that in partial STATCOM mode the steady state over voltages are regulated to their reference values within one and half cycle. In full STATCOM mode the TOVs that occurred during action of single line to ground fault and line to line faults are mitigated within one cycle duration. This functionalities of PV-STATCOM ensure continuous operation of a fully functional STATCOM. Hence, this type of control can bring significant savings in utilities and can rise the hosting capacities of PV farms in the smart grids.
3. Strategies for Integration of PVs along with EVs in Smart Grid
In smart grid environment, EVs opens a new revenue generation opportunity by vehicle to grid (V2G) energy support as well as grid stabilization, which optimizes grid operation costs in demand constrained urban and sub urban areas that are affected with high electricity prices in peak demand periods. PV and V2G integration strategies for peak demand reduction were described by Drude et al., in [97]. The simulation study involved influence of V2G for the energy demand profiles and also delivered the possibility to calculate costs related to battery degradation in the function of depth of discharge (DOD) and energy costs. They have used real electricity demand data that was measured in urban residential area of city in Brazil. Authors had introduced the strategy for maximizing the profit in the light of the then new traffic regulations released by Brazilian electricity regulatory agency (ANEEL). For reducing the peak demand, a three-level tariff was established for residential users, i.e., peak interval price is 5× higher than off peak, 3x more than off peak for 1 h before and after the peak intervals. With integration of PV with EV in off peak load hours, i.e., when vehicles are parked in the offices and utilizing the energy generated by PV installed in the office roof tops. While during the peak demand evening hours EVs supports the grid, which results in high revenues for the EV owners. This time of use tariffs contribute to grid stabilization in conjunction with EV that gets recharged in early hours with by PV and by assisting V2G in peak hours. Furthermore, this ensures that PV systems mounted on residential roofs not only can make a strategic contribution to alleviating urban distribution networks, when there is a strong correlation between loads and the accessibility of solar PV by shifting peak demand, but they can also supply all the energy demands of a number of EVs that are significantly greater than the amount of residential homes.
For stabilizing the grid, a static power upper limit is defined, where the EVs dispatch power to the grid and at the same time avoiding power demands in excess of the upper limit. It is the case where EV owner is providing a service to the utility and the costs are estimated in the function of the DOD. However, as per the study the annual revenues are generated for 40% DOD are higher and these are limited to 75%, because of maximum power limit adopted by the grid connection. But the costs for additional hardware for V2G, price for energy recharging via G2V and battery degradation rises as the power limit is reached, this anticipates lower revenues which was explored by the authors that shows the drawback in the electricity pricing model.
E. Taibi et al. in [98] defined certain functions and strategies leveraging flexibility from the EVs with integration of renewable sources: the Barbados case study. The first approach considered EVs as a static demand, where EV gets charged from grid under three scenarios i) uncontrolled charging (any time), ii) night charging, iii) day light charging (at parking lots using PV). In the second approach, EVs are considered for V2G service, a fleet of EVs were treated as single participant resembling a battery energy storage system (BESS) providing ancillary services. EV gets recharged when connected to the grid until its SOC is reached 70% or more, to ensure that it can be discharged after disconnection. Battery degradation depends on discharge rate, DOD and operation temperature. It involves charging and discharging comprising a cycle. Equation (10) gives the degradation cost of battery at time step t.
where replacement cost is the new cost of battery that needs to be installed, capacity is maximum energy storage in MWh, is state of charge from one period to next period and N is cycle life of a battery. Based on the defined strategies authors in [98] observed the integration of EV with the RES sources connected utility system impacts on production costs, PV power curtailment under high penetrations, marginal costs and reduction in grid connected storage investments. Especially, for the scenario of EV charging using PV with V2G support during day time provides outmost performance with reduced costs and high revenue generation for EV owners. The results of case study defined that EVs can decrease the grid storage needs by 13% and the production costs for EV sharing are decreased while charging and discharging when marginal costs are lower and higher respectively.
3.1. Scenario-based Modelling of the Potential for Solar Energy Charging of EVs
The authors in [99] introduced a stochastic modelling for combined operation of EV and PV impacting the energy consumption on city scale. The methodology was evaluated by case study of two Scandinavian cities. The operational flowchart of the methodology is as shown in the Figure 7. Solar yield is assessed by IEA PVPS task7 method, the total roof top area and total facades areas of buildings exposed to solar energy are estimated and location is determined. EVs mobility and their selection is modelled using Markov chain model [35]. It is a memoryless stochastic process where the specific current state depends on the previous state. The state of charge of the EV is estimated as in Equation (11)
where is the state of charge in KWh of EV, Pc is the charging power, d is the driving distance (km) travelled in time step and is th consumtion rate (KWh/km). The PV integration and EV penetration are studied in corresponding 10–100% range. The self-efficiency and self-consumption rate were determined for evaluation and compared for all different working patterns, the experimental values drawn for two weeks in winter and summer for two regions found that aggregated EV load can be covered by total solar generation except the case of winter, moreover it was found that for PV integration more than 50%, it can accommodate the charging of EV. However, the load match between the PV and EV charging differs, but it can has observed the EV charging reduces the peaks of PV yield.
Impact of parallel operation of EV and PV on future generation portfolio was described by the authors in [100]. Two scenarios are considered for the study first one is by uncontrolled charging which start when EV reaches the charging station while second is controlled charging where power used to recharge EV is aligned with PV output. The future investments were assessed for both EV and PV operations. The costs related to uncertainty, overall operational costs and CO2 emissions were also presented. The methodology implies a Monte Carlo generation portfolio modeling and EV modelling. Hourly PV generation over the annum and hourly charging profiles of EV are fed as input to MC modeling tool. It can incorporate key uncertainties that impacts adversely of overall generation costs. Furthermore, it provides results comprising of overall probability distribution of generation costs per year and CO2 emissions for each generation portfolio. While for EV modelling, simulated charging patterns were obtained from case study of Australian state of New South Wales- household transport survey. Two cases, evaluation as residential and universal charging were considered to study the potential for EV charging demand under different infrastructures. Residential charging involves charging at parking lots in any residential zone, while universal relates to charging EV at any location like shopping, work and commercial infrastructures. For evaluation certain test cases like residential unmanaged charging, universal unmanaged charging and universal managed charging were simulated for PV and EV levels ranging from 0% to 20% and 20% to 50%, respectively. The simulation results defined the effectiveness of the PV synergies with EV, although EV charging increases the overall costs while emissions can be reduced using PV generation.
3.2. Multi-Objective Optimization Technique for Grid Tied PV Powered EV Charging Station
Hassan et al. in [101] has analyzed the optimization strategy for the grid tied PV- EV station. The methodology involves maximizing the revenues by coordinated operation of PV and EVs while minimizing the BESS capability, and it is achieved under the constraints of power fluctuations at point of common coupling (PCC) defined by the hosting utility grid. The station discharge operator (SDO) is the main player that ensures the operation of the scheme. The scheduling of the PV, EV and BESS patterns are formulated for multi objective optimization (MOO) problem and solved using Augmented ε-constrained 2 algorithm which is a popular due to its capability to generate exact solutions for MOO problems, the operation involves the MOO problem is converted to objective function and solved based on other objective constraints, moreover this method is repeated to all the objectives until whole problem is solved. Different cases were analyzed to evaluate the study, monte carol simulation (MCS) was used for realistic scenario. Authors found that, in the case of solving single objective optimal operation of whole strategy fails, while considering the MOO problem the strategy gives effective operation of generating more revenues worth decreasing BESS life capacity under power fluctuation constraints at PCC.
A similar MOO problem was discussed in [102], with a standalone PV hydrogen retired EV battery (REVB) hybrid energy system. In [102], authors modelled a REVB model with capacity fade (loss) for the simulation study a tri objective optimization problem was formulated based on reliability, cost and energy waste as objective functions and simulated for five-year operating period. Non-dominated sorting genetic algorithm (NEGA-II) was applied to generate solutions. The optimization strategy involved modelling of REVB, PV arrays and the inverters. The power management strategy ensures the power distribution among the power sources, storage devices and loads in their optimal ranges. The optimization scheme uses decision variables and objective functions and constraints of all the devices. The NEGA-II algorithm is a multi-objective kind of evolutionary algorithm based on pareto-optimal solutions. It uses fast sorting technique and an elitist optimization process providing very efficient procedure for sorting and preserving the diversity of the objective functions. The basic steps involve the following:
- Step 1:
- Population based on predefined decision variables and number of populations is initialized.
- Step 2:
- Initialized data is sorted based on non-denomination.
- Step 3:
- Crowd data is calculated.
- Step 4:
- An offspring population is created using binary tournament (BT) selection, recombination, mutation operators.
- Step 5:
- From the first generation, following steps are performed for each new generation.
- Mating pool was created by combining parent population and offspring population.
- Combined population is sorted based on non-domination.
- New parent is generated.
- BT selection, recombination and mutation were performed on new parent population.
- Step 6:
- Step 5 is repeated till maximum iterations are met.
- Step 7:
- A pareto set is generated.
In [102], authors compared the results of the case with NEGA II algorithm with multi objective evolutionary algorithm (MOEA) based decomposition to solve a set of objectives through multi interictal single objective problems and found that solution sets using MOED converged and former gives solutions scattered with each other and with relatively larger gaps between each solution, which signs uniformity. Moreover, NSGA II performs better study regarding distribution of solutions and finding better results than the MOED algorithm.
3.3. A Novel Probabilistic Model for Coordinated EV Charging for Corelated EV and Grid Loads and PV Output:
Conventional approaches for coordinated EV charging did not consider mutual correlation which affects the system adversely increasing probability of voltage and current compliance (PVCN) and reduces the quality of service, overcoming this, authors in [103] stated a novel correlated approach for coordinated operation of time varying EV, PV and grid load models with reactive powers involved using correlated samples generation. The methodology involves two step probabilistic correlation model to generate correlated samples from previous uncorrelated samples of random variables that are involved in estimating EV loads, PV outputs and BES powers as shown in the Figure 8. The first step comprises of estimating means, standard deviations and correlation matrix for the identified variables, while the second step involves generation of correlated samples. The PVCN obtained from the new correlated values on comparison gives reduction in PVCN which indicates the effectiveness and efficacy of the coordinated strategy. Moreover, the voltage unbalance is also reduced by optimizing EV charging rates in regards to node voltages and feeder currents. In [103], based on the simulation results authors concluded that correlated based charging can improve the quality of service compared to existing methodology and further it can increase the energy harvest from PV panels while reducing the PVCN compared to deterministic charging.
Traube et al. focused on mitigating intermittent solar irradiance at short time scales by integrating energy storage using EV in PV systems [104]. The energy storage function is provided by plug-in hybrid EV (PHEV or EV) batteries via bidirectional dc-dc charge converters integrated into a conventional PV system that includes a high-voltage dc bus between the subcombiner and the inverter. A prototype model was demonstrated to evaluate the control and dc charger implementation techniques to obtain the objective. The operation involves, by exporting energy to the grid, the inverter regulates the dc bus voltage and controls the charger to sink or supply power to or from the battery of the vehicle. The charger draws off some of the PV current to charge the vehicle battery during high irradiance periods, thus placing no extra charge on the grid infrastructure. If a cloud moves over the array, the inverter controls the charger to reduce the current or even the source current from the battery to restrict the variation of the inverter power output. After the intermittent state, the charger ensures the EV battery to be charged at the same amount of time as that in a grid-connected charger case. In addition to that, the impact of transients/intermittency can be reduced by keeping the EV battery state of charge SOC to the minimum level.
The EV/PV charger concept is validated experimentally by authors using a prototype 10-kW 575-to-250-V bidirectional dc–dc charger was built in combination with a 10-kWh LiFePO4 EV battery installed in a Toyota Prius and a 100-kW Satcon Solstice inverter. The dc–dc charger based on a quasi-square-wave synchronous buck converter operates at 30 kHz. Laboratory experiments resulted that the dc–dc bidirectional charger with PI compensated average current control is capable of applying high-efficiency (up to 98 percent) filtering technique across a wide range of operating points. This ensures the charging of EV with clean and renewable energy source from vehicles perspective while in grid operator perspective, it provides reduced variable PV output leading to higher grid stability in case of high penetration through renewables.
3.4. EV Charge-Discharge Management for Maximum PV Generation
As there is no high demand at peak generation period of PV power, grid cannot absorb, and generation gets limited by curtailment resulting in failure of usage of 100% PV. Authors in [105] used an effective way of capturing the curtailed energy and using it by transferring to peak load hours by EVs. The main advantage of EVs are the electric motors, that work more efficient than the combustion engines reducing the carbon emissions and can reach high torques in less periods [106]. In addition to that EV batteries, which are movable and can be operated at different locations and different times. The large storage capacity improves its reliability of operation. Making use of this criteria, solutions are developed that coordinate the charge-discharge operation of PV with generated power of local PV systems. This enables the more capture of PV power instead of curtailment and EVs can charge for less tariff alternatively generate more income through grid support via vehicle to grid (V2G). this method indirectly increases the PV penetration into the system. the communication architecture model has presented using IEC 61850 has presented for charge discharge management of EV. IEC 61850 is a communication standard for the new power systems by which interoperability and communication through exchange of messages from logical nodes (LNs) and logical devices (LDs) can be achieved [107].
The framework for EV charge-discharge management has two components: house energy management system (HEMS) which controls EV and PV in the house, the other one is grid energy management system (GEMS) having its own controller and coordinates with the grid devices like OLTCs and control/protection components [108]. EMS controllers on controlled coordination exchanges information between HEMS and GEMS and change parameters which ever necessary. At first HEMS aims to use its generated power for household demand and then extra power is used to meet charge requirement of EVs or support the grid by selling it based on the price of energy to generate revenue. GEMS ensure grid to operate in safe and secure operation without and instability issues. for the incoming PV power grid lowers is operational costs which are higher due to conventional power plants. By the said operations, the aggregation of HEMS and GEMS can obtain larger benefits with coordinated operation and reduce the PV curtailment.
The coordination framework developed in [105] is as shown in Figure 9. The interactions between the components achieve the controlled operation. This approach initially starts based on forecasting the PV power by local irradiance measurements and the demand of household from past utilized data. Based on that information exchange takes place between HEMS and GEMS. Grid controller identifies the location of over voltages due to power penetration of HEMS controller and send information to curtail power. Upon receiving information HEMS plans for charge discharge of EVs to avoid power curtailment and reduce the operational costs. This control can be possible with continuous information exchange between the components such as PV inverter, Smart meter and EV battery of HEMS. Table 1 presents the comparative summary of the different PV integration strategies in conjunction with EVs.
4. Discussions and Future Research Directions
In the literature many strategies concerning to high penetration of PV power into the smart grids have been investigated. Table 2 gives the summary of different strategies studied. However, still there are certain knowledge gaps that need to be addressed.
In [109], a semi Markov model for control of energy storage is proposed in the case of high penetration of PV power in utility grid as well as microgrids. This model exhibits wide range of applications like utilization of PV in small and large timescales, short term forecasting of PV power and stochastic scheduling in coordination with ESDs and other resources including ultra-capacitors. The effective use of ESDs can be obtained by predicting cloud intermittency variation at rooftops also using pyranometer [110]. A probability mass function (PMF) and cumulative distribution function (CDF) of PV generated energy are introduced. This yielded results that can solve the forecasting issues during absence of solar radiation, also predicting day ahead forecast of PV Power. However, the proposed method is applied in a standalone PV model with a network. This methodology can be further extended in future for multiple dispersed PVs, various whether conditions and seasons as well as for larger networks with PV installations in larger areas.
In [111], a coordinating strategy for virtual energy storage systems (VESS) is proposed for buildings with air conditioners in a LV network for voltage regulation. In this method, to mitigate the voltage issues with high PV penetration, authors utilized the thermostatic controlled loads (TCLs) with demand response programs (DRs) [112]. As air conditioners belong to the category of TCLs, they received much attention thanks to their fast responses with minimum end user disturbances [113,114]. They are also energy hungry appliances in summer as per the Ausgrid investigation [115]. The thermal capacity of an air conditioner in household is seen a VESS. This dispatch strategy involves lower level local and upper level control where multiple VESS are aggregated to participate in demand response programs. While upper level control includes consensus-based aggregators control. Through this control active power consumption and curtailment is equally shared between the aggregators and maximize their revenues by participating in DRs. It also includes plug and play option which increases the reliability of the functionality. Authors performed the methodology on a small-scale network of residential complexes, while implementation in complex and large-scale networks is still a concern that need to be focused.
5. Conclusion
Environmental concerns and energy independence considerations led nations around to world to turn to clean energy resources such as solar and wind. However, these generation technologies have very unique topologies and alter the grid operation substantially. Low inertia, unknown fault behaviors and intermittent power output can be named as some examples. Nevertheless, the benefits of these clean energy resources are plenty and researchers have focused on developing strategies to mitigate their negative impacts on the power grid. This paper gives a thorough overview of such strategies that span a wide area of research, from power electronics applications to coordination schemes as well as novel use of certain power system equipment. Also, further research directions are provided as a pointer for future work. Researchers, policy-makers and practitioners active in the PV systems would find this information beneficial.
Author Contributions
Conceptualization, S.M.S.H. and T.S.U.; methodology, S.A.A., S.M.S.H. and T.S.U.; formal analysis, S.A.A., S.M.S.H.; investigation, S.A.A., S.M.S.H.; writing—original draft preparation, S.A.A.; writing—review and editing, S.M.S.H. and T.S.U.; funding acquisition, T.S.U. All authors have read and agreed to the published version of the manuscript.
Funding
This research received no external funding.
Conflicts of Interest
The authors declare no conflict of interest.
References
- Ackermann, T.; Andersson, G.; Söder, L. Distributed generation: A definition. Electr. Power Syst. Res. 2001, 57, 195–204. [Google Scholar] [CrossRef]
- SolarPower Europe. Global Market Outlook—for Solar power 2018–2022; SolarPower Europe: Brussels, Belgium, February 2018; pp. 1–81. Available online: https://www.solarpowereurope.org/wp-content/uploads/2018/09/Global-Market-Outlook-2018-2022.pdf (accessed on 2 February 2020).
- REN21. Renewables 2019 Global Status Report 2019; Paris, France. Available online: https://www.ren21.net/gsr-2019/ (accessed on 2 February 2020).
- Karekezi, S.; Kithyoma, W. Renewable energy strategies for rural Africa: Is a PV-led renewable energy strategy the right approach for providing modern energy to the rural poor of sub-Saharan Africa? Energy Policy 2002, 30, 1071–1086. [Google Scholar] [CrossRef]
- Almeshqab, F.; Ustun, T.S. Lessons learned from rural electrification initiatives in developing countries: Insights for technical, social, financial and public policy aspects. Renew. Sustain. Energy Rev. 2019, 102, 35–53. [Google Scholar] [CrossRef]
- International Energy Agency. World Energy Outlook 2018; International Energy Agency: Paris, France, 2018. [Google Scholar]
- The Ministry of Economy Trade and Industry (METI). Long-term Energy Supply and Demand Outlook 2015; The Ministry of Economy Trade and Industry (METI): Tokyo, Japan, 2015. [Google Scholar]
- RES LEGAL 2019. “EEG Feed-in tariff in Germany,” European Commission. 2019. Available online: http://www.res-legal.eu/search-by-country/germany/single/s/res-e/t/promotion/aid/feed-in-tariff-eeg-feed-in-tariff/lastp/135/ (accessed on 30 July 2019).
- Ministry of Energy & Minerals. TANZANIA’S SE4ALL ACTION AGENDA; Ministry of Energy & Minerals: Dar es Salaam, Tanzania, 2015. Available online: https://www.seforall.org/sites/default/files/TANZANIA_AA-Final.pdf (accessed on 2 February 2020).
- Ministry of New and Renewable energy Government of India. National Solar Mission—Central Financial Assistance(CFA). Available online: https://mnre.gov.in/resolution (accessed on 30 July 2019).
- Renewable Energy Target—An Australian Government scheme. Available online: http://www.cleanenergyregulator.gov.au/RET/ (accessed on 30 July 2019).
- International Institute for Sustainable Development. India’s Energy Transition: Mapping Subsidies to Fossil Fuels and Clean Energy in India GSI Report; Manitoba, Canada, 2017. Available online: https://www.iisd.org/sites/default/files/publications/india-energy-transition.pdf (accessed on 2 February 2020).
- European Union, “EU Renewable Energy Target 2020”. Available online: https://ec.europa.eu/energy/en/topics/renewable-energy (accessed on 31 July 2019).
- California Independent System Operator. Fast Facts: CAISO Duck Curve; California Independent System Operator: Folsom, CA, USA, 2016; pp. 1–4. Available online: https://www.caiso.com/Documents/FlexibleResourcesHelpRenewables_FastFacts.pdf (accessed on 2 February 2020).
- Yuan, X.; Ji, B.; Yuan, Y.; Ikram, R.M.; Zhang, X.; Huang, Y. An efficient chaos embedded hybrid approach for hydro-thermal unit commitment problem. Energy Convers. Manag. 2015, 91, 225–237. [Google Scholar] [CrossRef]
- Hussain, S.M.S.; Nadeem, F.; Aftab, M.A.; Ali, I.; Ustun, T.S. The emerging energy internet: Architecture, benefits, challenges, and future prospects. Electronics 2019, 8, 1037. [Google Scholar] [CrossRef] [Green Version]
- Tonkoski, R.; Turcotte, D.; El-Fouly, T.H.M. Impact of high PV penetration on voltage profiles in residential neighborhoods. IEEE Trans. Sustain. Energy 2012, 3, 518–527. [Google Scholar] [CrossRef]
- Walling, R.A.; Saint, R.; Dugan, R.C.; Burke, J.; Kojovic, L.A. Summary of distributed resources impact on power delivery systems. IEEE Trans. Power Deliv. 2008, 23, 1636–1644. [Google Scholar] [CrossRef]
- Cole, W.; Frazier, A.W. Impacts of increasing penetration of renewable energy on the operation of the power sector. Electr. J. 2018, 31, 24–31. [Google Scholar] [CrossRef]
- Yan, R.; Saha, T.K. Voltage Variation Sensitivity Analysis for Unbalanced Distribution Networks Due to Photovoltaic Power Fluctuations. IEEE Trans. Power Syst. 2012, 27, 1078–1089. [Google Scholar] [CrossRef]
- Shayani, R.A.; De Oliveira, M.A.G. Photovoltaic Generation Penetration Limits in Radial Distribution Systems. IEEE Trans. Power Syst. 2010, 26, 1625–1631. [Google Scholar] [CrossRef]
- Baran, M.E.; Shen, Z.; Huang, A.Q.; Hooshyar, H. Accommodating high PV penetration on distribution feeders. IEEE Trans. Smart Grid 2012, 3, 1039–1046. [Google Scholar] [CrossRef]
- Katiraei, F.; Aguero, J. Solar PV integration challenges. IEEE Power Energy Mag. 2011, 9, 62–71. [Google Scholar] [CrossRef]
- De Brito, M.A.G.; Galotto, L.; Sampaio, L.P.; Melo, G.D.A.E.; Canesin, C.A. Evaluation of the main MPPT techniques for photovoltaic applications. IEEE Trans. Ind. Electron. 2012, 60, 1156–1167. [Google Scholar] [CrossRef]
- Xu, J.; Shen, A.; Yang, C.; Rao, W.; Yang, X. ANN Based on IncCond Algorithm for MPP Tracker. In Proceedings of the 2011 Sixth International Conference on Bio-Inspired Computing: Theories and Applications, Penang, Malaysia, 27–29 September 2011; pp. 129–134. [Google Scholar]
- Tarek, B.; Said, D.; Benbouzid, M.E.H.; Tarek, B. Maximum power point tracking control for photovoltaic system using adaptive neuro-fuzzy “ANFIS”. In Proceedings of the 2013 Eighth International Conference and Exhibition on Ecological Vehicles and Renewable Energies (EVER), Monte Carlo, Monaco, 27–30 March 2013; pp. 1–7. [Google Scholar]
- Arora, A.; Gaur, P. Comparison of ANN and ANFIS based MPPT Controller for grid connected PV systems. In Proceedings of the 2015 Annual IEEE India Conference (INDICON), New Delhi, India, 17–20 December 2015; pp. 1–6. [Google Scholar]
- Sun, W. Maximizing Renewable Hosting Capacity in Electricity Networks; The University of Edinburgh: Edinburgh, UK, 2015. [Google Scholar]
- Sakar, S.; Balci, M.E.; Aleem, S.H.A.; Zobaa, A.F. Increasing PV hosting capacity in distorted distribution systems using passive harmonic filtering. Electr. Power Syst. Res. 2017, 148, 74–86. [Google Scholar] [CrossRef] [Green Version]
- Al-Saadi, H.; Zivanovic, R.; Al-Sarawi, S.F. Probabilistic Hosting Capacity for Active Distribution Networks. IEEE Trans. Ind. Inform. 2017, 13, 2519–2532. [Google Scholar] [CrossRef]
- Khayyatzadeh, M.; Kazemzadeh, R. Sub-synchronous resonance damping using high penetration PV plant. Mech. Syst. Signal Process. 2017, 84, 431–444. [Google Scholar] [CrossRef]
- Divan, D.; Moghe, R.; Chun, H. Managing distribution feeder voltage issues caused by high PV penetration. In Proceedings of the 2016 IEEE 7th International Symposium on Power Electronics for Distributed Generation Systems (PEDG), Vancouver, BC, Canada, 27–30 June 2016; pp. 1–8. [Google Scholar]
- Wang, L.; Lin, Y.-H. Random fluctuations on dynamic stability of a grid-connected photovoltaic array. In Proceedings of the 2001 IEEE Power Engineering Society Winter Meeting. Conference Proceedings (Cat. No.01CH37194), Columbus, OH, USA, 28 January–1 February 2001; Volume 3, pp. 985–989. [Google Scholar]
- Shah, R.; Mithulananthan, N.; Sode-Yome, A.; Lee, K. Impact of large-scale PV penetration on power system oscillatory stability. In Proceedings of the 2010 IEEE Power and Energy Society General Meeting, Providence, RI, USA, 25–29 July 2010; pp. 1–7. [Google Scholar]
- Lee, D.-J.; Wang, L. Small-signal stability analysis of an autonomous hybrid renewable energy power generation/Energy storage system Part I: Time-domain simulations. IEEE Trans. Energy Convers. 2008, 23, 311–320. [Google Scholar] [CrossRef]
- Haque, M.M.; Wolfs, P. A review of high PV penetrations in LV distribution networks: Present status, impacts and mitigation measures. Renew. Sustain. Energy Rev. 2016, 62, 1195–1208. [Google Scholar] [CrossRef]
- Hoke, A.; Butler, R.; Hambrick, J.; Kroposki, B. Steady-State Analysis of Maximum Photovoltaic Penetration Levels on Typical Distribution Feeders. IEEE Trans. Sustain. Energy 2012, 4, 350–357. [Google Scholar] [CrossRef]
- Cheng, D.; Mather, B.A.; Seguin, R.; Hambrick, J.; Broadwater, R.P. Photovoltaic (PV) Impact Assessment for Very High Penetration Levels. IEEE J. Photovolt. 2015, 6, 295–300. [Google Scholar] [CrossRef]
- Yang, G.; Marra, F.; Juamperez, M.; Kjær, S.B.; Hashemi, S.; Østergaard, J.; Ipsen, H.H.; Frederiksen, K.H.B. Voltage rise mitigation for solar PV integration at LV grids. J. Mod. Power Syst. Clean Energy 2015, 3, 411–421. [Google Scholar] [CrossRef] [Green Version]
- Mukwekwe, L.; Venugopal, C.; Davidson, I.E. A review of the impacts and mitigation strategies of high PV penetration in low voltage networks. In Proceedings of the 2017 IEEE PES PowerAfrica, Accra, Ghana, 27–30 June 2017; pp. 274–279. [Google Scholar]
- Olowu, T.O.; Sundararajan, A.; Moghaddami, M.; Sarwat, A.I. Future Challenges and Mitigation Methods for High Photovoltaic Penetration: A Survey. Energies 2018, 11, 1782. [Google Scholar] [CrossRef] [Green Version]
- Capasso, C.; Rubino, G.; Rubino, L.; Veneri, O. Power architectures for the integration of photovoltaic generation systems in DC-microgrids. Energy Procedia 2019, 159, 34–41. [Google Scholar] [CrossRef]
- Elfeqy, H.; Shahin, M.; Al-Rumaihi, A.; Massoud, A.; Gastli, A. A highly efficient PV power system for DC MicroGrids. In Proceedings of the 2016 IEEE Symposium on Computer Applications & Industrial Electronics (ISCAIE), Penang, Malaysia, 29–31 May 2016; pp. 183–188. [Google Scholar]
- Rauf, S.; Wahab, A.; Rizwan, M.; Rasool, S.; Khan, N. Application of Dc-grid for Efficient use of solar PV System in Smart Grid. Procedia Comput. Sci. 2016, 83, 902–906. [Google Scholar] [CrossRef] [Green Version]
- Dos Santos, F.C.; Thornburg, J.; Ustun, T.S. Automated Planning of Rooftop PV Systems with Aerial Image Processing. In Proceedings of the 2018 IEEE PES Asia-Pacific Power and Energy Engineering Conference (APPEEC), Kota Kinabalu, Sabah, Malaysia, 7–10 October 2018; pp. 736–740. [Google Scholar]
- Elsinga, B.; Van Sark, W.G. Short-term peer-to-peer solar forecasting in a network of photovoltaic systems. Appl. Energy 2017, 206, 1464–1483. [Google Scholar] [CrossRef]
- Wan, C.; Zhao, J.; Song, Y.; Xu, Z.; Lin, J.; Hu, Z. Photovoltaic and solar power forecasting for smart grid energy management. CSEE J. Power Energy Syst. 2015, 1, 38–46. [Google Scholar] [CrossRef]
- Hubble, A.H.; Ustun, T.S. Composition, placement, and economics of rural microgrids for ensuring sustainable development. Sustain. Energy Grids Netw. 2018, 13, 1–18. [Google Scholar] [CrossRef]
- Hubble, A.H.; Ustun, T.S. Scaling renewable energy based microgrids in underserved communities: Latin America, South Asia, and Sub-Saharan Africa. In Proceedings of the 2016 IEEE PES PowerAfrica, Livingstone, Zambia, 28 June–3 July 2016; pp. 134–138. [Google Scholar]
- Bódis, K.; Kougias, I.; Jäger-Waldau, A.; Taylor, N.; Szabó, S. A high-resolution geospatial assessment of the rooftop solar photovoltaic potential in the European Union. Renew. Sustain. Energy Rev. 2019, 114, 109309. [Google Scholar] [CrossRef]
- Akagi, S.; Takahashi, R.; Kaneko, A.; Ito, M.; Yoshinaga, J.; Hayashi, Y.; Asano, H.; Konda, H. Upgrading voltage control method based on photovoltaic penetration rate. IEEE Trans. Smart Grid 2018, 9, 3994–4003. [Google Scholar] [CrossRef]
- Yoshizawa, S.; Yamamoto, Y.; Yoshinaga, J.; Hayashi, Y.; Sasaki, S.; Shigetou, T.; Nomura, H. Voltage control of multiple step voltage regulators by renewing control parameters. In Proceedings of the 2014 Power Systems Computation Conference (PSCC), Wroclaw, Poland, 18–22 August 2014; pp. 1–7. [Google Scholar]
- Minister of Economy Trade and Industry Japan. New Energy and Industrial Technology Development Organisation (NEDO). Available online: https://www.nedo.go.jp/english/introducing_tdf1.html (accessed on 15 September 2019).
- Unigwe, O.; Okekunle, D.; Kiprakis, A. Economical distributed voltage control in low-voltage grids with high penetration of photovoltaic. CIRED Open Access Proc. J. 2017, 2017, 1722–1725. [Google Scholar] [CrossRef] [Green Version]
- Yang, Y.; Li, H.; Aichhorn, A.; Zheng, J.; Greenleaf, M. Sizing strategy of distributed battery storage system with high penetration of photovoltaic for voltage regulation and peak load shaving. IEEE Trans. Smart Grid 2013, 5, 982–991. [Google Scholar] [CrossRef]
- Aryanezhad, M. Management and coordination of LTC, SVR, shunt capacitor and energy storage with high PV penetration in power distribution system for voltage regulation and power loss minimization. Int. J. Electr. Power Energy Syst. 2018, 100, 178–192. [Google Scholar] [CrossRef]
- Taylor, C. Power System Voltage Stability; McGraw-Hill Inc: New York, NY, USA, 1994. [Google Scholar]
- Homaee, O.; Zakariazadeh, A.; Jadid, S. Real-time voltage control algorithm with switched capacitors in smart distribution system in presence of renewable generations. Int. J. Electr. Power Energy Syst. 2014, 54, 187–197. [Google Scholar] [CrossRef]
- Carpinelli, G.; Celli, G.; Mocci, S.; Mottola, F.; Pilo, F.; Proto, D. Optimal integration of distributed energy storage devices in smart grids. IEEE Trans. Smart Grid 2013, 4, 985–995. [Google Scholar] [CrossRef]
- Zhao, H.; Wu, Q.; Hu, S.; Xu, H.; Rasmussen, C.N. Review of energy storage system for wind power integration support. Appl. Energy 2015, 137, 545–553. [Google Scholar] [CrossRef]
- Nadeem, F.; Hussain, S.M.S.; Tiwari, P.K.; Goswami, A.K.; Ustun, T.S. Comparative Review of Energy Storage Systems, Their Roles, and Impacts on Future Power Systems. IEEE Access 2019, 7, 4555–4585. [Google Scholar] [CrossRef]
- Haupt, R.L.; Haupt, S.E. Practical Genetic Algorithms, 2nd ed.; John Wiley & Sons, Inc.: Hoboken, NJ, USA, 2004. [Google Scholar]
- Bendato, I.; Bonfiglio, A.; Brignone, M.; Delfino, F.; Pampararo, F.; Procopio, R. A real-time energy management system for the integration of economical aspects and system operator requirements: Definition and validation. Renew. Energy 2017, 102, 406–416. [Google Scholar] [CrossRef]
- Zhang, D.; Guo, J.; Li, J. Coordinated control strategy of hybrid energy storage to improve accommodating ability of PV. J. Eng. 2017, 2017, 1555–1559. [Google Scholar] [CrossRef]
- Koad, R.B.A.; Zobaa, A.F.; El Shahat, A. A Novel MPPT Algorithm Based on Particle Swarm Optimization for Photovoltaic Systems. IEEE Trans. Sustain. Energy 2017, 8, 468–476. [Google Scholar] [CrossRef] [Green Version]
- Elgammal, A.; El-Naggar, M.; Elnaggar, M. Energy management in smart grids for the integration of hybrid wind–PV–FC–battery renewable energy resources using multi-objective particle swarm optimisation (MOPSO). J. Eng. 2018, 2018, 1806–1816. [Google Scholar] [CrossRef]
- Parsopoulos, K.E.; Vrahatis, M.N. Particle Swarm Optimization and Intelligence: Advances and Applications; Information Science Publishing (IGI Global): Hershey, PA, USA, 2010. [Google Scholar]
- Javed, K.; Ashfaq, H.; Singh, R.; Hussain, S.S.; Ustun, T.S. Design and Performance Analysis of a Stand-alone PV System with Hybrid Energy Storage for Rural India. Electronics 2019, 8, 952. [Google Scholar] [CrossRef] [Green Version]
- Keshan, H.; Thornburg, J.; Ustun, T. Comparison of lead-acid and lithium ion batteries for stationary storage in off-grid energy systems. In Proceedings of the 4th IET Clean Energy and Technology Conference (CEAT 2016), Kuala Lumpur, Malaysia, 14–15 November 2016; p. 30. [Google Scholar]
- Rafi, F.; Hossain, M.; Lu, J. Hierarchical controls selection based on PV penetrations for voltage rise mitigation in a LV distribution network. Int. J. Electr. Power Energy Syst. 2016, 81, 123–139. [Google Scholar] [CrossRef] [Green Version]
- Rueda-Medina, A.C.; Padilha-Feltrin, A. Distributed Generators as Providers of Reactive Power Support—A Market Approach. IEEE Trans. Power Syst. 2012, 28, 490–502. [Google Scholar] [CrossRef]
- Wandhare, R.G.; Agarwal, V. Reactive Power Capacity Enhancement of a PV-Grid System to Increase PV Penetration Level in Smart Grid Scenario. IEEE Trans. Smart Grid 2014, 5, 1845–1854. [Google Scholar] [CrossRef]
- IEEE. IEEE Guide for the Application of Shunt Power Capacitors; IEEE: New York, NY, USA, 2011; Available online: https://0-ieeexplore-ieee-org.brum.beds.ac.uk/document/5703189 (accessed on 2 February 2020).
- Bae, Y.; Vu, T.-K.; Kim, R.-Y. Implemental Control Strategy for Grid Stabilization of Grid-Connected PV System Based on German Grid Code in Symmetrical Low-to-Medium Voltage Network. IEEE Trans. Energy Convers. 2013, 28, 619–631. [Google Scholar] [CrossRef]
- Yang, Y.; Enjeti, P.; Blaabjerg, F.; Wang, H. Wide-Scale Adoption of Photovoltaic Energy: Grid Code Modifications Are Explored in the Distribution Grid. IEEE Ind. Appl. Mag. 2015, 21, 21–31. [Google Scholar] [CrossRef] [Green Version]
- Sangwongwanich, A.; Yang, Y.; Blaabjerg, F. A Sensorless Power Reserve Control Strategy for Two-Stage Grid-Connected PV Systems. IEEE Trans. Power Electron. 2017, 32, 8559–8569. [Google Scholar] [CrossRef] [Green Version]
- Sangwongwanich, A.; Yang, Y.; Blaabjerg, F. High-Performance Constant Power Generation in Grid-Connected PV Systems. IEEE Trans. Power Electron. 2015, 31, 1822–1825. [Google Scholar] [CrossRef]
- Wanzeler, T.M.; Vieira, J.P.A.; Radatz, P.; Souza, V.C.; Pinheiro, D.C. Assessing the performance of smart inverter volt-watt and volt-var functions in distribution systems with high PV penetration. In Proceedings of the 2018 Simposio Brasileiro de Sistemas Eletricos (SBSE), Niteroi, Brazil, 12–16 May 2018; pp. 1–6. [Google Scholar]
- Del Pizzo, A.; Di Noia, L.P.; Meo, S.; Andrea, D.P.; Pio, D.N.L.; Santolo, M. Super twisting sliding mode control of smart-inverters grid-connected for PV applications. In Proceedings of the 2017 IEEE 6th International Conference on Renewable Energy Research and Applications (ICRERA), San Diego, CA, USA, 5–8 November 2017; pp. 793–796. [Google Scholar]
- Hossan, S.; Westfallen, V.; Paaso, E.A.; Avendano, M.; Bahramirad, S. Usage of smart inverter Q-V droop functionality for irradiance variation induced voltage fluctuation reduction considering system uncertainty. In Proceedings of the 2018 IEEE Power & Energy Society Innovative Smart Grid Technologies Conference (ISGT), Washionton DC, DC, USA, 19–22 February 2018; pp. 1–5. [Google Scholar]
- Dao, V.T.; Ishii, H.; Hayashi, Y. Voltage and energy loss assessment for systems with smart inverter functions of rooftop solar. In Proceedings of the 2017 14th International Conference on Electrical Engineering/Electronics, Computer, Telecommunications and Information Technology (ECTI-CON), Phuket, Thailand, 27–30 June 2017; pp. 159–162. [Google Scholar]
- Ustun, T.S.; Aoto, Y. Impact of Power Conditioning Systems with Advanced Inverter Capabilities on the Distribution Network. In Proceedings of the 2018 53rd International Universities Power Engineering Conference (UPEC), Glasgow, UK, 4–7 September 2018; pp. 1–6. [Google Scholar]
- Liu, Y.-J.; Huang, C.-Y.; Chang, Y.-R.; Lee, Y.-D. Voltage impact mitigation by smart inverter control for PV integration at distribution networks. In Proceedings of the 2018 IEEE International Conference on Applied System Invention (ICASI), Chiba, Japan, 13–17 April 2018; pp. 192–195. [Google Scholar]
- Parajeles, M.; Quiros-Tortos, J.; Valverde, G. Assessing the performance of smart inverters in large-scale distribution networks with PV systems. In Proceedings of the 2017 IEEE PES Innovative Smart Grid Technologies Conference—Latin America (ISGT Latin America), Quito, Ecuador, 20–22 September 2017; pp. 1–6. [Google Scholar]
- Howlader, A.M.; Sadoyama, S.; Roose, L.R.; Sepasi, S. Experimental analysis of active power control of the PV system using smart PV inverter for the smart grid system. In Proceedings of the 2017 IEEE 12th International Conference on Power Electronics and Drive Systems (PEDS), Honolulu, HI, USA, 12–15 December 2017; pp. 497–501. [Google Scholar]
- Pecenak, Z.K.; Kleissl, J.; Disfani, V.R. Smart inverter impacts on California distribution feeders with increasing PV penetration: A case study. In Proceedings of the 2017 IEEE Power & Energy Society General Meeting, Chicago, IL, USA, 16–20 July 2017; pp. 1–5. [Google Scholar]
- Ustun, T.S.; Hashimoto, J.; Otani, K. Impact of Smart Inverters on Feeder Hosting Capacity of Distribution Networks. IEEE Access 2019, 7, 163526–163536. [Google Scholar] [CrossRef]
- Ustun, T.S.; Khan, M.T.; Hussain, S.S. Modeling Smart Inverters for Hardware-in-the-loop tests in Low-Voltage Distribution Systems. In Proceedings of the TENCON 2019—2019 IEEE Region 10 Conference (TENCON), Kochi, India, 17–20 October 2019; pp. 1672–1676. [Google Scholar]
- Gagrica, O.; Nguyen, P.H.; Kling, W.L.; Uhl, T. Microinverter Curtailment Strategy for Increasing Photovoltaic Penetration in Low-Voltage Networks. IEEE Trans. Sustain. Energy 2015, 6, 369–379. [Google Scholar] [CrossRef] [Green Version]
- Machowski, J.; Bialek, J.W.; Bumby, J.R. Power System Dynamics: Stability and Control, 2nd ed.; John Wiley & Sons, Ltd.: Hoboken, NJ, USA, 2012. [Google Scholar]
- Kovalsky, L.; Yuan, X.; Tekletsadik, K.; Keri, A.; Bock, J.; Breuer, F. Applications of Superconducting Fault Current Limiters in Electric Power Transmission Systems. IEEE Trans. Appl. Supercond. 2005, 15, 2130–2133. [Google Scholar] [CrossRef]
- Varma, R.K.; Siavashi, E.M. Enhancement of Solar Farm Connectivity With Smart PV Inverter PV-STATCOM. IEEE Trans. Sustain. Energy 2019, 10, 1161–1171. [Google Scholar] [CrossRef]
- Chen, C.S.; Lin, C.H.; Hsieh, W.L.; Hsu, C.T.; Ku, T.T. Enhancement of PV penetration with DSTATCOM in taipower distribution system. IEEE Trans. Power Syst. 2013, 28, 1560–1567. [Google Scholar] [CrossRef]
- Hydro One. Distributed Generation Technical Interconnection Requirements Interconnections at Voltages 50kV and Below. Guia 2013, 3, 183. [Google Scholar]
- Ustun, T.S.; Aoto, Y. Analysis of Smart Inverter’s Impact on the Distribution Network Operation. IEEE Access 2019, 7, 9790–9804. [Google Scholar] [CrossRef]
- Yazdani, A.; Ghoddami, H.; Kazerani, M.; Jatskevich, J.; Di Fazio, A.R.; Russo, M.; Strunz, K.; Leva, S.; Martinez, J.A. Modeling Guidelines and a Benchmark for Power System Simulation Studies of Three-Phase Single-Stage Photovoltaic Systems. IEEE Trans. Power Deliv. 2010, 26, 1247–1264. [Google Scholar] [CrossRef]
- Drude, L.; Junior, L.C.P.; Rüther, R. Photovoltaics (PV) and electric vehicle-to-grid (V2G) strategies for peak demand reduction in urban regions in Brazil in a smart grid environment. Renew. Energy 2014, 68, 443–451. [Google Scholar] [CrossRef]
- Taibi, E.; Del Valle, C.F.; Howells, M. Strategies for solar and wind integration by leveraging flexibility from electric vehicles: The Barbados case study. Energy 2018, 164, 65–78. [Google Scholar] [CrossRef]
- Good, C.; Shepero, M.; Munkhammar, J.; Boström, T. Scenario-based modelling of the potential for solar energy charging of electric vehicles in two Scandinavian cities. Energy 2019, 168, 111–125. [Google Scholar] [CrossRef]
- Vithayasrichareon, P.; Mills, G.; MacGill, I.F. Impact of Electric Vehicles and Solar PV on Future Generation Portfolio Investment. IEEE Trans. Sustain. Energy 2015, 6, 899–908. [Google Scholar] [CrossRef]
- Eldeeb, H.H.; Faddel, S.; Mohammed, O.A. Multi-Objective Optimization Technique for the Operation of Grid tied PV Powered EV Charging Station. Electr. Power Syst. Res. 2018, 164, 201–211. [Google Scholar] [CrossRef]
- Huang, Z.; Xie, Z.; Zhang, C.; Chan, S.H.; Milewski, J.; Xie, Y.; Yang, Y.; Hu, X. Modeling and multi-objective optimization of a stand-alone PV-hydrogen-retired EV battery hybrid energy system. Energy Convers. Manag. 2019, 181, 80–92. [Google Scholar] [CrossRef]
- Islam, S.; Mithulananthan, N.; Hung, D.Q. Coordinated EV charging for correlated EV and grid loads and PV output using a novel, correlated, probabilistic model. Int. J. Electr. Power Energy Syst. 2019, 104, 335–348. [Google Scholar] [CrossRef]
- Traube, J.; Lu, F.; Maksimovic, D.; Mossoba, J.; Kromer, M.; Faill, P.; Katz, S.; Borowy, B.; Nichols, S.; Casey, L. Mitigation of solar irradiance intermittency in photovoltaic power systems with integrated electric-vehicle charging functionality. IEEE Trans. Power Electron. 2013, 28, 3058–3067. [Google Scholar] [CrossRef]
- Ustun, T.S.; Hussain, S.M.S.; Kikusato, H. IEC 61850-Based Communication Modeling of EV Charge-Discharge Management for Maximum PV Generation. IEEE Access 2019, 7, 4219–4231. [Google Scholar] [CrossRef]
- Ustun, T.S.; Zayegh, A.; Ozansoy, C. Electric Vehicle Potential in Australia: Its Impact on Smartgrids. IEEE Ind. Electron. Mag. 2013, 7, 15–25. [Google Scholar] [CrossRef]
- Aftab, M.A.; Hussain, S.M.S.; Ali, I.; Ustun, T.S. IEC 61850 and XMPP Communication Based Energy Management in Microgrids Considering Electric Vehicles. IEEE Access 2018, 6, 35657–35668. [Google Scholar] [CrossRef]
- Kikusato, H.; Mori, K.; Yoshizawa, S.; Fujimoto, Y.; Asano, H.; Hayashi, Y.; Kawashima, A.; Inagaki, S.; Suzuki, T. Electric Vehicle Charge-Discharge Management for Utilization of Photovoltaic by Coordination between Home and Grid Energy Management Systems. IEEE Trans. Smart Grid 2019, 10, 3186–3197. [Google Scholar] [CrossRef]
- Barnes, A.K.; Balda, J.C.; Escobar-Mejia, A. A Semi-Markov Model for Control of Energy Storage in Utility Grids and Microgrids With PV Generation. IEEE Trans. Sustain. Energy 2015, 6, 546–556. [Google Scholar] [CrossRef]
- Barnes, A.K.; Balda, J.C.; Hayes, J.K. Modelling PV Clouding Effects Using a Semi-Markov Process with Application to Energy Storage. IFAC Proc. Vol. 2014, 47, 9444–9449. [Google Scholar] [CrossRef]
- Wang, D.; Meng, K.; Gao, X.; Qiu, J.; Lai, L.L.; Dong, Z.Y. Coordinated Dispatch of Virtual Energy Storage Systems in LV Grids for Voltage Regulation. IEEE Trans. Ind. Inform. 2018, 14, 2452–2462. [Google Scholar] [CrossRef]
- Deng, R.; Yang, Z.; Chow, M.-Y.; Chen, J. A Survey on Demand Response in Smart Grids: Mathematical Models and Approaches. IEEE Trans. Ind. Inform. 2015, 11, 1. [Google Scholar] [CrossRef]
- Perfumo, C.; Braslavsky, J.H.; Ward, J.K. Model-Based Estimation of Energy Savings in Load Control Events for Thermostatically Controlled Loads. IEEE Trans. Smart Grid 2014, 5, 1410–1420. [Google Scholar] [CrossRef] [Green Version]
- Ayyubi, S.R.; Ustun, T.S.; Miao, Y. Grid planning: Agent based approach for early notification of air conditioning loads to smart grid. In Proceedings of the 2015 IEEE 10th Conference on Industrial Electronics and Applications (ICIEA), Auckland, New Zealand, 15–17 June 2015; pp. 1772–1777. [Google Scholar]
- Smith, R.; Meng, K.; Dong, Z.; Simpson, R. Demand response: A strategy to address residential air-conditioning peak load in Australia. J. Mod. Power Syst. Clean Energy 2013, 1, 223–230. [Google Scholar] [CrossRef] [Green Version]
Figure 1.
Global stats of renewable generation [3].
Figure 1.
Global stats of renewable generation [3].

Figure 2.
Flowchart for Distribution Control Algorithm.

Figure 3.
Flowchart for optimal coordination methodology.

Figure 4.
Flowchart of Hierarchal control algorithm.

Figure 5.
Circuit setup of PV–Grid system with Auxiliary converter and RBP [72].
Figure 5.
Circuit setup of PV–Grid system with Auxiliary converter and RBP [72].

Figure 6.
Flowchart for Smart PV inverter operating mode.

Figure 7.
Flowchart for scenario based solar energy charging of EV.

Figure 8.
Flowchart for coordinated EV charging with PV and Grid loads.

Figure 9.
EV charge -Discharge coordination framework.


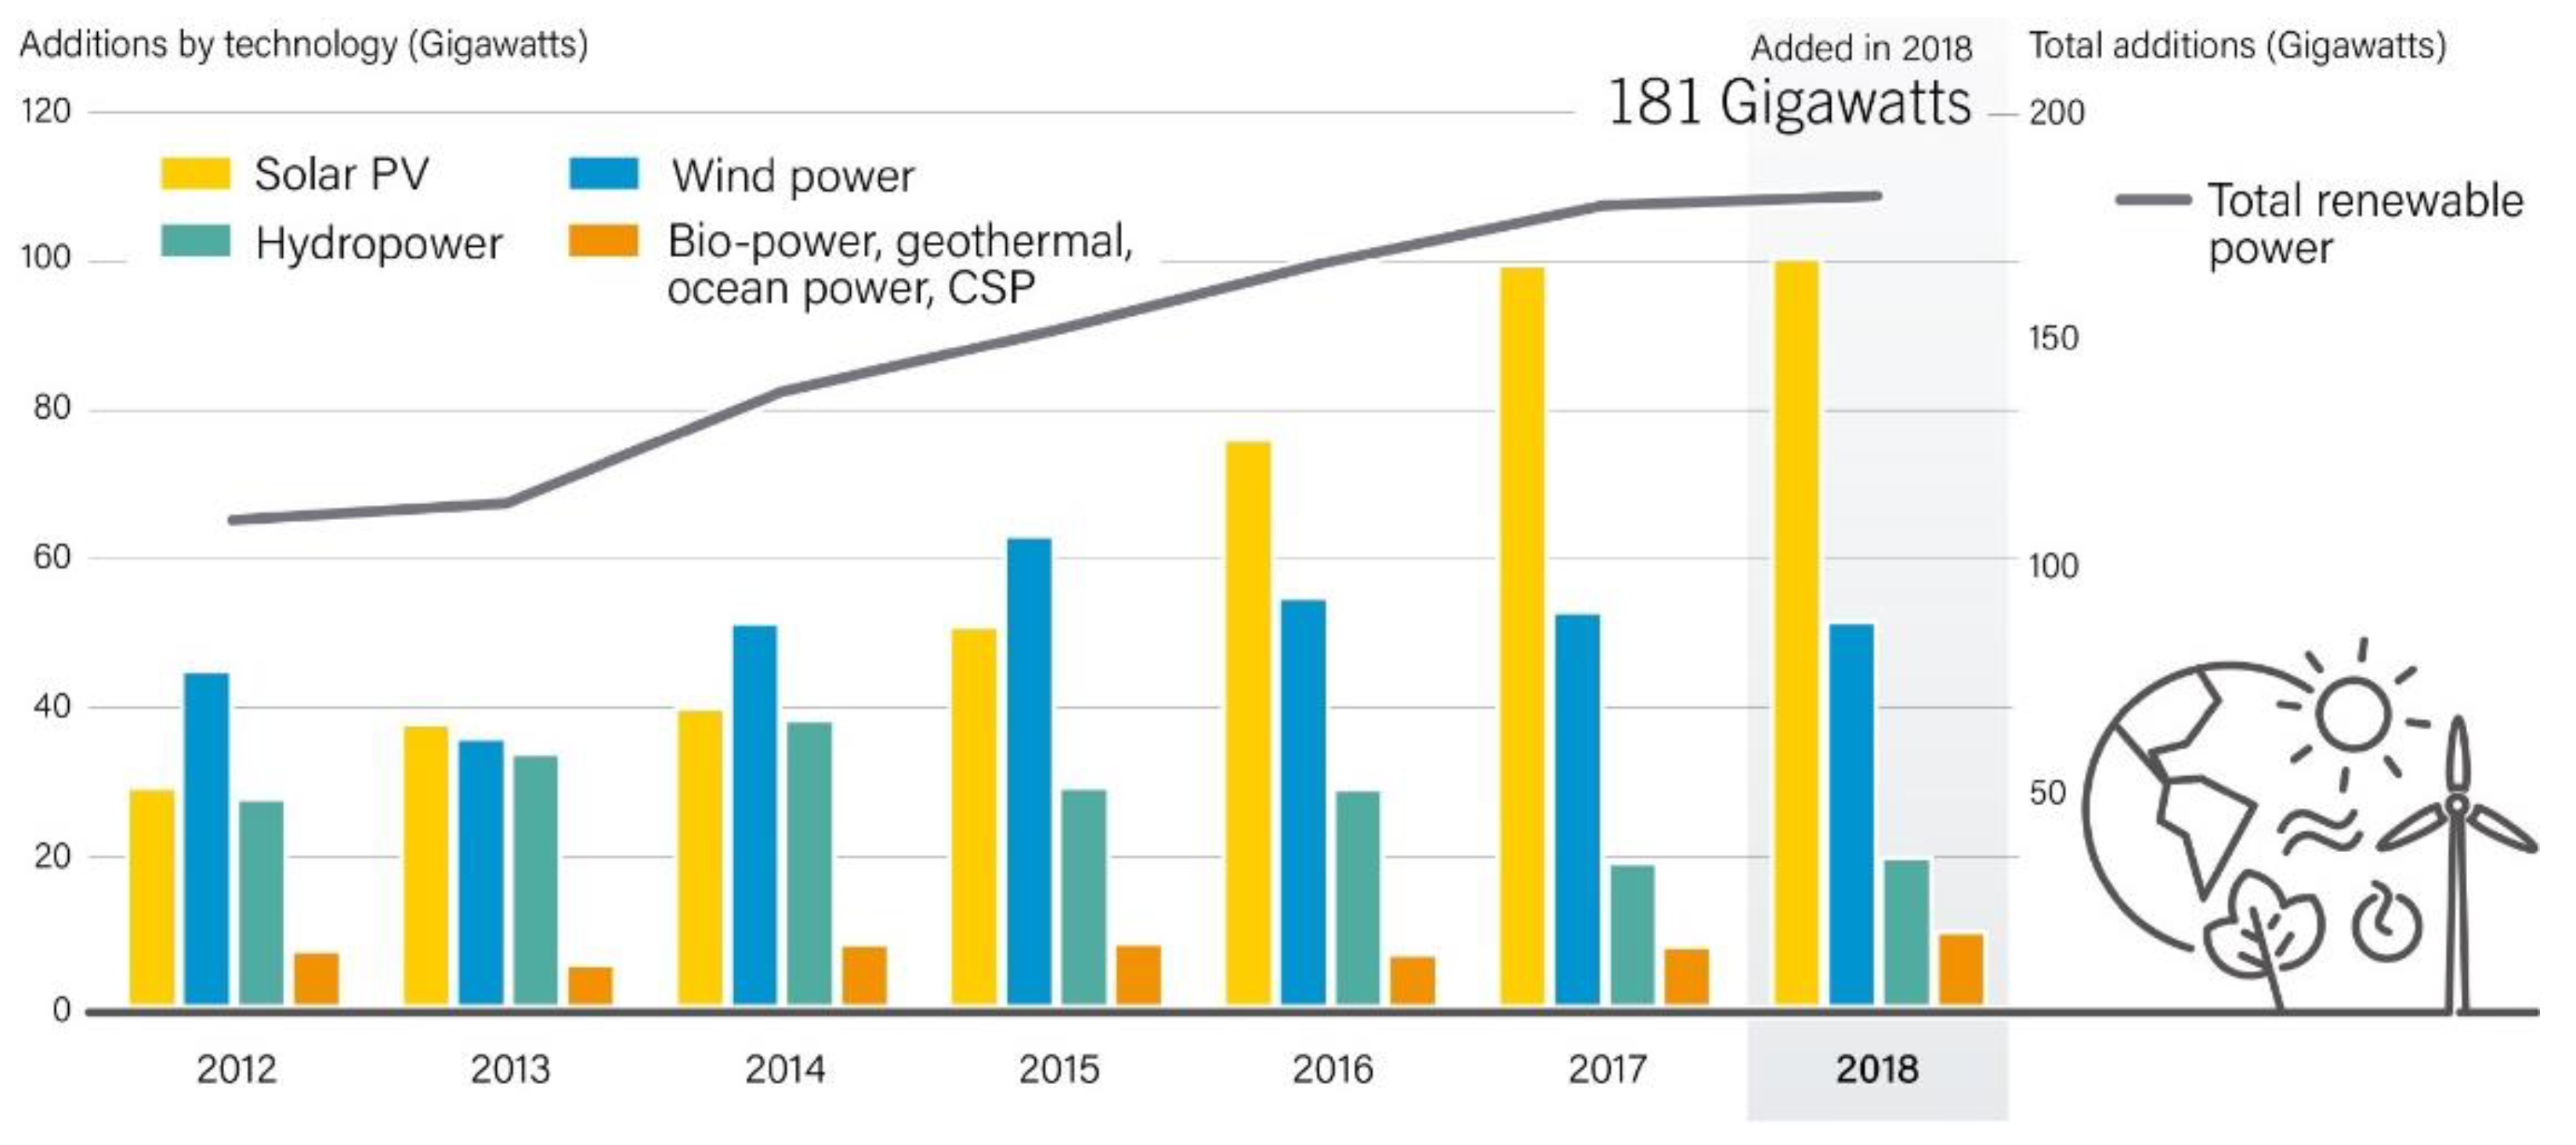
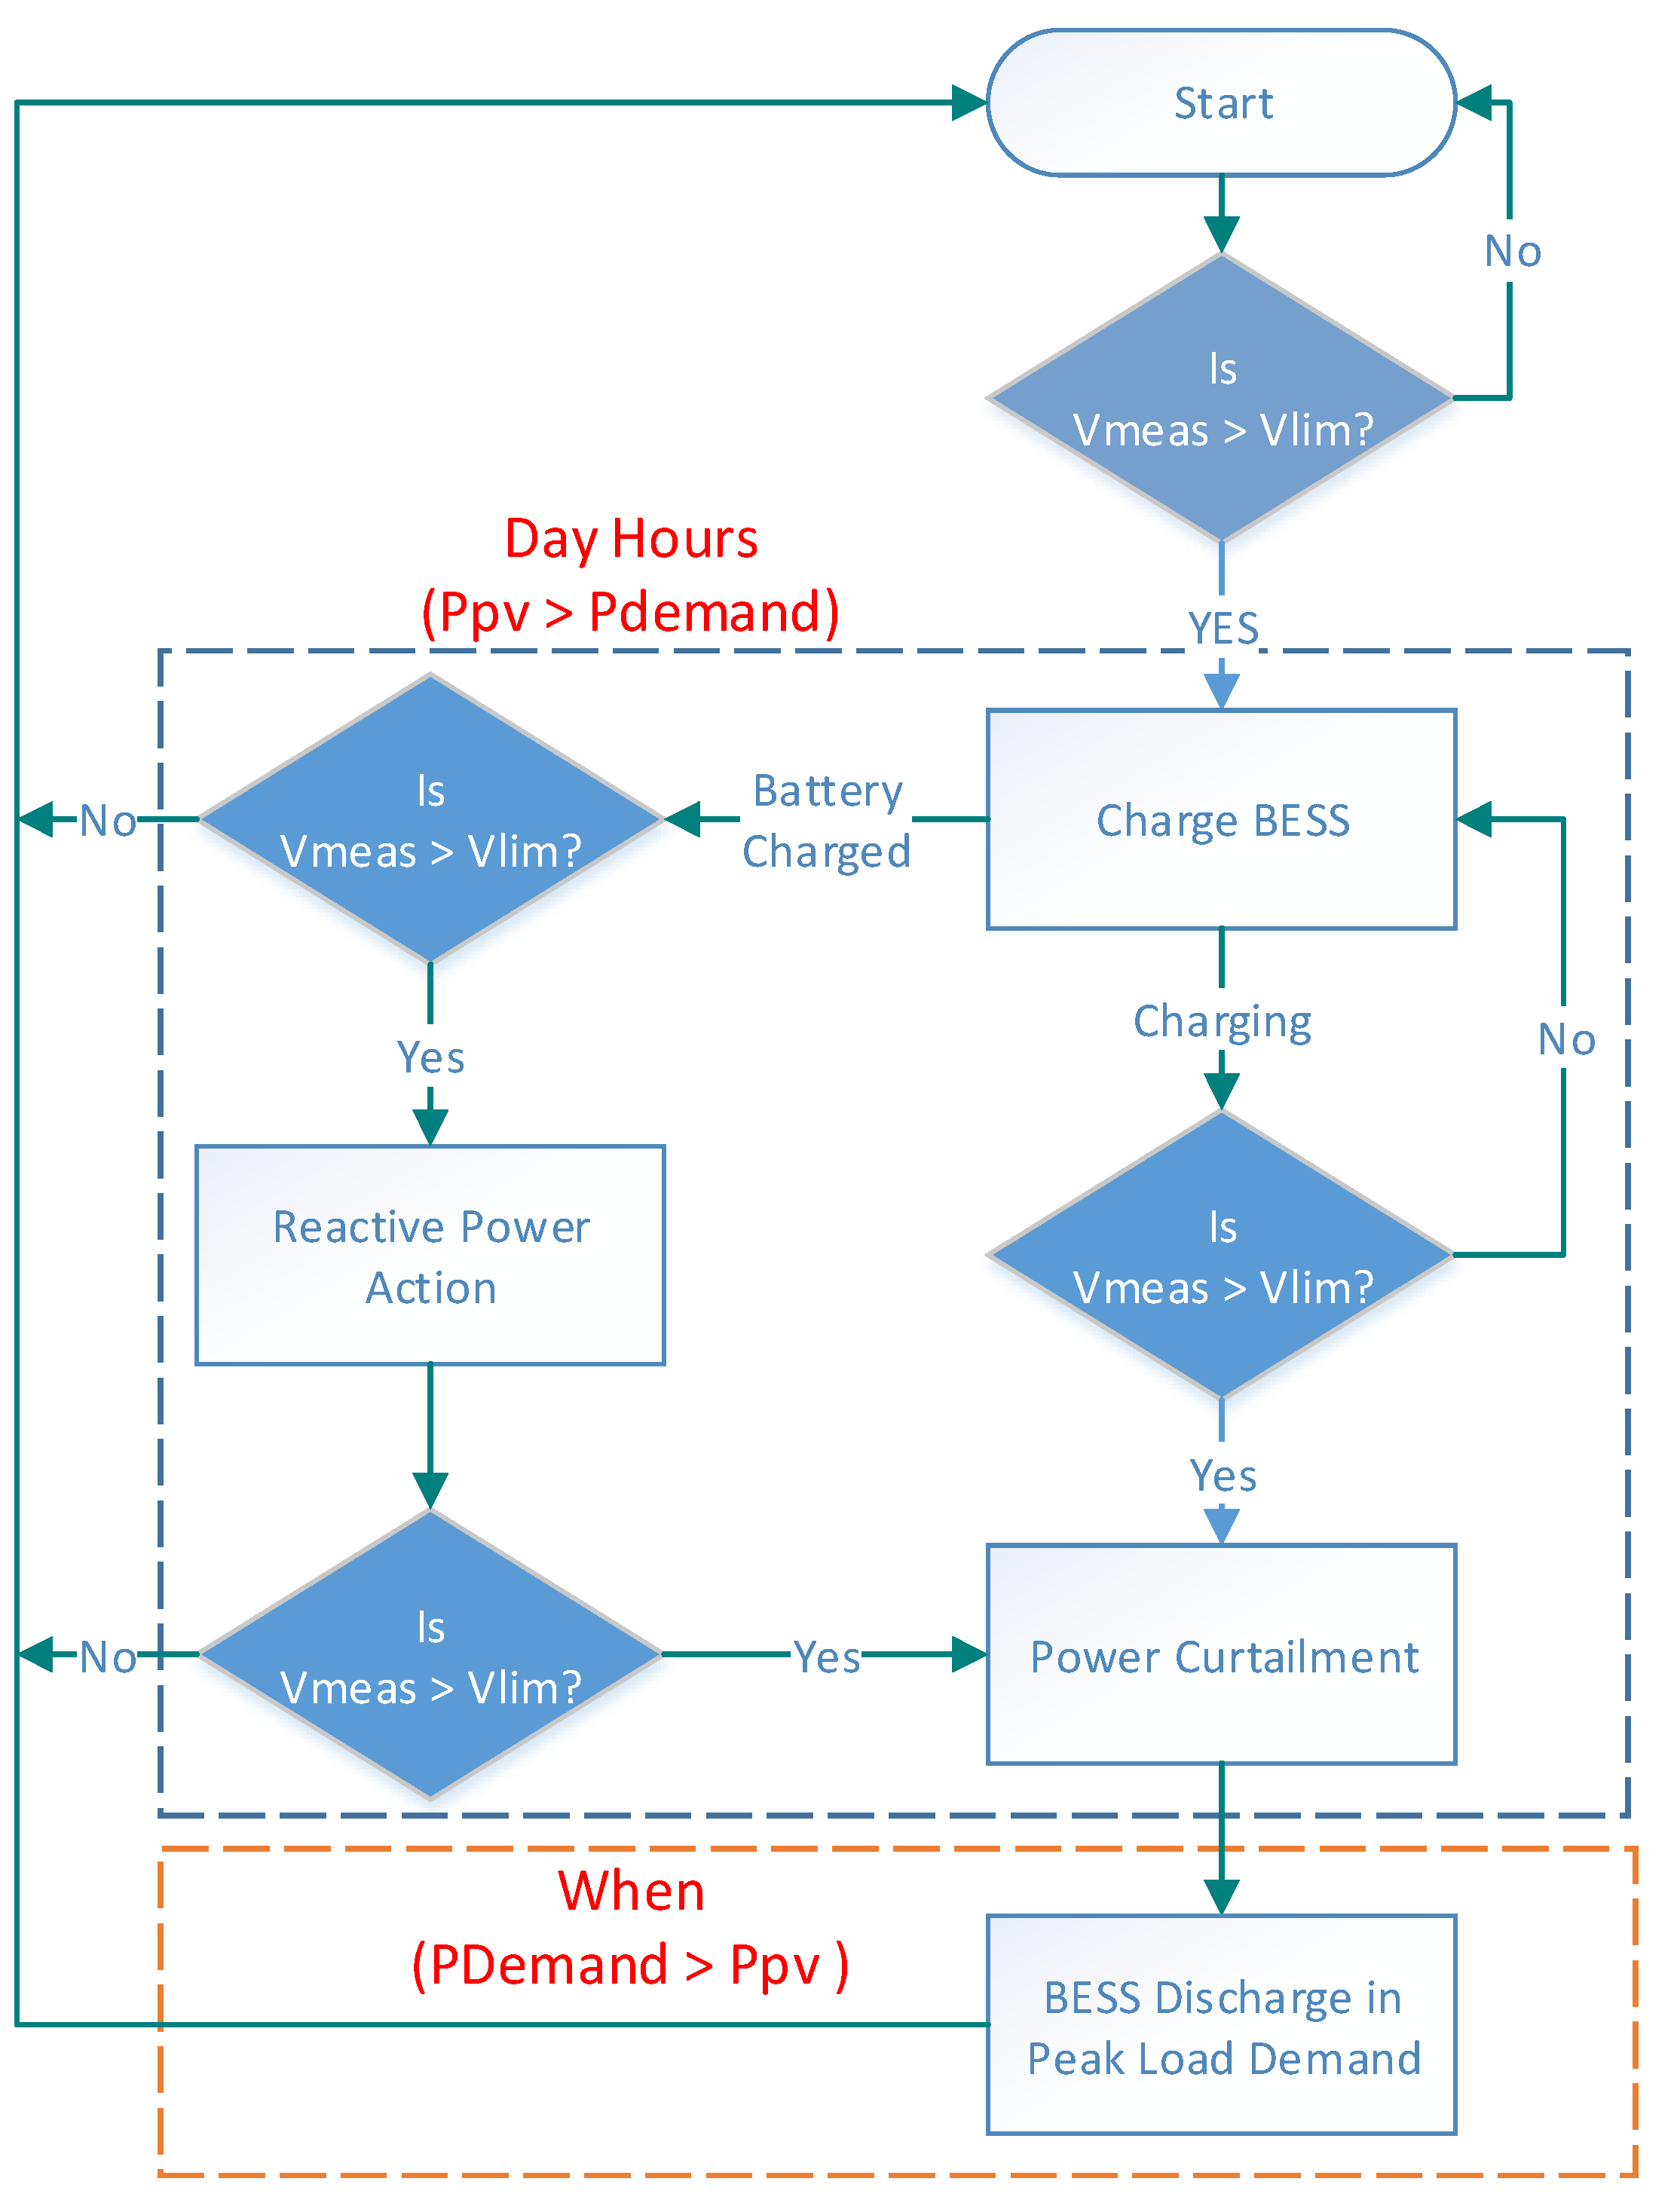
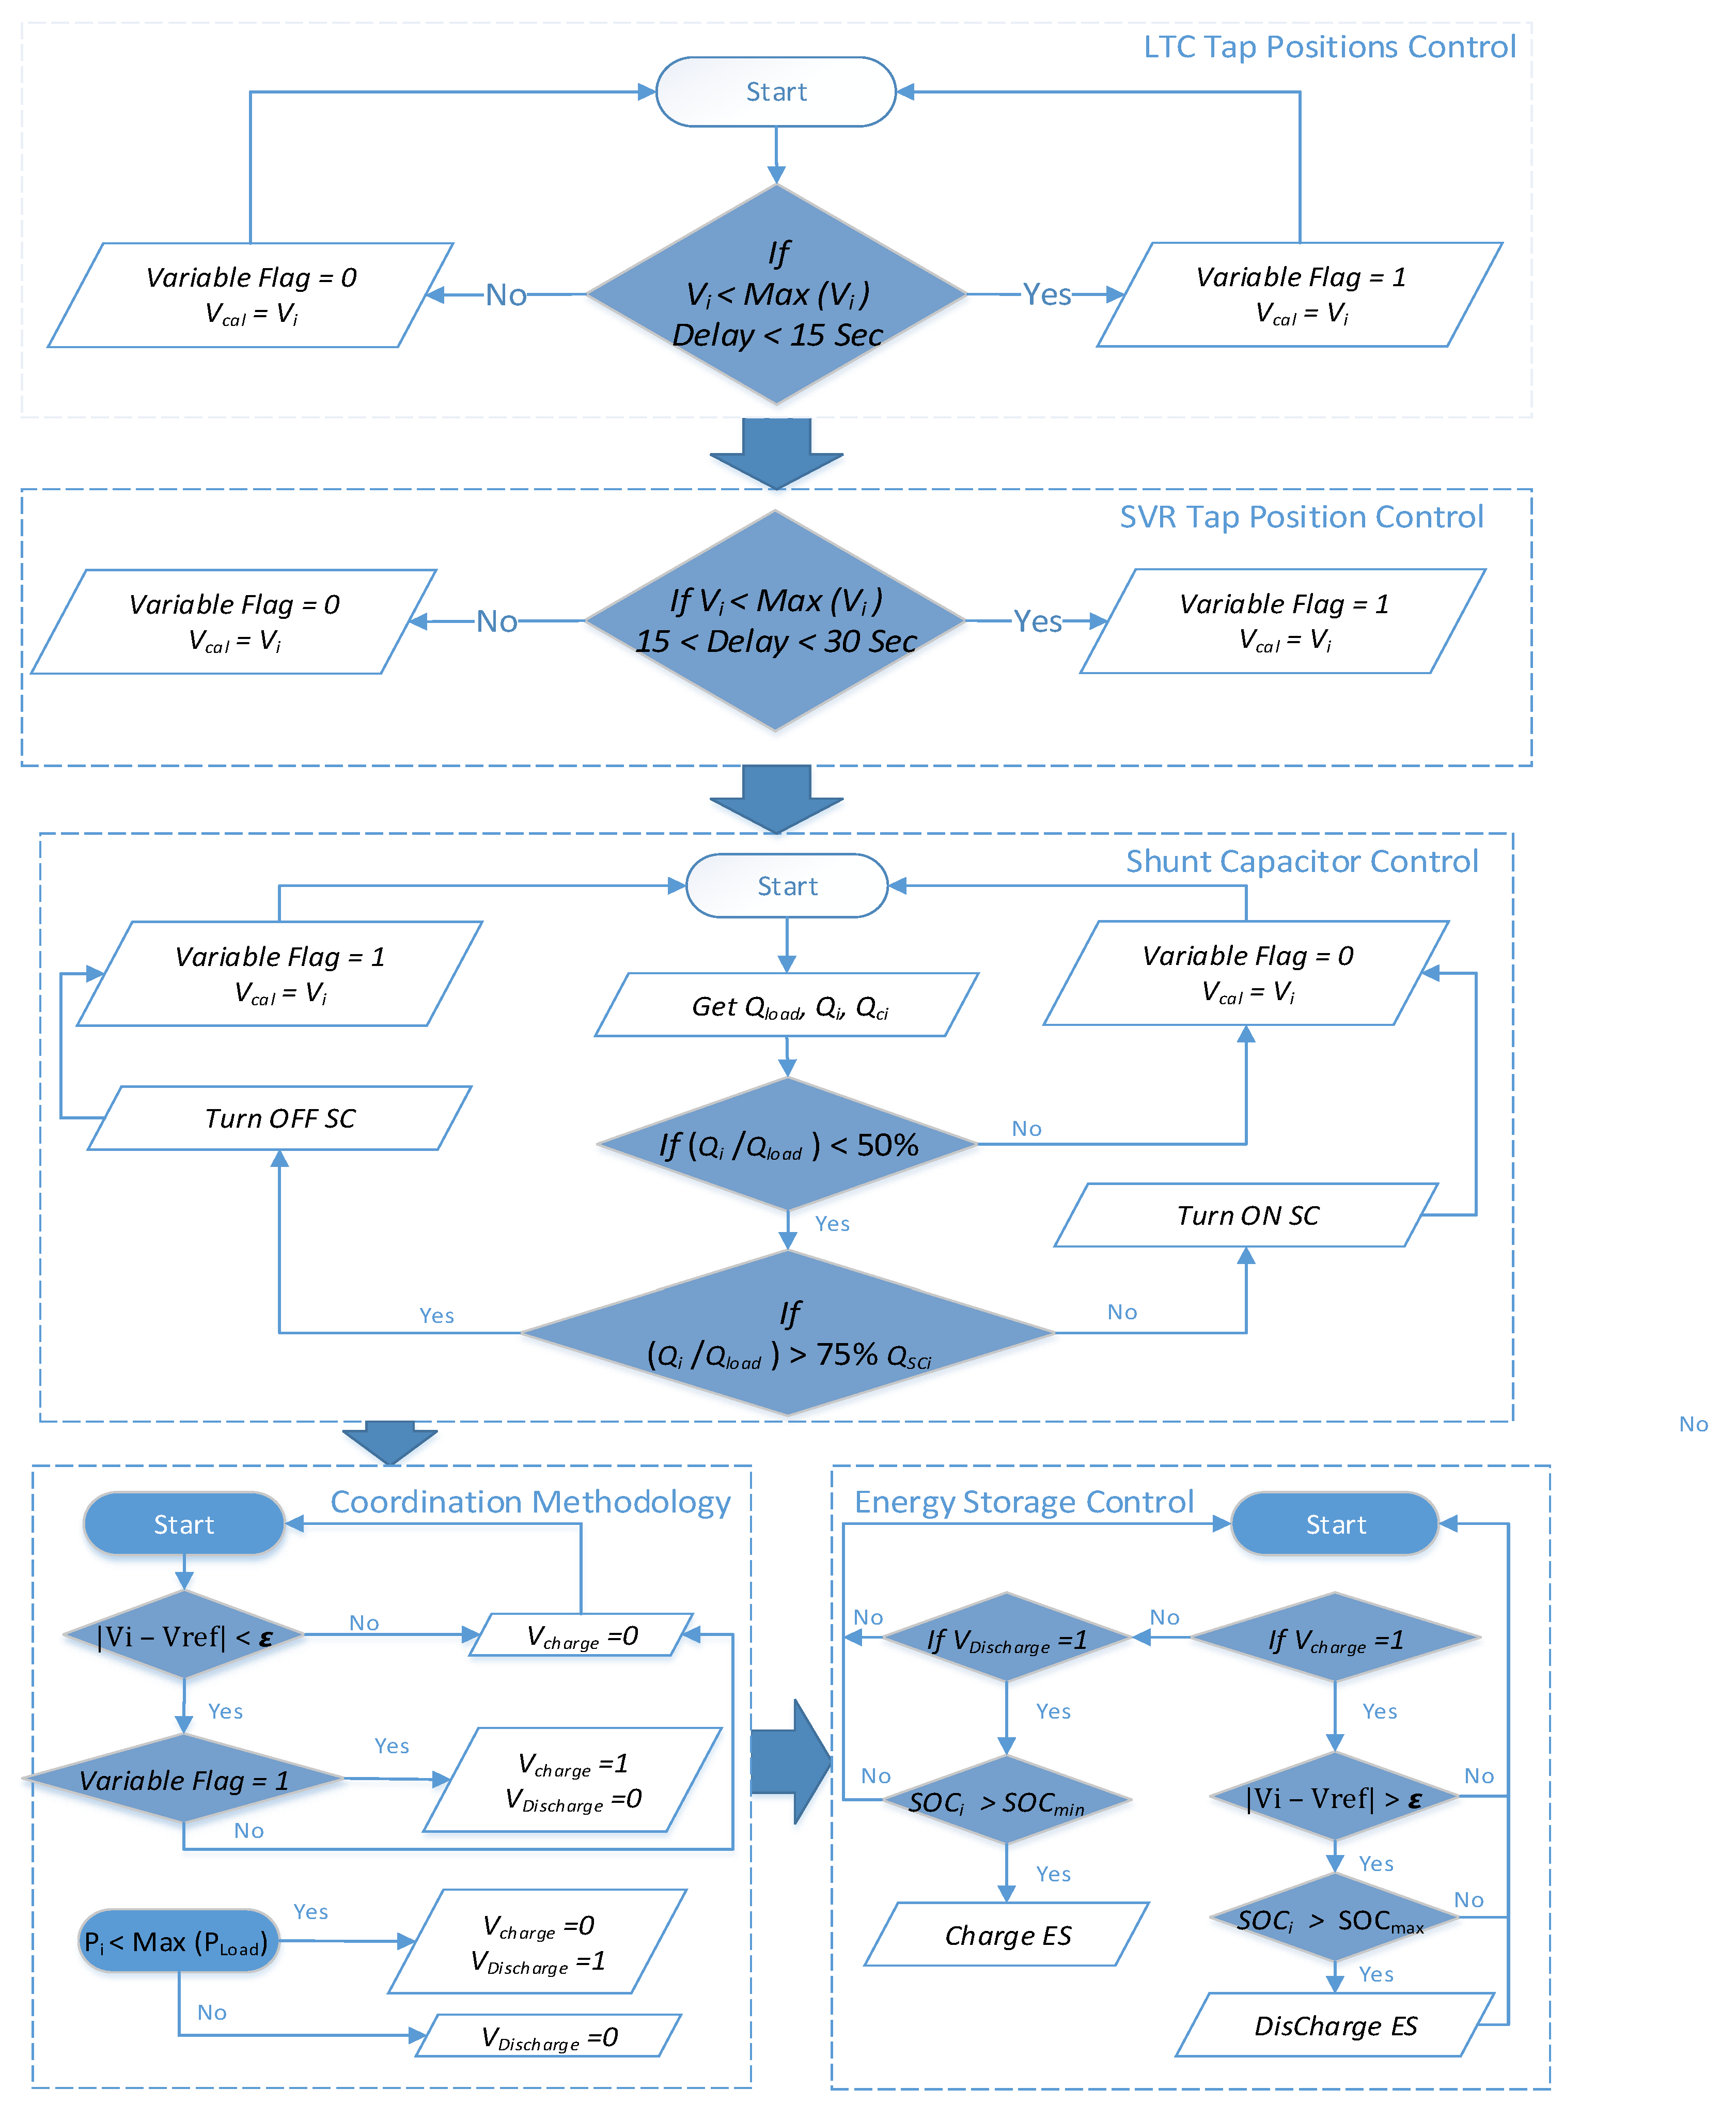
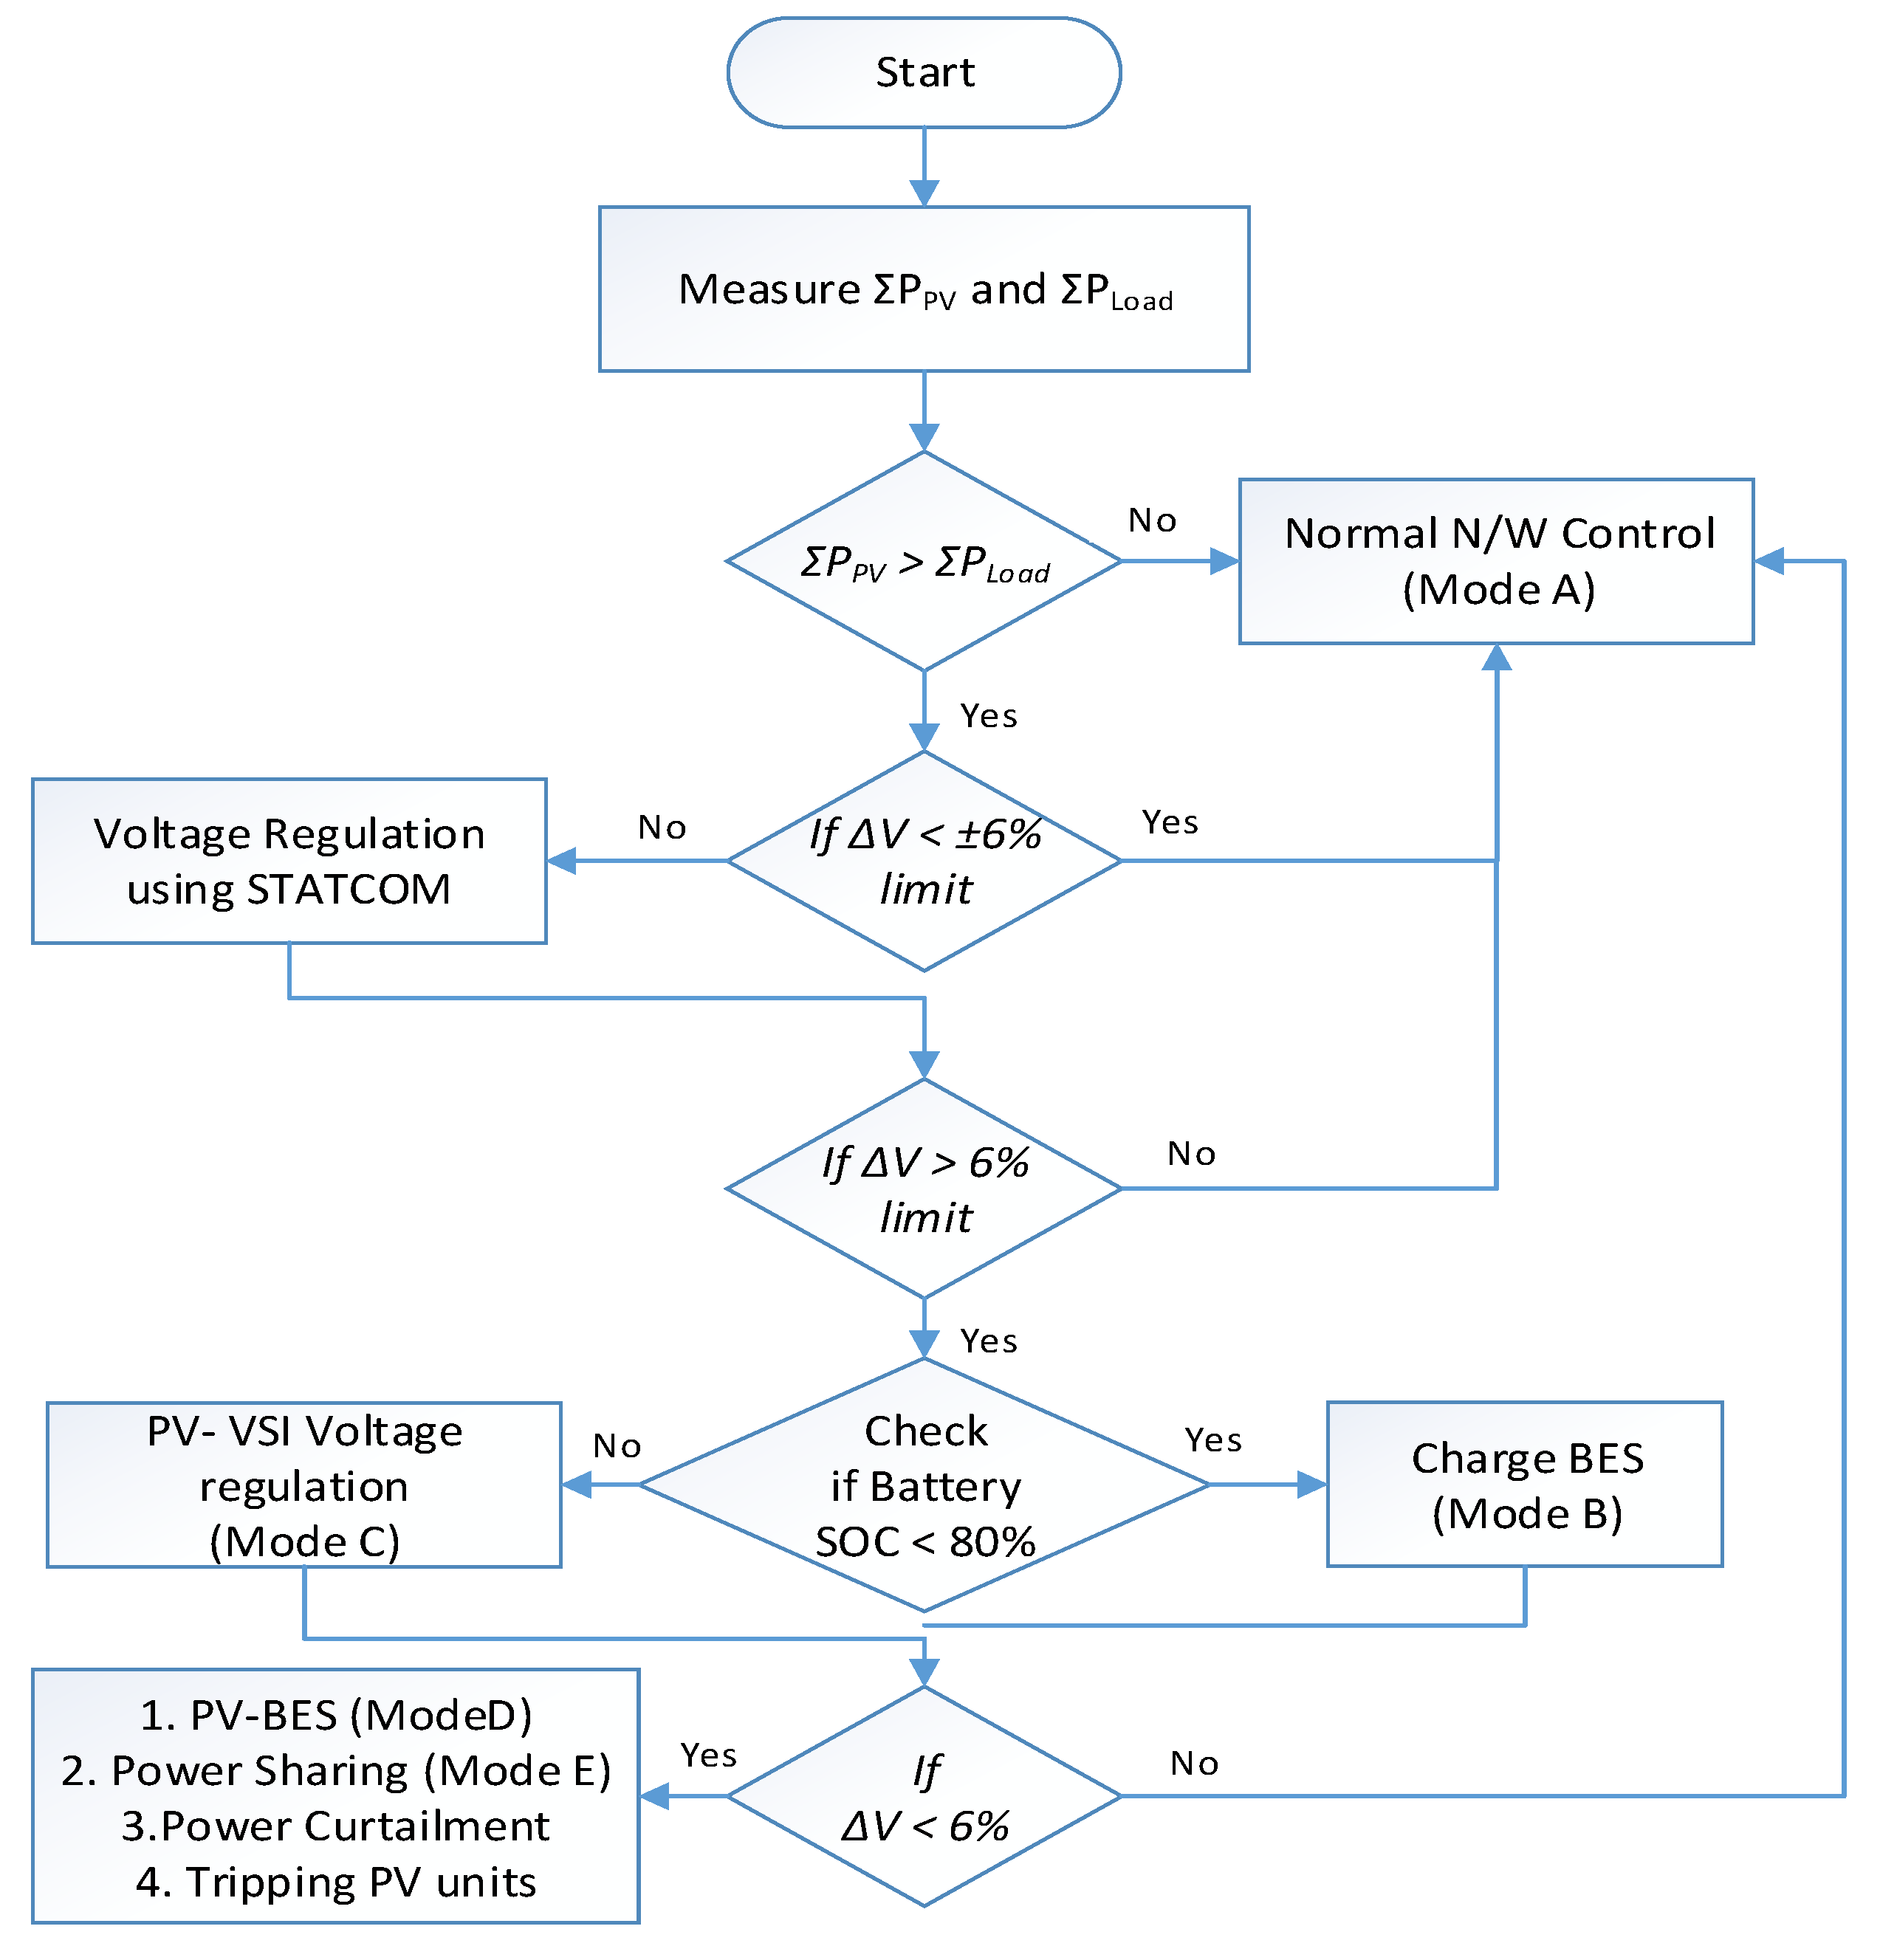
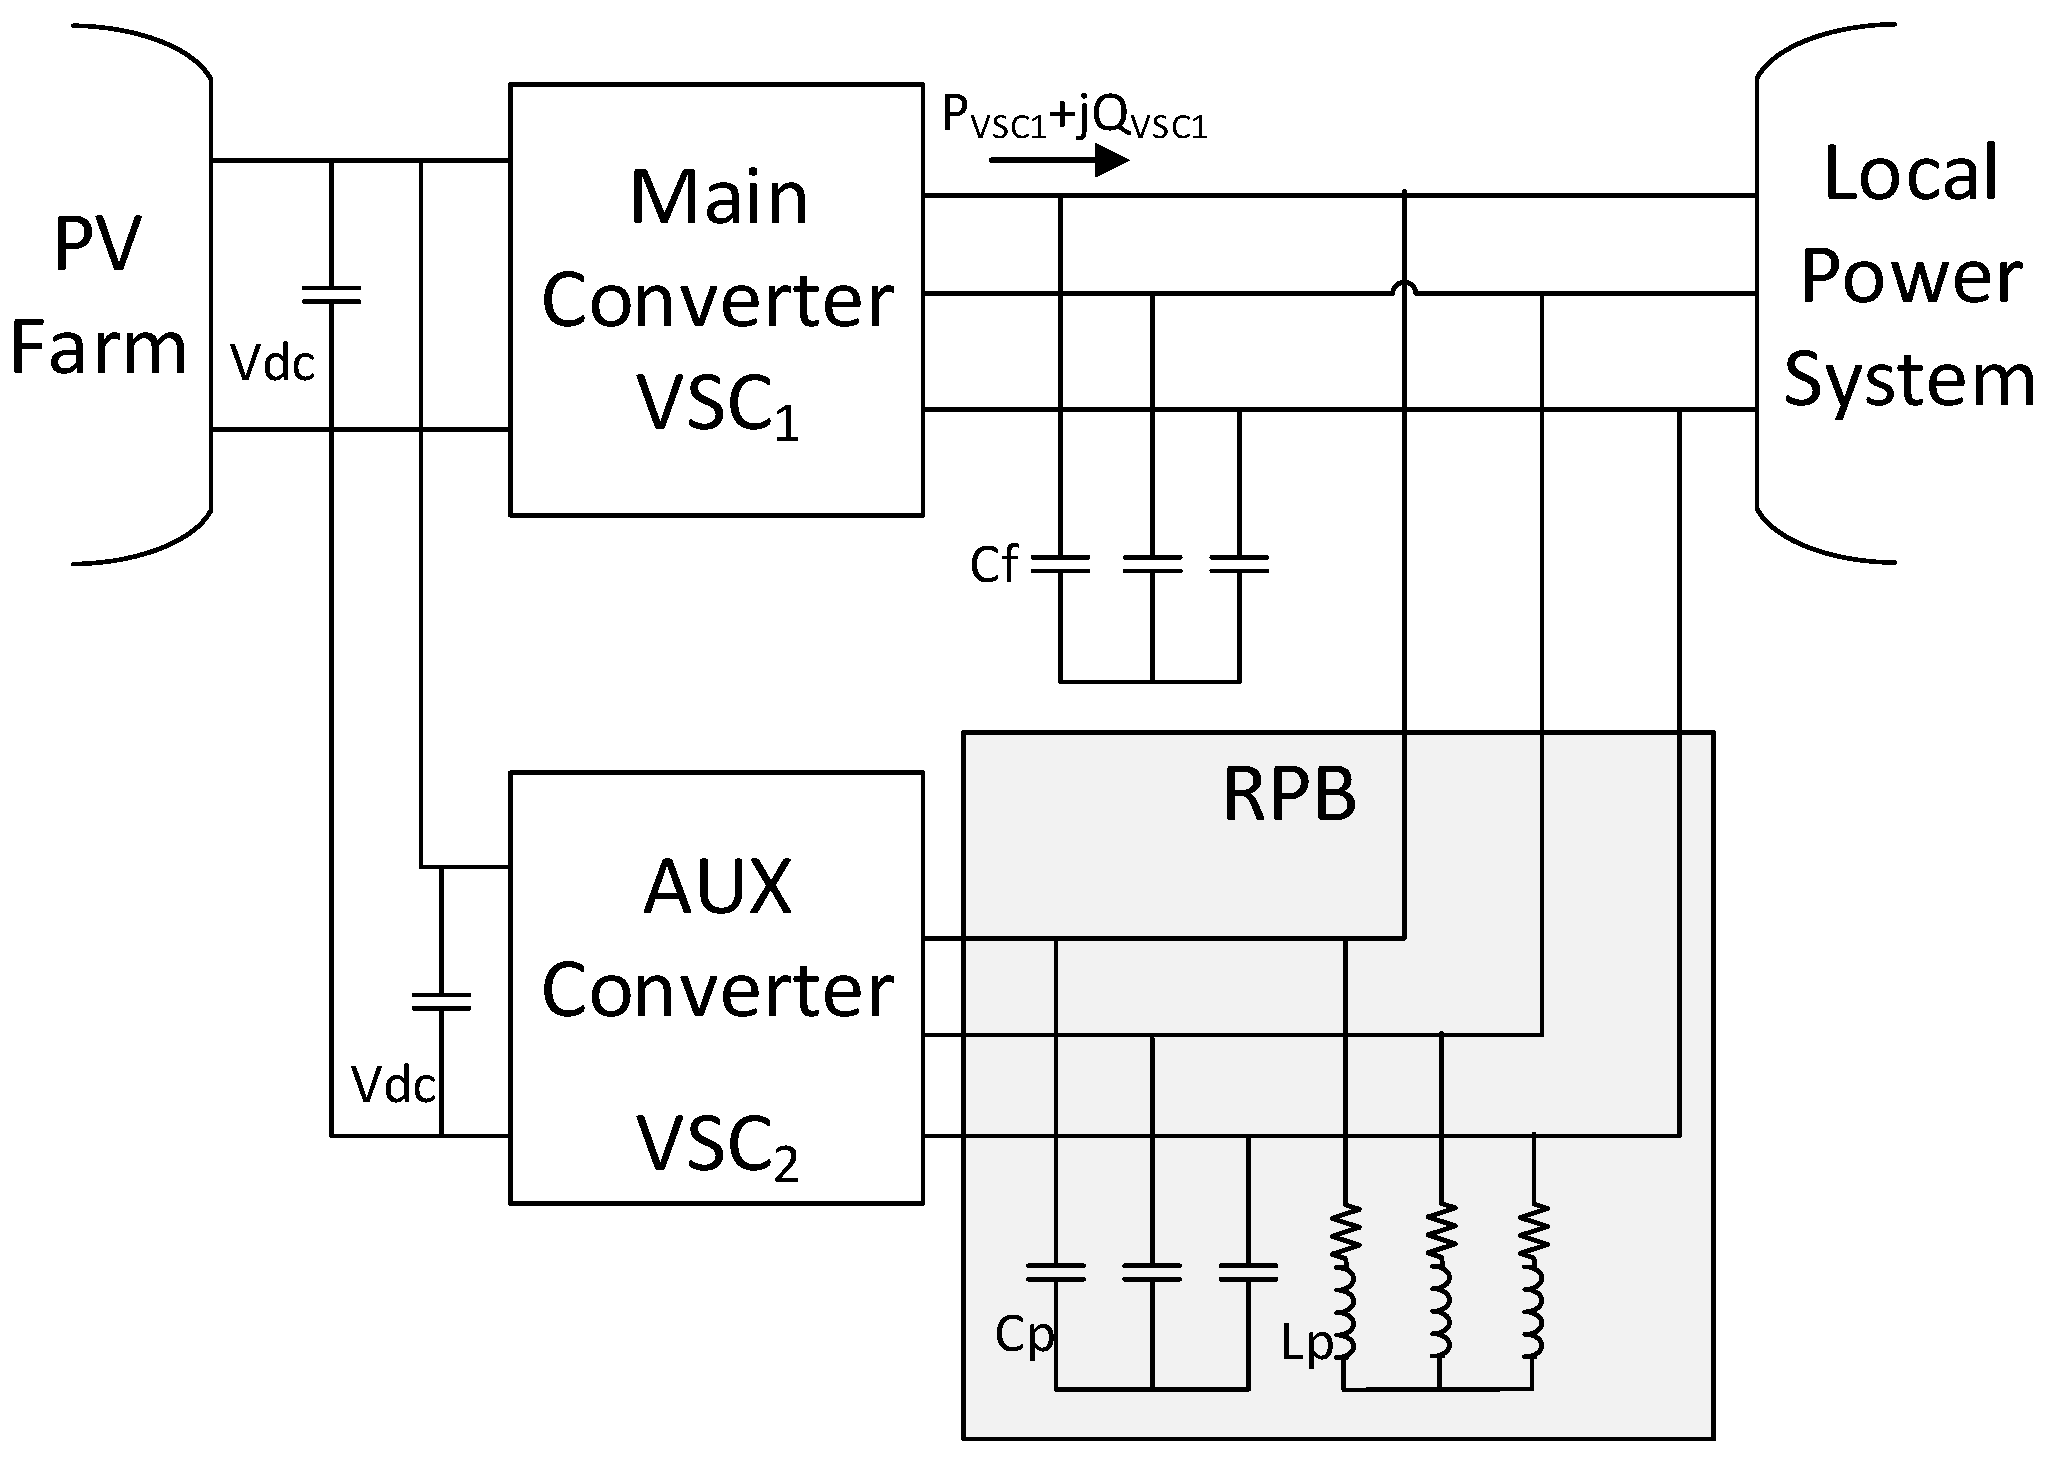
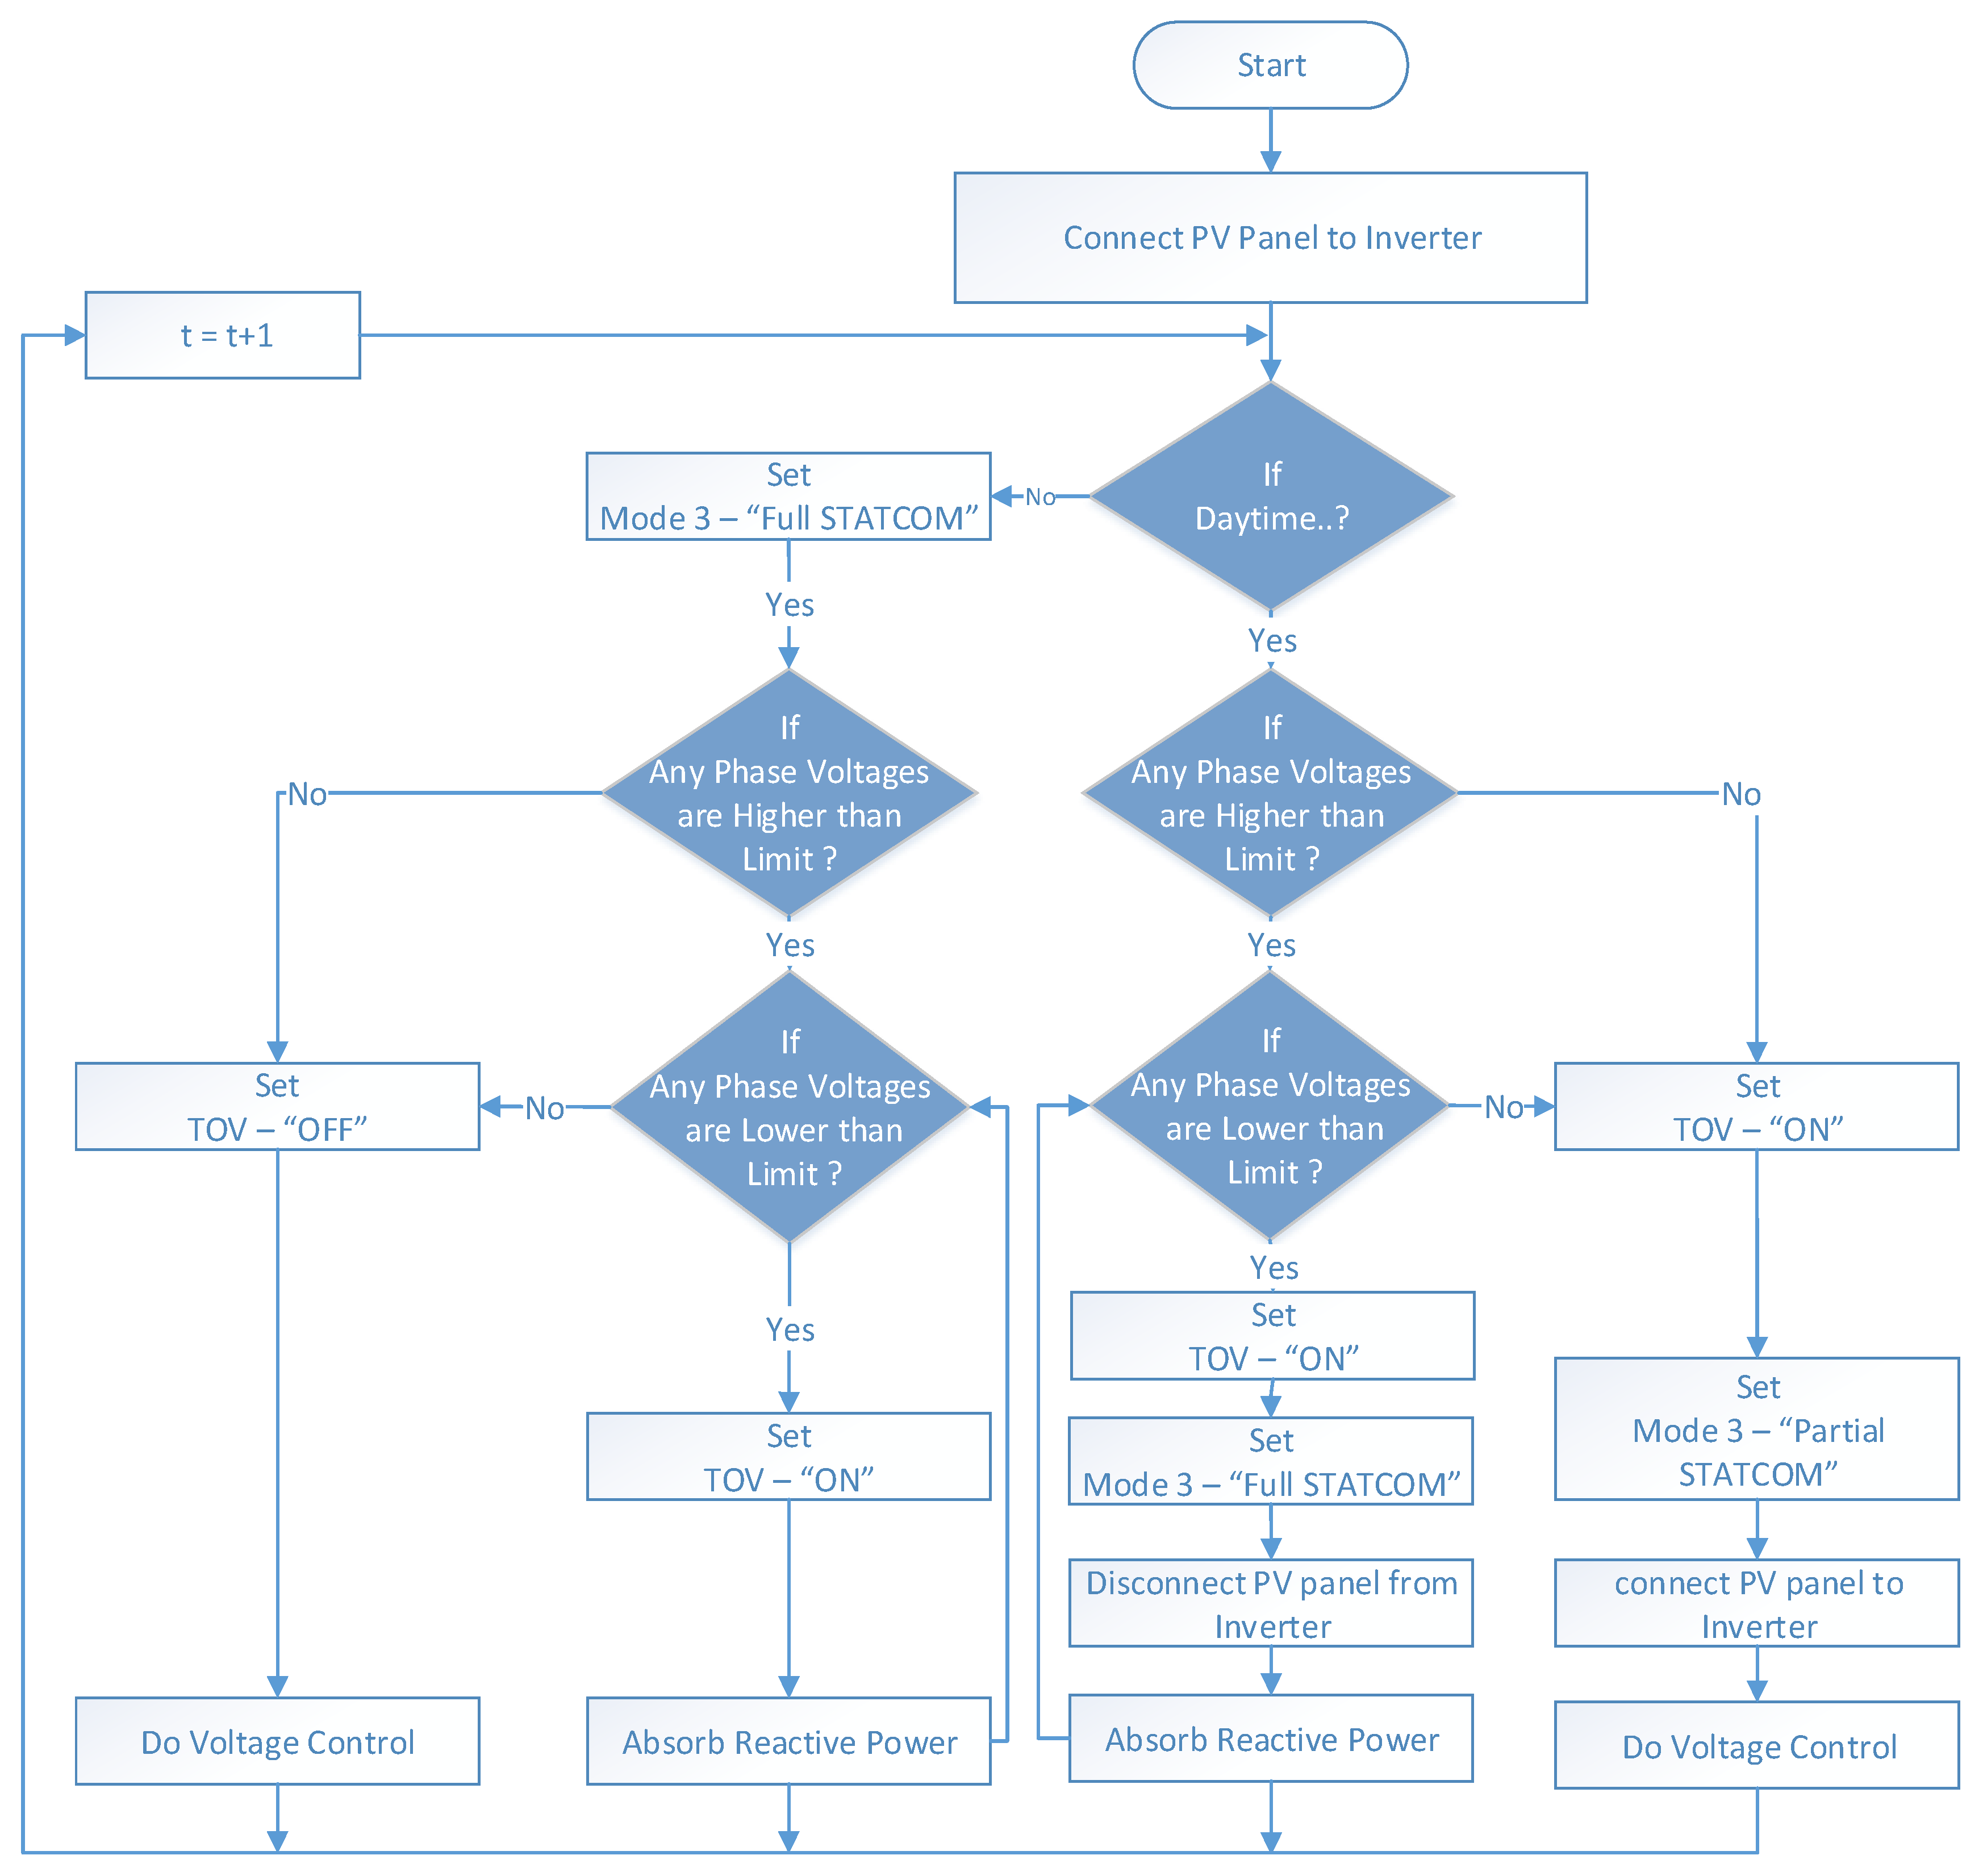
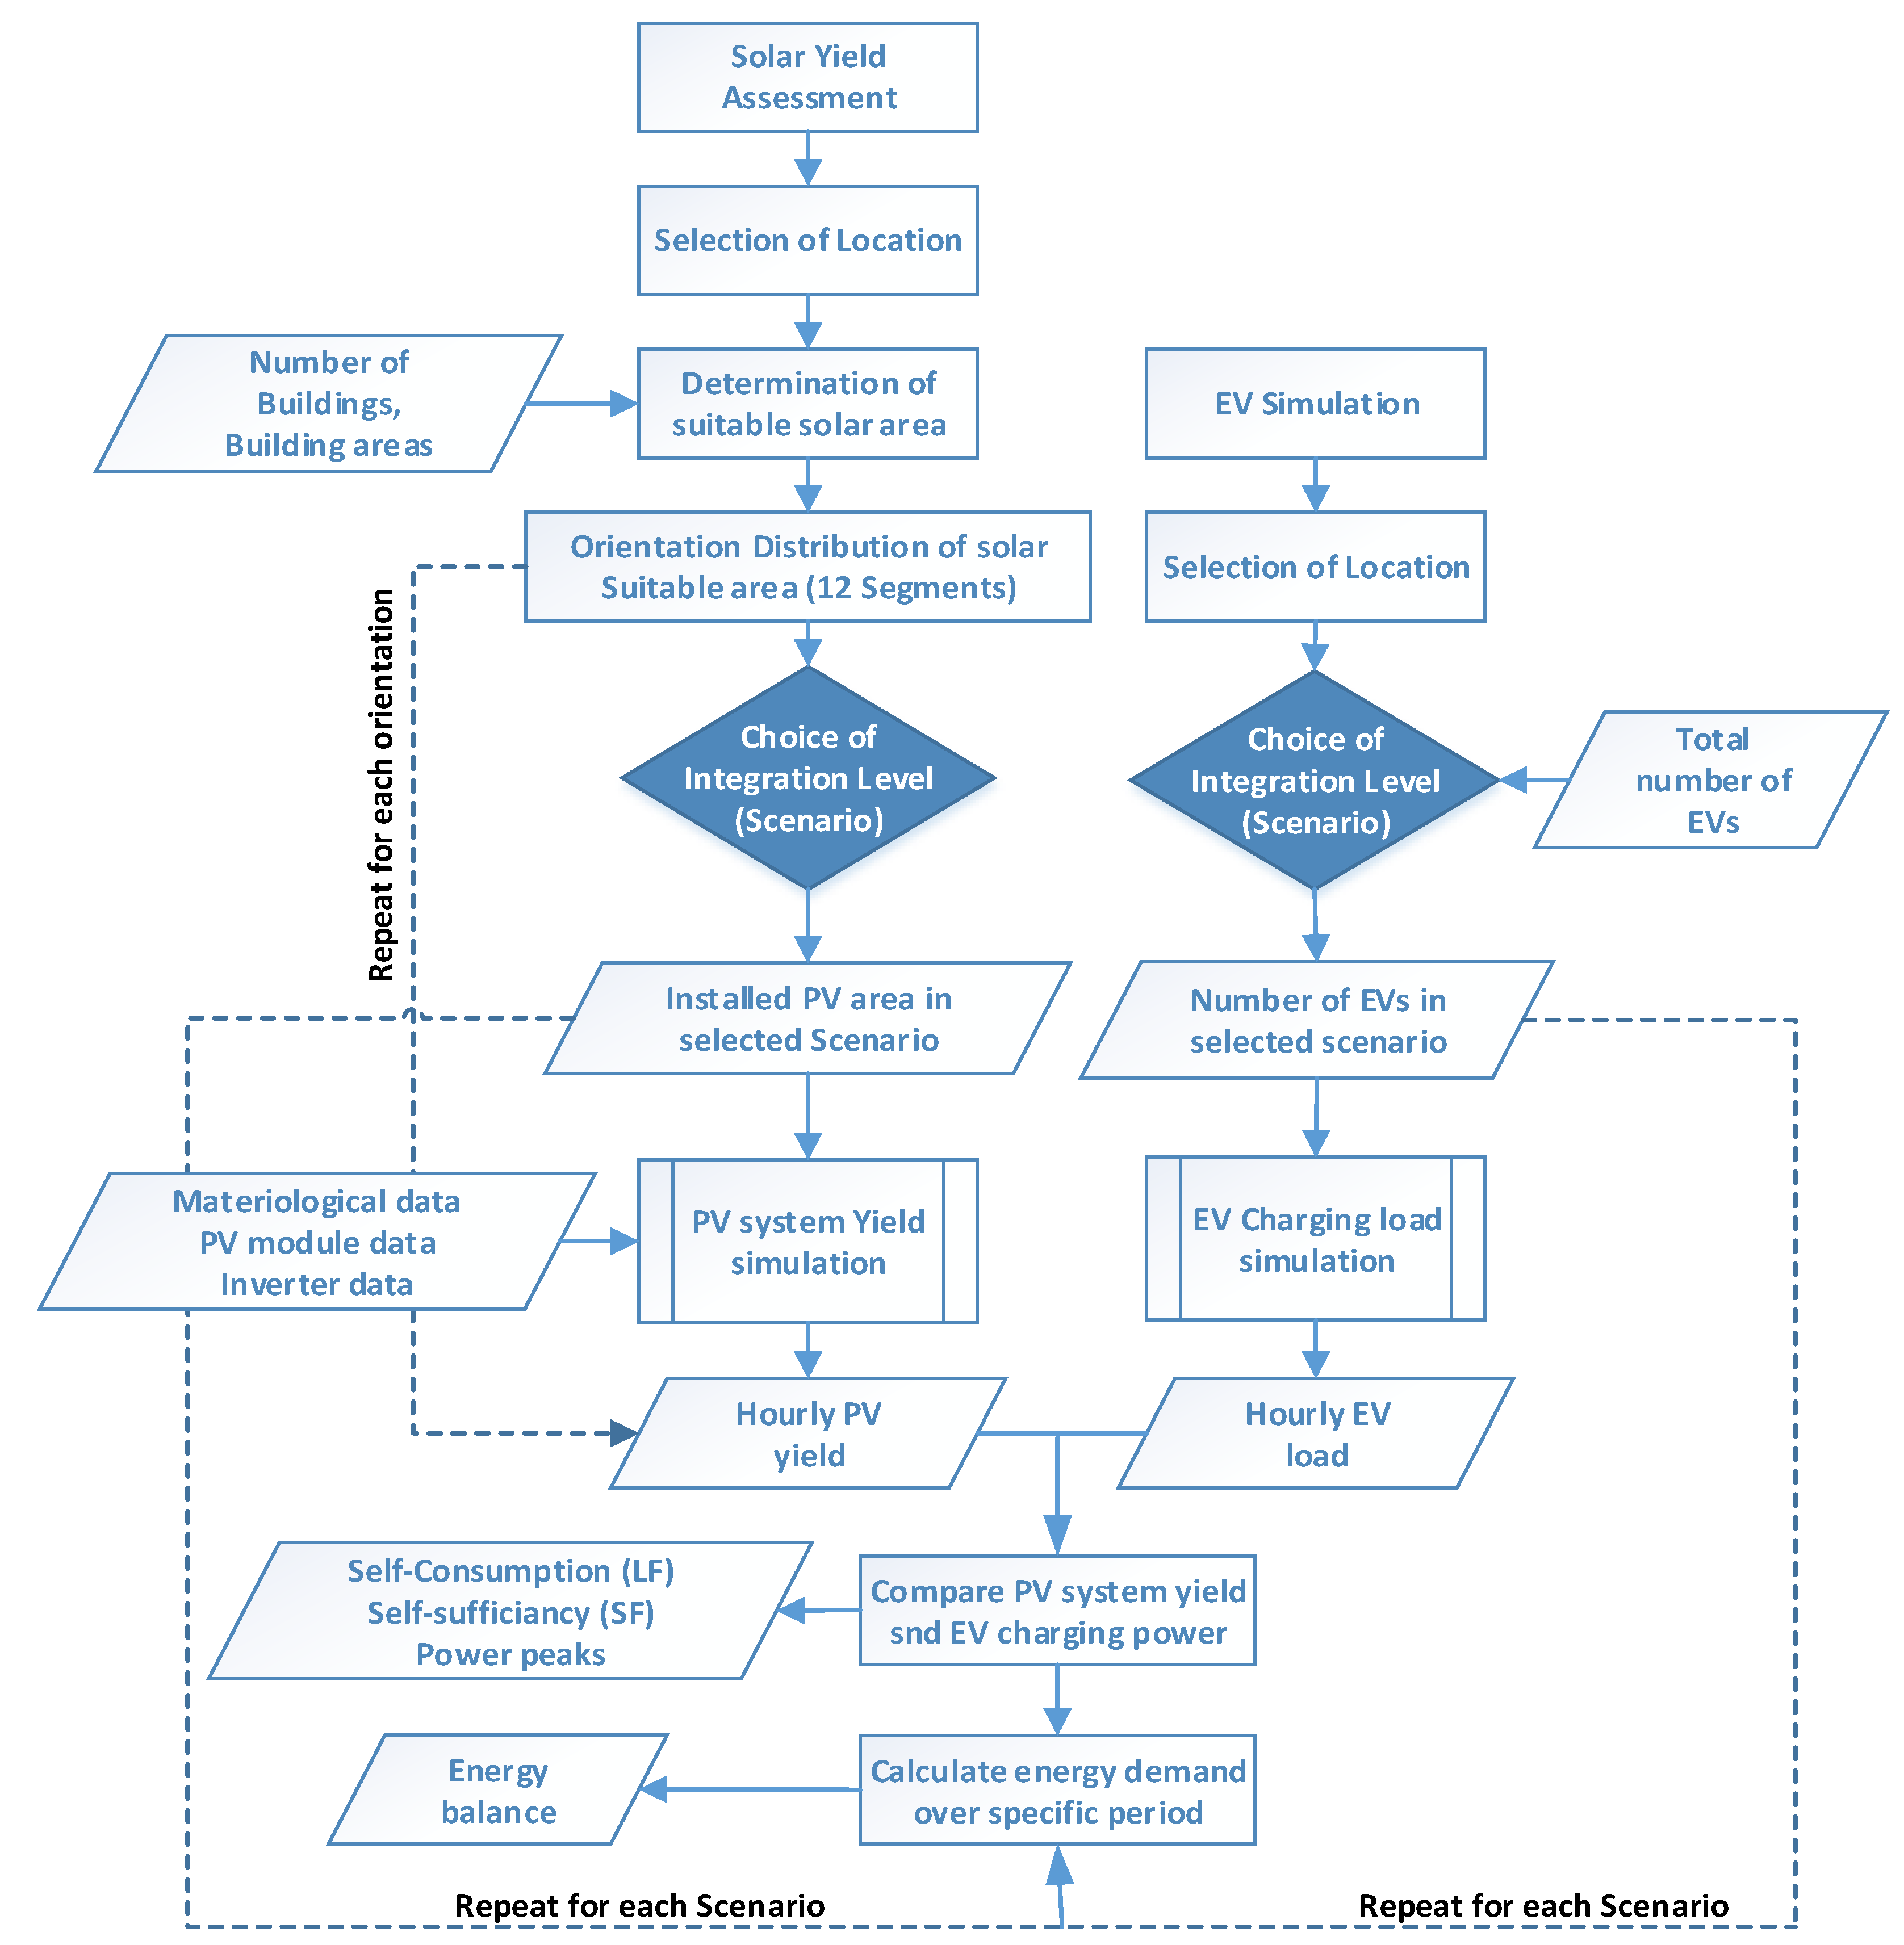
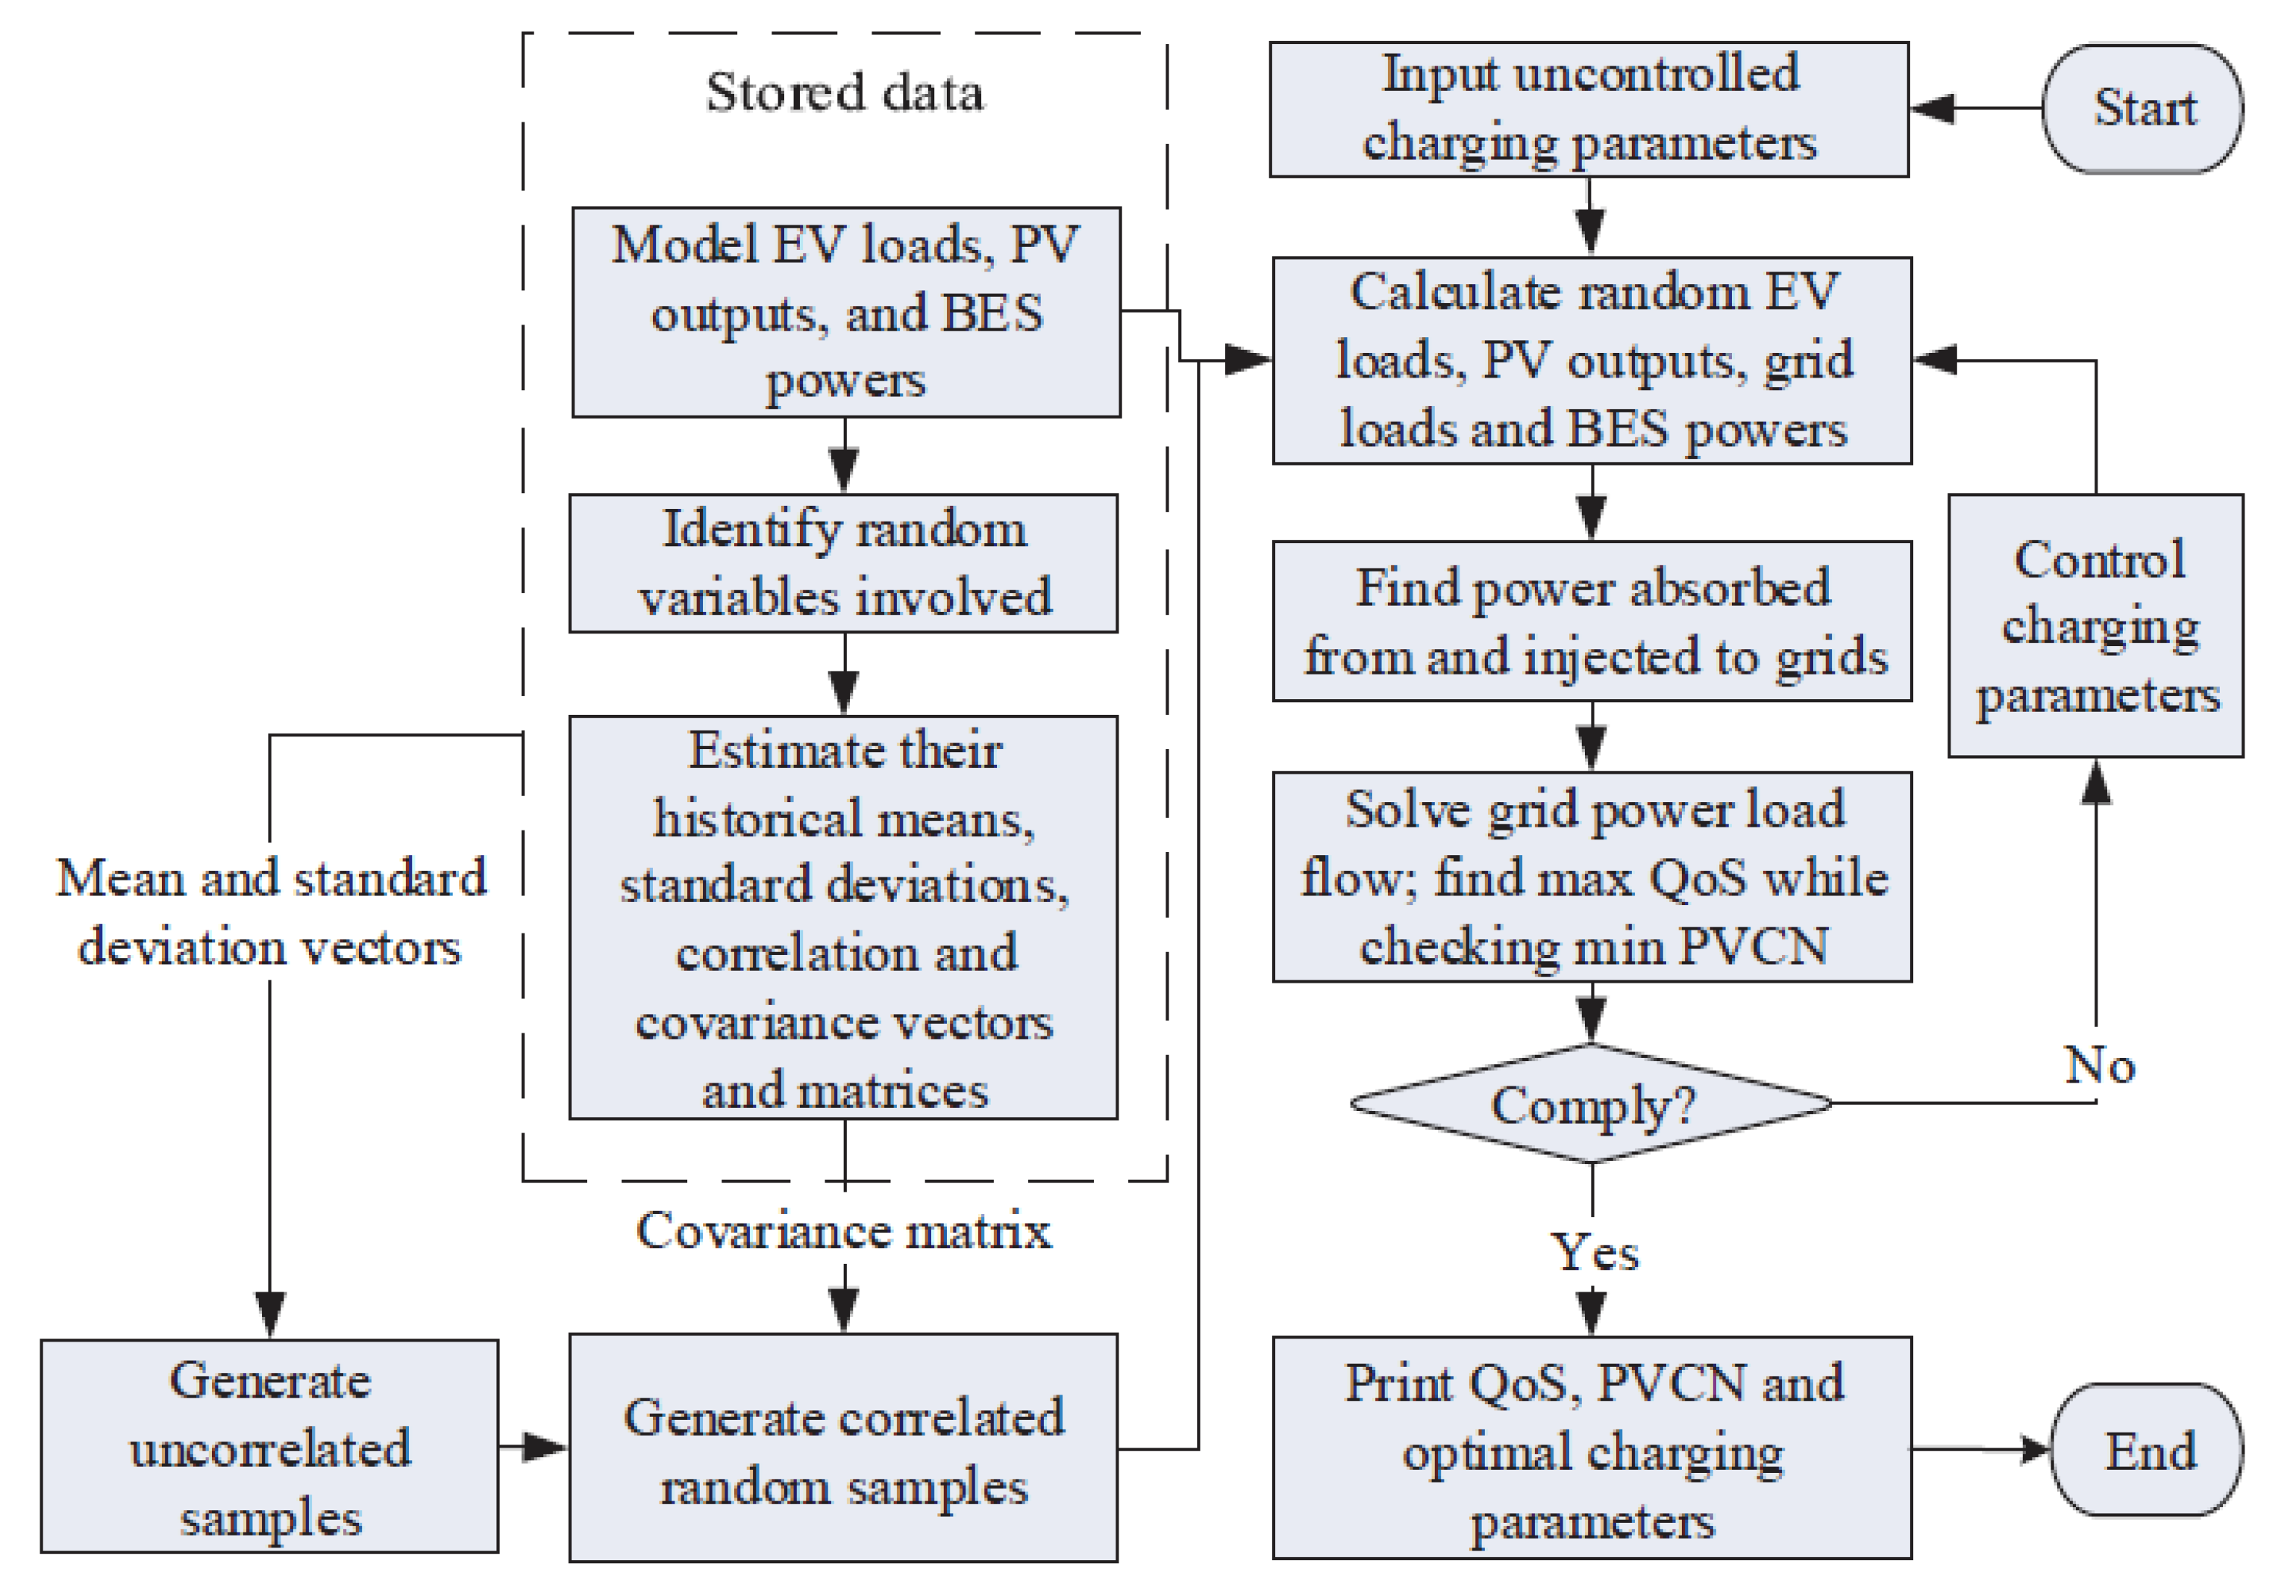
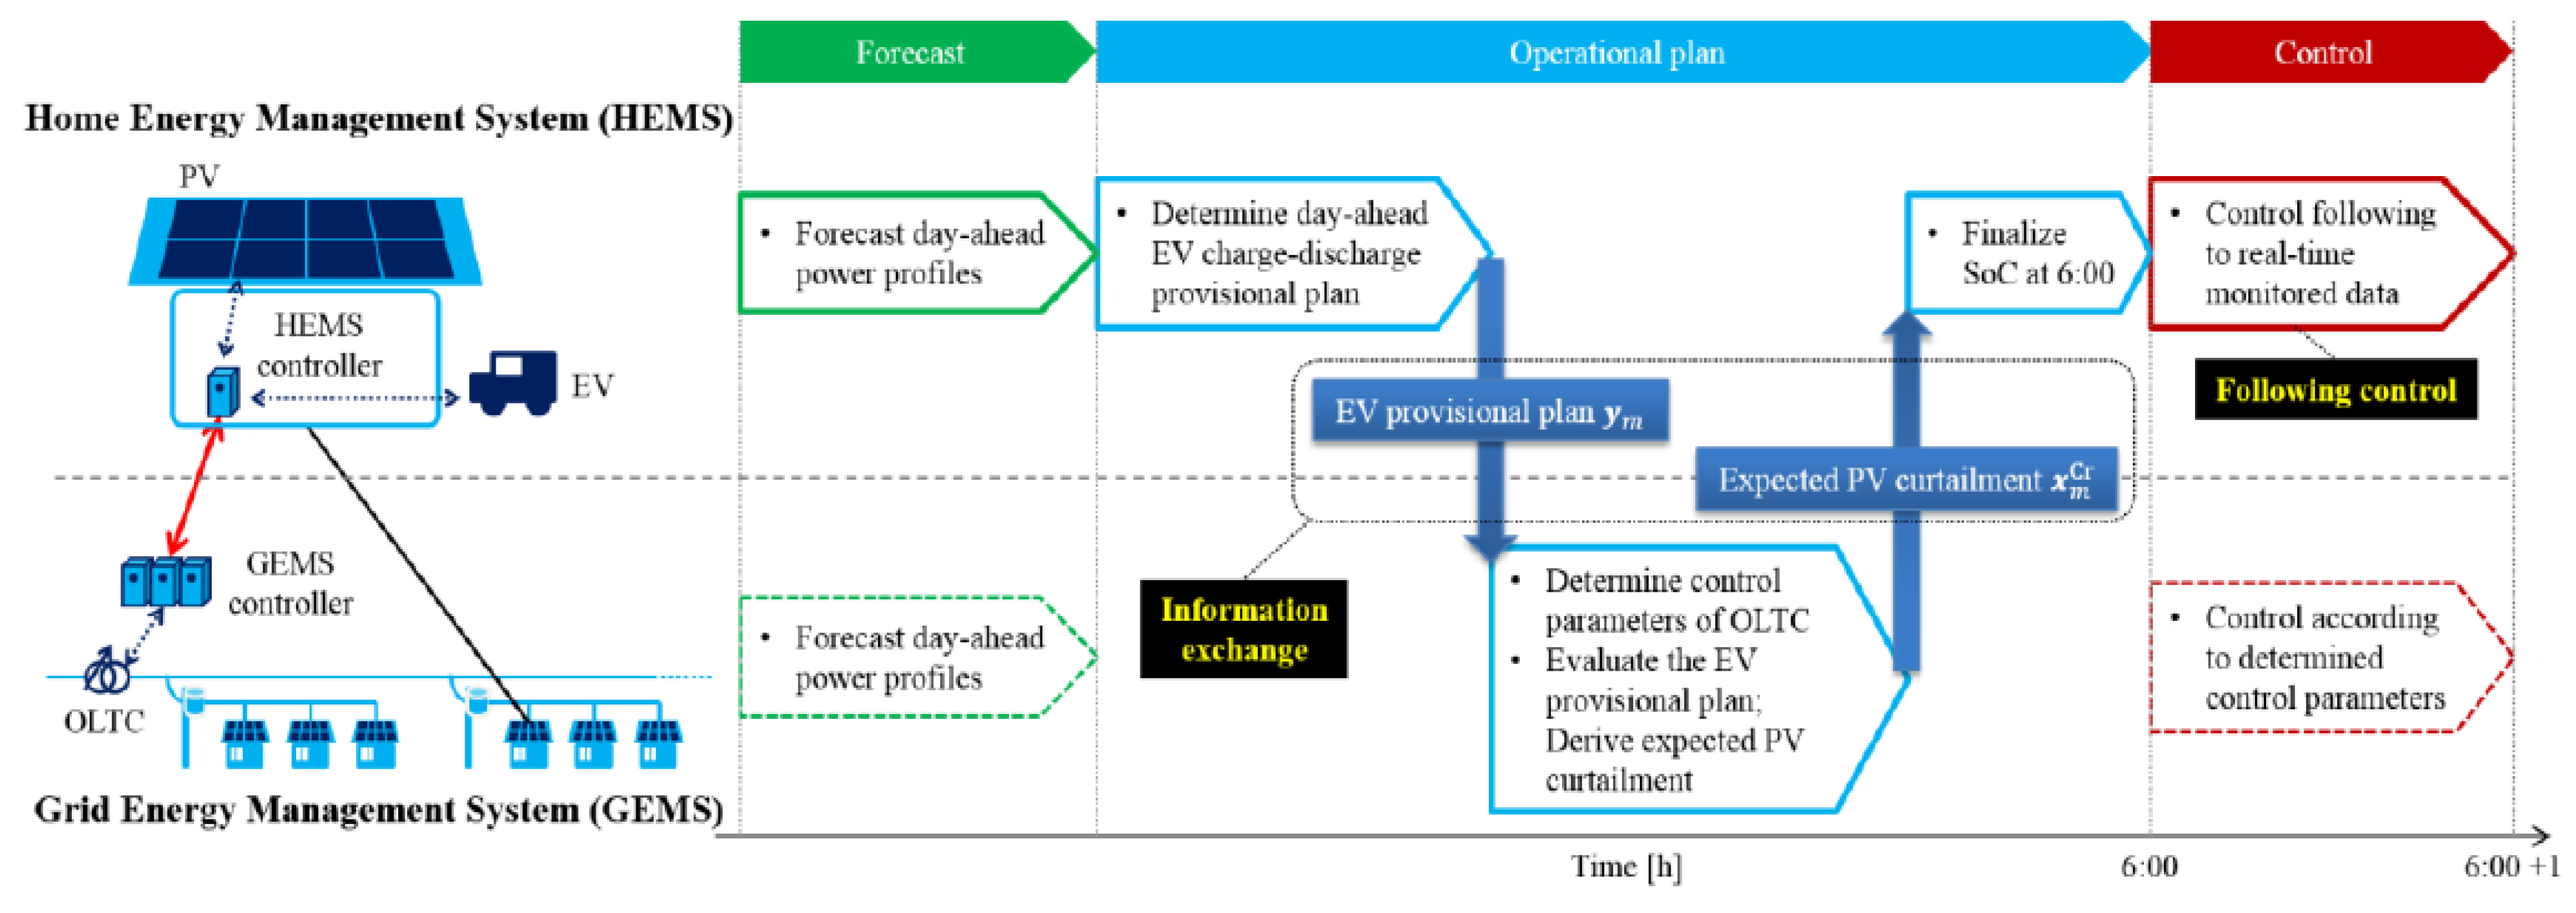
Table 1.
Summary of the strategies involved for integration of PV power along with EVs.
| Reference | Advantages | Disadvantages | Effectiveness | Complexity | Cost/economics |
|---|---|---|---|---|---|
| [97] |
|
| Less effective due to pricing analogy | Moderate | high |
| [98] |
|
| More effective | More | High |
| [99] |
|
| Moderate | More | High |
| [100] |
|
| More effective | Moderate | High |
| [101] |
|
| More effective | More complex due to uncertainties in modelling | High |
| [102] |
|
| More | More due to multi objective optimization | High |
| [103] |
|
| High | More complex due to unbalanced grid conditions | High |
| [104] |
|
| Highly effective | Moderate | High |
Table 2.
Summary of the strategies involved for high penetration of PV power.
| Reference | Advantages | Disadvantages | Effectiveness | Complexity | Cost/economics |
|---|---|---|---|---|---|
| [72] |
|
| Fast response of methodology with high Penetration gives high effectiveness | Medium | Economically feasible and less equipment costs |
| [51] |
|
| Highly effective as it expands the hosting capacity | Medium | Costs are moderately high as it uses SVC’s and SVR’s for control |
| [54] |
|
| Easily implemented | Comparatively high due to usage of BESS | |
| [56] |
|
| Less | More as coordination is needed for multiple devices | High |
| [70] |
|
| More effective | Medium | Moderate and less when compared to individual operation in centralized methods. |
| [89] |
|
| Less effective as more trippings are adopted on methodology | Simple coordination | Moderate, may get high on usage based on network. |
| [64] |
|
| More effective | Simple and easily implemented | High |
| [76] |
|
| Medium | High as control is applied at both DG and Grid sides with limitations | Less compared to other methods. |
| [45] |
|
| More effective as Algorithm provides nearly 80% accurate results | Less | Less |
| [105] |
|
| Highly efficient | High | High |
| [92] |
|
| More effective | Moderate | Less |
© 2020 by the authors. Licensee MDPI, Basel, Switzerland. This article is an open access article distributed under the terms and conditions of the Creative Commons Attribution (CC BY) license (http://creativecommons.org/licenses/by/4.0/).
Share and Cite
MDPI and ACS Style
Aleem, S.A.; Hussain, S.M.S.; Ustun, T.S. A Review of Strategies to Increase PV Penetration Level in Smart Grids. Energies 2020, 13, 636. https://0-doi-org.brum.beds.ac.uk/10.3390/en13030636
AMA Style
Aleem SA, Hussain SMS, Ustun TS. A Review of Strategies to Increase PV Penetration Level in Smart Grids. Energies. 2020; 13(3):636. https://0-doi-org.brum.beds.ac.uk/10.3390/en13030636
Chicago/Turabian StyleAleem, Sk Abdul, S. M. Suhail Hussain, and Taha Selim Ustun. 2020. "A Review of Strategies to Increase PV Penetration Level in Smart Grids" Energies 13, no. 3: 636. https://0-doi-org.brum.beds.ac.uk/10.3390/en13030636
Note that from the first issue of 2016, this journal uses article numbers instead of page numbers. See further details here.