A Wind Electric-Driven Combined Heating, Cooling, and Electricity System for an Office Building in Two Italian Cities †


1
Dipartimento di Ingegneria, Università degli Studi del Sannio, Piazza Roma 21, 82100 Benevento, Italy
2
Dipartimento di Medicina e Scienze della Salute “Vincenzo Tiberio”, Università degli Studi del Molise, 86100 Campobasso, Italy
*
Author to whom correspondence should be addressed.
†
This paper is an extended version of our paper presented at the 14th Conference on Sustainable Development af Energy, Water and Environment Systems (SDEWES 2019), Dubrovnik, Croatia, 1–6 October 2019.
Energies 2020, 13(4), 895; https://0-doi-org.brum.beds.ac.uk/10.3390/en13040895
Submission received: 4 January 2020
/
Revised: 31 January 2020
/
Accepted: 6 February 2020
/
Published: 18 February 2020
(This article belongs to the Special Issue Selected Papers from SDEWES 2019 conferences on Sustainable Development of Energy, Water and Environment Systems)
Abstract
:Electric air-conditioning systems driven by electricity from a wind turbine can be defined as wind electric and cooling systems according to the definition of solar-activated air-conditioners. They can potentially contribute to reduce primary energy demand and CO2 emission in the civil sector. In this paper, mini wind turbines are considered coupled with a ground source heat pump in order to serve an office building for air-conditioning and supply the electricity surplus for the pure electric load of the user. Different plant configurations are considered. First of all, assessments with two kinds of wind turbines (5–5.5 kW), vertical and horizontal axis, are performed, also considering the coupling with one and two identical wind generators. Secondly, to better use on-site electricity, a parametric study is proposed taking into account different battery storage system sizes (3.2–9.6 kWh). Finally, the plant is simulated in two locations: Naples and Cagliari. Simulation results demonstrate that the source availability mainly affects the system performance. In Cagliari, the primary energy reduction per kWh of final energy demand (for pure electric load, space heating, and cooling) is equal to 1.24, 54.8% more than in Naples. In addition, the storage system limits the interaction with the power grid, lowering the exported electricity from about 50% to about 27% for Naples and from 63% to 50% for Cagliari. The fraction of the load met by renewable energy accounts for up to 25% for Naples and 48% for Cagliari.
1. Introduction
One of the main targets of the European Union is the reduction of fossil fuel use and greenhouse gas emissions related to electricity, space heating, cooling, and domestic hot water loads in the civil sector [1,2,3]. In total, 31.2% of the European finally energy demand in 2012, about 294.8 Mtoe, is attributable to residential and tertiary sectors heating and cooling needs [4]. In Italy, these two sectors required 39.3 Mtoe in the 2013 for air-conditioning, about 33.1% of the total final energy demand [5]. The use and the diffusion of plants exploiting renewable energy sources was considered in recent years as a means to cut down the primary energy requests and, thus, the fossil-fuel combustion. Currently, the most studied systems are solar thermal heating and cooling plants [6] or those based on electric heat pumps (EHP) or ground source heat pumps (GSHP) activated with electricity from photovoltaic panels or wind turbine. Among them, special attention could be paid to wind turbine-driven technologies. In fact, in the last few decades, the growth of wind generation was very significant with a total installed capacity of 22.4 GW and an overall production of 17.5 TWh [7], that represents 6% of global Italian electricity demand [7], and it appears that the on-site electricity use is negligible. The total power of wind plants installed and economically incentivized as of June 2017 with a nominal power lower than 200 kW was only 2% of the total (8760 kW), while the number of low-size plants accounts for 83.3% of the total. Looking at the installation trends, one notices that the number of plants with a rated power in the range 20–200 kW passed from just over 500 at the beginning of 2013 to over 2500 in June 2017, while those in the range 1–20 kW went from about 150 to about 620 installations [8]. The number of higher-size systems remained practically constant.
From this situation derives the central role that the electric-driven devices play in the on-site use of energy produced from renewable energy sources. In order to avoid the export of electricity surplus from distributed photovoltaic (PV) and wind turbine (WT) systems to the grid, it should be strengthened by the introduction of GSHP and the use of battery storage systems to reduce electricity exported to the grid. The first alternative was widely studied in the scientific community. The second type of solution, based on small-scale wind turbines, is not so diffused and analyzed.
With respect to the introduction of space cooling and heating systems activated by electricity available from wind turbines, some papers mostly focused on electric-driven heat pumps, while some also studied GSHP.
Cao et al. [9] considered the impact of a GSHP operating in Finnish and German climate conditions with the goal of realizing a zero-energy residential building. The heat pump can interact with both PV and WT plants, whose nominal power varied in the range 0–26 kW throughout the TRNSYS 17 (University of Wisconsin-Madison: Madison, WI, USA) simulation environment. The optimal mix of PV and WT for the net zero-energy cases took place when the PV electricity percentage achieved values of 20% and 60% under Finnish and German conditions, respectively.
Tu et al. [10] proposed an economic optimization of a renewable energy-based stand-alone electricity micro-grid serving a residential building located in Australia. The hybrid energy conversion system was also based on PV and WT systems. Both generators covered electric demand due to lighting, appliances, and air-conditioning of the building. The results raised from this study highlighted that load deferring is a cost-effective and non-disruptive method of a demand-side control management strategy to improve the relationship between residential electricity demand profiles and renewable generation profiles.
An energy, environmental, and exergo-economic analysis was proposed by Stanek et al. [11] to evaluate the contribution due to PV (3.5 kW) or WT (3 kW) systems providing electricity to drive an EHP that satsfies the space heating demand of a residential building located in Katowice (Poland). Three configurations based on the PV system only, the WT system only, and a mix of both technologies were considered. The results obtained using the methodology proposed by the authors led to an unfavorable effect on the exergetic efficiency of the system when introducing renewable-based electricity production systems, while there was a positive effect on the environmental impact aspect.
Leon-Vargas et al. [12] analyzed the effect of economic incentives on the introduction of small-scale wind (3.5 kW) and PV (1.7 kW) systems for a household in four urban locations of Colombia (Bogotà, Cúcuta, Manizales, and Pasto). The results highlighted that the PV-based system is an interesting option with a reasonable pay-back period, while the investment cost of the small-scale wind turbine system could not be amortized within its lifetime, even when including the economic incentives.
Vanhoudt et al. [13] described a lab test set-up to evaluate the potential of an EHP for demand response purposes. Thorough the lab, the authors emulated the operation of an EHP in a single residential building located in Belgium, served by either a PV system (7.7 kW) or a small-scale WT (5.8 kW). Different control strategies were implemented with respect to the activation of the EHP, leading to a peak shaving and an increase in on-site exploitation of the electricity available from conversion systems fed by renewable energy sources. Active control increased the supply (8–29%) and demand (5–25%) cover factors for each case analyzed.
The aim of the study reported by Nakomicic et al. [14] was to assess, by means of energy, environmental and economic parameters, the potentialities of the introduction of renewable energy sources for electricity and heat supply to a residential building in Serbia, through a cost-effectiveness study of the proposed system. The proposed system consisted of a GSHP for space heating/cooling, as well as a PV system (5 kW) and a small wind turbine (6 kW) for power supply. The analysis was conducted with the support of RETscreen software. The results showed that the best solution was to equip the system with PV panels.
Li et al. [15] proposed a parametric assessment to evaluate the probability of matching the load of a stand-alone system composed of a WT and an EHP for a detached single-family house in Stockholm, varying WT power and the battery storage capacity. They found that increasing the battery size always led to better results; however, with an increase in wind generator size, the situation was different due to the different start-up speeds.
In subsequent analyses [16], a WT–EHP system configured as described before was modeled and dynamically simulated with the software TRNSYS; in addition to the considerations reported before, the effect of the setpoint temperature was also taken into account. It was highlighted that a higher setpoint temperature resulted in a higher loss of thermal comfort probability. In addition, it was also found that the time interval used in the dynamic simulation had a significant influence on the result. For example, with a 10 kW WT system and a battery bank of 20 kWh, the loss of load probability could reduce from 59.9% (no battery) to 35.8%; these percentages became 49.4% and 36.4% upon changing the time step from 1 min to 1 h.
In the work of Dursun and Kilic [17], a hybrid stand-alone system consisting of a 0.8 kW PV field, a 1 kW wind generator, and a backup 2 kW fuel cell was considered. The application of the proposed system was for a two-person family load (the most important part was the air-conditioning load equal to 2.8 kWh per day), with the aim of identifying the best management strategy, while also introducing a battery bank.
Reference [18] evaluated the coupling of a WT system with an absorption/compression heat pump. During the summer period, the wind generator supplied about 75% of the energy demand.
Ozener experimentally studied a solar-assisted geothermal heat pump combined with a 1.5 kW WT to satisfy the thermal load of a 12.54 m2 greenhouse [19]. Only 3.13% of the total electric energy consumption was supplied by the WT; therefore, he concluded that this renewable-based system could be economically preferable to conventional greenhouse heating applications if it was installed in a region with good wind resources. This result could also be extended to residential buildings.
A hybrid trigeneration system for heating, cooling, and electricity production was analyzed in Reference [20]. The system was composed of PV modules, wind generators, and a storage battery, and it was employed to power an electric heat pump, an electric vehicle charging station, and the building electric devices. The study was finalized to assess the reliability of the plant on a weekly and yearly basis.
Roselli et al. [21] analyzed, on an energy and environmental basis, the impact of different WT plants on an office building located in southern Italy.
The literature survey shows that existing works dealt with simulative or on-site analysis of WT-based systems satisfying the space heating and cooling load using EHP or a GSHP. The analysis, limited only to residential applications considering single-family and multi-family houses located in different countries, along with two cases concerning a greenhouse and an office building, demonstrates that these applications are not so numerous. This paper reports the analysis of a GSHP–WT-based system evaluating the impact on the electric grid, in terms of on-site used electricity, due to the introduction of electric energy storage. The assessment was performed for one year, considering the energy, environmental, and economic aspects of a renewable activated system, consisting of one or two WTs driving a GSHP to meet the electric, space heating, and cooling loads of an office building located in two Italian cities. The possibility of installing an electric storage system was also estimated, with the purpose of lowering the amount of electric energy fed into the grid. By limiting the interaction of the renewable-based system with the national electric grid, positive effects are induced in the whole system; thus, it is desirable to support the diffusion of plants with a high level of on-site energy consumption. In order to verify the effects of this last point, the paper proposes a sensitivity study to assess the effect of both WT and battery storage capacity. A novel performance index is introduced to compare absolute primary energy savings due to the proposed system with respect to the conventional system and final energy demand (no HVAC electricity, space heating, and cooling) of the end-user.
2. User and Building Description
The users considered in this work, 13 working persons, occupied a 200 m2 single-floor office building with a flat roof. The building envelope characteristics are listed in Table 1. The office was occupied in the morning (9:00–13:00) and in the afternoon (14:00–18:00) on weekdays, while it was closed on weekends. The users contributed to the heat gain with their activity, which consisted of very light writing in a seated position [22]. The building and the plants were evaluated in two cities: Naples (40°50′ north (N), 14°15′ east (E)) and Cagliari (39°13′ N, 9°07′ E), both belonging to climatic zone C with 1034 and 990 heating degree-days.
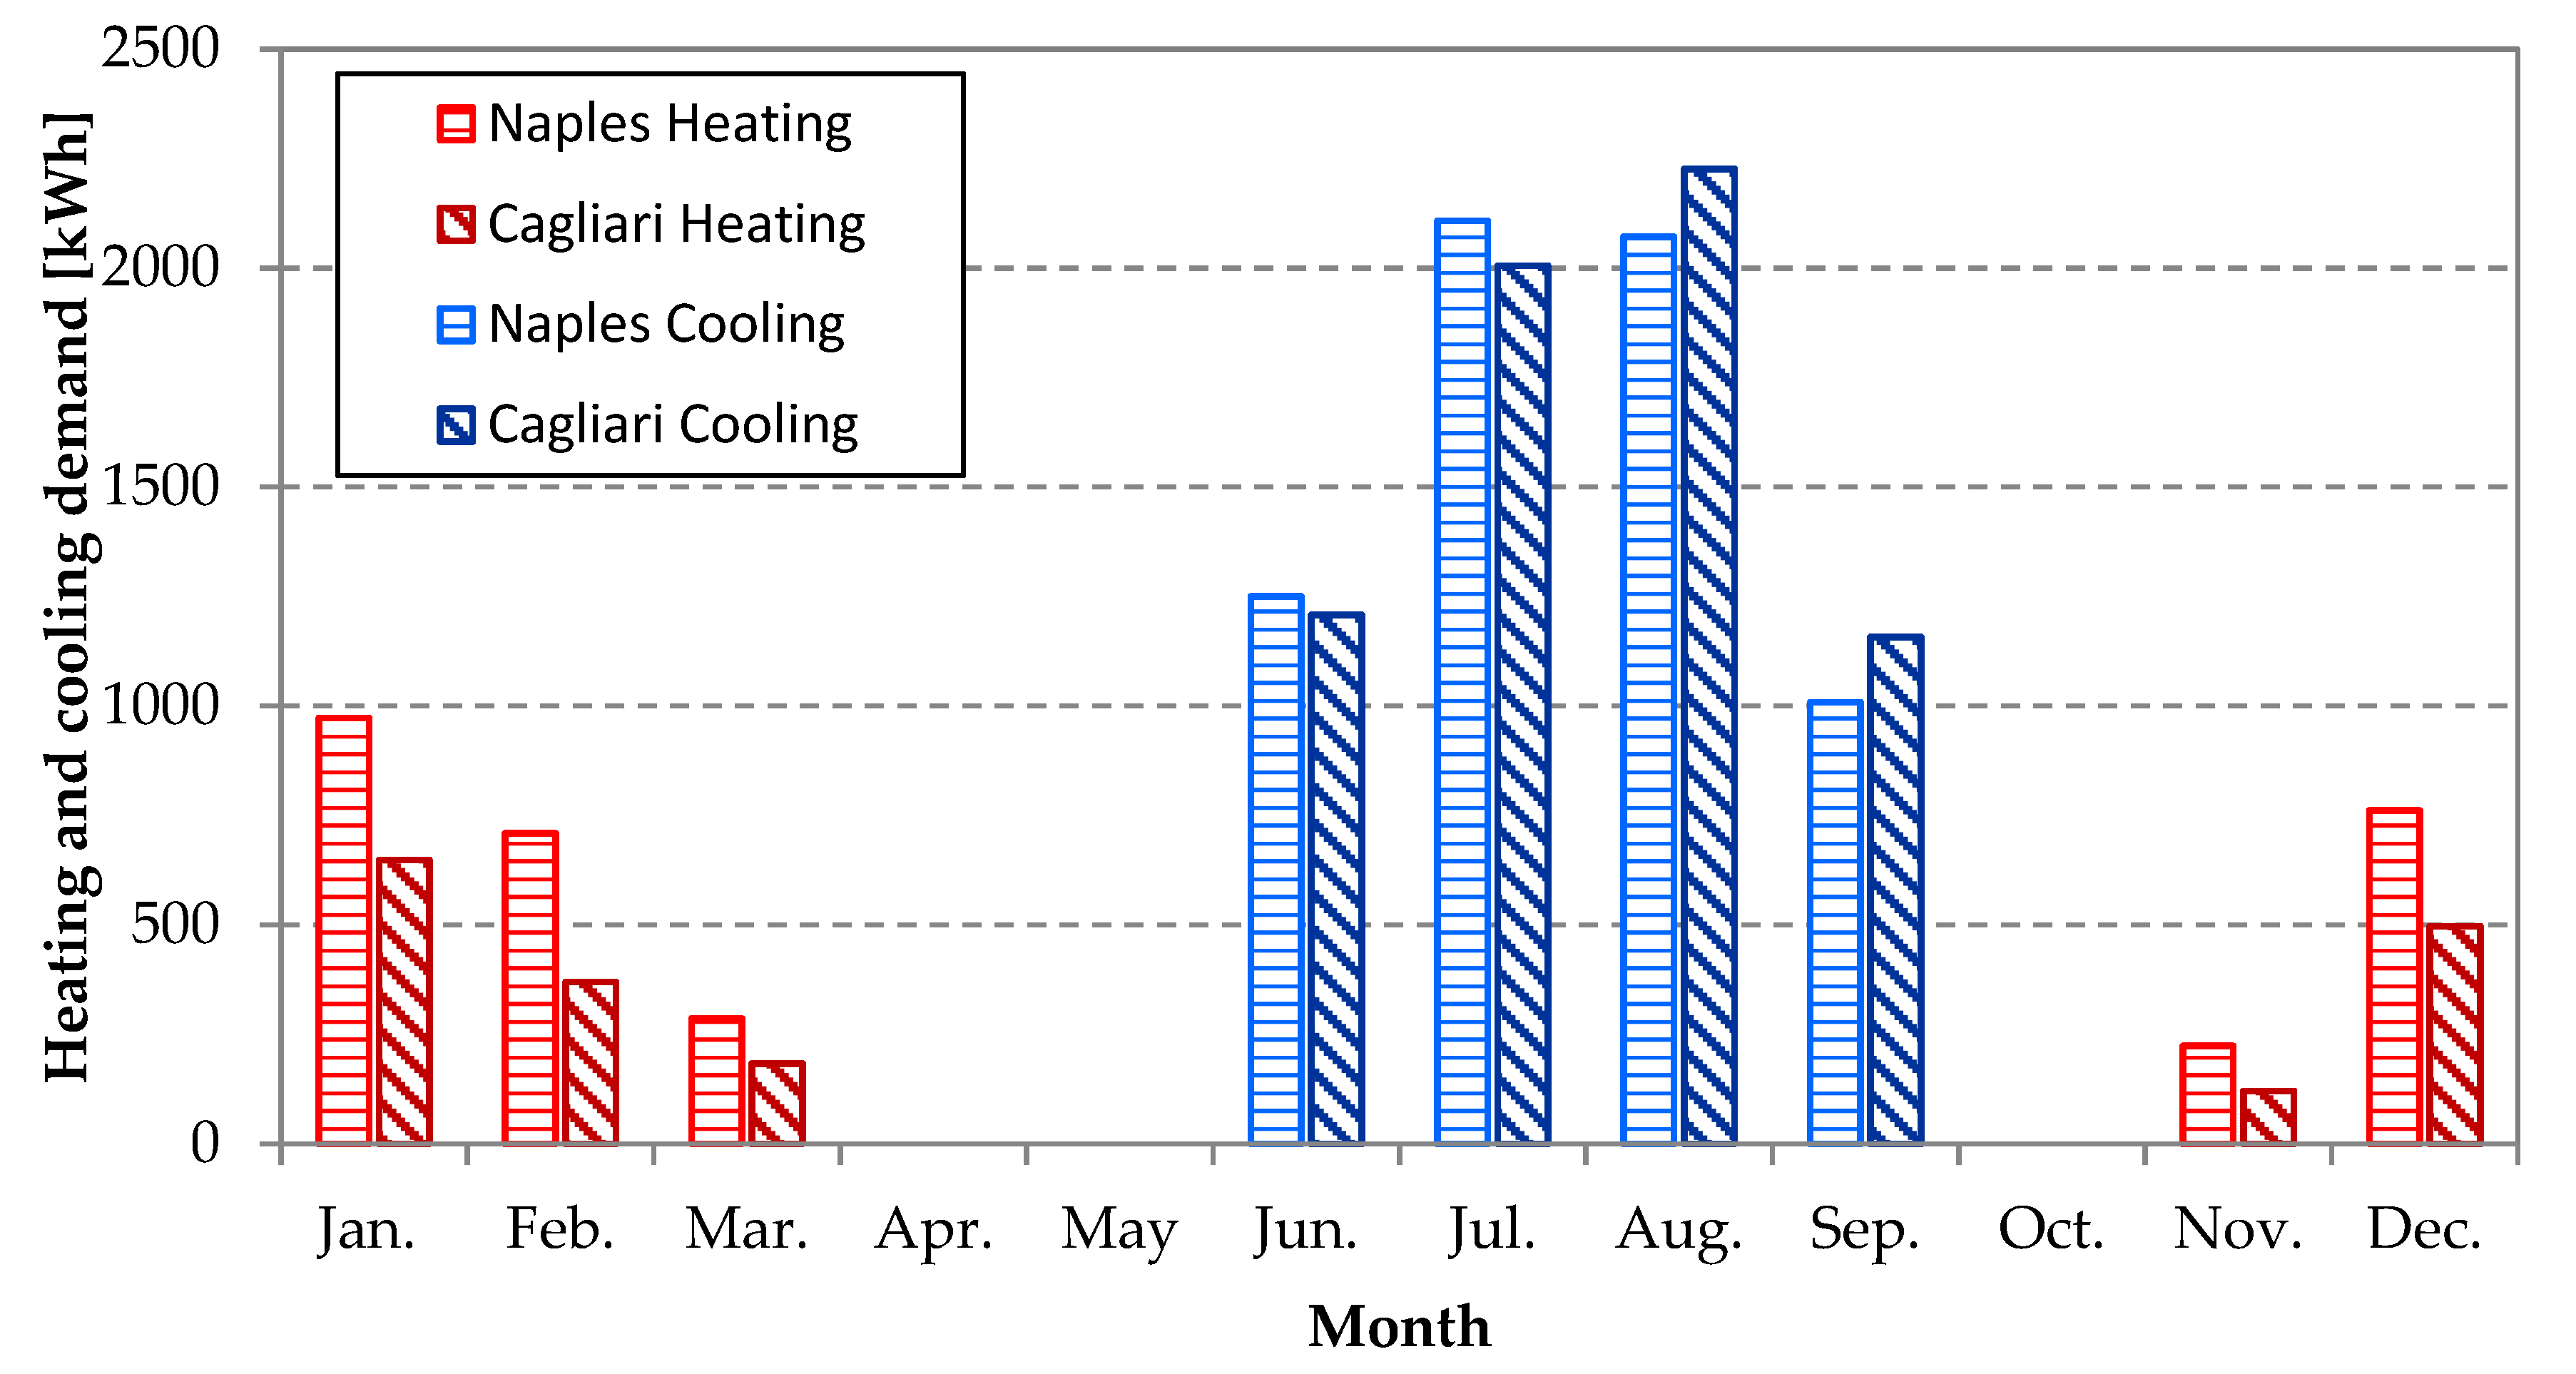
The heating season was assumed based on climatic zone C, according to the Italian legislation [23], from November 15th to March 31st, while the months of June, July, August, and September were taken into account as the cooling period. In these periods, the air-conditioning systems operated between 8:00 and 18:00 on a working day, while, on weekends, they were turned off. The indoor air set-point temperatures were 20.0 ± 0.5 °C and 26.0 ± 0.5 °C during working hours in the heating and cooling seasons, respectively. In Figure 1, heating and cooling monthly loads, evaluated by means of dynamic simulations, are shown for the two locations. These values also take into account the internal gains due to (persons, lights, office equipment, etc.) and those related to air infiltration and ventilation contributions. A mechanical ventilation system was considered for the building requiring about 312 kWh of electricity per year for Naples. Space heating and cooling demands in Naples were 2953 kWh and 6438 kWh, respectively, while, in Cagliari, they were 1818 kWh and 6597 kWh. The domestic hot water demand was not considered in the evaluation of the heat loads.
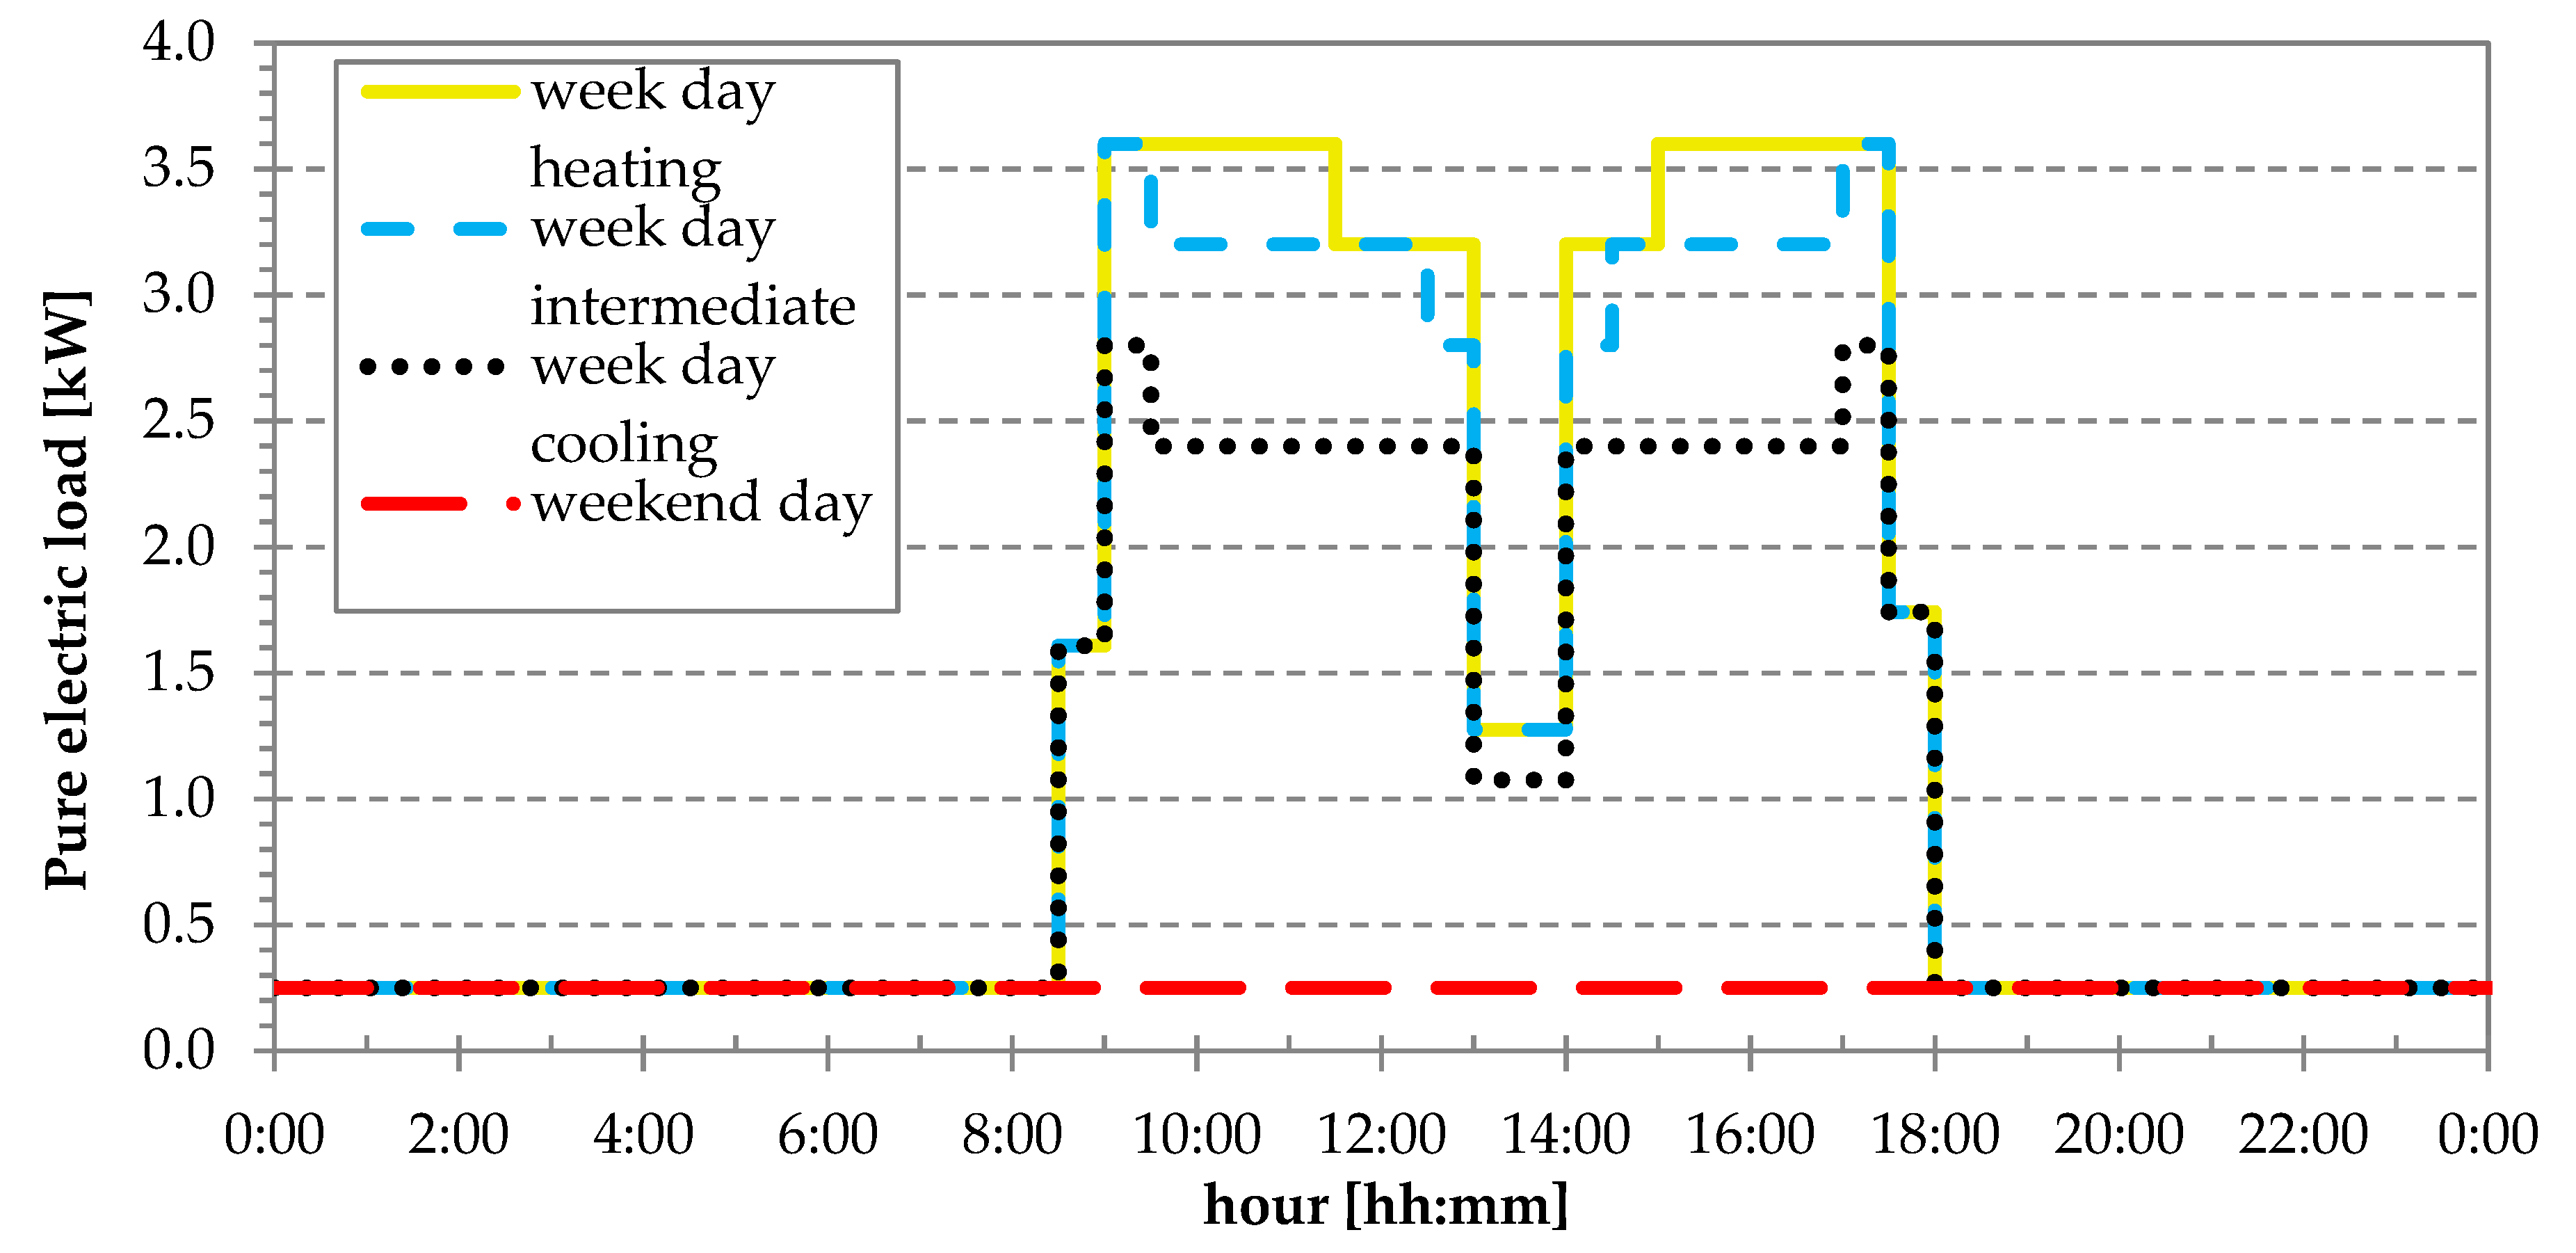
The pure electric load, excluding HVAC (heating, ventilation, and air-conditioning load), considered small power equipment available in the buildings (personal computers (PCs), monitors, printers, etc.) and artificial lights, with these contributions assumed equal to 29.64 kWh/m2 and 11.74 kWh/m2 per year, respectively, according to an on-site analysis of electricity required by office buildings [24]. The daily profiles of the pure electricity demand of the office for weekdays in the heating, intermediate, and cooling seasons and that for weekends are reported in Figure 2.
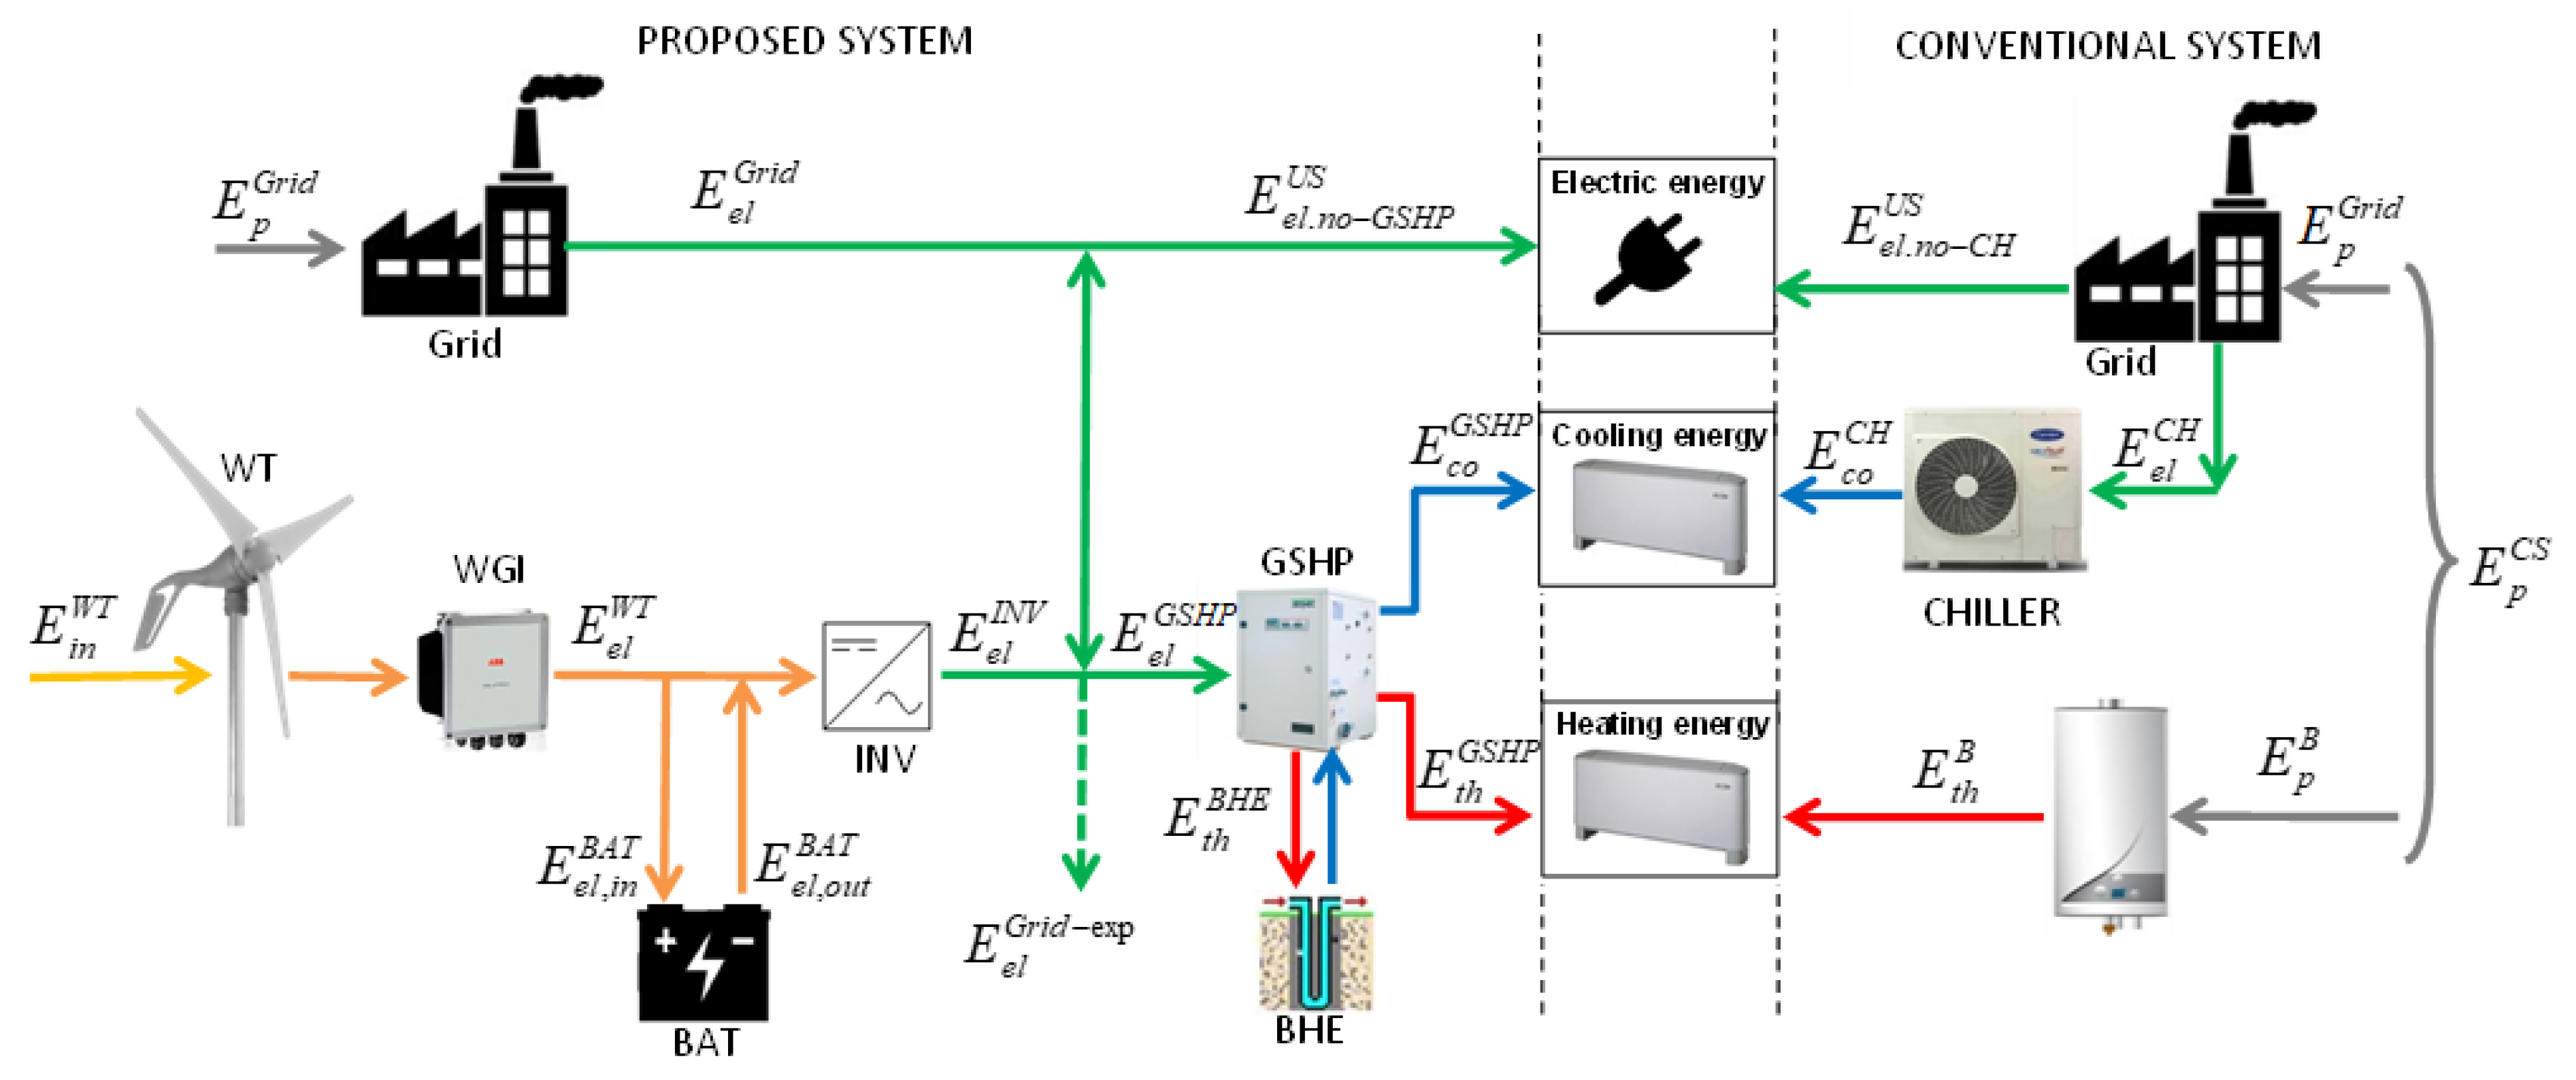
3. Proposed and Conventional System Configurations and Components
Hereinafter, the proposed (PS) and conventional systems (CS) are compared. The first system consisted of the following:
- ▪
- ▪
- A wind generator interface or rectifier (WGI), which, together with the inverter (INV), was used to adjust the frequency of the generated electricity to that of the grid;
- ▪
- A battery storage unit (BAT), which is considered with different sizes (3.2 kWh, 6.4 kWh, 9.6 kWh), allowed increasing the use of the renewable-generated electricity on-site. Its charging efficiency was equal to 94.0% and its depth of discharge was 90.0% [27];
- ▪
- ▪
- A borehole heat exchanger (BHE) was the heat source and sink with which the GSHP interacted.
Two different kinds of inverters were considered for the analyzed WT systems [29]. Their efficiency indexes were respectively equal to 97.0% (5–5.5 kW) and 98.0% (10–11 kW). These devices also established if the electricity from the WT was directly supplied to the end user, sent to the storage system, or fed into the grid. The latter circumstance took place when there was a surplus of production with respect to the demand and the battery was fully charged.
The borefield was sized in agreement with the ASHRAE methodology [30], considering a normal rocky soil. The assumptions considered for the borehole evaluation are reported in Table 3.
The assessment resulted in a borehole total length of 270 m, which was divided into three blocks of 90 m spaced 6 m apart.
The CS, which represented the most widespread energy conversion system used to meet heating, cooling, and electricity demands of an office user, was composed of the following:
- ▪
- A natural gas-fueled non-condensing 24.0 kW boiler (B), which had a rated thermal efficiency, , equal to 90.2% and was adopted to satisfy the heating load;
- ▪
- An electric-driven 13.3 kW chiller (CH), which had a rated energy efficiency ratio (EER) equal to 3.0 and was used to meet cooling demand;
- ▪
- The national power grid, which supplied electric energy to the end user (CH, lighting, etc.), achieved an electric efficiency () of 71.0%, considering the contributions of thermo-electric power plants, renewable-based systems, and the losses of the transmission and distribution grid [7].
A scheme of the CS and PS with highlighted energy flows is shown in Figure 3.
4. Model Description
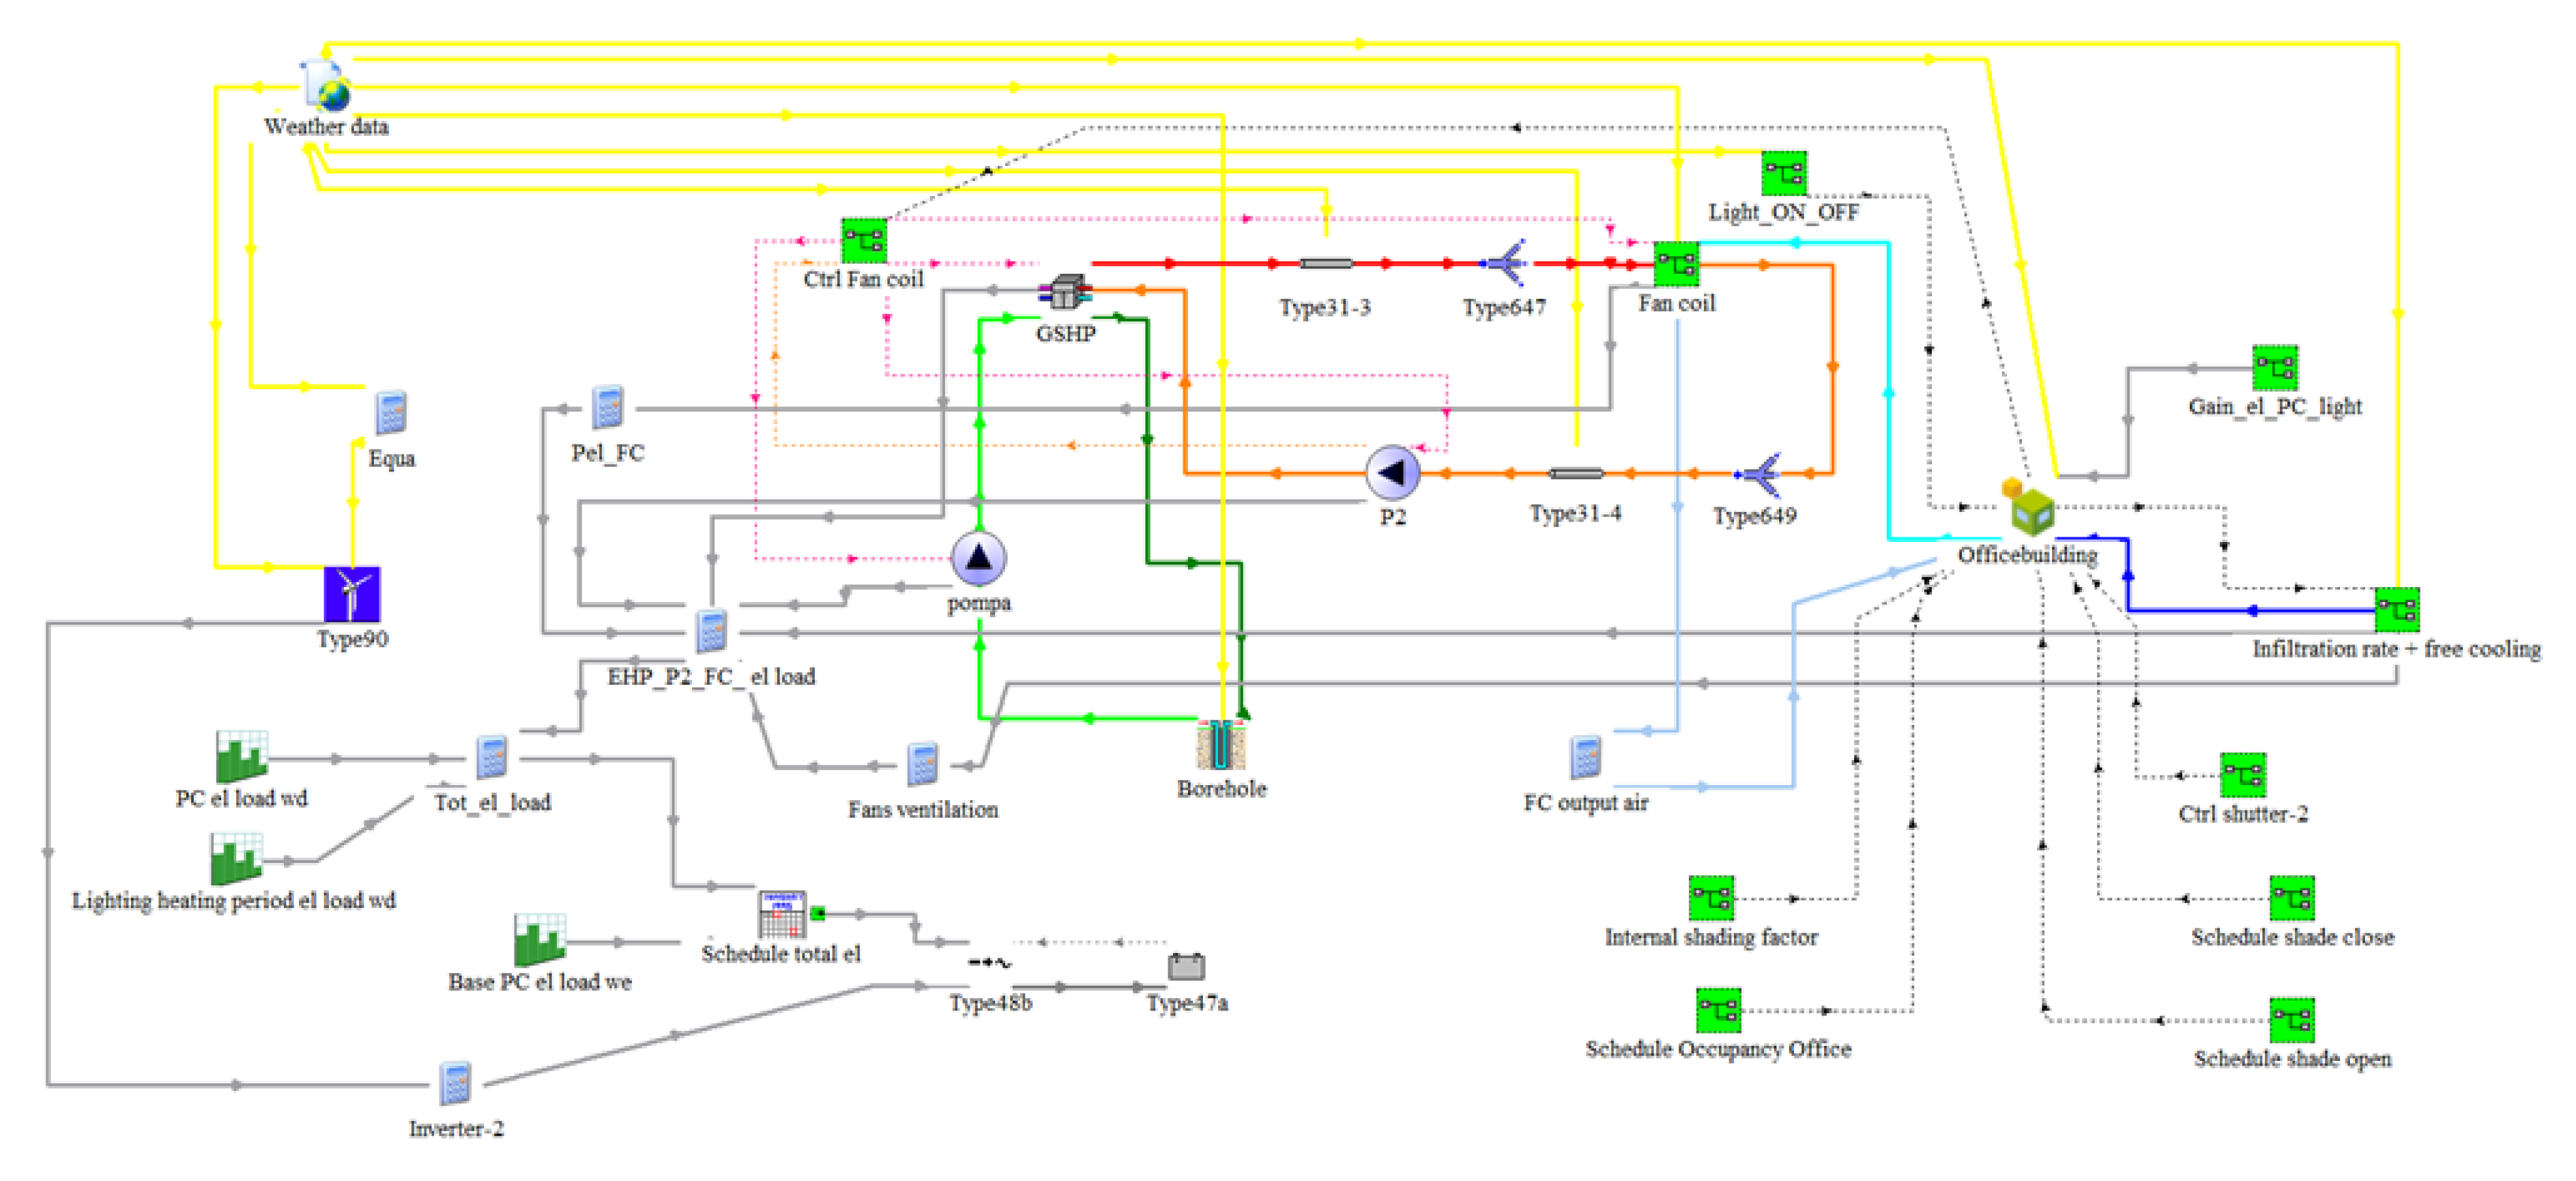
The simulation of the energy flows in the conventional and proposed systems was performed with TRNSYS software [31]. This simulation platform is widely used all over the world by researchers to carry out non-stationary simulations of complex energy conversion systems interacting with a building. The elementary components of TRNSYS, called “types”, are available in the standard [31] and TESS libraries [32]; they are subroutines incorporated in the software, which, when connected opportunely, can represent a specific building–plant system. The models introduced in this work are briefly listed in Table 4. The wind turbine was modeled with the type 90 subroutine, which allowed assessing the wind energy conversion system into electric power as a function of the wind velocity. The battery storage system and its charge controller were modeled by the type 47 subroutine. The power from the WT was stored if it exceeded the load demand and the battery was not fully charged. The inverter was represented by type 48, which considered both the electricity required in the office and that available from the WT system to establish the energy exchanges with the battery and the power grid. GSHP and CH were modeled by type 927 and type 655, respectively, which included a performance map of the devices. A simplified subroutine, type 6, was adopted for the non-condensing natural gas-fired boiler, which referred to a fixed thermal efficiency. The thermal interactions with the ground of the U-tube BHE were simulated by type 557. Finally, the thermal behavior of the different thermal zones of the building was simulated by type 56. The fan coils were modeled using type 928, which represents an air-to-water heat exchanger in both the heating and the cooling operation [33]. Figure 4 reports a scheme of the TRNSYS project considered for the evaluation of the renewable-based system.
5. Methodology
The analysis of the results started with the evaluation of the electric energy flows in the WT-based systems in order to have an idea about the energy production, the load, their simultaneity, and the benefits of introducing a battery storage system.
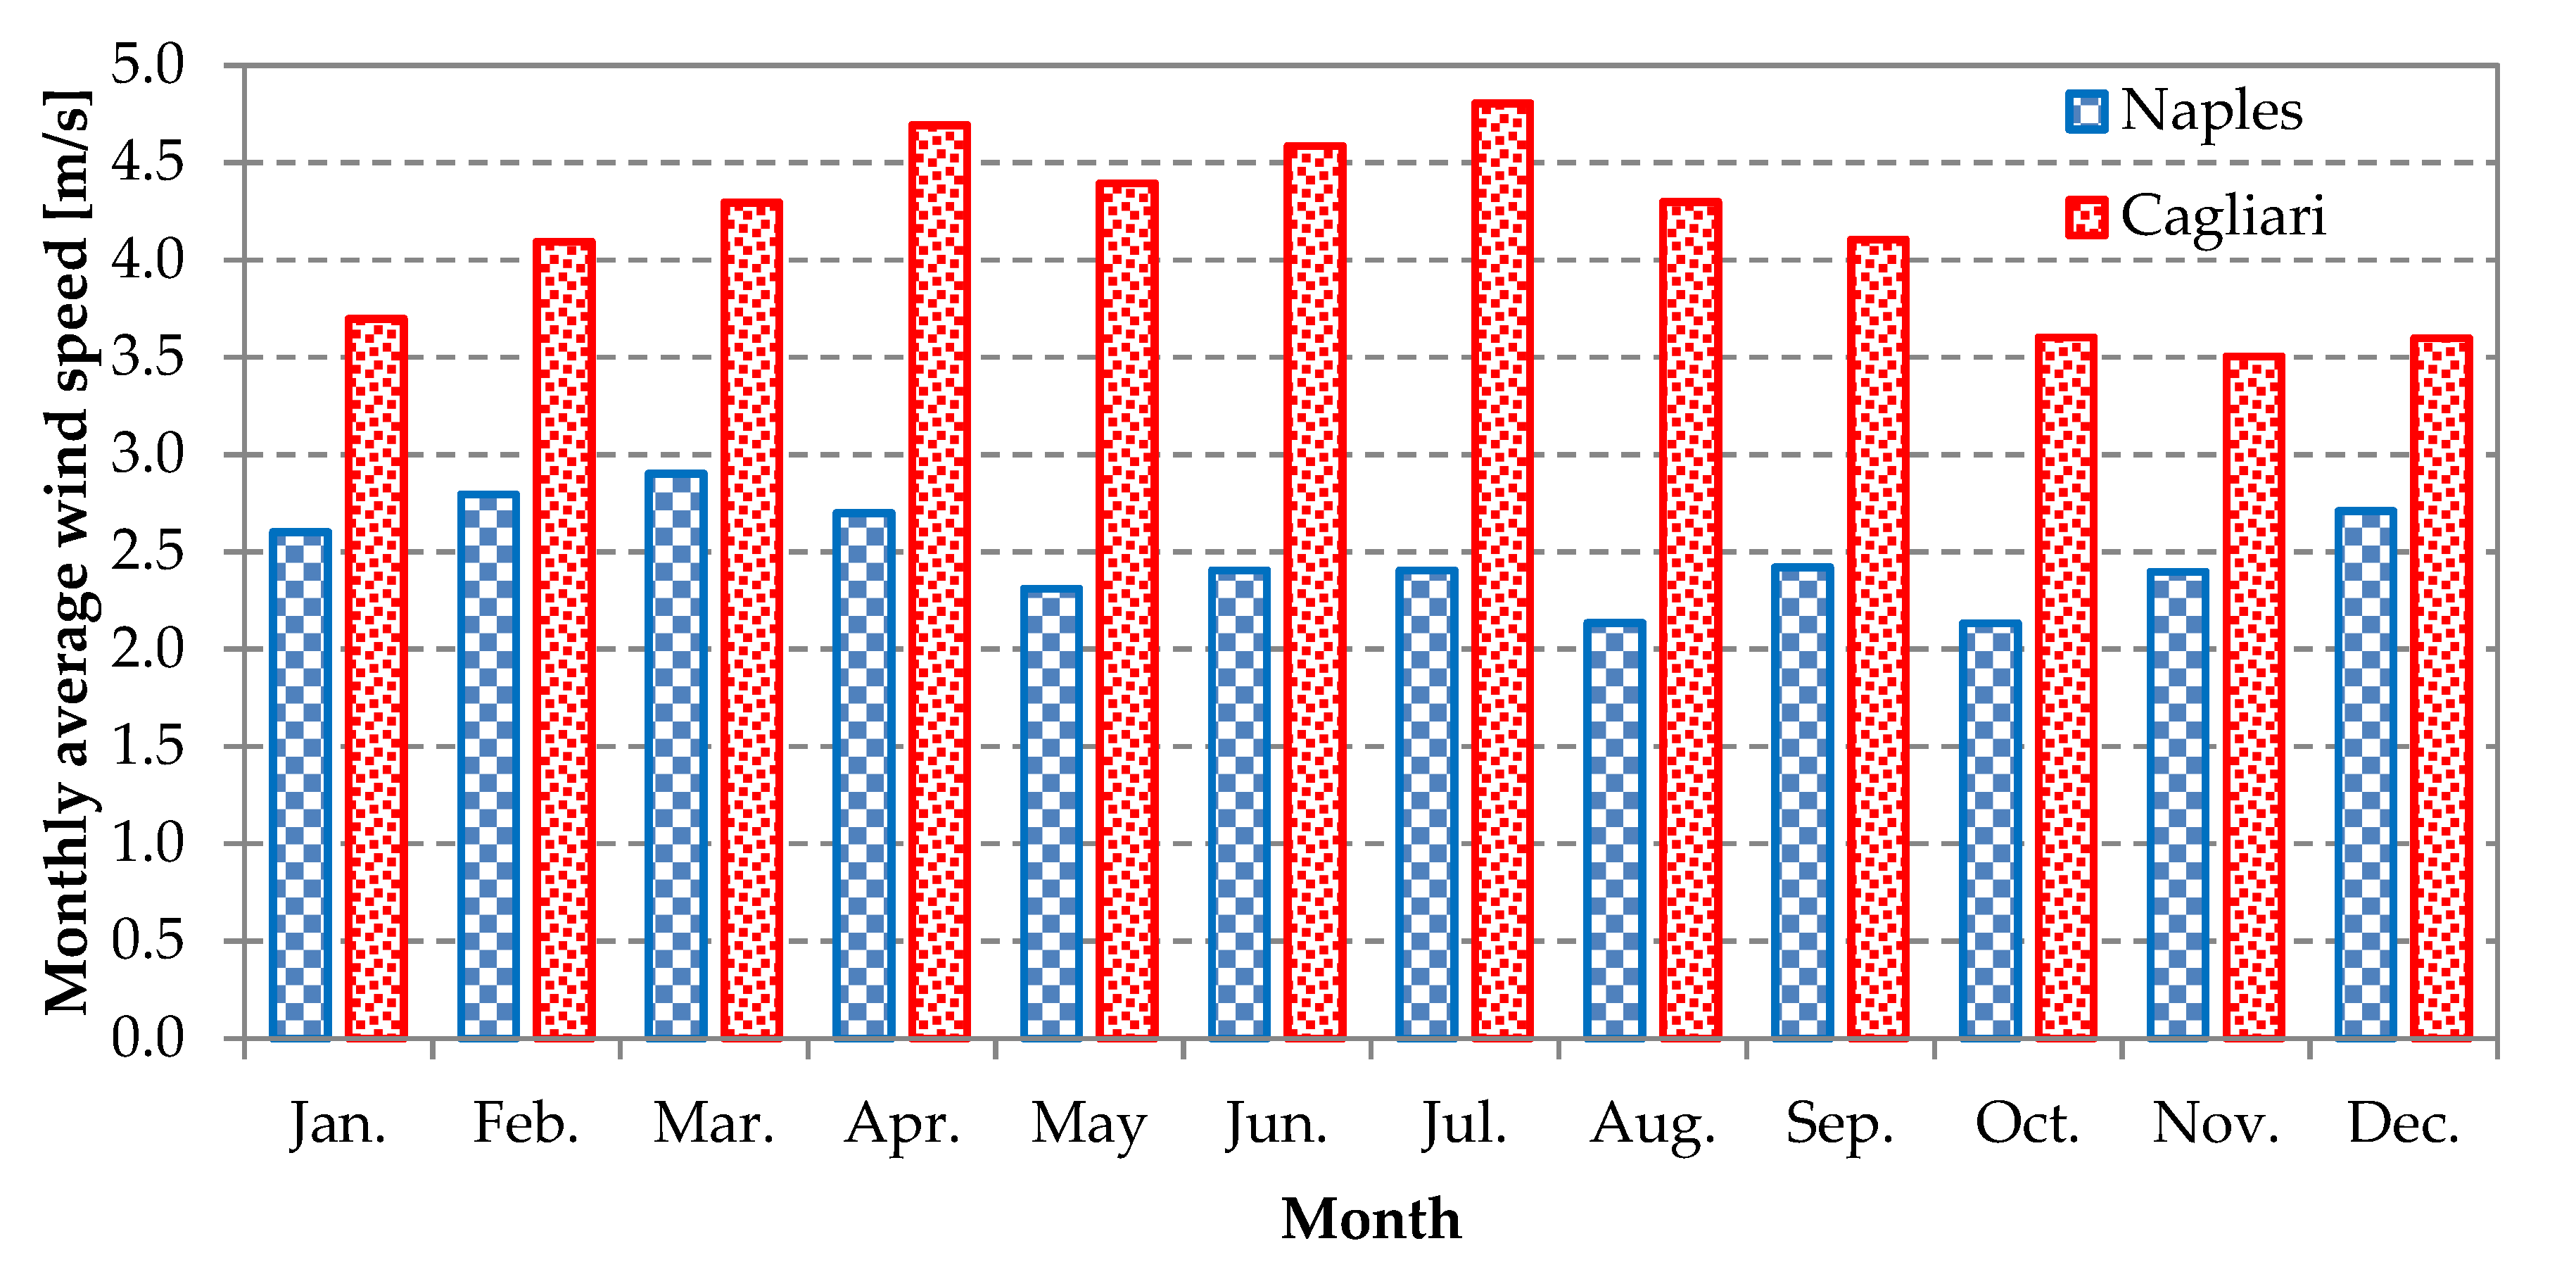
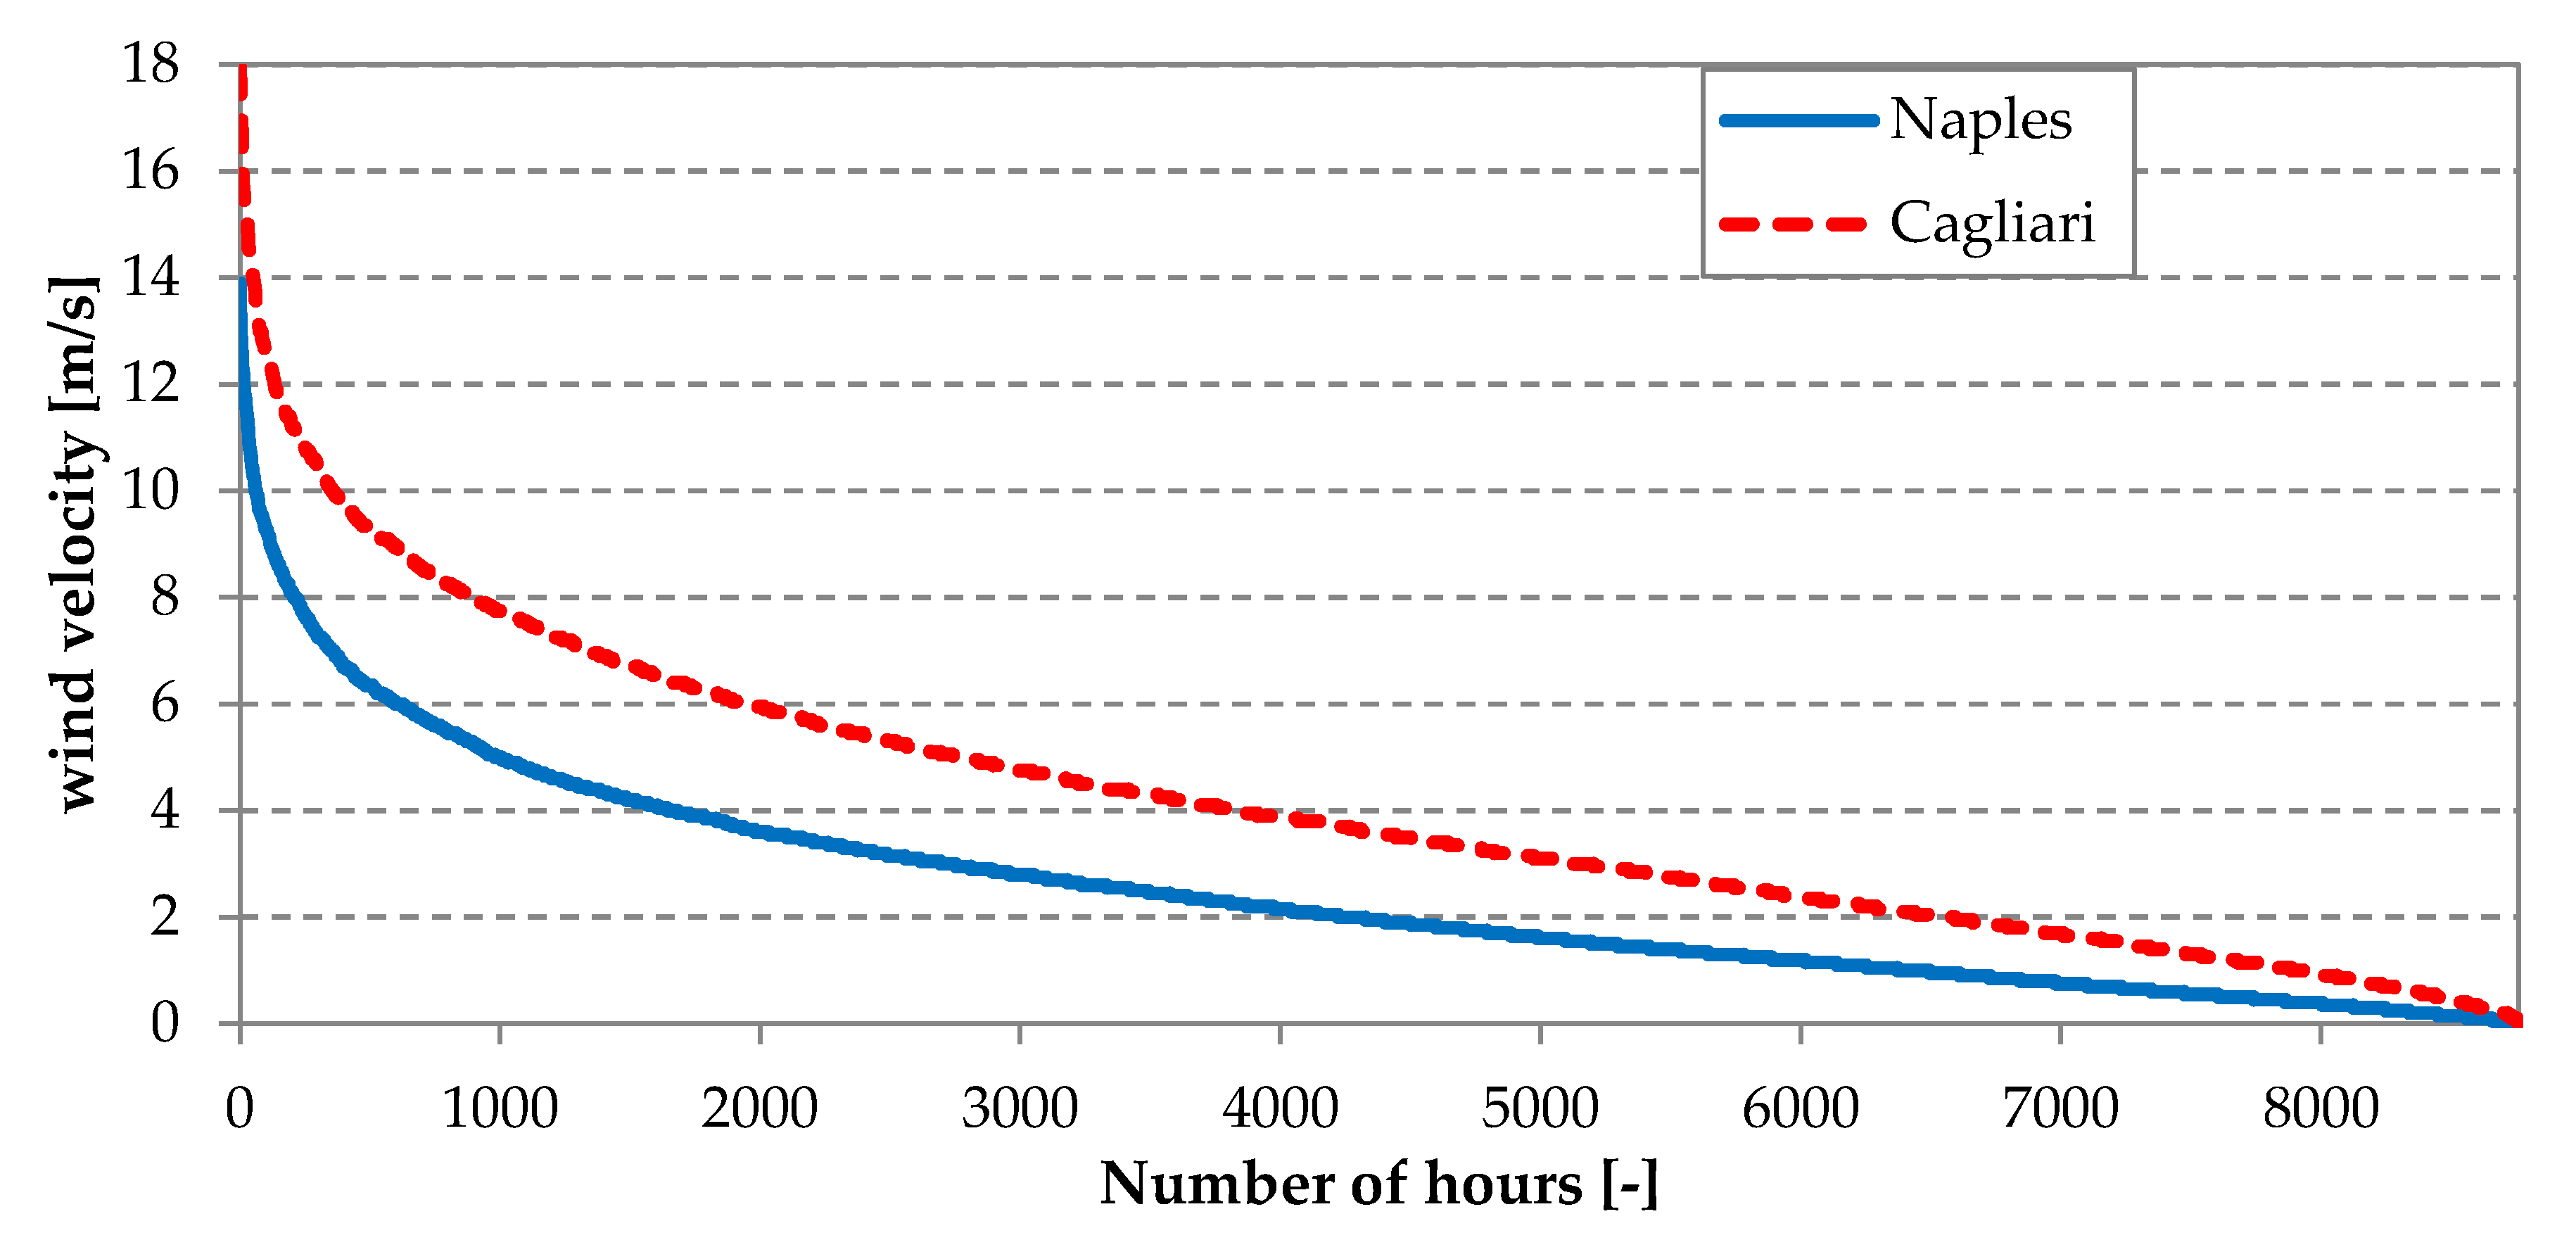
Then, a comparison between the PS and CS was performed on an energy and environmental basis. The energy and environmental analysis indexes referred to the user energy demands (for heating, cooling, and electric load) in order to make a comparison between both the conventional and the proposed system, as well as between the same system in different places. Cagliari and Naples, even if in the same climatic zone, are characterized by a similar cooling energy demand (about 6500 kWh) but a very different heating demand (see Section 2). This is mainly due to the temperature differences in the two cities. The Energy Plus Weather data files (in the standard format .epw [34]), with which the simulations were performed, showed certain differences in the winter temperatures. Figure 5 reports the average outdoor temperature on a monthly basis for both Naples and Cagliari; it can be seen that, during the summer period, the temperatures were very similar in the two cities, whereas Cagliari was warmer than Naples in the winter season. Further differences concern the availability of the renewable energy source. Looking at the monthly average wind velocity depicted in Figure 6, it is clear that the availability of wind resources was greater in Cagliari than in Naples. By processing the instantaneous wind speed data and arranging them in descending order, as shown in Figure 7, it is observed that, in Cagliari, the maximum wind speed was higher than in Naples, and regardless of the speed value selected, a speed greater than or equal to that was recorded for more hours in Cagliari than in Naples.
The energy performance parameter represents the ratio between the primary energy savings of PS () with respect to CS () and the total user energy demand (); therefore, it is called primary energy saving per unit load (PESPUL), and it is defined in Equation (8).
considering i = 1 (heating season), 2 (cooling season), and 3 (intermediate season).
The primary energy of the CS, as shown in Equation (9), was due to the electric energy feeding the chiller, , the pure electric load (artificial lighting, office equipment, etc.), , and the thermal energy covered by the natural gas boiler, , and it was a function of the reference efficiencies of CS devices (, ). A further equation could be considered for PS, even if it was function of the electricity taken from () and fed into () the grid, highlighting that the last term was assumed as an energy credit when the primary energy was calculated.
The environmental analysis was based on the evaluation of the CO2 emission reduction between CS () and PS () per each kWh of end user energy demand (). The index, called CO2 emission reduction per unit load (CO2RPUL), is defined in Equation (12).
considering i = 1 (heating season), 2 (cooling season), and 3 (intermediate season).
In order to assess the amount of CO2 released in the atmosphere by each system, the following two emission factors were necessary:
- ▪
- β, which concerns the combustion of natural gas, was equal to 0.205 kg of CO2 for every kWh of primary energy related to the fuel;
- ▪
- α, which concerns the electric energy, was equal to 0.356 kg CO2 for every kWh of electricity taken from the power grid. This value took into account the average CO2 emissions linked to the mix of the Italian thermo-electric power plants fueled by fossil fuels and the renewable-activated plants, while also including the transmission and distribution losses [35,36].
CO2 emissions that depend on electricity feeding the grid () were considered as a “credit” in the evaluation of CO2 for the PS.
The economic analysis was performed by introducing operating (OC) and investment costs (IC) for both the proposed and the conventional system. In particular, the operating costs are defined in Equations (15) and (16).
where
where the unitary cost for electricity drawn from the grid, cu,el, was considered equal to 0.22 €/kWh, while the unitary value of electricity delivered to power grid, vu,el, was 0.12 €/kWh. The natural gas used to fuel the boiler of the conventional system had a specific cost of 0.88 €/Nm3. The difference in operating costs is defined in Equation (18).
With respect to the economic analysis, the investment cost due to a WT with a horizontal axis (1 HAWT) was 36,500 € [37]. The following investment costs could be considered for the economic analysis [38]:
- A unitary cost of 625 € per kWh for the electricity storage;
- A first cost for GSHP of 7520 €;
- A cost for drilling and installation of the vertical borehole heat exchanger, including a water–glycol mixture, equal to 14,400 €.
6. Analysis of the Energy Results of the Proposed System
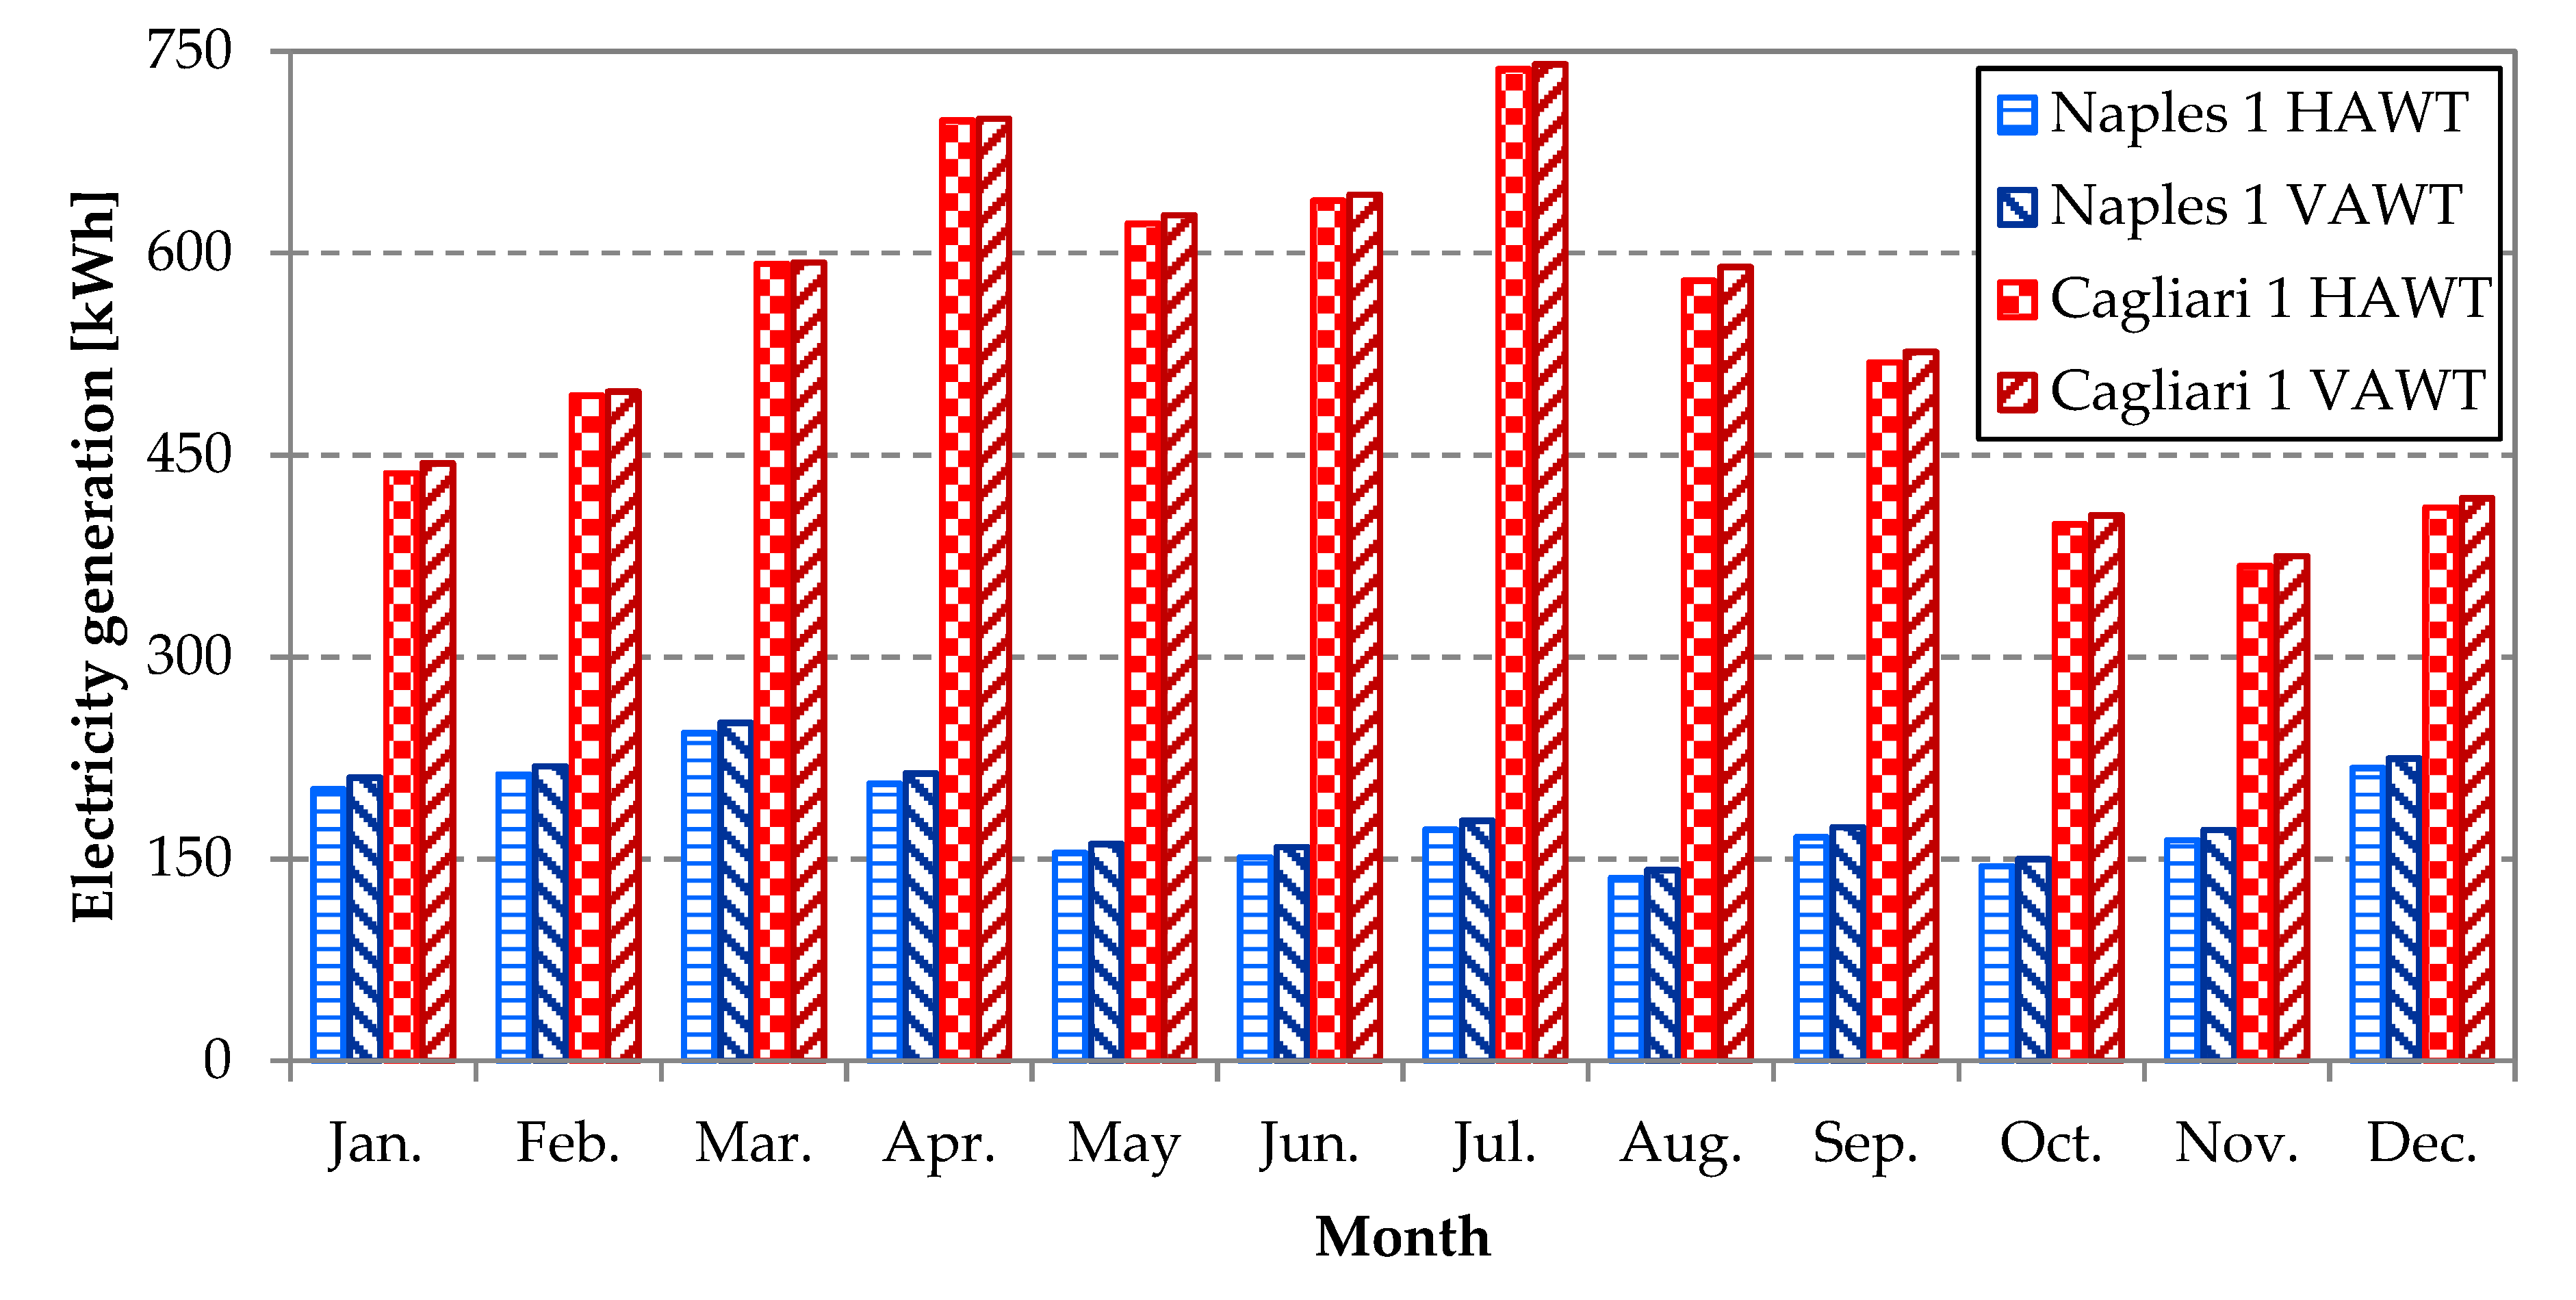
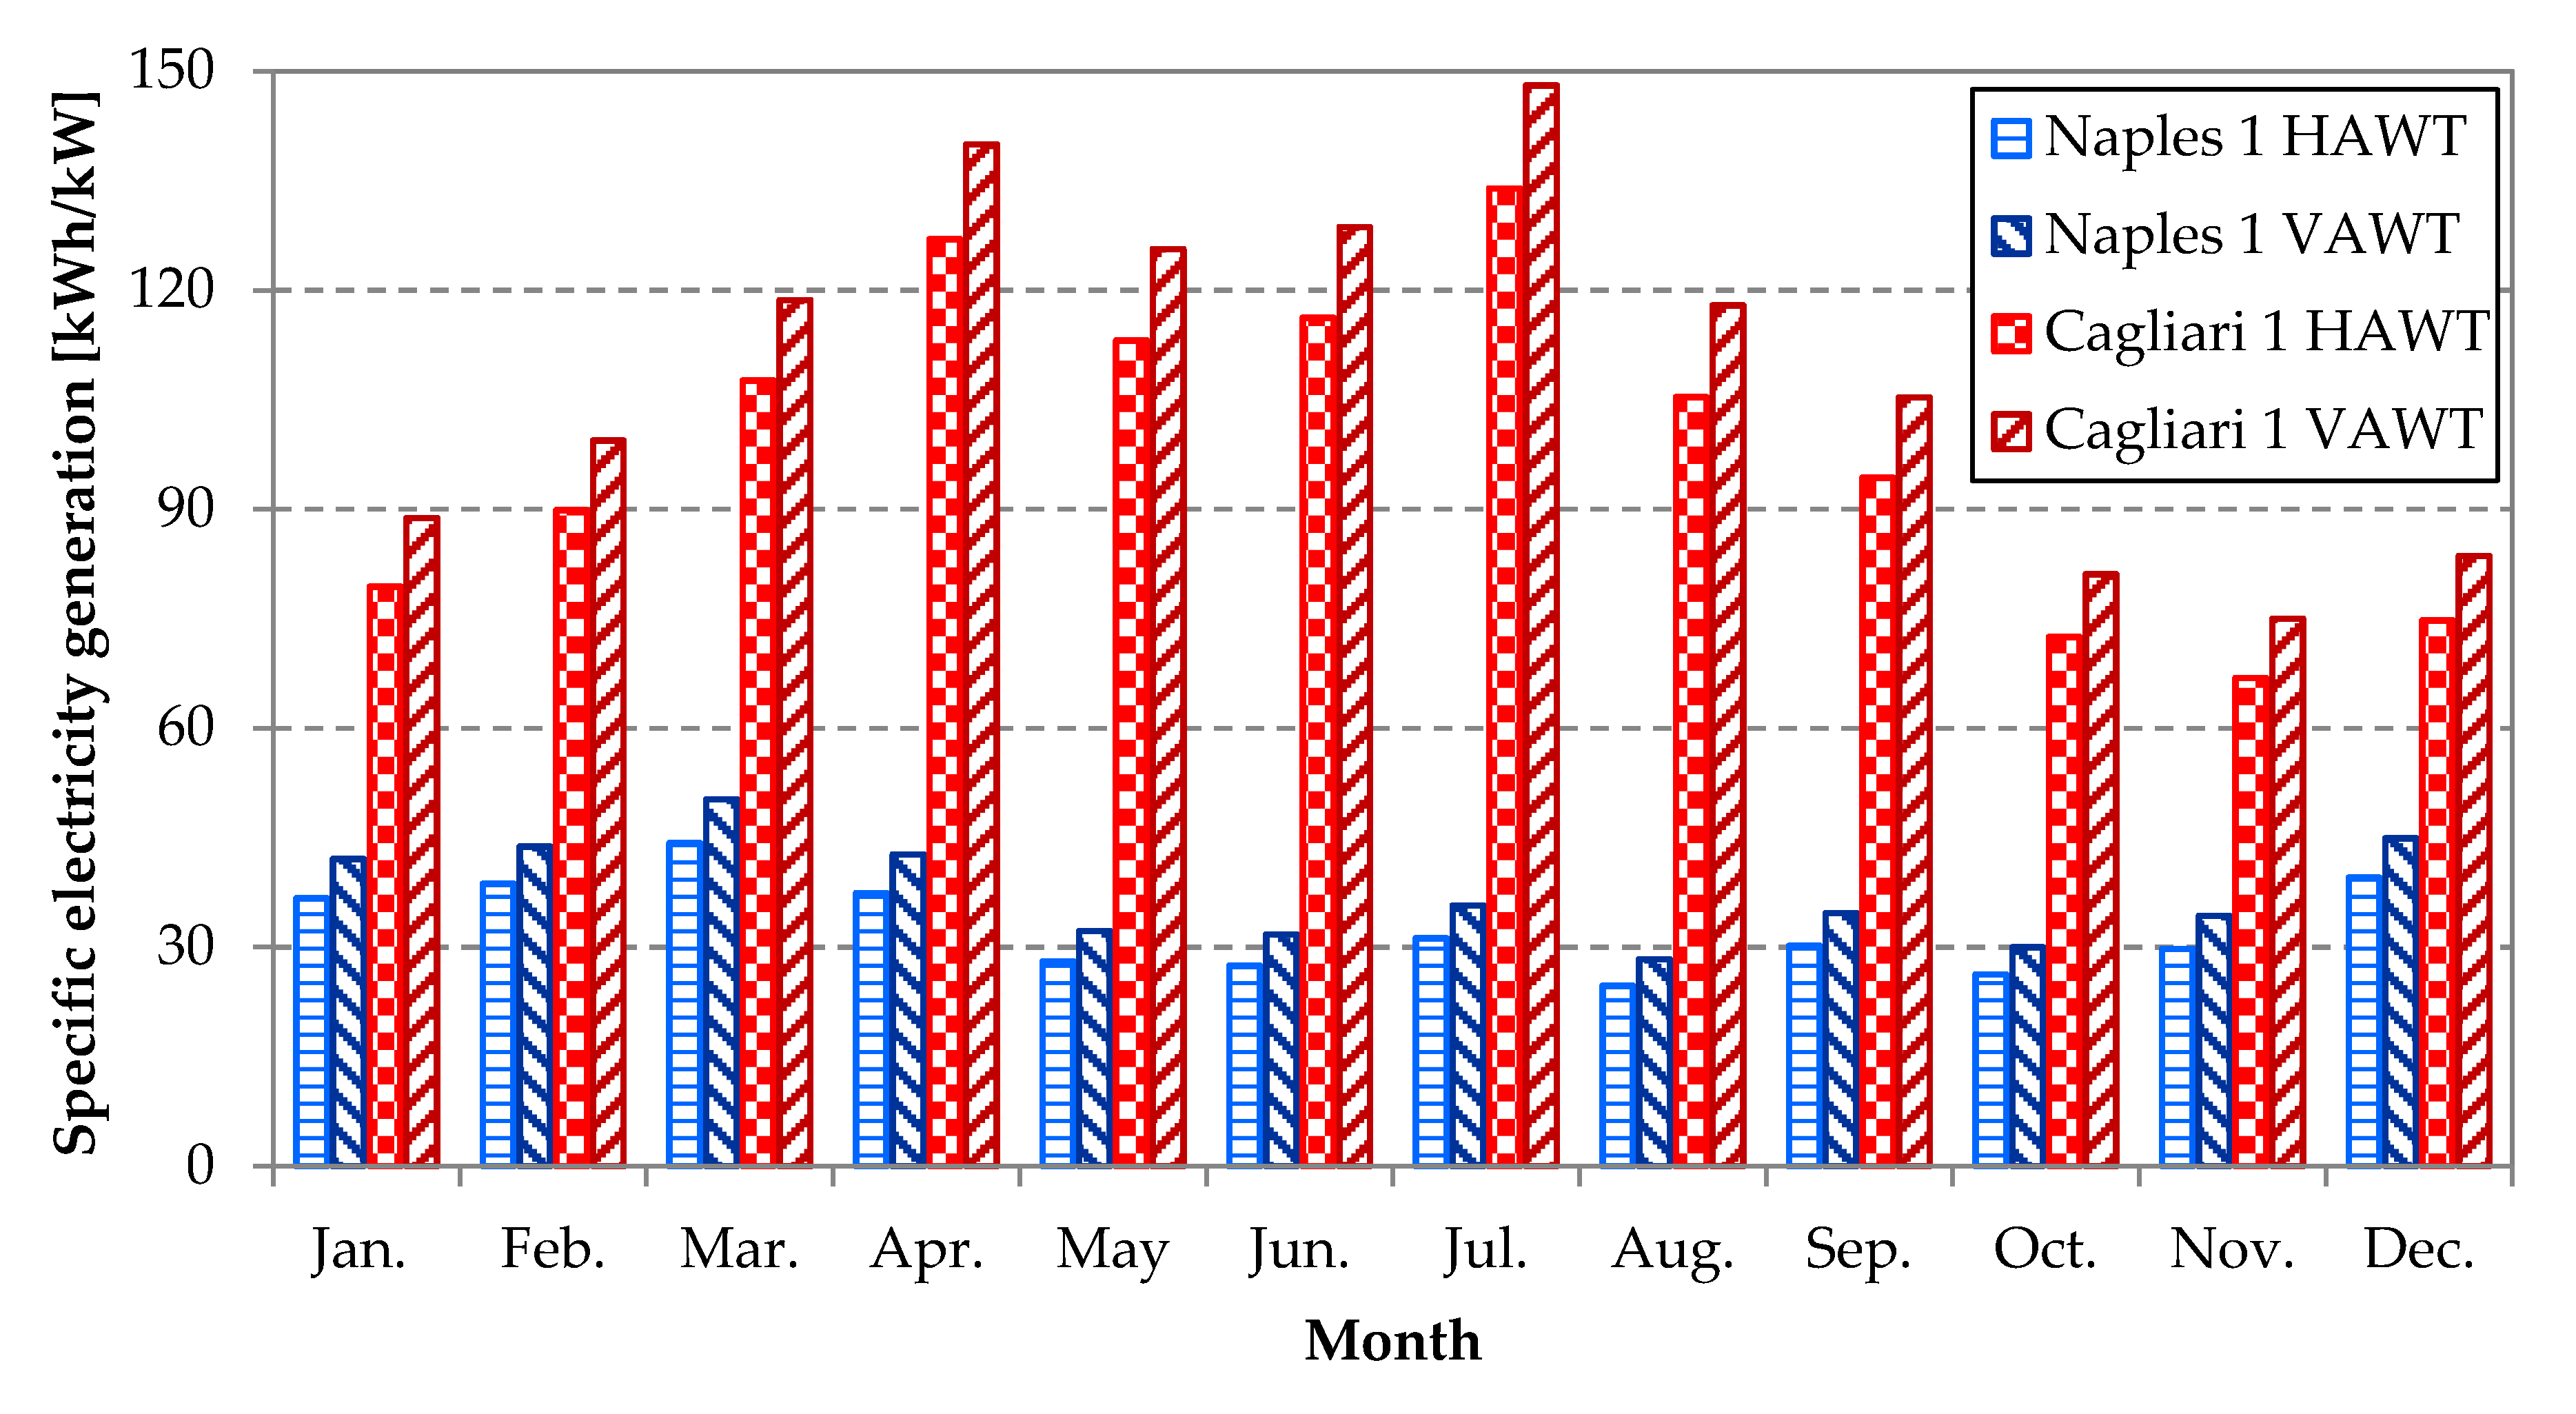
This section starts with the analysis of the electricity generated by the two models of WTs considered in the simulation and the two installation sites. Figure 8 shows that, in Cagliari, there was a renewable-based electricity production significantly higher than in Naples in each month, which was more than double. The total production of one year was about 2600 kWh in Naples and 6500 kWh in Cagliari. This was an expected result due to the wind distribution introduced in the previous section. Horizontal axis wind turbines (HAWTs) had a quite similar electricity production with respect to vertical axis WTs (VAWTs), both in Naples and in Cagliari and for each month, being slightly higher for VAWT. The reason for this situation was twofold. On one hand, the efficiency of the HAWT was lower than that of the VAWT and its cut-in velocity was higher. On the other hand, there was a difference in the nominal powers of the two devices; in fact, the VAWT and HAWT rated capacities were 5 and 5.5 kW, respectively. In terms of specific production, i.e., energy generation per kW of nominal capacity, the difference between the two kinds of WTs was more evident (see Figure 9). When both WTs were considered, the same analysis on the generated energy could be repeated using only doubled values. These considerations of the electricity output of the WTs affected the results introduced below.
In terms of electricity demand, Table 5 lists the annual electric loads of both PS and CS and for each location. The total electric energy demand summed the contribution of all the small office equipment (computers, printers), lighting, GSHP, and HVAC auxiliaries (ventilation system, fans of fan coils, circulating pumps, etc.). Upon analyzing the data of both Naples and Cagliari, a small difference between PS and CS emerged. The total end-user annual electric energy demand, also including GSHP, for PS was 11.39 MWh for Naples and 11.08 MWh for Cagliari. These values corresponded to 56.5 kWh/m2 per year for the first location, while, for the second case, the value was 55.4 kWh/m2 per year. For the conventional system, the total electricity requirement was 10.92 MWh per year for both locations.
The performance of the GSHP, on a seasonal basis, was about 3.97 for coefficient of performance (COP) and about 4.59 for EER when the system was installed in Naples.
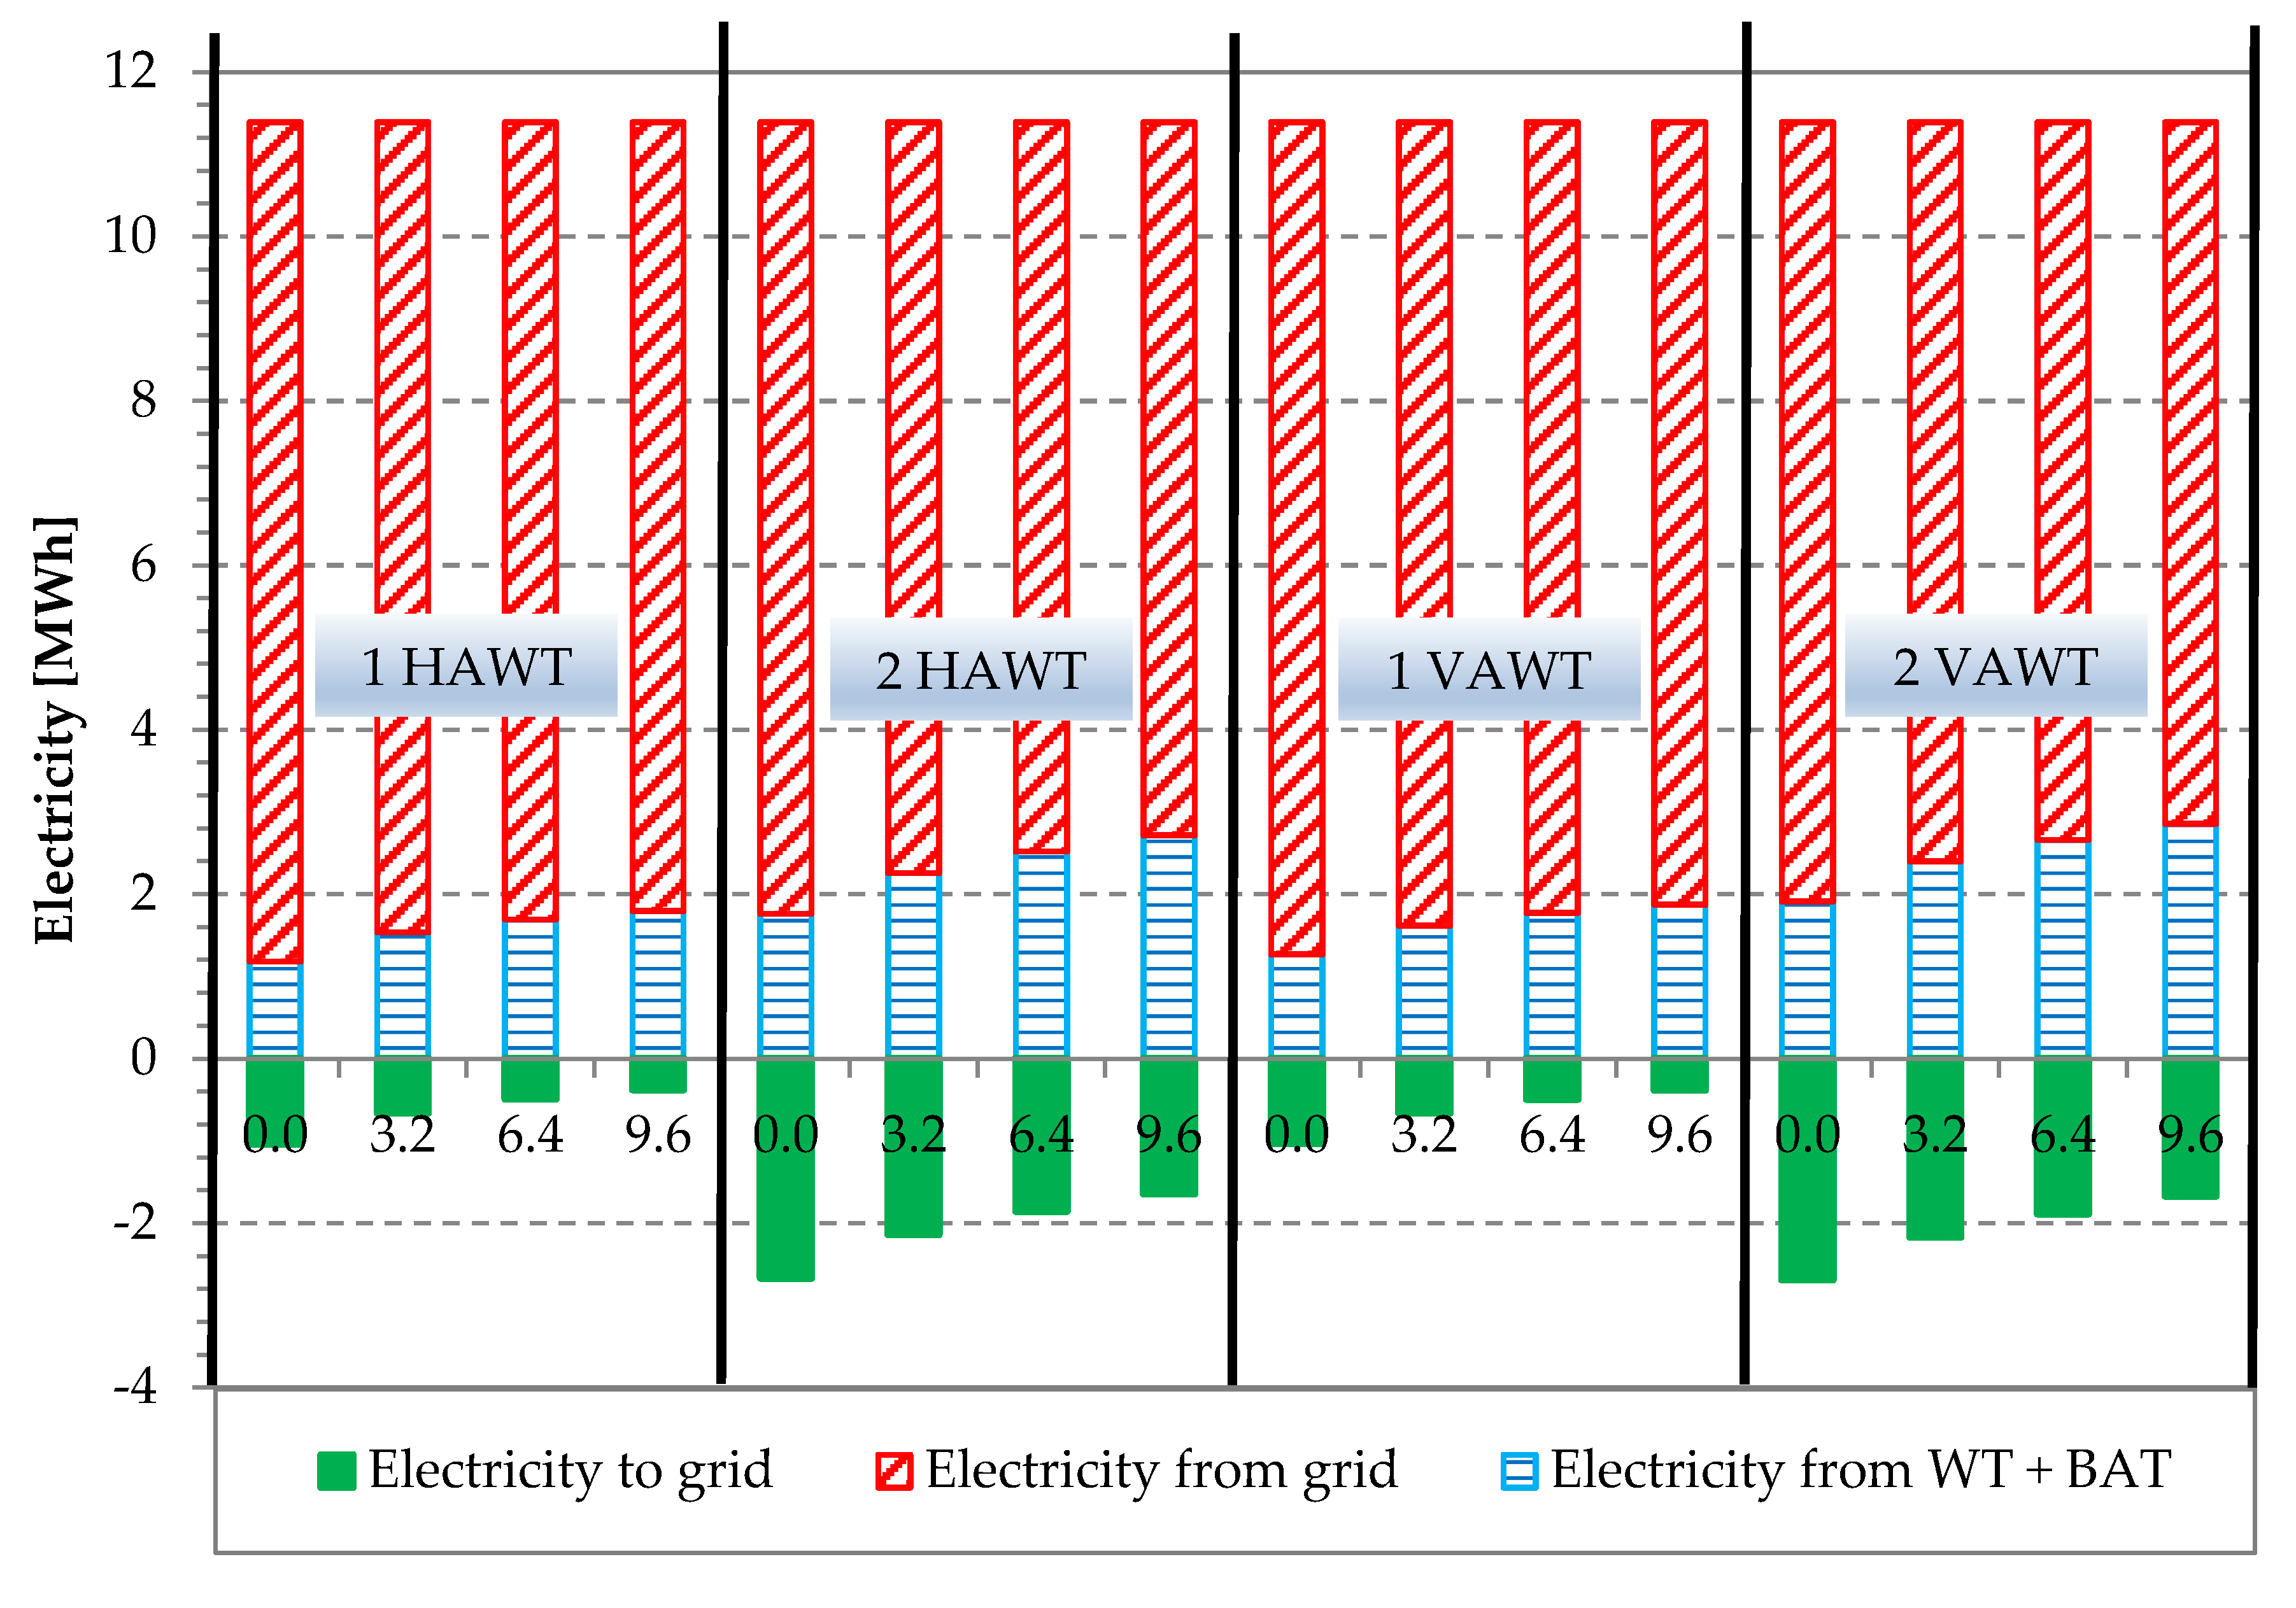
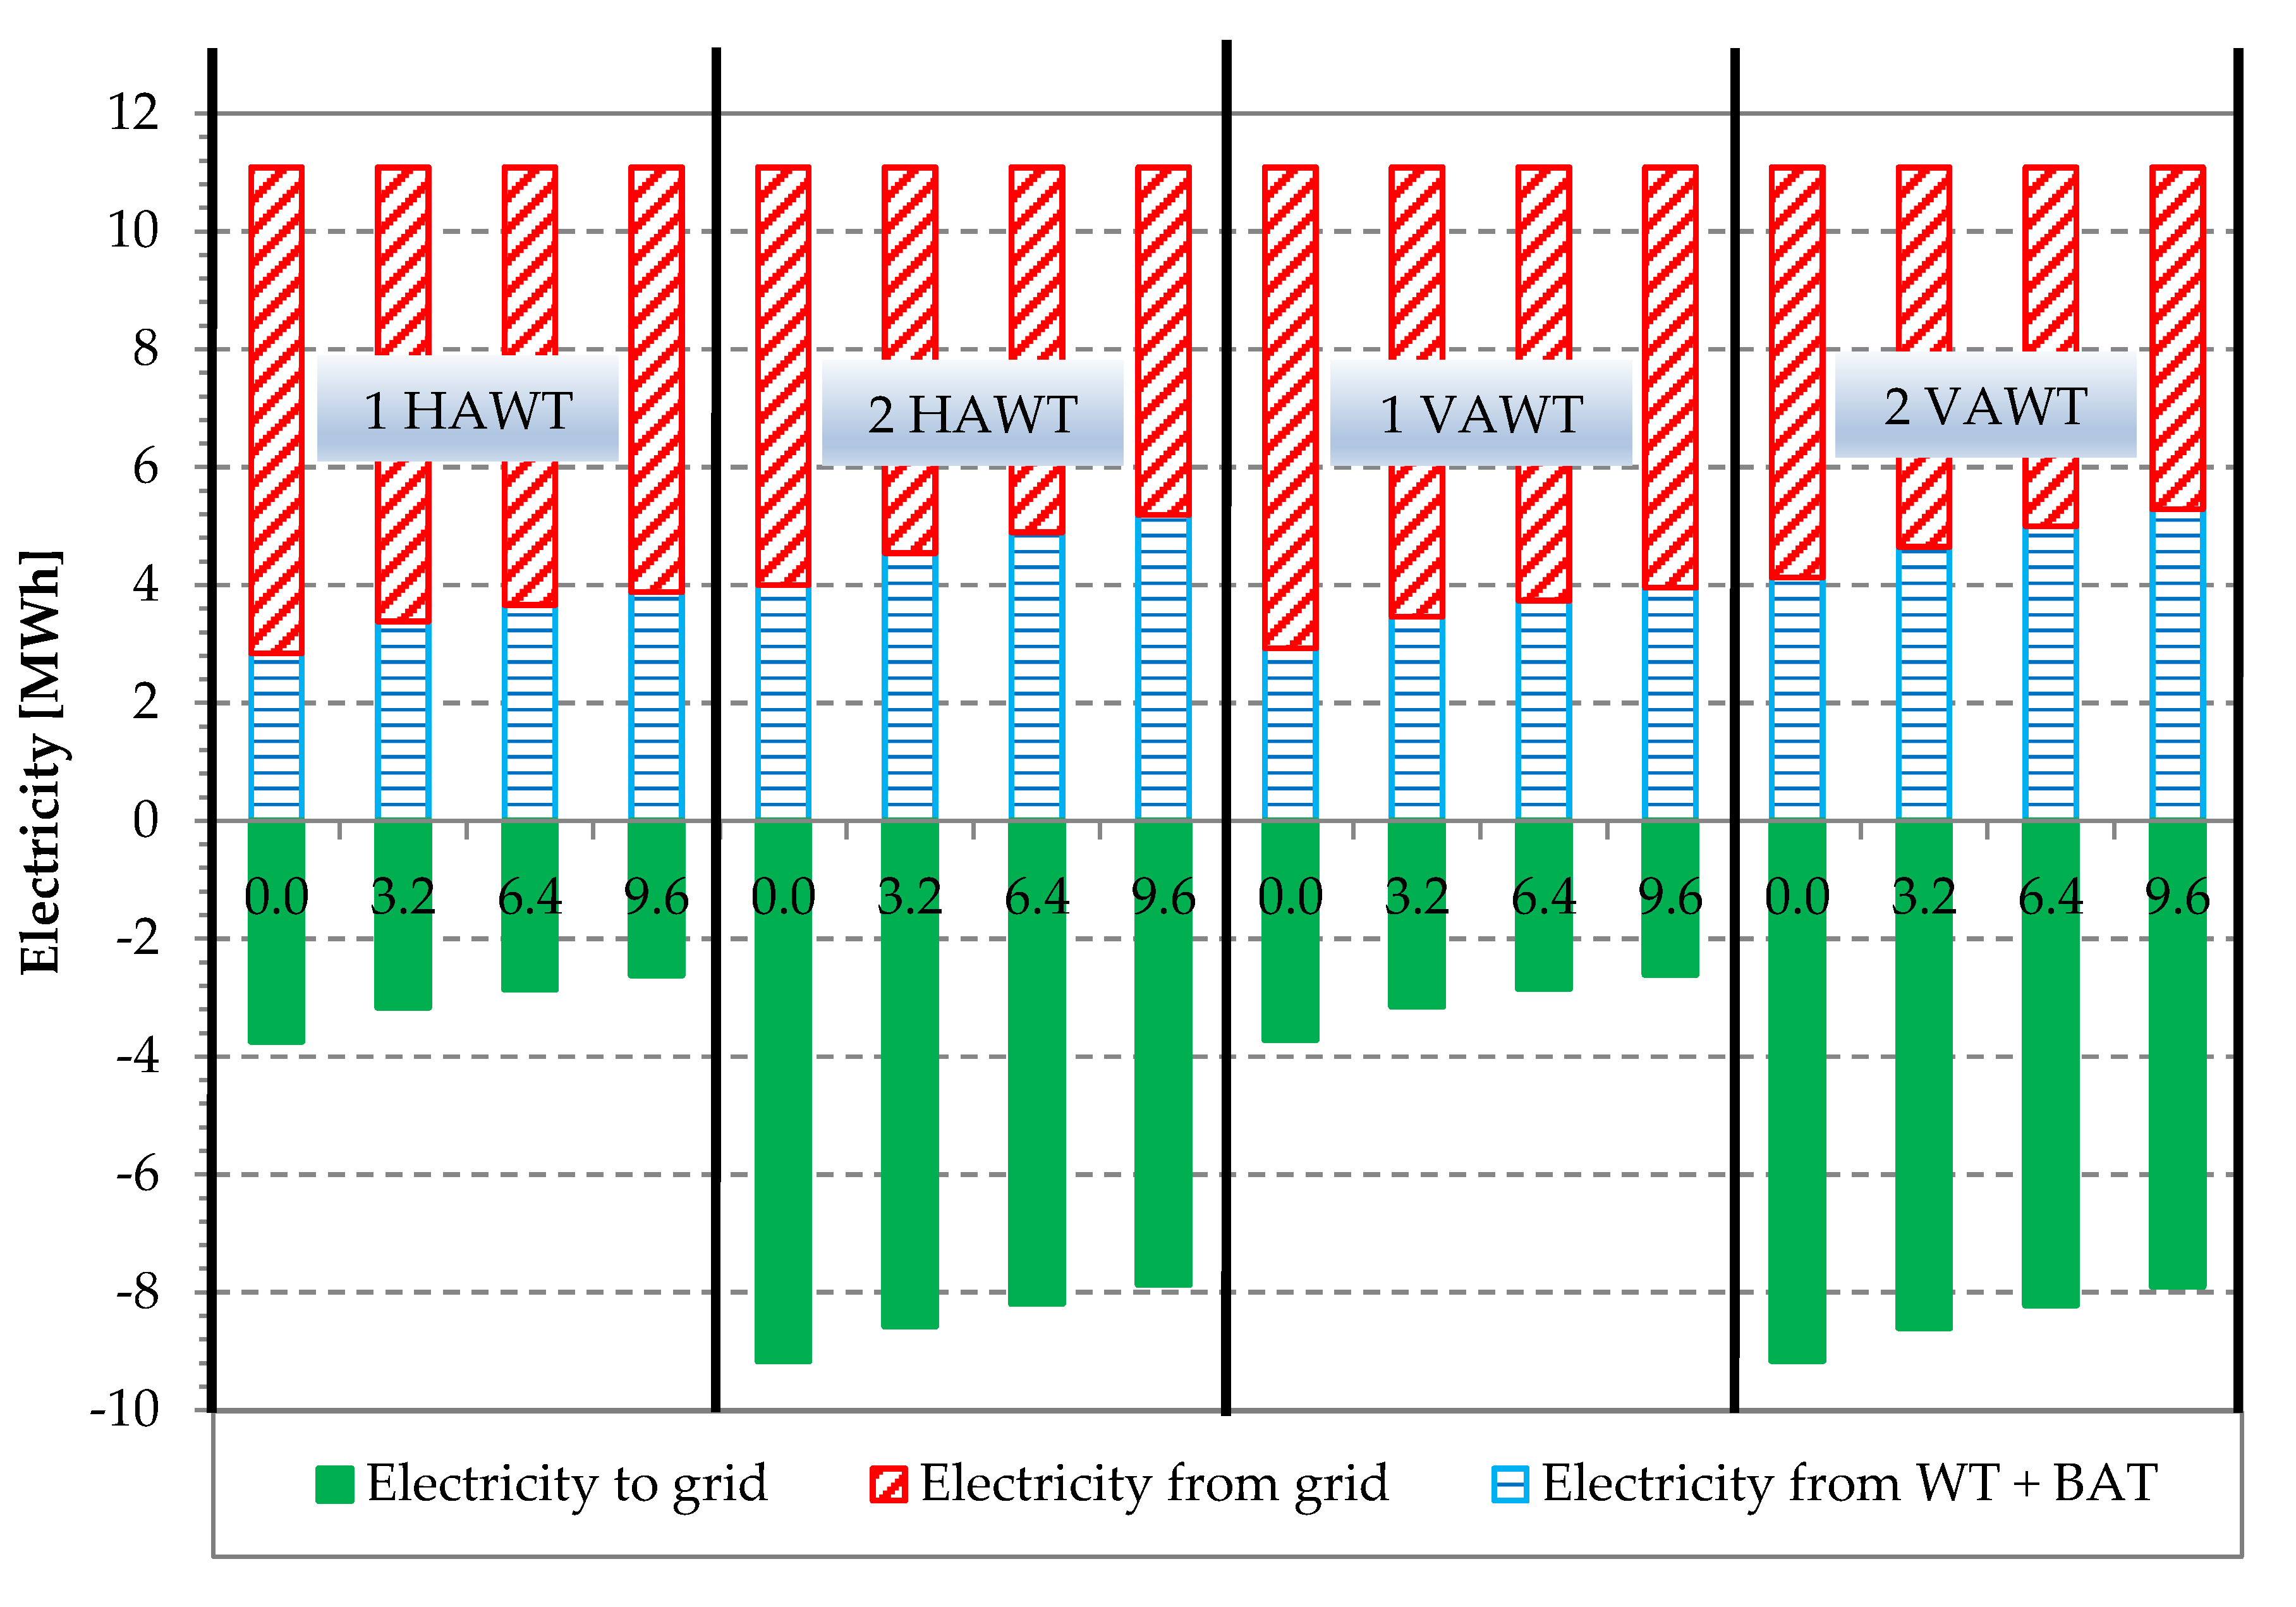
Each section of Figure 10 reports the results of energy analysis for one or two wind turbines characterized by horizontal (HA) or vertical axis (VA), varying the battery size (e.g., 3.2 on the x-axis means 3.2 kWh). Figure 10 shows, on an annual basis for each WT configuration (1 HAWT, 2 HAWT, 1 VAWT, 2 VAWT) and battery storage capacity (3.2 kWh, 6.4 kWh, 9.6 kWh), if available (0.0 means no battery), the distribution of electricity associated with the WT plant and the power grid for the plant installed in Naples, while Figure 11 reports the Cagliari case. Electricity available from the WT plant was taken in part by the office building (blue bar), while the remaining extra production (green bar) was fed into the grid. The integration from the power grid was always present (red bar). The electricity used on-site and that given to the grid increased when the WT capacity grew. The battery storage systems determined an increase in the on-site use of renewable electricity. The electricity available from the WT plant installed in Cagliari performed better due to the higher availability of the wind source. The electricity produced by the WT system was three times higher for Cagliari than for Naples.
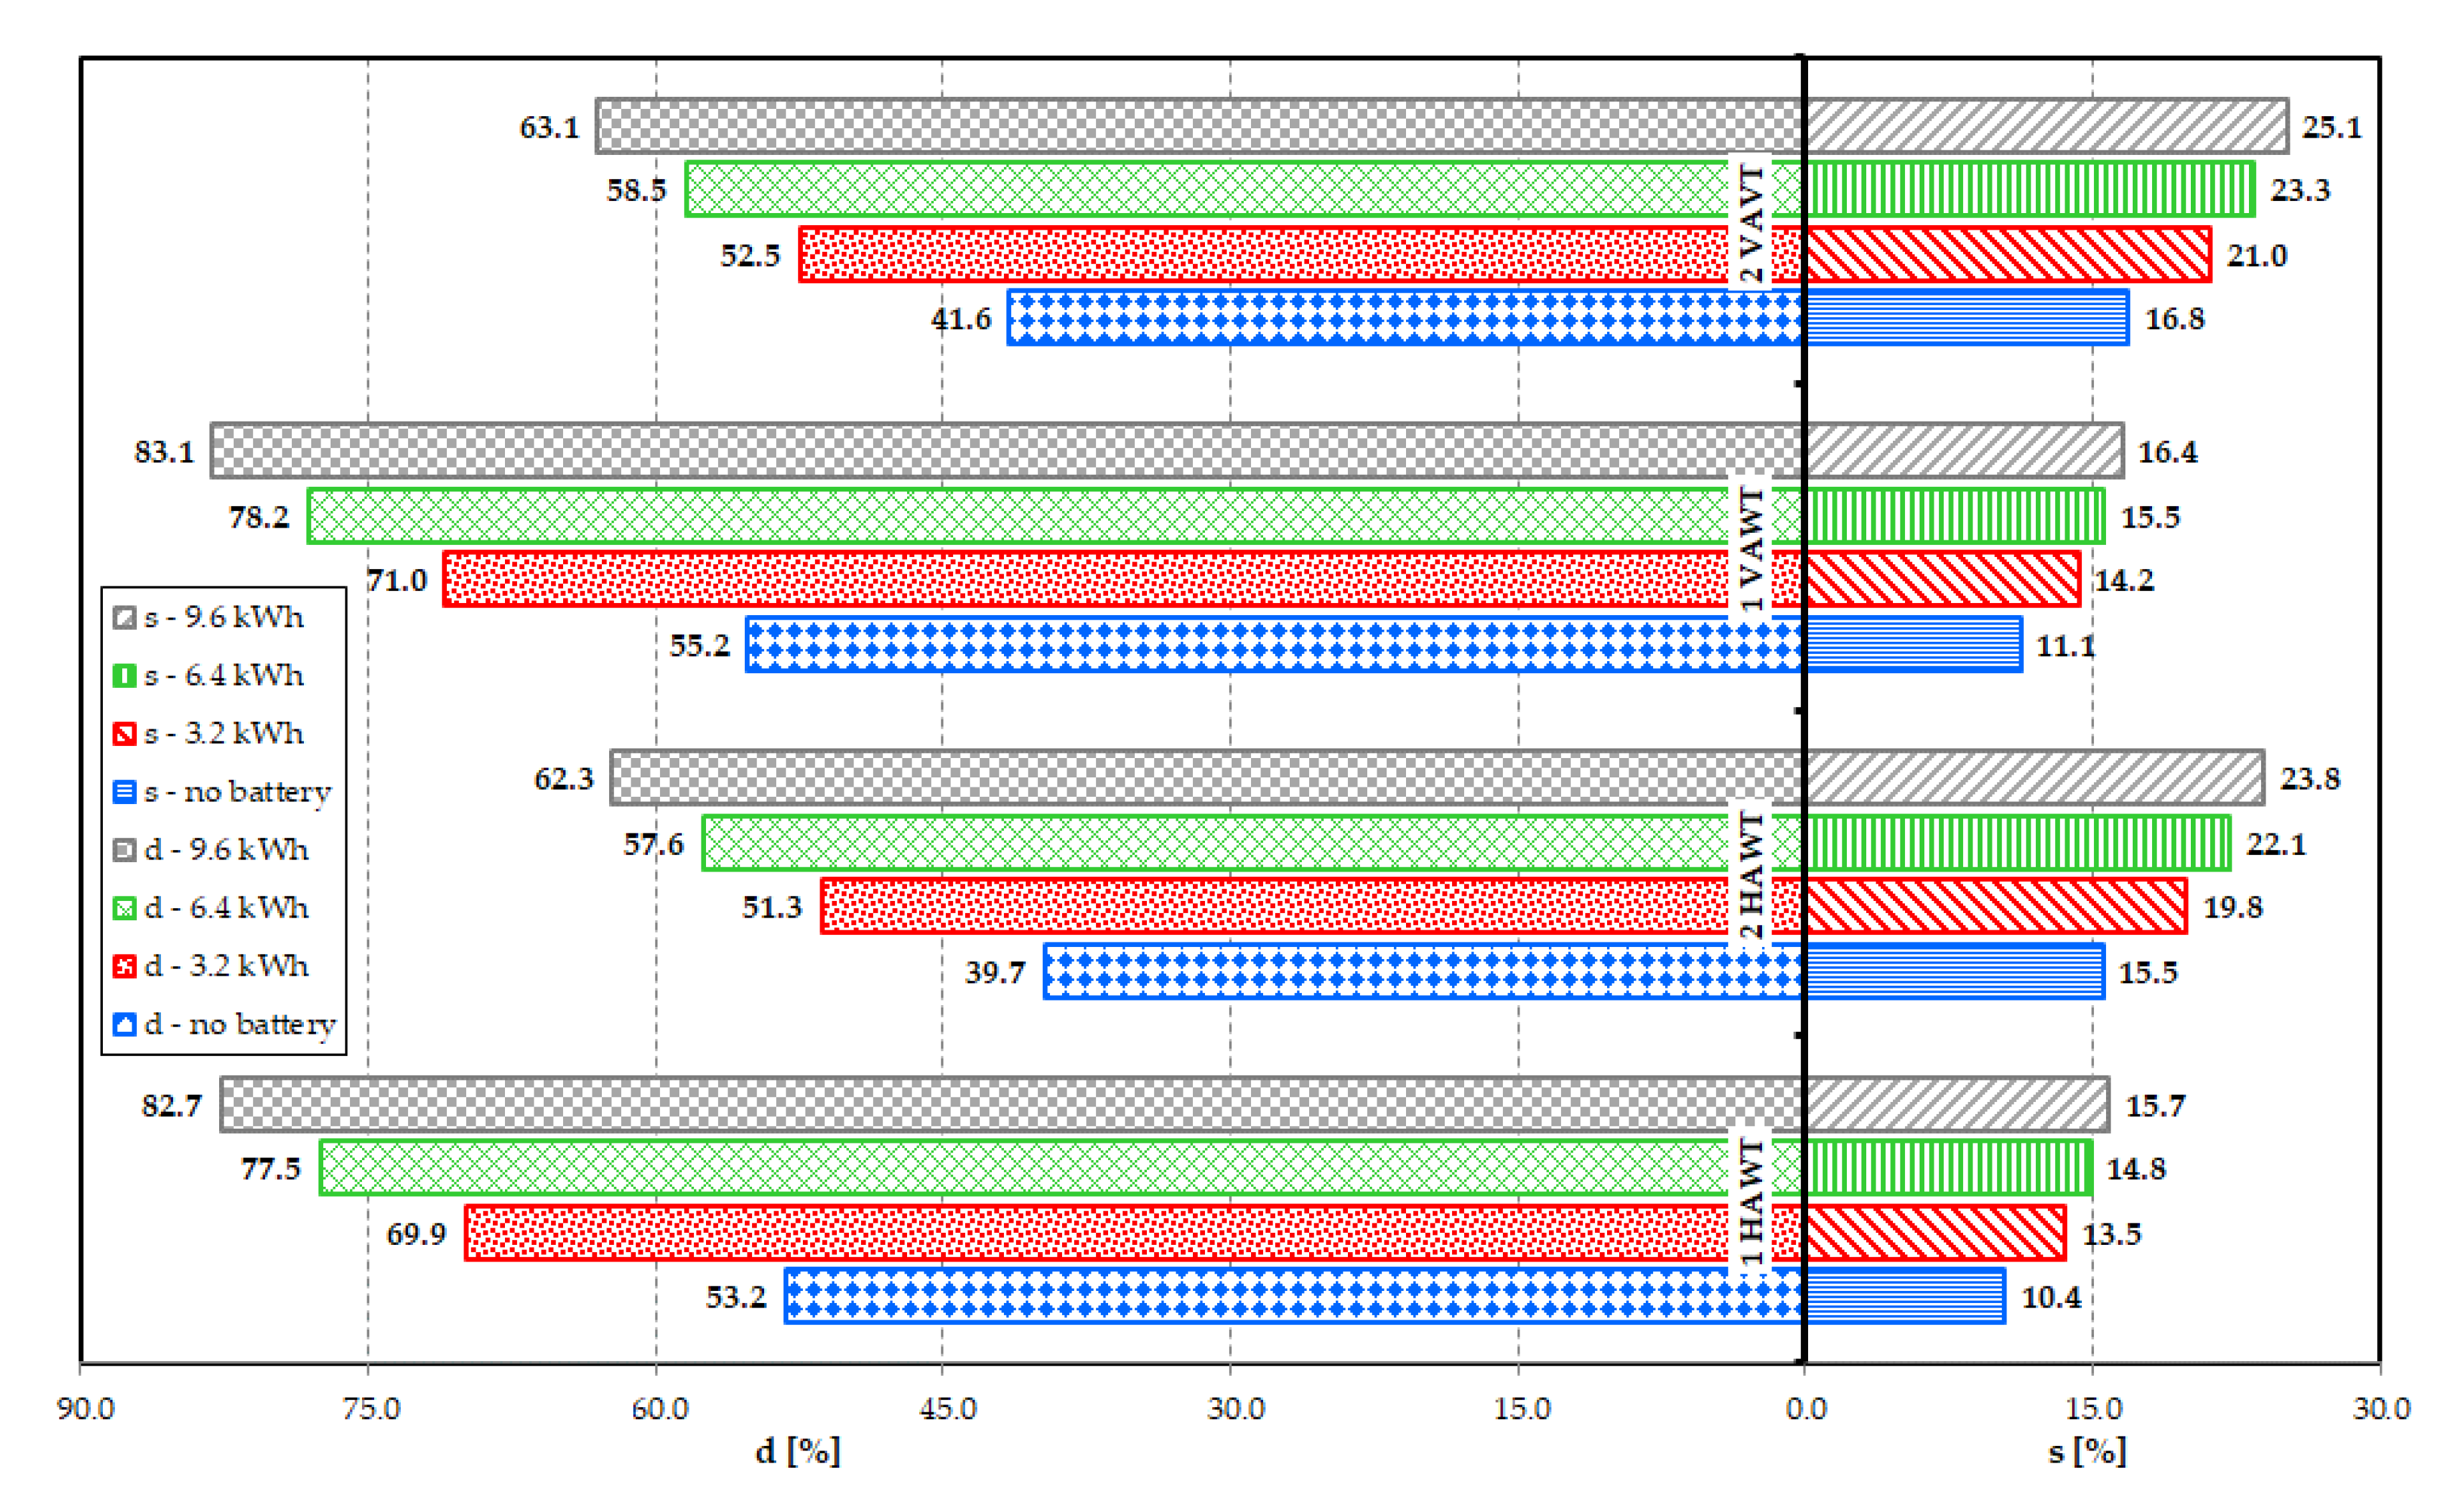
One of the main challenges related to WT plants is to reduce the energy surplus fed into the national grid. From this point of view, it is interesting to identify the best configurations that minimize the percentage of exported electricity. Two energy indexes were defined to assess renewable electricity used on-site [39].
- s is equal to the share of electricity available from the inverter powered by the WT and, if available, by the battery storage system, used by the end-user, divided by the total electricity demand;
- d is equal to the share of electricity delivered by the WT and, if available, by the battery storage system, used on-site, divided by the total energy supplied by the inverter.
In Figure 12, the factors s and d are reported for the Naples installation upon varying WT technology and its nominal power, as well as the battery storage capacity. Electricity generated by the WT plant that met the end-user load was quantified by the s factor. This index grew with both WT system and battery storage capacity. Its maximum value reached 25.1% for 9.6 kWh and two WTs with a vertical axis. This means that, with this configuration, the external grid supplied 74.9% of the total electricity demand of the building. The rate of WT electricity on-site consumed, with respect to the global production (index d), lowered with WT nominal power, while it increased when the battery storage capacity grew. The configuration with the lowest percentage of electricity feeding the external grid, equal to 16.9% (d = 83.1%), was that based on one WT with a vertical axis and 9.6 kWh. A further possibility to exploit electricity surplus on-site and avoid it being fed into the grid could be represented by the introduction of mobile storage batteries, i.e., electric vehicles [40].
For Cagliari, the range of s and d factors for each configuration is reported in Table 6. The first value in each table cell refers to the configuration without a battery, while the second refers to a 9.6 kWh battery capacity. Due to the increased electricity production from the WT plant, the index s was higher for Cagliari, meaning that more renewable energy was used to cover end-user demand. The index d was lower for Cagliari because of the high percentage of electricity exported to the power grid.
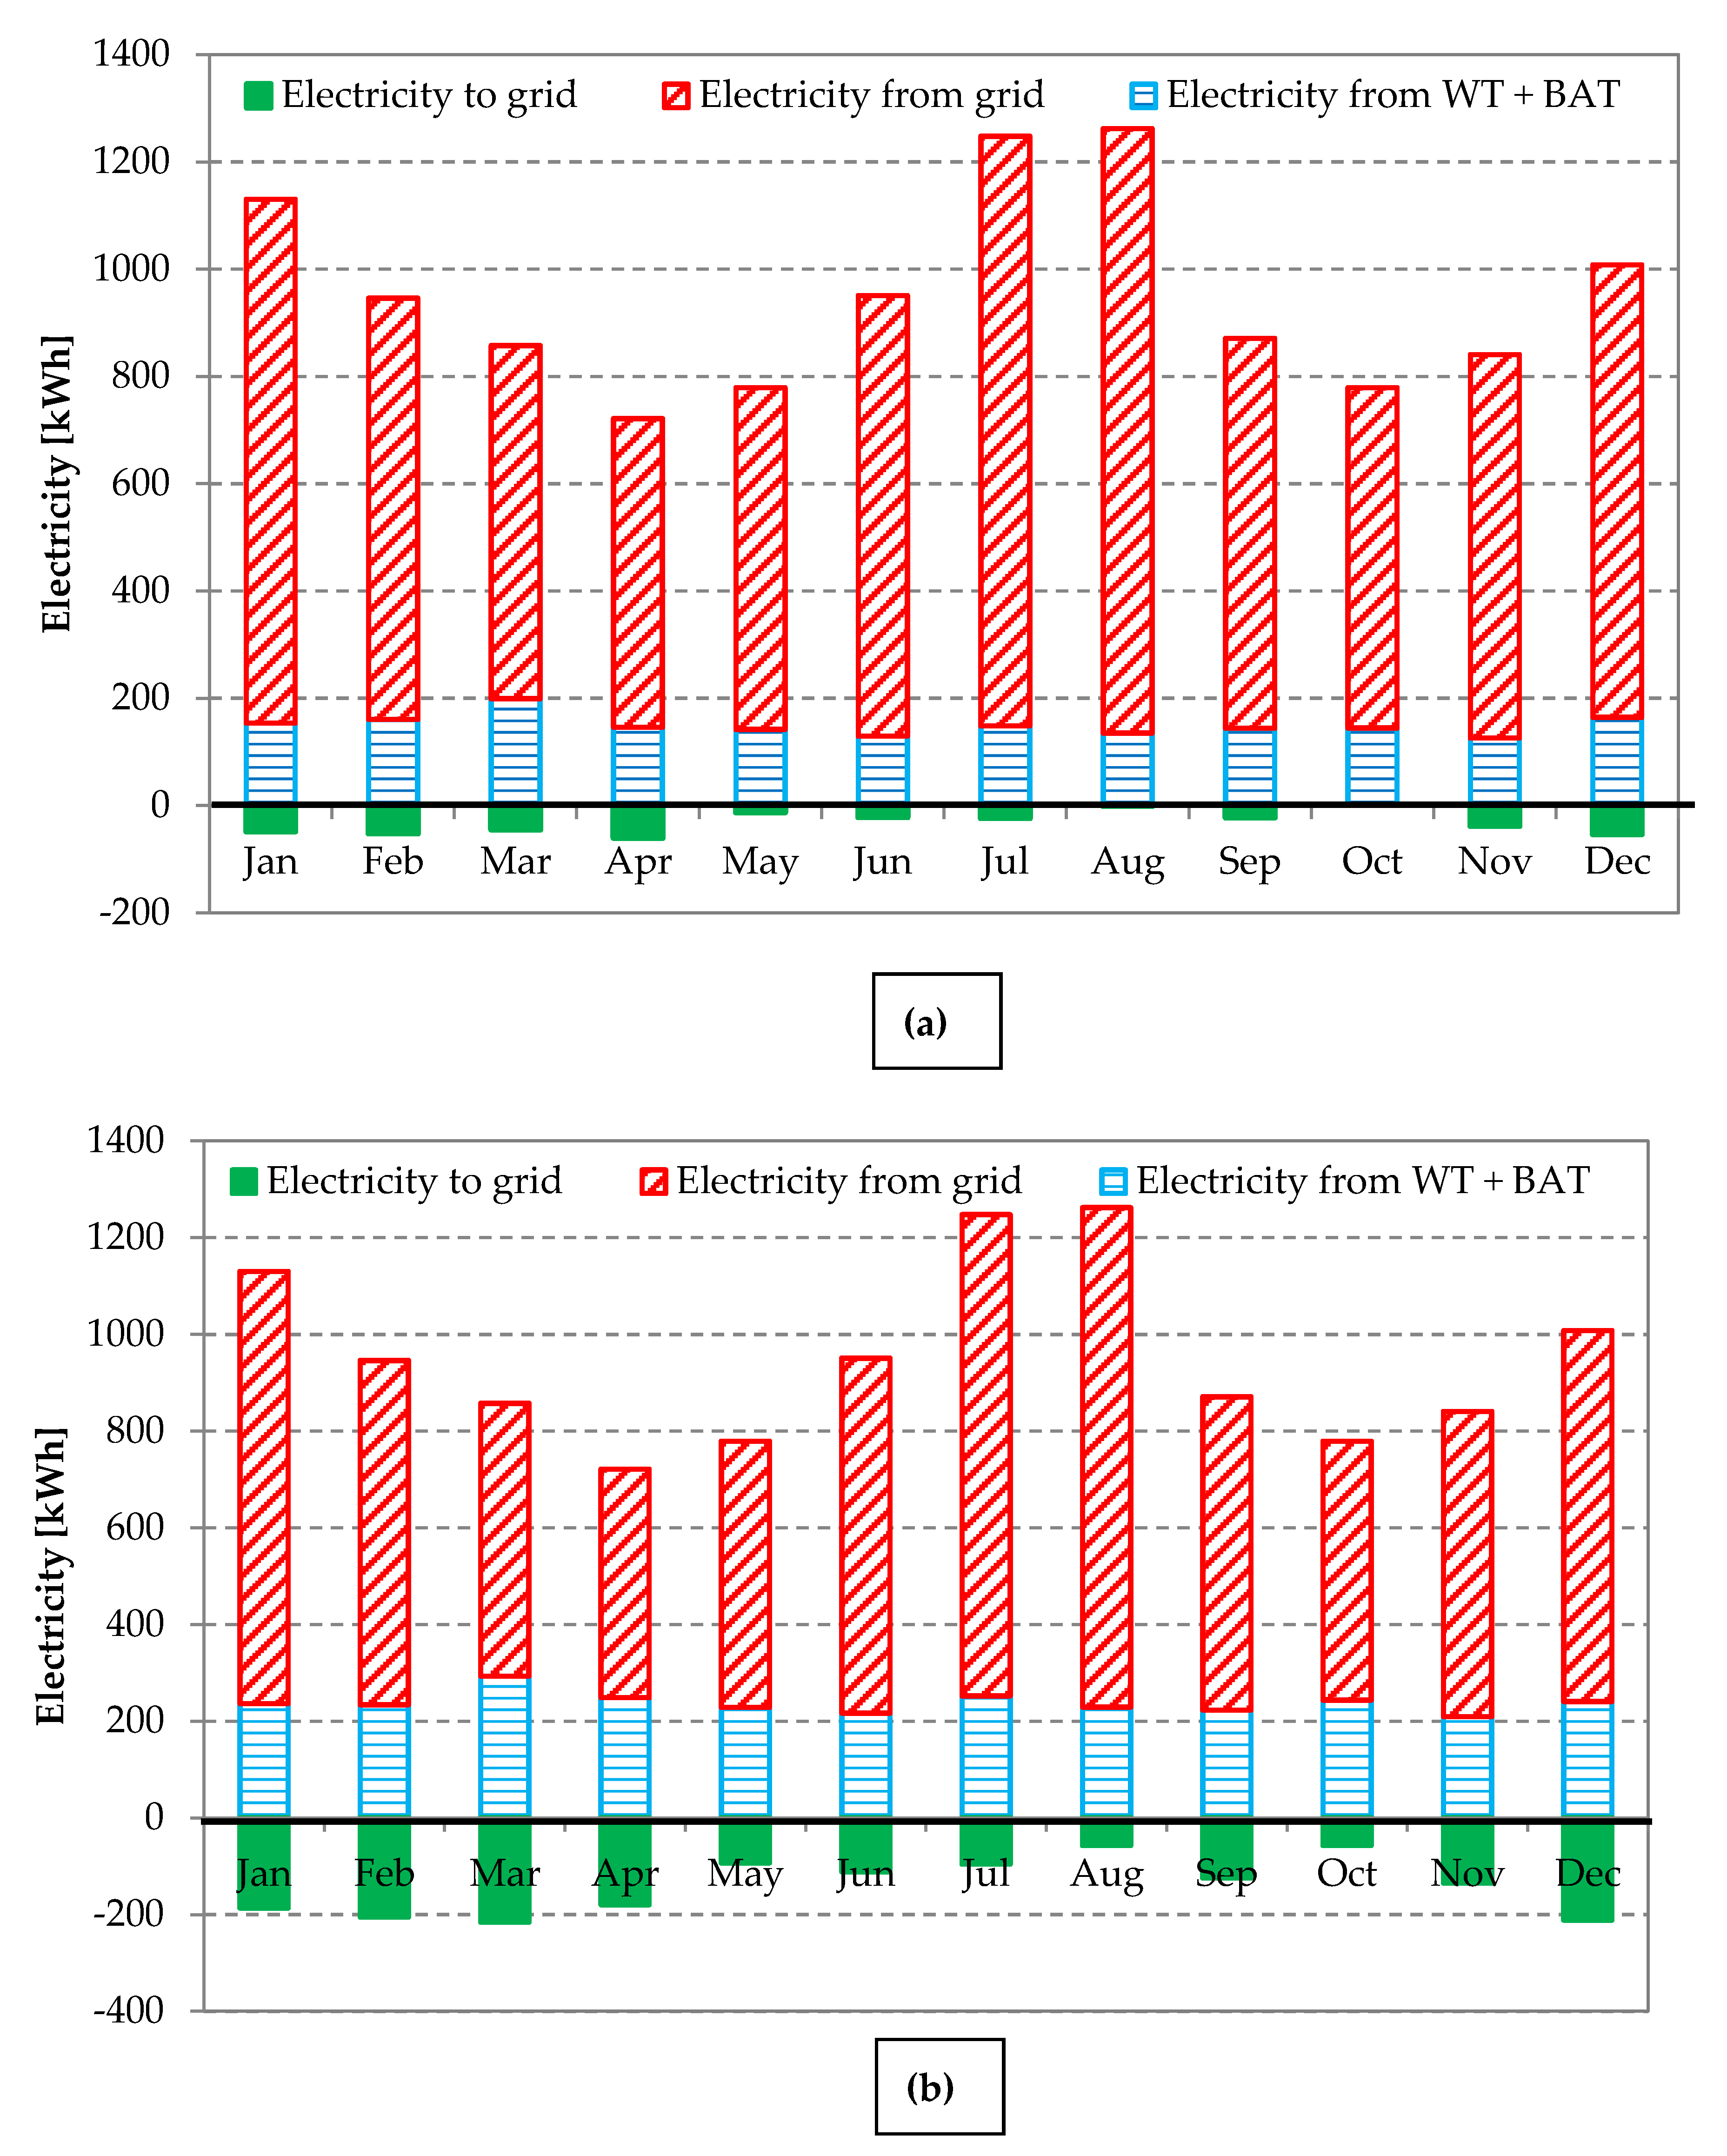
Figure 13 represents, on a monthly basis, how electricity from the WT was used, as well as the contribution from the national electric grid in the case of Naples. The configuration characterized by one horizontal axis wind turbine and an electricity storage of 9.6 kWh (Figure 13a) presented the highest percentage (s > 20%) of renewable electricity covering end-user load during the months of March and April. This result was due to higher renewable-based electricity production and a good agreement with user load.
The configuration characterized by two vertical axis wind turbines and a battery of 9.6 kWh, Figure 13b, shows an increased contribution from renewable energy in each month due to a higher electricity production. On the other hand, there was also a non-negligible percentage of exported electricity due to a poor agreement between production and load.
It appears that the increase in size of the WT plant affected more the percentage of exported electricity than the on-site use of renewable energy. The only way to improve this result could be the increase in battery storage size.
7. Comparison of Energy, Environmental, and Economic Results
In this section, a comparison between the proposed and reference systems on an energy, environmental, and economic basis is reported. The energy comparison was carried out by means of the PESPUL index introduced in Equation (8). This parameter increased for both locations with WT nominal power due to the increased primary energy savings with respect to total energy demand of the end-user. A higher value of this parameter denoted a better configuration proposed in terms of relative primary energy savings. It varied in the system with the battery between about 0.37 for 1 HAWT in Naples (0.69 for Cagliari) and about 1.23 for 2 VAWT in Cagliari and 0.55 for 2 VAWT in Naples (Table 7). This means that, in the configuration with two vertical axis WTs in Cagliari and a electricity storage system of 9.6 kWh, the PS achieved a relative primary energy savings 1.23 higher than the total energy needed by the office building. This parameter showed a non-significant link with battery storage size. For each configuration, the PESPUL index decreased with battery storage capacity as this component further increased energy losses.
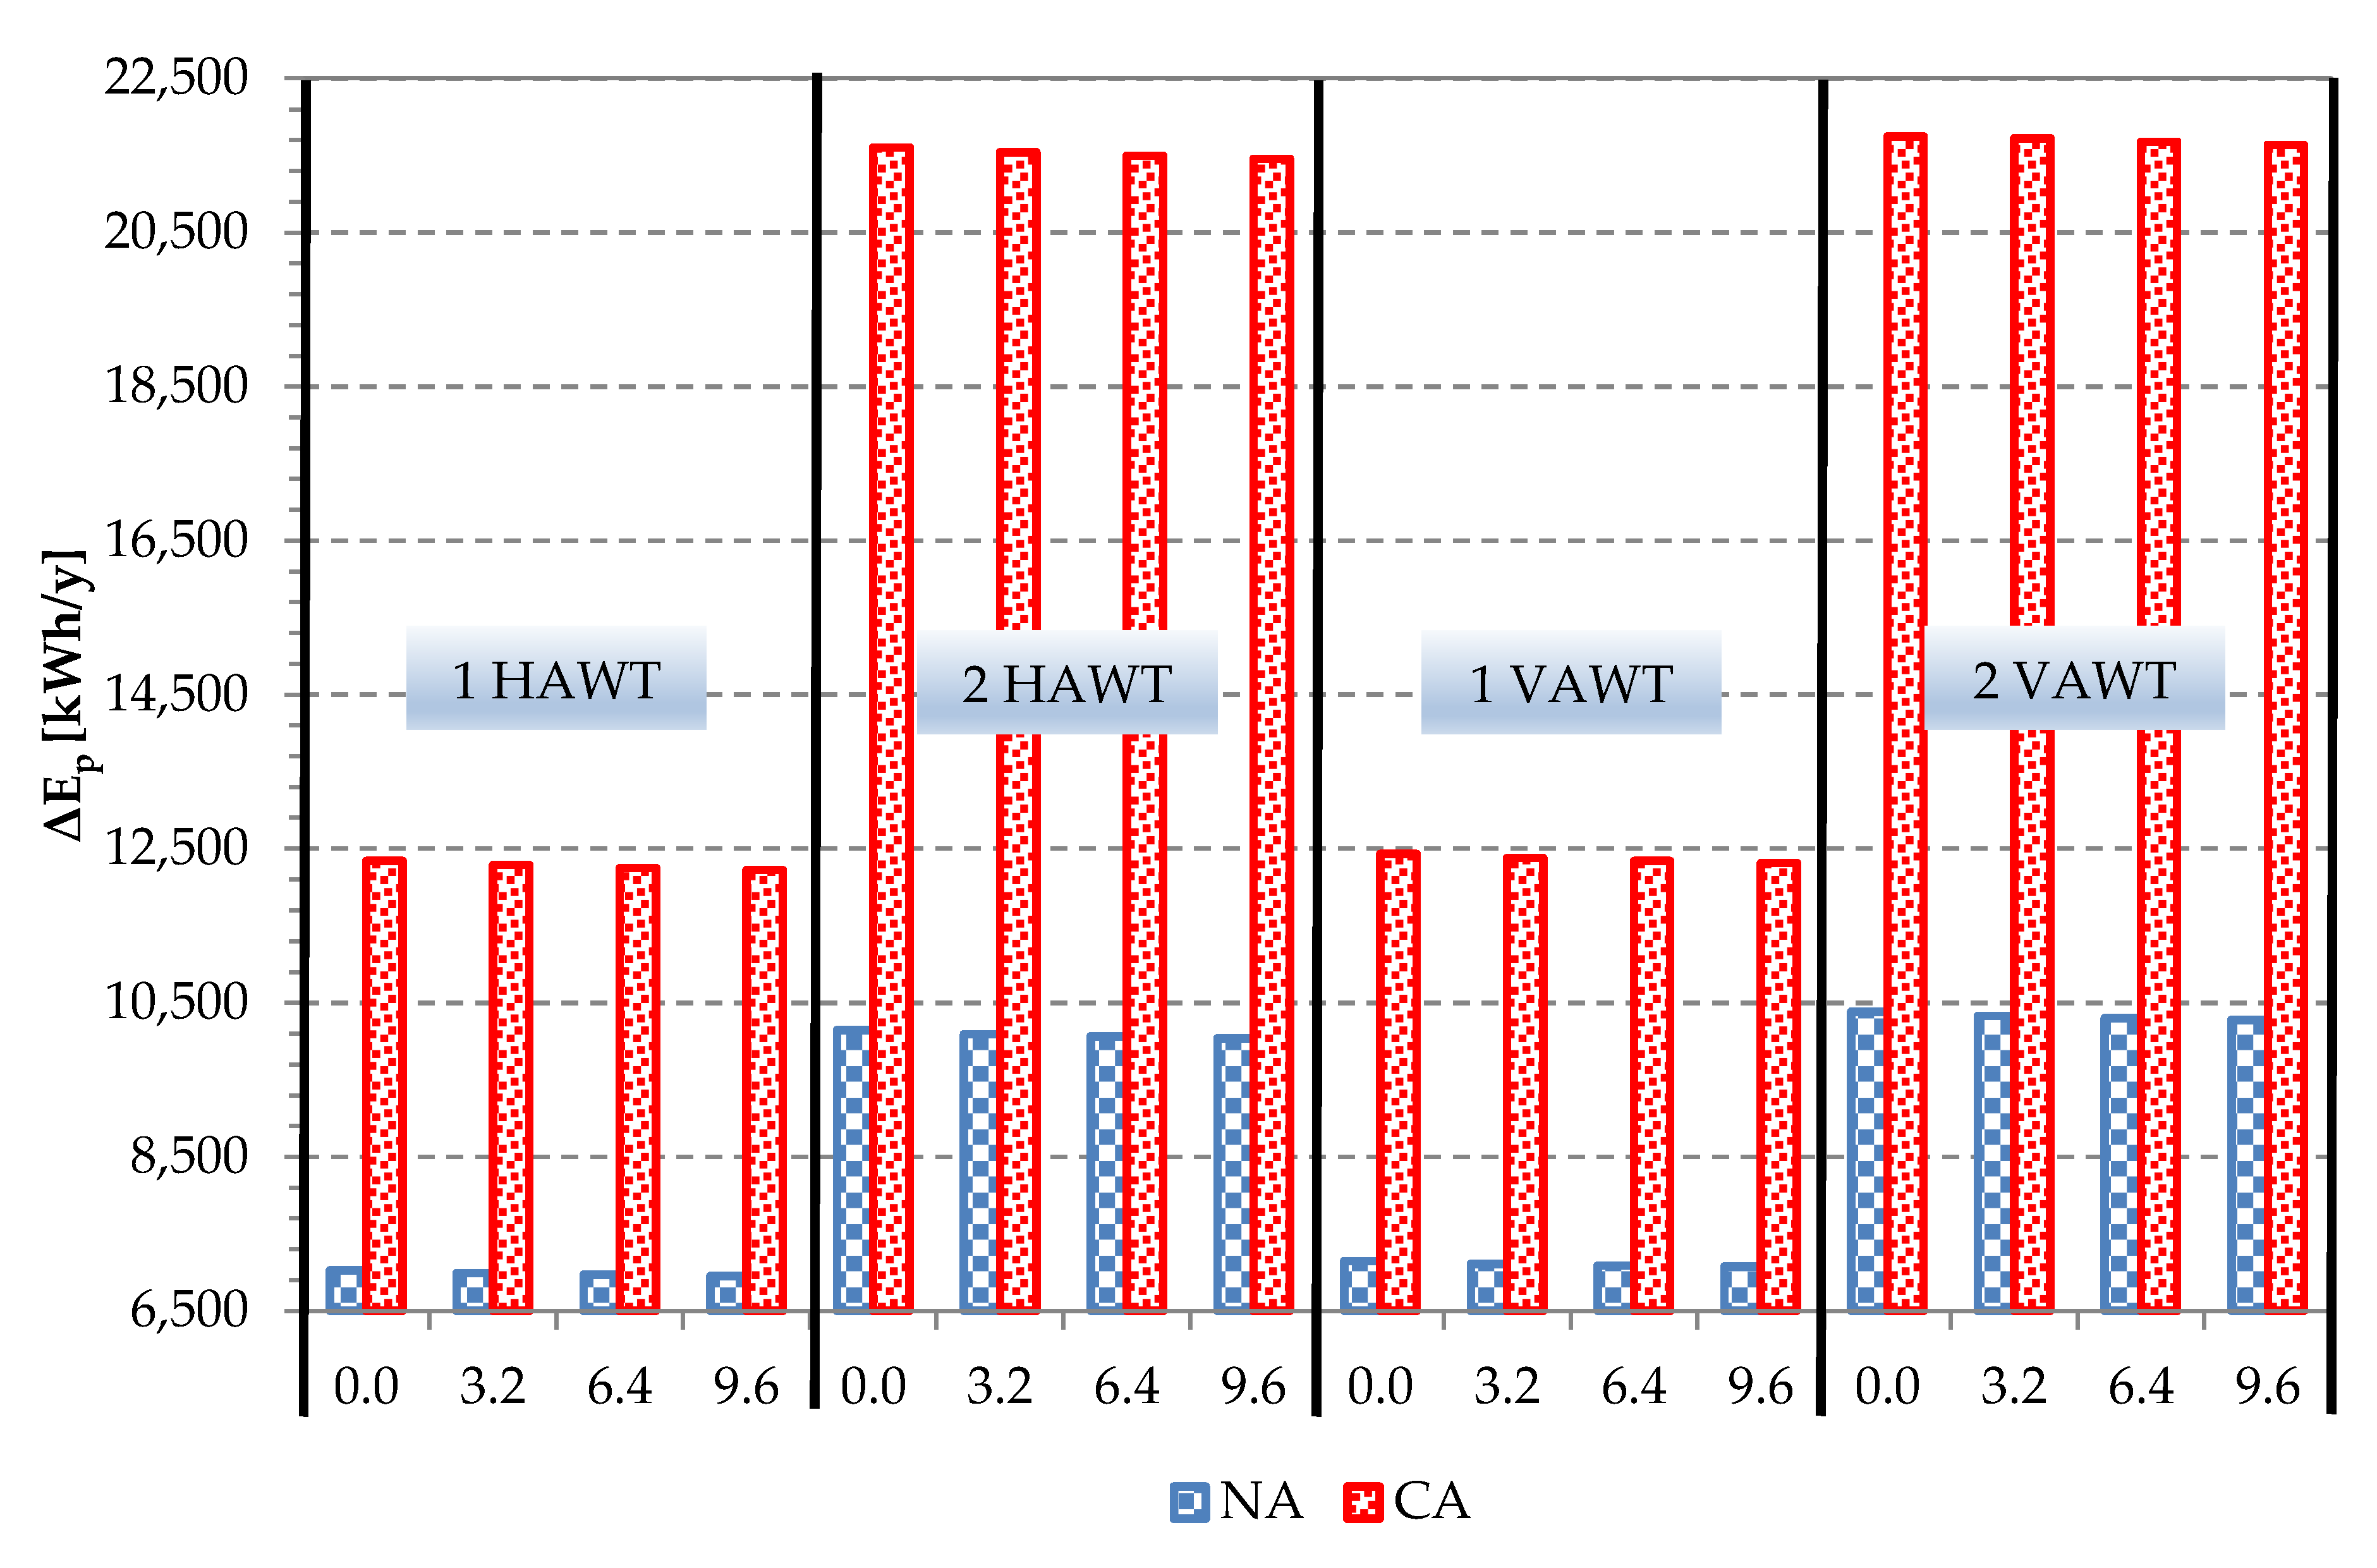
In absolute terms, the primary energy savings, ΔEp (see Figure 14), was about 3 MWh per year higher in the configuration with two WTs than in the plant with one WT when the city of Naples was considered. The difference between the two aforementioned configurations in Cagliari increased and was equal to about 9.3 MWh. The ΔEp was marginally affected by the size of the battery storage and the type of wind turbine. The best values took place for the solution without a battery and with two VAWTs; they were about 10.4 MWh and 21.8 MWh, respectively, in Naples and in Cagliari. The worst combination was that involving only one horizontal axis wind turbine and the biggest battery size (9.6 kWh); in Naples, this was equal to 6.95 MWh, while it was 12.22 MWh in Cagliari.
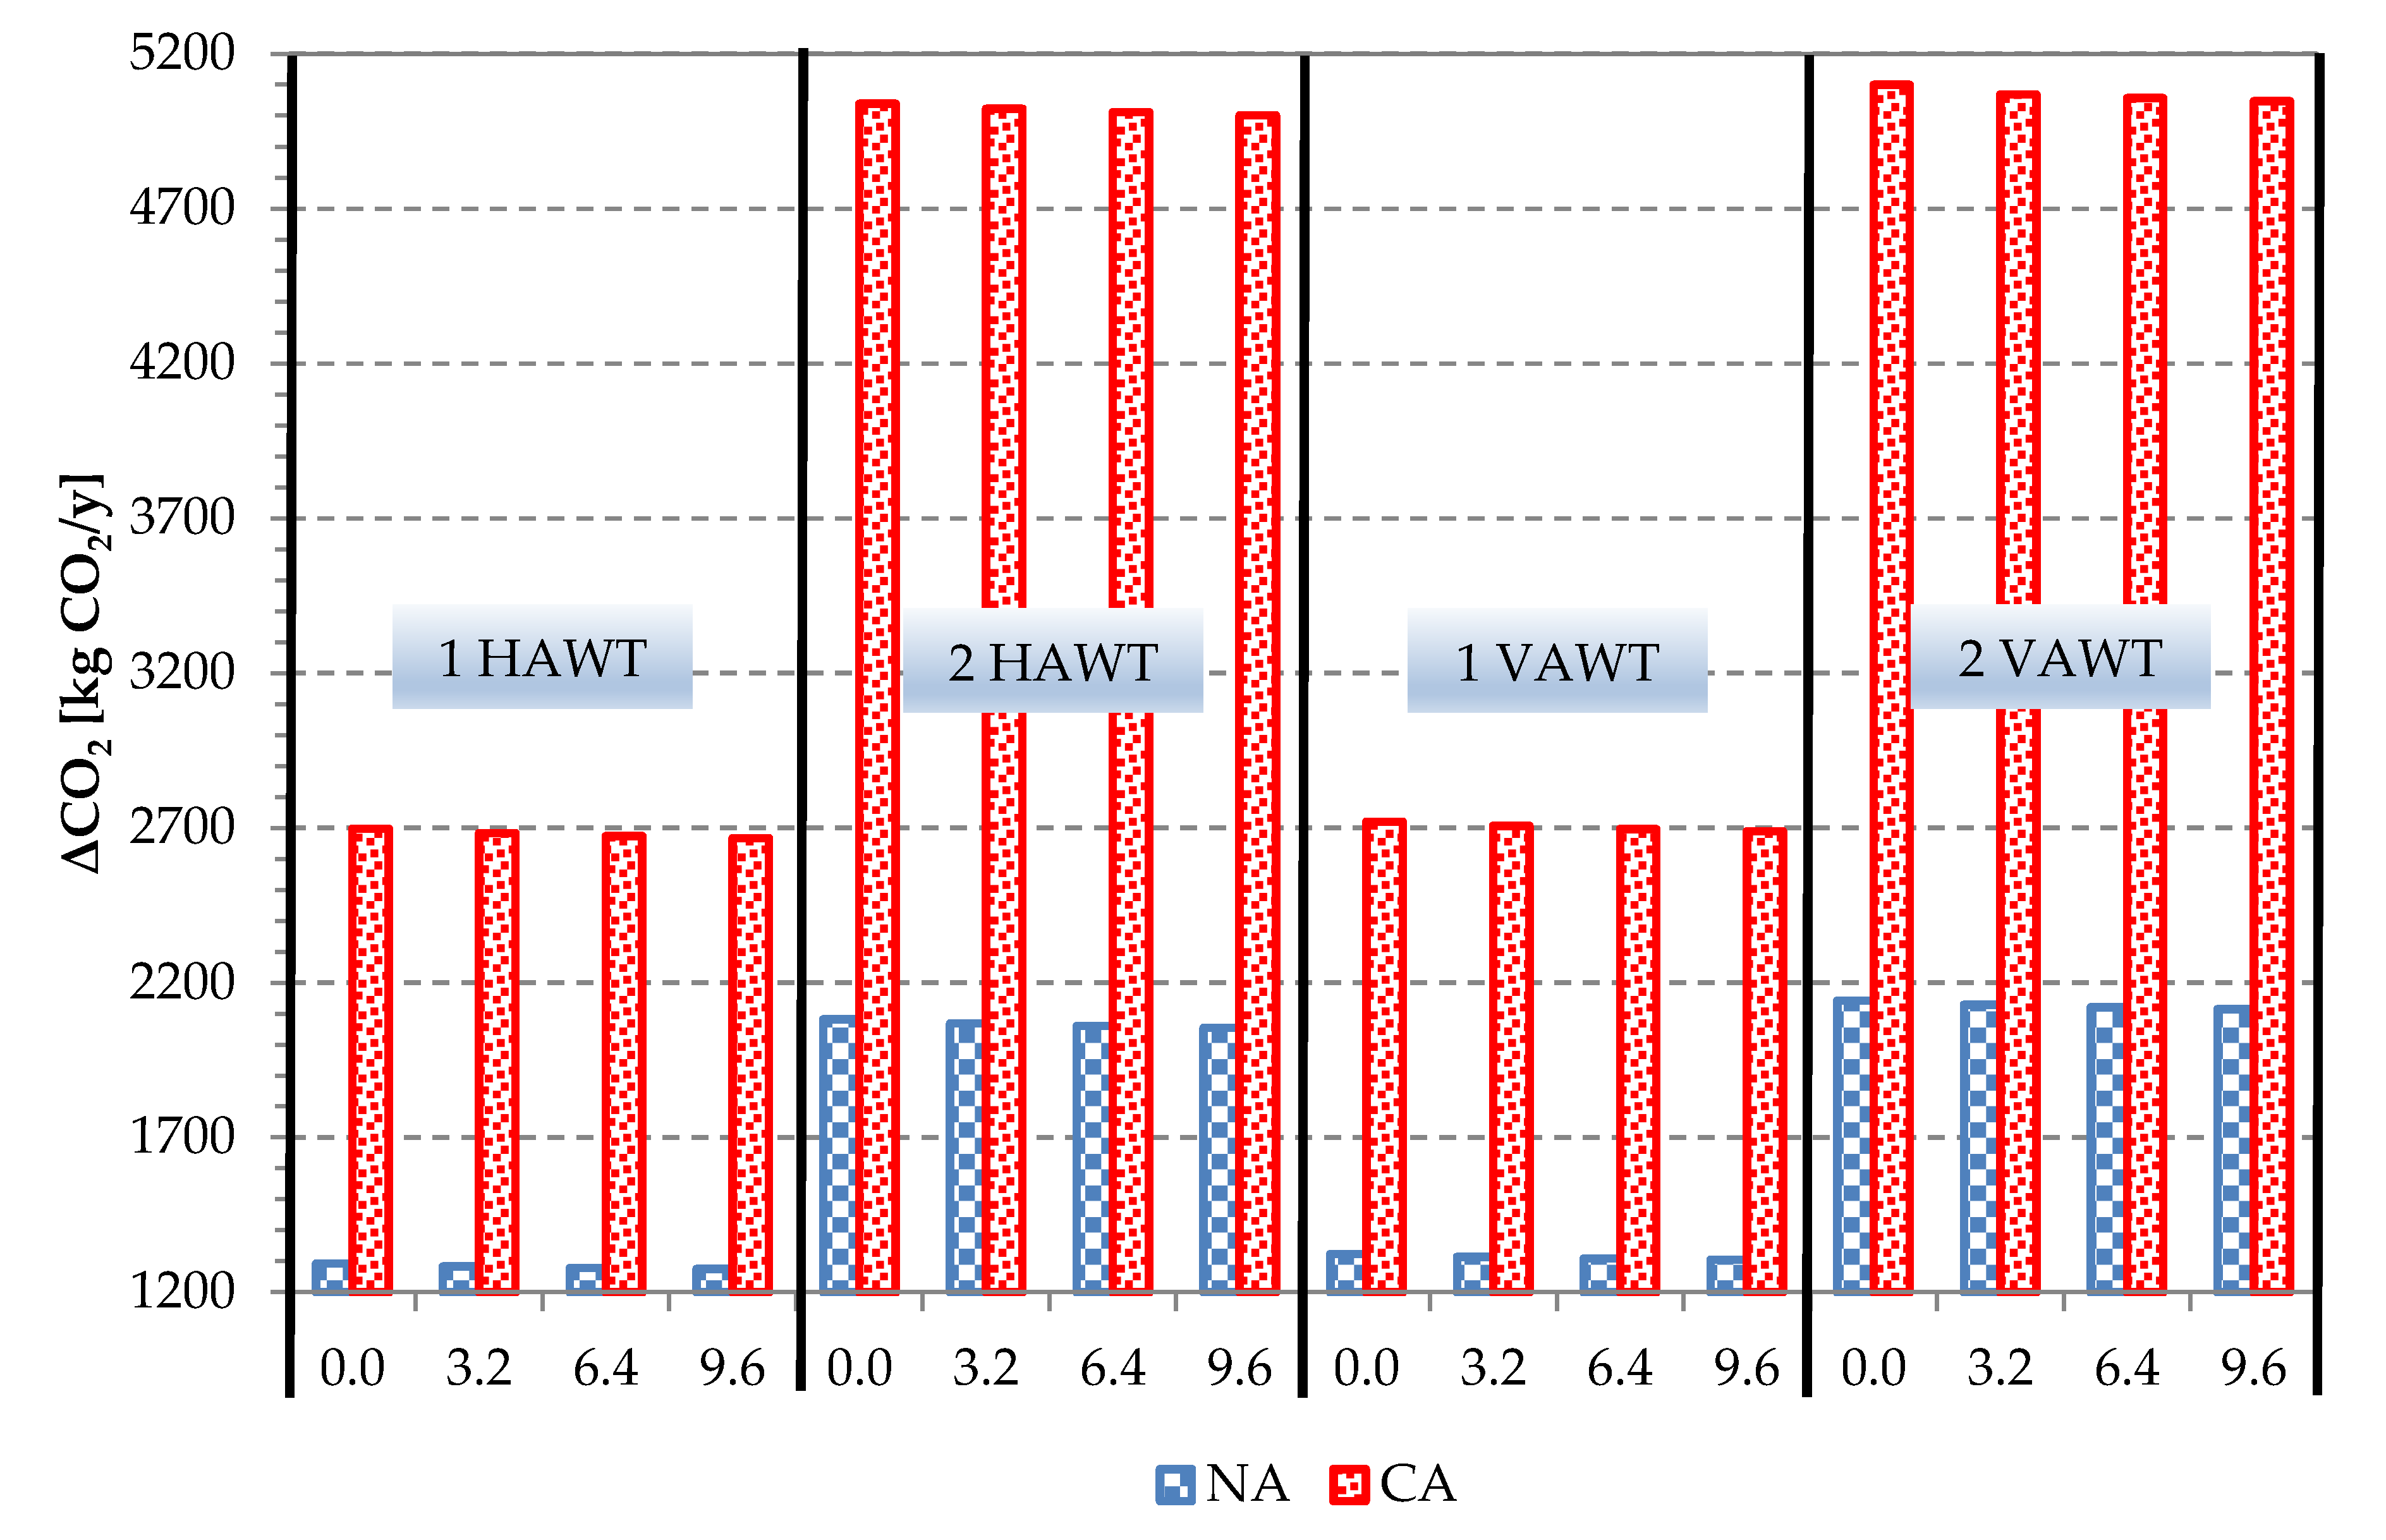
The environmental analysis was carried out by calculating the ∆CO2RPUL index described in Equation (12). Its trend was similar to that of PESPUL, reported in Table 8. Thanks to the WT-based system, a certain reduction in CO2 emission took place consequent to the reduced use of fossil fuel. In Cagliari, there was a reduction in greenhouse gas emissions between 0.153 and 0.288 kg CO2 per kWh of final energy demand, while these values ranged between 0.068 and 0.115 kg CO2 per kWh of final energy demand in Naples. The results were better for Cagliari due to the higher availability of wind energy.
In particular, thanks to the introduction of the PS, the highest reduction in terms of CO2 emissions per year was 5100 kg in Cagliari and 2142 kg in Naples (Figure 15). The best solution in both cities was once again that based on two wind turbines with a vertical axis. The amount of CO2 emitted per year decreased slightly with the battery size and presented low variations with the type of the WT. In Cagliari, the ΔCO2 was about 1.8 times higher in the system with two WTs than that in the configuration with one turbine. This proportion dropped to 1.6 when considering Naples.
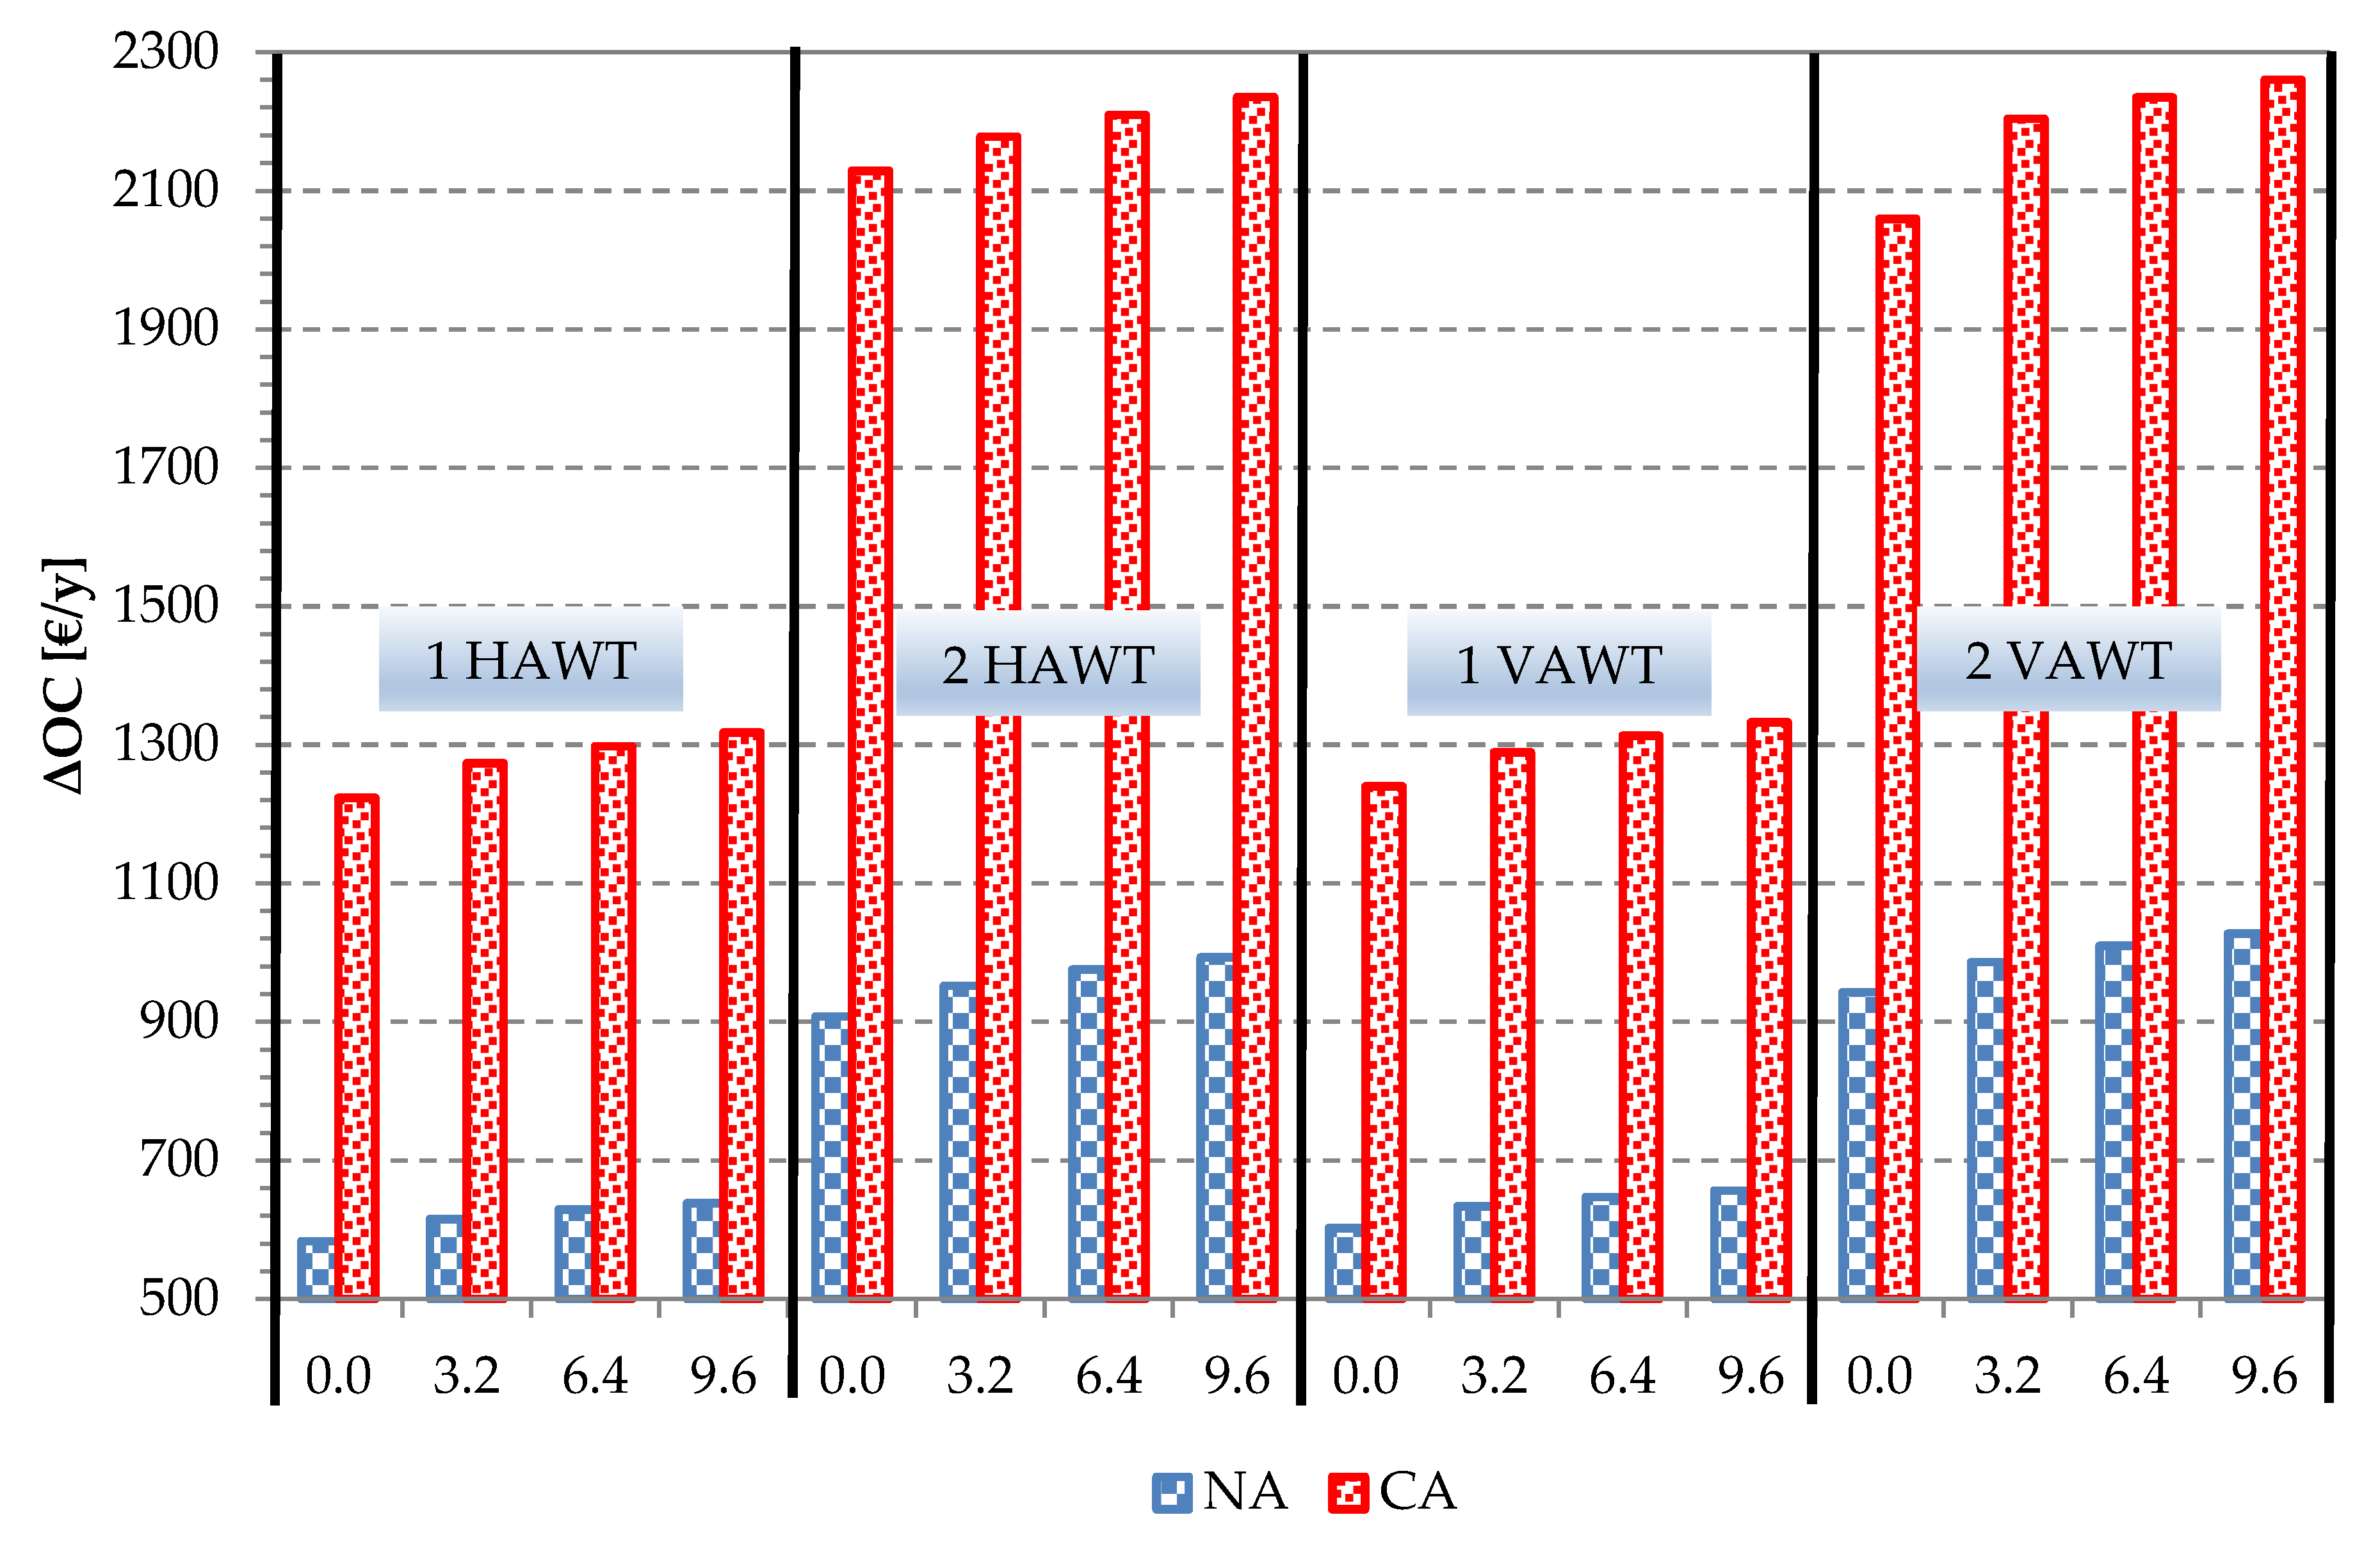
Figure 16 reports the operating cost reduction due to the introduction of PS upon varying the WT technology (HA, VA), number of WTs (one, two), battery size (0.0–9.6 kWh), and location (Naples, Cagliari). The economic analysis led to a reduction in the operating costs of the WT-based system that increased with moving from Naples to Cagliari, with the number of turbines, and with the size of battery storage. The results were little dependent on the WT axis position. The best result, 2260 € per year, was obtained for Cagliari for the configuration 2 VAWT with 9.6 kWh of electricity storage. For Naples, the worst result was for 1 HAWT without battery (583 € per year). The renewable-based solution, despite guaranteeing a reduction in operating costs, appeared uninteresting due to the high investment costs due to wind turbines, GSHP, batteries, and the borehole heat exchanger.
8. Conclusions
A renewable activated plant based on a wind turbine that supplies electricity to meet the pure electric load, as well as the heating and cooling demand, of an office building located in both Naples and Cagliari was analyzed. Specifically, the proposed system was composed of a GSHP interacting with a WT plant. Dynamic simulations were carried out to assess the energy, environmental and economic potential of the renewable-based plant, while modifying WT technology and battery storage capacity. The energy and environmental analysis showed interesting results for the proposed system and with a fixed configuration, slightly depending on the battery size. Primary energy savings (ΔEp) guaranteed by the proposed system was between about 6.95 MWh (1 HAWT) and 10.4 MWh (2 VAWT) per year for Naples, while the same configurations for Cagliari were characterized by a range between 12.2 MWh (1 HAWT) and 21.7 MWh (2 VAWT). On an environmental basis, the reduction in greenhouse gas emissions due to the proposed system (ΔCO2) ranged between 1275 kg CO2 (1HAWT) and 2140 kg CO2 (2 VAWT) per year for Naples. Energy (PESPUL) and environmental (∆CO2RPUL) performance indexes highlighted the role of the renewable-based system. The first index highlighted the primary energy savings with respect to total energy demand of the end-user, reaching 1.24 for Cagliari (2 VAWT, no battery) and 0.56 for Naples (2 VAWT, no battery). The environmental impact index allowed the evaluation of the reduction of greenhouse emission due to the proposed system; their values, expressed in kg CO2 per kWh of final energy demand, ranged between 0.151 (1 HAWT, 9.6 kWh) and 0.288 (2 VAWT, no battery) for Cagliari, and between 0.068 and 0.151 for Naples. Increasing the WT capacity for renewable electricity satisfied up to 25.1% in Naples and 47.7% in Cagliari of the total electricity demand when two vertical axis WTs and a 9.6 kWh battery storage were considered. For this last configuration, the share of the WT production exploited on-site was 63.1% for Naples and 40.1% for Cagliari. The percentage of renewable electricity fed to the office building decreased with WT nominal capacity and grew with battery storage size, reaching the best result (83.1%) in Naples for one vertical axis WT and 9.6 kWh. The use of a battery storage system reduced the interaction with the national power grid, highlighting the benefits of this device. The economic analysis led to a reduction in operating costs due to the renewable-based system, despite the high investment cost due to wind turbine, GSHP, borehole heat exchanger, and electricity storage at present.
Author Contributions
Conceptualization, C.R., M.S. and F.T.; Methodology, C.R., M.S. and F.T.; Software, C.R., M.S. and F.T.; Validation, C.R., M.S. and F.T.; Visualization, C.R., M.S. and F.T.; Writing-Original Draft Preparation, C.R., M.S. and F.T.; Writing-Review & Editing, C.R., M.S. and F.T. All authors have read and agreed to the published version of the manuscript.
Funding
The Campania Region (Regione Campania, Italy) within the framework of the GeoGRID Project (Progetto GEOGRID—Tecnologie e sistemi innovativi per l’utilizzo sostenibile dell’energia geotermica—CUP: B43D18000230007; PON03PE_00171_1), has supported this work.
Conflicts of Interest
The authors declare no conflict of interest.
Nomenclature
| A | Area (m2) |
| Cap | Capacity (kW) |
| COP | Coefficient of performance |
| CO2 | CO2 emission (kgCO2) |
| CO2RPUL | CO2 emission reduction per unit load (kgCO2/kWh) |
| CP | Power coefficient |
| cp | Specific heat (kJ/kgK) |
| E | Energy (kWh) |
| FFLP | Fraction of full load power |
| h | Specific enthalpy (kJ/kg) |
| IC | Investment cost (€) |
| Mass flow rate (kg/s) | |
| OC | Operating cost (€/y) |
| P | Power (kW) |
| PESPUL | primary energy saving per unit load |
| PLR | Partial load ratio |
| U | Thermal transmittance (W/m2K) |
| W0 | Air speed in the free stream (m/s) |
| Greek symbols | |
| η | Efficiency |
| ρ | Air density (kg/m3) |
| Δ | Difference |
| Superscripts | |
| B | Boiler |
| BAT | Battery |
| BHE | borehole heat exchanger |
| CH | Chiller |
| CS | Conventional system |
| FC | Fan coil |
| Grid | Grid |
| Grid-exp | Fed into the grid |
| GSHP | Ground source heat pump |
| INV | Inverter |
| US | User |
| WT | Wind turbine |
| Subscripts | |
| a | Air |
| av | Average |
| co | Cooling |
| coil | Coil |
| el | Electric |
| env | Environment |
| fan | Fan |
| h | Heating |
| in | Input |
| l | Load |
| no-CH | Not related to chiller |
| no-GSHP | Not related to ground source heat pump |
| out | Output |
| p | Primary |
| R | Rotor of the wind turbine |
| s | Source |
| sp | Set-point |
| th | Thermal |
| tot | Total |
| w | Water |
| Acronyms | |
| AHU | Air handling unit |
| B | Boiler |
| BAT | Battery storage |
| BHE | Borehole heat exchanger |
| CA | Cagliari |
| CH | Chiller |
| COP | Coefficient of performance |
| CS | Conventional system |
| EER | Energy efficiency ratio |
| FC | Fan coil |
| GSHP | Ground source heat pump |
| HAWT | Horizontal axis wind turbine |
| HVAC | Heating, ventilation, and air-conditioning |
| INV | Inverter |
| NA | Naples |
| PS | Proposed system |
| VAWT | Vertical axis wind turbine |
| WGI | Wind generator interface, rectifier |
| WT | Wind turbine |
References
- European Directive. Directive 2009/28/EC of the European Parliament and of the Council of 23 April 2009 on the promotion of the use of energy from renewable sources and amending and subsequently repealing Directives 2001/77/EC and 2003/30/EC. Off. J. Eur. Union 2009, 5, 2009. [Google Scholar]
- European Directive. Directive 2010/31/EU of the European Parliament and of the Council of 19 May 2010 on the energy performance of buildings. Off. J. Eur. Union 2010, 153, 13–35. [Google Scholar]
- European Directive. Directive 2012/27/EU of the European Parliament and of the Council of 25 October 2012 on energy efficiency, amending Directives 2009/125/EC and 2010/30/EU and repealing Directives 2004/8/EC and 2006/32/EC. Off. J. Eur. Union 2012, 315, 1–56. [Google Scholar]
- European Commission. Communication from the Commission to the European Parliament, the Council, the European Economic and Social Committee and the Committee of the Regions on an EU Strategy for Heating and Cooling. 2016. Available online: https://ec.europa.eu/transparency/regdoc/rep/1/2016/EN/1-2016-51-EN-F1-1.PDF (accessed on 15 April 2019).
- GSE. Gestore dei Servizi Energetici (Public Authority for Energy Services), Valutazione del Potenziale Nazionale di Applicazione Della Cogenerazione ad Alto Rendimento e Teleriscaldamento Efficiente (Evaluation of the National Potential for the Application of High-Efficiency Cogeneration and District Heating). 2015. Available online: http://www.gse.it/it/DatieBilanci/GSE_Documenti/Studi/PotenzialeCAReTLR.pdf (accessed on 15 April 2019).
- Balaras, C.A.; Grossman, G.; Henning, H.M.; Infante Ferreira, C.A.; Podesser, E.; Wang, L.; Wiemken, E. Solar air conditioning in Europe-an overview. Renew. Sustain. Energy Rev. 2007, 11, 299–314. [Google Scholar] [CrossRef]
- Terna, Statistics and Forecasts, Statistical Data, Production. 2017. Available online: https://www.terna.it/en-gb/sistemaelettrico/statisticaldata.aspx (accessed on 15 April 2019).
- GSE, Gestore dei Servizi Energetici (Public Authority for Energy Services), Il Punto Sull’eolico (The Situation on Wind Energy). 2017. Available online: www.gse.it/documenti_site/DocumentiGSE/Studiescenari/Ilpuntosull’eolico.pdf (accessed on 15 April 2019).
- Cao, S.; Klein, K.; Herkel, S.; Sirén, K. Approaches to enhance the energy performance of a zero-energy building integrated with a commercial-scale hydrogen fueled zero-energy vehicle under Finnish and German conditions. Energy Convers. Manag. 2017, 142, 153–175. [Google Scholar] [CrossRef]
- Tu, T.; Rajarathnam, G.P.; Vassallo, A.M. Optimization of a stand-alone photovoltaic-wind-diesel-battery system with multi-layered demand scheduling. Renew. Energy 2019, 131, 333–347. [Google Scholar] [CrossRef]
- Stanek, W.; Simla, T.; Gazda, W. Exergetic and thermo-ecological assessment of heat pump supported by electricity from renewable sources. Renew. Energy 2019, 131, 404–412. [Google Scholar] [CrossRef]
- Leon-Vargas, F.; García-Jaramillo, M.; Krejci, E. Pre-feasibility of wind and solar systems for residential self-sufficiency in four urban locations of Colombia: Implication of new incentives included in Law 1715. Renew. Energy 2019, 130, 1082–1091. [Google Scholar] [CrossRef]
- Vanhoudt, D.; Geysen, D.; Claessens, B.; Leemans, F.; Jespers, L.; Van Bael, J. An actively controlled residential heat pump: Potential on peak shaving and maximization of self-consumption of renewable energy. Renew. Energy 2014, 63, 531–543. [Google Scholar] [CrossRef]
- Nakomčić-Smaragdakis, B.B.; Dragutinović, N.G. Hybrid renewable energy system application for electricity and heat supply of a residential building. Therm. Sci. 2016, 20, 695–706. [Google Scholar] [CrossRef] [Green Version]
- Li, H.; Campana, P.E.; Berretta, S.; Tan, Y.; Yan, J. Dynamic performance of the standalone wind power driven heat pump. Energy Procedia 2016, 103, 40–45. [Google Scholar] [CrossRef]
- Li, H.; Campana, P.E.; Tan, Y.; Yan, J. Feasibility study about using a stand-alone wind power driven heat pump for space heating. Appl. Energy 2018, 228, 1486–1498. [Google Scholar] [CrossRef]
- Dursun, E.; Kilic, O. Comparative evaluation of different power management strategies of a stand-alone PV/Wind/PEMFC hybrid power system. Int. J. Electr. Power Energy Syst. 2012, 34, 81–89. [Google Scholar] [CrossRef]
- Toujani, R.; Iffa, R.B.; Bouaziz, N. An improved cycle for heat pump application in hybrid-lift absorption/compression system integrated a wind energy and using organic fluid mixtures. Energy Procedia 2019, 157, 1278–1284. [Google Scholar] [CrossRef]
- Ozener, O. Use of solar assisted geothermal heat pump and small wind turbine systems for heating agricultural and residential buildings. Energy 2010, 35, 262–268. [Google Scholar] [CrossRef]
- Mazzeo, D. Solar and wind assisted heat pump to meet the building air conditioning and electric energy demand in the presence of an electric vehicle charging station and battery storage. J. Clean. Prod. 2019, 213, 1228–1250. [Google Scholar] [CrossRef]
- Roselli, C.; Sasso, M.; Tariello, F. Wind electric heating and cooling system for an office application. In Proceedings of the Conference on Sustainable Development of Energy, Water and Environment Systems (SDEWES 20219), Dubrovnik, Croatia, 1–6 October 2019; pp. 1–14. [Google Scholar]
- Ergonomics of the Thermal Environment—Analytical Determination and Interpretation of Thermal Comfort Using Calculation of the PMV and PPD Indices and Local Thermal Comfort Criteria; ISO: Geneva, Switzerland, 2005.
- Regolamento recante norme per la progettazione, l’installazione, l’esercizio e la manutenzione degli impianti termici degli edifici ai fini del contenimento dei consumi di energia, in attuazione dell’art. 4, comma 4, della legge 9 gennaio 1991, n. 10. Gazz. Uff. Repubb. Ital. SO. 1993. Available online: https://www.gazzettaufficiale.it/eli/id/1993/10/14/093G0451/sg (accessed on 13 February 2020).
- Menezes, A.C.; Cripps, A.; Buswell, R.A.; Wright, J.; Bouchlaghem, D. Estimating the energy consumption and power demand of small power equipment in office buildings. Energy Build. 2014, 75, 199–209. [Google Scholar] [CrossRef] [Green Version]
- Bergey. Datasheet Bergey Excel 5. 2018. Available online: www.bergey.com (accessed on 23 November 2018).
- Aeolos. Datasheet Aeolos-V 5kW. 2018. Available online: www.windturbinestar.com (accessed on 23 November 2018).
- LG. Datasheet RESU 6.4 EX. 2018. Available online: http://www.lgchem.com (accessed on 23 March 2018).
- Aermec. Datasheet WRL H51. 2018. Available online: www.aermec.com (accessed on 23 March 2018).
- ABB. Datasheet Wind Inverter. 2019. Available online: New.abb.com/power-converters-inverters/wind-turbines/small-wind (accessed on 15 April 2019).
- Kavanaugh, S.P.; Rafferty, K. Ground-Source Heat Pumps-Design of Geothermal System for Commercial and Institutional Buildings; ASHRAE Applications Handbook: Atlanta, GA, USA, 1997; ISBN 1883413524. [Google Scholar]
- TRNSYS 17, A TRaNsient SYstem Simulation Program, Solar Energy Laboratory; University of Wisconsin-Madison: Madison, WI, USA, 2010.
- T.E.S.S. Component Libraries v.17.01 for TRNSYS v17.0 and the TRNSYS Simulation Studio, Parameter/Input/Output Reference Manual, Thermal Energy System Specialists, LLC. 2004. Available online: http://www.trnsys.com/tess-libraries/ (accessed on 13 February 2020).
- Sabiana. Datasheet CRC 43. 2018. Available online: http://www.sabiana.it (accessed on 23 March 2018).
- Energy Plus Weather Data File. Available online: https://energyplus.net/weather (accessed on 13 February 2020).
- ISPRA, (Institute for Environmental Protection and Research), Fattori di Emissione Atmosferica di CO2 e Sviluppo Delle Fonti Rinnovabili Nel Settore Elettrico (CO2 Emission Factors and Development of Renewable-Based Systems in Electricity Sector). 2017. Available online: http://www.isprambiente.gov.it/files/pubblicazioni/rapporti/R_257_17.pdf (accessed on 24 November 2018).
- ISPRA, (Institute for Environmental Protection and Research), Fattori di Emissione Per la Produzione e il Consumo di Energia Elettrica in Italia—Aggiornamento al 2016 e Stime Preliminari Per il 2017 (CO2 Emission Factors in Electricity Sector in Italy-Years 2016/17). 2017. Available online: http://www.sinanet.isprambiente.it/it/sia-ispra/serie-storiche-emissioni/fattori-di-emissione-per-la-produzione-ed-il-consumo-di-energia-elettrica-in-italia/at_download/file (accessed on 24 November 2018).
- Bukala, J.; Damaziak, K.; Kroszczynski, K.; Malachowski, J.; Szafranski, T.; Tomaszewski, M.; Karimi, H.R.; Jozwik, K.; Karczewski, M.; Sobczak, K. Small Wind Turbines: Specification, Design, and Economic Evaluation. In Wind Turbines—Design, Control and Applications; Aissaoui, A.G., Tahour, A., Eds.; InTech Janeza Trdine: Rijeka, Croatia, 2016. [Google Scholar] [CrossRef] [Green Version]
- Basta, S.; Minchio, F. Geotermia e Pompe di Calore (Geothermal Energy and Heat Pumps); Hoepli: Milan, Italy, 2008. [Google Scholar]
- Weniger, J.; Tjaden, T.; Quaschning, V. Sizing of residential PV battery systems. Energy Procedia 2014, 46, 78–87. [Google Scholar] [CrossRef] [Green Version]
- Angrisani, G.; Canelli, M.; Roselli, C.; Sasso, M. Integration between electric vehicle charging and micro-cogeneration system. Energy Convers. Manag. 2015, 98, 115–126. [Google Scholar] [CrossRef]
Figure 1.
Monthly heating and cooling demands for Naples (horizontal striped filled column) and Cagliari (oblique striped filled column).
Figure 1.
Monthly heating and cooling demands for Naples (horizontal striped filled column) and Cagliari (oblique striped filled column).

Figure 2.
Daily pure electric load profiles (weekdays, weekends) considered for both Naples and Cagliari.
Figure 2.
Daily pure electric load profiles (weekdays, weekends) considered for both Naples and Cagliari.

Figure 3.
Proposed and conventional systems in heating and cooling configurations.

Figure 4.
TRNSYS project scheme.

Figure 5.
Monthly average temperature from weather data files.

Figure 6.
Monthly average wind speed from weather data files.

Figure 7.
Duration curve of the wind speed.

Figure 8.
Horizontal and vertical axis wind turbine (HAWT and VAWT) electricity generation on a monthly basis for both Naples and Cagliari.
Figure 8.
Horizontal and vertical axis wind turbine (HAWT and VAWT) electricity generation on a monthly basis for both Naples and Cagliari.

Figure 9.
HAWT and VAWT specific electricity generation on a monthly basis for both Naples and Cagliari.
Figure 9.
HAWT and VAWT specific electricity generation on a monthly basis for both Naples and Cagliari.

Figure 10.
Electricity distribution for Naples as a function of WT configuration and battery storage capacity.
Figure 10.
Electricity distribution for Naples as a function of WT configuration and battery storage capacity.

Figure 11.
Electricity distribution for Cagliari as a function of WT configuration and battery storage capacity.
Figure 11.
Electricity distribution for Cagliari as a function of WT configuration and battery storage capacity.

Figure 12.
s and d indexes as a function of WT configuration (type and number) and battery storage capacity for Naples.
Figure 12.
s and d indexes as a function of WT configuration (type and number) and battery storage capacity for Naples.

Figure 13.
Monthly electricity fluxes for plant configuration: (a), 1 HAWT and 9.6 kWh and (b) 2 VAWT and 9.6 kWh, in Naples.
Figure 13.
Monthly electricity fluxes for plant configuration: (a), 1 HAWT and 9.6 kWh and (b) 2 VAWT and 9.6 kWh, in Naples.

Figure 14.
Primary energy demand reduction for both Naples and for Cagliari, as well as for WT configuration.
Figure 14.
Primary energy demand reduction for both Naples and for Cagliari, as well as for WT configuration.

Figure 15.
Carbon dioxide emission reduction for both Naples and for Cagliari, as well as for WT configuration and battery size.
Figure 15.
Carbon dioxide emission reduction for both Naples and for Cagliari, as well as for WT configuration and battery size.

Figure 16.
Operating cost reduction due to introduction of PS upon varying WT technology (HA, VA), number of WTs (one, two), battery size (0.0–9.6 kWh), and location (Naples, Cagliari).
Figure 16.
Operating cost reduction due to introduction of PS upon varying WT technology (HA, VA), number of WTs (one, two), battery size (0.0–9.6 kWh), and location (Naples, Cagliari).


Table 1.
Office building envelope data.
| Envelope Element | Overall Heat Transfer Coefficient (W/(m2K)) | Area (m2) | g-Value (-) |
|---|---|---|---|
| Window | 2.58 | 45 | 0.75 |
| Flat roof | 0.38 | 200 | - |
| External wall | 0.40 | 135 | - |
| Ground floor | 0.42 | 200 | - |
Table 2.
Rated ground source heat pump (GSHP) data. COP-coefficient of performance; EER-energy efficiency ratio.
Table 2.
Rated ground source heat pump (GSHP) data. COP-coefficient of performance; EER-energy efficiency ratio.
| Heating | Heating output (kW) | 16.5 | Cooling | Cooling output (kW) | 13.7 |
| Electric power input (kW) | 4.13 | Electric power input (kW) | 3.14 | ||
| COP (-) | 4.00 | EER (-) | 4.36 |
Table 3.
Borehole main characteristics.
| Borehole | Values | Unit |
|---|---|---|
| Diameter | 0.125 | m |
| Backfill material | A mixture of bentonite and cement | - |
| Backfill conductivity | 1.4 | W·m−1·K−1 |
| Shank spacing | 0.075 | m |
| Tube shape and material | U-tube of high-density polyethylene | - |
| Tube radius | 0.016 | m |
| Ground conductivity | 2.0 | W·m−1·K−1 |
| Ground diffusivity | 9.2·10−7 | m2·s−1 |
Table 4.
Main components of the conventional system (CS) and proposed system (PS) and their models.
| Component | Type | Library | Mathematical Model Description |
|---|---|---|---|
| Wind turbine | 90 | Standard | The electric power output (Pel,out) is evaluated through the power coefficient, Cp, (Betz’s model):
|
| Battery and charge system | 47a | Standard | The state of charge of the battery (BAT) is established as a function of the power input/output through an energy balance. |
| Inverter | 48b | Standard | It is a control system that establishes the charge/discharge of the battery as a function of the load (served with priority), the generated power availability, the state of charge of the BAT, and its upper and lower limit. |
| Ground source heat pump | 927 | TESS | The output temperatures of the heat transfer fluids at the source (water + glycol), i.e., borehole circuit, () and load side (water), i.e., heating and cooling loop, () of the GSHP are assessed using the capacity () and electric power () obtained from the performance map introduced in the type in both heating (h) and cooling operation (co):
|
| Borehole heat exchanger | 557 | TESS | The mathematical model of the BHE evaluates convective and conductive heat transfer within the pipes and the storage volume, respectively. The temperature in the ground is assessed in a threefold way: a global temperature, a local solution, and a steady-flux solution. An explicit finite difference method is used for the global and local temperature estimations. The steady-flux solution is evaluated analytically. and finally, a superposition method is assumed for the temperature calculation. |
| Boiler | 6 | Standard | The primary power necessary required by the boiler () to supply water circulating in the heating loop at the set point temperature () is evaluated considering environmental losses (Tenv) and a constant thermal efficiency ():
|
| Chiller | 655 | TESS | The output temperature of water at the load side (), i.e., that pumped to the fan coil, is established using the cooling capacity () obtained from the performance map introduced in the type and partial load factor (PLRCH):
|
| Building | 56 | Standard | This model represents a multi-zone building, with one or more air-nodes per zone, by solving an energy balance for each node. |
| Fan coil | 928 | TESS | In this work, it is assumed that no fresh air from outdoors is taken by the fan coil (FC); thus, the condition of the air exiting the FC in heating mode is characterized by the following enthalpy () and the same absolute humidity ratio of the input:
The temperature of the water exiting the coil (), instead, is |
* The parameters not specified in the table are reported in the nomenclature section.
Table 5.
Annual electricity demand of the end-user.
| Electricity per Year | PS (Naples) | CS (Naples) | PS (Cagliari) | CS (Cagliari) |
|---|---|---|---|---|
| Small power office equipment (MWh) | 5.93 | 5.93 | 5.93 | 5.93 |
| Lighting (MWh) | 2.35 | 2.35 | 2.35 | 2.35 |
| GSHP (MWh) | 2.15 | - | 1.90 | - |
| Chiller (MWh) | - | 1.84 | - | 1.88 |
| HVAC auxiliaries (MWh) | 0.97 | 0.81 | 0.91 | 0.76 |
| Total (MWh) | 11.39 | 10.92 | 11.08 | 10.92 |
Table 6.
Range for s and d factors considering the system located in Cagliari.
| 1HAWT | 2HAWT | 1VAWT | 2VAWT | |
|---|---|---|---|---|
| s | 25.6–35.0 | 36.1–46.8 | 26.4–35.7 | 37.4–47.7 |
| d | 43.2–59.8 | 30.4–39.8 | 44.1–60.3 | 31.1–40.1 |
Table 7.
Primary energy saving per unit load (PESPUL) as a function of WT configuration and battery storage size. CA—Cagliari; NA—Naples.
Table 7.
Primary energy saving per unit load (PESPUL) as a function of WT configuration and battery storage size. CA—Cagliari; NA—Naples.
| WT Configuration | 1 HAWT | 2 HAWT | 1 VAWT | 2 VAWT |
|---|---|---|---|---|
| PESPUL, CA (-) | 0.70–0.69 | 1.23–1.22 | 0.71–0.70 | 1.24–1.23 |
| PESPUL, NA (-) | 0.38–0.37 | 0.54–0.54 | 0.38–0.38 | 0.56–0.55 |
| Battery storage range (kWh) | 0.0–9.6 | 0.0–9.6 | 0.0–9.6 | 0.0–9.6 |
Table 8.
ΔCO2RPUL as a function of WT configuration, location, and battery storage capacity.
| WT Configuration | 1 HAWT | 2 HAWT | 1 VAWT | 2 VAWT |
|---|---|---|---|---|
| ΔCO2RPUL, CA (kg CO2/kWh) | 0.153–0.151 | 0.286–0.284 | 0.154–0.153 | 0.288–0.287 |
| ΔCO2RPUL, NA (kg CO2/kWh) | 0.069–0.068 | 0.112–0.111 | 0.071–0.070 | 0.115–0.113 |
| Battery capacity range (kWh) | 0.00–9.6 | 0.00–9.6 | 0.00–9.6 | 0.00–9.6 |
© 2020 by the authors. Licensee MDPI, Basel, Switzerland. This article is an open access article distributed under the terms and conditions of the Creative Commons Attribution (CC BY) license (http://creativecommons.org/licenses/by/4.0/).
Share and Cite
MDPI and ACS Style
Roselli, C.; Sasso, M.; Tariello, F. A Wind Electric-Driven Combined Heating, Cooling, and Electricity System for an Office Building in Two Italian Cities. Energies 2020, 13, 895. https://0-doi-org.brum.beds.ac.uk/10.3390/en13040895
AMA Style
Roselli C, Sasso M, Tariello F. A Wind Electric-Driven Combined Heating, Cooling, and Electricity System for an Office Building in Two Italian Cities. Energies. 2020; 13(4):895. https://0-doi-org.brum.beds.ac.uk/10.3390/en13040895
Chicago/Turabian StyleRoselli, Carlo, Maurizio Sasso, and Francesco Tariello. 2020. "A Wind Electric-Driven Combined Heating, Cooling, and Electricity System for an Office Building in Two Italian Cities" Energies 13, no. 4: 895. https://0-doi-org.brum.beds.ac.uk/10.3390/en13040895
Note that from the first issue of 2016, this journal uses article numbers instead of page numbers. See further details here.