Assessment of Grid-Connected Wind Turbines with an Inertia Response by Considering Internal Dynamics

 ,
,
Abstract
:1. Introduction
2. Modelling
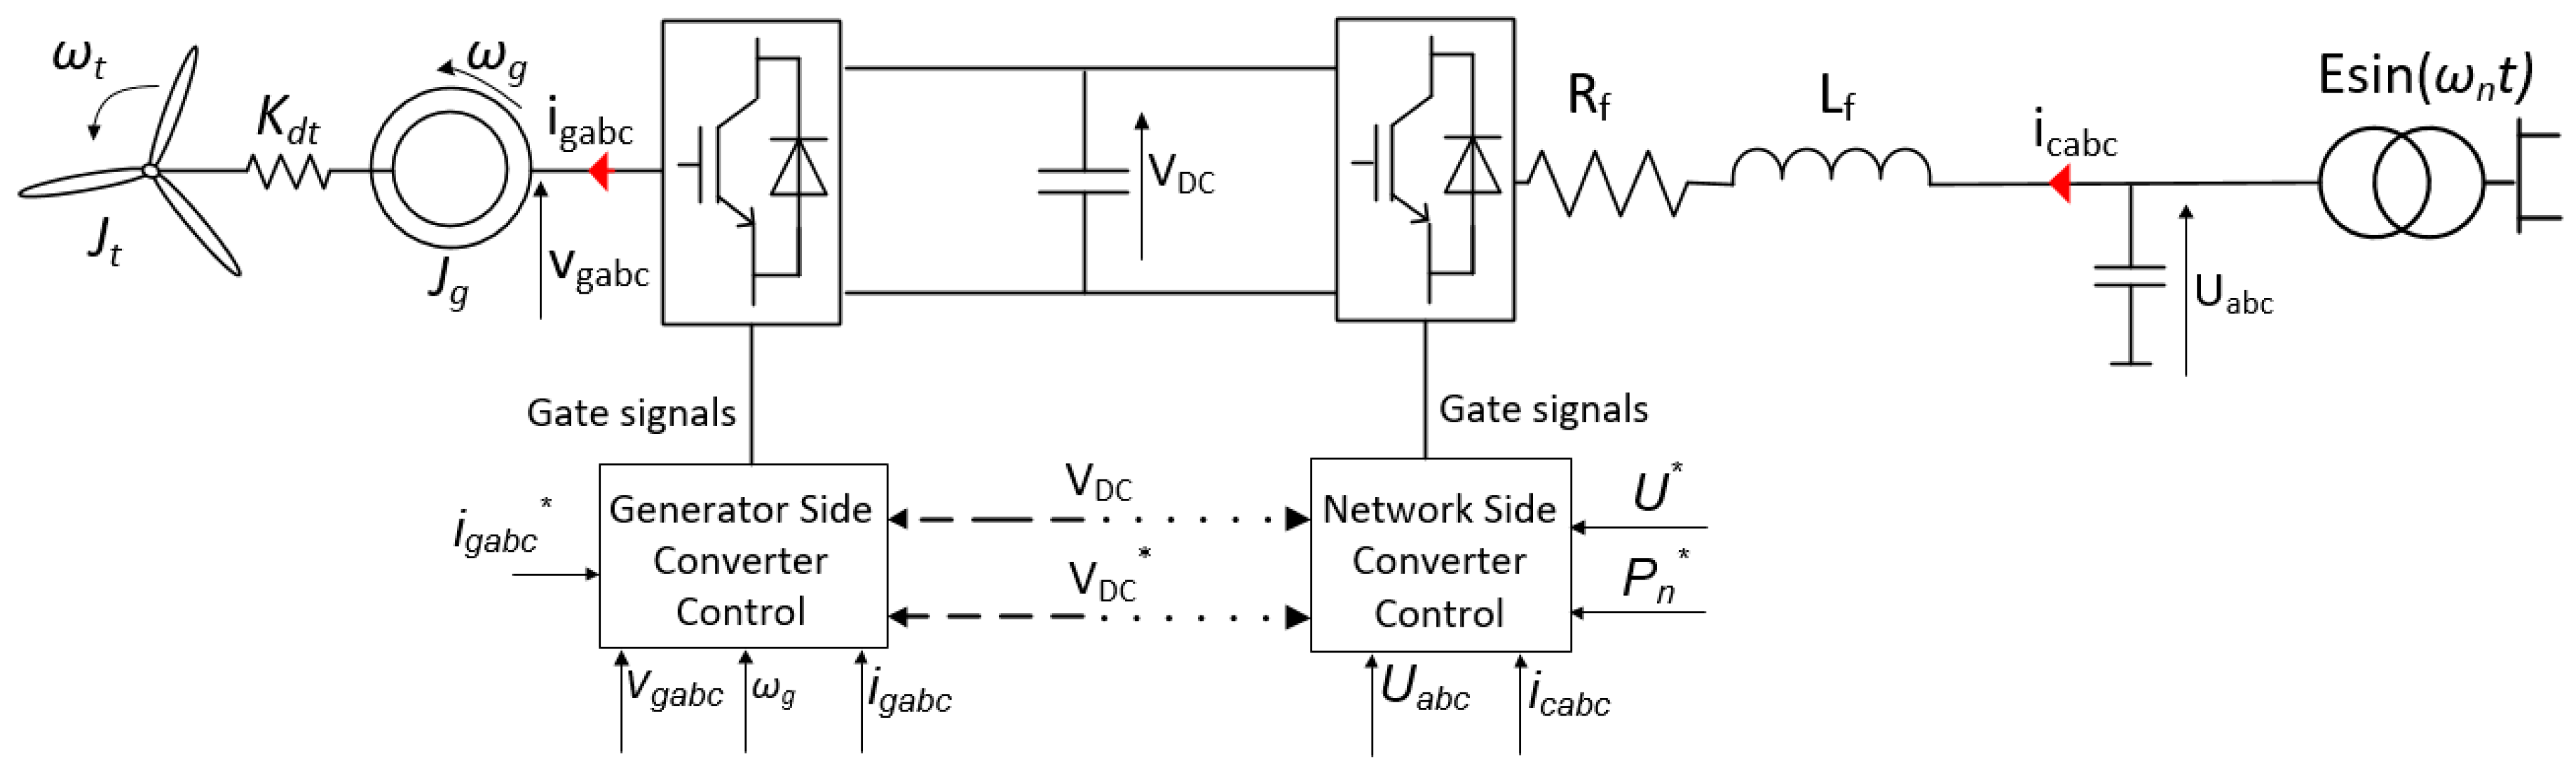
2.1. Hardware
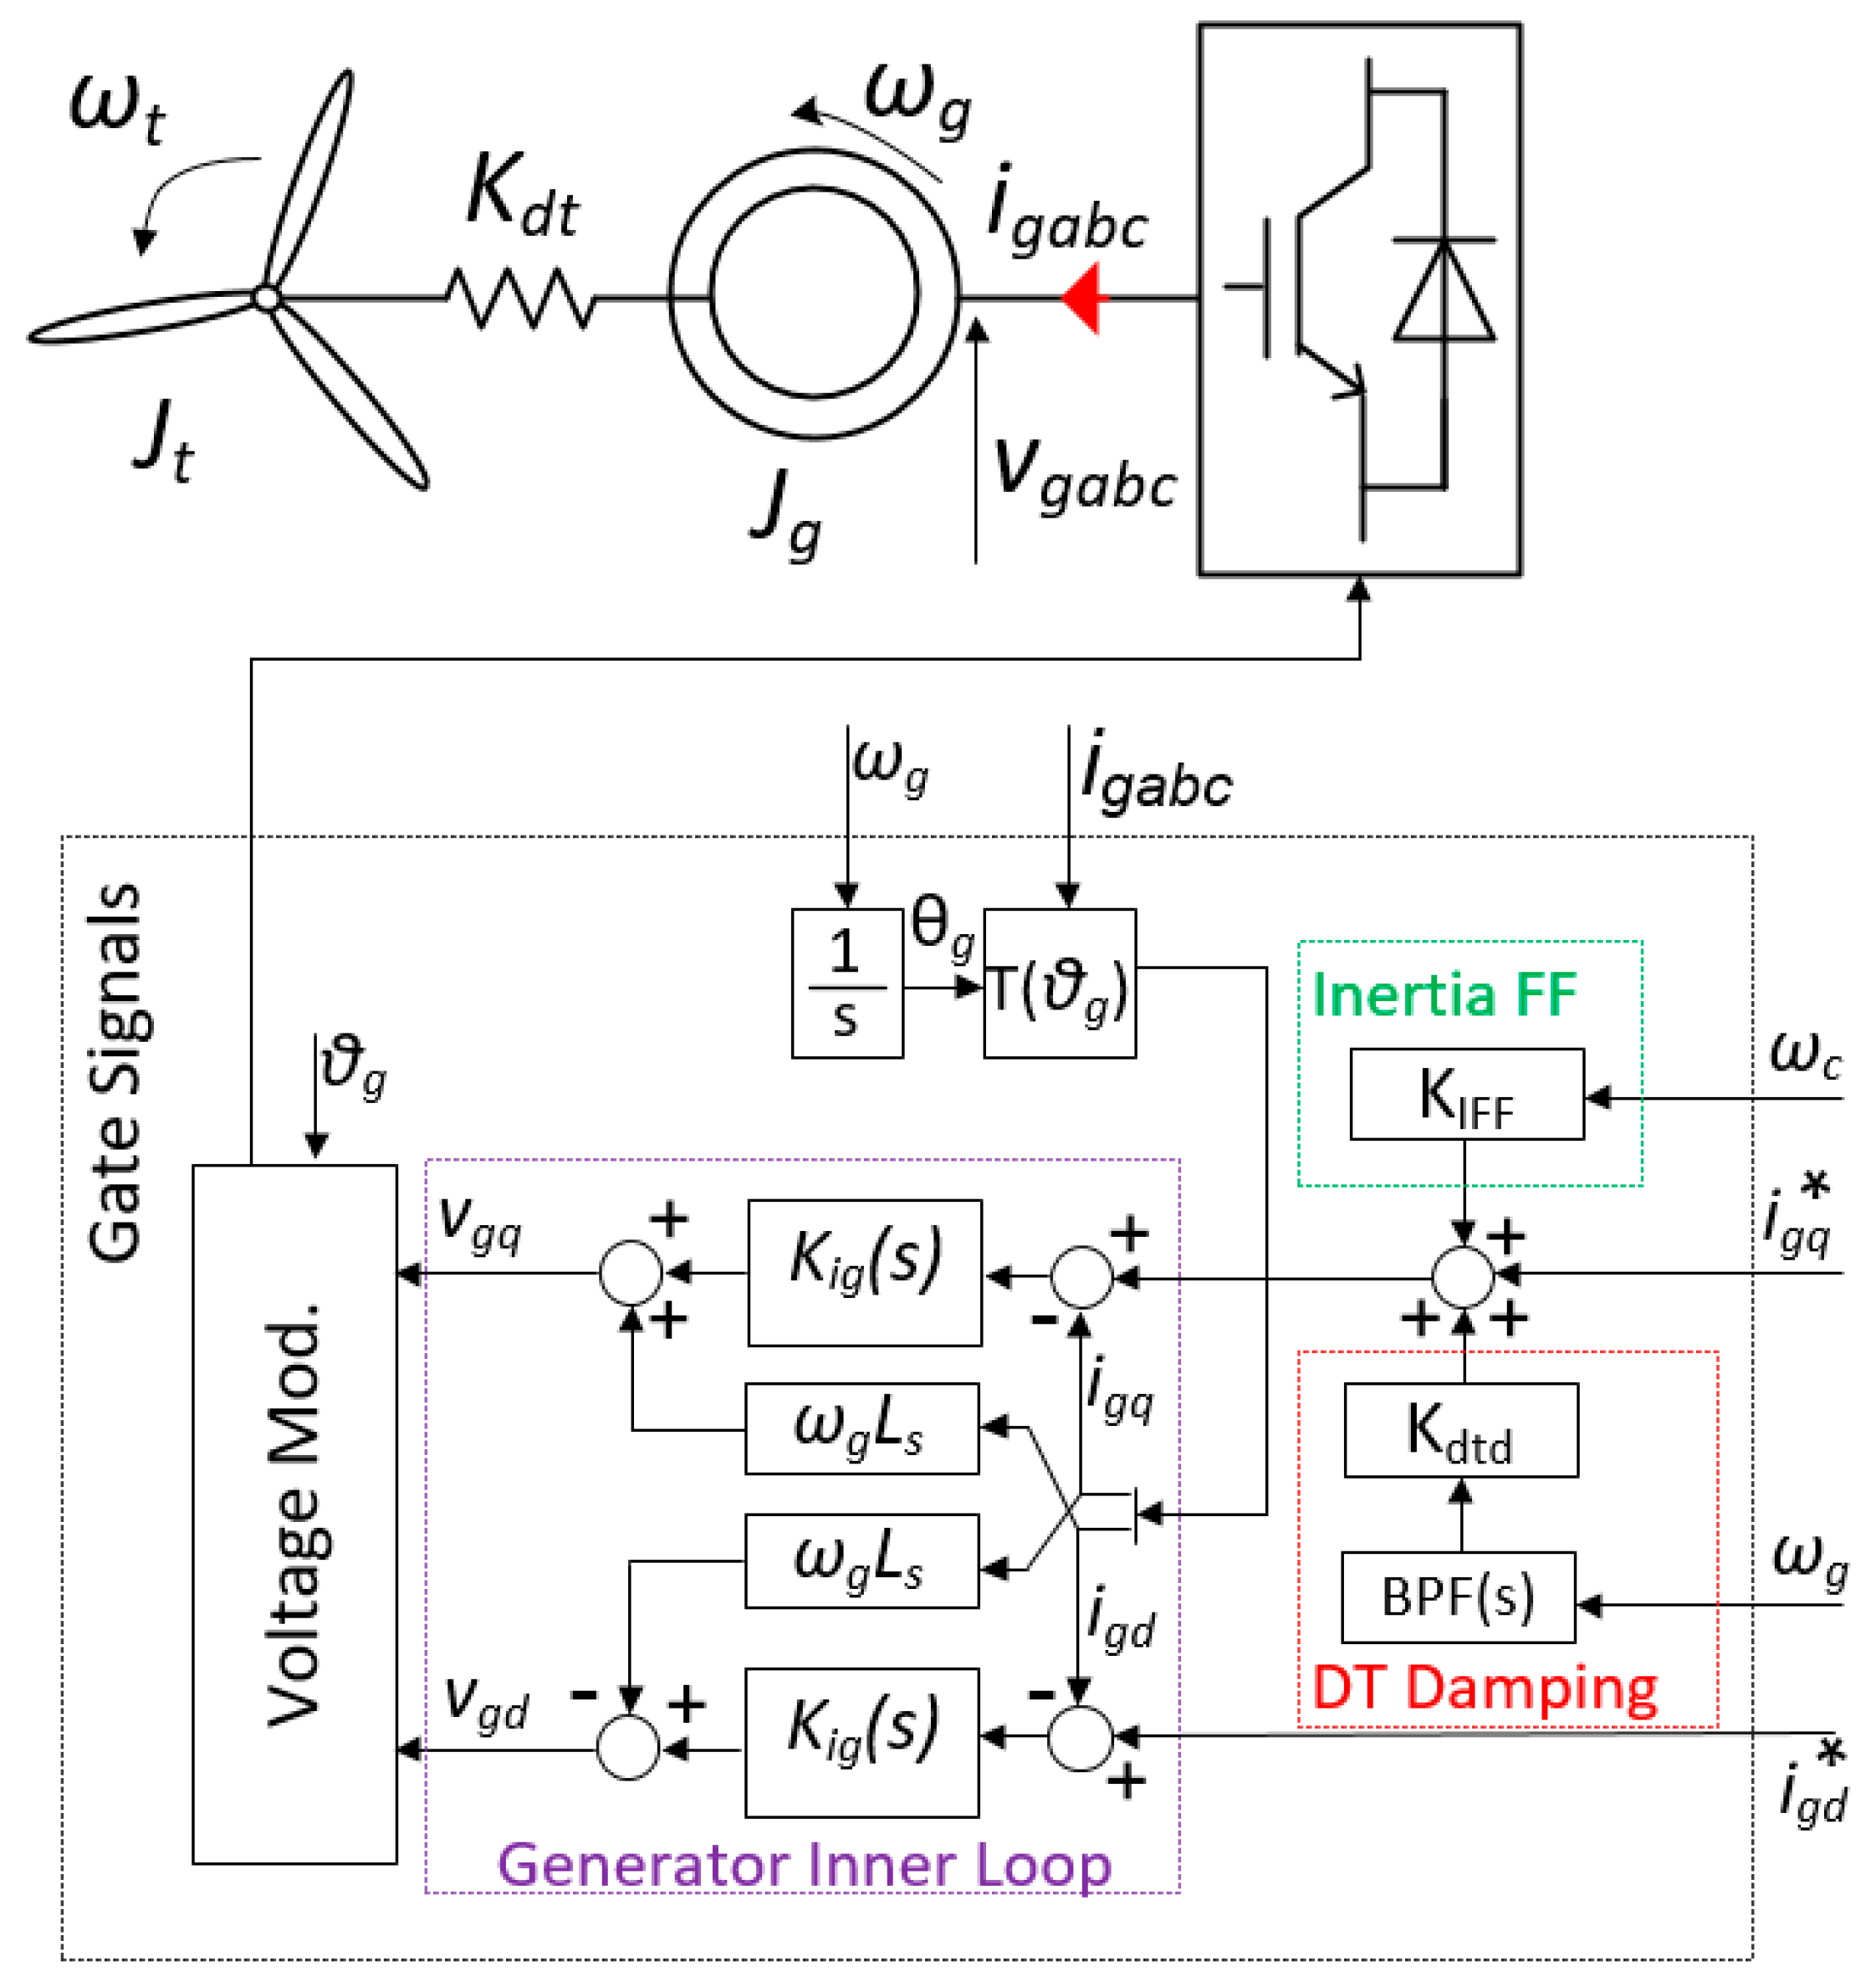
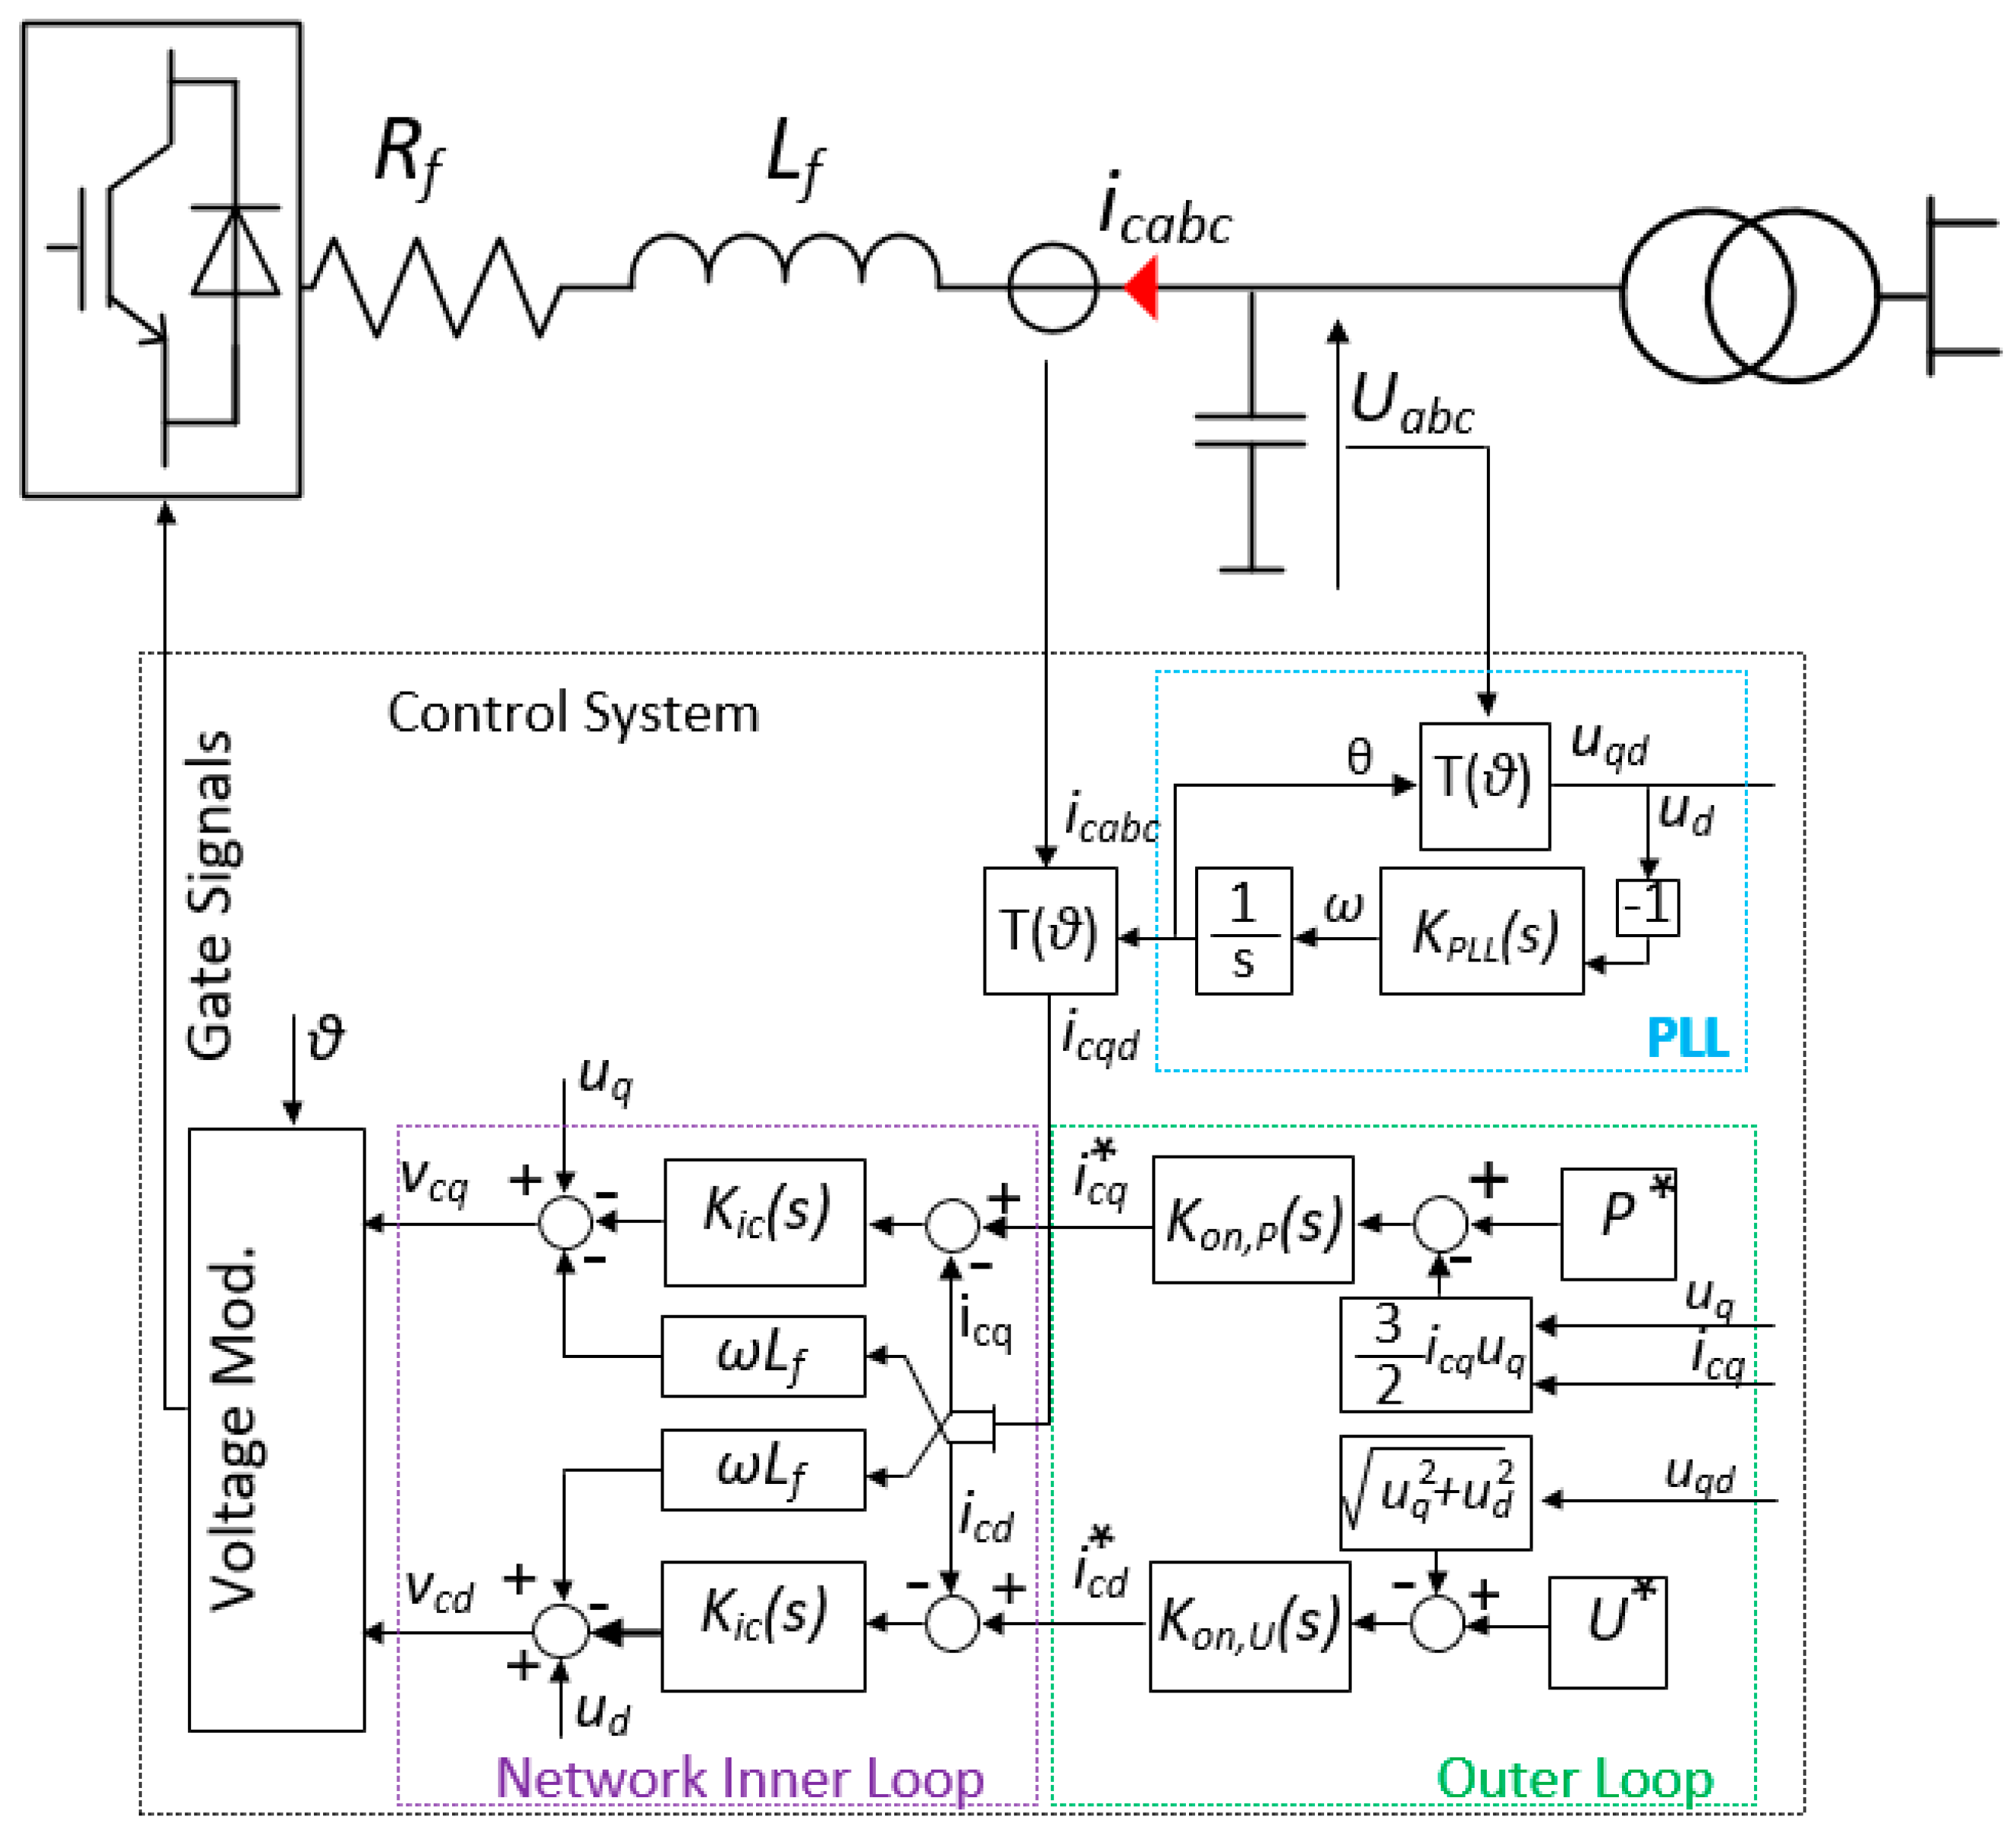
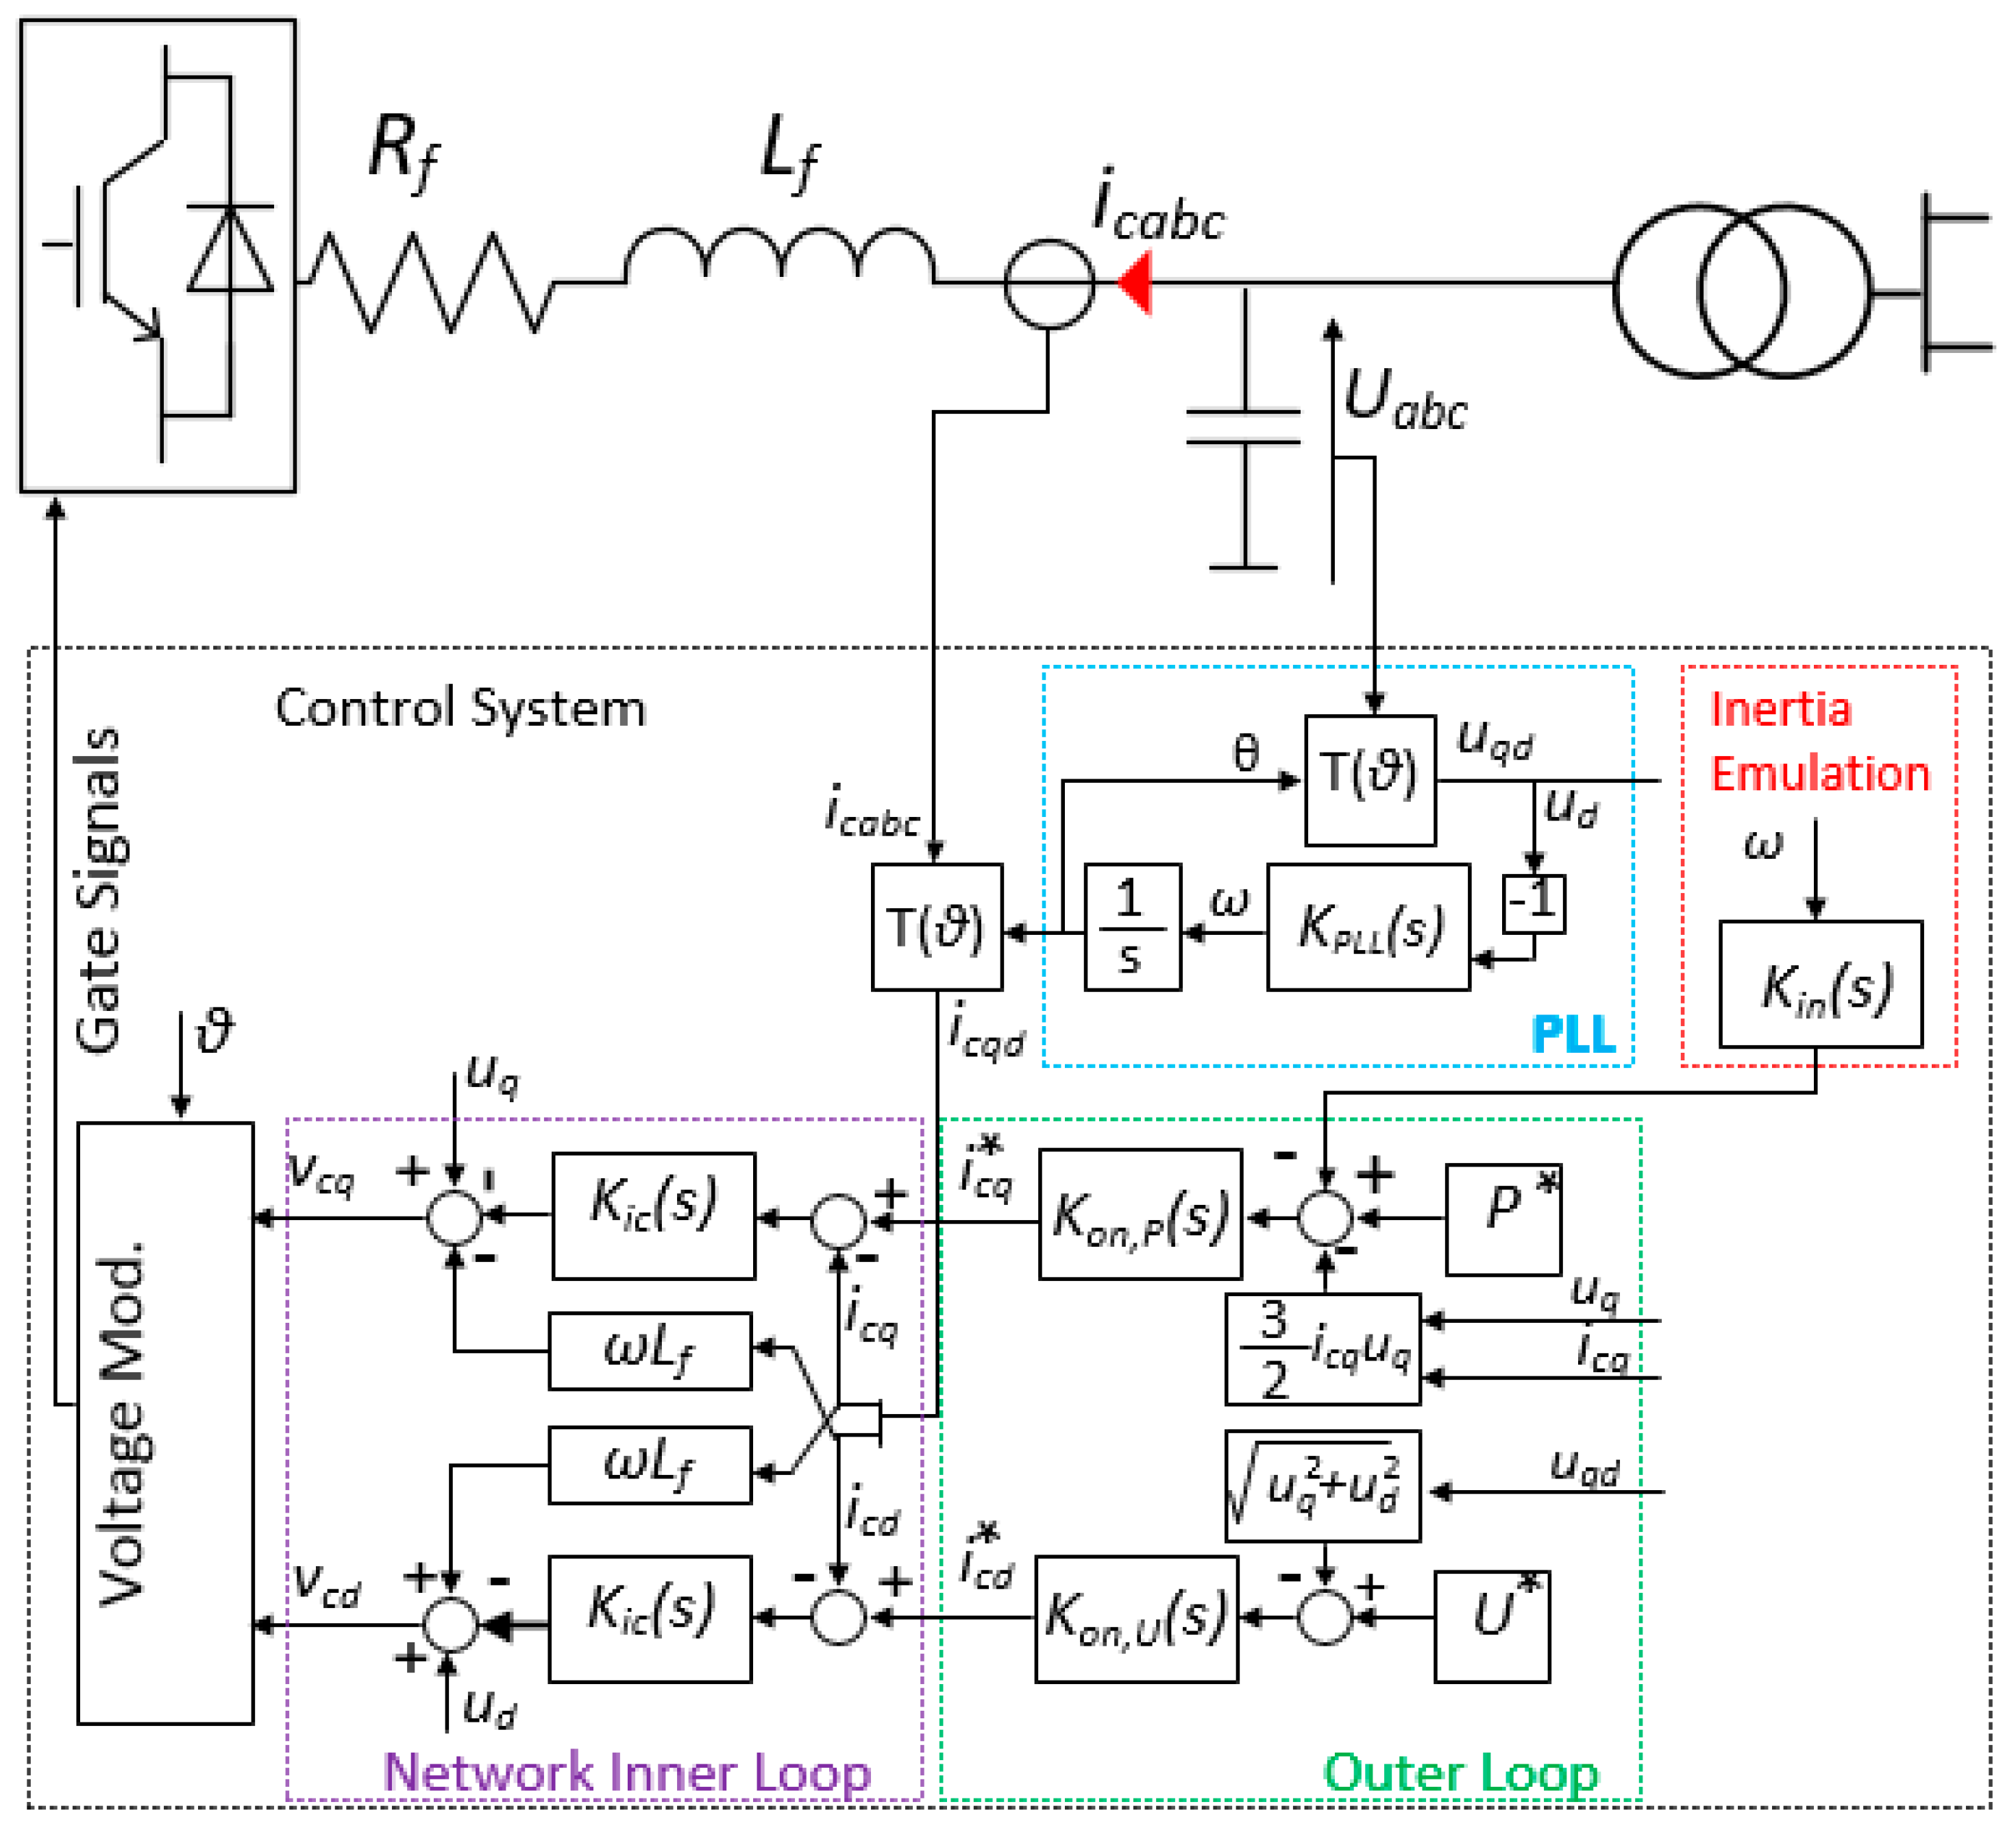
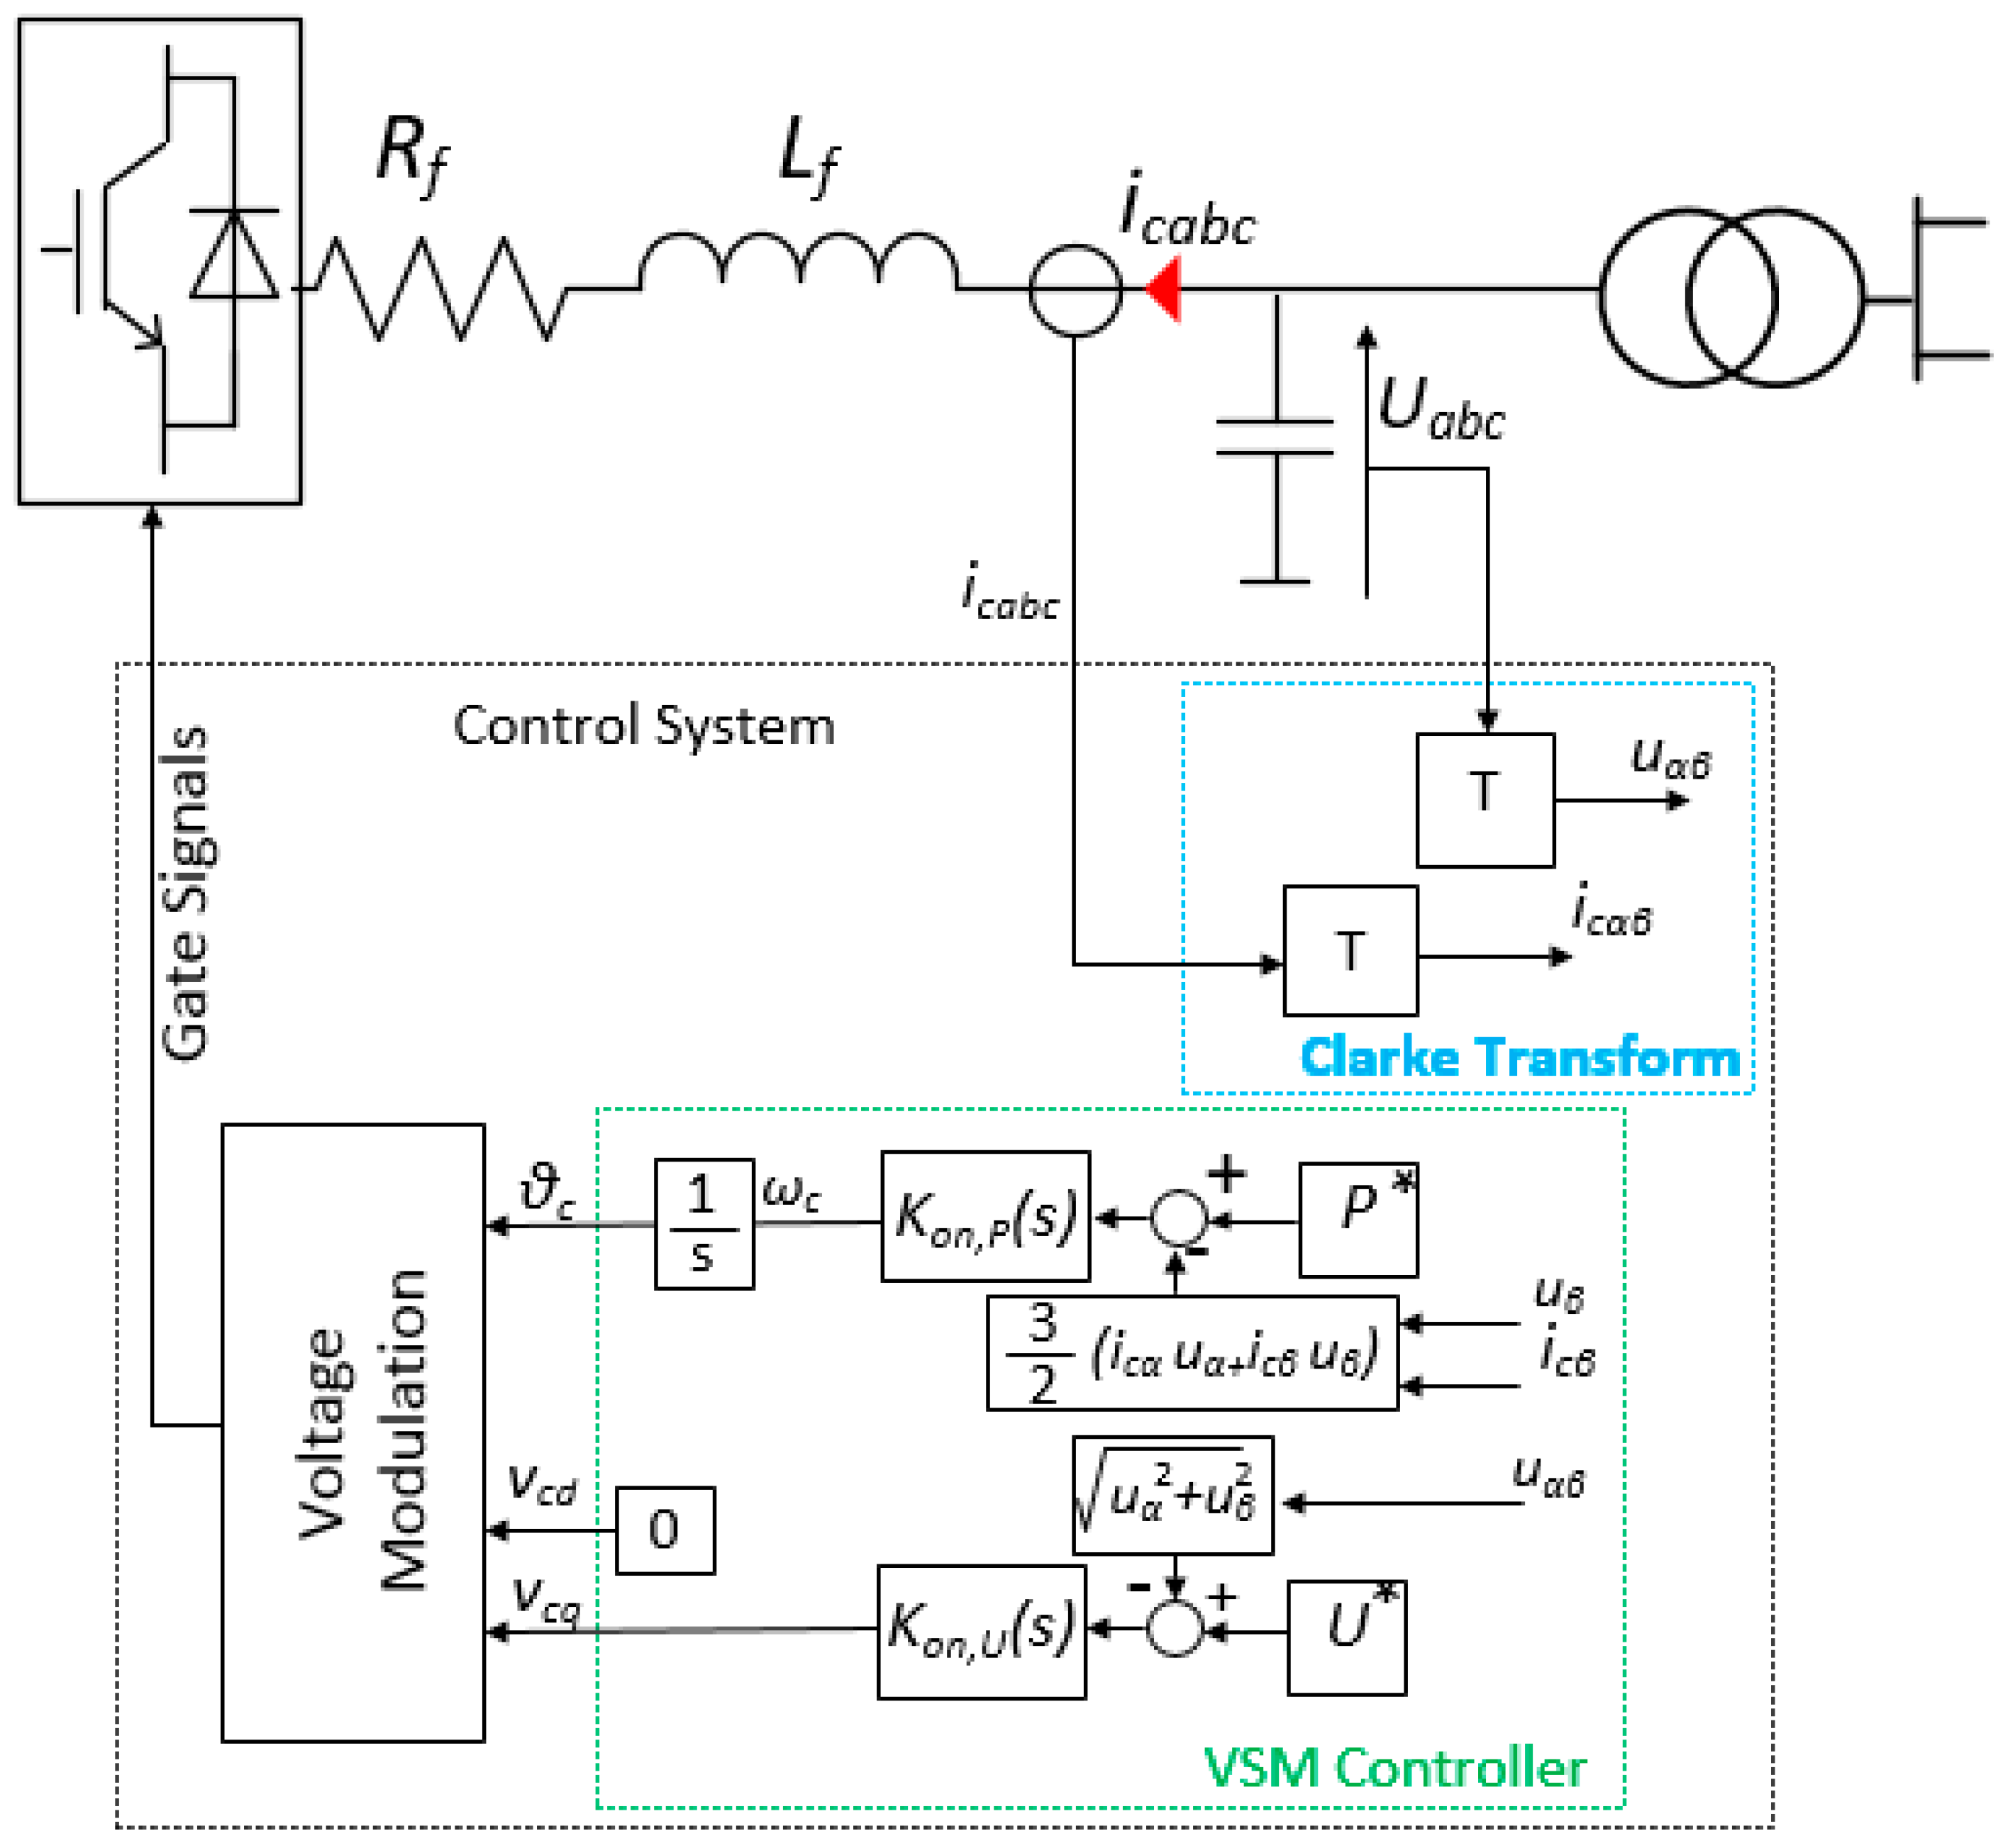
2.2. Wind Turbine Control Structures
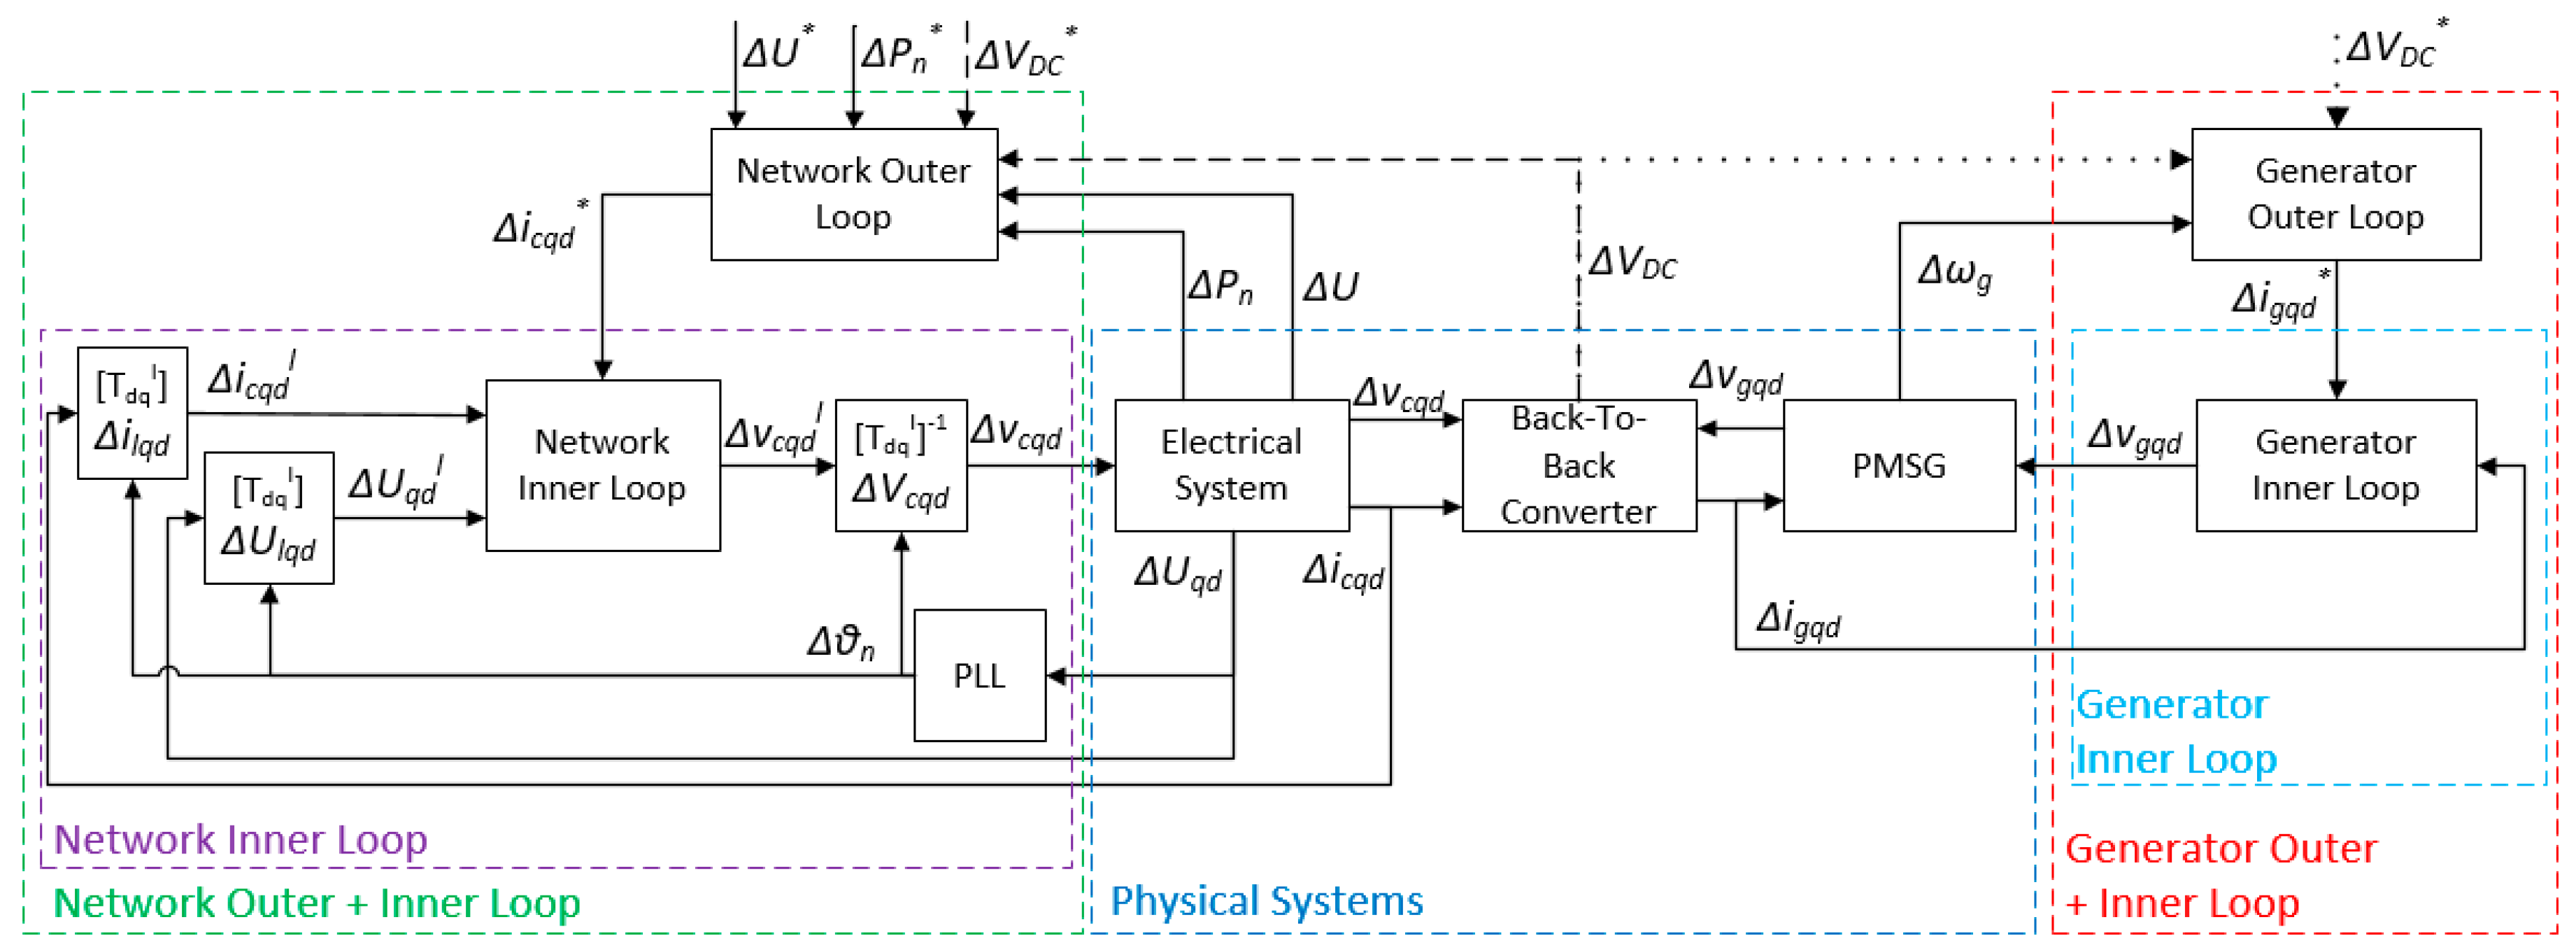
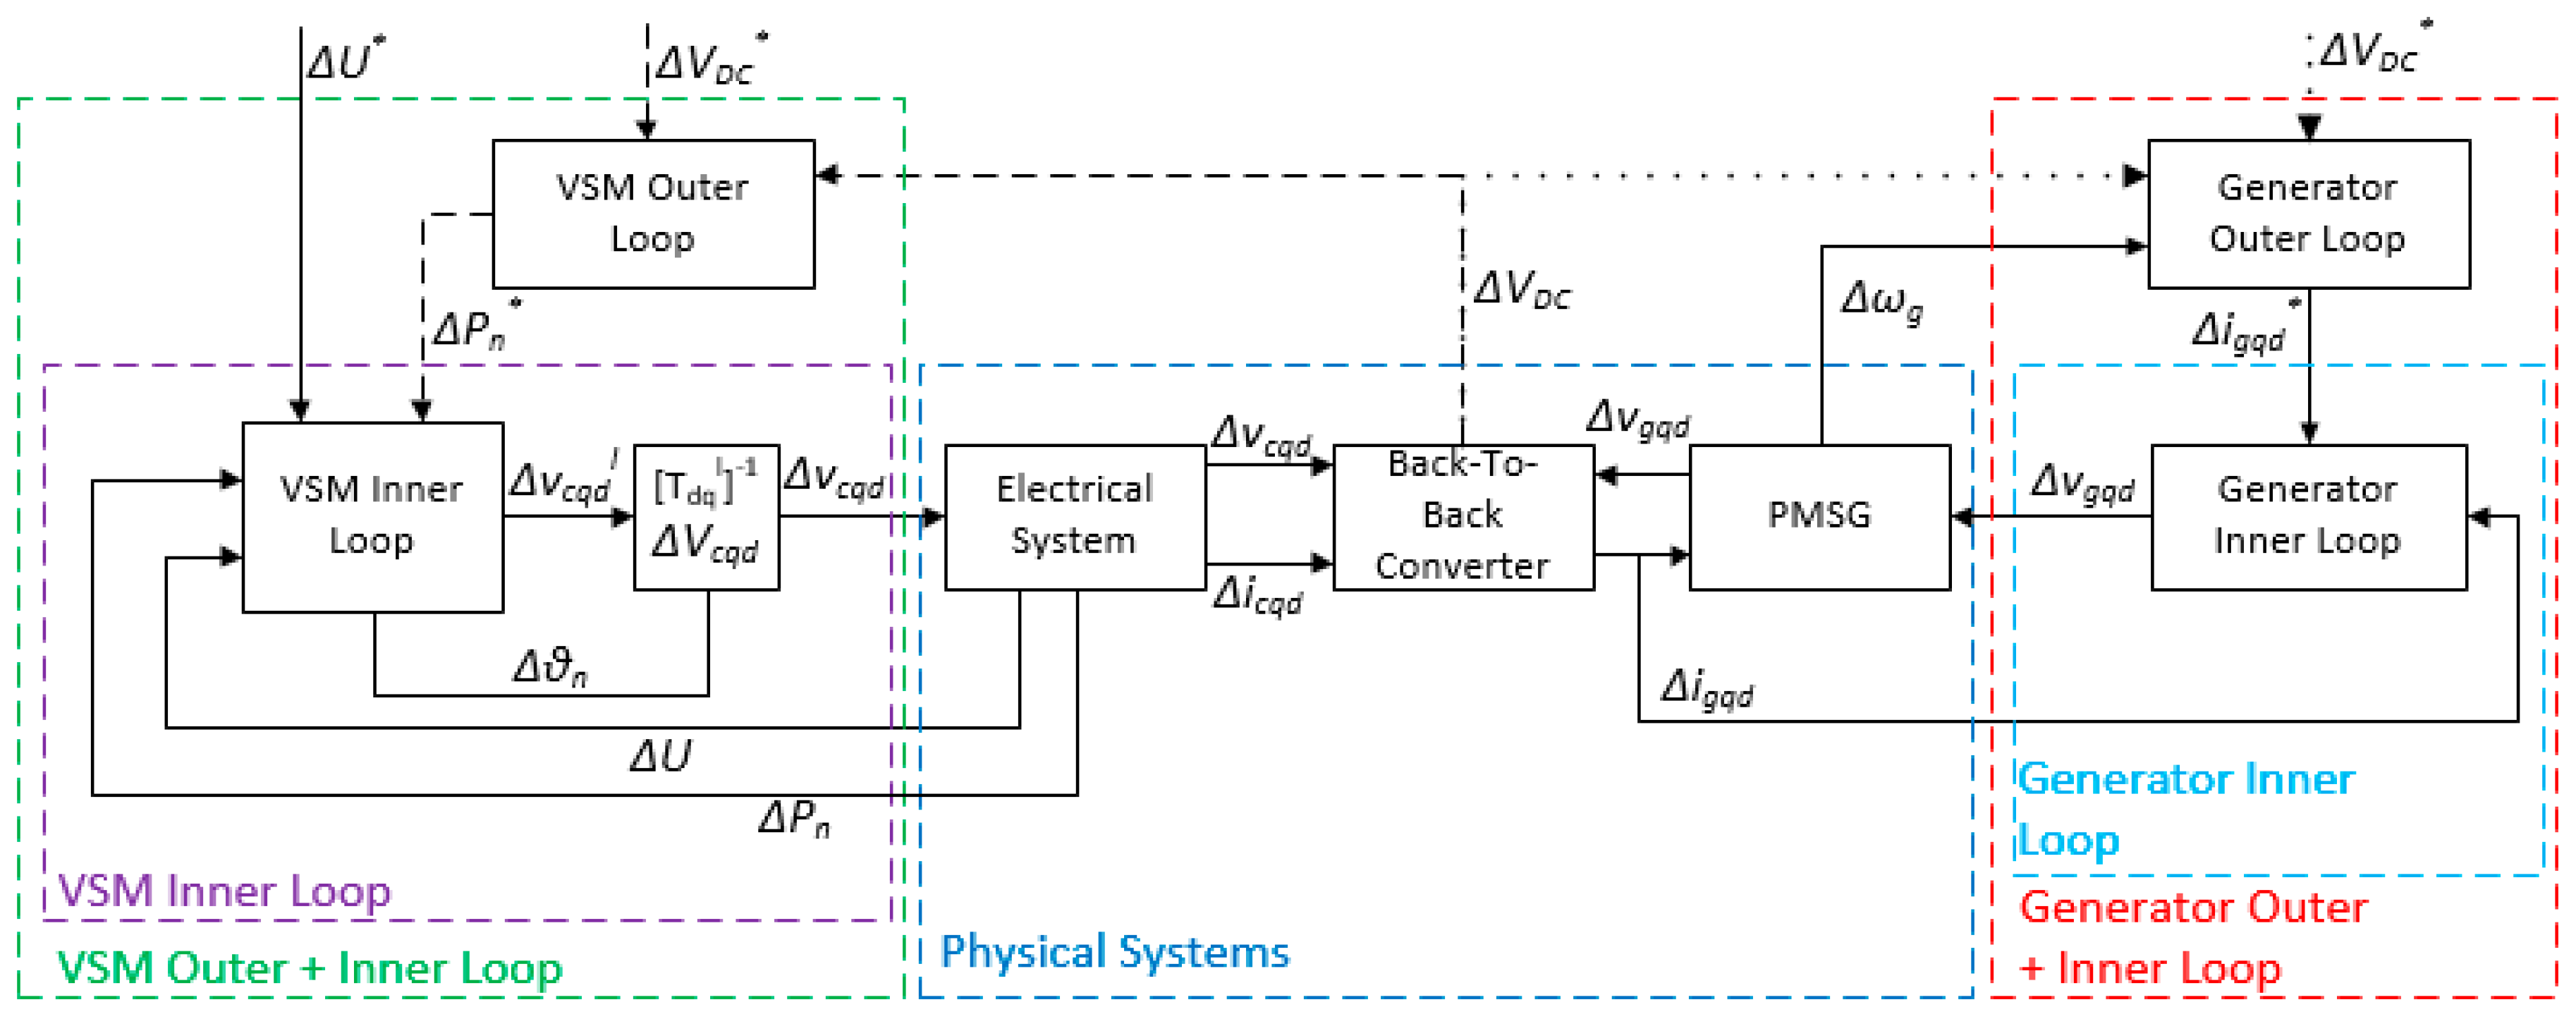
2.3. Small-Signal Modelling
3. System Analysis
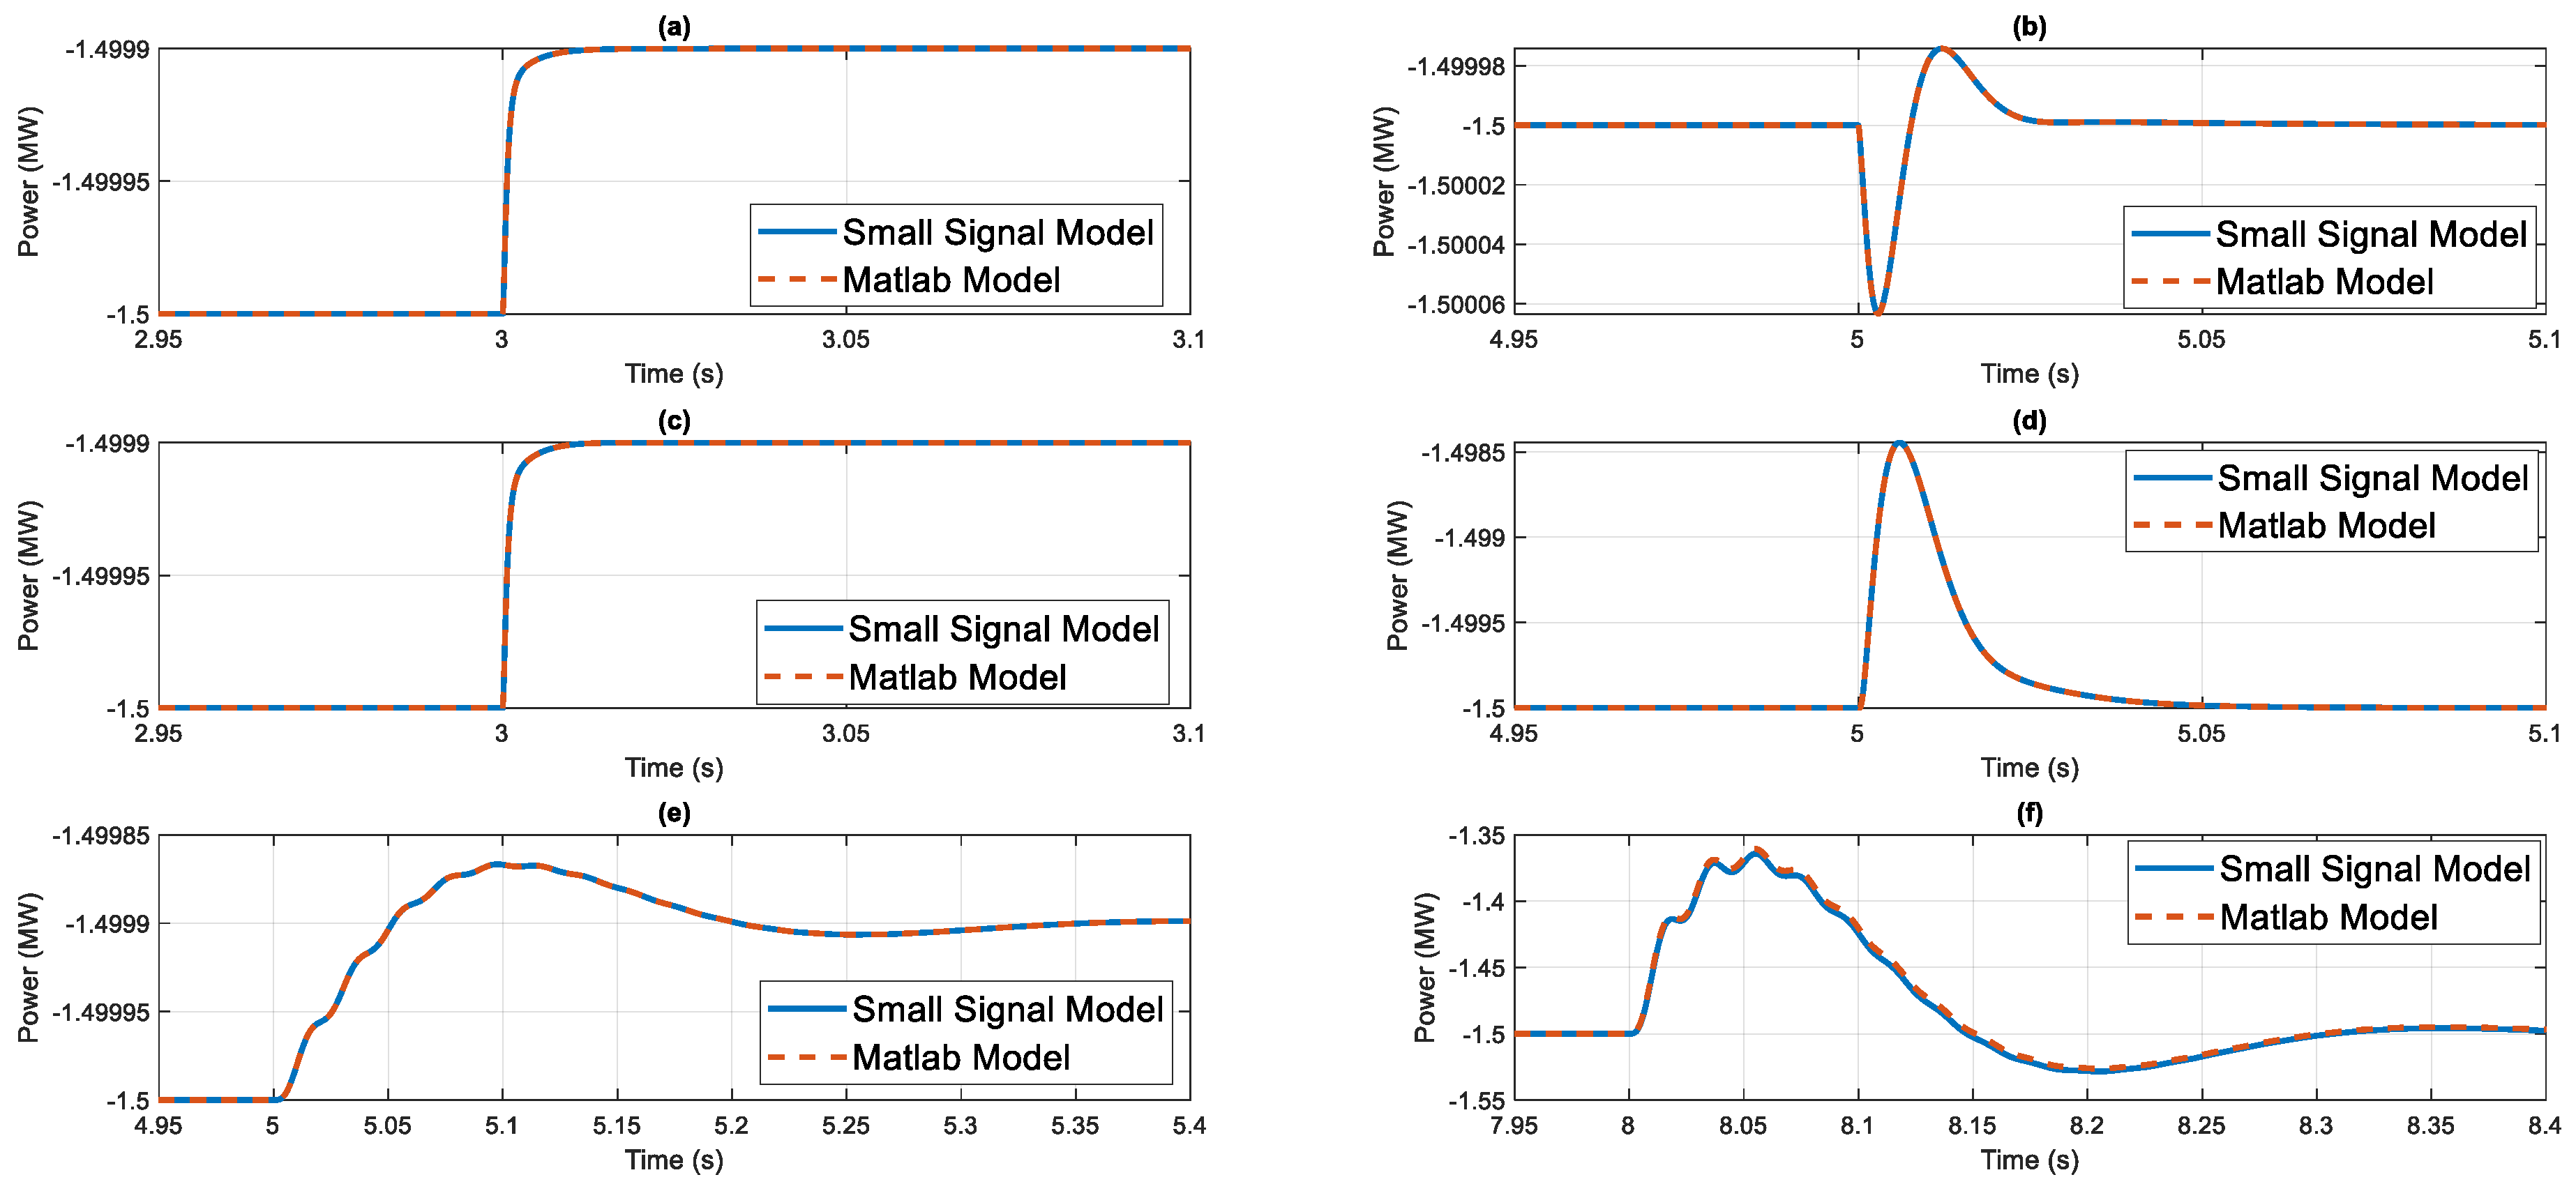
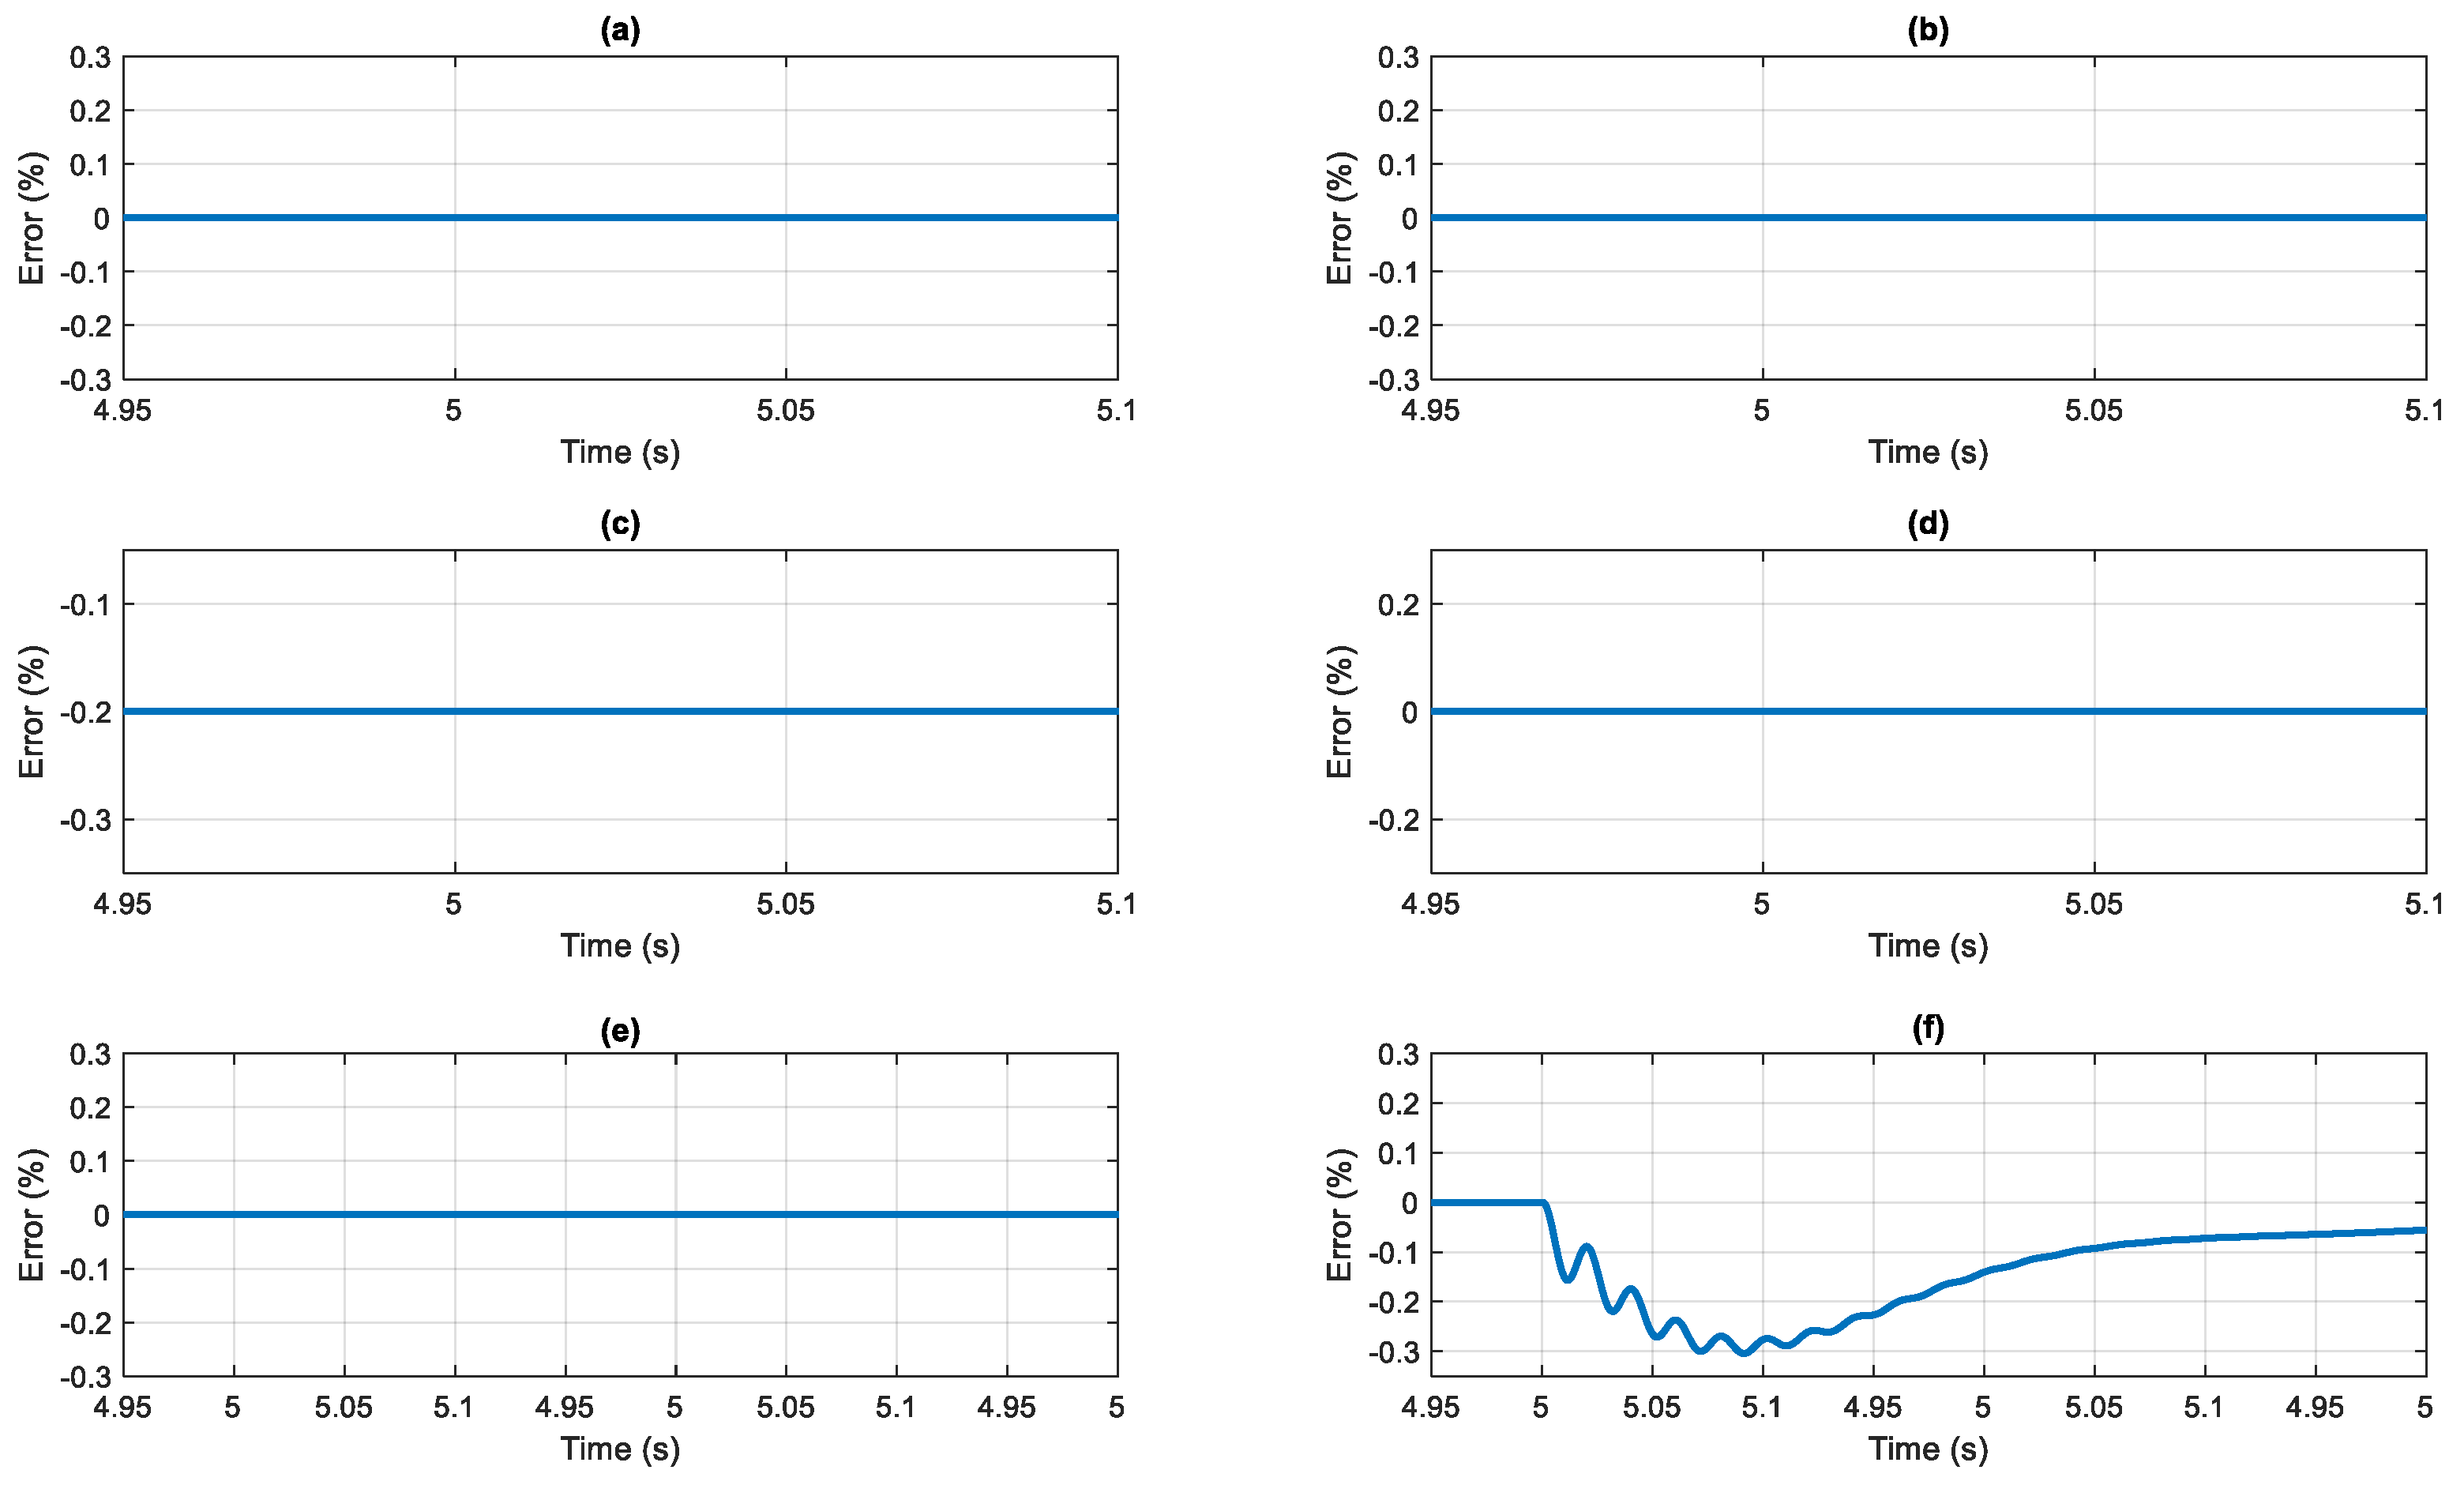
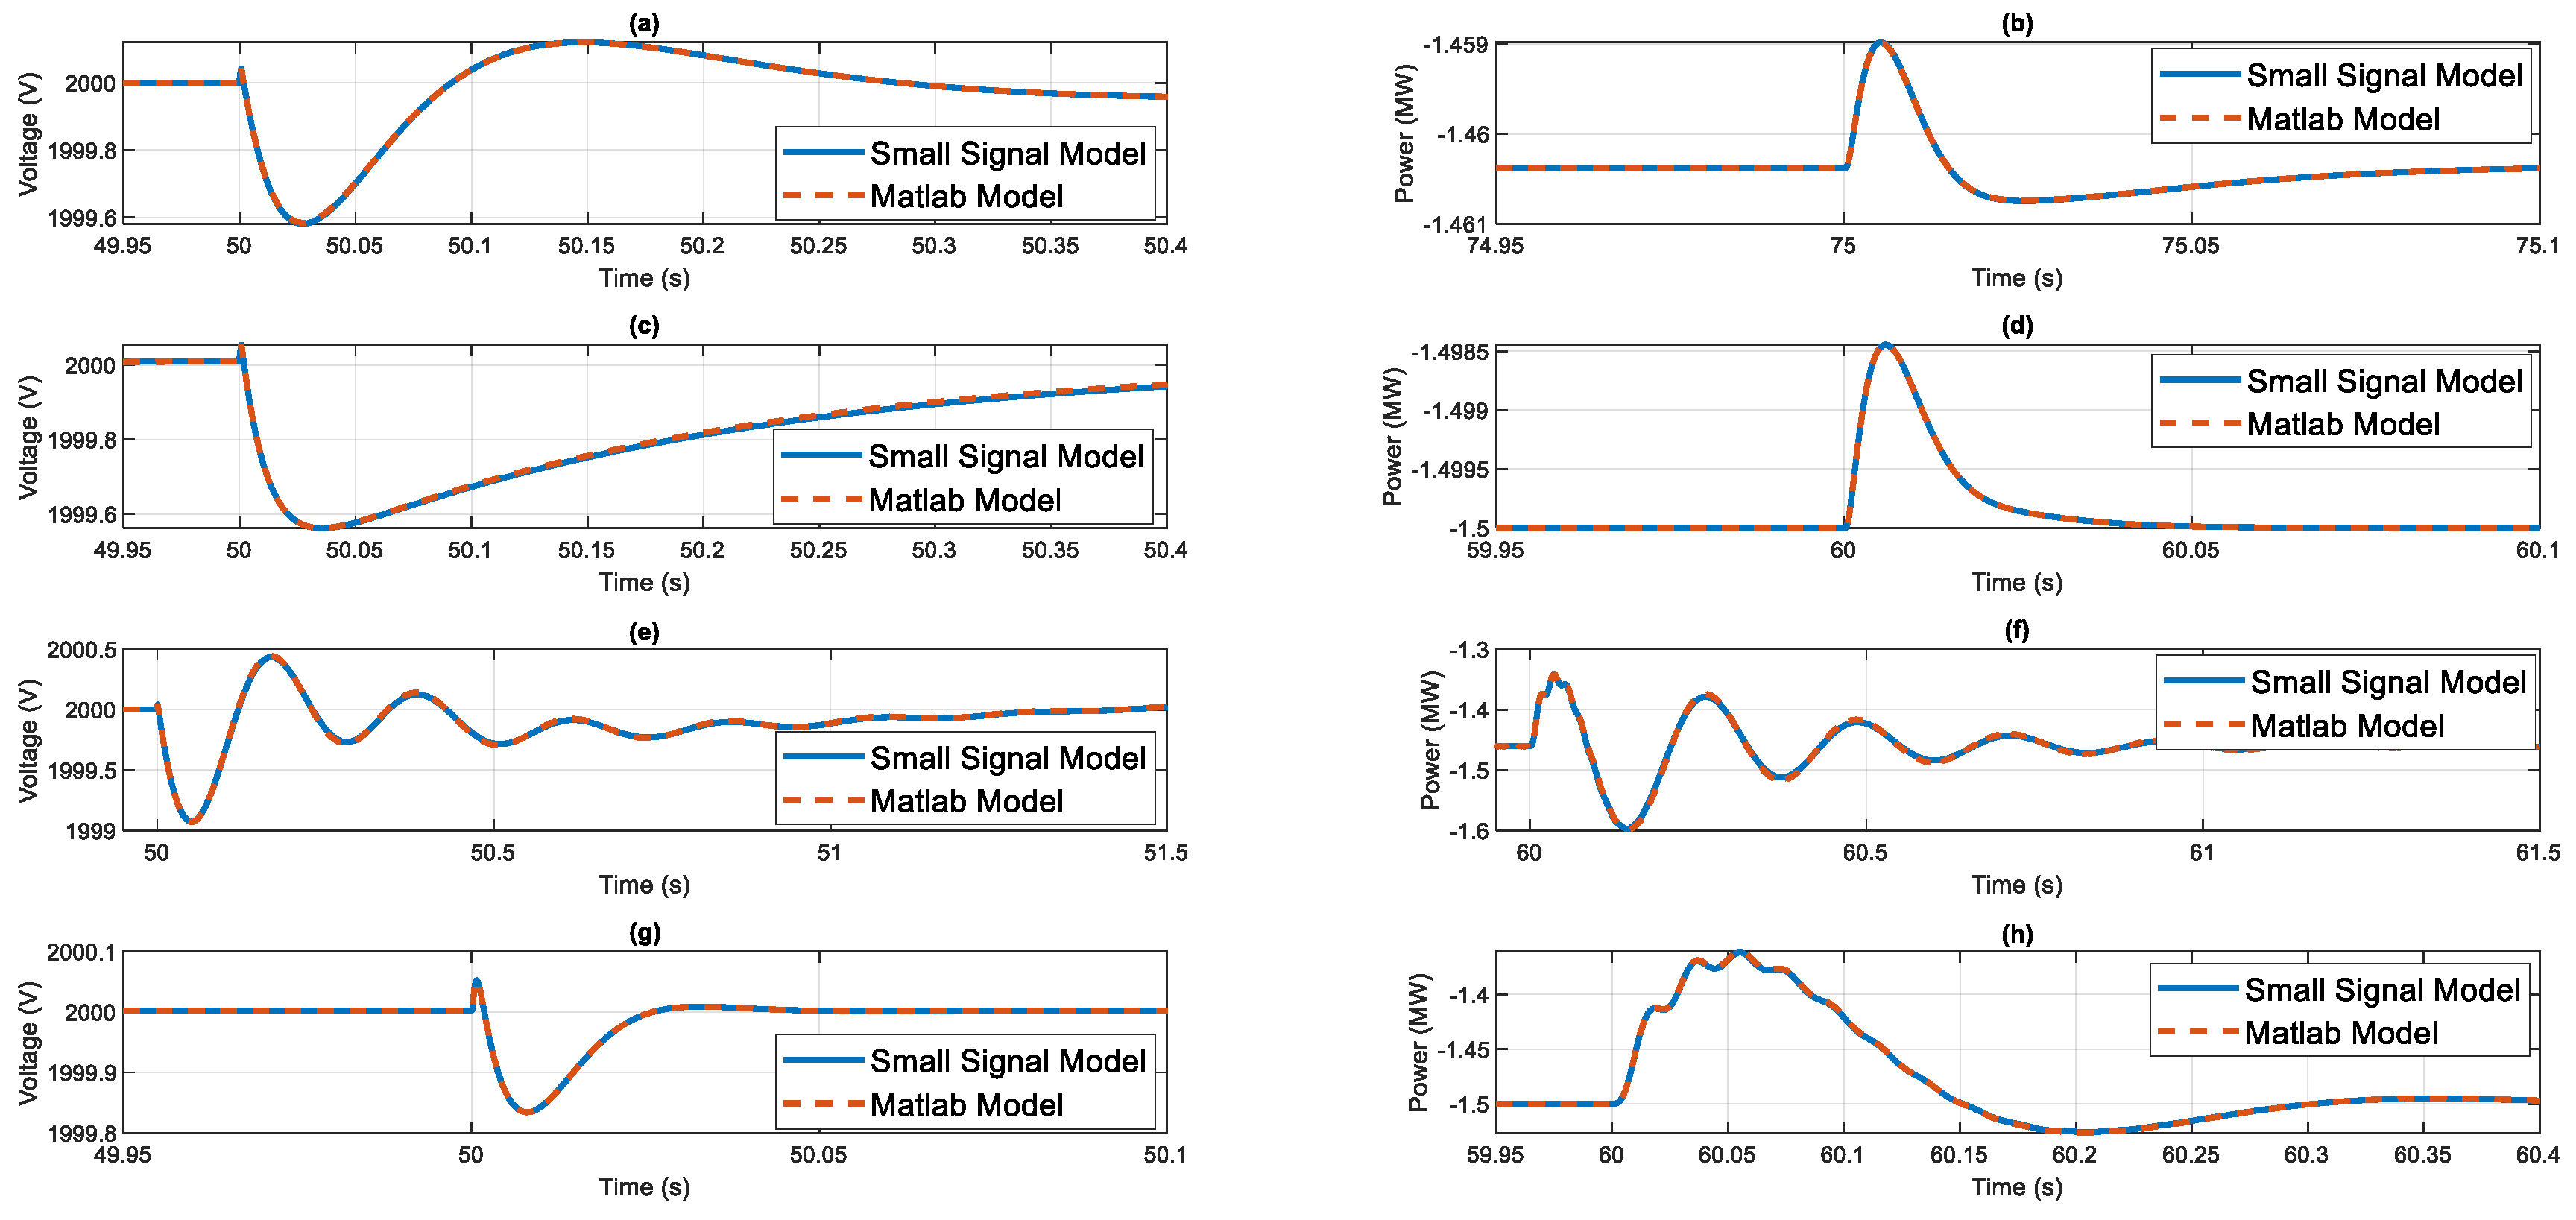
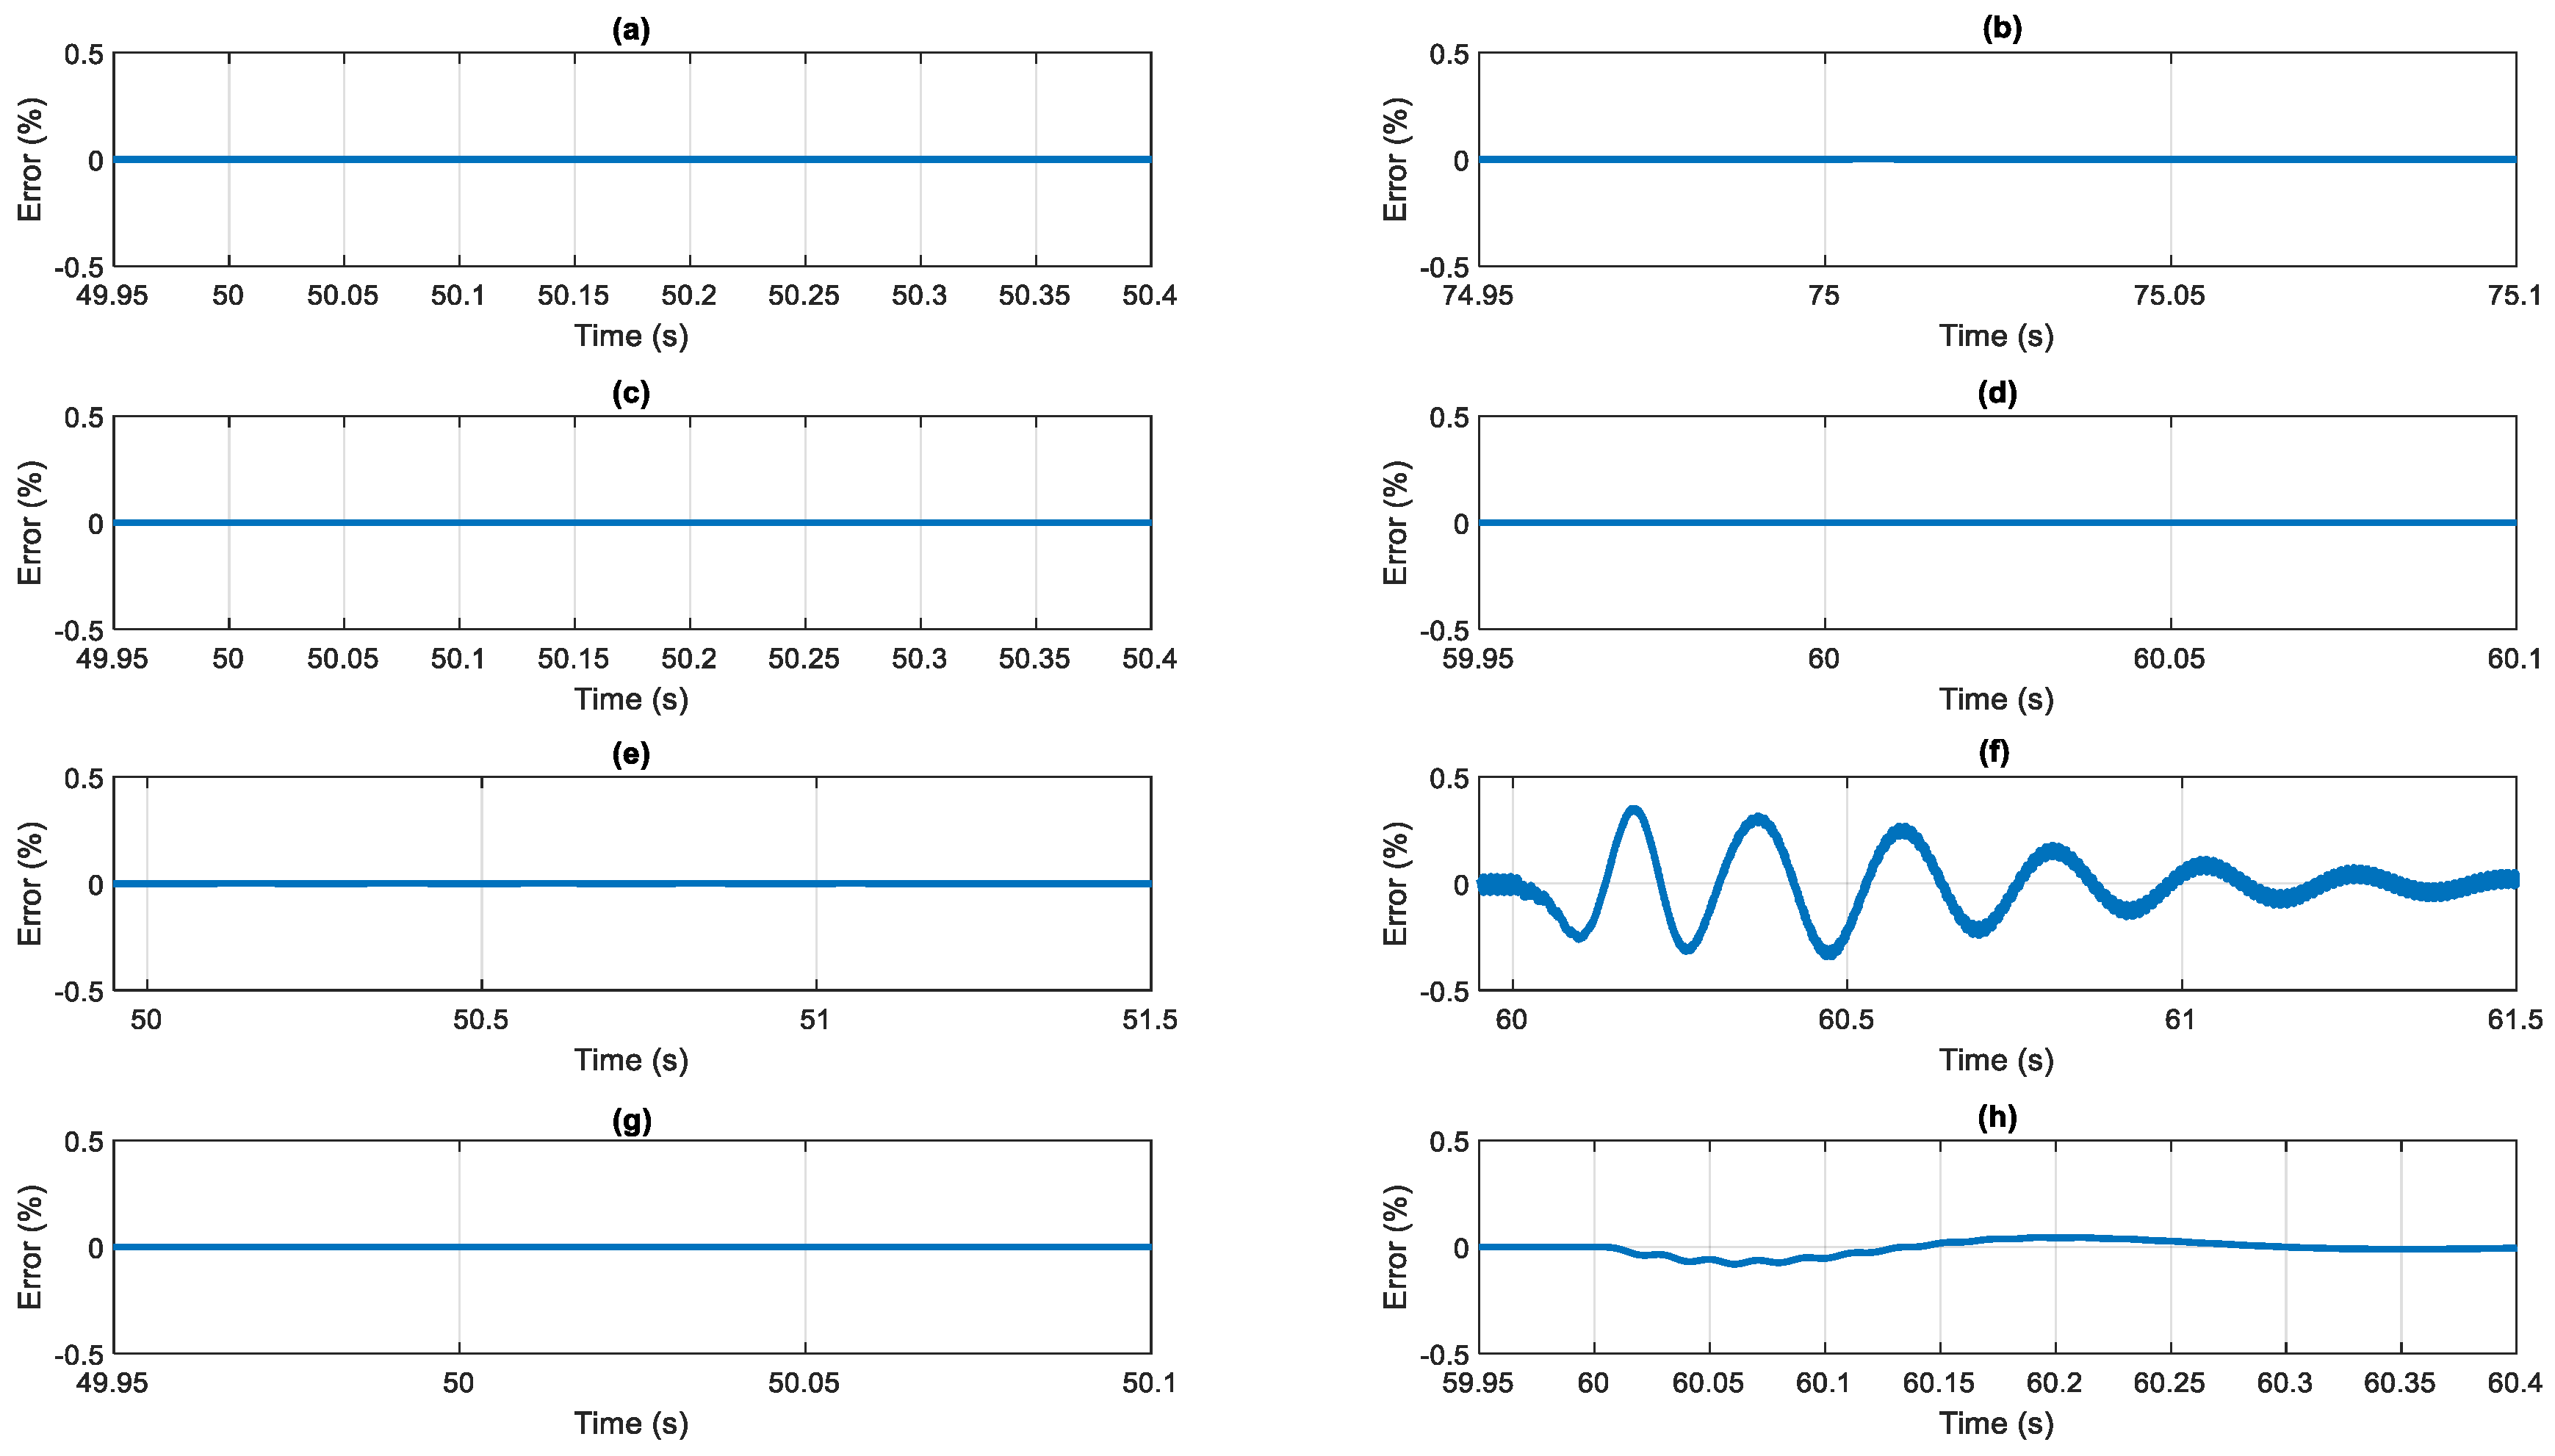
3.1. Small-Signal Model Validation
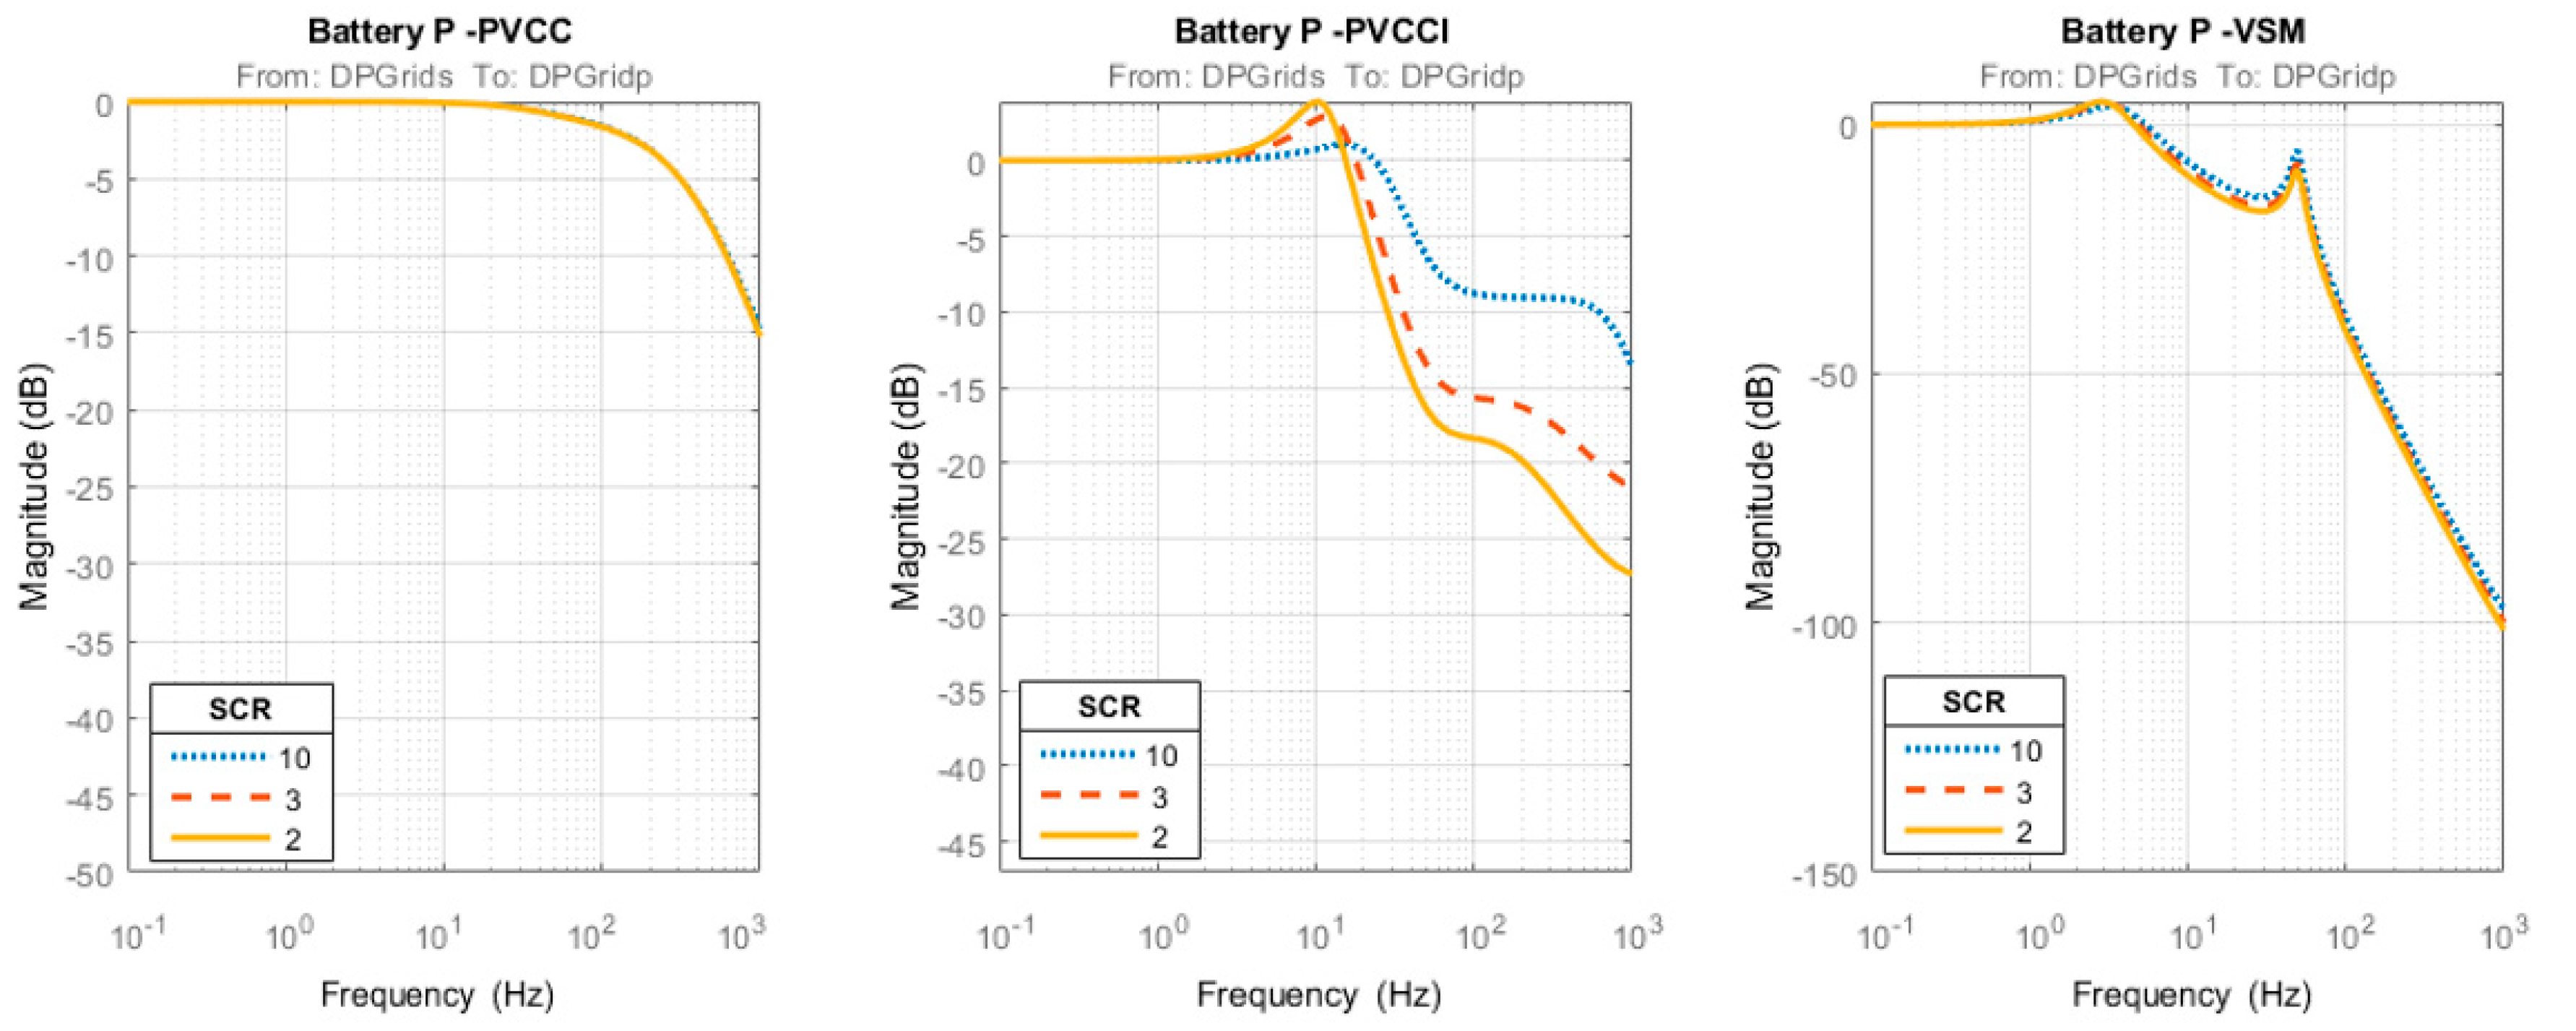
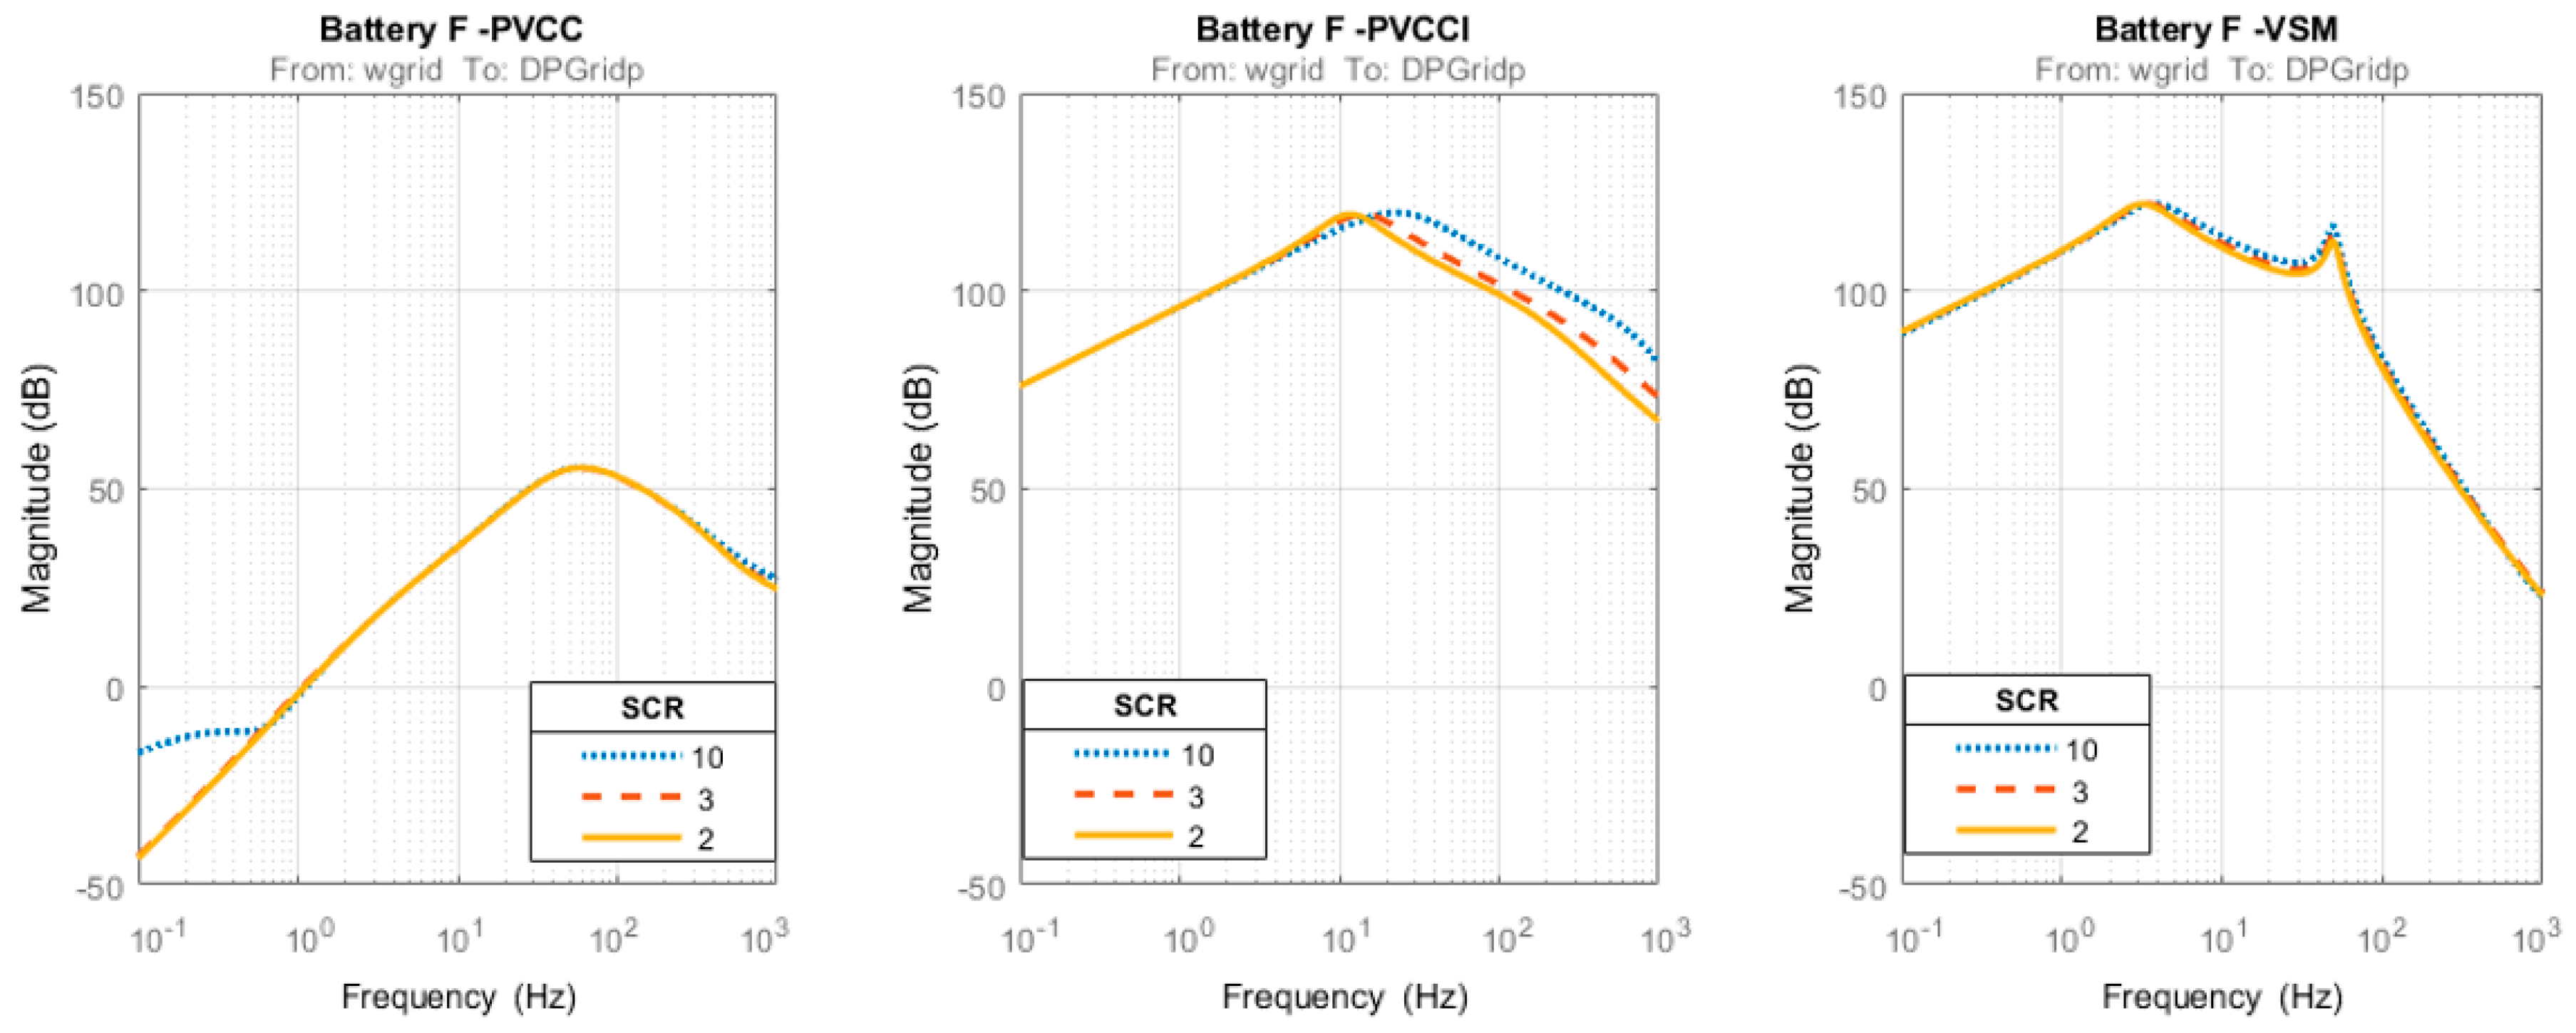
3.1.1. Battery-Connected Models
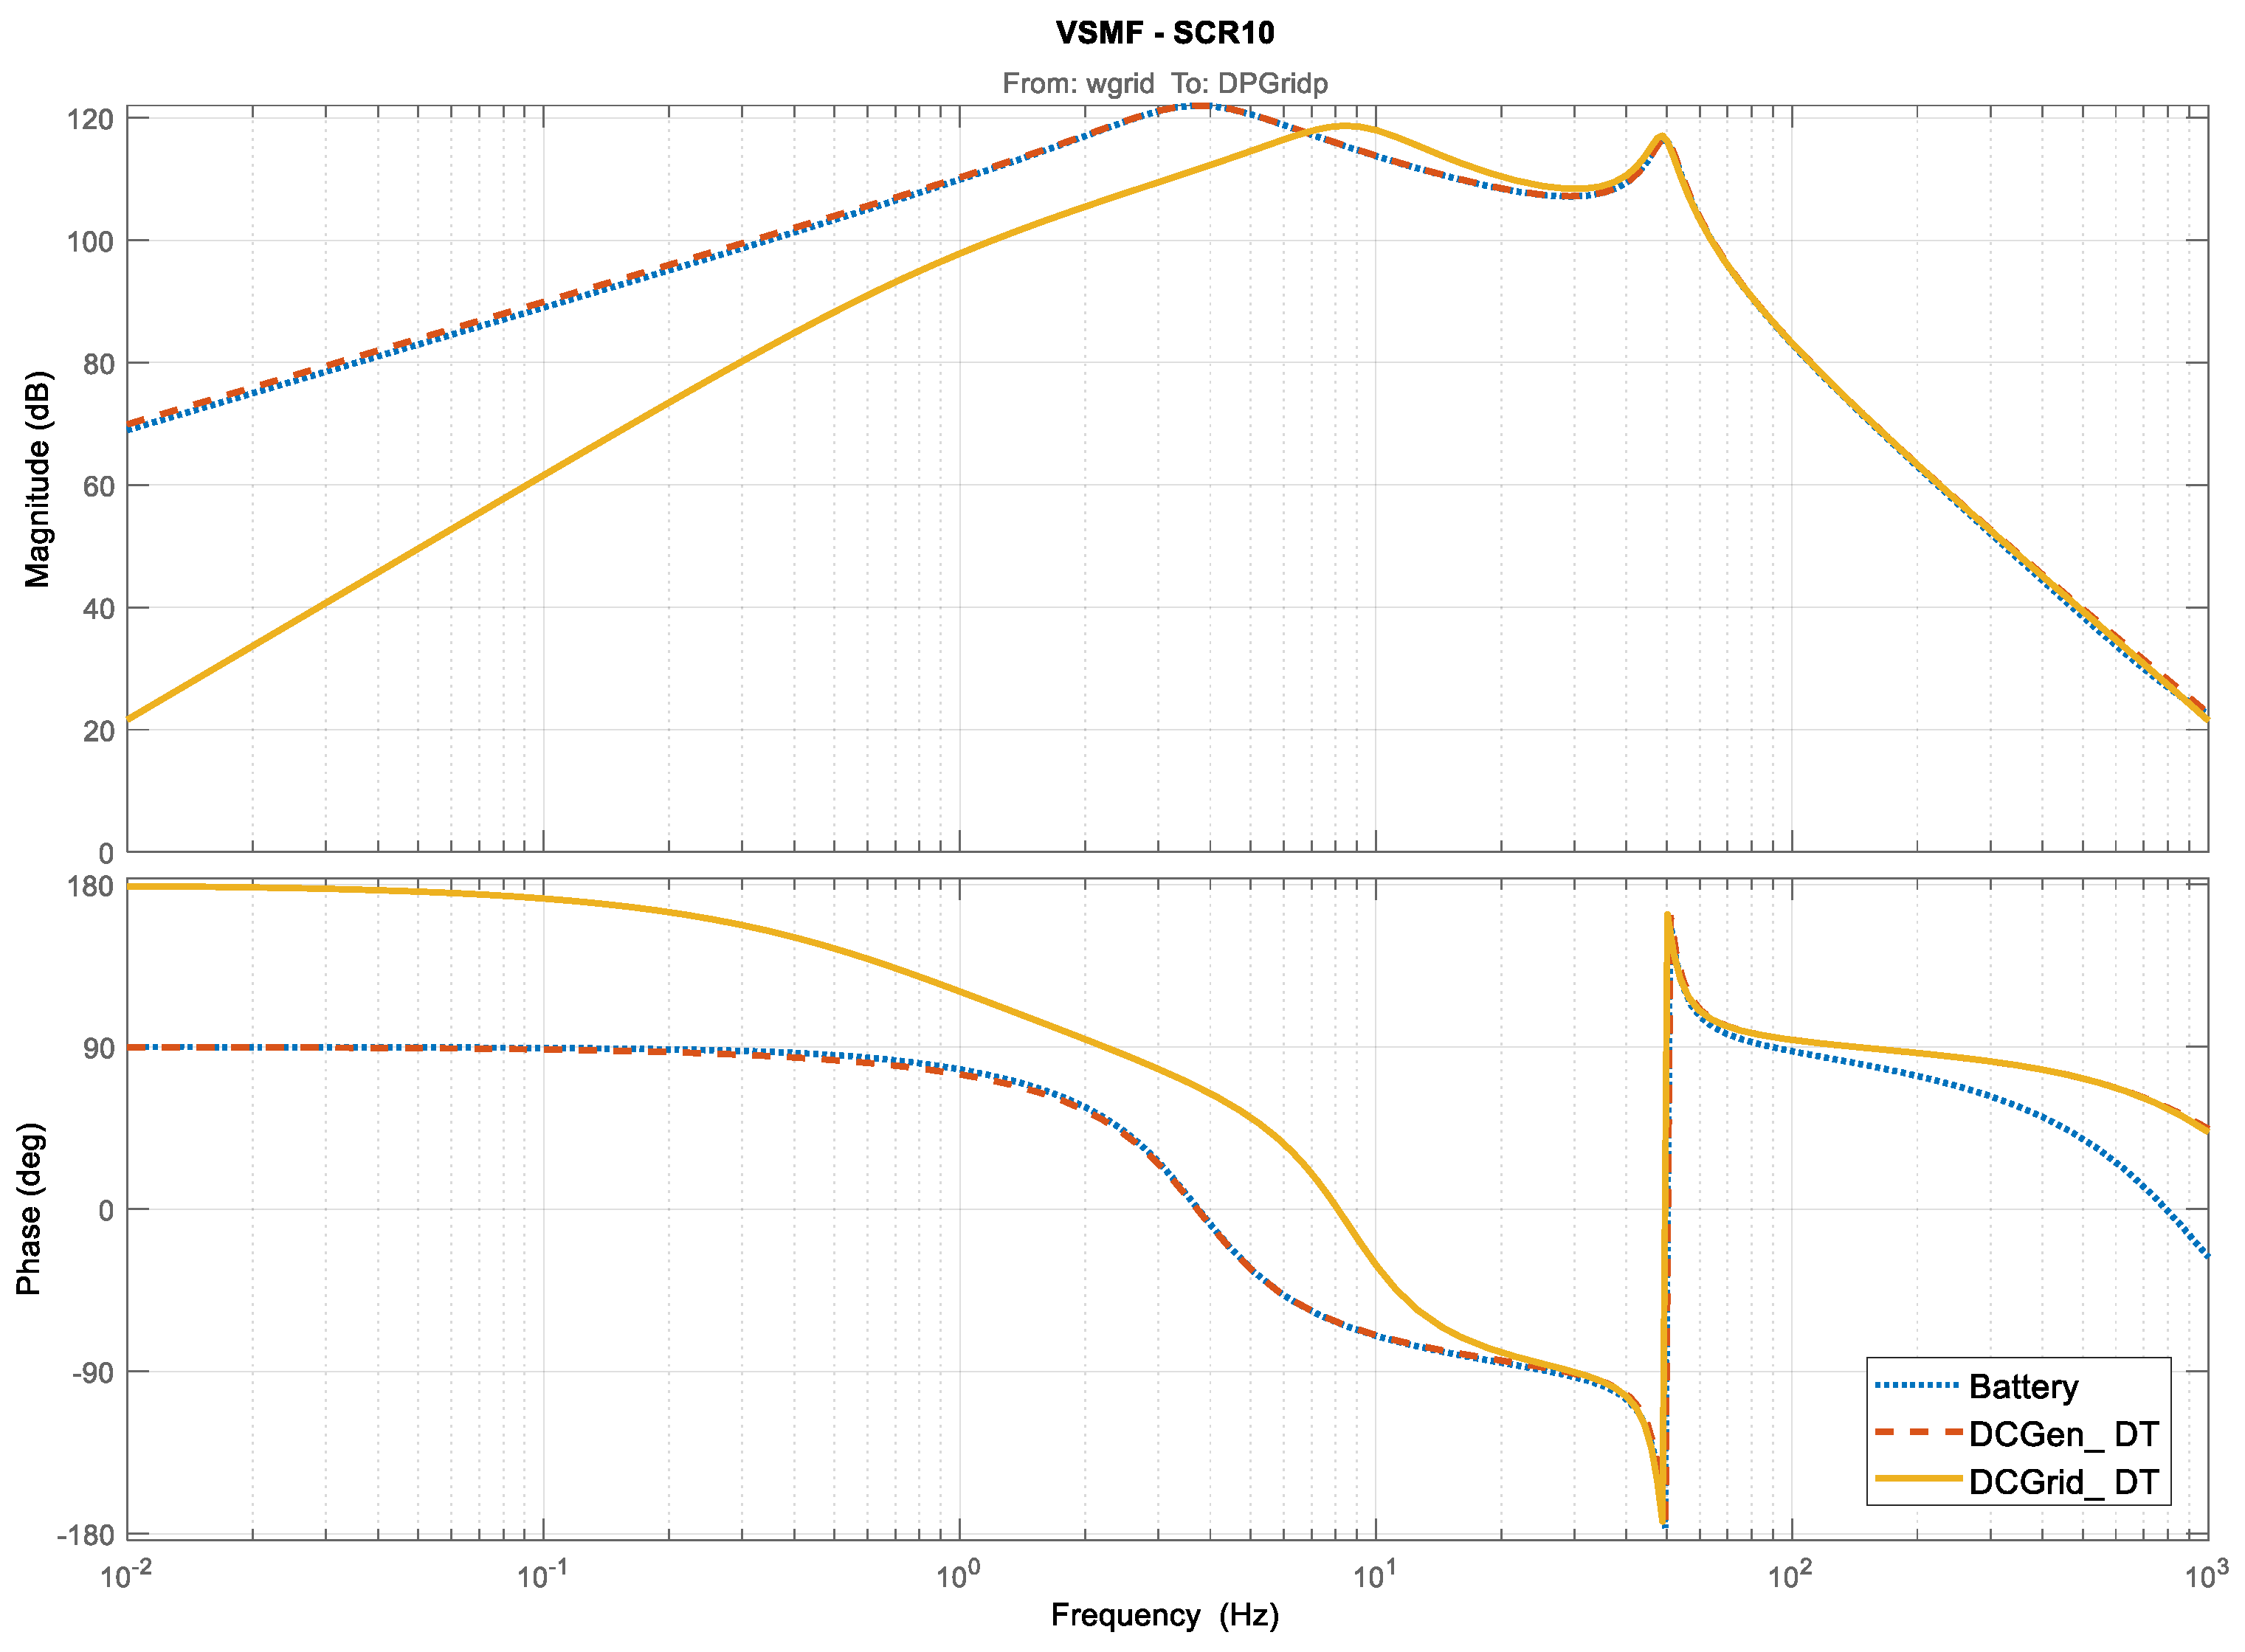
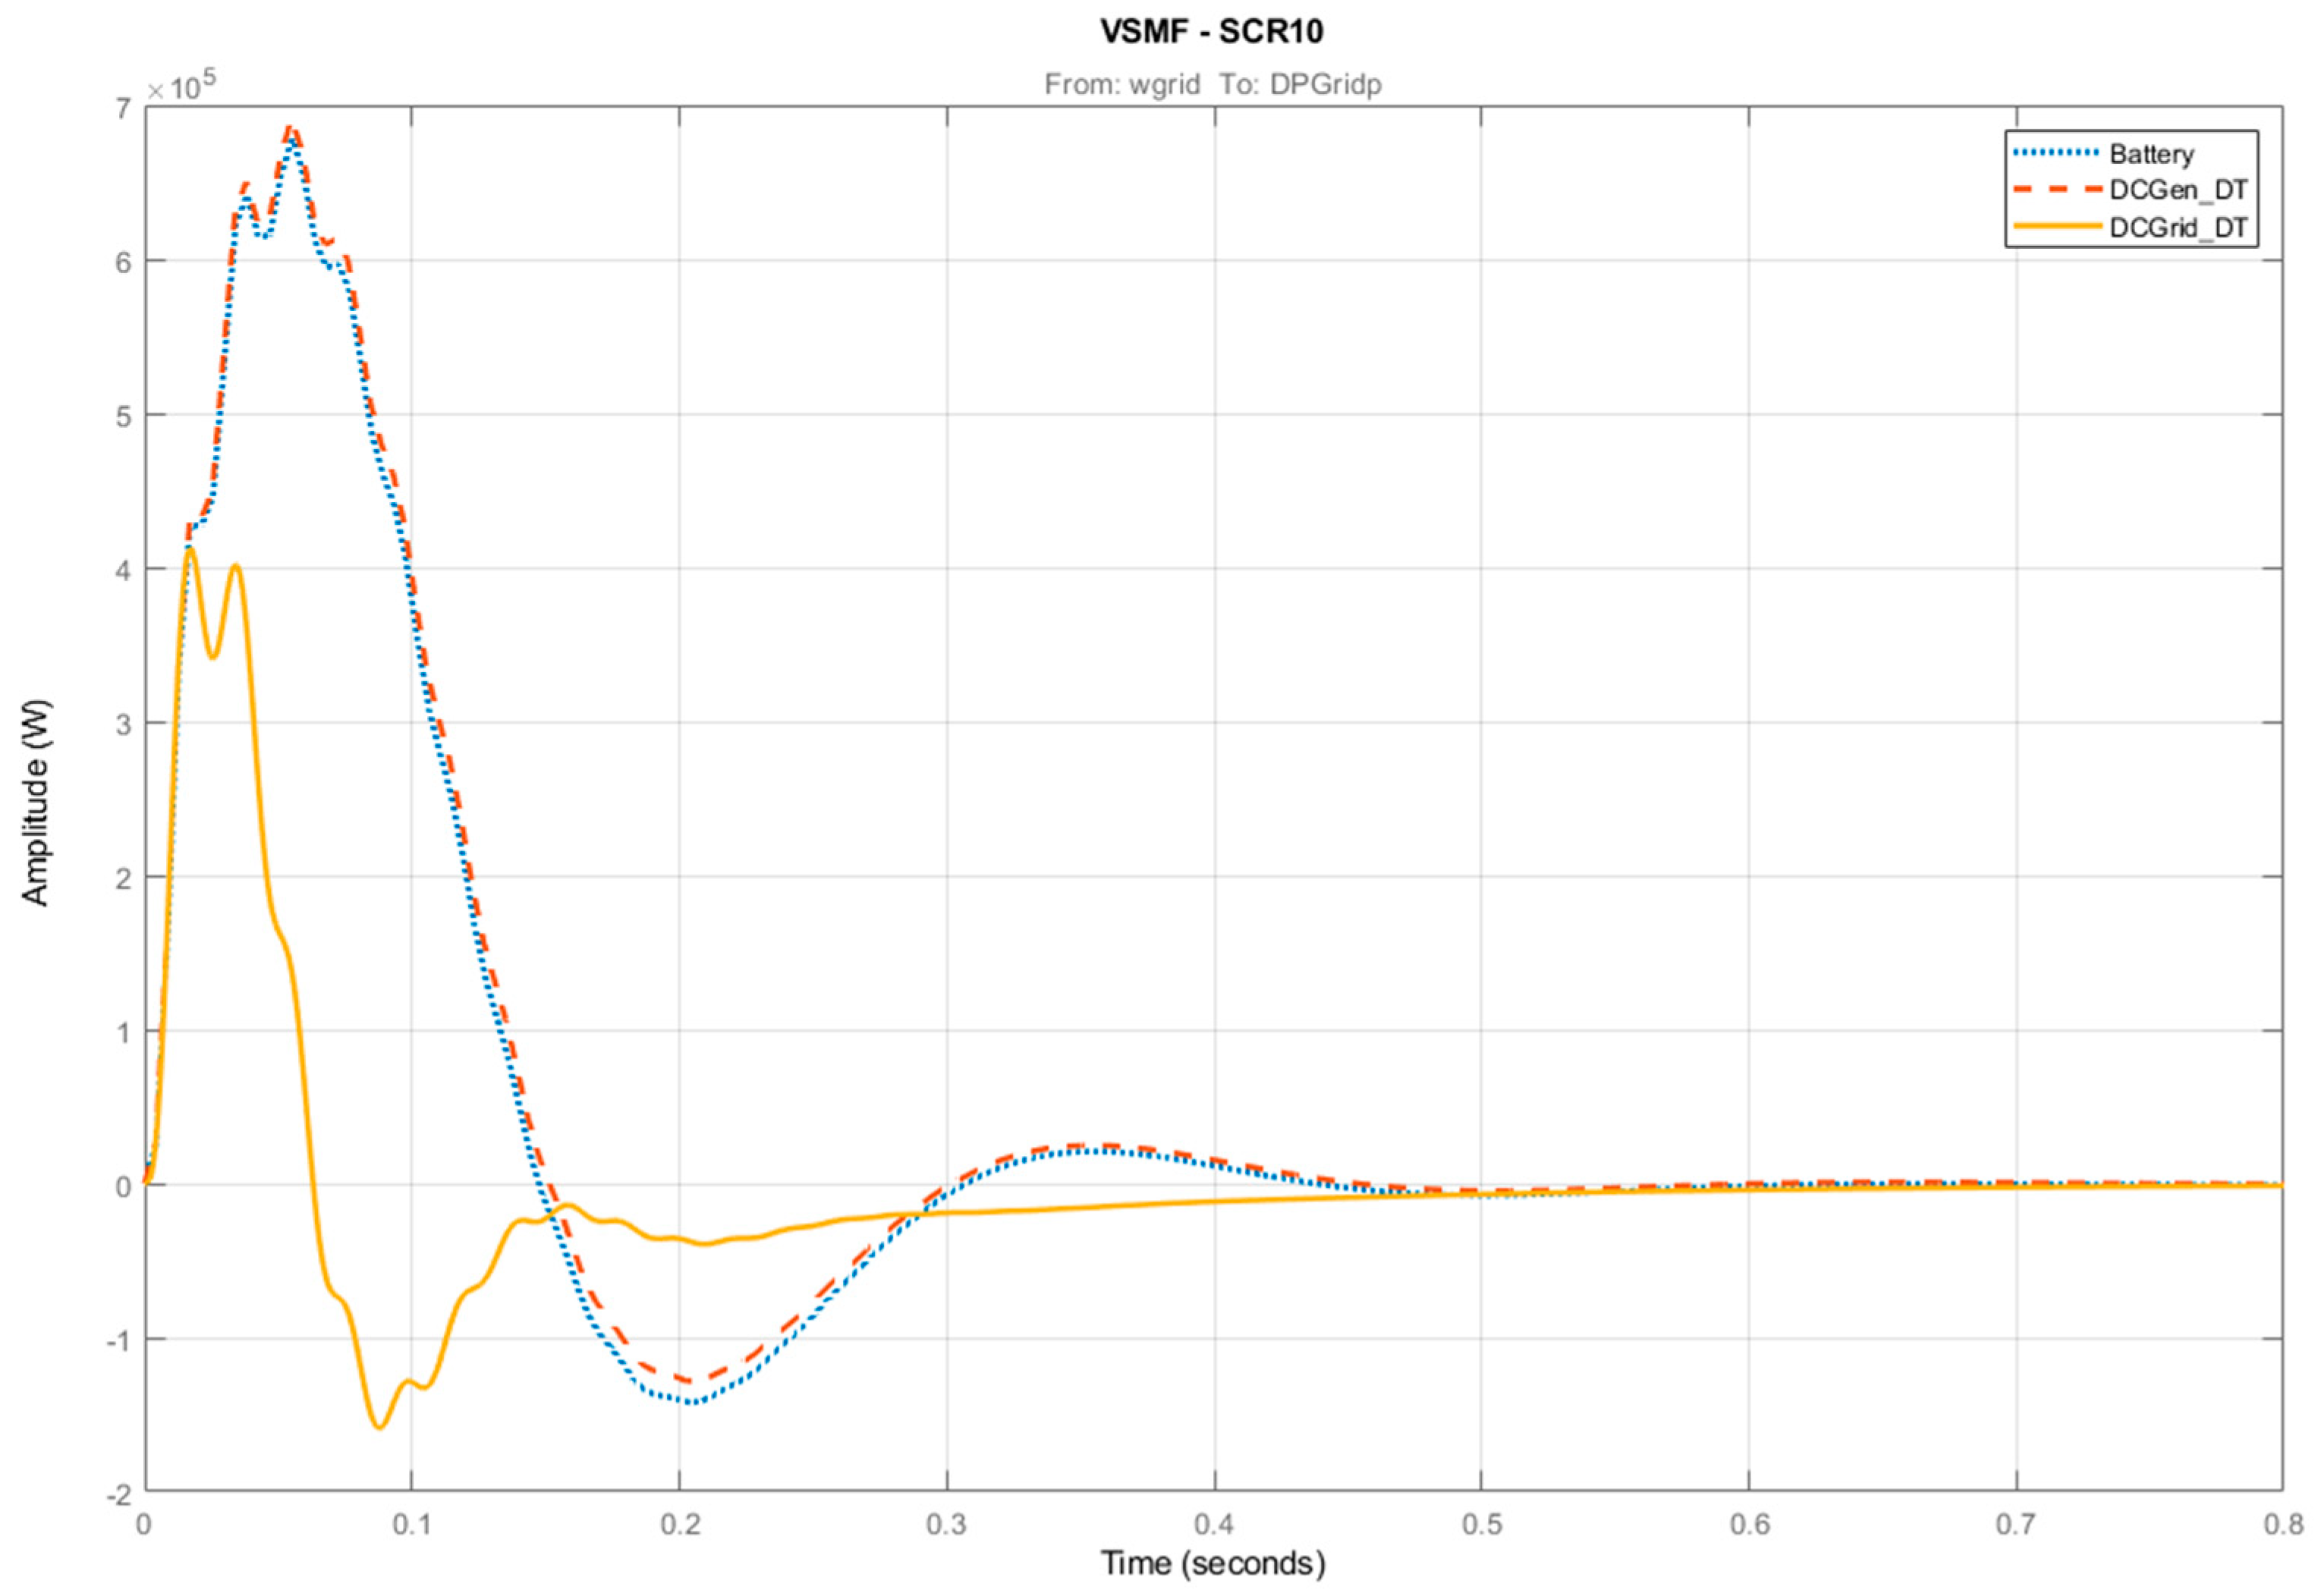
3.1.2. Full Wind Turbine Models
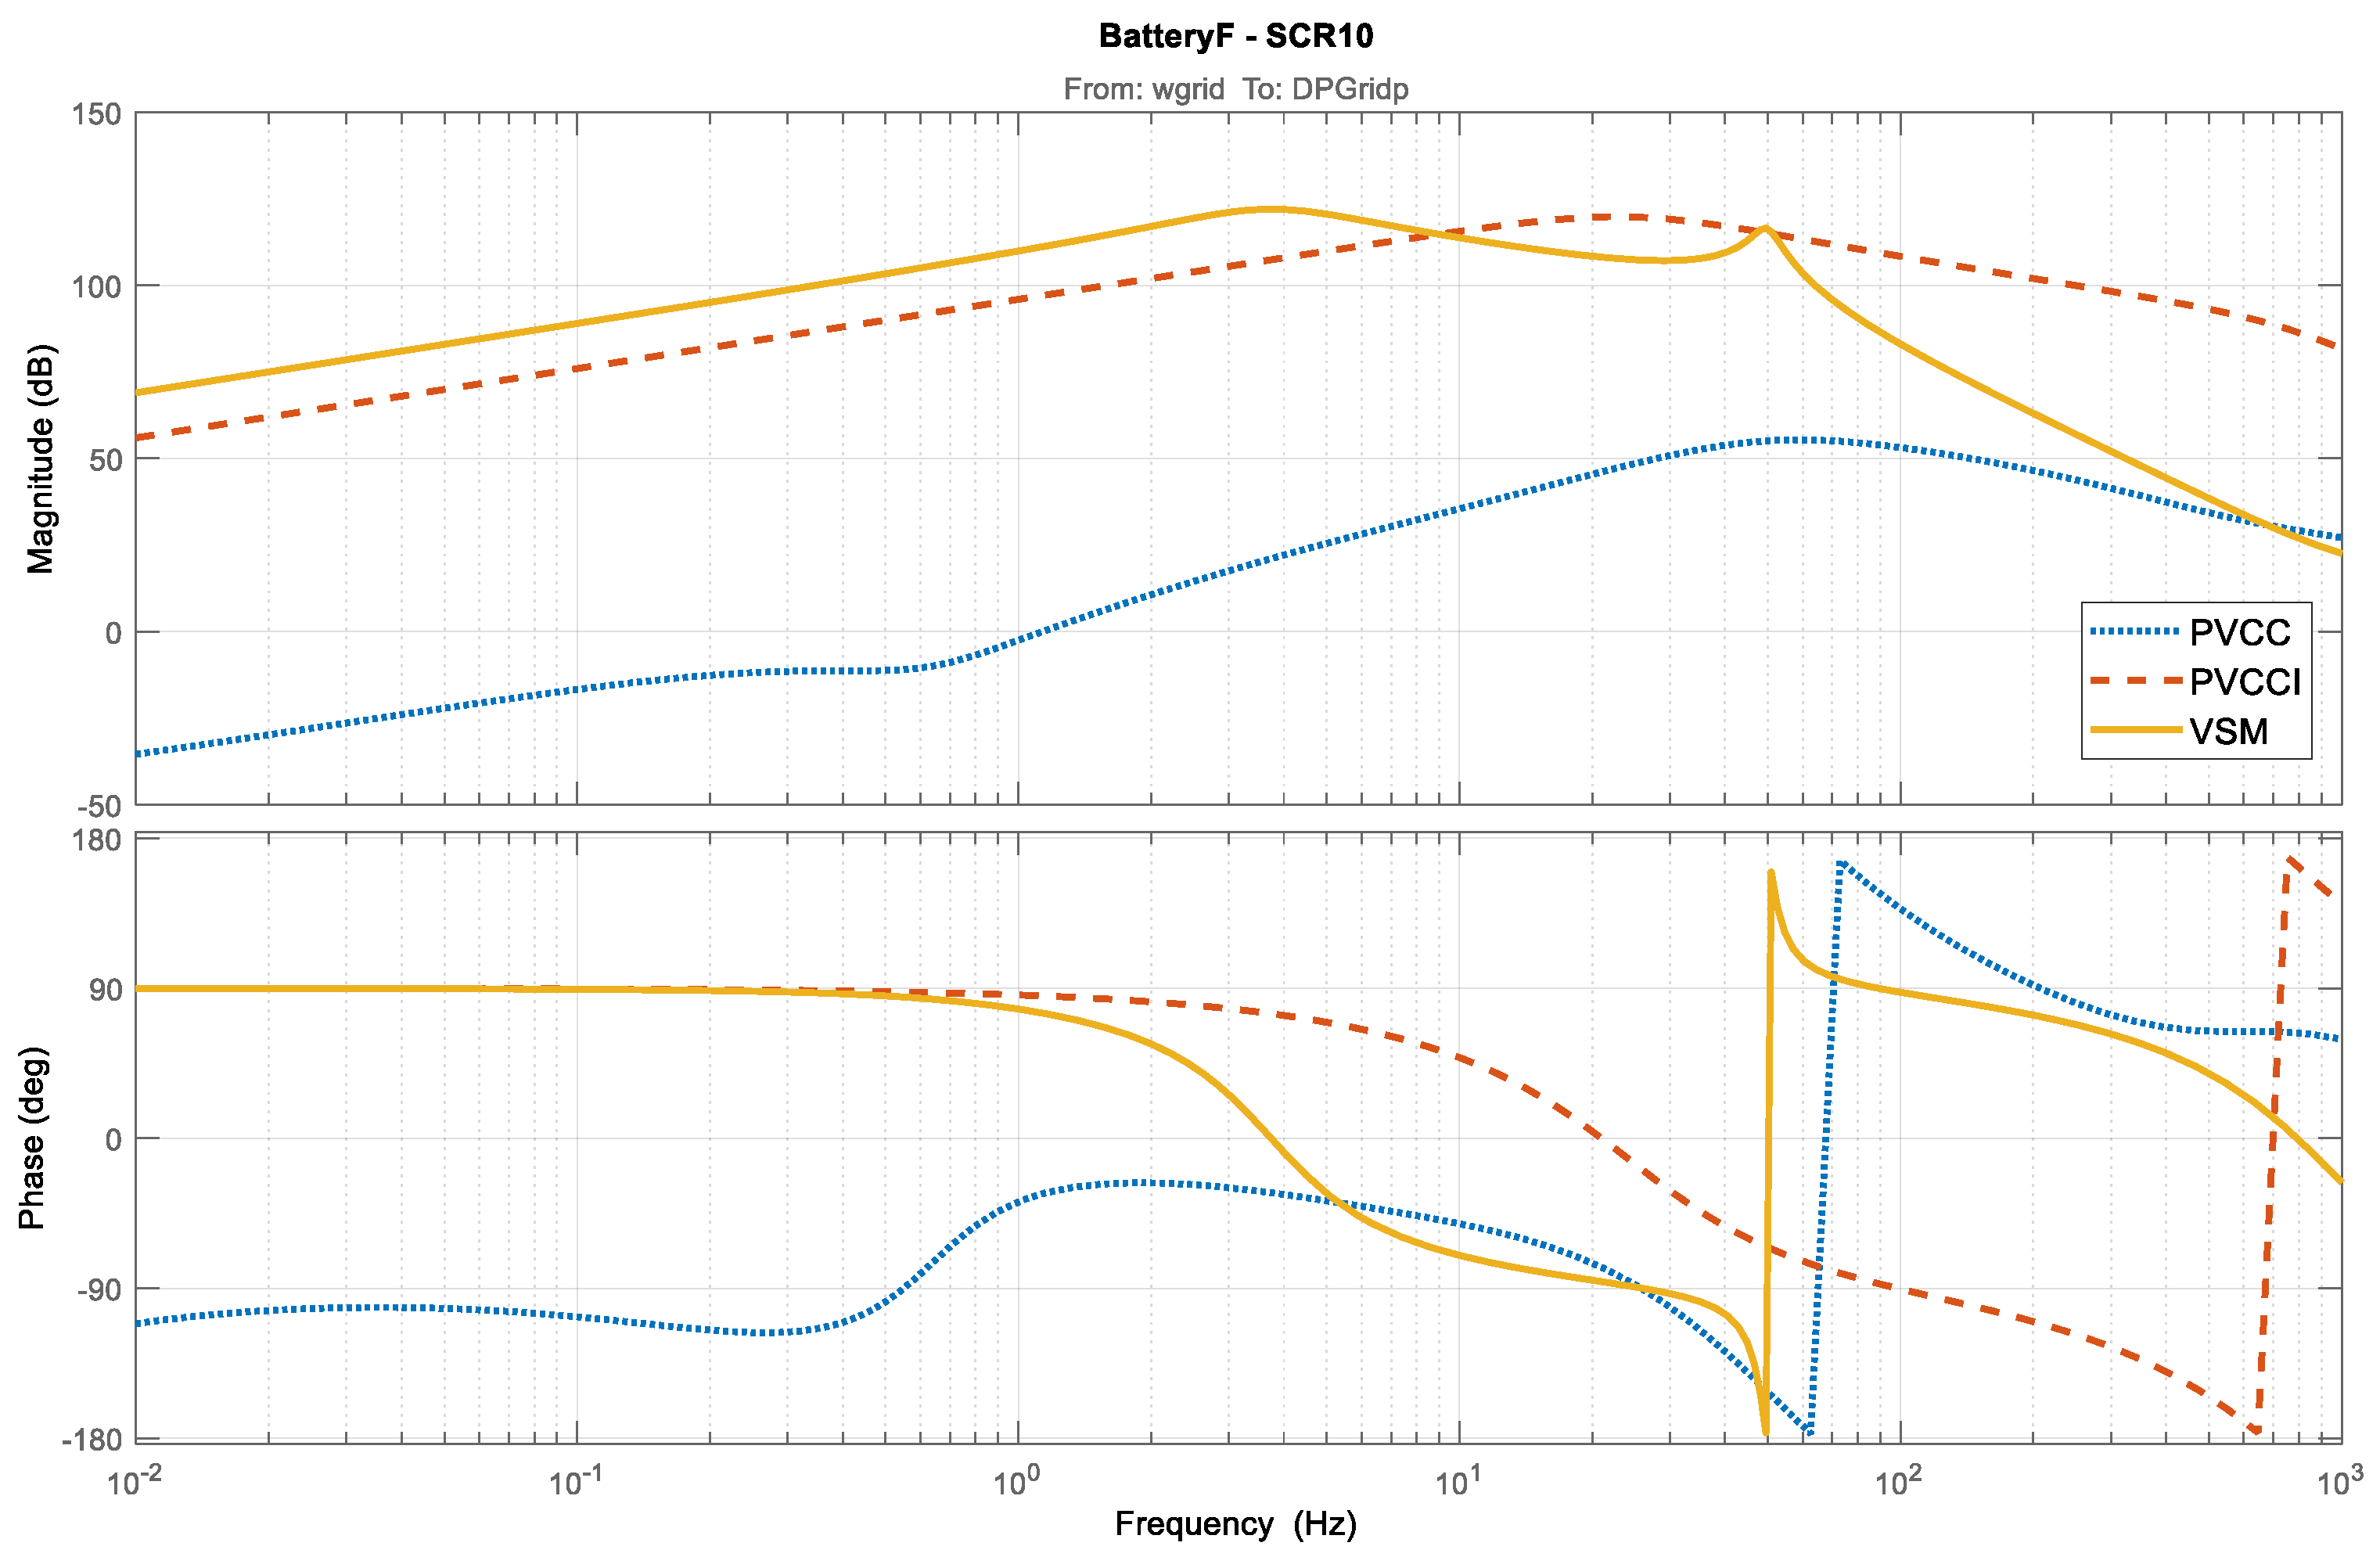
3.2. Small-Signal Analysis of the Different Network Side Converter Controllers
3.3. DC Link Voltage Control Location Comparison
3.4. Generator-Side Converter DC Link Voltage Control
3.5. Network-Side DC Link Voltage Control
4. Discussion
5. Conclusions
Supplementary Materials
Author Contributions
Funding
Conflicts of Interest
References
- Department for Business energy & Industrial Strategy. UK National Energy and Climate Plan (NECP); UK Government: London, UK, 2019. [Google Scholar]
- Department for Business, Energy and Industrial Strategy. UK Energy Statistics, Q1 2019; UK Government: London, UK, 27 June 2019. [Google Scholar]
- Tielens, P.; van Hertem, D. Grid Inertia and Frequency Control in Power Systems with High Penetration of Renewables. In Proceedings of the Young Researchers Symposium in Electrical Power Engineering, Delft, The Netherlands, 16–17 April 2012. [Google Scholar]
- Wind Europe. Wind Energy in Europe in 2018—Trends and Statistics; Wind Europe: Brussels, Belgium, 2019. [Google Scholar]
- Erlich, I.; Korai, A.; Shewarega, F. Study on the minimum share of conventional generation units required for stable operation of future converter-dominated grids. In Proceedings of the 2018 IEEE Power & Energy Society General Meeting (PESGM), Portland, OR, USA, 5–10 August 2018. [Google Scholar]
- Yu, M.; Roscoe, A.J.; Dysko, A.; Booth, C.D.; Ierna, R.; Zhu, J.; Urdal, H. Instantaneous penetration level limits of non-synchronous devices in the British power system. IET Renew. Power Gener. 2017, 11, 1211–1217. [Google Scholar] [CrossRef] [Green Version]
- Zhu, J.; Booth, C.; Adam, G.; Roscoe, A.; Bright, C.G. Inertia emulation control strategy for VSC-HVDC transmission systems. IEEE Trans. Power Syst. 2012, 28, 1277–1287. [Google Scholar] [CrossRef] [Green Version]
- Morren, J.; Pierik, J.; de Haan, S.W.H. Inertial response of variable speed wind turbines. Electr. Power Syst. Res. 2006, 76, 980–987. [Google Scholar] [CrossRef]
- Serban, I.; Petrea, C. Microgrid control based on a grid-forming inverter operating as virtual synchronous generator with enhanced dynamic response capability. Int. J. Electr. Power Energy Syst. 2017, 89, 94–105. [Google Scholar] [CrossRef]
- Mandrile, F.; Carpaneto, E.; Bojoi, R. Grid-Tied Inverter with Simplified Virtual Synchronous Compensator for Grid Services and Grid Support. In Proceedings of the IEEE Energy Conversion Congress and Exposition, Baltimore, MD, USA, 29 September–3 October 2019. [Google Scholar]
- Zhao, M.; Yin, H.; Xue, Y.; Zhang, X.-P. The Impact on Power System with Wind Integration from Multiple Virtual Synchronous Machines. In Proceedings of the IEEE International Conference on Systems, Man and Cybernetics, Bari, Italy, 6–9 October 2019. [Google Scholar]
- L. Torres, M.A.; C. Lopes, L.A.; T. Morán, L.A.; C. Espinoza, J.R. Self-Tuning Virtual Synchronous Machine: A Control Strategy for Energy Storage Systems to Support Dynamic Frequency Control. IEEE Trans. Energy Convers. 2014, 29, 833–840. [Google Scholar] [CrossRef]
- Hogan, D.J.; Gonzalez-Espin, F.; Hayes, J.G.; Lightbody, G.; Albiol-Tendillo, L.; Foley, R. Virtual Synchronous-Machine Control of Voltage-Source Converters in a Low-Voltage Microgrid. In Proceedings of the 18th European Conference on Power Electronics and Applications, Karlsruhe, Germany, 5–9 September 2016. [Google Scholar]
- D’Arco, S.; Suul, J.A.; Fosso, O.B. Small-Signal Modelling and Parameteric Sensitivity of a Virtual Synchronous Machine. In Proceedings of the Power Systems Computation Conference, Wroclaw, Poland, 18–22 August 2014. [Google Scholar]
- Chen, Y.; Hesse, R.; Turschner, D.; Beck, H.-P. Improving the Grid Power Quality Using Virtual Synchronous Machines. In Proceedings of the International Conference on Power Engineering, Energy and Electrical Drives, Torremolinos (Malaga), Spain, 11–13 May 2011. [Google Scholar]
- Virtual Synchronous Machines—Classification of Implementations and Analysis of Equivalence to Droop Controllers for Microgrids. In Proceedings of the IEEE Grenoble Conference, Grenoble, France, 16–20 June 2013.
- D’Arco, S.; Suul, J.A.; Fosso, O.B. A Virtual Synchronous Machine implementation for distributed control of power converters in SmartGrids. Electr. Power Syst. Res. 2015, 122, 180–197. [Google Scholar] [CrossRef]
- Van Wesenbeeck, M.P.N.; de Haan, S.W.H.; Varela, P.; Visscher, K. Grid Tied Converter with Virtual Kinetic Storage. In Proceedings of the IEEE Bucharest Power Tech Conference, Bucharest, Romania, 28 June–2 July 2009. [Google Scholar]
- Torres, M.; Lopes, L.A.C. Virtual Synchronous Generator Control in Autonomous Wind-Diesel Power Systems. In Proceedings of the IEEE Electrical Power & Energy Conference, Montreal, QC, Canada, 22–23 October 2009. [Google Scholar]
- Vassilakis, A.; Kotsampopoulos, P.; Hatziargyriou, N.; Karapanos, V. A Battery Energy Storage Based Virtual Synchronous Generator. In Proceedings of the IREP Symposium—Bulk Power System Dynamics and Control, Rethymnon, Greece, 25–30 August 2013. [Google Scholar]
- He, W.; Yuan, X.; Hu, J. Inertia provision and estimation of PLL-based DFIG wind turbines. IEEE Trans. Power Syst. 2016, 31, 510–521. [Google Scholar] [CrossRef]
- Ramtharan, G.; Jenkins, N.; Anaya-Lara, O.; Bossanyi, E. Influence of Rotor Structural Dynamics Representations on the Electrical Transient Performance of FSIG and DFIG Wind Turbines. Wind Energy 2007, 10, 293–301. [Google Scholar] [CrossRef]
- Muyeen, S.M.; Ali, M.H.; Takahashi, R.; Murata, T.; Tamura, J.; Tomaki, Y.; Sakahara, A.; Sasano, E. Comparative study on transient stability analysis of wind turbine generator system using different drive train models. IET Renew. Power Gener. 2007, 1, 131–141. [Google Scholar] [CrossRef]
- Alizadeh, O.; Yazdani, A. A Strategy for Real Power Control in a Direct-Drive PMSG-Based Wind Energy Conversion System. IEEE Trans. Power Deliv. 2013, 28, 1297–1305. [Google Scholar] [CrossRef]
- Geng, H.; Xu, D.; Wu, B.; Yang, G. Active Damping for PMSG-Based WECS With DC-Link Current Estimation. IEEE Trans. Ind. Electron. 2011, 58, 1110–1119. [Google Scholar] [CrossRef]
- Mendes, V.F.; Matos, F.F.; Liu, S.Y.; Cupertino, A.F.; Pereira, H.A.; de Sousa, C.V. Low Voltage Ride-Through Capability Solutions for Permanent Magnet Synchronous Wind Generators. Energies 2016, 91, 59. [Google Scholar] [CrossRef] [Green Version]
- Geng, H.; Xu, D.; Wu, B.; Yang, G. Active damping for torsional vibrations in PMSG based WECS. In Proceedings of the 2010 Twenty-Fifth Annual IEEE Applied Power Electronics Conference and Exposition (APEC), Palm Springs, CA, USA, 21–25 Febuary 2010. [Google Scholar]
- Harnefors, L.; Nee, H.-P. Model-based current control of AC machines using the internal model control method. IEEE Trans. Ind. Appl. 1998, 34, 287–293. [Google Scholar] [CrossRef]
- Almeida, R.G.; Castronuovo, E.D.; Lopes, J.A.P. Optimum generation control in wind parks when carrying out system operator requests. IEEE Trans. Power Syst. 2006, 21, 718–725. [Google Scholar] [CrossRef] [Green Version]
- Sanjari, M.J.; Gharehpetian, G.B. Unified framework for frequency and voltage control of autonomous microgrids. IET Gener. Transm. Distrib. 2013, 7, 965–972. [Google Scholar] [CrossRef]
- Egea-Alvarez, A.; Fekriasl, S.; Hassan, F.; Gomis-Bellmunt, O. Advanced Vector Control for Voltage Source Converters Connected to Weak Grids. IEEE Trans. Power Syst. 2015, 30, 3072–3081. [Google Scholar] [CrossRef] [Green Version]
- Zhang, L. Modeling and Control of VSC-HVDC Links Connected to Weak AC Systems. Ph.D. Dissertation, KTH, Stockholm, Sweden, 2010. [Google Scholar]
- Ma, Y.; Cao, W.; Yang, L.; Wang, F.; Tolbert, L. Virtual synchronous generator control of full converter wind turbines with short-term energy storage. IEEE Trans. Ind. Electron. 2017, 64, 8821–8831. [Google Scholar] [CrossRef]
- Roscoe, A.; Brogan, P.; Elliot, D.; Knueppel, T.; Gutierrez, I.; Campion, J.-C.P.; Da Silva, R. Practical Experience of Operating a Grid Forming Wind Park and its Response to System Events. In Proceedings of the 18th Interational Wind Integration Workshop, Dublin, Ireland, 16–18 October 2019. [Google Scholar]


| Parameter | Value | Parameter | Value |
|---|---|---|---|
| 690 V | 5 | ||
| 34.1 μF | 0.0253 | ||
| 50.5 μH | 0.7935 | ||
| 1.6 mΩ | 0.0029 | ||
| 11.2 mF | 1 | ||
| 2.7 mΩ | 20 | ||
| 0.526 mH | 1000 | ||
| 12,892,100 kgm2 | 100,000 | ||
| 1,371,500 kgm2 | 100 | ||
| 21,264,367 Nm−1 | 0.1 | ||
| 4.14 rads−1 | |||
| 1 | |||
| 80 | 0.02 | ||
| 1.885 rads−1 | 50 | ||
| 0.1 ms | 0.7885 | ||
| 2 | 175.1847 |
© 2020 by the authors. Licensee MDPI, Basel, Switzerland. This article is an open access article distributed under the terms and conditions of the Creative Commons Attribution (CC BY) license (http://creativecommons.org/licenses/by/4.0/).
Share and Cite
Henderson, C.; Vozikis, D.; Holliday, D.; Bian, X.; Egea-Àlvarez, A. Assessment of Grid-Connected Wind Turbines with an Inertia Response by Considering Internal Dynamics. Energies 2020, 13, 1038. https://0-doi-org.brum.beds.ac.uk/10.3390/en13051038
Henderson C, Vozikis D, Holliday D, Bian X, Egea-Àlvarez A. Assessment of Grid-Connected Wind Turbines with an Inertia Response by Considering Internal Dynamics. Energies. 2020; 13(5):1038. https://0-doi-org.brum.beds.ac.uk/10.3390/en13051038
Chicago/Turabian StyleHenderson, Callum, Dimitrios Vozikis, Derrick Holliday, Xiaoyan Bian, and Agustí Egea-Àlvarez. 2020. "Assessment of Grid-Connected Wind Turbines with an Inertia Response by Considering Internal Dynamics" Energies 13, no. 5: 1038. https://0-doi-org.brum.beds.ac.uk/10.3390/en13051038