Defects and Dopants in CaFeSi2O6: Classical and DFT Simulations


1
Department of Materials, Imperial College London, London SW7 2AZ, UK
2
Faculty of Engineering, Environment and Computing, Coventry University, Priory Street, Coventry CV1 5FB, UK
*
Author to whom correspondence should be addressed.
Energies 2020, 13(5), 1285; https://0-doi-org.brum.beds.ac.uk/10.3390/en13051285
Submission received: 27 January 2020
/
Revised: 25 February 2020
/
Accepted: 8 March 2020
/
Published: 10 March 2020
Abstract
:Calcium (Ca)-bearing minerals are of interest for the design of electrode materials required for rechargeable Ca-ion batteries. Here we use classical simulations to examine defect, dopant and transport properties of CaFeSi2O6. The formation of Ca-iron (Fe) anti-site defects is found to be the lowest energy process (0.42 eV/defect). The Oxygen and Calcium Frenkel energies are 2.87 eV/defect and 4.96 eV/defect respectively suggesting that these defects are not significant especially the Ca Frenkel. Reaction energy for the loss of CaO via CaO Schottky is 2.97 eV/defect suggesting that this process requires moderate temperature. Calculated activation energy of Ca-ion migration in this material is high (>4 eV), inferring very slow ionic conductivity. However, we suggest a strategy to introduce additional Ca2+ ions in the lattice by doping trivalent dopants on the Si site in order to enhance the capacity and ion diffusion and it is calculated that Al3+ is the favourable dopant for this process. Formation of Ca vacancies required for the CaO Schottky can be facilitated by doping of gallium (Ga) on the Fe site. The electronic structures of favourable dopants were calculated using density functional theory (DFT).
1. Introduction
Over the last two decades, great progress has been made in the development of rechargeable lithium (Li)-ion batteries. However, there is a necessity to find alternatives to Li-ion batteries as energy demand increases rapidly with the world population. In this respect, sodium (Na) batteries are currently being considered mainly due to the high abundance of Na [1,2,3,4]. Batteries based on multivalent cations such as magnesium (Mg2+) and zinc (Zn2+) are also promising, as they can provide high energy density [5,6,7,8,9].
A Ca-ion battery is being currently considered as an alternative to Li-ion battery mainly due to the low cost associated with high abundance of Ca and high energy density [10]. However, Ca-ion diffusion is expected to be slow due to its larger ion size compared to that of Li. Furthermore, it is expected that there will be strong attractive or repulsive forces between migrating Ca ions and surrounding ions due to the double positive charge of Ca.
A variety of compounds such as garnets (e.g., Ca3Fe2Si3O12), pyroxenes (e.g., CaMnSi2O6), double carbonates (e.g., CaMg(CO3)2), marokites (e.g., CaMn2O4) have been tested as cathode materials for application in Ca-ion batteries experimentally or theoretically [11,12]. In a combined experimental and theoretical study on CaMn2O4 by Arryo-de Dompablo et al. [12], it was concluded that deinsertion of Ca ions from CaMn2O4 is hard, and this was further confirmed by the high activation energy (1.00 eV) calculated for the Ca-ion migration. In a DFT (Density Functional Theory) study by Torres et al. [11] on pyroxene, garnet and double carbonate-based minerals, it was shown that deintercalation would provide high energy densities and Ca-ion diffusion in these materials would be slow.
“Hedenbergite” CaFeSi2O6 [13] is a silicon-based Ca-bearing mineral which is of great interest for designing electrode material as Si and Fe are safer, abundant and cheap. Furthermore, the great structural stability required during the intercalation is expected to be provided by strong Si–O bonds in SiO4 units. Electrode materials based on [SiO4]4− poly anion have been synthesized and their electrochemical activities tested for Li, Na and Mg ion batteries [14,15,16]. In addition, theoretical studies have also been explored on silicate-based materials to examine defects, diffusion and dopants [17,18,19,20].
Understanding the defect and diffusion properties of energy materials via computational modelling is an efficient complementary way for the design of promising energy devices. In many cases, computational studies have been successful in the determination of experimental crystal structures and ion migration pathways and prediction of promising isovalent and aliovalent dopants in many oxide materials [21,22,23,24,25,26]. In this work, we examine the intrinsic defect processes, Ca-ion diffusion pathways and promising doping strategies.
2. Computational Methods
Computational simulations were performed using classical simulation and DFT simulation. Classical simulations as implemented in the generalized used lattice program (GULP) [27,28] allowed the modelling of the energy minimized crystal structure with equilibrium lattice constants, calculation of the lowest energy defect process, identification of the promising dopants at different cation sites and the simulation of the Ca-ion diffusion pathways with the respective activation energies of migration. This method consists of two main ionic interactions, namely, long range (Coulombic) and short range (repulsive—Pauli—and attractive—van der Waals). Buckingham potentials were used to model short-range interactions. Point defects were modelled using Mott-Littleton method [29], as adopted in the GULP code. Core-shell model was applied to consider the polarization of ions in the lattice. In line with the previous studies [30], Ca-ion migration calculations were performed by following the method developed by Catlow et al. [31].
Electronic structures of the most favourable dopants were calculated using a plane wave DFT code VASP (Vienna ab initio simulation program) [32,33], which uses projected augmented wave (PAW) potentials [34] and plane wave basis sets. A plane wave basis set with a cut-off of 500 eV and Monkhorst pack [35] k-points (4 × 4 × 4) were used in all calculations. For defect modelling, a supercell containing 80 atoms was used. Exchange correlation was modelled using generalized gradient approximation (GGA) implemented by Perdew, Burke, and Ernzerhof (PBE) [36]. Both atomic positions and the cell parameters optimized using conjugate gradient algorithm [37]. Short range attractive interactions arising from dispersion were modelled using a semi-empirical scheme (DFT+D3) as implemented in the VASP code [38].
3. Results
3.1. Crystal Structure of CaFeSi2O6
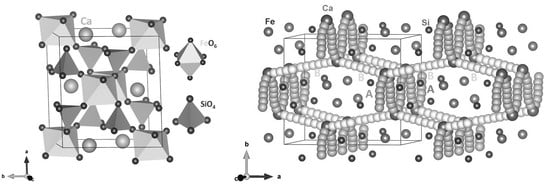
CaFeSi2O6 is monoclinic with space group of C2/c (no. 227). Zhang et al. [13] reported the crystal structure of CaFeSi2O6 with experimental values are a = 9.8107 Å, b = 8.9856 Å, c = 5.2245 Å, α = γ = 90° and β = 104.593°. The crystal structure consists of corner sharing FeO6 octahedral and SiO4 tetrahedral units as shown in Figure 1. To validate the Buckingham potentials (Table S1 in the supplementary information) used in the classical simulation and PAW potentials used in the DFT simulation, energy mimisation calculations were performed and the calculated lattice parameters were compared with corresponding experimental values. The theoretical method reproduced the experimetal structure with the error margin being less than 2% (refer to Table 1).
3.2. Intrinsic Defect Processes
Point defects in materials are important as they control many physical properties of solids, including diffusion properties and thermodynamic properties. Classical simulations were used to calculate two principle intrinsic point defect energies (vacancies and interstitials). To calculate the Schottky and Frenkel defect processes, energies of point defects were then combined. Anti-site defect in which cations exchange their atomic positons were also calculated. Fourteen intrinsic defect processes were identified, as outlined in Equations (1)–(14) using the Kröger-Vink notation [39].
Table 2 reports the defect energies of Frenkel, Schottky and anti-site defect processes. The lowest formation energy is calculated for the Ca-Fe anti-site defect (0.42 eV/defect). This is due to the same charge (+2) of both Ca and Fe. Other anti-site defects (Ca-Fe and Ca-Si) are slightly high due to the charge mismatch. Anti-site defects are common in many oxide materials and have been observed experimentally and theoretically [40,41,42,43]. The O Frenkel (2.87 eV/defect) and CaO Schottky (2.97 eV/defect) energies are close to each other and their energies are lower than the other Frenkel or Schottky energies. However, those defects are not significant at normal temperatures. Both Ca and Fe Frenkel energies are ~4.90 eV, suggesting that their formation is unlikely to occur at room temperature. Si Frenkel energy is 9.18 eV/defect inferring the absence of this defect at any conditions.
3.3. Calcium Ion Diffusion
To examine the Ca-ion diffusion pathways and their corresponding activation energies, classical simulationes were performed. For a potential high-rate electrode material, ion diffusion with low activation energy of migration is an important factor. The experimental observation of diffusion pathways and their energetics is challenging. In that respect, computational modelling has been useful in providing valuable information on migration pathways and their activation energies [44,45,46,47,48]. We identified two Ca local hops (A and B), as shown in Figure 2. Table 3 reports the Ca-Ca distances and activation energies. In Figure 3, energy profile diagrams for each local hops are shown.
Calculations show that activation energies are high for both local hops inferring slow diffusion of Ca ions in this material. To construct long-range diffusion pathways, local Ca hops were connected. Two different long-range pathways were identified. The first pathway (A→A→A→A) exhibits a zig-zag pattern in the bc plane with overall activation energy of 4.36 eV. The second pathway consists of local hops B (B→B→B→B) and Ca ions migrate in the ab plane with overall activation energy of 4.49 eV. High activation energies reveal that very slow Ca-ion diffusion would be expected in CaFeSi2O6. Table 4 reports the activation energies calculated in previous DFT modelling in different Ca-based electrode materials [11,12]. In general, high activation energy is noted. CaMn(SiO3)2 exhibits a very high activation energy. This should be due to the long Ca-Ca distances. Notably, both CaFeSi2O6 and CaMn(SiO3)2 have the same crystal structures. Both classical and DFT modelling methods provide similar activation energies for these types of materials.
3.4. Solution of Dopants
Performance of an electrode material can be improved by doping aliovalent or isovalent dopants via introducing charge compensating point defects (vacancies and interstitials) in the lattice. Here we investigated the substitution of a range of dopant ions in CaFeSi2O6 using classical simulation to test the most favourable dopants experimentally.
3.4.1. Divalent Dopants
Both Ca and Fe sites were considered for substituion with some divalent cations (M = Ni, Mg, Co, Zn, Mn, Sr and Ba) and the following reaction equations were used to calculate reaction enthalpies. Substitution of divalent cations at the divalent cation sites in the lattice does not require another defect for charge compensation.
Figure 4 reports the solution enthalpy as a function of the radius of the dopant ion. The lowest solution enthalpy (0.01 eV) is calculated for Sr2+ ion at the Ca site (refer to Figure 4a). The ionic radius of Ca2+ is 1.00 Å. The preference of Sr2+ can be due to position of both Ca2+ and Sr2+ ions in the same group. The second favourable dopant is Mn2+ with the soultion enthalpy of 0.56 eV and its ionic radius (0.96 Å) is very close to that of Ca2+ (1.00 Å). Solution enthalpy decreases with the increase of ionic radius from Ni2+ to Sr2+. This is mainly due to the decrease in the cation mismatch. The soution enthalpy of Ba2+ is 1.03 eV due to its larger ionic radius than that of Ca2+.
Exoergic solution enthalpy is calculated for Mn2+ at the Fe site. The ionic radius of Fe2+ in an octahedral environment is 0.61 Å. Solution enthalpies for Co2+, Ni2+, Mg2+ and Zn2+ are very small and range between 0.02 eV and 0.10 eV meaning that they are also candidate dopants. Both Sr2+ and Ba2+ exhibit high solution enthalpies.This is beacause of their larger ionic radii than that of Fe2+ ion.
3.4.2. Trivalent Dopants
Additional Ca2+ ions can improve its capacity and then enhance ionic conductivity in CaFeSi2O6. Here we suggest a stratergy to form Ca interstitials by doping trivalent cations (Al, Sc, In, Y, Gd, La and Ga) at the Si site. Previous modelling studies also considered the same strategy in different battery materials and validity of this stratergy has been confirmed by experimental studies in Li2RuO3 [49]. The solution of M2O3 (R = Al, Sc, In, Y, Gd, La and Ga) was considered using the following reaction (in Kröger-Vink notation).
Figure 5a reports the solution enthalpies of M2O3. The current simulations show that the most favourable dopant is the Al3+ but the solution enthalpy is highly endothermic. This indicates that the additional Ca can be formed in the form of interstitials into CaFeSi2O6. Experimental verification is needed to determine the exact concentration of the composition. The possible structure of doped compound can be written as CaFeSi2−xAlxO6 (x = 0.0–1.0).
Doping of trivalent dopants at the Fe site can facilitate the formation of Ca vacancies required for the vacancy assisted Ca diffusion and CaO Schottky formation. Figure 5b reports the solution enthalpies calculated using the following reaction equation.
In all cases, solution enthalpies are endothermic, suggesting that a high temperature is required for this process. Current calculations were performed at 0 K and it is anticipated that at high temperature, solution enthalpy values would be less positive. A favourable dopant in this process is Ga. This could be due to the very small difference between ionic radii of Ga3+ (0.62 Å) and Fe2+ (0.61 Å). The highest solution enthalpy is calculated for Al3+. Both Sc and In exhibit almost similar solution enthalpies deviating only by ~0.08 eV from the value calculated for Ga3+. From Y to La, solution enthalpies increase gradually with ionic radius.
Here we calculate the activation energies for Ca-ion diffusion in the presence of Al3+ on the Si site. Figure 6 shows the energy profile diagrams for the local Ca hops.
There is a slight reduction (by 0.02 eV) in the activation energy for the local hop A. In the case of hop B, activation energy is reduced by 0.48 eV. In both cases, Ca-Ca distances have been elongated compared to the distances present in the pure crystal structure. This perturbation in the distances can be due to the charge and ionic radius mismatch between Al3+ and Si4+. Our simulation predicts that doping Al on the Si site would not only increase the concentration of Ca2+ ions in the lattice but also reduces the activation energy of the Ca-ion migration.
3.4.3. Tetravalent Dopants
Here we discuss the results obtained from doping of some tetravalent dopants (Ge4+, Ti4+, Sn4+, Zr4+ and Ce4+) at the Si site. Solution enthalpy was calculated using the following reaction equation.
Promising dopant for this process is Ge with the lowest solution enthalpy of 0.65 eV (see Figure 7). This is because of the fact that ionic radii of both Ge4+ (0.39 Å) and Si4+ (0.40 Å) are very close. Solution enthalpy for the doping of Ti4+ is 3.20 eV higher by ~2.50 eV than that calculated for Ge4+. Solution enthalpy increases with ionic radius from Sn to Ce. Solution enthalpy for CeO2 is 4.19 eV meaning that this highly endoergic process mainly occurs at high temperatures.
3.5. Electronic Structures of Doped CaFeSi2O6
We employed DFT to examine the electronic structures of defect free and doped-CaFeSi2O6 configurations. The promising dopants were only considered as discussed in the previous sections.
Previous DFT simulations by Streltsov et al. [50] discussed the electronic structure of CaFeSi2O6. Their calculation show that CaFeSi2O6 is a wide gap semiconductor with the band gap of 3.80 eV which is in agreement with the calculated band gap of 3.40 eV in this study (see Figure 8c). Furthermore, the total DOS (density of states) plot shows that there should be a net magnetic moment present as spin-up and spin-down states are not symmetric.
First we considered the electronic structure of Sr substituted at the Ca site in CaFeSi2O6. The Sr-O bond distances are slightly longer than the Ca-O bond distances. This is due to the larger ionic radius of Sr2+ (1.26 Å) than that of Ca2+ (1.00 Å). Fermi energy and band gap were almost unaltered with the doping of Sr (see Figure 8d). However, the states occupied in the gap region sligltly perturbes. Atomic DOS of Sr is shown in Figure 8e.
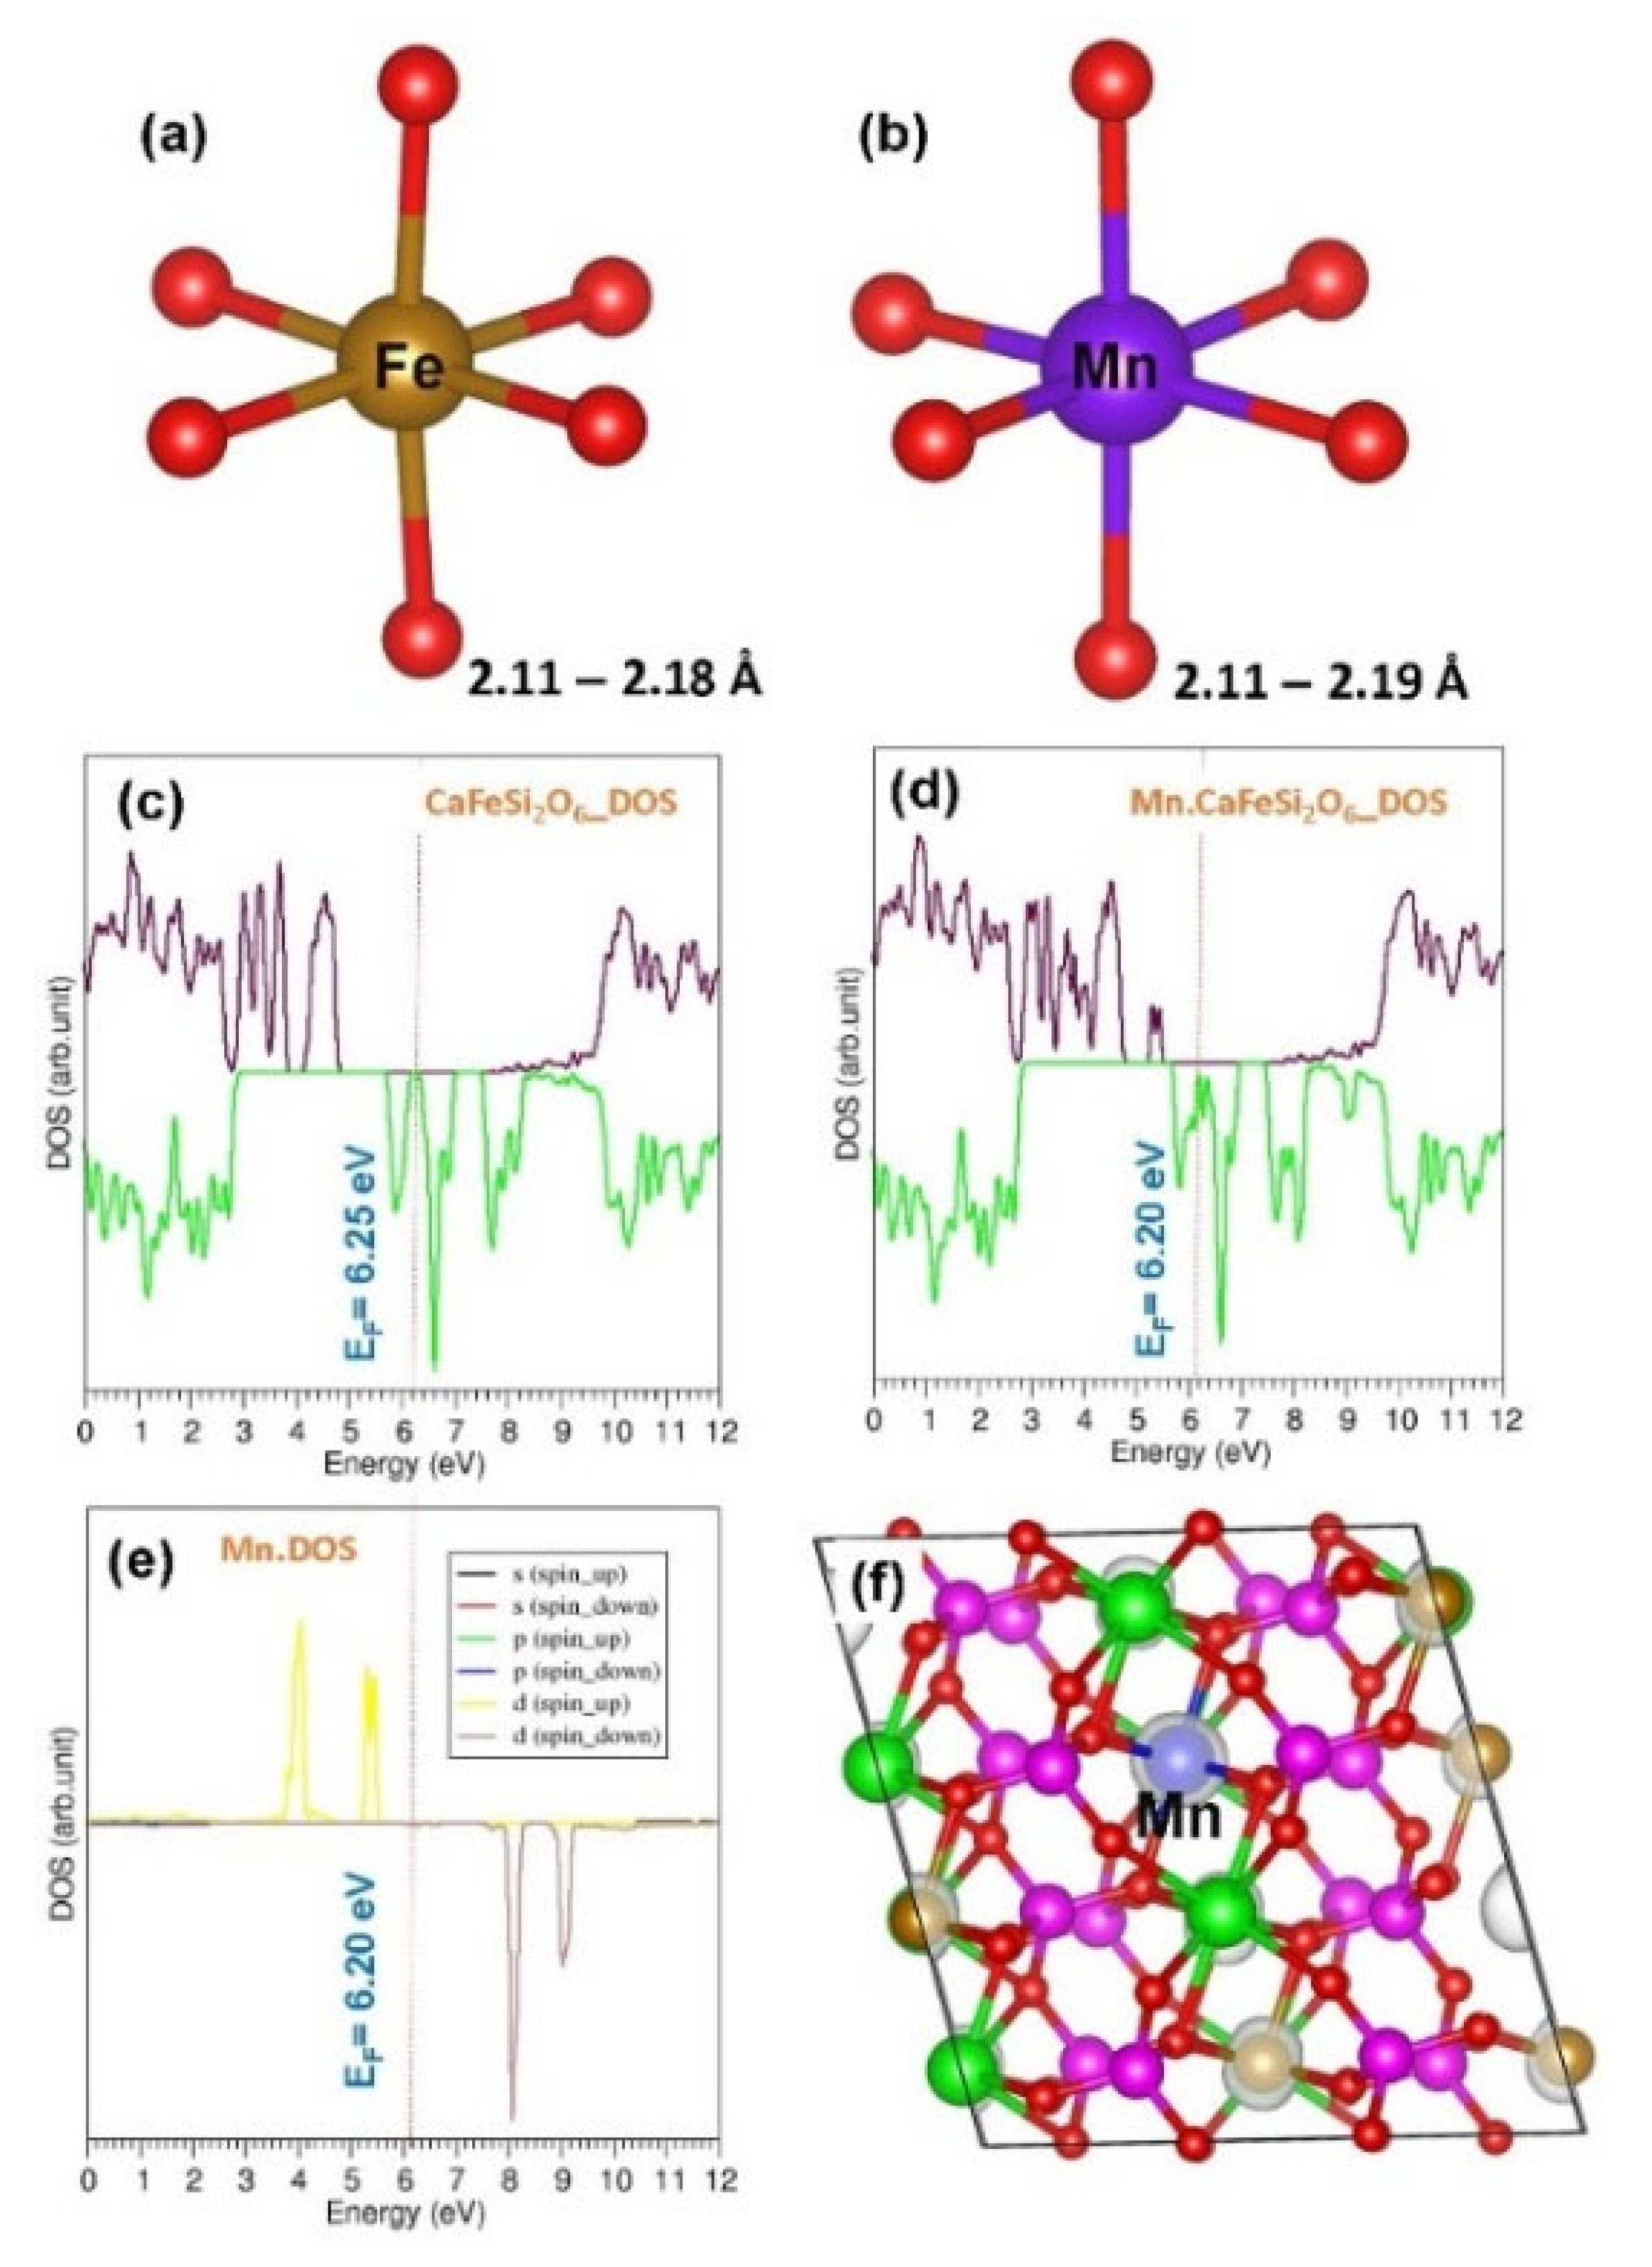
Next we discuss the electronic structure of Mn substituted at the Fe site. Calculated Fe-O and Mn-O bond distances are almost the same. This is due to the similar ionic radius of Fe2+ (0.61 Å) and Mn2+ (0.67 Å). Doping of Mn reduces the Fermi energy slightly (by 0.05 eV) and band gap significantly (by 0.80 eV) (see Figure 9).
Doping of Al at the Si site was next considered. Al-O bond distances are slightly longer than Si-O bond distances (see Figure 10). This is due to the larger ionic radius of Al3+ than that of Si4+ in a tetrahedral coordination. Fermi energy is shifted by 0.21 eV upon doping. Fermi energy level is occupied by additional states mainly arising from p states of Al (see Figure 10d,e). Substitution of Al at the Si site introduces an electron in the lattice and makes the resultant compound metallic.
Calculated bond lengths show that Fe-O bond distances are shorter than the Ga-O bond distances. Ionic radii of both Fe2+ and Ga3+ ions are close to each other. However, charge density of Ga3+ is greater than that of Fe2+ due to the higher charge (+3) of Ga than that of Fe (+2). Shorter Ga-O bond distances are due to the strong ionic interaction between Ga3+ and O2−. Fermi energy increase by 0.35 eV upon Ga doping (see Figure 11). There are no significant peaks arising from Ga near Fermi energy level or in the gap according to the atomic DOS of Ga. However, there is a significant reorientation of spin states and the resultant doped configuration exhibits metallic character.
Finally, Ge was introduced at the Si site. Though Ge and Si are isovalent atoms, their ionic radii are different (Si4+: 0.26 Å and Ge4+: 0.39 Å). Larger ionic radius of Ge4+ reflects in the longer Ge-O bond distances (see Figure 12). Total DOS plot of Ge-doped CaFeSi2O6 is almost unaltered near the Fermi level. This is further confirmed by the atomic DOS of Ge. The Fermi energy is lowered only by 0.08 eV upon Ge substitution. Charge density plot shows that there is a slight perturbation of electron charge density around Fe atoms only. However, charge localization is not observed around the Ge due to the isoelectronic nature of both Si and Ge.
4. Conclusions
We used computational techniques to provide a detailed atomistic level understanding of key defect processes, diffusion mechanisms and dopant properties in CaFeSi2O6. Calculations show that the Ca-Fe anti-site defect would be dominant in this material. The formation of Frenkel defects is unlikely under normal conditions though the O Frenkel exhibits the lowest Frenkel energy of 2.87 eV/defect. The loss of CaO in this material requires a moderate temperature and can be facilitated by introducing additional Ca vacancies. Ca-ion diffusion in this material is found to be very slow. Doping of Al at the Si site is anticipated to improve the capacity and ion diffusion. Formation of Ca vacancies required for the CaO Schottky can be facilitated by doping Ga at the Fe site. Electronic structure calculations show that CaFeSi2O6 is a wide-gap semiconductor. While isovalent dopants do not affect the electronic structure much, aliovalent dopants alter the electronic structure and gap states.
Supplementary Materials
The following are available online at https://0-www-mdpi-com.brum.beds.ac.uk/1996-1073/13/5/1285/s1, Table S1: Interatomic potential parameters used in the atomistic simulations of CaFeSi2O6.
Author Contributions
Computation, N.K.; Writing, N.K.; Analysis and Editing, A.C. All authors have read and agreed to the published version of the manuscript.
Funding
This research was financially supported by European Union’s H2020 Programme under Grant Agreement no 824072– HARVESTORE.
Acknowledgments
We acknowledge Imperial College for providing high performance computing facilities.
Conflicts of Interest
The authors declare no conflict of interest.
References
- Liu, Y.; Zhou, Y.; Zhang, J.; Xia, Y.; Chen, T.; Zhang, S. Monoclinic Phase Na3Fe2(PO4)3: Synthesis, Structure, and Electrochemical Performance as Cathode Material in Sodium-Ion Batteries. ACS Sustain. Chem. Eng. 2017, 5, 1306–1314. [Google Scholar] [CrossRef]
- Yabuuchi, N.; Kubota, K.; Dahbi, M.; Komaba, S. Research Development on Sodium-Ion Batteries. Chem. Rev. 2014, 114, 11636–11682. [Google Scholar] [CrossRef] [PubMed]
- Hwang, J.-Y.; Myung, S.-T.; Sun, Y.-K. Sodium-ion batteries: Present and future. Chem. Soc. Rev. 2017, 46, 3529–3614. [Google Scholar] [CrossRef] [PubMed] [Green Version]
- Kim, J.; Yoon, G.; Kim, H.; Park, Y.-U.; Kang, K. Na3V(PO4)2: A New Layered-Type Cathode Material with High Water Stability and Power Capability for Na-Ion Batteries. Chem. Mater. 2018, 30, 3683–3689. [Google Scholar] [CrossRef]
- Xu, C.; Li, B.; Du, H.; Kang, F. Energetic Zinc Ion Chemistry: The Rechargeable Zinc Ion Battery. Angew. Chem. Int. Ed. 2012, 51, 933–935. [Google Scholar] [CrossRef]
- Muldoon, J.; Bucur, C.B.; Gregory, T. Quest for Nonaqueous Multivalent Secondary Batteries: Magnesium and Beyond. Chem. Rev. 2014, 114, 11683–11720. [Google Scholar] [CrossRef] [PubMed]
- Ponrouch, A.; Frontera, C.; Bardé, F.; Palacín, M.R. Towards a calcium-based rechargeable battery. Nat. Mater. 2015, 15, 169–172. [Google Scholar] [CrossRef] [Green Version]
- Novák, P.; Imhof, R.; Haas, O. Magnesium insertion electrodes for rechargeable nonaqueous batteries—A competitive alternative to lithium? Electrochim. Acta 1999, 45, 351–367. [Google Scholar] [CrossRef]
- Aurbach, D.; Gofer, Y.; Lu, Z.; Schechter, A.; Chusid, O.; Gizbar, H.; Cohen, Y.; Ashkenazi, V.; Moshkovich, M.; Turgeman, R.; et al. A short review on the comparison between Li battery systems and rechargeable magnesium battery technology. J. Power Sources 2001, 97, 28–32. [Google Scholar] [CrossRef]
- Gummow, R.J.; Vamvounis, G.; Kannan, M.B.; He, Y. Calcium-Ion Batteries: Current State-of-the-Art and Future Perspectives. Adv. Mater. 2018, 30, 1801702. [Google Scholar] [CrossRef]
- Torres, A.; Luque, F.J.; Tortajada, J.; Arroyo-de Dompablo, M.E. Analysis of Minerals as Electrode Materials for Ca-based Rechargeable Batteries. Sci. Rep. 2019, 9, 9644. [Google Scholar] [CrossRef] [PubMed]
- Dompablo, M.E.A.-d.; Krich, C.; Nava-Avendaño, J.; Biškup, N.; Palacín, M.R.; Bardé, F. A Joint Computational and Experimental Evaluation of CaMn2O4 Polymorphs as Cathode Materials for Ca Ion Batteries. Chem. Mater. 2016, 28, 6886–6893. [Google Scholar] [CrossRef] [Green Version]
- Zhang, L.; Ahsbahs, H.; Hafner, S.S.; Kutoglu, A. Single-crystal compression and crystal structure of clinopyroxene up to 10 GPa. Am. Mineral. 1997, 82, 245–258. [Google Scholar] [CrossRef]
- Nishimura, S.-I.; Hayase, S.; Kanno, R.; Yashima, M.; Nakayama, N.; Yamada, A. Structure of Li2FeSiO4. J. Am. Chem. Soc. 2008, 130, 13212–13213. [Google Scholar] [CrossRef] [PubMed]
- Law, M.; Ramar, V.; Balaya, P. Na2MnSiO4 as an attractive high capacity cathode material for sodium-ion battery. J. Power Sources 2017, 359, 277–284. [Google Scholar] [CrossRef]
- Redfern, S.A.T.; Artioli, G.; Rinaldi, R.; Henderson, C.M.B.; Knight, K.S.; Wood, B.J. Octahedral cation ordering in olivine at high temperature. II: An in situ neutron powder diffraction study on synthetic MgFeSiO4 (Fa50). Phys. Chem. Miner. 2000, 27, 630–637. [Google Scholar] [CrossRef]
- Kuganathan, N.; Islam, M.S. Li2MnSiO4 Lithium Battery Material: Atomic-Scale Study of Defects, Lithium Mobility, and Trivalent Dopants. Chem. Mater. 2009, 21, 5196–5202. [Google Scholar] [CrossRef]
- Kuganathan, N.; Chroneos, A. Defects, Dopants and Sodium Mobility in Na2MnSiO4. Sci. Rep. 2018, 8, 14669. [Google Scholar] [CrossRef]
- Armstrong, A.R.; Kuganathan, N.; Islam, M.S.; Bruce, P.G. Structure and Lithium Transport Pathways in Li2FeSiO4 Cathodes for Lithium Batteries. J. Am. Chem. Soc. 2011, 133, 13031–13035. [Google Scholar] [CrossRef] [Green Version]
- Liivat, A.; Thomas, J.O. Li-ion migration in Li2FeSiO4-related cathode materials: A DFT study. Solid State Ion. 2011, 192, 58–64. [Google Scholar] [CrossRef]
- Rupasov, D.; Chroneos, A.; Parfitt, D.; Kilner, J.A.; Grimes, R.W.; Istomin, S.Y.; Antipov, E.V. Oxygen diffusion in Sr0.75Y0.25CoO2.625: A molecular dynamics study. Phys. Rev. B 2009, 79, 172102. [Google Scholar] [CrossRef] [Green Version]
- Grimes, R.W.; Busker, G.; McCoy, M.A.; Chroneos, A.; Kilner, J.A.; Chen, S.-P. The Effect of Ion Size on Solution Mechanism and Defect Cluster Geometry. Ber. Der Bunsenges. Für Phys. Chem. 1997, 101, 1204–1210. [Google Scholar] [CrossRef]
- Jay, E.E.; Rushton, M.J.D.; Chroneos, A.; Grimes, R.W.; Kilner, J.A. Genetics of superionic conductivity in lithium lanthanum titanates. Phys. Chem. Chem. Phys. 2015, 17, 178–183. [Google Scholar] [CrossRef] [PubMed]
- Kuganathan, N.; Kordatos, A.; Chroneos, A. Li2SnO3 as a Cathode Material for Lithium-ion Batteries: Defects, Lithium Ion Diffusion and Dopants. Sci. Rep. 2018, 8, 12621. [Google Scholar] [CrossRef] [Green Version]
- Kuganathan, N.; Chroneos, A. Defects and dopant properties of Li3V2(PO4)3. Sci. Rep. 2019, 9, 333. [Google Scholar] [CrossRef]
- Kuganathan, N.; Chroneos, A. Defect Chemistry and Na-Ion Diffusion in Na3Fe2(PO4)3 Cathode Material. Materials 2019, 12, 1348. [Google Scholar] [CrossRef] [Green Version]
- Gale, J.D. GULP: A computer program for the symmetry-adapted simulation of solids. J. Chem. Soc. Faraday Trans. 1997, 93, 629–637. [Google Scholar] [CrossRef]
- Gale, J.D.; Rohl, A.L. The General Utility Lattice Program (GULP). Mol. Simul. 2003, 29, 291–341. [Google Scholar] [CrossRef]
- Mott, N.F.; Littleton, M.J. Conduction in polar crystals. I. Electrolytic conduction in solid salts. Trans. Faraday Soc. 1938, 34, 485–499. [Google Scholar] [CrossRef]
- Kuganathan, N.; Ganeshalingam, S.; Chroneos, A. Defects, Diffusion, and Dopants in Li2Ti6O13: Atomistic Simulation Study. Materials 2019, 12, 2851. [Google Scholar] [CrossRef] [Green Version]
- Catlow, C.R.A. “SolidState Chemistry: Techniques”; Cheetham, A.K., Day, P., Eds.; Clarendon Press: Oxford, UK, 1987; p. 231. [Google Scholar]
- Kresse, G.; Furthmüller, J. Efficient iterative schemes for ab initio total-energy calculations using a plane-wave basis set. Phys. Rev. B 1996, 54, 11169–11186. [Google Scholar] [CrossRef] [PubMed]
- Kresse, G.; Joubert, D. From ultrasoft pseudopotentials to the projector augmented-wave method. Phys. Rev. B 1999, 59, 1758–1775. [Google Scholar] [CrossRef]
- Blöchl, P.E. Projector augmented-wave method. Phys. Rev. B 1994, 50, 17953–17979. [Google Scholar] [CrossRef] [PubMed] [Green Version]
- Monkhorst, H.J.; Pack, J.D. Special points for Brillouin-zone integrations. Phys. Rev. B 1976, 13, 5188–5192. [Google Scholar] [CrossRef]
- Perdew, J.P.; Burke, K.; Ernzerhof, M. Generalized Gradient Approximation Made Simple. Phys. Rev. Lett. 1996, 77, 3865–3868. [Google Scholar] [CrossRef] [PubMed] [Green Version]
- Press, W.H.; Teukolsky, S.A.; Vetterling, W.T.; Flannery, B.P. Numerical Recipes in C The Art of Scientific Computing, 2nd ed.; Cambridge University Press: Cambridge, UK, 1992; p. 994. [Google Scholar]
- Grimme, S.; Antony, J.; Ehrlich, S.; Krieg, H. A consistent and accurate ab initio parametrization of density functional dispersion correction (DFT-D) for the 94 elements H-Pu. J. Chem. Phys. 2010, 132, 154104. [Google Scholar] [CrossRef] [Green Version]
- Kröger, F.A.; Vink, H.J. Relations between the Concentrations of Imperfections in Crystalline Solids. In Solid State Physics; Seitz, F., Turnbull, D., Eds.; Academic Press: New York, NY, USA, 1956; Volume 3, pp. 307–435. [Google Scholar]
- Ensling, D.; Stjerndahl, M.; Nytén, A.; Gustafsson, T.; Thomas, J.O. A comparative XPS surface study of Li2FeSiO4/C cycled with LiTFSI- and LiPF6-based electrolytes. J. Mater. Chem. 2009, 19, 82–88. [Google Scholar] [CrossRef]
- Liu, H.; Choe, M.-J.; Enrique, R.A.; Orvañanos, B.; Zhou, L.; Liu, T.; Thornton, K.; Grey, C.P. Effects of Antisite Defects on Li Diffusion in LiFePO4 Revealed by Li Isotope Exchange. J. Phys. Chem. C 2017, 121, 12025–12036. [Google Scholar] [CrossRef]
- Kempaiah Devaraju, M.; Duc Truong, Q.; Hyodo, H.; Sasaki, Y.; Honma, I. Synthesis, characterization and observation of antisite defects in LiNiPO4 nanomaterials. Sci. Rep. 2015, 5, 11041. [Google Scholar] [CrossRef] [Green Version]
- Politaev, V.V.; Petrenko, A.A.; Nalbandyan, V.B.; Medvedev, B.S.; Shvetsova, E.S. Crystal structure, phase relations and electrochemical properties of monoclinic Li2MnSiO4. J. Solid State Chem. 2007, 180, 1045–1050. [Google Scholar] [CrossRef]
- Islam, M.S.; Driscoll, D.J.; Fisher, C.A.J.; Slater, P.R. Atomic-Scale Investigation of Defects, Dopants, and Lithium Transport in the LiFePO4 Olivine-Type Battery Material. Chem. Mater. 2005, 17, 5085–5092. [Google Scholar] [CrossRef]
- Fisher, C.A.J.; Hart Prieto, V.M.; Islam, M.S. Lithium Battery Materials LiMPO4 (M = Mn, Fe, Co, and Ni): Insights into Defect Association, Transport Mechanisms, and Doping Behavior. Chem. Mater. 2008, 20, 5907–5915. [Google Scholar] [CrossRef]
- Perera, D.; Ganeshalingam, S.; Kuganathan, N.; Chroneos, A. A Computational Study of Defects, Li-Ion Migration and Dopants in Li2ZnSiO4 Polymorphs. Crystals 2019, 9, 563. [Google Scholar] [CrossRef] [Green Version]
- Kaushalya, R.; Iyngaran, P.; Kuganathan, N.; Chroneos, A. Defect, Diffusion and Dopant Properties of NaNiO2: Atomistic Simulation Study. Energies 2019, 12, 3094. [Google Scholar] [CrossRef] [Green Version]
- Kuganathan, N.; Gkanas, E.I.; Chroneos, A. Mg6MnO8 as a Magnesium-Ion Battery Material: Defects, Dopants and Mg-Ion Transport. Energies 2019, 12, 3213. [Google Scholar] [CrossRef] [Green Version]
- Kuganathan, N.; Kordatos, A.; Chroneos, A. Defect Chemistry and Li-ion Diffusion in Li2RuO3. Sci. Rep. 2019, 9, 550. [Google Scholar] [CrossRef] [Green Version]
- Streltsov, S.; Skorikov, N. Spin-state transitions in CaFeSi2O6 and NaFeSi2O6 under pressure. Phys. Rev. B 2011, 83, 214407. [Google Scholar] [CrossRef]
Figure 1.
Crystal structure of monoclinic-CaFeSi2O6.

Figure 2.
Calculated long-range calcium ion diffusion pathways. Yellow- and green-coloured atoms show two different Ca trajectories.
Figure 2.
Calculated long-range calcium ion diffusion pathways. Yellow- and green-coloured atoms show two different Ca trajectories.

Figure 3.
Energy profiles diagrams for local Ca hops (a) A and (b) B as shown in Figure 2.
Figure 3.
Energy profiles diagrams for local Ca hops (a) A and (b) B as shown in Figure 2.

Figure 4.
Solution enthalpies caclulated for MO (M = Ni, Mg, Co, Zn, Mn and Sr) at the (a) Ca and (b) Fe sites with respect to the M2+ ionic radius.
Figure 4.
Solution enthalpies caclulated for MO (M = Ni, Mg, Co, Zn, Mn and Sr) at the (a) Ca and (b) Fe sites with respect to the M2+ ionic radius.

Figure 5.
Solution enthalpies caclulated for M2O3 (M = Al, Ga, In, Sc, Y, Gd and La) at the Fe site with the formation of (a) Ca interstitials and (b) Ca vacancies with respect to the M3+ ionic radius.
Figure 5.
Solution enthalpies caclulated for M2O3 (M = Al, Ga, In, Sc, Y, Gd and La) at the Fe site with the formation of (a) Ca interstitials and (b) Ca vacancies with respect to the M3+ ionic radius.

Figure 6.
Energy profile diagrams for the Ca local hops (a) A and (b) B in the presence of Al on the Si site (refer to Figure 2).
Figure 6.
Energy profile diagrams for the Ca local hops (a) A and (b) B in the presence of Al on the Si site (refer to Figure 2).

Figure 7.
Solution enthalpies calculated for tetravalent dopants at the Si site with respect to dopant ionic radius.
Figure 7.
Solution enthalpies calculated for tetravalent dopants at the Si site with respect to dopant ionic radius.

Figure 8.
(a,b) Distorted CaO8 and SrO8 units showing bond lengths in defect free and defect (Sr-doped) configurations respectively, (c,d) corresponding total DOSs (e) atomic DOS of Sr and (f) constant charge density around the dopant.
Figure 8.
(a,b) Distorted CaO8 and SrO8 units showing bond lengths in defect free and defect (Sr-doped) configurations respectively, (c,d) corresponding total DOSs (e) atomic DOS of Sr and (f) constant charge density around the dopant.

Figure 9.
(a,b) Distorted FeO6 and MnO6 octahedral units showing bond lengths in defect free and defect (Mn-doped) configurations respectively, (c,d) corresponding total DOSs (e) atomic DOS of Mn and (f) constant charge density around the dopant.
Figure 9.
(a,b) Distorted FeO6 and MnO6 octahedral units showing bond lengths in defect free and defect (Mn-doped) configurations respectively, (c,d) corresponding total DOSs (e) atomic DOS of Mn and (f) constant charge density around the dopant.

Figure 10.
(a,b) Distorted SiO4 and AlO4 octahedral units showing bond lengths in defect free and defect (Al-doped) configurations respectively, (c,d) corresponding total DOSs (e) atomic DOS of Al and (f) constant charge density around the dopant.
Figure 10.
(a,b) Distorted SiO4 and AlO4 octahedral units showing bond lengths in defect free and defect (Al-doped) configurations respectively, (c,d) corresponding total DOSs (e) atomic DOS of Al and (f) constant charge density around the dopant.

Figure 11.
(a,b) Distorted FeO6 and GaO6 octahedral units showing bond lengths in defect free and defect (Ga-doped) configurations respectively, (c,d) corresponding total DOSs (e) atomic DOS of Ga and (f) constant charge density around the dopant.
Figure 11.
(a,b) Distorted FeO6 and GaO6 octahedral units showing bond lengths in defect free and defect (Ga-doped) configurations respectively, (c,d) corresponding total DOSs (e) atomic DOS of Ga and (f) constant charge density around the dopant.

Figure 12.
(a,b) Distorted SiO4 and GeO4 tetrahedral units showing bond lengths in defect free and defect (Ge-doped) configurations respectively, (c,d) corresponding total DOSs (e) atomic DOS of Ge and (f) constant charge density around the dopant.
Figure 12.
(a,b) Distorted SiO4 and GeO4 tetrahedral units showing bond lengths in defect free and defect (Ge-doped) configurations respectively, (c,d) corresponding total DOSs (e) atomic DOS of Ge and (f) constant charge density around the dopant.


Table 1.
Calculate and experimental structural parameters of monoclinic CaFeSi2O6.
| Parameter | Calculated | Experiment [13] | |∆|(%) | ||
|---|---|---|---|---|---|
| Force Field | DFT | Force Field | DFT | ||
| a (Å) | 9.8716 | 9.9900 | 9.8107 | 0.62 | 1.83 |
| b (Å) | 8.9569 | 8.9373 | 8.9856 | 0.32 | 0.54 |
| c (Å) | 5.2459 | 5.2256 | 5.2245 | 0.41 | 0.02 |
| α = γ (°) | 90.00 | 90.00 | 90.00 | 0.00 | 0.00 |
| β (°) | 105.16 | 104.01 | 104.59 | 0.54 | 0.56 |
| V (Å3) | 447.7095 | 452.6849 | 445.7081 | 0.45 | 1.56 |
Table 2.
Defect formation energies of intrinsic defect process calculated in monoclinic CaFeSi2O6.
| Defect Process | Equation Number | Defect Energy (eV) | Defect Energy (eV)/Defect |
|---|---|---|---|
| Ca Frenkel | 1 | 9.92 | 4.96 |
| Fe Frenkel | 2 | 9.74 | 4.87 |
| Si Frenkel | 3 | 18.36 | 9.18 |
| O Frenkel | 4 | 5.74 | 2.87 |
| Schottky | 5 | 38.40 | 3.84 |
| CaO Schottky | 6 | 5.94 | 2.97 |
| FeO Schottky | 7 | 6.72 | 3.36 |
| SiO2 Schottky | 8 | 14.28 | 4.76 |
| Ca-Fe anti-site (isolated) | 9 | 0.90 | 0.45 |
| Ca-Fe anti-site (cluster) | 10 | 0.86 | 0.42 |
| Ca-Si anti-site (isolated) | 11 | 9.06 | 4.53 |
| Ca-Si anti-site (cluster) | 12 | 5.26 | 2.63 |
| Fe-Si anti-site (isolated) | 13 | 5.98 | 2.98 |
| Fe-Si anti-site (cluster) | 14 | 2.84 | 1.42 |
Table 3.
Ca local hop distances and their activation energies as shown in Figure 3.
Table 3.
Ca local hop distances and their activation energies as shown in Figure 3.
| Migration Path | Ca-Ca Separation (Å) | Activation Energy (eV) |
|---|---|---|
| A | 4.47 | 4.36 |
| B | 5.02 | 4.49 |
© 2020 by the authors. Licensee MDPI, Basel, Switzerland. This article is an open access article distributed under the terms and conditions of the Creative Commons Attribution (CC BY) license (http://creativecommons.org/licenses/by/4.0/).
Share and Cite
MDPI and ACS Style
Kuganathan, N.; Chroneos, A. Defects and Dopants in CaFeSi2O6: Classical and DFT Simulations. Energies 2020, 13, 1285. https://0-doi-org.brum.beds.ac.uk/10.3390/en13051285
AMA Style
Kuganathan N, Chroneos A. Defects and Dopants in CaFeSi2O6: Classical and DFT Simulations. Energies. 2020; 13(5):1285. https://0-doi-org.brum.beds.ac.uk/10.3390/en13051285
Chicago/Turabian StyleKuganathan, Navaratnarajah, and Alexander Chroneos. 2020. "Defects and Dopants in CaFeSi2O6: Classical and DFT Simulations" Energies 13, no. 5: 1285. https://0-doi-org.brum.beds.ac.uk/10.3390/en13051285
Note that from the first issue of 2016, this journal uses article numbers instead of page numbers. See further details here.