The Valuation of the Operational Flexibility of the Energy Investment Project Based on a Gas-Fired Power Plant


1
Mineral and Energy Economy Research Institute, Polish Academy of Sciences, Wybickiego 7a, 31-261 Krakow, Poland
2
Faculty of Mining and Geoengineering, AGH University of Science and Technology, Mickiewicza 30, 30-059 Krakow, Poland
*
Author to whom correspondence should be addressed.
Energies 2020, 13(7), 1567; https://0-doi-org.brum.beds.ac.uk/10.3390/en13071567
Submission received: 29 February 2020
/
Revised: 21 March 2020
/
Accepted: 24 March 2020
/
Published: 28 March 2020
(This article belongs to the Special Issue Selected Papers from 3rd International Conference on the Sustainable Energy and Environmental Development (SEED 2019))
Abstract
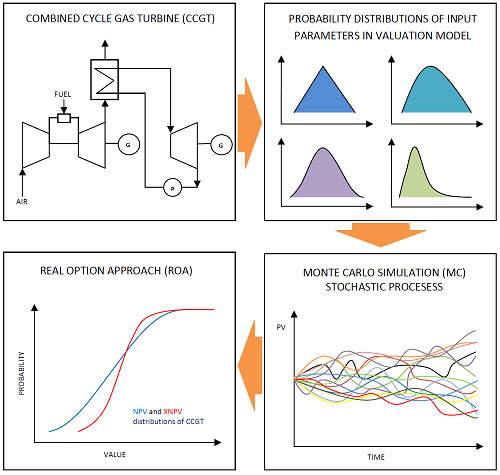
:This paper presents an attempt to the valuation of the operational flexibility of the energy investment project based on the example of combined cycle gas turbine (CCGT). For this purpose, the real options approach (ROA), net present value (NPV) method, and the Monte Carlo (MC) simulation have been used. Motivations to take up such a topic result from the fact that traditional valuation methods neglect flexibility embedded in CCGT assets. Operational flexibility was defined as the switching option to dynamically shut down and restart gas units. Valuation of the operational flexibility, the project’s extended net present value (XNPV), was based on a discounted cash flow model. The Monte Carlo simulation, allowing for better replication of the stochastic nature of market factors and some technical parameters, was introduced to the valuation model. The obtained results indicate that the value of the options significantly influences the NPV of the analyzed technology and its risk profile. The NPV was calculated at −169.1 million USD, while the XNPV amounted to 102.5 million USD. This difference, compared to the NPV distribution range at a significance level of 0.05, was more than 8.1% (almost 10.4% for α = 0.1). The results achieved help to explain the significance of the operational flexibility in the modeling profitability of CCGT technologies.

1. Introduction
The global energy sector is currently facing unprecedented changes associated with the rapid growth in energy demand, the development of new technologies, and the liberalization of energy markets, limiting monopoly and increasing competition. More than 80% of the energy in the world is generated in the process of burning fossil fuels: coal, oil, and natural gas. According to the expertise of the International Energy Agency (IEA) in the 21st century, fossil fuels will continue to be the main source of energy in most sectors of the economy around the world, particularly in the electricity sector [1]. However, their acquisition and processing technologies will be improved.
Energy companies are characterized by considerable flexibility and the possibility to control the structure and level of variable costs [2]. For example, power plants can be switched to other operating points, gaining more power with lower efficiency (and thus increasing the marginal costs). In addition, if the overall level of variable costs is satisfactory, it is possible to postpone some of the downtimes or maintenance works. This increases the level of production. The reverse scenario is also possible. In addition, some maintenance works in power plants can be performed without a complete shutdown of individual units. Any action on the possible control of the manufacturing process facilitates the achievement of planned production and may affect its marginal costs. Taking into account the uncertainty of future revenues and costs, as well as the exposure to risks related to the production goals, this fact is very important. When selecting more or less risky technologies, even minor risk reduction, cost savings or revenue increase may have a significant impact on the results in the long run and ultimately result in optimal manufacturing systems. Therefore, energy projects characterized by changing operating conditions can generate higher benefits for their owners when managed in a proactive manner [3].
Motivations for undertaken research correspond with the inherent features of the traditional discount cash flow methods used to evaluate the energy projects (energy technologies). In this paper, we examined two basic theses:
- Methods such as net present value (NPV), internal rate of return (IRR), and levelized cost of electricity (LCOE) are insufficient for the economic evaluation of energy investment projects, such as combined cycle gas turbine (CCGT).
- Operational flexibility, resulting from the dynamic shutting down and restarting gas-fired blocks (CCGT) in the process of electricity production, changes the risk profile of the project and increases the economic efficiency (profitability) of the entire production process.
The first thesis is strengthened by the following facts: (1) discounting methods do not take into account the value of operational flexibility, which is quantified in the methods based on real option valuation [4]. However, the decision maker is forced to react flexibly to the changing situation, both in the surrounding environment and in the project itself. The objective is usually to maximize the potential benefits and minimize losses [5]. This applies in particular to the energy sector, where the process of deregulation has started and has increased the level of competition and diversification. Experience has shown that the process of decision-making about energy production is usually not only extremely complex, but also dynamic (changing forecasts of costs, sales, and profitability). (2) Negative NPV today does not necessarily mean that the project will still remain risky in the future (the improvement of investment conditions can take place). (3) The use of a single discount rate does not correspond to the actual risk profile; the level or uncertainty and risk usually decrease with the advancement of the project and the emergence of further information. Therefore, the exposure to the real risk of the project is usually reduced as a result of the management decisions, minimizing the negative aspects of uncertainty and risk.
The second thesis embraces the idea that operational flexibility, resulting from the dynamic shutting down and restarting of gas-fired blocks in the process of electricity production, increases the economic efficiency (profitability) of the entire production process. CCGT technologies are inherently flexible, designed to work in dynamic manner, and that fact should be reflected in the valuation process [4]. This means that the overall results of the investment project are affected by subsequent decisions. Diversified energy production and decision-making processes can be understood as an availability of options. Gas-fired technologies (CCGT) have all of these features. They are designed as base load units or, thanks to operational flexibility, as peaking power plants (the plant can flexibly operate during periods of strong growth in demand, when electricity prices are high, and can be shut down during the market price downturns [6]).
The aim of this paper is to measure the value of operational flexibility of CCGT, its impact on the NPV, and its risk profile.
In the valuation model of the gas-fired power plant, operational flexibility was reproduced by a combination of two options (put and call); the so called switching option [7]. The CCGT total capacity was assumed at 500 MW and was an example of a hypothetical power plant (numerical example) created for the analytical and scientific purposes. The stochastic nature of electricity prices, some technological aspects, and interdependences were replicated with use of the Monte Carlo (MC) simulation.
This paper is structured as follows: Section 2 presents a brief review of the literature on the use of real options for the valuation of energy investment projects. This chapter discusses the issue of operational flexibility and its valuation with use of the Monte Carlo method. Section 3 discusses the valuation model based on the real options approach. Section 4 presents the assumptions used in the valuation model and the achieved results. Section 5 brings the conclusions resulting from the conducted analyses.
2. Literature Review
2.1. The Use of the Real Options Approach for the Valuation of Energy Projects
A critical review of the literature on the subject indicates that the real options approach (ROA) is very important as a method of assessing the economic efficiency (profitability) of energy projects [8]. The real options approach has been used for a long time, but its popularity has increased significantly in recent years. The survey by Graham and Harvey [9], who studied nearly 392 cases in 2001, strengthens this opinion. Almost 27% of the respondents applied the real options method as an investment decision support [9]. This states that an equivalent of decision-making (operational) flexibility, expressed in money and resulting from the possibility of dynamic decision-making, maximizing the value of projects, is becoming a key component of the value. This is due to the fact that investors associated with the energy industry are beginning to understand the limitations of traditional valuation methods and recognize the potential of the ROA. Taking into consideration the decision to invest in a new power plant, which is essentially irreversible, uncertain future cash flows, and existing decision-making flexibility, the real options approach, which takes into account all of these demands, seems to perfectly fit for its practical use [10,11].
Uncertainty, especially concerning changes in the prices of carbon credits, electricity, and fuel—the key variables determining the value of energy technologies—can be properly taken into account in analysis through the use of the ROA, which has been shown in many studies. The real options approach has been used, among others, to make investment decisions in the electricity sector when determining the optimum date for the construction of new generating units. Näsäkkälä and Fleten [12] have taken into account the option to postpone the investment decisions in their research on the economic evaluation of gas energy sources. The economic evaluation of the three investment projects based on coal-fired electricity generation technologies, traditional technology, pulverized coal combustion technology, and integrated gasification combined cycle (IGCC), was carried out by Sekar [13]. The evaluation used the option account, taking into account the changing price of carbon credits. Sekar [13] developed models of cash flows for each of the three technologies, considering the price of CO2 as an uncertain variable. Laurikka [14] elaborated a simulation model using the real options in the process of estimation of the value of combined cycle coal gasification, taking into account the computing for the CO2 emissions trading scheme. The research used the three stochastic variables: electricity price, fuel price, and the price of CO2 allowances. Frayer and Uludere [15] estimated the economic efficiency of an energy source using the ROA, taking into account the fluctuations in electricity prices. Their analysis has shown that the gas sources may be more promising than coal power plants, which was in opposition to the results obtained with traditional discount methods. This work is perhaps the closest to ours. However, in our work, the valuation of energy investments was done for one type of energy technology, namely gas-steam units. In addition, the analysis was conducted for the Polish energy market, assuming the volatility of the electricity price and the flexible operation of the generating unit. The Monte Carlo method was used to calculate the value of the real option.
Other contemporary applications of the options analysis in the energy sector include Siddiqui et al. [16], who conducted a study on the development of renewable energy sources in the United States, Marreco and Carpio [17], who studied the flexibility of the Brazilian power system, and Kuper and Soest [18], who studied the effects of oil prices on energy consumption. Examples of application of the ROA to estimate the impact of climate policy on energy investments are shown by Blyth and Yang [19] and Laurikka and Koljonen [20]. Other studies, such as Tseng and Barz [21], Deng and Oren [22], and Reuter et al. [23], have focused on operational variability and/or constraints on investment decisions within a short-term horizon. In contrast, He and Pindyck [24] focus on the flexibility to produce either one of two different products. Kulatilaka [25] analyses the choice between a flexible technology (fired by oil or gas) and two inflexible technologies to generate electricity. Dixit and Pindyck [26] demonstrated the usefulness of the option valuation to support decision-making in electricity generation structure. Keppo and Lu [27] continued the research by Dixit and Pindyck [26] on the use of real options in the energy sector. Luo [28] evaluated optimal entry and exit decisions using a real options approach with two stochastic variables. Li et al. [29] presents a policy benefit model of a photovoltaic power generation project based on real options approach. Moon and Baran [30] applied ROA for determining the optimal time to invest in a (small or large) residential photovoltaic system and the value of deferral option for Germany, Japan, Korea, and the USA. Gazheli and van den Bergh [31] investigated simultaneous investments in two different renewable energy technologies, namely wind and solar (photovoltaics). In their real options model, they incorporate uncertainty about future electricity prices and uncertainty about the speed at which learning drives down the costs of wind and solar electricity. Zambujal-Oliveira [32] analyzed the deferral option with a 3-year license for starting plant construction for an investment in a natural gas combined cycle power plant (NGCC). In conclusion, they suggested to delay the investment. Rohlfs and Madlener [33] compared investments in different power generation technologies, taking into account multiple underlying, technology-specific input and output prices, such as those of fuel, CO2, and electricity. Abadie [34] conducted a study on the valuation of an operating coal-fired power plant and a natural gas power plant operating as a base load, independently of margins, with a switching option exercised only when the electricity price was higher than the variable costs (fuel, emissions and O&M (operation and maintenance)). Abadie and Chamorro [3] analyzed an investment in power plants, assuming fuel flexibility, different costs, and limited time of exercising the option to build.
Applying ROA, Gatfaoui [35] considered a firm that had to choose between different energy sources to run its business. The choice is between crude oil and natural gas, and the goal is to minimize energy or production costs of the firm. Aronne et al. [36] presented the valuation of a flexible power plant, which can operate either with natural gas or an oil building research scenario with the use of the option to switch among these fuels. A very similar scientific problem was undertaken by Grzesiak [37]; the combination of a put and call option was used to replicate the electricity price pattern and the ability to dynamically moderate the production scale of gas-fired blocks.
Another interesting application of the real options approach can be found in Oliveira et al. [38], where the authors analyzed the feasibility of installing a cogeneration unit in an industrial plant in Brazil.
The project should make the firm more flexible and allow it to make a choice between an increase in production or the generation of surplus energy, which can be sold in the short-term electricity market. This study also applies ROA in the context of flexibility improvements.
Glensk and Madlener [39,40] developed a decision tool based on real options approach that supports investment decisions concerning flexibility (upgrades) of conventional lignite-fired power plants. In their next paper [41,42], they presented a three-step procedure based on ROA testing the possibilities of enhancing the flexibility of conventional gas-fired power plants, with respect to growing profitability and timing.
2.2. Operational Flexibility and Monte Carlo Simulation in Energy Project Valuation
The problem of flexibility in the decision-making process is defined differently in the professional literature; however, it is dominated by the opinion that operational flexibility is the “possibility” to take an alternative investment decision in case of unpreferable turns in project surroundings. Axelrod [43] gives the following definition of flexibility in decision-making: The ability and capacity of the management to actively respond to the changing situation. The flexibility of decision-making can be understood as an opportunity to take a sequence of decisions and actions, while the implementation of them can generate further, alternative, previously unavailable scenarios of project evaluation. According to Upton [44], the issue of determining the flexibility of decision-making is the ability to change or react, combined with limited consequences on time, effort, costs, or efficiency.
The decision-making flexibility, in real options terms, is the ability to choose the most favorable scenario of actions. In the case of projects modelled with a combination of options, the total value of flexibility is the choice of options maximizing the value of the project for the assumed level of the input data (e.g., prices). This points to the exercise of all in-the-money options. In this paper, the operational flexibility of the analyzed CCGT power plant is recognized as the switching option.
The sources of the potential flexibility of the analyzed power plant are market factors, such as electricity and natural gas prices, carbon credits price and technological aspects, the ability to dynamically shutting down and restart the production, and others, described later on. The problem of “multiple risk sources” was solved through the implementation of the Monte Carlo simulation. The attempt to model the impact of multiple risk factors was undertaken by, inter alia, Wiśniewski [45] and Charnes [46].
Stochastic simulation based on Monte Carlo techniques is, nowadays, one of the most complex and powerful methods used to solve problems, including many different sources of uncertainty and risk that are very often mutually dependent. The MC simulation has no limitations regarding the shape of the underlying density distributions [47,48] and is very often used, especially for high-dimensional option models, i.e., when the model incorporates multiple sources of uncertainties [49].
The MC simulation techniques with the application of ROA have been employed by a number of studies in the electricity industry to model key uncertainties, such as fuel prices, carbon credits price, electricity price, and capital cost. Zhou et al. [50] modeled the stochastic nature of carbon credits price under three representative types of carbon capture and storage technology to determine the best strategy for investing in China. Rothwell [51] evaluated the risk of developing new nuclear power plants by means of real options and simulated three uncertain factors: price risk, production risk, and cost risk. The risk premium was derived by the Monte Carlo simulation. Zhang et al. [52] applied ROA for investments in solar PV, trying to find the optimal feed-in tariff level for this technology in different regions of China (they used a backward dynamic programming algorithm in combination with the least-squares Monte Carlo simulation). Alharbi and Csala [53] used the Monte Carlo simulation and stochastic processes (Brownian motions) to predict the future behavior of solar and wind energy, along with long-term temperature performance based on 69 years of historical daily data. Kroniger and Madlener [54] investigated the economic viability of hydrogen storage for excess electricity production in wind power plants. For the analysis, they applied the Monte Carlo simulation and real options approach (ROA) to compute hourly profits under uncertainty, regarding wind speed, spot market electricity prices, and call of minute reserve capacity. Sanpasertparnich and Aroonwilas [55] identified and determined optimal design and operating conditions that would offer the maximum power plant efficiency of both subcritical and supercritical pulverized coal-fired power plants. The developed model was used for a sensitivity analysis using rank correlation coefficient and Monte Carlo simulation approaches in order to arrive at the optimal operating and design conditions. Gorre at al. [56] optimized a power-to-gas plant configuration, with respect to the cost benefits, using a Monte Carlo-based simulation tool. Salman at al. [57] proved that economic analysis, coupled with uncertainty analysis, through Monte Carlo simulations, shows that by integrating heat and a power-generating plant with a gasifier to produce biofuels is significantly profitable as compared with only heat and electricity production.
Based on the literature review, it can be stated that ROA, supported by the Monte Carlo simulation, would be the best alternative to model the mutual impact of many coexisting input and output parameters of the CCGT power plant. This is due to limitations of deterministic methods. and, on the other hand, ROA underlying stochastic processes, which represent every single source of uncertainty and risk mathematically, with regard to their mutual impact, which is very complicated and, in some cases, impossible (i.e., the lack of appropriate data). The combination of the traditional discounting methods with the MC simulation and with ROA fundamentals brings new insights and novelty to the modeling of CCGT power plants, with respect to their dynamics. In this field, investment decisions can be discussed in probabilistic terms, linking NPV general acceptance with advantages of ROA.
3. Research Methodology and Characteristics of the Valuation Model
The valuation of the CCGT power station required the construction of a sophisticated mathematical model and the adoption of specific formulas. The verification of the research theses was based on [58]:
- The construction of two parallel valuation models;
- Mathematization of the options that reflect the aim of the researches and meet the technical and organizational aspects supporting their existence;
- The construction of a suitable simulation model, based on the Monte Carlo method, taking into account the random processes of market factors (prices) and operating costs;
- Calculation of the distribution of the net present value (NPV);
- Valuation of the project’s extended net present value (XNPV) and the value of the option premium (OP);
- Interpretation of the results.
During the simulation, specified input distributions were sampled and stochastic processes were calculated, in particular for the:
- Price of electricity;
- Price of primary fuel (natural gas);
- Price of carbon credits;
- Net efficiency of the power plant;
- Annual unit costs of operation and maintenance;
- Time to build a power plant.
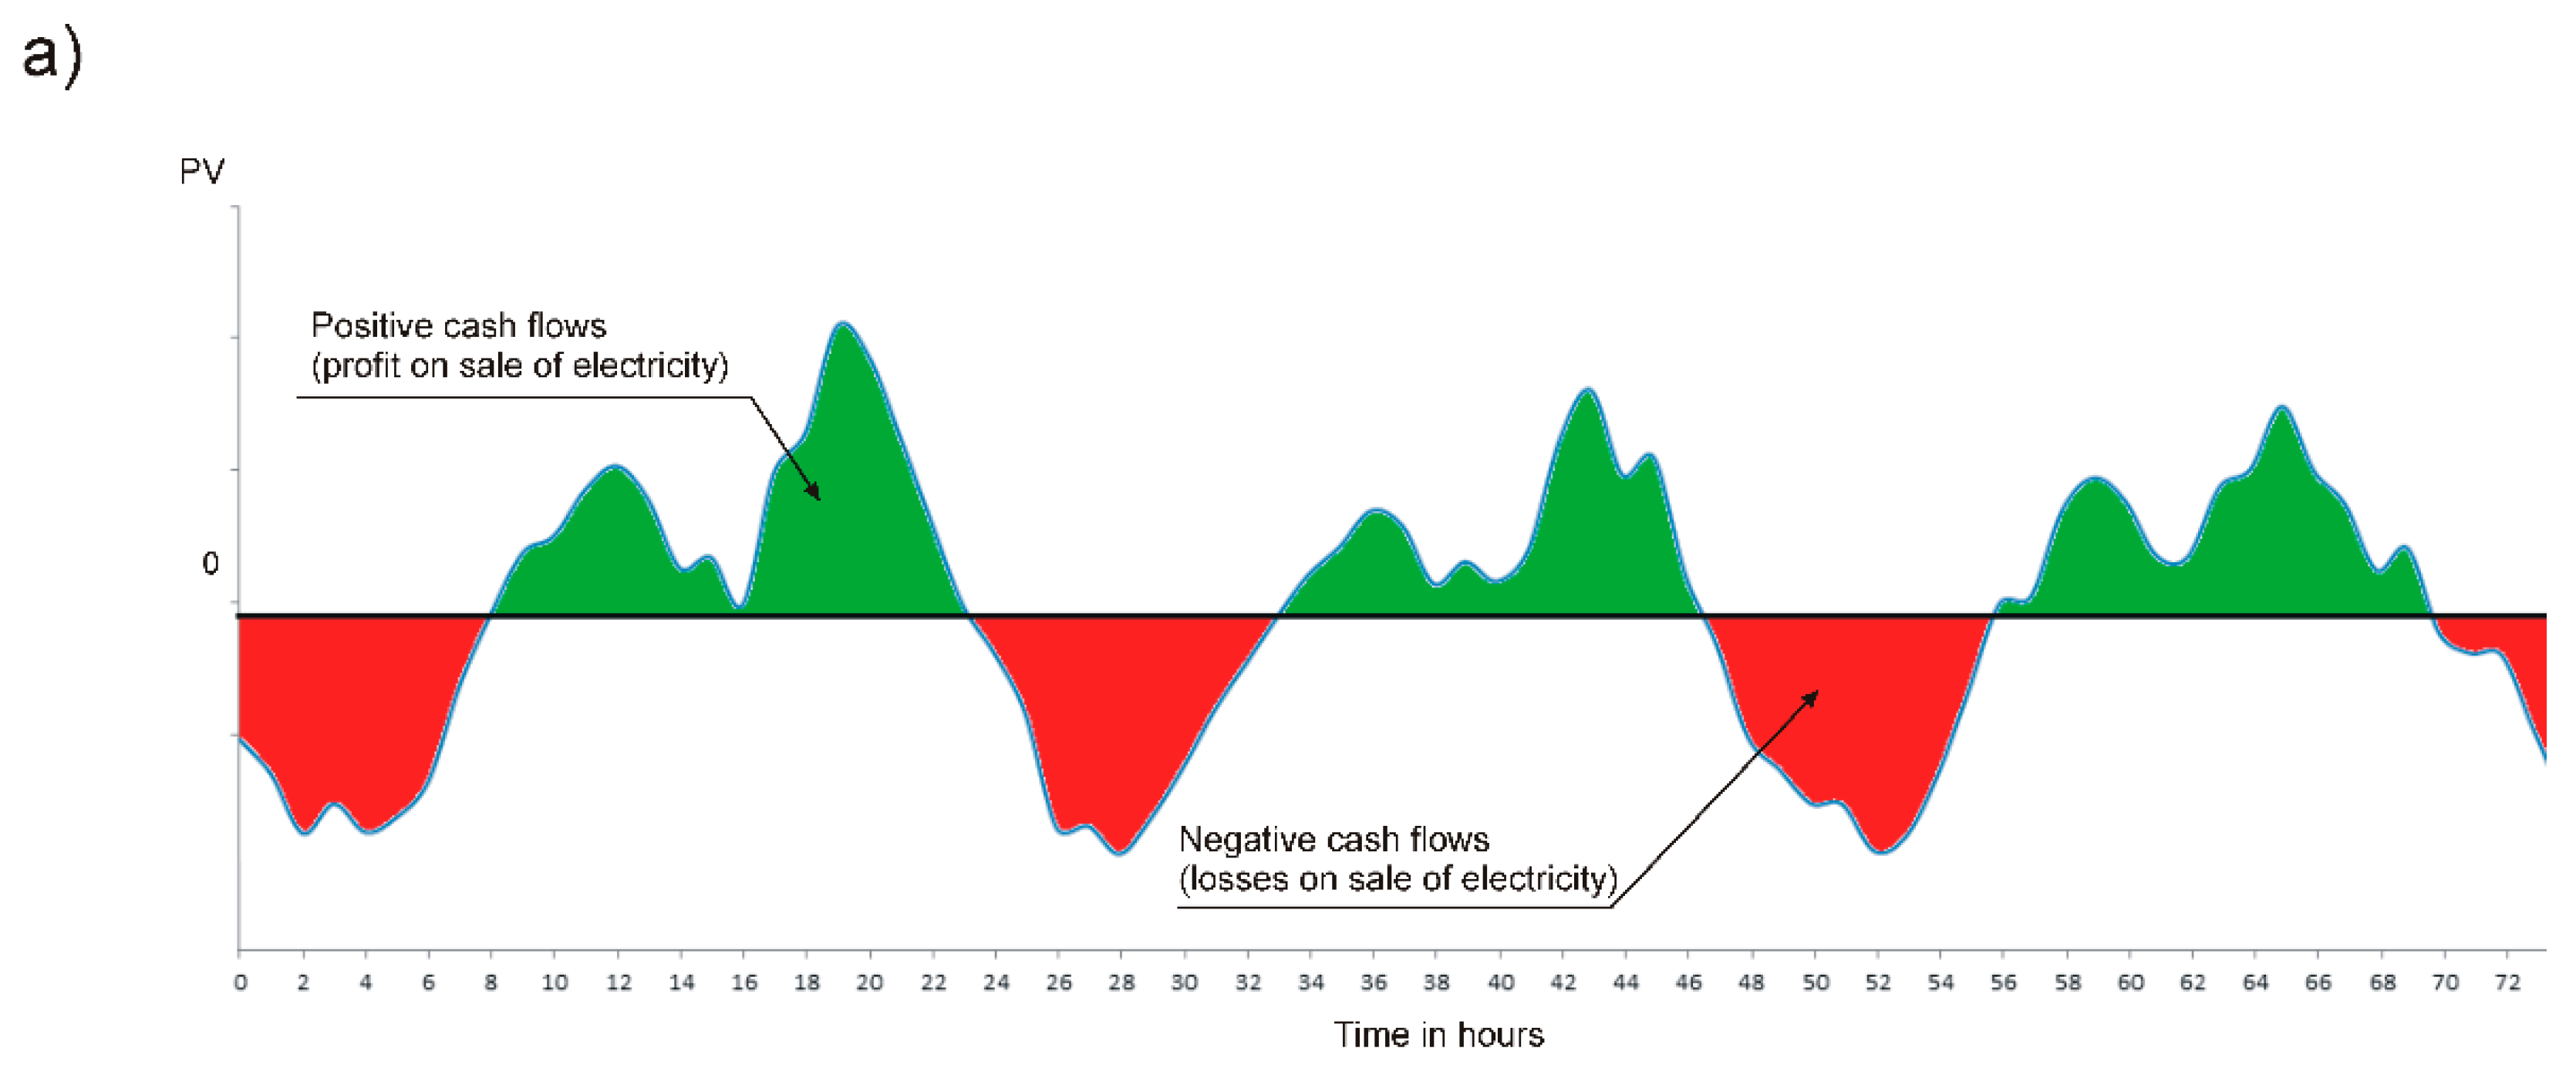
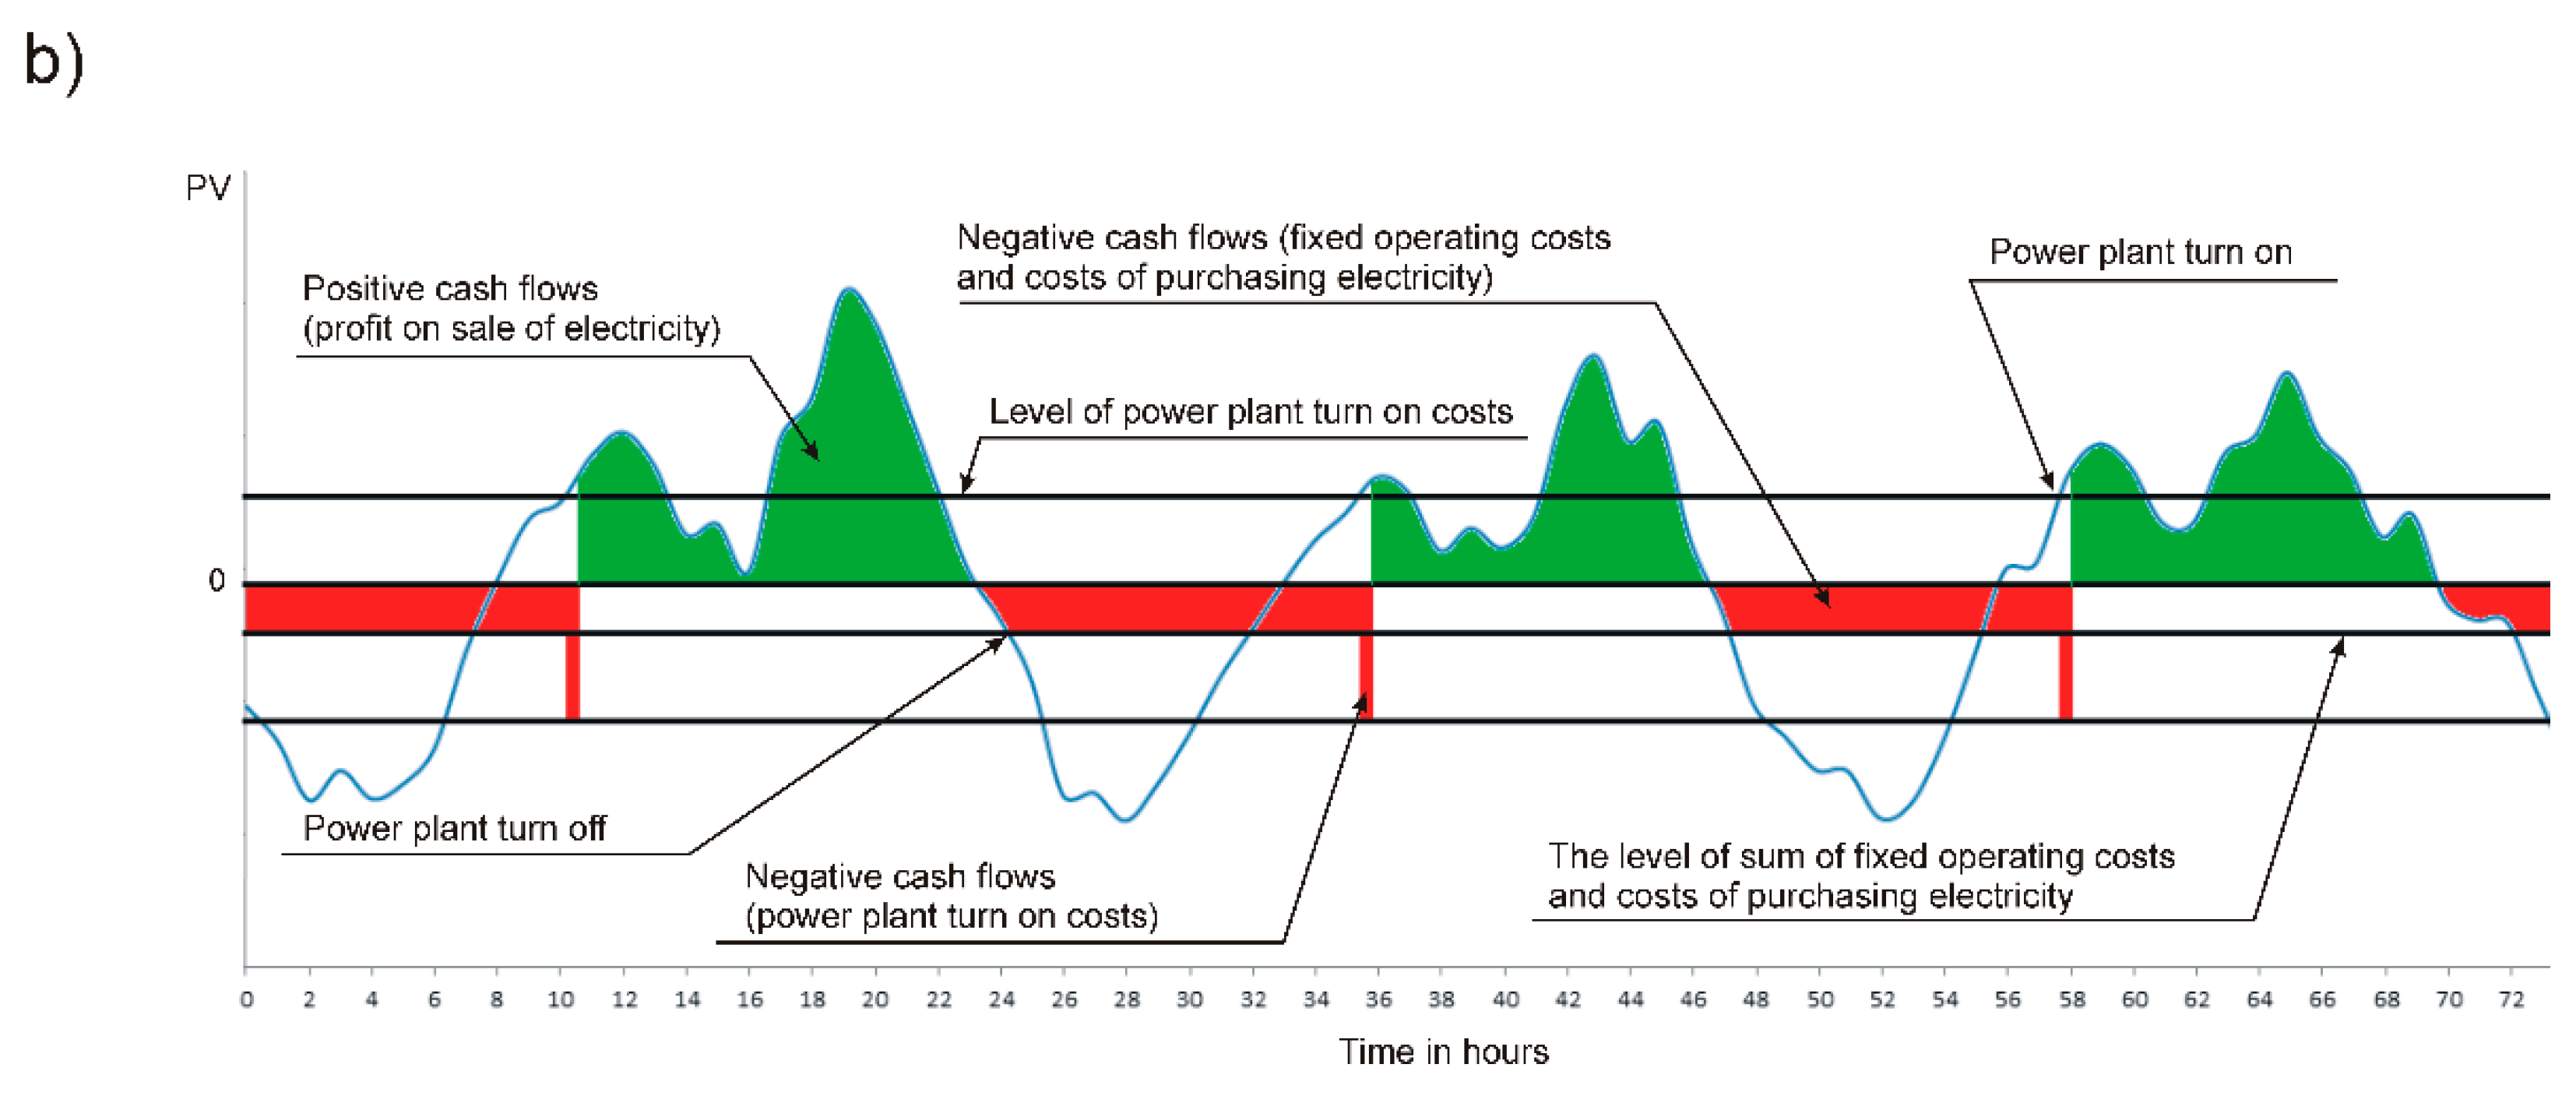
As mentioned before, the study used two models. The base model did not contain formulas with options to switch (Figure 1a). This pattern presents the cash flows of electricity production in a continuous process. The second, parallel, model in turn allowed us to simulate the impact of the dynamic shutting down and restarting of the energy units (Figure 1b). Restarting the gas-fired units was accompanied by high electricity prices, while shutting down was accompanied by production costs higher than the possible revenues. It should also be noted that the power plant was shut down when the fixed costs in the “no operation” state were lower than the total losses in the operation phase. This condition was one of the reasons for option exercising.
Based on the technical aspects of the analyzed installation, it was assumed that the shortest period of continuous operation was 1 h (t = 1 h). The authors assumed that the decision to shut down or restart the production was limited only by economic reasons (other decision factors, e.g., grid and distribution aspects, have been eliminated). This was acceptable, assuming that electricity prices were highly correlated with the demand for electricity. The relationship of thermal efficiency and load levels was also neglected.
The measurements of cash flows from operations in both models were performed in hourly intervals and compared with each other (PV(b)t: base model; PV(op.)t: model with the options). The model with options took into account the additional costs of shutting down and restarting of the power plant. The adoption of the function maximizing the value of PV, as a criterion for options exercising, was consistent with the classical approach to the valuation of switching option. In the simulation procedure, the electricity prices were randomized at a defined time interval within a week (168 h).
The value of revenues at the time (t) was calculated as the product of the amount of energy produced and the unit price, wherein the amount of energy produced depended on the working time, the unit availability, and the power installed. The revenues resulted only from the sale of electricity (potential income from heat energy, mechanical energy, cooling, system services, and property rights were neglected). The interdependences between electricity, gas, and carbon credit prices were included in the simulation model, with the use of the correlation coefficients.
In the analyzed example, operating costs were simulated for a number of years and then scaled to the periods in which the PV was determined. Operating costs were directly connected with the production of electricity and included labor costs (wages with derivatives), external services, repairs, materials, energy costs for own needs, amortization and depreciation of fixed assets, carbon credits, administrative costs, taxes, and fees [59]. The total costs of fuel were derived from its price, energy conversion efficiency, and the power of the unit. The cost of carbon credits resulted from the price and the amount of CO2 emitted, which was also determined by the emissivity of the fuel used, power installed, and energy conversion efficiency. Operating and maintenance costs (fixed and variable O&M) were calculated as a product of the assumed unit value, the power of the plant, and the amount of electricity produced, respectively. The O&M costs included the costs of shutting down and restarting the installations.
Capital expenditures were determined as a function of the installed capacity and the unit investment costs. The value of amortization and depreciation was calculated as a product of depreciation rates and the expenditures incurred by the company for the acquisition of fixed tangible and intangible assets and legal assets.
The operating profit was calculated as the difference between total revenues and operating costs (including amortization and depreciation). Because the model did not include other operating costs or the cost of borrowing external capital, the calculated operating profit corresponded to the level of gross profit. The positive gross profit after taxes was the basis for the calculation of the net profit.
In order to determine the cash flows in each period (t), the net profit was corrected for:
- Previously adjusted amortization and depreciation of fixed assets;
- Capital expenditures incurred during the construction of the installation;
- Changes in the net working capital.
Following the above-mentioned procedure, the free cash flows at the end of each period were finally estimated and discounted, according to Formula (1), leading to the estimation of the NPV, described as follows:
where:
- CFt is the cash flow in the year t [USD];
- I0 is the initial investments [USD];
- D is the discount rate [%];
- n is the lifetime of the technology.
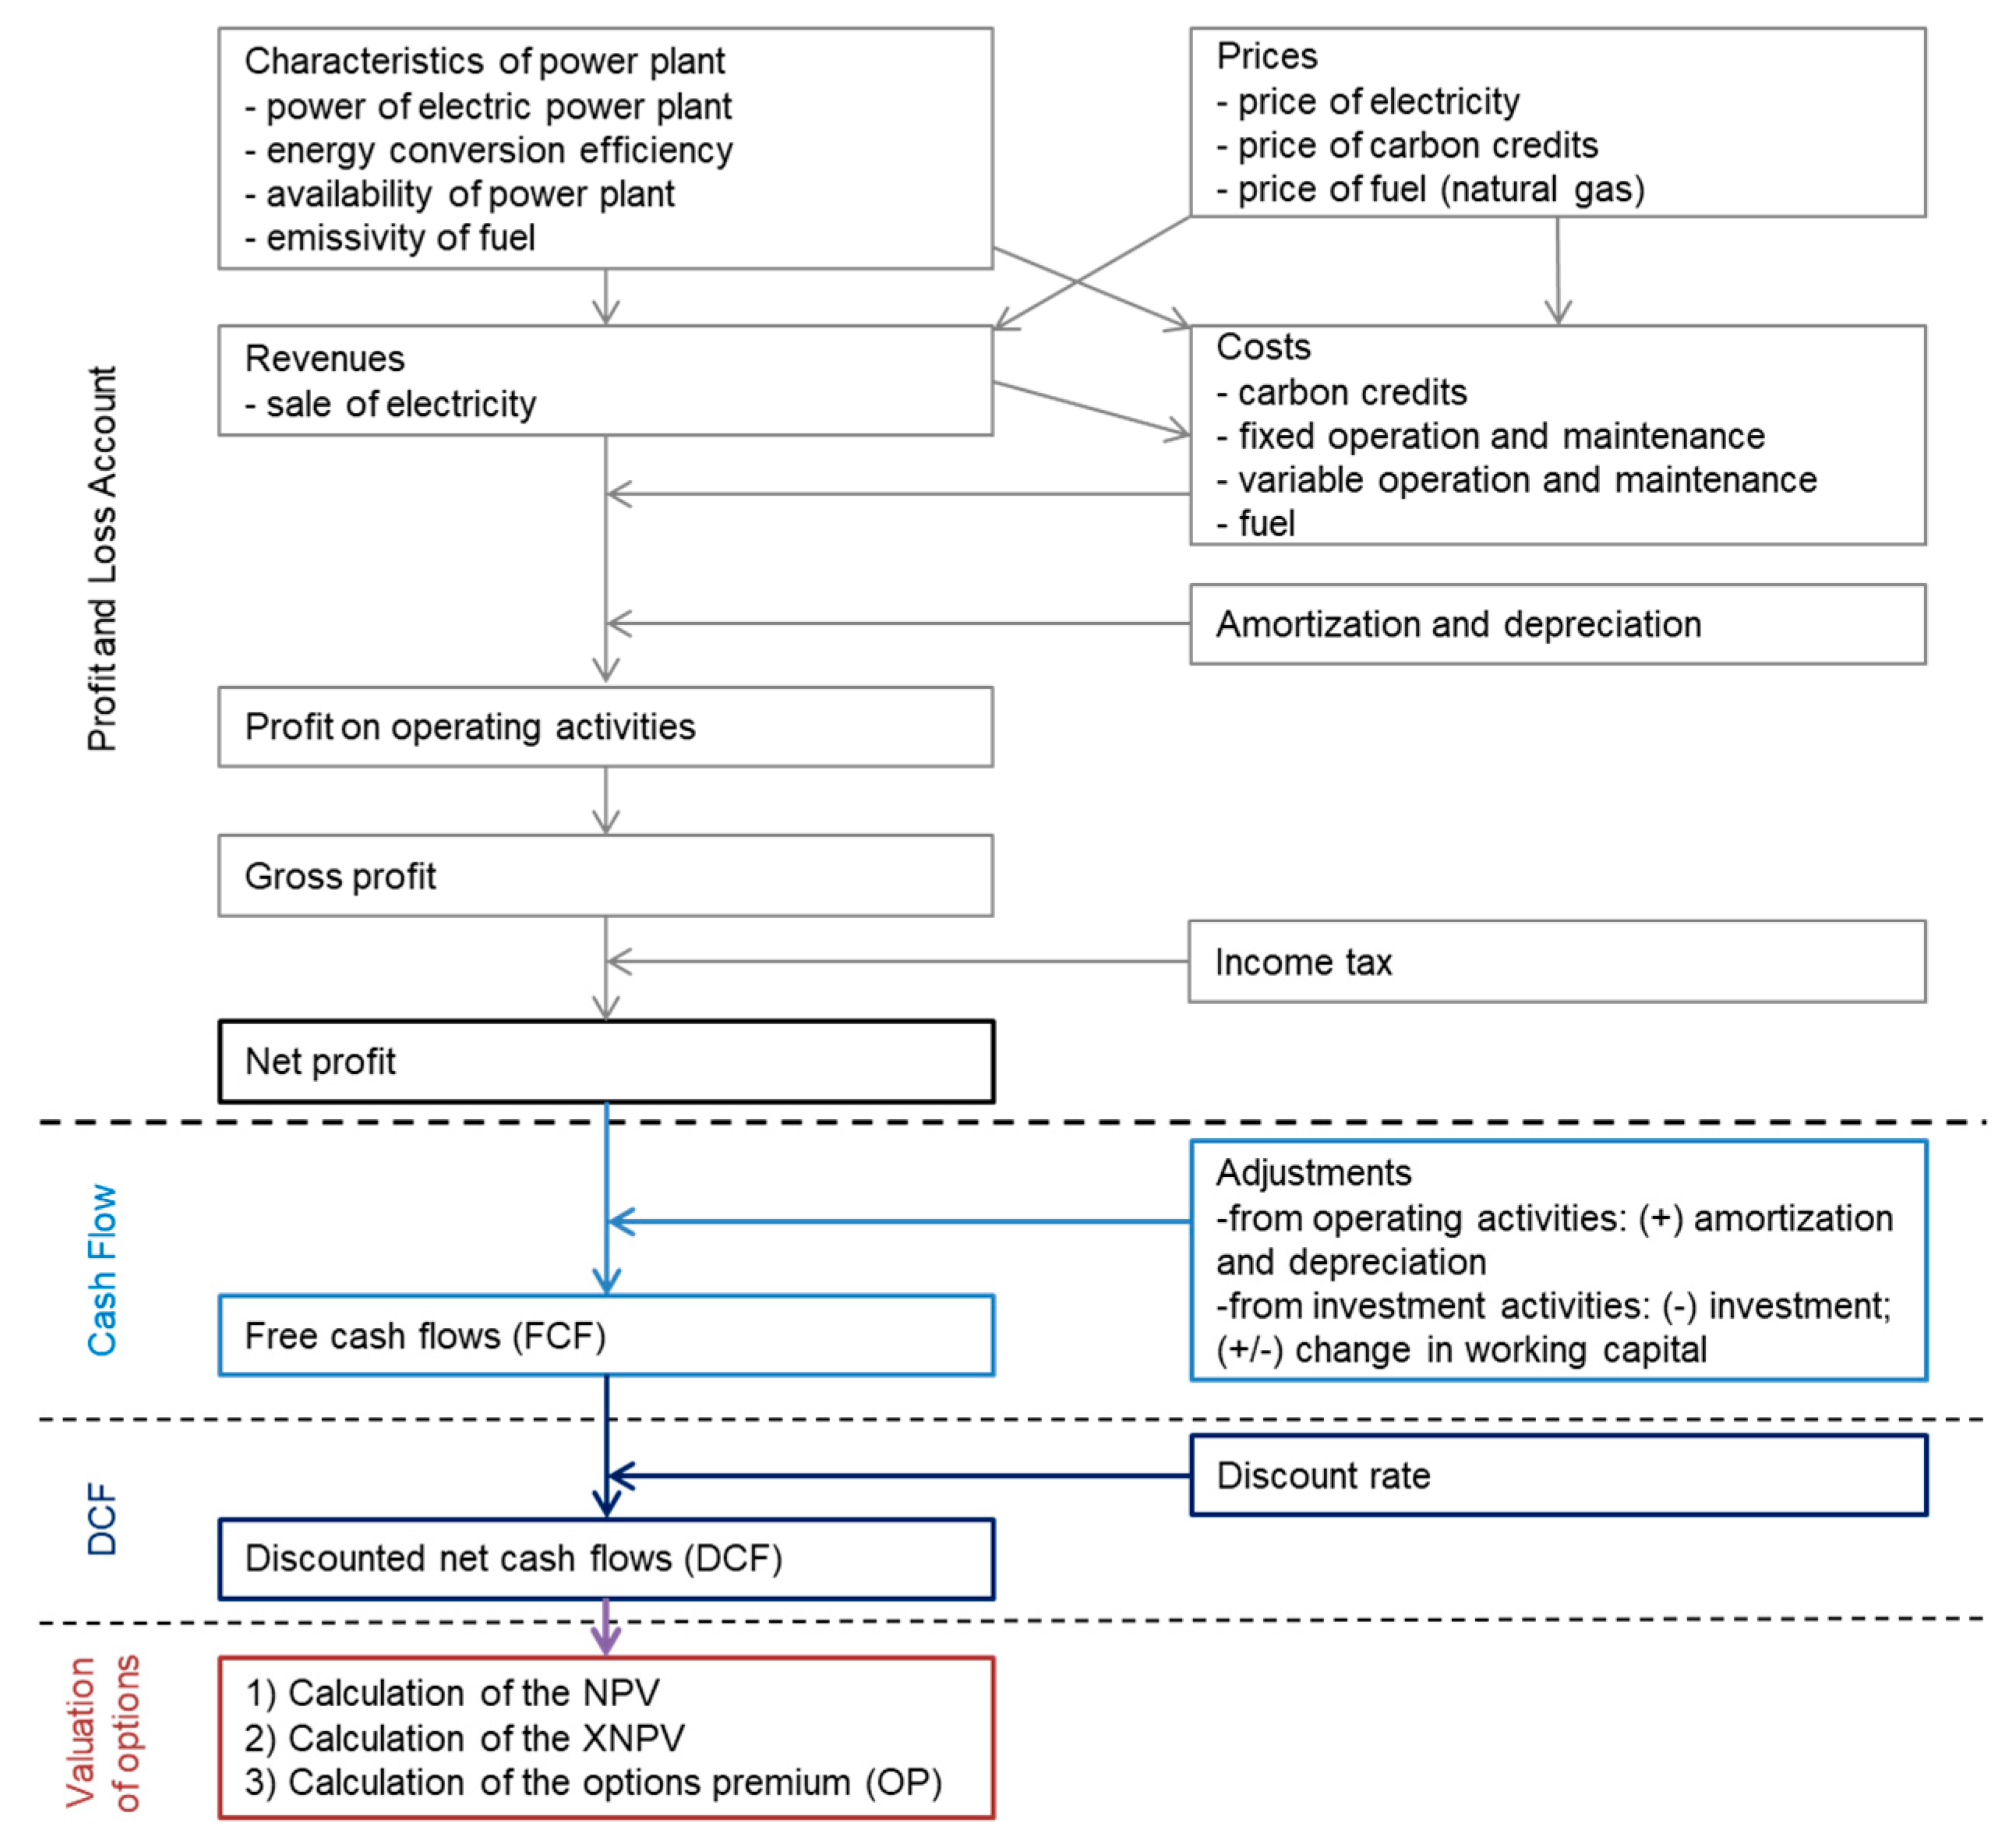
Figure 2 shows the relationships between the key technical (technological) parameters of the analyzed technology and the economic and financial variables. On this basis, the cash flows generated by the analyzed CCGT unit were finally estimated in both valuation models.
Taking into account the above-mentioned, the calculations comprised:
- Estimation of the distribution of the NPV (or the model without options and XNPV for the model with options);
- Assessing the XNPV by evaluating the options embedded in the assets of the analyzed project, according to Formula (2).
3.1. The Definition of the Option in the Valuation Model
The strategic (option) value is marked in this publication as the extended net present value (XNPV) and is the sum of the present value of net cash flows represented by the NPV and option premium (OP), resulting from the quantified value of the decision-making flexibility, i.e., options embedded in assets. The equation describing the extended value of the investment project (XNPV) is presented in the following form [60]:
where:
- XNPV is the extended net present value of the investment project;
- NPV is the net present value;
- OP is the value of operational flexibility and option premium, estimated in the valuation model.
Concerning the above formula, it was possible to determine the value of the option premium by rearranging Formula (2), as follows:
(symbols description, as above).
The concept of XNPV of the analyzed energy project was based on the valuation of the switching option, which is a combination of two simple options [16]:
- The option to temporarily shut down;
- The option to restart.
Both of these options are American style options. The first was the put option, where the underlying assets were revenues, while the strike price was the sum of the variable costs reduced by the costs of temporarily shutting the plant down. The second option was the call option, also based on the revenues, while the strike price consisted of total variable costs, increased by the costs of restarting the production. The payoff function for the shutting down option is expressed as follows [60]:
Meanwhile, the payoff function for restarting the electricity production based on the analyzed technology is expressed as:
where:
- PV is the present value of cash flows from operating activities;
- P is the revenues from electricity sales;
- Ks is the fixed costs;
- Kz is the variable costs;
- Kw is the costs of shutting down the power plant;
- Kr is the cost of re-starting the production.
The period of existence of both options, due to the conditions of simulation and the considered electricity price pattern, was limited to 1 week (it was possible to exercise the option before its expiration date). Because the option of shutting down brought the availability of options to restart (and vice versa), in such a defined sequence, the entire production period (excluding the construction phase and decommissioning) was covered. Characteristics of real options used in the valuation model are presented in Table 1.
After studying the professional literature, we assumed that the costs of shutting the gas-fired unit down were negligible, so they were omitted. However, restarting the electricity production triggered the need to purchase the electricity for own needs from the market. Fixed start-up costs were adopted in the paper, considering that a warm start-up would always take place [61].
3.2. Monte Carlo Simulation in the Valuation Model
The Monte Carlo simulation was used to sample statistical distributions of selected unknown parameters. In the Excel environment, random values were inserted into excel formulas, then the valuation model was recalculated and the distributions of NPV and XNPV were generated. After achieving 20,000 iterations, the simulation was stopped. The measurement of quality of the simulation was based on checking the statistics of the average standard error, which was calculated automatically during the simulation process. Then, the statistics describing the estimated distribution and goodness of fit were estimated. In our valuation model, the probability distributions of NPV and XNPV were calculated with a set of descriptive statistics. Finally, the probability of achieving the specific (“in range” or “greater than”) output values was calculated.
For modelling the price of electricity, natural gas, and carbon credits, the geometric Brownian process with drift (trend) was used. Table 2 shows the characteristics of the input variables and the calculation intervals.
4. The Characteristics of Variables in the Valuation Model
The valuation models included both deterministic and random variables. The deterministic character was assigned to the following input variables:
- Net electric power of the power plant, (MW);
- Availability of the power plant, (%);
- Fuel emissivity (MgCO2/MWh);
- Indicator of own consumption of energy, (%);
- Unit investment costs, (USD/MW);
- Start-up costs of the power unit (USD).
The net electric power of the CCGT unit did not change throughout the operation lifetime and was set at the level of 500 MW. It was also assumed that the availability of the power plant would be constant and it amounted to 0.90. The CO2 emission was assumed at the level of 0.20196 MgCO2/MWh and was constant over time. The rate of energy consumption for own needs was constant and equal to 10%. The unit investment costs incurred for the construction phase were assumed to be 850,000 USD/MW. The costs of operation and maintenance associated with restarting the production were set at the level 2,500 USD. The amortization and depreciation of fixed assets was of linear character and was set at the level of 5%.
The stochastics variables (mentioned in Section 3) were described using standard, normal distributions. This did not apply to net efficiency of the power plant and construction time.
Characteristic parameters of the probability distributions, in case of market prices, were determined by the expert method, using the historical values of these parameters, exchange quotations (stock data), or the forecasts available in the literature [62]. Expected rates of return of the electricity prices and natural gas prices were assumed to be 3% and 0%, respectively. Due to the tightening of climate policy, the value of the expected upward trend of carbon credits prices was estimated at the level of 5%. The standard deviations of annual returns of electricity prices, natural gas, and carbon credits were estimated at the level of: 10%, 15%, and 5%, respectively. The electricity prices were determined on the basis of historical data, simulated with an accuracy of up to 1 h, setting a probability distribution for each hour of the week. Due to the high fluctuations of electricity prices throughout the day, the resulting profiles were corrected with the three period arithmetic mean, so that the simulation process allowed obtaining the profiles that were consistent with the market energy prices. On the basis of real-life observations, it was assumed that the weekly profile of electricity prices would be the same every week of the year. Different price profiles were simulated every year.
The initial value of the unit costs of the variable O&M part was set at the level of 1.5 USD/MWh and was varying over time, in accordance with the normal distribution described by the expected value of 1% and a standard deviation of 2%. The initial value of the unit cost of the fixed O&M part was set at the level of 20,000 USD/MW, following the normal distribution, with an expected value of 1% and a standard deviation of 1%.
The net efficiency of the power plant was described using the triangular distribution with the minimum and maximum values in the range of 54%–56%. The probability for the construction time of 2 years was assumed at 80%, while for 3 years it was at 20%, respectively. If the construction time of the power plant was 2 years, 40% of the total expenditures incurred in the first year and the rest in the following year. However, if the construction time was 3 years, 10% of the total expenditures incurred in the first year, 40% in the second year, and 50% in the third year.
Other technical and economic assumptions were as follows:
- The project was financed from own funds’
- All electricity produced was sold on the spot market;
- Construction of a generating unit was hypothetically set for the 2019, and the planned lifetime of the plant was estimated to be 25 years;
- The discount rate was 6%;
- The annual allocation of free carbon allowances was 0%;
- The income tax rate was 19%;
- The value of the correlation between natural gas prices and the price of CO2 allowances was set at 0.5;
- The value of the correlation of natural gas prices against electricity prices was assumed to be 0.5;
- The time needed for start-up of the unit was estimated to be 20 min.
All values were expressed in real prices for the end of 2019.
The model was prepared in MS Excel, while the simulation was performed using the Oracle Crystal Ball, which is an addition to Microsoft Office. 20,000 iterations were performed for each simulation, which allowed to obtain stable distributions of dependent variables of the NPV and XNPV.
5. The Results
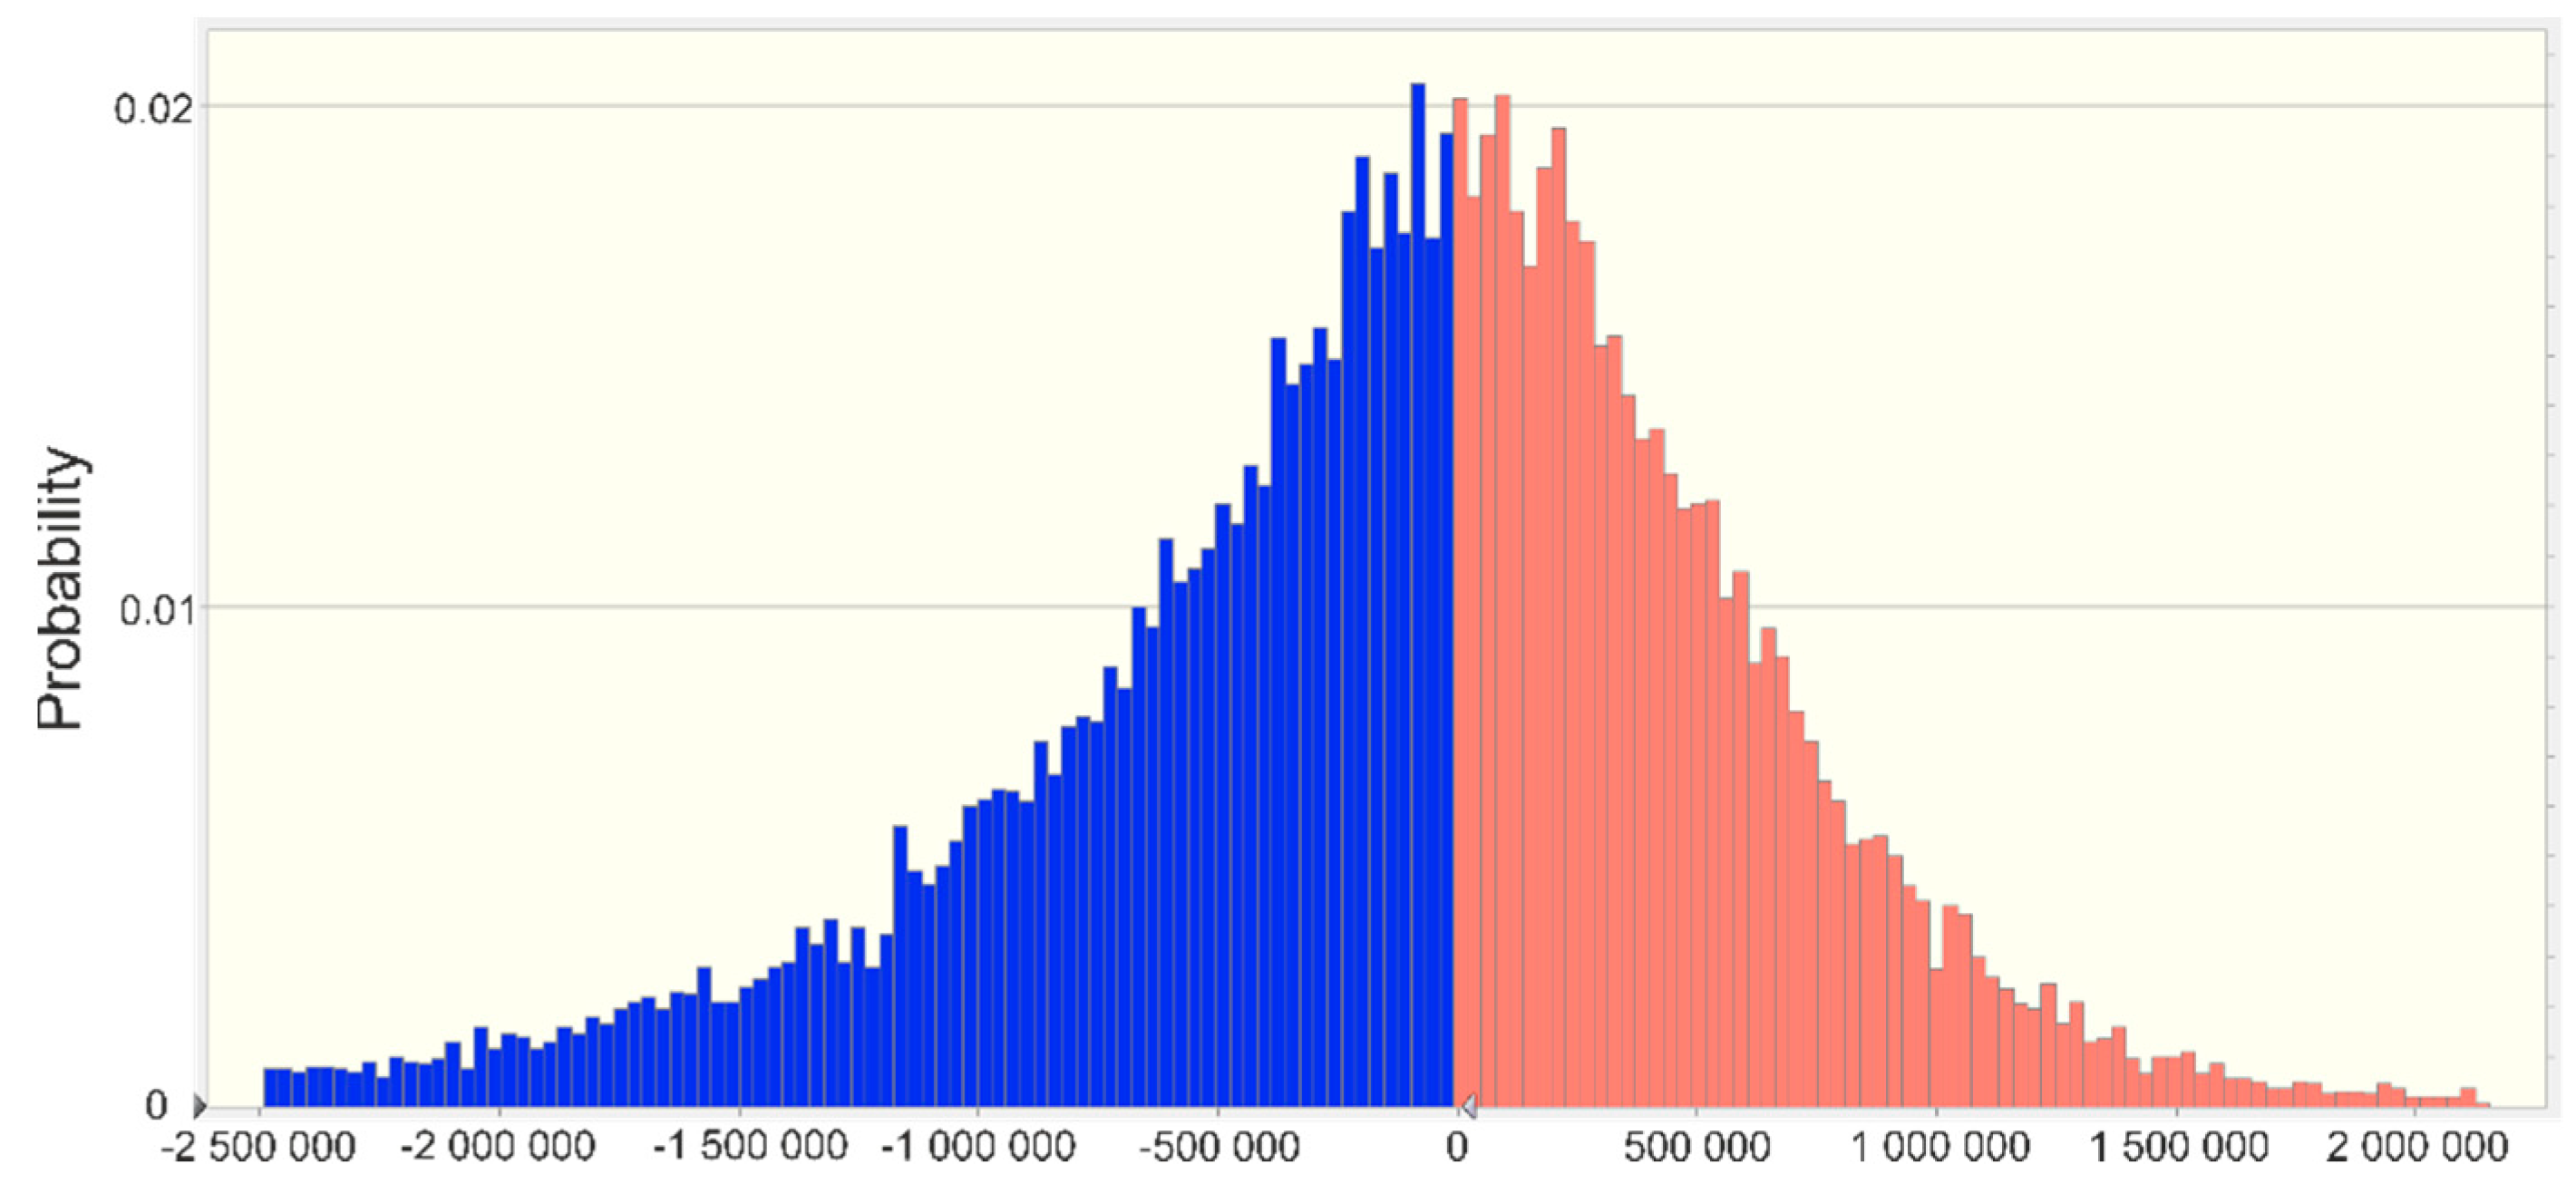
The distribution of the forecasted NPV (in the model without options) is presented in Figure 3. The distribution was a bit asymmetric and had relatively long tails, extended by extreme observations. The expected value was estimated to be −169.1 million USD, with a standard deviation of 829.5 million USD (Table 3). The probability of positive values was approximately 45.4%.
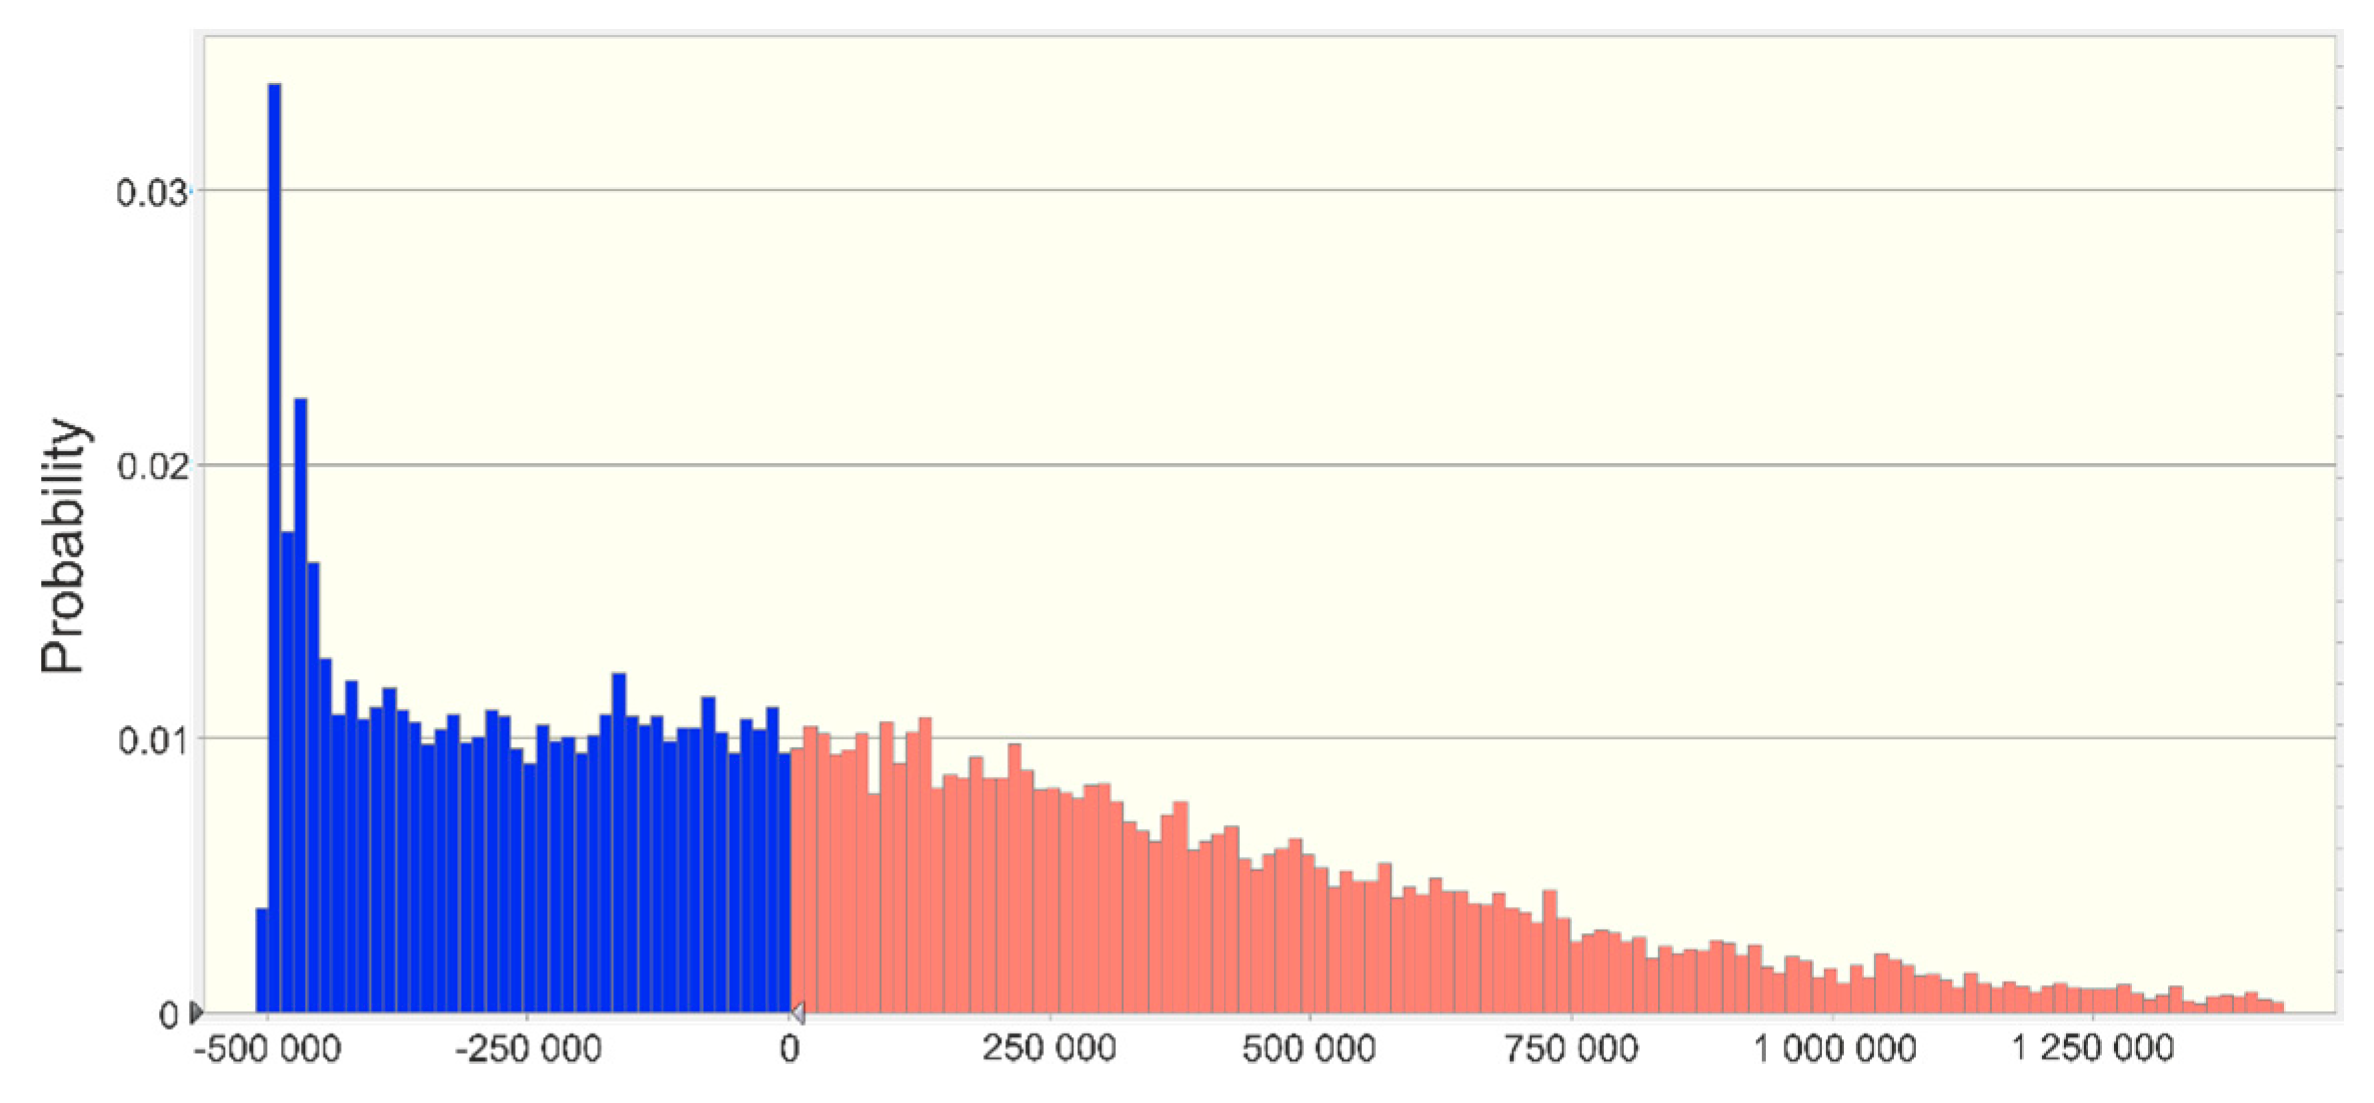
On the other hand, Figure 4 shows the XNPV distribution derived from the model with options. Theoretically, the best matched distribution would be the beta distribution. The expected value was estimated at 102.5 million USD, with a standard deviation reduced by over 57% to 475.1 million USD. The probability of the positive values in this case amounted to 51.6%. It seems to be quite clear that taking into account the switching option the value and the profile of the XNPV’s distribution are changed. The value of the option premium, estimated indirectly as the difference between the expected value in both models, was 271.6 million USD.
6. Conclusions
The paper presents the thesis that the operational flexibility, resulting from the dynamic shutting down and restarting gas-fired blocks in the continuous process of electricity generation, increases the economic efficiency of the entire investment.
The increase in the project’s value results from the valuation of the available options. In this paper, the switching option, a combination of two separate options (shutting down and restarting the production) was examined. This paper did not study the impact of other embedded options (e.g., an option to wait).
Operational flexibility in the production of electricity of CCGT power plants has been demonstrated as the project’s extended net present value (XNPV). To do so, a sophisticated valuation model, with the use of the Monte Carlo simulation, was prepared. Finally, the value of operational flexibility was estimated in monetary terms. Uncertainty and the stochastic nature of key decision (input) variables were replicated with the use of appropriate distributions and stochastic processes.
Considering achieved results, it can be concluded that the calculation of operational flexibility of the analyzed technology modified the NPV distribution. The net present value was calculated to −169.1 million USD, while the XNPV amounted to 102.5 million USD. This difference, compared to the NPV distribution range at a significance level of 0.05, was more than 8.1% (almost 10.4% for α = 0.1). The XNPV was completely different in shape. The probability of obtaining values greater than 0 (i.e., positive) increased from 45.4% to 51.6%. It should be noted that the analyzed power plant became more profitable and less risky after taking into account the operational flexibility “embedded” in its assets. The operational flexibility not only increased the expected NPV, but also improved the risk assessment of the installation (reduction of the probability of negative NPV).
The presented approach to the valuation of operational flexibility of the CCGT power plant combined elements of discounted cash flow methods, Monte Carlo simulation, and the real options approach. Operational flexibility of the analyzed CCGT power plant was assessed with use of advanced modeling process, which allowed for better understanding of the mutual impact of many sources of potential uncertainty and risk, but also opportunities. Transferring operational flexibility to the NPV profile and modeling all important sources of uncertainty and risk with use of the Monte Carlo simulation seems to be unique in the professional literature. The research effects cannot be achieved by a single evaluation method. The combination of the mentioned methods brings new insights and novelty to the modeling of the effectiveness of CCGT technologies, with respect to their dynamics.
The results of the study indicate the need to consider the existing options in the economic valuation of energy technologies. Ignoring the possibilities of more flexible operation of gas-fired energy units may lead to an underestimation of their value, considering them less attractive than they are. Keeping in mind the fact that we have only examined the impact of one complex option (probably the most distinguished one), in our next works, we would like to examine the influence of other options related with CCGT power technologies based on fuel switching, deferring the investment, or operating with a partially limited load. We would also stress our intention to better express the future carbon credits and electricity price fluctuations incorporating the European Union legislations.
Author Contributions
Individual contribution: Conceptualization, D.K. and M.K.; Methodology, D.K. Software and computation, D.K. Model validation, M.K. Formal analysis, K.K. Writing and original draft preparation, D.K. and M.K. Writing—review and editing, K.K. and M.K. Visualization, D.K. and K.K. Supervision, M.K. All authors have read and agreed to the published version of the manuscript.
Funding
This research received no external funding.
Acknowledgments
This research did not receive any specific grant from funding agencies in the public, commercial, or not-for-profit sectors.
Conflicts of Interest
The authors declare no conflict of interest.
References
- World Energy Outlook 2019; International Energy Agency: Paris, France, 2019.
- Kryzia, D. Selection of the Electricity Generation Technology in the Risk Conditions; Publishing House of the MEERI PAS: Krakow, Poland, 2015. [Google Scholar]
- Abadie, L.M.; Chamorro, J.M. Valuing flexibility: The case of an integrated gasification combined Cycle power plant. Energy Econ. 2008, 30, 1850–1881. [Google Scholar] [CrossRef] [Green Version]
- Roques, F.A. Technology choices for new entrants in liberalized markets: The value of operating flexibility and contractual arrangements. Util. Policy 2008, 16, 245–253. [Google Scholar] [CrossRef]
- Brandăo, L.E.; Dyer, J.S.; Hahn, W.J. Using binomial decision trees to solve real-option valuation problems. Decis. Anal. 2005, 2, 69–88. [Google Scholar] [CrossRef]
- Rukes, B.; Taud, R. Status and perspectives of fossil power generation. Energy 2004, 29, 1853–1874. [Google Scholar] [CrossRef]
- Trigeorgis, L. Real Options Managerial Flexibility and Strategy in Resource Allocation; MIT Press: Cambridge, MA, USA, 2000. [Google Scholar]
- Fernandes, B.; Cunha, J.; Ferreira, P. The use of real options approach in energy sector investments. Renew. Sustain. Energy Rev. 2011, 15, 4491–4497. [Google Scholar] [CrossRef] [Green Version]
- Graham, J.R.; Harvey, C.R. The theory and practice of corporate finance: Evidence from the field. J. Financ. Econ. 2001, 60, 187–243. [Google Scholar] [CrossRef]
- Botterud, A.; Korpås, M. A stochastic dynamic model for optimal timing of investments in new generation capacity in restructured power systems. Int. J. Electr. Power Energy Syst. 2007, 29, 163–174. [Google Scholar] [CrossRef]
- Hach, D.; Spinler, S. Capacity payment impact on gas-fired generation investments under rising renewable feed-in—A real options analysis. Energy Econ. 2016, 53, 270–280. [Google Scholar] [CrossRef]
- Näsäkkälä, E.; Fleten, S.E. Flexibility and technology choice in gas fired power plant investments. Rev. Financ. Econ. 2005, 14, 371–393. [Google Scholar] [CrossRef] [Green Version]
- Sekar, C. Carbon Dioxide Capture from Coal-Fired Power Plants: A Real Options Analysis; MIT Press: Cambridge, MA, USA, 2005. [Google Scholar]
- Laurikka, H. Option value of gasification technology within an emissions trading scheme. Energy Policy 2006, 34, 3916–3928. [Google Scholar] [CrossRef]
- Frayer, J.; Uludere, N.Z. What is it worth? Application of real options theory to the valuation of generation assets. Electr. J. 2001, 14, 40–51. [Google Scholar] [CrossRef]
- Siddiqui, A.S.; Marnay, C.; Wiser, R.H. Real options valuation of USA federal renewable energy research, development, demonstration, and deployment. Energy Policy 2007, 35, 265–279. [Google Scholar] [CrossRef] [Green Version]
- Marreco, J.M.; Carpio, L.G.T. Flexibility valuation in the Brazilian power system: A real options approach. Energy Policy 2006, 34, 3749–3756. [Google Scholar] [CrossRef]
- Kuper, G.H.; Soest, D.P. Does oil price uncertainty affect energy use? Energy J. 2006, 27, 55–78. [Google Scholar] [CrossRef] [Green Version]
- Blyth, W.; Yang, M. Impact of Climate Change. Policy Uncertainty in Power Investment; International Energy Agency: Paris, France, 2006. [Google Scholar]
- Laurikka, H.; Koljonen, T. Emissions trading and investment decisions in the power sector—A case study in Finland. Energy Policy 2006, 34, 1063–1074. [Google Scholar] [CrossRef]
- Tseng, C.-L.; Barz, G. Power plant operations and real options: Using options methodology to enhance capital budgeting decisions. In Real Options and Energy Management; Ronn, E.I., Ed.; Risk Books: London, UK, 2002. [Google Scholar]
- Deng, S.-J.; Oren, S.S. Incorporating operational characteristics and start-up costs in option-based valuation of power generation capacity. Probabeng Inf. Sci. 2003, 17, 155–181. [Google Scholar] [CrossRef] [Green Version]
- Reuter, W.H.; Fuss, S.; Szolgayová, J.; Obersteiner, M. Investment in wind power and pumped storage in a real options model. Renew. Sustain. Energy Rev. 2012, 16, 2242–2248. [Google Scholar] [CrossRef]
- He, H.; Pindyck, R.S. Investments in flexible production capacity. J. Econ. Dyn. Control 1992, 16, 575–599. [Google Scholar] [CrossRef] [Green Version]
- Kulatilaka, N. The value of flexibility: A general model of real options. In Real Options in Capital Investment; Trigeorgis, L., Ed.; Praeger: London, UK, 1995. [Google Scholar]
- Dixit, A.K.; Pindyck, R.S. Investment Under Uncertainty; Princeton University: Princeton, NJ, USA, 1994. [Google Scholar]
- Keppo, J.; Lu, H. Real options and a large producer: The case of electricity markets. Energy Econ. 2003, 25, 459–472. [Google Scholar] [CrossRef]
- Luo, J. Optimal Entry and Exit in the Ethanol Industry: A Real Options Analysis with Two Stochastic Variables. Master’s Thesis, Cornell University, New York, NY, USA, 2009. [Google Scholar]
- Li, Y.; Yang, W.; Tian, L.; Yang, J. An evaluation of investment in a PV power generation project in the GOBI desert using a real options model. Energies 2018, 11, 257–273. [Google Scholar] [CrossRef] [Green Version]
- Moon, Y.; Baran, M. Economic analysis of a residential PV system from the timing perspective: A real option model. Renew. Energy 2018, 125, 783–795. [Google Scholar] [CrossRef]
- Gazheli, A.; van den Bergh, J. Real options analysis of investment in solar vs. wind energy: Diversification strategies under uncertain prices and costs. Renew. Sustain. Energy Rev. 2018, 82, 2693–2704. [Google Scholar] [CrossRef] [Green Version]
- Zambujal-Oliveira, J. Investments in combined cycle natural gas-fired systems: A real options analysis. Int. J. Elec. Power Energy Syst. 2013, 49, 1–7. [Google Scholar] [CrossRef]
- Rohlfs, W.; Madlener, R. Optimal investment strategies in power generation assets: The role of technological choice and existing portfolios in the deployment of low-carbon technologies. Int. J. Greenh. Gas. Control 2014, 28, 114–125. [Google Scholar] [CrossRef]
- Abadie, L.M. Operating flexibility at power plants: A market valuation. Int. J. Electr. Power Energy Syst. 2015, 64, 41–49. [Google Scholar] [CrossRef]
- Gatfaoui, H. Pricing the (European) option to switch between two energy sources: An application to crude oil and natural gas. Energy Policy 2015, 87, 270–283. [Google Scholar] [CrossRef]
- Aronne, A.; Brasil, H.; Aronne, I. Valuation of flexible power plants in Brazil: A real options approach. Revista Gestão Tecnologia 2011, 9, 1–9. [Google Scholar]
- Grzesiak, P. Decision Flexibility in the Process of Selecting Coal Gasification Technology. Ph.D. Thesis, Krakow, Poland, 2015. [Google Scholar]
- De Oliveira, D.; Brandao, L.; Igrejas, R.; Gomes, L. Switching outputs in a bioenergy cogeneration project: A real options approach. Renew. Sustain. Energy Rev. 2014, 36, 74–82. [Google Scholar] [CrossRef]
- Glensk, B.; Madlener, R. Evaluating the Enhanced Flexibility of Lignite-Fired Power Plants: A Real Options Analysis; FCN Working Papers 107/2016; E.ON Energy Research Center, Future Energy Consumer Needs and Behavior (FCN): Aachen, Germany, 2016. [Google Scholar]
- Glensk, B.; Madlener, R. Evaluating the enhanced flexibility of lignite-fired power plants: A real options analysis. Energy Convers. Manag. 2018, 177, 737–749. [Google Scholar] [CrossRef] [Green Version]
- Glensk, B.; Madlener, R. Real Options Analysis of the Flexible Operation of an Enhanced Gas-Fired Power Plant; FCN Working Paper No.11/2015; Institute for Future Energy Consumer Needs and Behavior, School of Business and Economics/E.ON ERC, RWTH Aachen University: Aachen, Germany, 2015. [Google Scholar]
- Glensk, B.; Madlener, R. The value of enhanced flexibility of gas-fired power plants: A real options analysis. Appl. Energy 2019, 251, 113–125. [Google Scholar] [CrossRef]
- Axelrod, A. Real option—A Silver bullet or a black hole. In Annual International Conference on Real Options; Los Angeles, CA, USA, 2001; Available online: www.realoptions.org (accessed on 28 February 2020).
- Upton, D.M. The management of manufacturing flexibility. Calif. Manag. Rev. 1994, 36, 72–89. [Google Scholar] [CrossRef]
- Wiśniewski, T. Simulation method for valuation of multivariate real options. In Financial Investments and Insurance—Global Trends and the Polish Market; Research Papers of Wroclaw University of Economics: Warsaw, Poland, 2005; pp. 357–367. [Google Scholar]
- Charnes, J. Financial Modeling with Crystal Ball and Excel; John Wiley & Sons: New York, NY, USA, 2007. [Google Scholar]
- Rubinstein, R.Y.; Kroese, D.P. Simulation and the Monte Carlo Method; Wiley: New York, NY, USA, 2011. [Google Scholar]
- Kroese, D.P.; Taimre, T.; Botev, Z.I. Handbook of Monte Carlo Methods; Wiley: Hoboken, NJ, USA, 2011. [Google Scholar]
- Rohlfs, W.; Madlener, R. Valuation of CCS-ready coal-fired power plants: A multidimensional real options approach. Energy Syst. 2011, 2, 243–261. [Google Scholar] [CrossRef]
- Zhou, W.; Zhu, B.; Fuss, S.; Szolgayová, J.; Obersteiner, M.; Fei, W. Uncertainty modeling of CCS investment strategy in China’s power sector. Appl. Energy 2010, 87, 2392–2400. [Google Scholar] [CrossRef]
- Rothwell, G.A. A real options approach to evaluating new nuclear power plants. Energy J. 2006, 27, 37–53. [Google Scholar] [CrossRef]
- Zhang, M.; Zhou, D.; Zhou, P.; Liu, G.Q. Optimal feed-in tariff for solar photovoltaic power generation in China: A real options analysis. Energy Policy 2016, 97, 181–192. [Google Scholar] [CrossRef]
- Alharbi, F.; Csala, D. Saudi Arabia’s solar and wind energy penetration: Future performance and requirements. Energies 2020, 13, 588. [Google Scholar] [CrossRef] [Green Version]
- Kroniger, D.; Madlener, R. Hydrogen storage for wind parks: A real options evaluation for an optimal investment in more flexibility. Appl. Energy 2014, 136, 931–946. [Google Scholar] [CrossRef]
- Sanpasertparnich, T.; Aroonwilas, A. Simulation and optimization of coal-fired power plants. Energy Procedia 2009, 1, 3851–3858. [Google Scholar] [CrossRef] [Green Version]
- Gorre, J.; Ruoss, F.; Karjunen, H.; Schaffert, J.; Tynjälä, T. Cost benefits of optimizing hydrogen storage and methanation capacities for power-to-gas plants in dynamic operations. Appl. Energy 2020, 257, 113967. [Google Scholar] [CrossRef]
- Salman, C.A.; Naqvi, M.; Thorin, E.; Yan, J. Gasification process integration with existing combined heat and power plants for polygeneration of dimethyl ether or methanol: A detailed profitability analysis. Appl. Energy 2018, 226, 116–128. [Google Scholar] [CrossRef]
- Kopacz, M. The Investment Projects Valuating Method in Polish Copper Ore Mining with Use of Stochastic Simulation; Publishing House of the MEERI PAS: Krakow, Poland, 2009. [Google Scholar]
- Projected Cost of Generating Electricity; International Energy Agency: Paris, France, 2010.
- Saługa, P. Managerial Flexibility in Mineral Project Valuation; Publishing House of the MEERI PAS: Krakow, Poland, 2011. [Google Scholar]
- Kumar, N.; Besuner, P.; Lefton, S.; Agan, D.; Hilleman, D. Power Plant. Cycling Costs; Intertek APTECH: Sunnyvale, CA, USA, 2012. [Google Scholar]
- Gawlik, L.; Grudziński, Z.; Kamiński, J.; Kaszyński, P.; Kryzia, D.; Lorenz, U.; Mirowski, T.; Mokrzycki, E.; Olkuski, T.; Ozga-Blaschke, U.; et al. Coal for Polish Energy Sector in 2050 Perspective—Scenario Analyses; Mining Chamber of Industry and Commerce, Publishing House of the MEERI PAS: Katowice, Poland, 2013. [Google Scholar]
Figure 1.
Cash flows from operating activities generated by the gas-fired unit; (a) continuous operation (base model); (b) flexible operation (with switching option).
Figure 1.
Cash flows from operating activities generated by the gas-fired unit; (a) continuous operation (base model); (b) flexible operation (with switching option).


Figure 2.
The scheme for estimating cash flows, the net present value (NPV), and the extended net present value (XNPV) in the valuation model.
Figure 2.
The scheme for estimating cash flows, the net present value (NPV), and the extended net present value (XNPV) in the valuation model.

Figure 3.
The distribution of the NPV in the model without options. Source: own study.

Figure 4.
The distribution of the XNPV in the model with options. Source: own study.


Table 1.
Characteristics of real options used in the valuation model.
| Options Name | Underlying Asset | Strike Price | Expiration (Period of Existence) | Options Style |
|---|---|---|---|---|
| Option to temporarily shut down | (P) revenues | 1 week | American | |
| Option to restart | (P) revenues | 1 week | American |
Fixed costs (Ks); costs of shutting down (Kw); cost of restarting (Kr).
Table 2.
Sampling interval in the Monte Carlo simulation for the input variables.
| Variables Specification | Calculating Interval |
|---|---|
| Electricity price | 1 h |
| Price of natural gas | 1 year |
| Price of carbon credits | 1 year |
| Fixed operating and maintenance costs | 1 year |
| Variable operating and maintenance costs | 1 year |
| Net efficiency of the power plant | 1 for each iteration |
| Construction time of the power plant | 1 for each iteration |
Table 3.
The distribution parameters of the projected variables of NPV and XNPV.
| Parameter | Unit | The Values Characterizing the NPV Distribution | The Values Characterizing the XNPV Distribution |
|---|---|---|---|
| The expected value | USD | −169,068,329 | 102,511,091 |
| The median | USD | −72,860,944 | 20,030,410 |
| The standard deviation | USD | 829,491,851 | 475,090,235 |
| Coefficient of skewness | - | −1.20 | 1.11 |
| Kurtosis | - | 8.20 | 4.74 |
| Minimum | USD | −10,404,109,138 | −510,266,323 |
| Maximum | USD | 3,251,990,414 | 3,361,091,170 |
| Average standard error | USD | 5,865,393 | 3,359,395 |
© 2020 by the authors. Licensee MDPI, Basel, Switzerland. This article is an open access article distributed under the terms and conditions of the Creative Commons Attribution (CC BY) license (http://creativecommons.org/licenses/by/4.0/).
Share and Cite
MDPI and ACS Style
Kryzia, D.; Kopacz, M.; Kryzia, K. The Valuation of the Operational Flexibility of the Energy Investment Project Based on a Gas-Fired Power Plant. Energies 2020, 13, 1567. https://0-doi-org.brum.beds.ac.uk/10.3390/en13071567
AMA Style
Kryzia D, Kopacz M, Kryzia K. The Valuation of the Operational Flexibility of the Energy Investment Project Based on a Gas-Fired Power Plant. Energies. 2020; 13(7):1567. https://0-doi-org.brum.beds.ac.uk/10.3390/en13071567
Chicago/Turabian StyleKryzia, Dominik, Michał Kopacz, and Katarzyna Kryzia. 2020. "The Valuation of the Operational Flexibility of the Energy Investment Project Based on a Gas-Fired Power Plant" Energies 13, no. 7: 1567. https://0-doi-org.brum.beds.ac.uk/10.3390/en13071567
Note that from the first issue of 2016, this journal uses article numbers instead of page numbers. See further details here.