Characterizing Variations in the Indoor Temperature and Humidity of Guest Rooms with an Occupancy-Based Climate Control Technology


1
Hillier College of Architecture and Design, New Jersey Institute of Technology, Newark, NJ 07102, USA
2
DLR Group, Washington, DC 20004, USA
*
Author to whom correspondence should be addressed.
Energies 2020, 13(7), 1575; https://0-doi-org.brum.beds.ac.uk/10.3390/en13071575
Submission received: 22 February 2020
/
Revised: 18 March 2020
/
Accepted: 22 March 2020
/
Published: 1 April 2020
(This article belongs to the Special Issue Designing, Modeling and Optimizing Energy and Environmental Systems for Buildings)
Abstract
:This paper characterizes variations in the indoor temperature and humidity profiles of actual guest rooms equipped with Occupancy-Based Climate Control (OBCC) systems that were used to initiate a temperature setback to 15.6 °C in the winter and to 26.7 °C in the summer in the guest rooms. Empirical knowledge of these conditions can provide useful insights for an improved field demonstration and optimization of OBCC, as well as for a more realistic temperature and occupancy input for building simulations for hotel guest rooms. As a result, one year of one minute temperatures and humidity data was characterized against outdoor climate for three different occupancy modes, which was useful to identify the observed room-to-room variations in heat losses and resultant indoor temperatures during the heating season due to the different dynamic heat balance conditions of the guest rooms. This indicated potential discomfort in the rooms that appeared to have a stronger association between outdoor and indoor temperatures, which was also identified from the thermal comfort survey indicating thermostat-related discomfort sources. Interestingly enough, the guests who stayed in these rooms tended to set their thermostat at higher setpoint temperatures when they occupied the room, which appeared to compensate for the low balance-point temperatures of these rooms.
1. Introduction
According to the U.S. Energy Information Administration’s (EIA) Commercial Buildings Energy Consumption Survey (CBECS), hotel buildings are considered part of the lodging sector. Of total building energy use in the U.S., about 8.1% was consumed by the lodging sector as reported by the 2012 CBECS [1], which made the lodging sector the fifth-largest energy consumer. To save energy in hotel guest rooms, recent industry efforts have focused on Occupancy-Based Climate Control (OBCC) technology using either occupancy sensors or card-key based control systems that activate temperature setback schedules when the hotel guest rooms are vacated. Hotel guest rooms are considered to be one of the most appropriate building types for OBCC due to their relatively low occupancy rates and unpredictable occupancy schedules [2]. In addition to energy savings, several non-energy benefits may accrue, including the extended equipment lifespan and therefore reduced maintenance and replacement costs [3,4].
The use of occupancy sensors to control thermal conditions of unoccupied guest rooms in hotels was discussed in an early study by Fountain et al. [5]. Recently, the latest edition of American Society of Heating, Refrigerating and Air-Conditioning Engineers (ASHRAE) Standard 90.1-2016 [6], which has been the commercial building energy code in the U.S., mandated the use of occupancy sensors or card-key based systems to control the thermal conditions of unoccupied guest rooms in hotels. The new provisions of the ASHRAE Standard 90.1-2016 on OBCC technology (i.e., Section 6.4.3.3.5) require the capability of automatic Heating, Ventilating and Air-Conditioning (HVAC) controls, which can reset HVAC setpoints to 26.7 °C (80 °F) or higher for cooling and 15.6 °C (60 °F) or lower for heating when the hotel room is unrented and unoccupied. Studies showed that increased setback and setup temperature produced greater energy savings [7,8]. However, this implies that the implementation of OBCC technology in guest rooms may create periods of uncomfortable conditions for hotel guests when they first enter the room. This customer discomfort has been often considered as major barrier impeding the wide deployment of OBCC technology in hotels that are dependent on satisfied customers who expect instant comfort when they check-in to their rooms in the U.S. market [4,9]. The frequent guest complaints may also result in deactivated systems due to occupant complaints even after installation.
One recent study by Qi et al. [10] found that there was a close relationship between a high rate of Indoor Environmental Quality (IEQ) complaints and lower online ratings based on an analysis of more than 160,000 online reviews from 70 five-star hotels in China. They also reported that IEQ performance was significantly compromised in hotels with an annual energy consumption lower than 150 kWh/m2. In another study, Bohdanowicz and Martinac [11] reported that the use of expensive and sophisticated systems did not guarantee guest satisfaction, and the most common complaints included uncomfortable air temperatures, which were too high or too low, and the lack of controls in the hotel room.
To overcome potential discomfort from a deployment of OBCC in buildings, numerous efforts have been made to predict and model the probability of occupancy to be used for advanced occupancy-based Model Predictive Control (MPC) for building indoor climate, including space preconditioning prior to occupancy to ensure occupant comfort. The modeling procedures use different statistical, stochastic, or machine learning methods, which were thoroughly reviewed in previous literature [12,13,14]. However, most studies have focused on offices and homes that are normally occupied by the same tenants with relatively predictable occupancy schedules, which limits their applicability to buildings whose occupancy schedule is uncertain and hard to predict with random occupants such as hotel guest rooms.
In addition, few studies have actually measured and evaluated the performance of OBCC in hotel guest rooms, which were commissioned by several major utilities in California [4,9,15,16,17]. Unfortunately, previous demonstrations of OBCC technology for guest rooms often excluded an IEQ assessment, which was reviewed in Kim and Oldham [8]. In these studies, the energy savings were reported based on simple side-by-side tests (i.e., parallel approach) or before-and-after tests (i.e., series approach) of a small sample size of guest rooms without the understanding of different room occupancy and temperature profiles, as well as guests’ preferred temperatures, which might be different during the test periods. Unfortunately, this is one of the crucial variables that has had a large influence on the measured savings of the OBCC technology, which needs to be studied. Asadi et al. [18] examined indoor air quality of hotel buildings, but their assessments did not include an OBCC technology.
In summary, no studies to date have reported the impacts of the deployment of OBCC on temperature and humidity variations in actual guest rooms despite the fact that they can directly influence guest comfort and satisfaction. Accordingly, further studies are needed to better understand these variations in order to make sure hotels can still deliver high standards of comfort to their guests whose occupancy schedules and thermal preferences are hard to predict. Such a study may also provide useful insights for an improved field demonstration and optimization of OBCC, as well as for a more realistic temperature and occupancy input for building simulations for hotel guest rooms. For example, current assumptions on thermostat setpoint schedules used by the U.S. Department of Energy (DOE) reference building models for hotel guest rooms, which were developed to be used for DOE commercial building research to assess new building technologies, are constant at 24 °C (75.2 °F) for cooling and 21 °C (69.8 °F) for heating [19]. This assumption should be examined and updated to have more realistic thermostat setpoint schedules for guest rooms based on field studies on actual temperature profiles in guest rooms.
Therefore, the current paper presents the results of an effort to measure and characterize variations in temperature and humidity of actual guest rooms equipped with an OBCC technology across different seasons. Empirical knowledge of these conditions can provide a better understanding of the impacts of OBCC on temperature and humidity variations in guest rooms and how guests react to the observed variations. The analysis was based on one year of temperature, humidity, and occupancy measurements in twenty guest rooms in a case-study hotel in Washington, D.C. At the case-study hotel, a card-key based climate control system was used to initiate a temperature setback to 15.6 °C (60 °F) in the winter and to 26.7 °C (80 °F) in the summer in the guest rooms that were studied.
This paper is an extended version of the work presented in Kim et al. [20], which reported the preliminary results of this study during the cooling season. The results presented in this paper provide deeper insights into how OBCC technology actually performed with respect to thermal comfort conditions across three different seasons (i.e., cooling, heating, and transitional seasons). Full details of measured energy data are available in Kim and Oldham [21], including new models to properly normalize the measured energy use of guest rooms for weather and occupancy. A detailed energy savings analysis from the installed OBCC technology is available in Kim and Oldham [8].
2. Methods
This study analyzed one minute temperature, humidity, and occupancy measurements in twenty guest rooms in a case-study hotel in Washington, D.C. for one year from 5 June 2015 to 4 June 2016. Coincident outdoor weather data, including hourly outdoor air temperature and dew point temperature, were also collected from the nearby National Oceanic and Atmospheric Administration (NOAA) weather station at Washington Reagan National Airport [22], which is about 8 km away from the case-study building.
2.1. Case-Study Hotel Description
The case-study hotel was built in 1966 and received a full renovation in 2013. The hotel is ten-stories tall with a conditioned floor area of 7297 m2 (78,545 ft2) and a window-to-wall ratio of 32%. Each of the 121 guest rooms in the hotel has a full kitchen. The building is of metal frame construction with batt insulation with an R-value of 3.35 K m2/W (19 h ft2 °F/Btu) and continuous insulation with an R-value of 1.48 K m2/W (8.4 h ft2 °F/Btu). All guest rooms feature operable double-pane, low-e windows with a U-factor of 1.93 W/m2 K (0.34 Btu/h ft2 °F) and a solar heat gain coefficient of 0.60. Kim and Oldham [8] reported that the daily total floor electricity use of the guest rooms on the sixth floor of the case-study hotel varied from 5.6 W/m2 (0.52 W/ft2) to 22.4 W/m2 (2.08 W/ft2).
The rooms are arranged in a parallel fashion with windows facing the four different orientations such as west, northwest, east, and southeast. The floor areas of the rooms vary between 38.6 m2 and 56.3 m2. Variable Refrigerant Flow Heat Recovery (VRF-HR) units provide heating and cooling to the guest rooms. Ventilation is provided via a rooftop Dedicated Outdoor Air System (DOAS). Regardless of occupancy, the DOAS constantly provides conditioned Outdoor Air (OA) to the guest rooms at around 23.9 °C (75 °F) during the heating season and at around 17.8 °C (64 °F) during the cooling season.
Guest room setbacks are activated by an automatic climate control system when a card-key is not detected in the card-slot sensor. During unoccupied or unrented periods, the room temperature is set back to 15.6 °C (60 °F) for the heating season and 26.7 °C (80 °F) for the cooling season. To turn on the lights and activate the guest room’s heating and cooling system, a guest must insert the card-key into a card-slot located inside the entryway of the room, which switches the room to occupied mode. When the card-key is removed from the card-slot while exiting the room, the room automatically returns to unoccupied mode, which includes turning off the lights and initiating the temperature setback of the heating and cooling system.
2.2. Temperature, Humidity, and Occupancy Measurements
Twenty guest rooms were selected for the measurements, including all fourteen guest rooms on the sixth floor (i.e., middle floor) and six guest rooms on the tenth floor (i.e., top floor). In each room, portable measuring devices were installed to measure continuous, one-minute data, including: temperature and humidity at the thermostat, temperature and humidity in the room, and occupancy. Table 1 describes the specifications of the instrumentation used for temperature, humidity, and occupancy measurements.
Temperature and humidity were measured with two identical data loggers, one mounted directly below the thermostat for the measurements of temperature and humidity at the thermostat, which is often located near the entrance to the room, and another mounted underneath the desk in the guest room for the measurements of temperature and humidity in the room. In four of the 20 guest rooms, additional variables, including globe temperatures, were measured along with temperature and humidity, which were used to calculate operative temperatures [20]. However, the differences between air temperature and operative temperature was minimal, for which the average difference was less than 0.1 °C, which might be affected by the absence of significant external or internal radiation sources in these guest rooms. As a result, this paper used air temperatures as a primary metric in the analysis.
The occupancy sensor used in this study incorporated the Passive Infrared (PIR) technology to detect the presence of the room’s occupancy in a binary manner (i.e., occupied, unoccupied), which has been used in previous literature to measure occupancy [23,24]. Even though the rooms are equipped with the card-key systems, the hotel’s Property Management System (PMS) does not record guest occupancy status as detected in their card-key systems. Therefore, measurements from the installed PIR sensors were cross-checked against dates of stay as recorded in the hotel’s PMS, including check-in and check-out dates.
PIR sensors are one of the commonly used technologies to detect occupancy presence in buildings for diverse building control applications [13,25,26,27]. One of the limitations of this technology is that it can detect motion only within its field of view [13,26,27], which can be overcome with careful placement of sensors [28]. Therefore, this study mounted the occupancy sensors high on the wall, near the ceiling, facing the open portion of the room, which reasonably detected guest movement throughout the entire guest room.
Another known limitation of PIR sensors is that they are not effective to detect a stationary occupant (e.g., a sleeping person) [26,27], which may result in false-negative errors in occupancy modes, particularly at night times in guest rooms. Therefore, to address the uncertainty associated with this limitation, if the recorded “no occupancy” modes occurred during the nighttime between 7 PM and 9 AM, the temperature and humidity data collected during this time period were excluded from the analysis, as a heuristic solution. In other words, the analysis of the temperature and humidity data when the checked-in rooms were unoccupied included only the data collected during the daytime between 9 AM and 7 PM, while the analysis for the checked-out rooms, as well as the checked-in, occupied rooms included all data collected during the daytime and nighttime.
2.3. Thermal Comfort Survey
A thermal comfort assessment questionnaire survey was distributed to guests staying in the twenty guest rooms that were selected for temperature and humidity measurements. The two-page survey was available in three languages: English, Spanish, and French. The survey questions consisted of an evaluation of four IEQ topics, including: thermal comfort, air quality, lighting, and acoustics, with a background survey (i.e., gender, age, etc.), which was based on the methods in ASHRAE/Chartered Institution of Building Services Engineers (CIBSE)/U.S. Green Building Council (USGBC) Performance Measurement Protocols (PMP) for Commercial Buildings [29]. For each IEQ topic area, the occupant’s satisfaction and self-reported productivity were evaluated using 7-point satisfaction (3: very satisfied, 0: neutral, −3: very dissatisfied) and self-productivity (3: enhances, 0: neutral, −3: interferes) scores. These questions were then followed by branching questions to identify the sources of discomfort.
3. Results
3.1. Classification of the Season
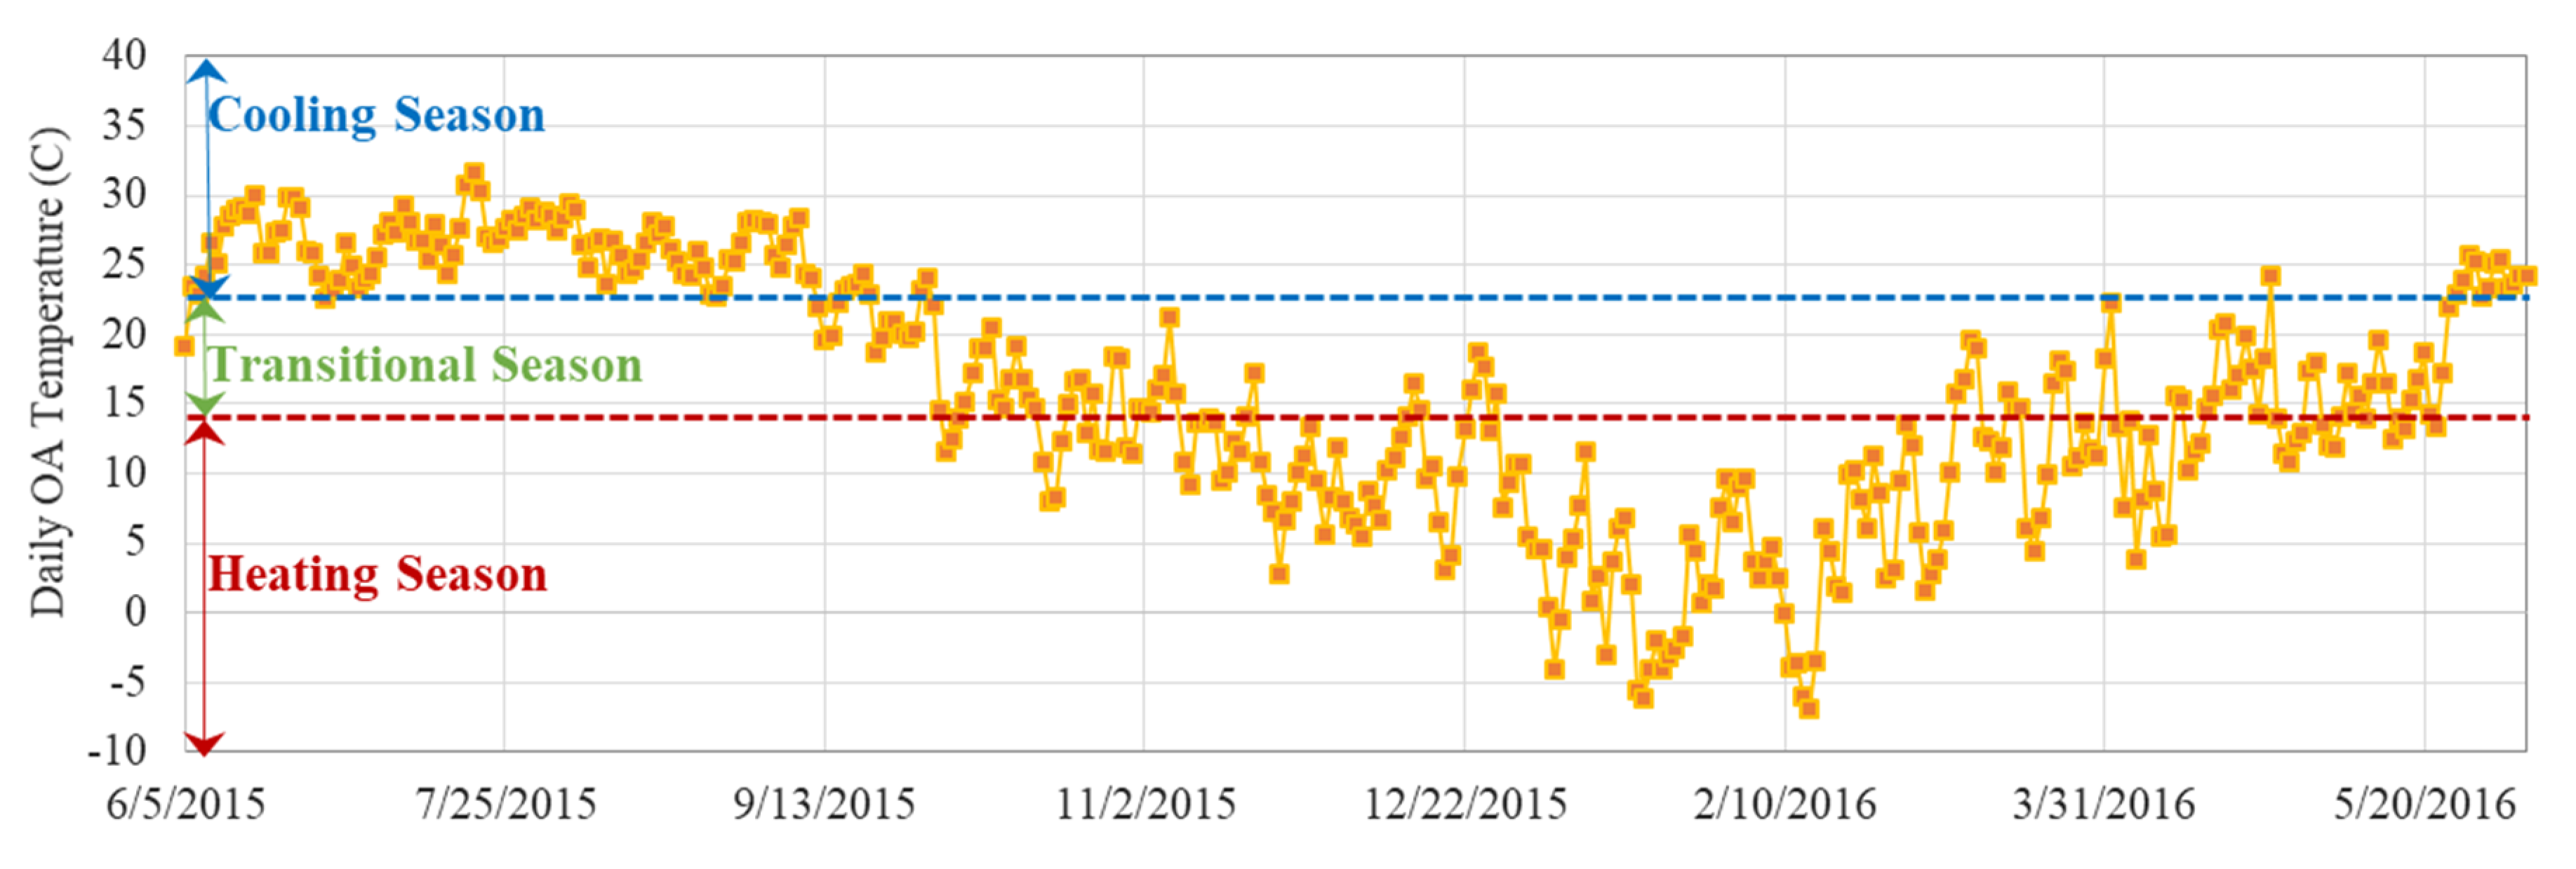
For the analysis, this study classified one-year of data into three seasons (i.e., cooling season, heating season, and transitional season) based on coincident outdoor air temperature, as shown in Figure 1. For the classification, the days when the daily average outdoor air temperature was below 14.4 °C (60 °F) were considered the heating season, where 14.4 °C (60 °F) was the outdoor air temperature below which the hotel’s DOAS was in heating mode. The days when the daily average outdoor air temperature was above 22.2 °C (72 °F) were considered the cooling season, where 22.2 °C (72 °F) was the average setpoint temperatures in the rooms in the cooling season based on a preliminary analysis of the measured data. The days when the daily average outdoor air temperature was between 14.4 °C (60 °F) and 22.2 °C (72 °F) were considered to be in the transitional season.
3.2. Thermal Comfort Survey
A total of 205 subjective surveys were collected: 75 during the cooling season, 76 during the heating season, and 54 during the transitional season. Of the 205 responses received, 12% of the respondents were 29 years old or younger, 23% were 30–39 years old, 28% were 40–49 years old, 26% were 50–59 years old, and 10% were 60 or older. About 65% of respondents were male. More than 90% of respondents were business travelers and stayed alone in their rooms. The respondents traveled from different continents: 33% from North America; 23% from Europe; 18% from Asia; 13% from Africa; 12% from South America; and 1% from Australia. Regardless of season, the most common clothing value worn by respondents was 0.57 clo, which was indicated by 38% of respondents. The most common activity the respondents engaged in was sleeping with a median value of 70% of time spent while staying in the room, followed by sedentary activities with a median value of 15% of time.
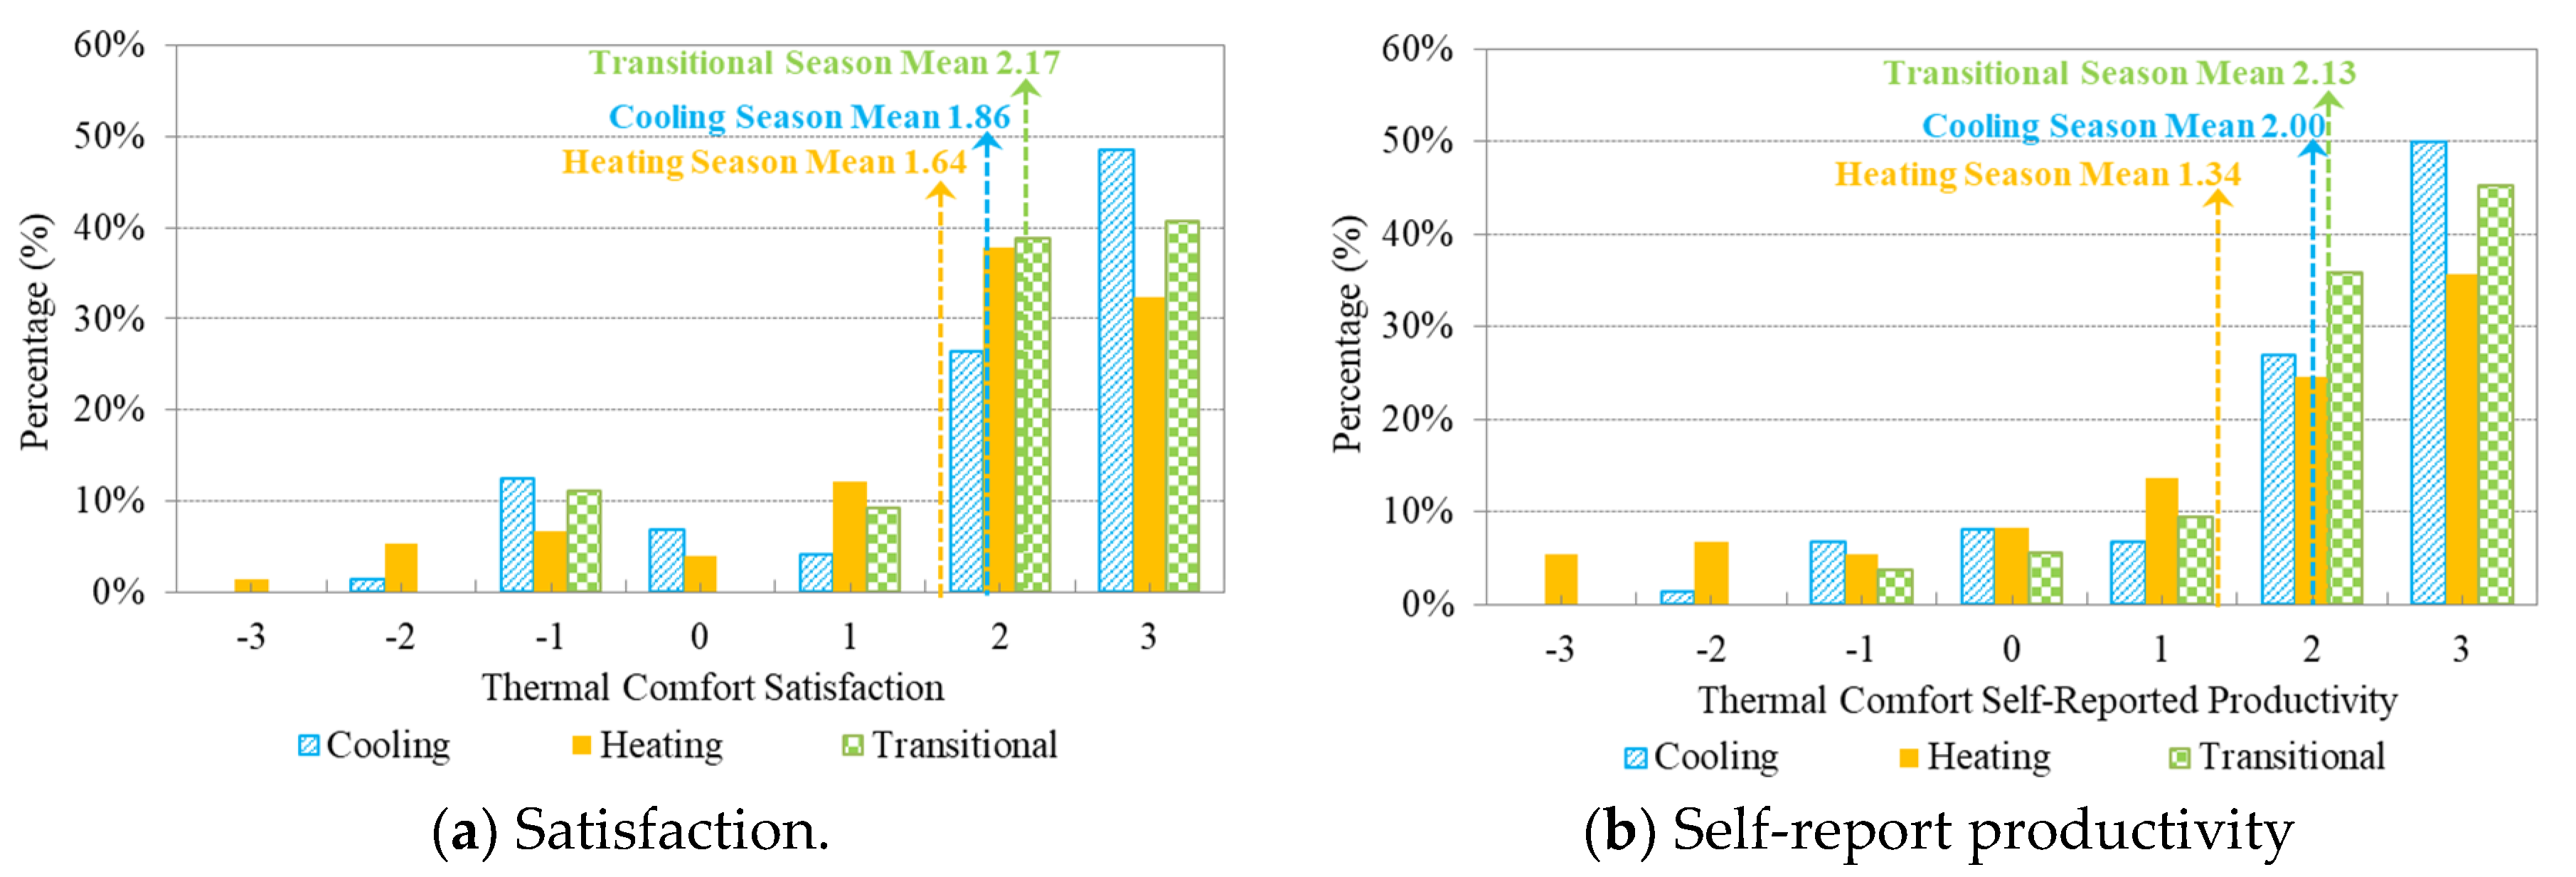
Figure 2 presents the frequency distributions of surveyed thermal comfort satisfaction and self-reported productivity by seasons (i.e., cooling season, heating season, and transitional season) based on a seven-point scale with the mean scores: (a) satisfaction (3: very satisfied, 0: neutral, −3: very dissatisfied) and (b) self-reported productivity (3: enhanced, 0: neutral, −3: interfered). On average, the survey participants were highly satisfied with their thermal environments: 1.86 for the cooling season; 1.64 for the heating season; and 2.17 for the transitional season. The surveyed, self-reported productivity scores were also high, which were 2.00 for the cooling season, 1.34 for the heating season, and 2.13 for the transitional season on average. The surveyed high satisfaction with thermal environments was notable when considering the fact the guest rooms were equipped with a card-key based automatic climate control system indicating potential discomfort when guests first entered their rooms. The highest scores for thermal satisfaction and self-reported productivity reported for the transitional season might be affected by smaller temperature drifts during unoccupied hours.
Frequency-wise, about 14% (cooling season), 14% (heating season), and 11% (transitional season) of respondents were dissatisfied with their thermal environments, which was lower than the 20% unacceptability limit (i.e., 80% acceptability limit for typical applications), but higher than the 10% unacceptability limit (i.e., 90% acceptability limit for applications requiring a higher standard) based on the ASHRAE Standard 55-2017 [30]. For self-reported productivity, about 8% (cooling season), 18% (heating season), and 4% (transitional season) of respondents reported that the perceived thermal comfort in their guest rooms interfered with their job performance.
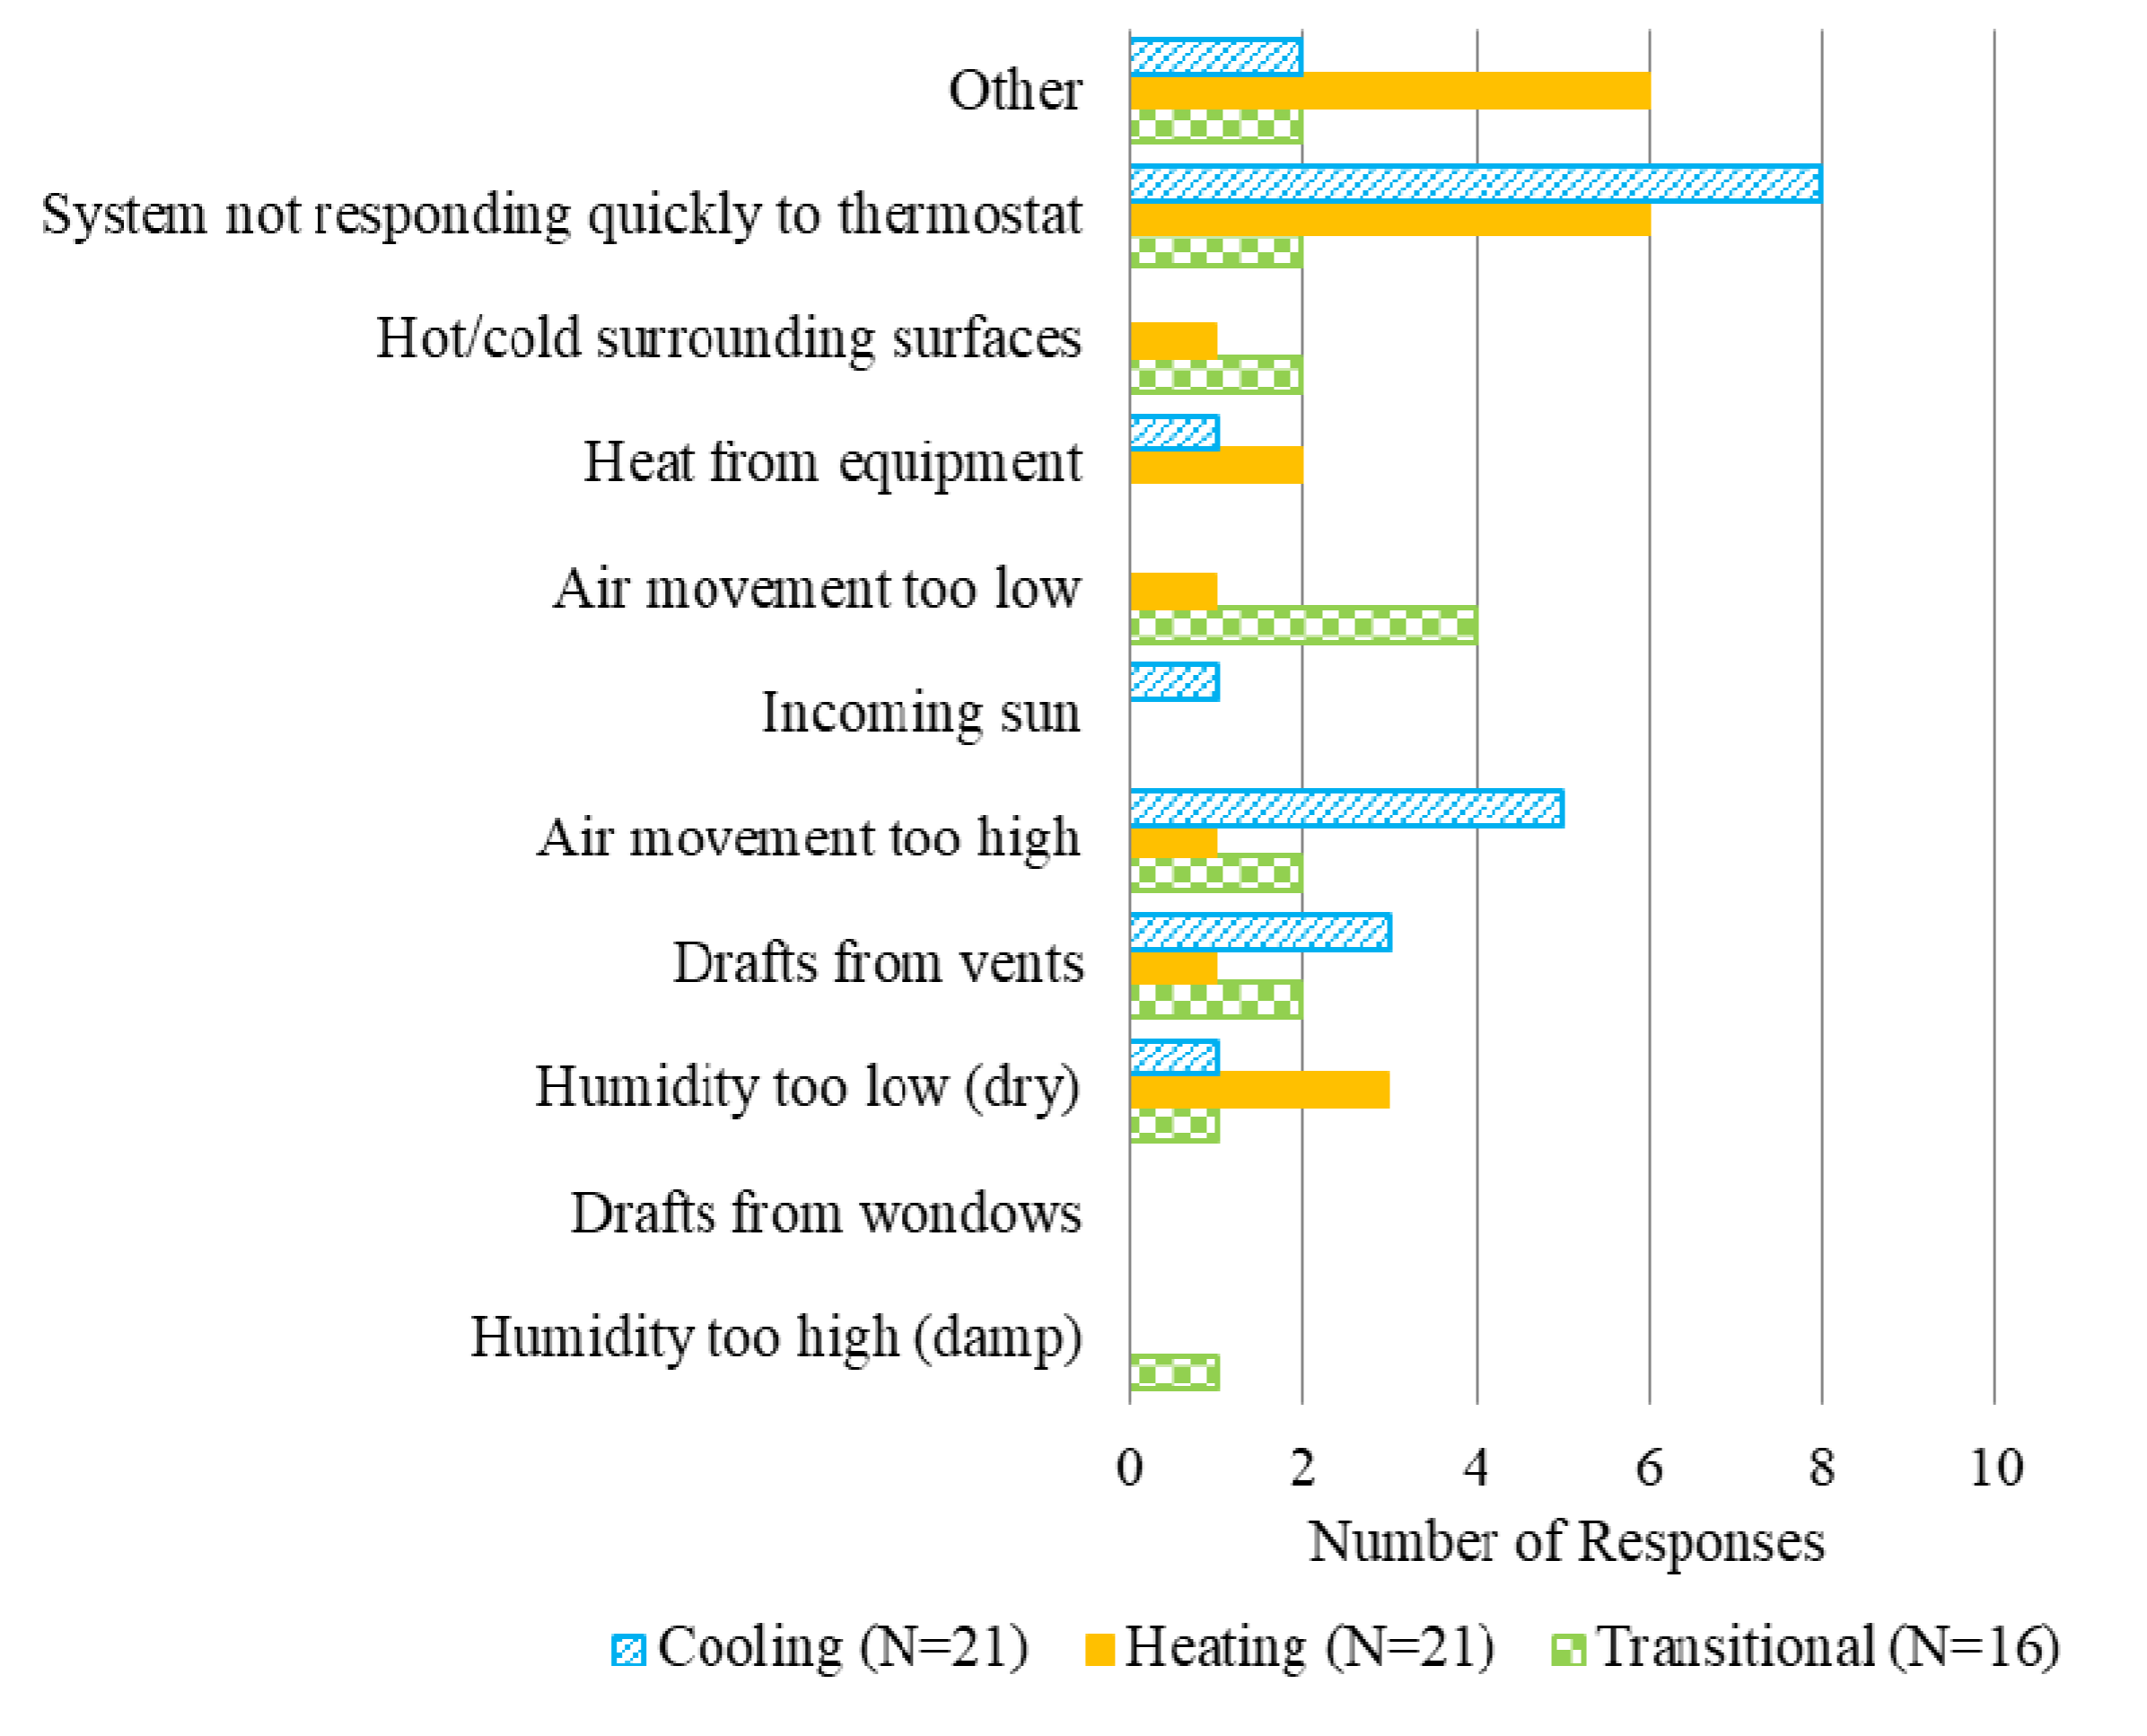
Figure 3 presents the responses to the branching questions that asked the sources of thermal discomfort. For cooling and heating seasons, the common major sources of thermal discomfort were related to the thermostat, including the mechanical system not responding quickly to the thermostat changes. Other responses during the heating season also indicated that the low set-back temperatures made the room too cold when the guest entered the room. However, the major discomfort source during the transitional season was too low air movement. During the summer season, too high air movement and drafts from vents were also reported as the second highest discomfort sources, which might be affected by a constant supply of conditioned cool outdoor air at around 17.8 °C (64 °F) from the hotel’s DOAS to the rooms when it was in the cooling mode.
3.3. Variations by Occupancy Modes
Table 2 and Table 3 present the temperature (Table 2) and relative humidity (Table 3) data for each room for three different occupancy modes (i.e., occupied when the room was checked-in, unoccupied when the room was checked-in, and unoccupied when the room was checked-out) by season (i.e., cooling season, heating season, and transitional season) from 5 June 2015 to 4 June 2016. On average, the rooms were checked-out for 55% of the time during the heating season, 47% of the time during the cooling season, and 41% of the time during the transitional season. The average temperature and humidity measured at the thermostat, which were not included in the tables for simplicity, showed similar values as the temperature and humidity measured in the room with an average difference of 0.3 °C (0.54 °F) and 0.7% RH. The rooms numbered 1 and 15 were excluded from the average calculations in the tables because they exhibited somewhat different temperature and humidity trends (i.e., lower temperature, higher RH) from the other rooms. This was because of large amounts of conditioned OA from the DOAS due to incorrectly designed ductwork. Follow-up measurements found that these rooms had about 0.118 m3/s (250 cubit fit per minute (cfm)) OA ventilation, which was over three times the design rate of a guest room at the case-study hotel: 0.033 m3/s (70 cfm).
In check-in, occupied rooms, there was a higher temperature and humidity difference by room during the cooling season than the other seasons, which varied about 5 °C (9 °F) by room (i.e., from 21.1 °C to 26.1 °C (70.0 °F to 79.0 °F)) and about 11.7%RH by room (i.e., from 44.2%RH to 56.0%RH). However, the room-to-room temperature and humidity variations were 2 °C (3.6 °F) (i.e., from 22.6 °C to 24.6 °C (72.7 °F to 76.3 °F)) and 7.9%RH (i.e., from 31.6% RH to 39.5% RH) during the heating season and 3.1 °C (5.6 °F) (i.e., from 22.4 °C to 25.5 °C (72.3 °F to 77.9 °F)) and 7.9% RH (i.e., from 39.9%RH to 47.8%RH) during the transitional season. It was also found that the temperature data collected during the heating season tended to have a larger dispersion than the cooling season with higher standard deviations varying from 1.4 °C to 3.6 °C (2.5 °F to 6.5 °F), while it varied from 1.0 °C to 1.7 °C (1.8 °F to 3.1 °F) during the cooling season. These observed variations in temperatures between the check-in, occupied rooms indicated individual differences in the preferred comfort temperatures of random guests mainly from five different continents since the temperatures of the checked-in, occupied rooms were likely to be controlled by the guests. Individual differences in thermal comfort were recognized in previous literature although there were no clear consistent conclusions between studies, as recently reviewed by Wang et al. [31]. This also indicated a need to examine common assumptions on constant setpoint temperatures in energy simulation of guest rooms.
Similar trends (i.e., higher room-to-room temperature variations during the cooling season with smaller standard deviations) were also observed with other occupancy modes, which was easier to observe in the check-out rooms when the rooms were unoccupied for a longer time span. The room-to-room temperature and humidity variations of the twenty check-out rooms were 9.1 °C (16.4 °F) (i.e., from 19.0 °C to 28.1 °C (66.2 °F to 82.6 °F)) with a standard deviation from 0.6 °C to 2.3 °C (1.1 °F to 4.1 °F) by room and 20.9%RH (i.e., from 39.9% RH to 60.8% RH) with a standard deviation from 2.5% RH to 5.5% RH by room during the cooling season. During the heating season, the variations were smaller, but with higher standard deviations: 4.1 °C (7.4 °F) (i.e., from 18.7 °C to 22.8 °C (65.7 °F to 73.0 °F)) with a standard deviation from 1.1 °C to 2.8 °C (2.0 °F to 5.0 °F) by room and 6.7% RH (i.e., from 29.9% RH to 36.6% RH) with a standard deviation from 7.4% RH to 12.1% RH by room.
Meaningful differences were observed in the average temperatures of the checked-in rooms between occupied and unoccupied modes (i.e., TOcc − TUnOcc) during the heating season, which varied from 0.3 °C to 1.7 °C (0.5 °F to 3.1 °F) by room. A positive difference indicated that the unoccupied rooms were colder than the occupied rooms, which was expected during the heating season. However, the temperature differences were less obvious between occupied and unoccupied modes of the checked-in rooms during the cooling and transitional season, which varied from −0.8 °C to 0.5 °C (−1.4 °F to 0.9 °F) during the cooling seasons; and from −0.2 °C to 1.0 °C (−0.4 °F to 1.8 °F) during the transitional seasons. This resulted from a constant supply of conditioned outdoor air at around 17.8 °C (64 °F) from the hotel’s DOAS to the rooms (i.e., 24 h per day, seven days per week) when it was in the cooling mode, which created similar thermal environments between occupied and unoccupied modes.
Larger differences were observed in the average temperatures between checked-in rooms and checked-out rooms. The average temperature differences between checked-in, occupied, and checked-out rooms (i.e., TOcc − TChecked-Out) varied from 1.1 °C to 4.8 °C (2.0 °F to 8.6 °F) during the heating season, from −2.0 °C to 2.8 °C (−3.6 °F to 5.0 °F) during the cooling season, and from 0.1 °C to 2.7 °C (0.2 °F to 4.9 °F) during the transitional season. A positive difference indicated that the checked-out rooms were colder than the checked-in, occupied rooms, while a negative difference indicated the opposite. Thus, in the heating season, there was a clear trend of temperature drops when the rooms were checked-out, which was expected. However, in the cooling season, the average temperatures of the checked-out rooms were not always higher than the average temperatures of the checked-in, occupied rooms, which was contrary to expectation. This meant that the card-key based automatic climate control system used in the case-study hotel might not be generating the intended energy savings in the cooling season due to the unexpected interaction with the DOAS.
Surprisingly, there were no obvious trends in the average indoor relative humidity levels of the twenty rooms across the different occupancy modes, which was partially affected by the temperature-dependent nature of the metric, relative humidity. However, as expected, there was a seasonal variation in the measured relative humidity levels. The measurements showed that the average relative humidity of the checked-in, occupied rooms varied from 31.6% to 39.5% during the heating season, from 44.2% to 56.0% during the cooling season, and from 39.9% to 47.8% during the transitional season. These ranges were well within the optimum relative humidity range reported by Sterling et al. [32] and more recently by Derby and Roger [33], which were between 30% and 60%. A detailed analysis of the variations observed in the measured absolute humidity is provided in the section of the paper: Section 4.3 Relationship between Outdoor and Indoor Humidity.
3.4. Variations by Location of Guest Rooms
When viewed by location, the rooms on the tenth floor (i.e., top floor) tended to have warmer temperatures during the cooling season than the rooms on the sixth floor. This tendency became more pronounced when the rooms were checked-out. The average temperature difference (i.e., T10th − T6th) of checked-out rooms was 2.9 °C (5.2 °F) during the cooling season. In addition, the rooms on the tenth floor tended to have higher temperatures when the rooms were checked-out compared to checked-in, which implied that there was a temperature drift in the checked-out rooms during the cooling season. However, for most rooms on the sixth floor, with some exceptions (i.e., rooms numbered 8, 10, 13, and 14), the average temperatures of the checked-out rooms were slightly lower or similar to the average temperatures of the checked-in rooms. This indicated that the rooms on the tenth floor had a higher level of external loads, which caused a temperature drift when the rooms were not occupied for a longer time span.
When viewed by orientation, the rooms on the west side of the building tended to have warmer temperatures than the rooms on the east side of the building. This trend was easier to see when the rooms were checked-out during the cooling season. The average temperature differences (i.e., Twest − Teast) of checked-out rooms were 0.2 °C (0.4 °F) during the heating season, 1.2 °C (2.2 °F) during the cooling season, and 0.8 °C (1.4 °F) during the transitional season.
4. Discussion
4.1. Time-of-Day Analysis
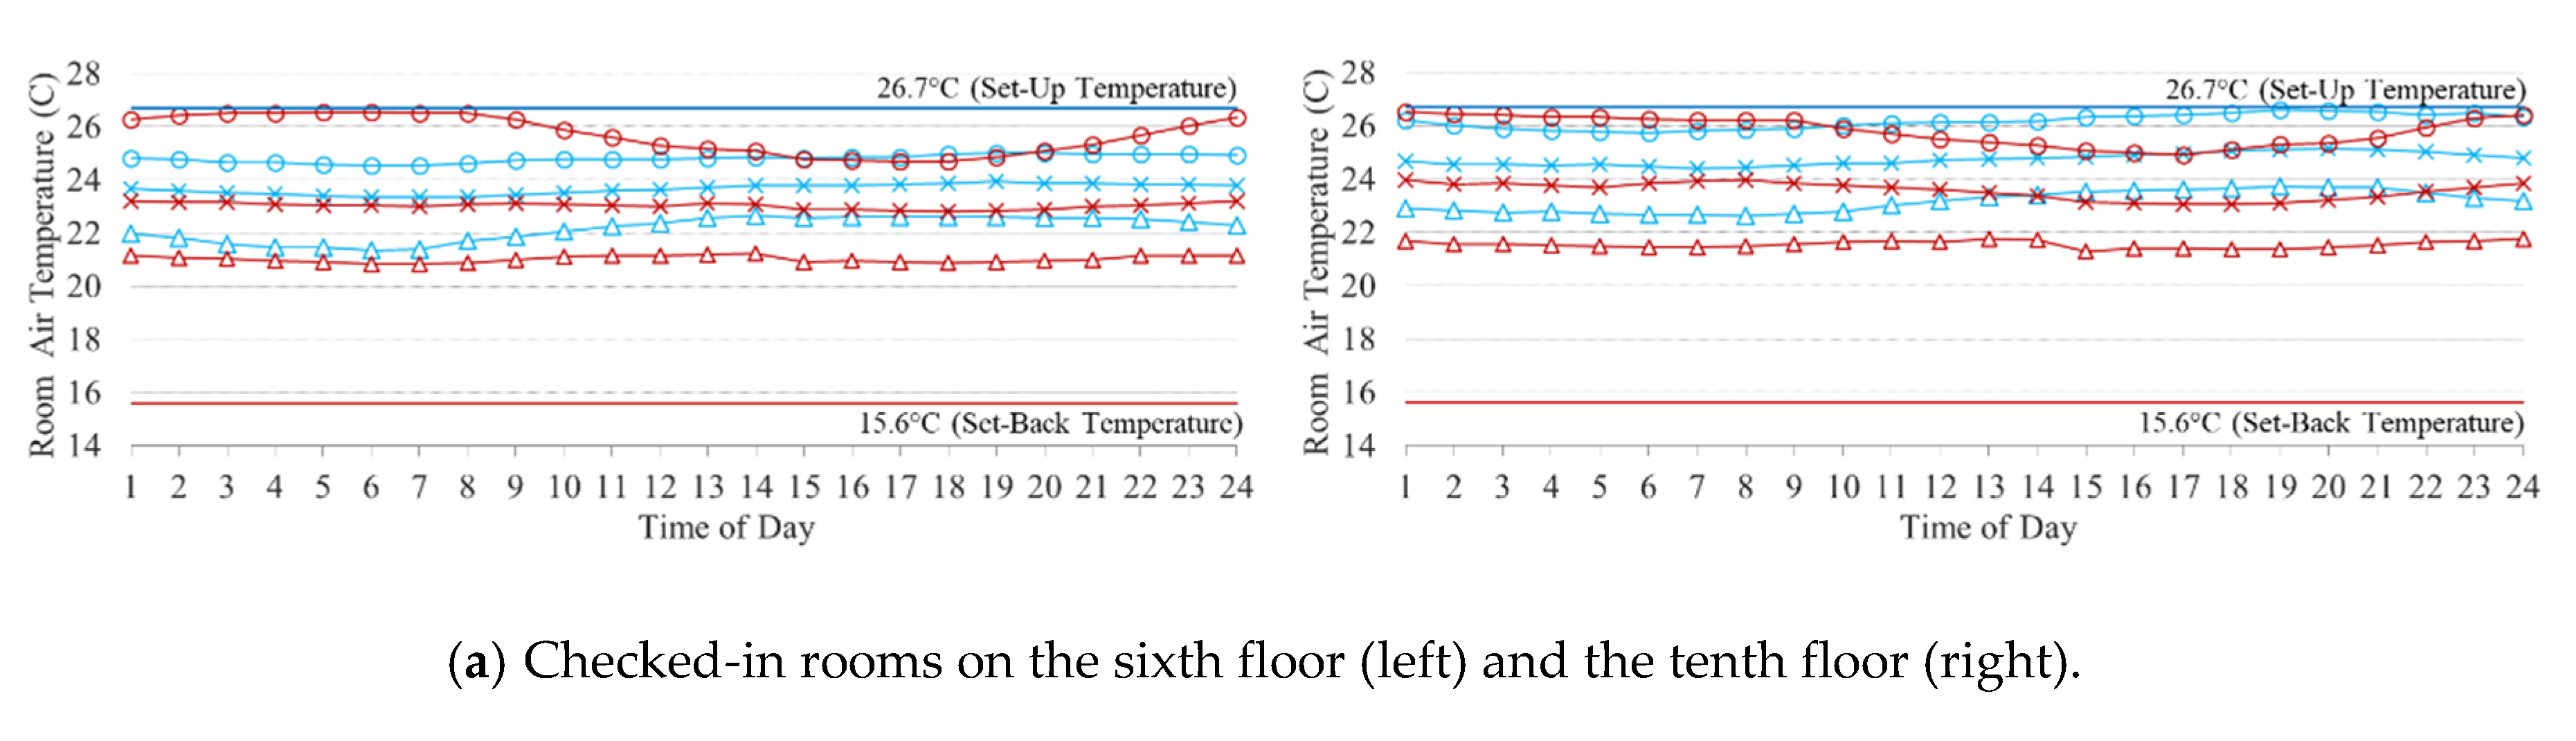
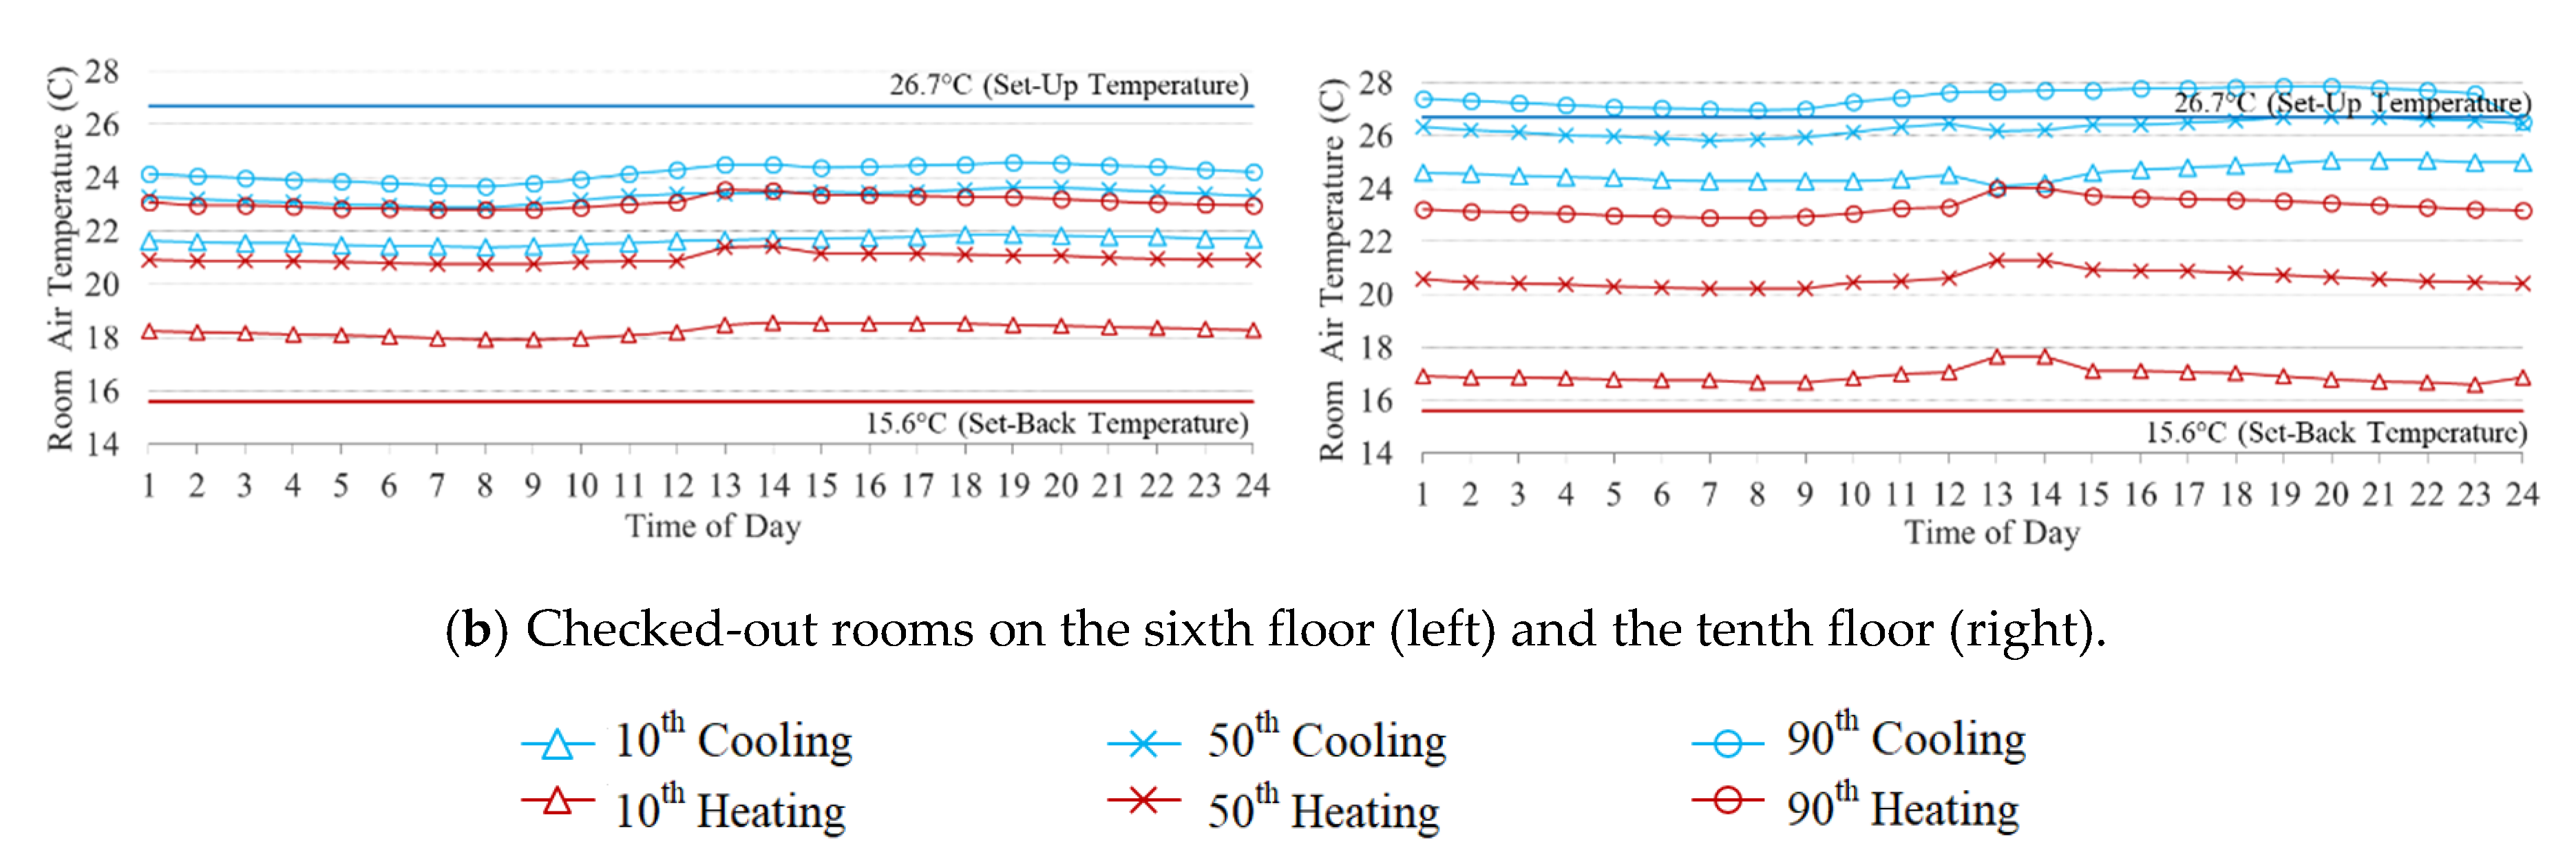
This study also performed a time-of-day analysis of the measured room temperature data for checked-in versus checked-out rooms. The methodology used to derive the hourly temperature profiles of the eighteen rooms, excluding rooms numbered 1 and 15, was based on the ASHRAE Research Project 1093 Diversity Factor procedure [34], which calculated and displayed the 10th, 25th, 50th, 75th, and 90th percentiles, as well as minimum, mean, and maximum values being reported for each hour of the day. Figure 4 shows the resultant 10th, 50th, and 90th percentiles of the average hourly room temperature profiles for the 18 rooms for three season (i.e., blue lines for cooling season; red lines for heating season) and by location (i.e., thirteen rooms on the sixth floor; five rooms on the tenth floor) when the rooms were: (a) checked-in versus (b) checked-out.
The time-of-day temperature variations of the checked-in rooms followed the expected patterns of temperature drifts when the rooms were unoccupied roughly between 10 AM and 6 PM: decreased 90th percentile heating temperature profile; and increased 10th percentile cooling temperature profile. The observed temperature drifts were steady and gradual in this highly insulated hotel building. In addition, it was observed that the temperature drifts were smaller during the cooling season (i.e., blue lines) due to a constant supply of conditioned OA ventilation at a relatively low temperature. It was also noted that the day-to-day variations (i.e., 10th vs. 90th) were much larger than hourly variations, which might indicate different setpoint temperatures of the guest rooms by different guests due to individual differences in preferred temperatures. Finally, it was observed that when the rooms were occupied, the temperature profiles were almost flat until early morning.
The time-of-day temperature variations of the checked-out rooms were flatter with higher day-to-day variations as revealed by differences between the 10th and 90th percentiles. The measured day-to-day variations during the heating season were much larger than those during the cooling season. It was also found that there was a clear difference in room temperatures between checked-in rooms (Figure 4a) and checked-out rooms (Figure 4b) during the heating season, which was larger in the rooms on the tenth floor. The average 10th percentile heating temperature profile of the checked-out rooms on the tenth floor approached the set-back temperature, 15.6 °C (60 °F), while their average 90th percentile cooling temperature profile was slightly above the set-up temperature, 26.7 °C (80 °F). This seemed to indicate that the tested OBCC system had a higher potential for energy savings during the heating season in the rooms on the tenth floor, although such setbacks may create periods of uncomfortable conditions.
The time-of-day temperature variations of the checked-out rooms were flatter with higher day-to-day variations as revealed by differences between the 10th and 90th percentiles. The measured day-to-day variations during the heating season were much larger than those during the cooling season. It was also found that there was a clear difference in room temperatures between checked-in rooms (Figure 4a) and checked-out rooms (Figure 4b) during the heating season, which was larger in the rooms on the tenth floor. The average 10th percentile heating temperature profile of the checked-out rooms on the tenth floor approached the set-back temperature, 15.6 °C (60 °F), while their average 90th percentile cooling temperature profile was slightly above the set-up temperature, 26.7 °C (80 °F). This seemed to indicate that the tested OBCC system had a higher potential for energy savings during the heating season in the rooms on the tenth floor, although such setbacks may create periods of uncomfortable conditions.
This potential discomfort was also identified from the collected thermal comfort survey. During the heating season, about 57% of the surveyed discomfort sources were related to the thermostat, including the mechanical system not responding quickly to the thermostat changes; and low set-back temperatures made the room too cold when the guest entered the room. However, overall, only 14% of survey participants expressed dissatisfaction with their thermal environment. This indicated that the OBCC system was still widely accepted at the case-study hotel, which might be also affected by the recovery time (i.e., the time required for the room temperature to return to the benchmark condition) of the heating system in the guest rooms and guests’ tolerance for these undesirable conditions.
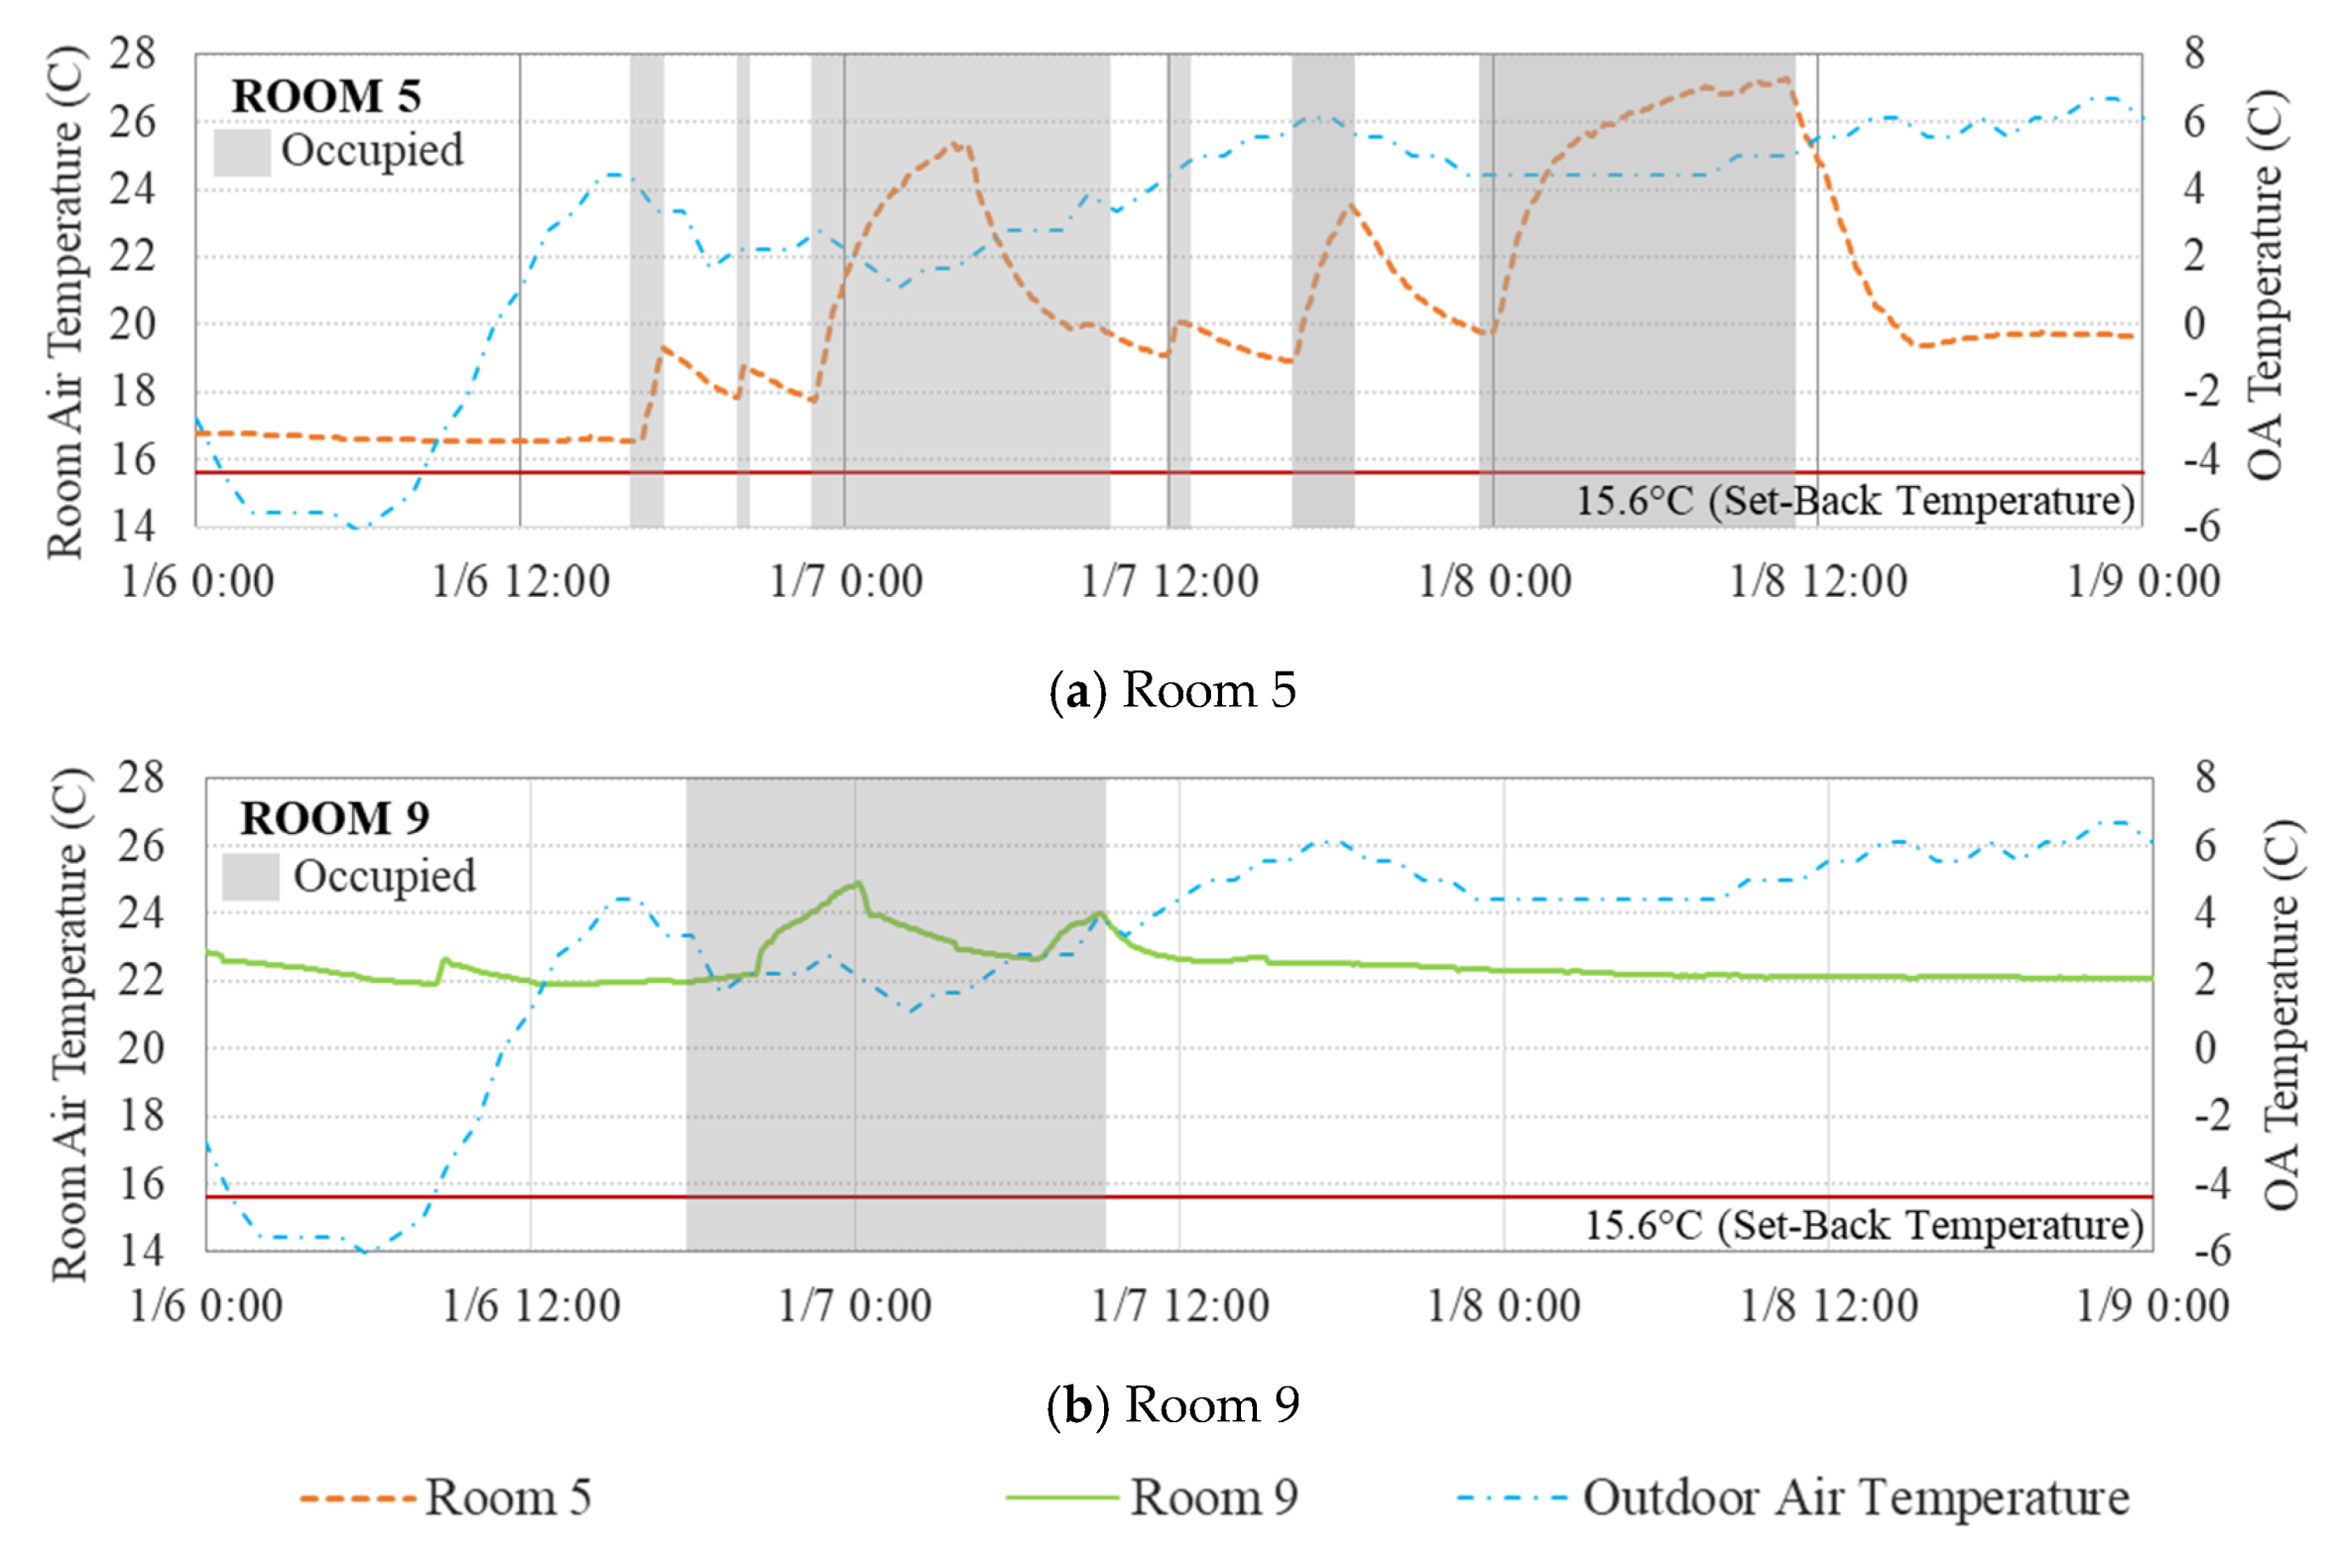
To better analyze the surveyed dissatisfaction during the heating season, the temperatures measured in the rooms where the thermally-dissatisfied guests stayed were compared with the temperatures measured in other nearby rooms on the same floor where the guests did not complain. As an example of this comparison, Figure 5 shows a time-series plot of the 5 min interval temperatures measured in the room with a dissatisfied guest (i.e., Room 5) along with the temperatures measured in the room next door (i.e., Room 9) during the same measurement period over one three day period from 6 to 8 January 2016.
An analysis of the data indicated that the two rooms had quite different rates of heat loss during the same outdoor weather conditions. A higher heat loss occurred in Room 5 where the guests complained about the cold thermal conditions when they entered the room. This resulted in lower room temperatures between 18 °C (64.4 °F) and 19 °C (66.2 °F) when Room 5 was not occupied, which also caused a higher temperature difference between the occupied (i.e., temperature set by the guests) and unoccupied period. The recovery time calculated for Room 5 was 1.5 h when 22.2 °C (72 °F) was used as a benchmark temperature, which was the temperature of Room 9 when the room was checked-out.
4.2. Relationship between Outdoor and Indoor Temperature
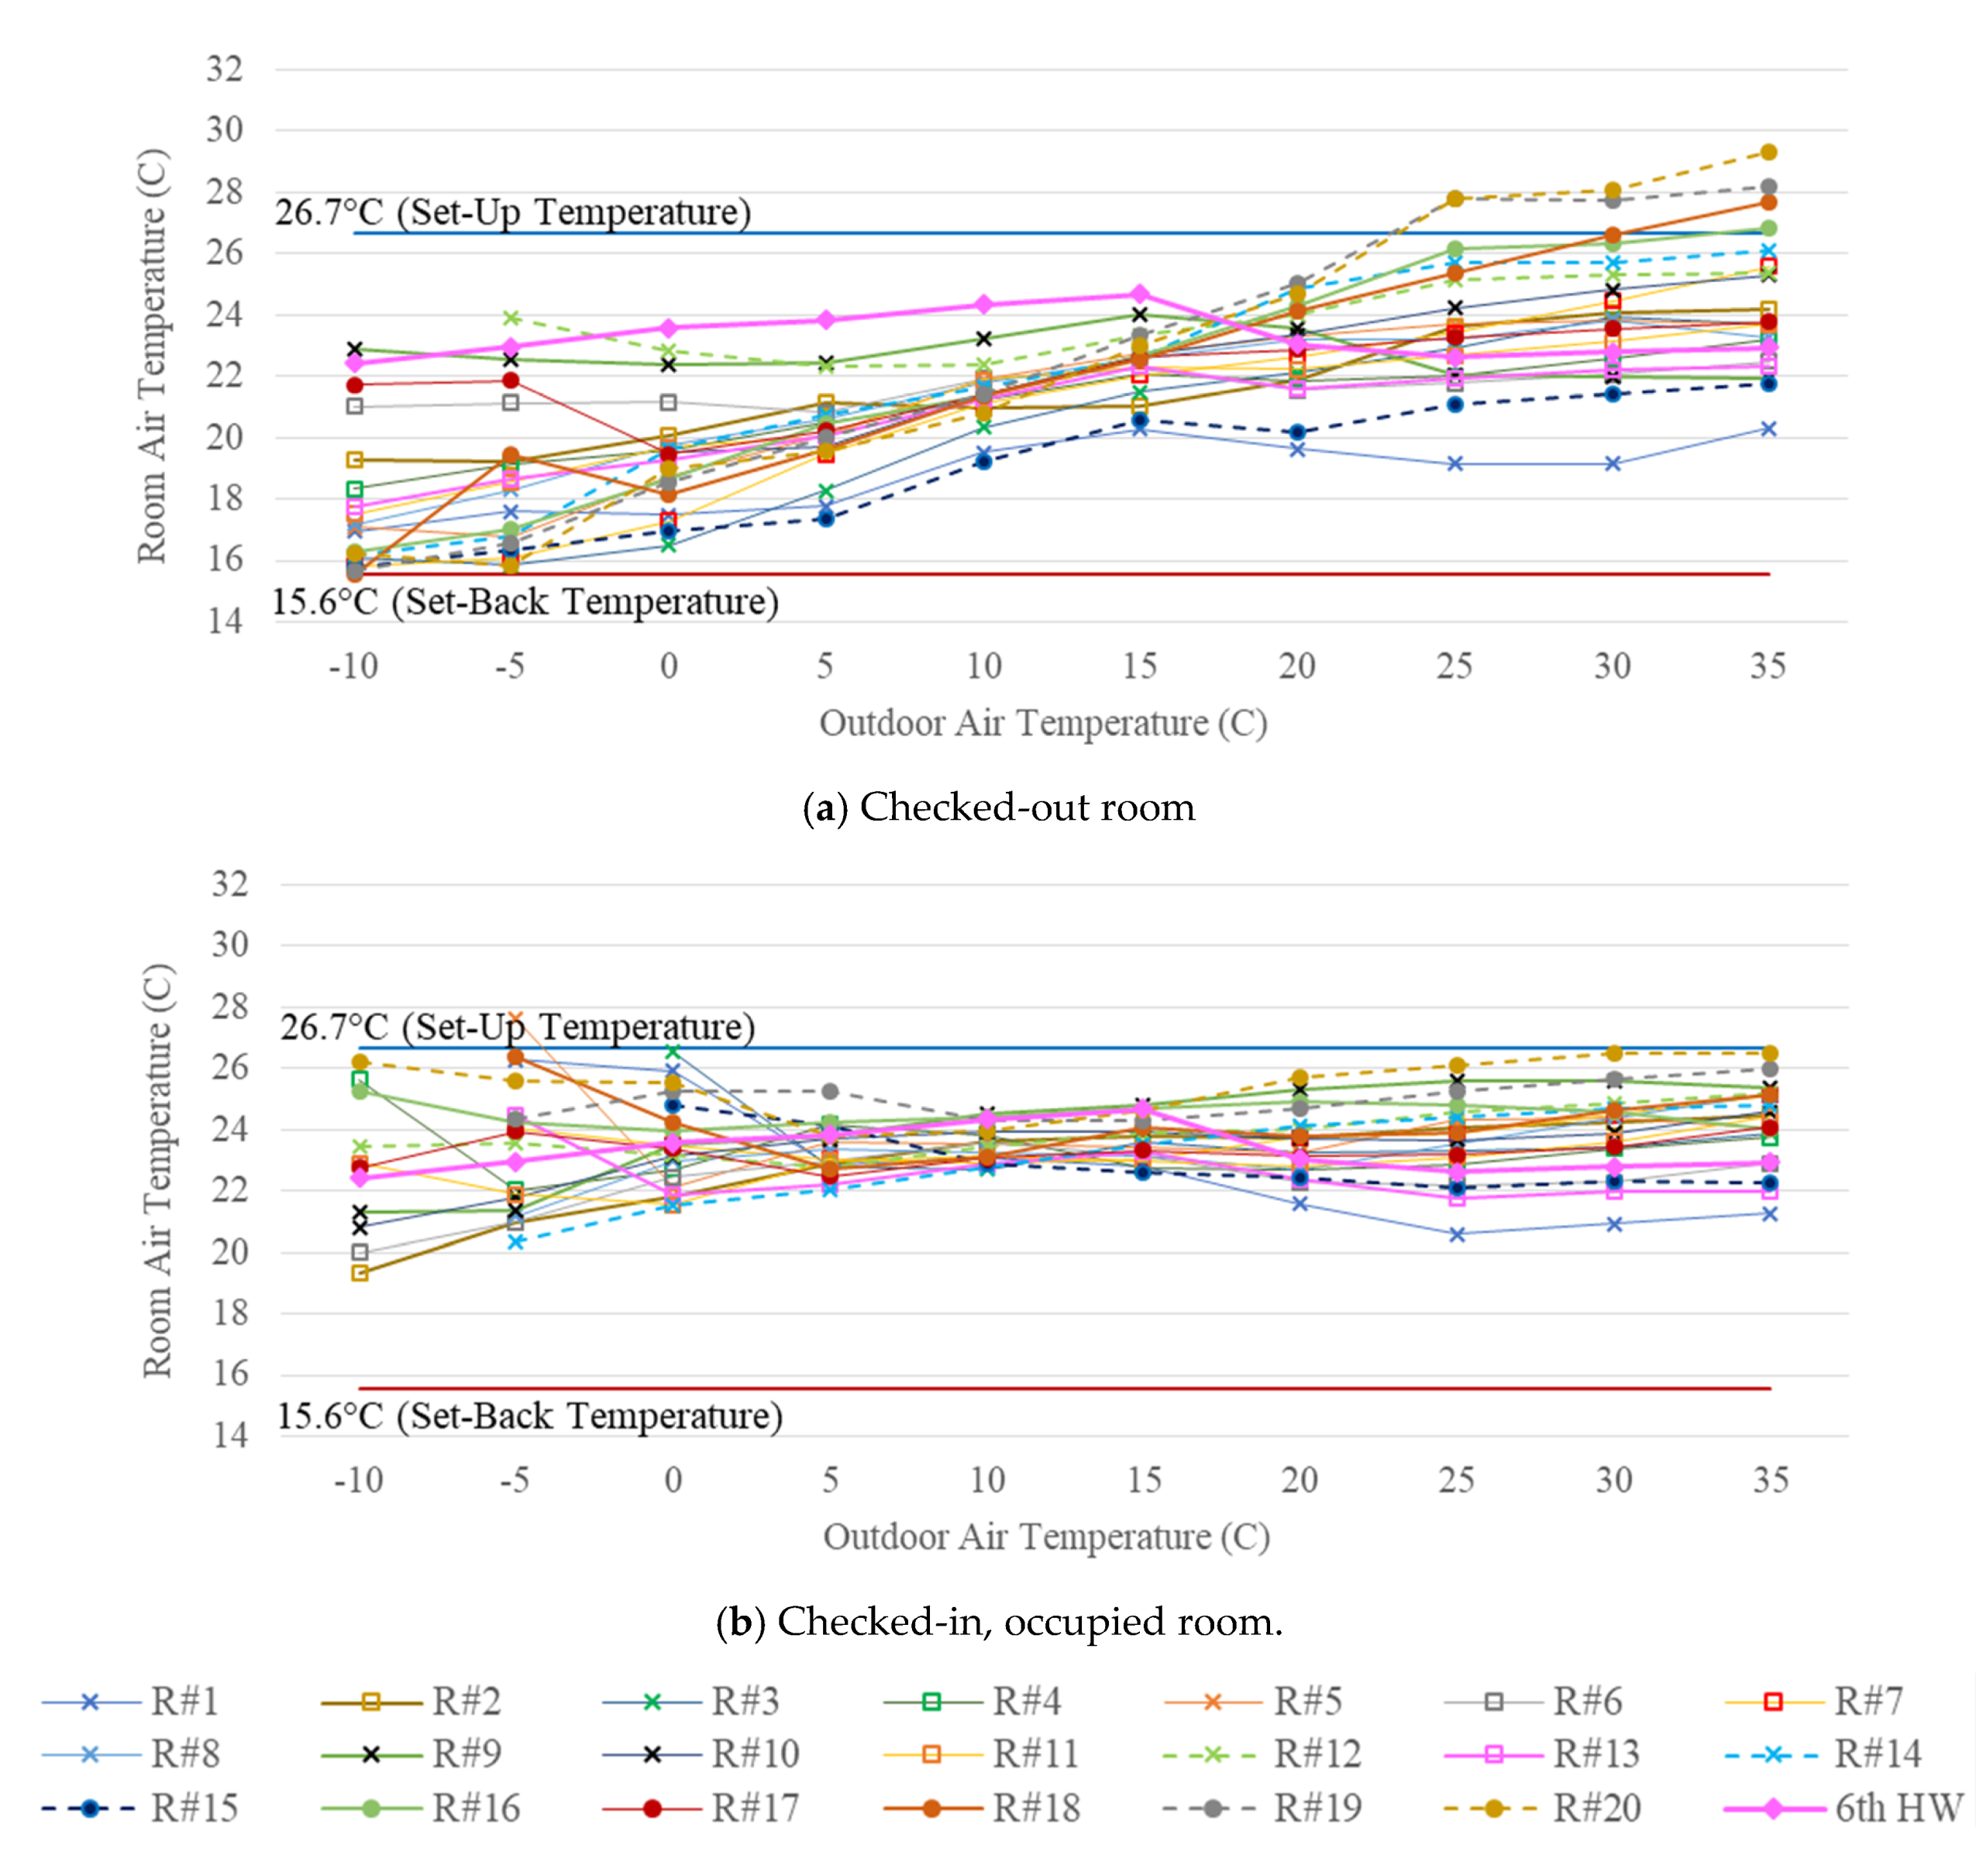
To confirm the observed room-to-room variations in heat losses and resultant indoor temperatures, this study examined how outdoor temperature and humidity were related to indoor temperature and humidity by occupancy modes using a 5 °C (9 °F) binned quartile analysis (i.e., a box-and-whisker plot). The box-and-whisker plot, which has been commonly used in statistics, allowed displaying building performance data in an informative and visually effective form [35]. To accomplish this, the indoor temperatures measured in each room were characterized using the binned box-and-whisker plots for three different occupancy modes, where the 25th, 50th, and 75th percentiles, as well as the minimum, mean, and maximum values were arranged against outdoor temperatures binned into 5 °C (9 °F) bins. The plots for all twenty guest rooms are provided as supplementary documents (Supplementary Figure S1). Figure 6 displays the median values of all twenty rooms and the sixth-floor hallway for: (a) checked-out room; and (b) checked-in, occupied room conditions.
When the rooms were checked-out, some rooms appeared to have a stronger association between outdoor and indoor temperatures, including Room 5, which had a dissatisfied guest. This resulted in a lower balance-point temperature near the set-back temperature, 15.6 °C (60 °F), in these checked-out rooms during the heating season, but a higher balance-point temperature during the cooling season near the set-up temperature, 26.7 °C (80 °F). This trend appeared to be stronger in the checked-out rooms on the tenth floor with median indoor temperatures higher than 26.7 °C (80 °F) during the cooling season. However, there were also rooms where the indoor temperatures were relatively constant across different outdoor temperature bins, including the rooms numbered 6, 9, and 12. It was also noted that the observed room-to-room variations in the measured indoor temperatures had a larger variation at either the higher or lower outdoor temperatures.
When the rooms were checked-in and occupied, the relation between outdoor and indoor temperatures was less clear. Some rooms exhibited inverse relations between outdoor and indoor temperatures during the heating season. Like checked-out rooms, the room-to-room variations were larger at either the higher or lower outdoor temperatures. The two rooms that had larger volumes of conditioned OA ventilation (i.e., Rooms 1 and 15) showed the lowest median indoor temperatures during the cooling season, which was an indicator for potential guest discomfort due to uncontrollable, low temperatures in these two rooms. In the subjective IEQ assessment, out of 75 completed surveys, only two surveys were completed by the guests staying in these two rooms during the cooling season. However, both guests complained that the room was too cold because of the mechanical system not responding quickly enough to thermostat changes; and cold drafts from the OA diffuser were reported even though the guest had turned off the AC system.
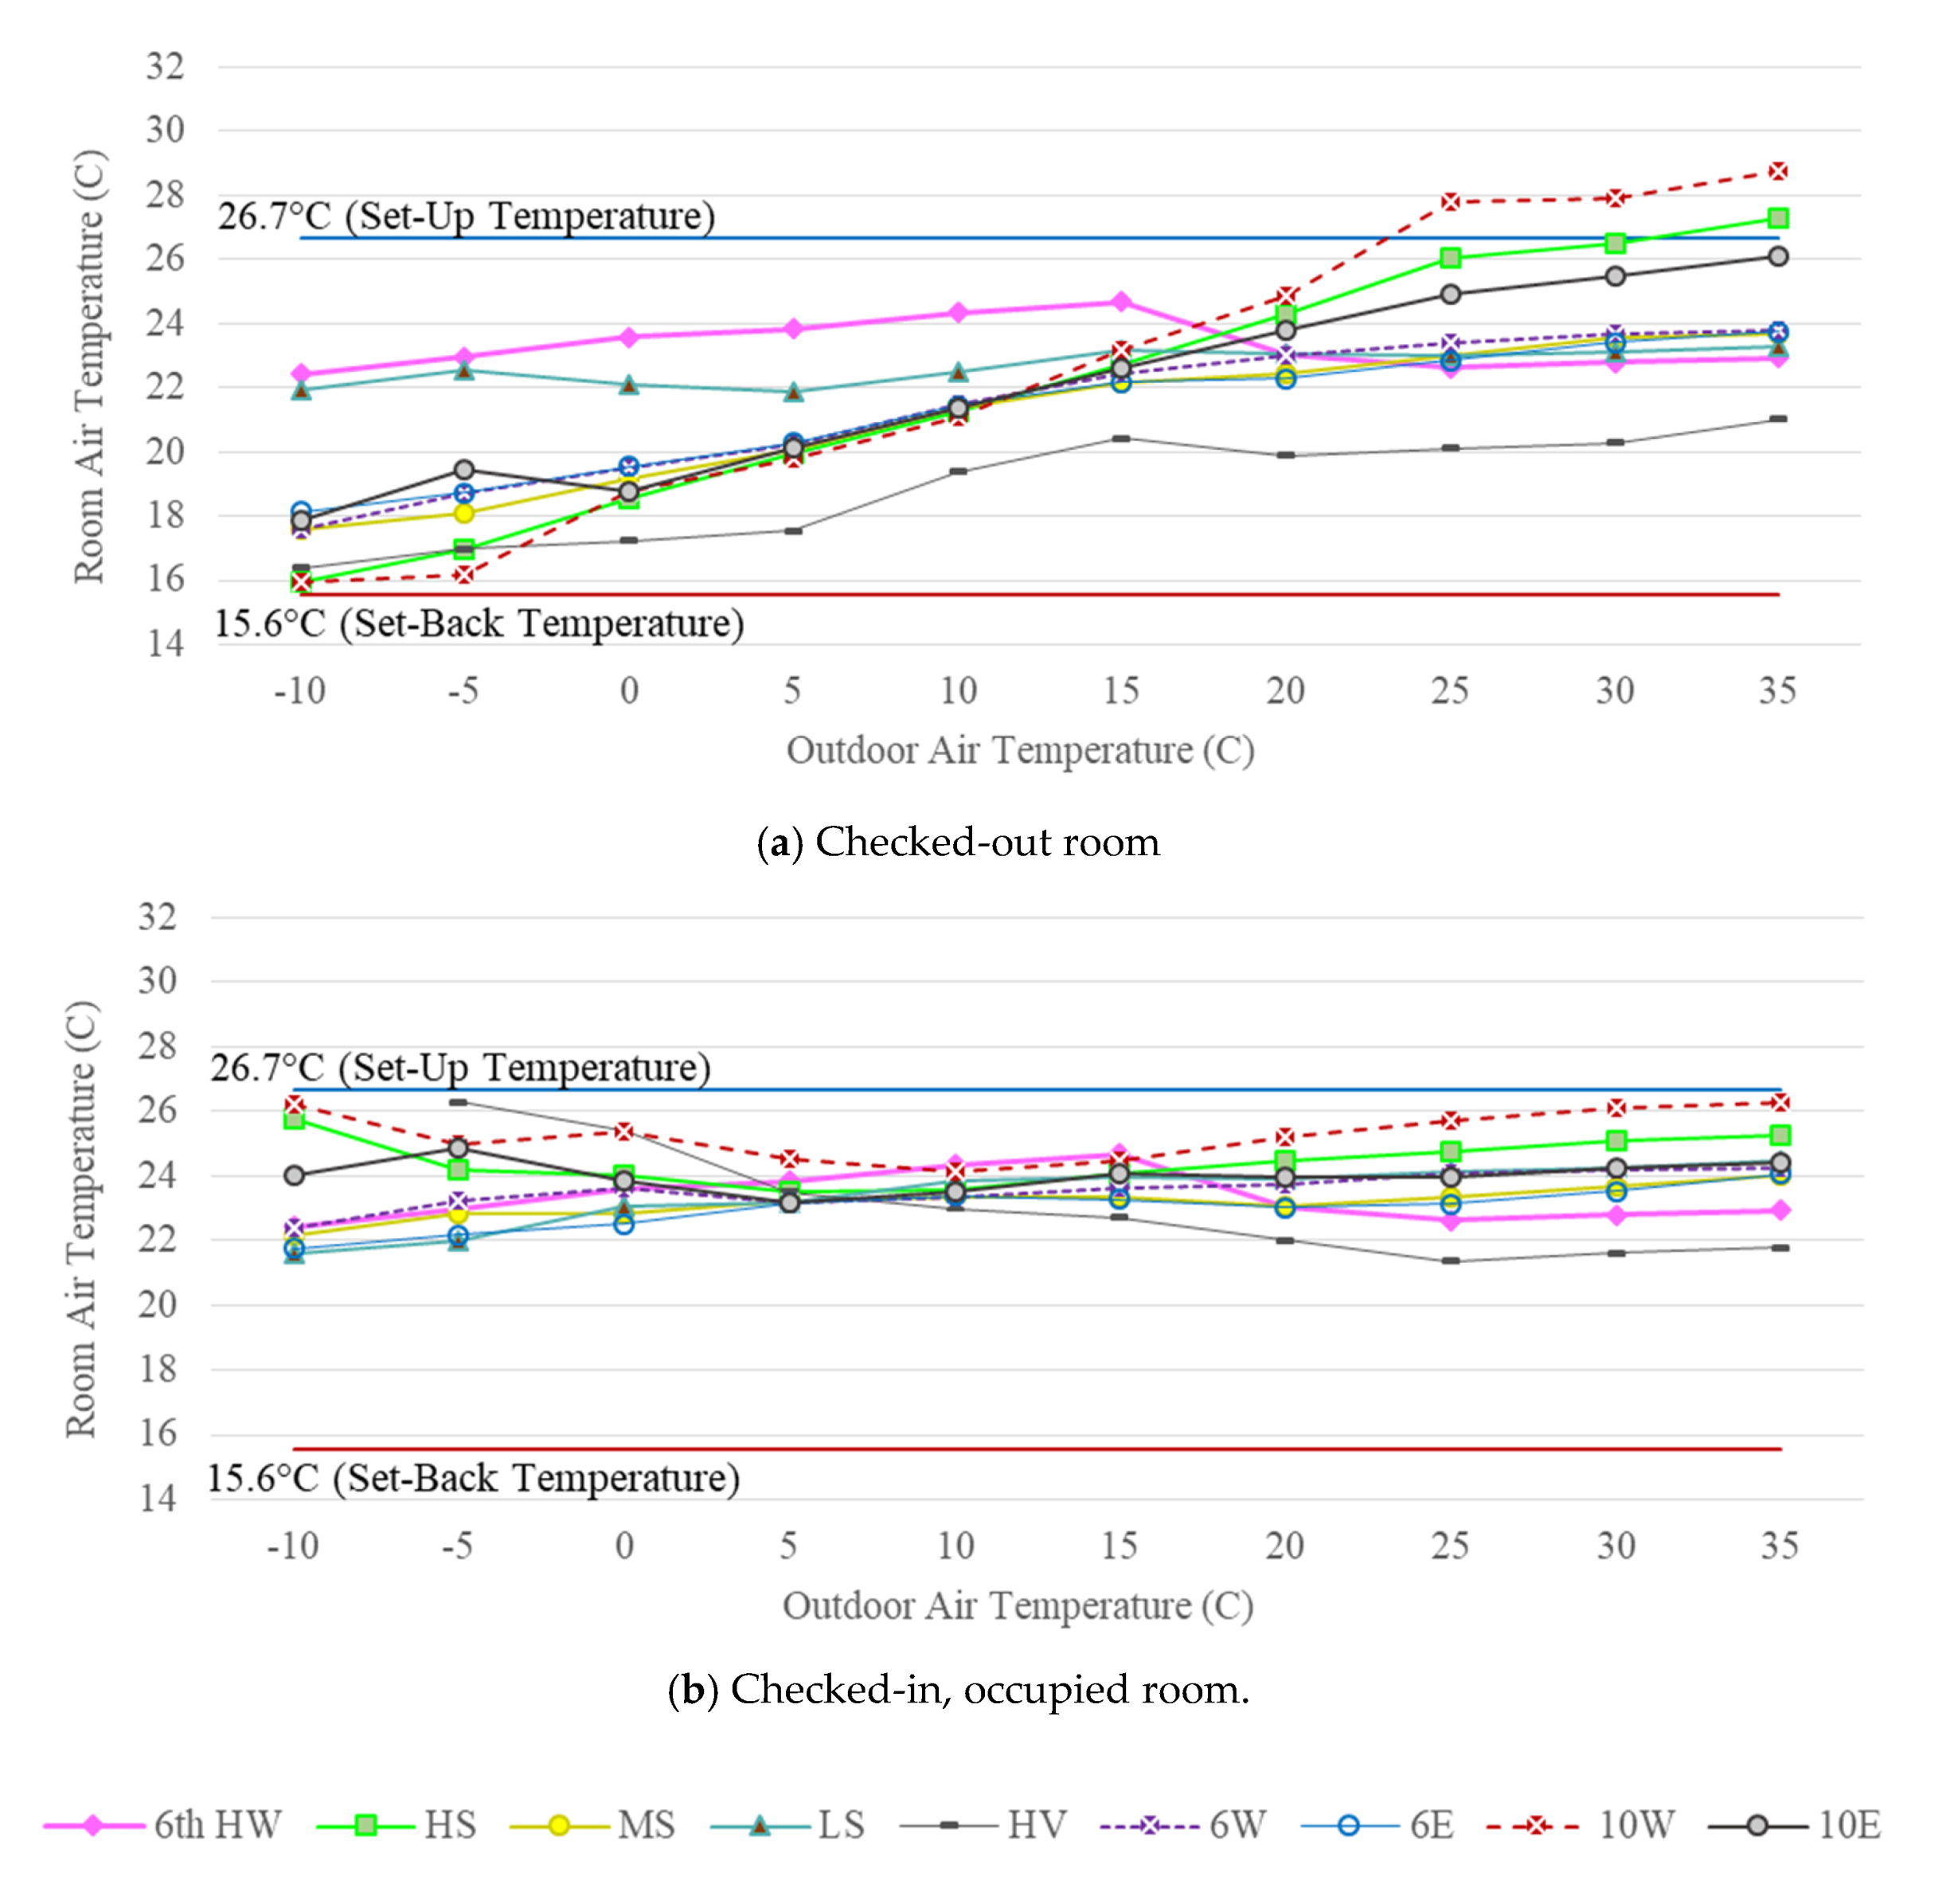
To identify potential reasons for different room-to-room trends, this study divided the twenty rooms into four groups based on the sensitivity of the binned indoor temperatures against outdoor temperatures, as shown in Figure 7: for (a) checked-out rooms; and (b) checked-in, occupied rooms. These four groups included three sensitivity levels (i.e., High Sensitivity (HS), Medium Sensitivity (MS), and Low Sensitivity (LS)); and one exceptional group consisting of the two rooms (i.e., Rooms 1 and 15), which had High Ventilation (HV) rates due to incorrectly designed ductwork. In comparison, the median values of the binned indoor temperatures of the rooms were averaged by location (i.e., rooms on the sixth floor facing west (6 W); rooms on the sixth floor facing east (6 E); rooms on the tenth floor facing west (10 W); and rooms on the tenth floor facing east (10 E)) and plotted in the same figure.
When the rooms were checked-out, it was found that there was a large difference in the maintained temperatures between the groups. For example, the HS group showed a strong relationship with outdoor temperatures. All six rooms in the HS group were more exposed to outdoor conditions than other rooms, including the four rooms on the top floor of the building (i.e., Rooms 16, 18, 19, and 20), one corner room on the sixth floor (i.e., Room 14), and one center room on the sixth floor with the largest window area of 19.7 m2 (212 ft2) (i.e., Room 7), which was about 2.6 times larger than the average window area of the fourteen rooms on the same floor. Out of the six rooms, the indoor temperatures measured in the two rooms located on the tenth floor facing west (i.e., 10 W in Figure 7) appeared to be most sensitive to outdoor temperatures with the highest slope for outdoor temperature bins between −5 °C (23 °F) and 25 °C (77 °F). However, when outdoor temperatures fell below −5 °C (23 °F) or rose above 25 °C (77 °F), the VRF unit was running to maintain the set-back or set-up temperatures of the rooms.
The analysis revealed that the LS group, consisting of three rooms on the sixth floor (i.e., rooms 6, 9, and 12), appeared to have similar indoor temperatures as the sixth floor Hallway (6th HW in Figure 7) when the rooms were checked-out. All three rooms in the LS group were centrally located with only one side exposed to the outdoor conditions and had relatively small windows than other rooms. In addition, the building was recently renovated with a thermal envelope, including 3.35 K·m2/W (19 h·ft2·°F/Btu) cavity insulation with 1.48 K·m2/W (8.4 h·ft2·°F/Btu) continuous insulation for the walls. As a result, the indoor temperatures measured in these rooms did not show a strong relationship with outdoor temperatures.
The HV group, consisting of the two rooms numbered 1 and 15, exhibited somewhat different trends than other rooms due to high amounts of conditioned OA ventilation, which was three times larger than the design rate. As a result, the checked-out rooms had very low indoor temperatures during the cooling season. This indicated that the card-key based automatic climate control system used in these rooms might not be generating the intended energy savings during the cooling season. However, during the heating season, the measured indoor temperatures showed a stronger association with the coincident outdoor temperatures, which was expected for these two corner rooms with two sides exposed to the outdoor atmosphere.
Finally, the MS group consisted of the remaining nine rooms, including eight rooms on the sixth floor and one room on the tenth floor. The MS group had almost identical trends with the median values of the binned indoor temperatures of the rooms for the sixth floor regardless of the orientation (i.e., either 6W or 6E in Figure 7). Unlike the 10th floor, no differences were observed in the averaged, median binned indoor temperatures between 6W and 6E because the highest median values of the room in HS canceled out the lowest median values of the room in LS in the same orientation group.
In the checked-in, occupied rooms, an interesting trend was observed between outdoor and indoor temperatures during the heating season. The measured indoor temperatures of the HS group rooms that included the two 10W rooms appeared to have increased with decreasing outdoor temperature during the heating season, which was the opposite to the trends observed in the other rooms. This trend began to appear when outdoor temperatures fell below 5 °C (41 °F), when the room-to-room variations in the checked-out room temperatures began as well. This indicated that the guests in the HS group rooms set their thermostat at higher setpoint temperatures, which appeared to compensate for the low balance-point temperatures of these rooms, which was near the set-back temperature, 15.6 °C (60 °F), when the rooms were checked-out due to their high sensitivity between outdoor and indoor temperature. This trend also agreed with early findings by Kempton [36] about occupants’ thermostat control behaviors due to their misconception about how the heating system worked such that a higher temperature setting would provide a faster warm up.
4.3. Relationship between Outdoor and Indoor Humidity
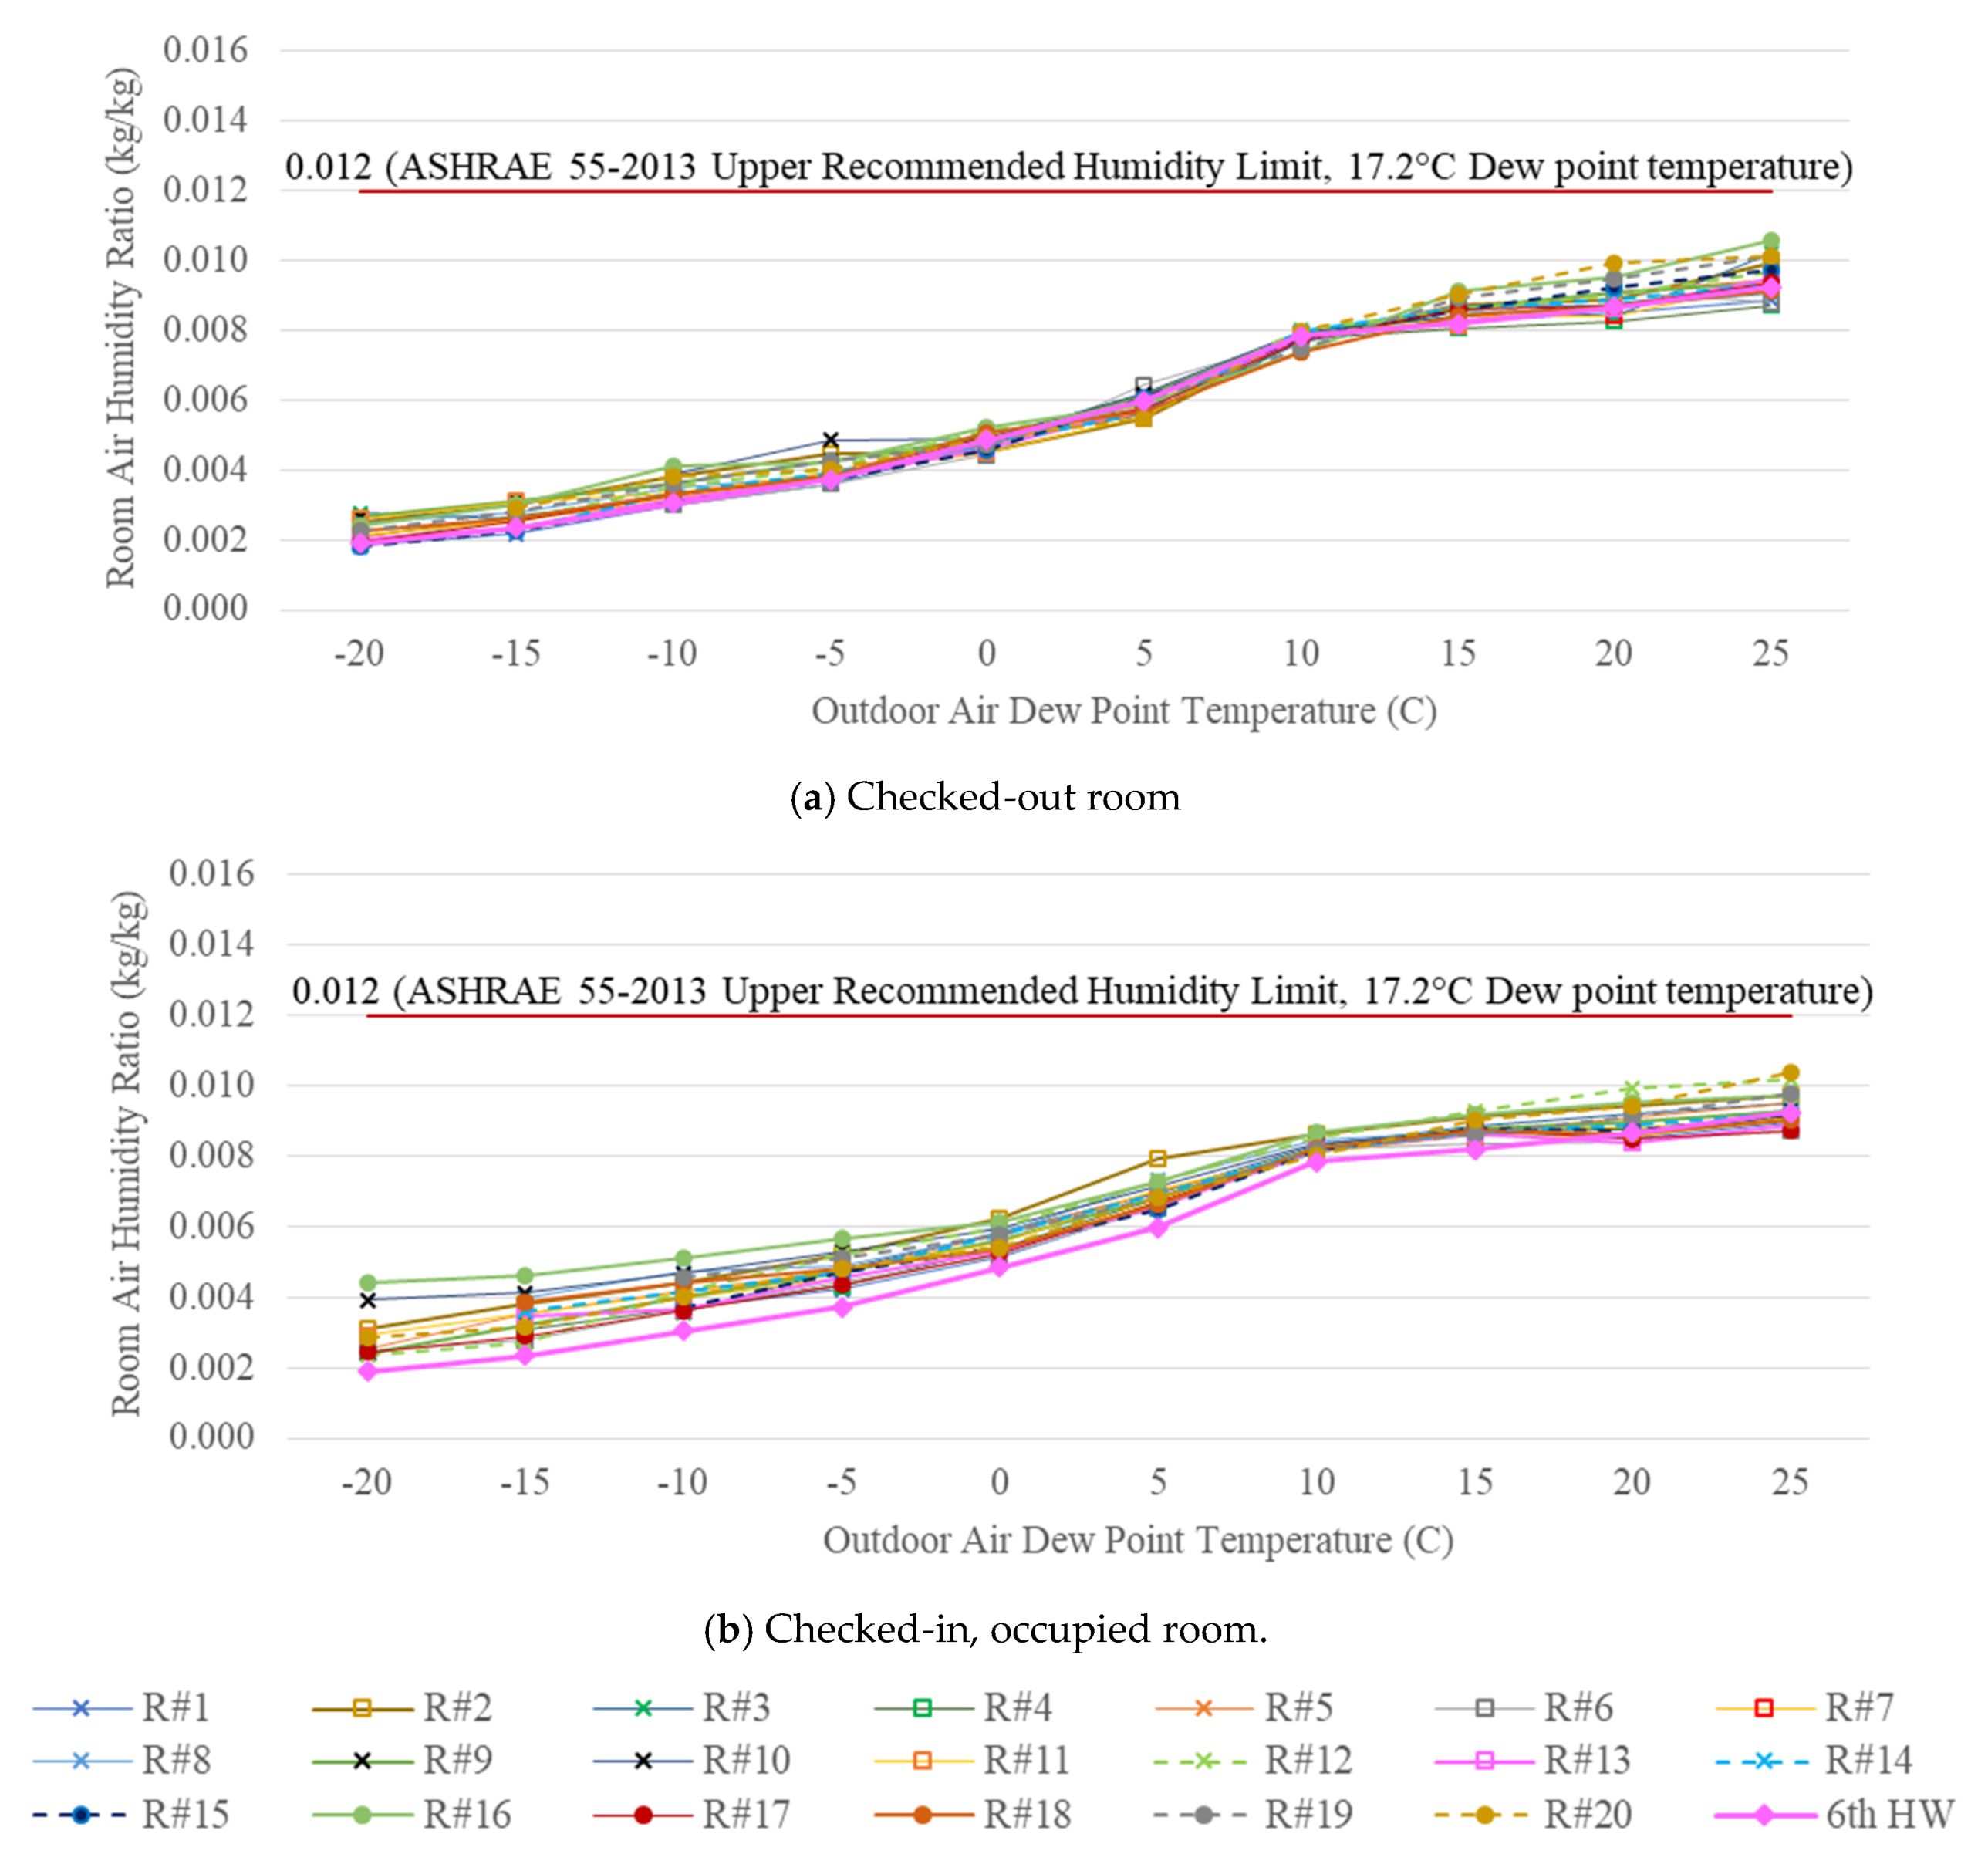
The indoor absolute humidity levels (i.e., humidity ratio in kg H2O/kg dry air) measured in each room were also characterized using the binned box-and-whisker plots by three different occupancy modes, where the 25th, 50th, and 75th percentiles, as well as the minimum, mean, and maximum values are reported over outdoor dew point temperatures binned into 5 °C (9 °F). The plots for all twenty guest rooms are provided as supplementary documents (Supplementary Figure S2). Figure 8 displays only the median values of all twenty rooms and the sixth floor hallway: (a) checked-out room; and (b) checked-in, occupied room.
All rooms appeared to have a strong association between the outdoor and indoor absolute humidity levels regardless of occupancy, which agreed with the findings reported in previous literature [37]. However, the relationship between the indoor and outdoor humidity ratio observed in this case-study hotel was non-linear. At higher outdoor dew point temperatures, the relation was less strong. A room-to-room humidity variation began when outdoor dew point temperatures were higher than 15 °C (59 °F). This meant that the hotel’s DOAS system effectively removed moisture from the air and maintained humidity ratios in the rooms well below the upper recommended humidity limit of the ASHRAE Standard 55-2017 [30]: 0.012 kg/kg, which is equivalent to a 17.2 °C (63 °F) dew point temperature. The maximum humidity ratios measured in these rooms were also lower than 0.012 kg/kg, as shown in the plots of individual rooms (Supplementary Figure S2).
When compared by occupancy mode, the median humidity ratios of all checked-in, occupied rooms were higher than those of the checked-out rooms, as well as the sixth floor hallway (i.e., pink line in Figure 8). This indicated some guest activities such as showers might raise the humidity level in these checked-in, occupied rooms. In addition, it could be observed that the rooms on the tenth floor (i.e., rooms numbered 16, 19, and 20) tended to have higher humidity ratios than the rooms on the sixth floor.
5. Conclusions
This paper presented the results of an effort to measure and characterize variations in temperature and humidity of actual guest rooms equipped with OBCC systems across different seasons. One year of one minute temperature and humidity measurements was performed along with occupancy measurements in twenty guest rooms of the case-study hotel building in Washington, D.C., from June 2015 to June 2016. At the case-study hotel, a card-key based climate control system was used to initiate a temperature set-back to 15.6 °C (60 °F) in the winter and to 26.7 °C (80 °F) in the summer in the guest rooms that were studied.
The measured indoor temperatures and humidity data were characterized using the binned box-and-whisker plots for three different occupancy modes against outdoor temperatures binned into 5 °C (9 °F) bins. This method was found useful to characterize the observed room-to-room variations in heat losses and resultant indoor temperatures during the heating season. The analysis of data using this method also indicated that an implementation of uniform, steady set-back or set-up temperatures across all the guest rooms of the hotel created periods of uncomfortable conditions in some guest rooms especially during the heating season. This was due to the different dynamic heat balance of the twenty guest rooms, which resulted from the combined effects of several factors such as the location of the guest rooms (i.e., higher level vs. lower level of external loads), ventilation rates, vacant periods (i.e., short-term vs. long-term vacancy), other conditioning mechanisms (i.e., DOAS), and external weather conditions.
This potential discomfort was also identified from the collected thermal comfort survey. During the heating season, about 57% of the surveyed discomfort sources were related to the thermostat, including the mechanical system not responding quickly to the thermostat changes; and low set-back temperatures made the room too cold when the guest entered the room. However, overall, only 14% of survey participants expressed dissatisfaction with their thermal environment, which indicated the system was still widely accepted. Interestingly enough, the guests who stayed in the rooms that appeared to have a stronger association between outdoor and indoor temperatures tended to set their thermostat at higher setpoint temperatures when they occupied the room. This might be caused to compensate the low balance-point temperatures of these rooms.
However, the temperature differences due to occupancy (i.e., checked-in rooms vs. checked-out rooms) were less obvious during the cooling and transitional seasons, which was contrary to the expectation. The time-of-day temperature variations during the cooling season were also smaller regardless of occupancy. This was the result of a constant supply of conditioned outdoor air at around 17.8 °C (64 °F) from the hotel’s DOAS to the rooms (i.e., 24 h per day, seven days per week) when it was in the cooling mode, which created near-uniform thermal environments between occupied and unoccupied modes. This indicated that there was a need to coordinate the deployment of card-key based automatic climate control systems with other conditioning mechanism such as DOAS in guest rooms to generate and maximize the intended energy savings.
Across all seasons, in check-in, occupied rooms, there was a high temperature and humidity difference by room. These observed variations in temperatures between the check-in, occupied rooms indicated individual differences in the preferred comfort temperatures of random guests since the temperatures of the checked-in, occupied rooms were likely to be controlled by the guests. This indicated a need to examine common assumptions on constant setpoint temperatures in energy simulation of guest rooms.
The information presented in this study provided deeper insights into the impacts of the deployment of OBCC on temperature and humidity variations in guest rooms and how guests reacted to the observed variations, which was not addressed in the previous publications. Empirical knowledge of these conditions also provided useful insights for an improved field demonstration and optimization of OBCC, as well as for a more realistic temperature and occupancy input for building simulations for hotel guest rooms.
Based on the findings from this study, the implementation of uniform, steady set-back or set-up temperatures to hotel guest rooms needs to be reconsidered in the future application in order to make sure hotels can still deliver high standards of thermal comfort to their guests. This also implies there is a need for the development of new research and systems that will allow calculating ideal room-by-room setback temperatures once the building is built along with a new dynamic set-back control algorithm for OBCC technologies, which should be incorporated during the building commissioning process. Such research will determine customized set-back or set-up temperatures of the room depending on how quickly the room is losing or gaining heat, which should be automatically applied to the room equipped with OBCC technologies. Empirical data collected from such a system can be also incorporated in the hotel’s PMS system so as to be used when hotels assign rooms to guests. For example, rooms with smaller temperature drifts when they are not occupied can be first assigned to guests instead of a random room assignment. This will also lead to the development of additional diagnostic methods and metrics (i.e., thermal signatures) for building performance.
Supplementary Materials
The following are available online at https://0-www-mdpi-com.brum.beds.ac.uk/1996-1073/13/7/1575/s1. Figure S1: Binned box-and-whisker plots of indoor temperatures measured in the twenty guest rooms against outdoor temperatures, Figure S2: Binned box-and-whisker plots of indoor absolute humidity levels measured in the twenty guest rooms against outdoor dew point temperature.
Author Contributions
The authors declare the following contributions: Conceptualization, H.K.; data curation, E.O.; formal analysis, H.K. and E.O.; funding acquisition, H.K.; methodology, H.K.; project administration, H.K.; resources, H.K.; supervision, H.K.; visualization, H.K. and E.O.; writing, original draft, H.K. and E.O.; writing, review and editing, H.K. All authors have read and agreed to the published version of the manuscript.
Funding
Financial support for this study was provided by Samsung Electronics Co., Ltd.
Acknowledgments
The authors acknowledge Jeff Haberl at Texas A&M University for his useful comments.
Conflicts of Interest
The authors declare no conflict of interest.
References
- EIA. 2012 Commercial Buildings Energy Consumption Survey (CBECS) Energy Usage Summary. Table 1. Total Energy Consumption by Energy Source; U.S. Energy Information Administration: Washington, DC, USA, 2017. Available online: https://www.eia.gov/consumption/commercial/reports/2012/energyusage/ (accessed on 3 March 2017).
- Woolley, J.; Peffer, T. Occupancy sensing adaptive thermostat controls: A market review and observations from multiple field installations in university residence halls. In Proceedings of the 2012 ACEEE Summer Study on Energy Efficiency in Buildings, Pacific Grove, CA, USA, 12–17 August 2012; Volume 7, pp. 298–311. [Google Scholar]
- HMG. Guest Room Occupancy Controls, 2013 California Building Energy Efficiency Standards, Codes and Standards Enhancement Initiative (CASE); Heschong Mahone Group, Inc.: Gold River, CA, USA, 2011. [Google Scholar]
- Sullivan, G.P.; Blanchard, J. Guest Room HVAC Occupancy-Based Control Technology Demonstration; Pacific Northwest National Laboratory: Richland, WA, USA, 2012. [Google Scholar]
- Fountain, M.; Brager, G.; Arens, E.; Bauman, F.; Benton, C. Comfort control for short-term occupancy. Energy Build. 1994, 21, 1–13. [Google Scholar] [CrossRef]
- ASHRAE. ANSI/ASHRAE/IESNA Standard 90.1-2016, Energy Standard for Buildings Except Low-Rise Residential Buildings; American Society of Heating, Refrigerating and Air-Conditioning Engineers, Inc.: Atlanta, GA, USA, 2016. [Google Scholar]
- Guo, W.; Nutter, D.W. Setback and setup temperature analysis for a classic double-corridor classroom building. Energy Build. 2010, 42, 189–197. [Google Scholar] [CrossRef]
- Kim, H.; Oldham, E. Energy performance of an occupancy-based climate control technology in guest rooms. Ashrae Trans 2019, 125, 703–717. [Google Scholar]
- Frey, D.; Arent, J. Card-Key Guestroom Controls Study; Emerging Technologies Program Application Assessment Report #0801 prepared for Pacific Gas and Electric Company; Architectural Energy Corporation: Boulder, CO, USA, 2009. [Google Scholar]
- Qi, M.; Li, X.; Zhu, E.; Shi, Y. Evaluation of perceived indoor environmental quality of five-star hotels in China: An application of online review analysis. Build. Environ. 2017, 111, 1–9. [Google Scholar] [CrossRef]
- Bohdanowicz, P.; Martinac, I. Thermal comfort and energy savings in the hotel industry. In Proceedings of the 16th International Congress of Biometeorology, Kansas City, MO, USA, 27 October–1 November 2002. [Google Scholar]
- Yan, D.; O’Brien, W.; Hong, T.; Feng, X.; Gunay, H.B.; Tahmasebi, F.; Mahdavi, A. Occupant behavior modeling for building performance simulation: Current state and future challenges. Energy Build. 2015, 107, 264–278. [Google Scholar] [CrossRef] [Green Version]
- Salimi, S.; Hammad, A. Critical review and research roadmap of office building energy management based on occupancy monitoring. Energy Build. 2019, 182, 214–241. [Google Scholar] [CrossRef]
- Mirakhorli, A.; Dong, B. Occupancy behavior based model predictive control for building indoor climate—A critical review. Energy Build. 2016, 129, 499–513. [Google Scholar] [CrossRef]
- Lau, H. Field performance of a card key energy saving system for hotels and motels. In Proceedings of the 2000 ACEEE Summer Study on Energy Efficiency in Buildings, Pacific Grove, CA, USA, 20–25 August 2000; Volume 3, pp. 219–228. [Google Scholar]
- Pistochini, T.; Heinemeier, K.; DeJean, D. Hotel Guest Room Energy Controls; Emerging Technologies Program Final Report prepared for San Diego Gas & Electric; California Lighting Technology Center: Davis, CA, USA, 2008. [Google Scholar]
- Frank, D. Packaged Terminal Heat Pumps and Room-Based Occupancy Sensors M&V: Best Western Peppertree Airport Inn. Spokane, WA; Report Prepared for Bonneville Power Administration; EMP2, Inc.: Richland, WA, USA, 2010. [Google Scholar]
- Asadi, E.; Costa, J.J.; da Silva, M.G. Indoor air quality audit implementation in a hotel building in Portugal. Build. Environ. 2011, 46, 1617–1623. [Google Scholar] [CrossRef]
- Deru, M.; Field, K.; Studer, D.; Benne, K.; Griffith, B.; Torcellini, P.; Liu, B.; Halverson, M.; Winiarski, D.; Rosenberg, M.; et al. Department of Energy Commercial Reference Building Models of the National Building Stock; National Renewable Energy Laboratory: Golden, CO, USA, 2011. [Google Scholar]
- Kim, H.; Oldham, E.; Haberl, J. Field investigation of an occupancy-based climate control technology: IEQ performance during the cooling season. In Proceedings of the 14th International Conference on Indoor Air Quality and Climate-Indoor Air 2016, Ghent, Belgium, 3–8 July 2016; p. 495. [Google Scholar]
- Kim, H.; Oldham, E. Long-term field investigation and modeling of electricity end-use patterns in hotel guest rooms. Energy Build. 2017, 155, 414–424. [Google Scholar] [CrossRef]
- NCDC. Quality Controlled Local Climatological Data; National Oceanic and Atmospheric Administration, National Climatic Data Center: Washington, DC, USA, 2016. Available online: http://www.ncdc.noaa.gov/qclcd/QCLCD?prior=N (accessed on 7 March 2017).
- Duarte, C.; Wymelenberg, K.V.D.; Rieger, C. Revealing occupancy patterns in an office building through the use of occupancy sensor data. Energy Build. 2013, 67, 587–595. [Google Scholar] [CrossRef]
- Pritoni, M.; Woolley, J.M.; Modera, M.P. Do occupancy-responsive learning thermostats save energy? A field study in university residence halls. Energy Build. 2016, 127, 469–478. [Google Scholar] [CrossRef]
- Yun, J.; Lee, S.S. Human movement detection and identification using pyroelectric infrared sensors. Sensors 2014, 14, 8057–8081. [Google Scholar] [CrossRef] [PubMed]
- Labeodan, T.; Zeiler, W.; Boxem, G.; Zhao, Y. Occupancy measurement in commercial office buildings for demand-driven control applications—A survey and detection system evaluation. Energy Build. 2015, 93, 303–314. [Google Scholar] [CrossRef] [Green Version]
- Teixeira, T.; Dublon, G.; Savvides, A. A survey of human-sensing: Methods for detecting presence, count, location, track, and identity. ACM Comput. Surveys 2010, 5, 59–69. [Google Scholar]
- Guo, X.; Tiler, D.K.; Henze, G.P.; Waters, C.E. The performance of occupancy-based lighting control systems: A review. Lighting Res. Technol. 2010, 42, 415–431. [Google Scholar] [CrossRef]
- ASHRAE. ASHRAE/CIBSE/USGBC Performance Measurement Protocols for Commercial Buildings; American Society of Heating, Refrigerating and Air-Conditioning Engineers, Inc.: Atlanta, GA, USA, 2010. [Google Scholar]
- ASHRAE. ANSI/ASHRAE Standard 55-2017, Thermal Environmental Conditions for Human Occupancy; American Society of Heating, Refrigerating, and Air-Conditioning Engineers, Inc.: Atlanta, GA, USA, 2017. [Google Scholar]
- Wang, Z.; de Dear, R.; Luo, M.; Lin, B.; He, Y.; Ghahramani, A.; Zhu, Y. Individual difference in thermal comfort: A literature review. Build. Environ. 2018, 138, 181–193. [Google Scholar] [CrossRef]
- Sterling, E.; Arundel, A.; Sterling, T. Criteria for human exposure to humidity in occupied buildings. ASHRAE Trans. 1985, 91, 611–622. [Google Scholar]
- Derby, M.; Pasch, R. Effects of low humidity on health, comfort and IEQ. ASHRAE J. 2017, 59, 45–51. [Google Scholar]
- Abushakra, B.; Haberl, J.; Claridge, D.; Sreshthaputra, A. Compilation of Diversity Factors and Schedules for Energy and Cooling Load Calculations; Final Report on ASHRAE Research Project 1092-RP; American Society of Heating, Refrigerating and Air-Conditioning Engineers, Inc.: Atlanta, GA, USA, 2001. [Google Scholar]
- Haberl, J.; Abbas, M. Development of graphical indices for viewing building energy data: Part 1. ASME J. Sol. Energy Eng. 1998, 120, 156–161. [Google Scholar] [CrossRef]
- Kempton, W. Two Theories of Home Heat Control. Cogn. Sci. 1986, 10, 75–90. [Google Scholar] [CrossRef]
- Nguyen, J.; Schwartz, J.; Dockery, D. The relationship between indoor and outdoor temperature, apparent temperature, relative humidity, and absolute humidity. Indoor Air 2014, 24, 103–112. [Google Scholar] [CrossRef] [PubMed] [Green Version]
Figure 1.
Classification of the heating, transitional, and cooling seasons based on daily average outdoor air temperature. OA, Outdoor Air.
Figure 1.
Classification of the heating, transitional, and cooling seasons based on daily average outdoor air temperature. OA, Outdoor Air.

Figure 2.
Frequency distributions by season of: (a) thermal comfort satisfaction; (b) self-reported productivity.
Figure 2.
Frequency distributions by season of: (a) thermal comfort satisfaction; (b) self-reported productivity.

Figure 3.
Source of thermal discomfort by season.

Figure 4.
The 10th, 50th, and 90th percentile time-of-day room temperature profiles of the 18 guest rooms by season and by location for (a) checked-in rooms on the sixth floor (left) and the tenth floor (right) versus (b) checked-out rooms on the sixth floor (left) and the tenth floor (right).
Figure 4.
The 10th, 50th, and 90th percentile time-of-day room temperature profiles of the 18 guest rooms by season and by location for (a) checked-in rooms on the sixth floor (left) and the tenth floor (right) versus (b) checked-out rooms on the sixth floor (left) and the tenth floor (right).


Figure 5.
Standard time-series plot of the 5 min interval temperatures measured in rooms numbered 5 and 9 on the sixth floor over one three-day period (6 to 8 January 2016): (a) Room 5; and (b) Room 9.
Figure 5.
Standard time-series plot of the 5 min interval temperatures measured in rooms numbered 5 and 9 on the sixth floor over one three-day period (6 to 8 January 2016): (a) Room 5; and (b) Room 9.

Figure 6.
Comparison of median values of binned indoor temperatures of the twenty guest rooms against outdoor temperatures: (a) checked-out room; and (b) checked-in, occupied room. R, Room; HW, Hallway.
Figure 6.
Comparison of median values of binned indoor temperatures of the twenty guest rooms against outdoor temperatures: (a) checked-out room; and (b) checked-in, occupied room. R, Room; HW, Hallway.

Figure 7.
Median values of binned indoor temperatures averaged by sensitivity of binned indoor temperatures against outdoor temperatures, as well as by location: (a) checked-out room; and (b) checked-in, occupied room. HW, Hallway; HS, High Sensitivity; MS, Medium Sensitivity; LS, Low Sensitivity; HV, High Ventilation.

Figure 8.
Comparison of the median values of binned indoor air humidity ratios of the twenty guest rooms against outdoor dew point temperatures: (a) checked-out room; and (b) checked-in, occupied room.
Figure 8.
Comparison of the median values of binned indoor air humidity ratios of the twenty guest rooms against outdoor dew point temperatures: (a) checked-out room; and (b) checked-in, occupied room.


Table 1.
Specifications of basic Indoor Environmental Quality (IEQ) and occupancy measurement instrumentation.
Table 1.
Specifications of basic Indoor Environmental Quality (IEQ) and occupancy measurement instrumentation.
| Parameter | Sensor Type | Accuracy | Range |
|---|---|---|---|
| Air temperature (°C) | Thermistor | ±0.21 °C (from 0° to 50 °C) | −20 to 70 °C |
| Relative humidity (%) | Capacity polymer sensor | ±2% RH (from 20% to 80% RH) | 1% to 90% |
| Occupancy (% occupied) | Passive Infrared (PIR) sensor | 102° (±51°) horizontal; 92° (±46°) vertical | Max 12 m |
Table 2.
Mean (standard deviation) of the measured room temperature by three occupancy modes and seasons.
Table 2.
Mean (standard deviation) of the measured room temperature by three occupancy modes and seasons.
| Room ID | Heating Season (°C) | Cooling Season (°C) | Transitional Season (°C) | ||||||||
|---|---|---|---|---|---|---|---|---|---|---|---|
| Checked-In1 | Checked-Out | Checked-In1 | Checked-Out | Checked-In1 | Checked-Out | ||||||
| Occ | UnOcc | Occ | UnOcc | Occ | UnOcc | ||||||
| Floor | Orientation2 | ||||||||||
| 1 | 6 | NW | 23.4 (2.8) | 21.7 (2.0) | 18.9 (1.7) | 21.1 (1.3) | 20.6 (1.0) | 19.0 (1.4) | 23.1 (2.5) | 22.3 (2.0) | 20.8 (1.9) |
| 2 | 6 | SE | 23.2 (2.0) | 22.9 (2.0) | 20.7 (1.7) | 24.0 (1.0) | 23.9 (0.7) | 23.6 (0.9) | 24.5 (1.9) | 24.1 (1.7) | 21.7 (1.3) |
| 3 | 6 | NW | 23.9 (2.2) | 22.5 (1.5) | 19.0 (2.3) | 23.4 (1.7) | 23.4 (1.0) | 23.2 (1.0) | 24.1 (2.3) | 23.1 (1.1) | 21.9 (1.2) |
| 4 | 6 | SE | 24.6 (3.6) | 23.7 (2.6) | 20.5 (1.8) | 22.7 (1.3) | 23.1 (1.0) | 22.2 (0.8) | 23.7 (2.5) | 23.5 (1.8) | 21.9 (1.4) |
| 5 | 6 | W | 23.7 (1.8) | 22.7 (1.6) | 20.1 (2.3) | 24.4 (1.6) | 24.0 (0.9) | 23.6 (0.7) | 23.5 (1.2) | 23.4 (0.8) | 23.1 (0.9) |
| 6 | 6 | SE | 23.6 (2.3) | 23.0 (1.6) | 21.7 (1.4) | 22.3 (1.1) | 22.3 (0.8) | 21.8 (0.6) | 23.2 (1.6) | 23.4 (1.4) | 22.3 (1.2) |
| 7 | 6 | E | 23.6 (2.1) | 22.8 (1.4) | 19.7 (2.5) | 24.2 (1.4) | 24.4 (1.0) | 23.7 (1.1) | 23.9 (1.7) | 23.8 (1.2) | 22.4 (0.9) |
| 8 | 6 | E | 23.7 (2.2) | 23.3 (1.7) | 20.9 (2.1) | 23.4 (1.4) | 24.0 (1.0) | 23.6 (0.9) | 23.3 (1.3) | 23.4 (1.0) | 22.9 (0.8) |
| 9 | 6 | W | 24.1 (1.8) | 23.5 (1.5) | 22.8 (1.1) | 25.4 (1.5) | 24.9 (1.2) | 22.5 (1.1) | 25.5 (1.6) | 24.8 (1.2) | 24.4 (0.9) |
| 10 | 6 | E | 23.6 (1.7) | 23.4 (1.6) | 21.1 (1.5) | 23.4 (1.5) | 24.0 (1.2) | 24.4 (0.9) | 24.2 (1.3) | 24.1 (1.0) | 23.0 (0.9) |
| 11 | 6 | E | 23.2 (1.9) | 22.4 (1.3) | 20.6 (1.7) | 23.1 (1.0) | 23.1 (0.8) | 22.9 (0.6) | 23.4 (1.4) | 23.2 (1.1) | 22.4 (0.9) |
| 12 | 6 | W | 23.5 (1.6) | 23.3 (1.6) | 22.4 (2.3) | 24.5 (1.1) | 24.6 (1.1) | 24.1 (2.3) | 23.9 (1.2) | 23.6 (1.2) | 23.4 (0.6) |
| 13 | 6 | E | 22.9 (1.8) | 22.4 (1.5) | 20.2 (2.0) | 21.4 (1.5) | 21.8 (0.8) | 21.9 (0.6) | 23.5 (1.5) | 22.9 (1.3) | 22.0 (1.2) |
| 14 | 6 | W | 22.6 (1.6) | 21.9 (1.6) | 20.2 (2.3) | 24.5 (1.0) | 24.5 (0.7) | 25.5 (0.8) | 23.5 (1.1) | 23.5 (0.8) | 23.4 (0.9) |
| 15 | 10 | NW | 23.2 (1.9) | 21.7 (1.6) | 18.7 (2.8) | 22.2 (1.6) | 22.1 (1.4) | 21.1 (1.4) | 22.4 (2.0) | 21.7 (1.9) | 20.8 (2.3) |
| 16 | 10 | SE | 24.0 (1.4) | 23.4 (1.4) | 20.7 (2.3) | 24.4 (1.2) | 25.0 (1.1) | 26.2 (0.9) | 24.9 (1.2) | 24.8 (1.1) | 23.3 (1.5) |
| 17 | 10 | SE | 23.1 (1.7) | 22.8 (1.2) | 20.7 (2.1) | 23.3 (1.3) | 23.2 (0.9) | 23.5 (0.9) | 23.3 (1.3) | 23.3 (1.3) | 22.7 (0.8) |
| 18 | 10 | E | 23.7 (2.2) | 22.8 (1.9) | 19.9 (2.6) | 24.2 (1.2) | 25.1 (1.3) | 25.5 (1.4) | 24.0 (1.4) | 24.1 (1.1) | 23.4 (1.4) |
| 19 | 10 | W | 24.5 (1.9) | 23.7 (1.6) | 20.4 (2.8) | 25.6 (1.5) | 25.4 (1.3) | 27.5 (1.5) | 24.6 (1.2) | 24.5 (0.9) | 23.7 (1.1) |
| 20 | 10 | W | 24.5 (1.8) | 23.4 (1.4) | 20.3 (2.2) | 26.1 (1.4) | 26.1 (1.3) | 28.1 (1.4) | 24.9 (1.6) | 24.5 (1.3) | 23.8 (1.2) |
| AVG3 | 23.7 (2.0) | 23.0 (1.6) | 20.7 (2.0) | 23.9 (1.3) | 24.0 (1.0) | 24.1 (1.0) | 24.0 (1.5) | 23.8 (1.2) | 22.9 (1.1) | ||
1 Occ: Occupied, UnOcc: Unoccupied; 2 W: West, NW: Northwest, E: East, SE: Southeast; 3 Rooms 1 and 15 were excluded from the average calculations because of an oversupply of conditioned OA from the Dedicated Outdoor Air System (DOAS) due to incorrectly designed ductwork.
Table 3.
Mean (standard deviation) of the measured room humidity by the three occupancy modes and seasons.
Table 3.
Mean (standard deviation) of the measured room humidity by the three occupancy modes and seasons.
| Room ID | Floor | Orientation2 | Heating Season (%RH) | Cooling Season (%RH) | Transitional Season (%RH) | ||||||
|---|---|---|---|---|---|---|---|---|---|---|---|
| Checked-In1 | Checked-Out | Checked-In1 | Checked-Out | Checked-In1 | Checked-Out | ||||||
| Occ | UnOcc | Occ | UnOcc | Occ | UnOcc | ||||||
| 1 | 6 | NW | 36.0 (11.4) | 38.0 (11.0) | 36.0 (12.1) | 56.0 (5.7) | 56.2 (3.8) | 60.8 (4.9) | 43.3 (10.7) | 43.8 (9.6) | 55.3 (9.7) |
| 2 | 6 | SE | 39.5 (9.1) | 38.1 (9.1) | 33.8 (10.5) | 50.4 (4.2) | 49.4 (3.8) | 48.8 (4.3) | 47.2 (7.8) | 46.5 (6.9) | 47.8 (7.9) |
| 3 | 6 | NW | 38.9 (9.1) | 38.5 (8.8) | 35.7 (9.9) | 50.9 (4.5) | 50.3 (3.9) | 46.4 (4.3) | 44.5 (9.1) | 45.5 (8.7) | 48.4 (9.7) |
| 4 | 6 | SE | 31.9 (10.2) | 32.3 (9.4) | 32.5 (11.5) | 50.5 (4.2) | 50.4 (3.7) | 49.7 (2.5) | 45.7 (9.0) | 44.7 (8.4) | 47.7 (8.5) |
| 5 | 6 | W | 35.5 (8.5) | 34.6 (7.7) | 31.9 (9.9) | 48.3 (3.6) | 48.0 (3.0) | 49.2 (2.9) | 45.5 (8.3) | 45.7 (7.4) | 45.4 (8.3) |
| 6 | 6 | SE | 32.3 (10.0) | 32.3 (9.9) | 31.9 (11.3) | 49.3 (4.4) | 49.7 (3.5) | 53.4 (3.9) | 45.5 (9.3) | 43.8 (9.7) | 50.1 (7.8) |
| 7 | 6 | E | 37.2 (10.3) | 35.5 (9.7) | 34.2 (10.5) | 47.4 (3.5) | 46.1 (3.8) | 46.1 (3.6) | 46.1 (8.5) | 43.0 (8.9) | 46.8 (8.1) |
| 8 | 6 | E | 36.9 (9.2) | 35.8 (9.3) | 33.6 (10.1) | 50.0 (4.3) | 49.1 (3.5) | 47.9 (3.2) | 46.5 (8.6) | 45.0 (8.5) | 48.5 (6.7) |
| 9 | 6 | W | 31.7 (9.2) | 32.6 (8.9) | 31.8 (10) | 44.2 (4.8) | 45.1 (3.7) | 51.6 (5.5) | 39.9 (7.5) | 41.2 (7.0) | 43.6 (7.1) |
| 10 | 6 | E | 35.6 (8.4) | 35.8 (8.2) | 36.6 (7.4) | 47.3 (4.2) | 46.9 (3.7) | 45.3 (3.2) | 44.7 (8.2) | 44.8 (7.2) | 47.3 (4.3) |
| 11 | 6 | E | 36.4 (9.6) | 34.6 (9.5) | 32.7 (9.4) | 48.3 (4.5) | 49.1 (3.8) | 49.4 (3.6) | 44.6 (8.7) | 44.5 (8.7) | 49.4 (8.2) |
| 12 | 6 | W | 37.8 (9.4) | 36.1 (9.9) | 29.9 (8.6) | 52.1 (5.7) | 48.6 (3.9) | 46.8 (3.9) | 45.7 (7.6) | 45.1 (7.0) | 45.8 (5.8) |
| 13 | 6 | E | 34.7 (9.0) | 35.6 (9.5) | 31.9 (10.9) | 52.9 (5.7) | 51.9 (4.4) | 51.7 (3.8) | 44.6 (8.9) | 44.4 (8.3) | 51.1 (7.7) |
| 14 | 6 | W | 38.0 (8.6) | 37.4 (8.5) | 32.0 (9.5) | 45.8 (3.7) | 46.1 (3.0) | 42.9 (3.1) | 44.7 (7.5) | 44.6 (7.6) | 48.2 (7.3) |
| 15 | 10 | NW | 39.1 (10.2) | 40.4 (11.1) | 36.4 (11.7) | 53.0 (6.0) | 54.1 (5.8) | 56.6 (4.4) | 47.8 (10.2) | 47.0 (9.5) | 52.8 (10.5) |
| 16 | 10 | SE | 36.4 (9.2) | 37.4 (8.7) | 35.7 (9.3) | 49.1 (4.0) | 50.0 (3.8) | 45.4 (3.7) | 44.1 (7.4) | 44.0 (6.7) | 48.2 (8.9) |
| 17 | 10 | SE | 33.7 (10.3) | 32.6 (10.3) | 35.1 (11.5) | 49.0 (5.3) | 48.0 (4.2) | 48.2 (3.2) | 46.9 (9.0) | 43.7 (8.3) | 48.9 (9.4) |
| 18 | 10 | E | 34.9 (9.9) | 36.2 (9.8) | 34 (10.7) | 46.3 (4.3) | 44.7 (3.8) | 42.4 (3.5) | 44.3 (8.2) | 42.3 (7.7) | 44.7 (11.4) |
| 19 | 10 | W | 34.7 (8.8) | 35.0 (9.3) | 33.5 (9.1) | 45.1 (5.3) | 45.5 (3.9) | 39.9 (3.4) | 41.2 (8.9) | 43.2 (8.1) | 45.3 (7.6) |
| 20 | 10 | W | 31.6 (9.1) | 33.0 (8.6) | 36.2 (9) | 45.0 (4.5) | 46.3 (4.6) | 40.7 (3.2) | 40.5 (7.0) | 42.5 (6.2) | 45.4 (10.2) |
| AVG3 | 35.4 (9.3) | 35.2 (9.2) | 33.5 (10) | 48.4 (4.5) | 48.1 (3.8) | 47.0 (3.6) | 44.6 (8.3) | 44.1 (7.8) | 47.4 (8.0) | ||
1 Occ: Occupied, UnOcc: Unoccupied; 2 W: West, NW: Northwest, E: East, SE: Southeast; 3 Rooms 1 and 15 were excluded from the average calculations because of an oversupply of conditioned OA from the DOAS due to incorrectly designed ductwork.
© 2020 by the authors. Licensee MDPI, Basel, Switzerland. This article is an open access article distributed under the terms and conditions of the Creative Commons Attribution (CC BY) license (http://creativecommons.org/licenses/by/4.0/).
Share and Cite
MDPI and ACS Style
Kim, H.; Oldham, E. Characterizing Variations in the Indoor Temperature and Humidity of Guest Rooms with an Occupancy-Based Climate Control Technology. Energies 2020, 13, 1575. https://0-doi-org.brum.beds.ac.uk/10.3390/en13071575
AMA Style
Kim H, Oldham E. Characterizing Variations in the Indoor Temperature and Humidity of Guest Rooms with an Occupancy-Based Climate Control Technology. Energies. 2020; 13(7):1575. https://0-doi-org.brum.beds.ac.uk/10.3390/en13071575
Chicago/Turabian StyleKim, Hyojin, and Emily Oldham. 2020. "Characterizing Variations in the Indoor Temperature and Humidity of Guest Rooms with an Occupancy-Based Climate Control Technology" Energies 13, no. 7: 1575. https://0-doi-org.brum.beds.ac.uk/10.3390/en13071575
Note that from the first issue of 2016, this journal uses article numbers instead of page numbers. See further details here.