Article

Reduction in Energy Requirement and CO2 Emission for Microalgae Oil Production Using Wastewater

1
Graduate School of Life and Environmental Sciences, University of Tsukuba, Ibaraki 305-8572, Japan
2
Faculty of Life and Environmental Sciences, University of Tsukuba, Ibaraki 305-8572, Japan
3
Research Center for Chemistry, Indonesian Institute of Sciences, Serpong 15314, Indonesia
4
Algae Biomass and Energy System R&D Center, University of Tsukuba, Ibaraki 305-8572, Japan
*
Author to whom correspondence should be addressed.
Submission received: 19 February 2020 / Revised: 22 March 2020 / Accepted: 25 March 2020 / Published: 2 April 2020
(This article belongs to the Special Issue Bioenergy from Organic Waste)

Abstract

:
A comparative evaluation of energy requirement and CO2 emission was performed for native polyculture microalgae oil production in a wastewater treatment plant (WWTP). The wastewater provided nutrients for algae growth. Datasets of microalgae oil production and their details were collected from the Minamisoma pilot plant. Environmental impact estimation from direct energy and material balance was analyzed using SimaPro® v8.0.4. in two scenarios: existing and algal scenarios. In the existing scenario, CO2 emission sources were from wastewater treatment, sludge treatment, and import of crude oil. In the algal scenario, CO2 emission with microalgae production was considered using wastewater treatment, CO2 absorption from growing algae, and hydrothermal liquefaction (HTL) for extraction, along with the exclusion of exhausted CO2 emission for growing algae and use of discharged heat for HTL. In these two scenarios, 1 m3 of wastewater was treated, and 2.17 MJ higher heating value (HHV) output was obtained. Consequently, 2.76 kg-CO2 eq/m3-wastewater in the existing scenario and 1.59 kg-CO2 eq/m3-wastewater in the algal scenario were calculated. In the HTL process, 21.5 MJ/m3-wastewater of the discharged heat energy was required in the algal scenario. Hence, the efficiency of the biocrude production system will surpass those of the WWTP and imported crude oil.

Graphical Abstract

1. Introduction

Energy security has become a concern in Japan since the accident of the Fukushima nuclear power plant. Furthermore, the global trend toward non-fossil fuels by the sustainable development goals (SDGs) is accelerating renewable energies. Hence, the microalgae biofuel production system is highly promising, but the challenge is its competitiveness with existing energy supply systems. Research has been conducted after the incident of the nuclear power plant to increase renewable energy production.
Microalgae is referred to as one of the best candidates for biofuel production, a source of renewable energy. Fuel production from microalgae in the Minamisoma pilot plant measuring 0.1 ha has been reported, which can facilitate 50 m3/day in an open raceway pond (ORP) [1]. Simulation was conducted based on experimental results that considered profitability, energy balance, and emission of environmental load (GHG). Major species of microalgae that had been cultivated were Desmodesmus sp., Dictyosphaerium sp., Klebsormidium sp., Micractinium sp., and Scenedesmus sp. [2].
The bottlenecks in profitability were nutrients and freshwater for algae growth. However, if wastewater were used for microalgae cultivation, costs could be reduced from 1605.9 JPY (14.1 USD: the exchange in Table A1 in Appendix A was used)/kg-biocrude-wet to 160.6 JPY (1.4 USD: Table A1)/kg-biocrude-wet [1]. Moreover, to fulfill energy demand, a bottleneck in energy balance was the energy requirement for circulating water in the ORP, the hydrothermal-liquefaction (HTL) process, and the centrifugation process.
A previous study showed that the use of wastewater with the addition of CO2 gas was effective for microalgal growth and reduced CO2 [3]. However, in that study, the introduction and the total system’s emissions of wastewater treatment by microalgae were not explained because the details of the oil-production system from algae were unknown. The experiment at the Minamisoma plant showed that wastewater was a potential source from households that could be used after filtration in the ORP for microalgae production [4]. Wastewater could serve as a nutrient source for culturing microalgae, which could additionally reduce energy and CO2. Theoretical calculations of microalgae oil production have been reported [5]; however, the theoretical and practical values calculated differed vastly. Hence, an accurate estimation of CO2 emissions is highly required. A simulation is required based on the life cycle assessment (LCA) approach to project oil production potentiality from microalgae at the Minamisoma pilot plant.
Therefore, the purpose of this research is to evaluate the potential of microalgae oil production integrated with wastewater treatment including microalgae cultivation. Wastewater treatment and microalgae production could reduce the required energy and CO2 emission, which could improve microalgae systems. This research differs from previous studies in the following two ways. First, the reproducibility in commercial plants is high because the parameters are set by experimental values from Minamisoma and not theoretical values. Secondly, the comparison is being made with the existing systems that are replaceable because of their superiority, with a thorough assessment of the applicability of the technology.

2. Methodology

The authors conducted repeated laboratory experiments, and field experiments using outdoor culture ponds of 33 m2 which located in Kurihara (Ibaraki Prefecture), and culture pond of 1000 m2 in Minamisoma. From the cultivation phase up to biocrude production phase, many issues were raised and a detailed procedure for full-scale plant design was obtained [4]. Based on these results, this study simulation was performed. The main reconstruction was emphasized based on five aspects: use of wastewater, reducing commercial nutrients, energy of circulation equipment, energy requirements for HTL, and centrifugation processes. These five aspects have been considered in a previous study regarding microalgae oil-production systems [5].
The suitable combination between an algae system and wastewater treatment plant (WWTP) was investigated; subsequently, an oxidation ditch (OD) method for WWTPs [6] was discovered. Regarding wastewater use, semi-continuous cultivation with overflowing wastewater (primary treatment water) and sodium acetate (0.3 g/L) in the first sedimentation basin was performed at the Tobu purification center (standard activated sludge method) located in the Ibaraki prefecture. Consequently, an algae biomass productivity of 0.037 to 0.049 g/L/day has been reported [4].
Algal production from primary treatment water has been confirmed. However, the possibility of raw sewage from the OD method can be used instead of overflowing wastewater from the standard activated sludge method (Tobu purification center). The auxiliary experiment, which was performed using raw sewage from the university’s sewage pit, indicated a possibility. The result of algae productivity was 16.8 g/m2/day with a hydraulic retention time (HRT) of 4 days and add 5% CO2 (1 L/min/10 L-wastewater) [7]. Therefore, algal production using raw sewage in the OD method was assumed, where wastewater can be used to reduce freshwater load. However, further research is required on algae productivity values.
Regarding the reduction of commercial nutrients, the waste from the HTL process could be recycled as nutrients [4]. The additional use of waste organic acids from the HTL process at a high algae concentration is effective for promoting growth. In that experiment, waste organic acids from the HTL process were treated by activated carbon. Half of the nutrients were recycled from the waste and the other half of the nutrients were provided by sodium acetate from commercial nutrients that were used in the initial stage of culture with low algae concentrations.
The energy requirement, such as circulation in an ORP, was calculated from existing facilities in Minamisoma [4,5]. However, in this study, the equipment size and number were optimized for the usage time and maximum daily processing capacity, of which the values were calculated using a function (Appendix A) that reflected the reality better. Also, energy consumption was reduced by changing the centrifugation to condensed sedimentation with flocculants. Furthermore, for the HTL energy, waste heat from power plants or other facilities was used for heat treatment, instead of electricity.
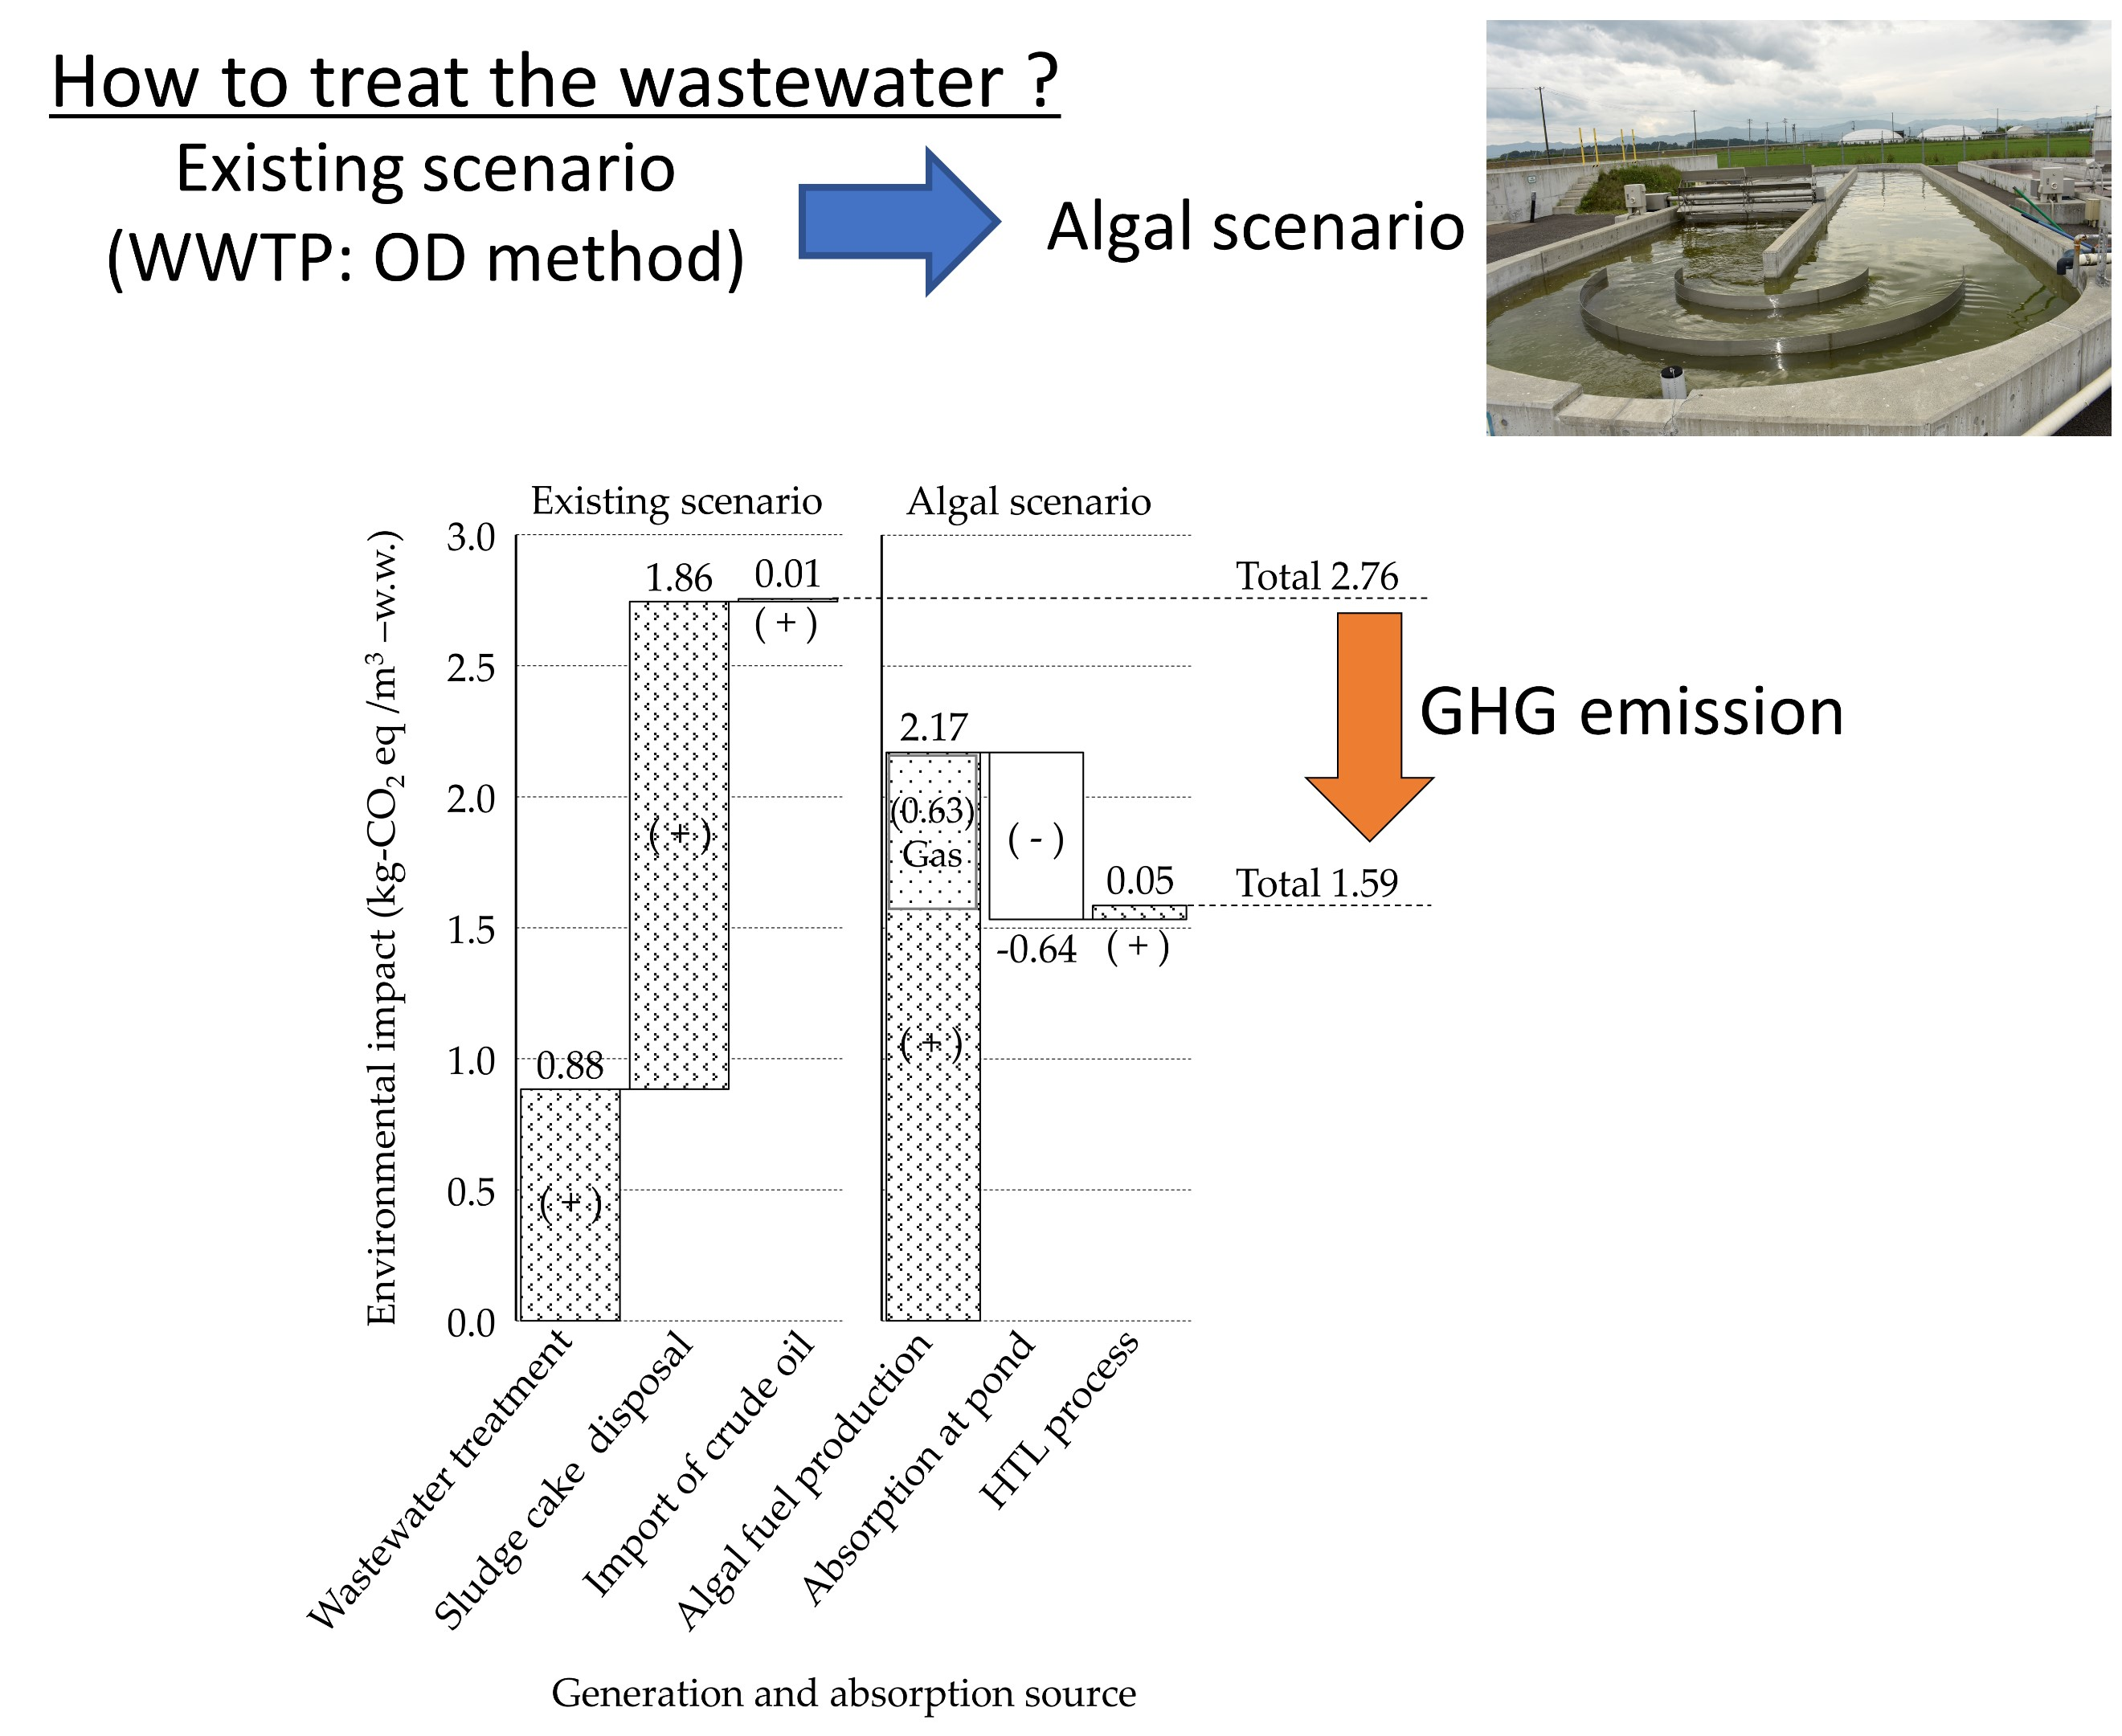
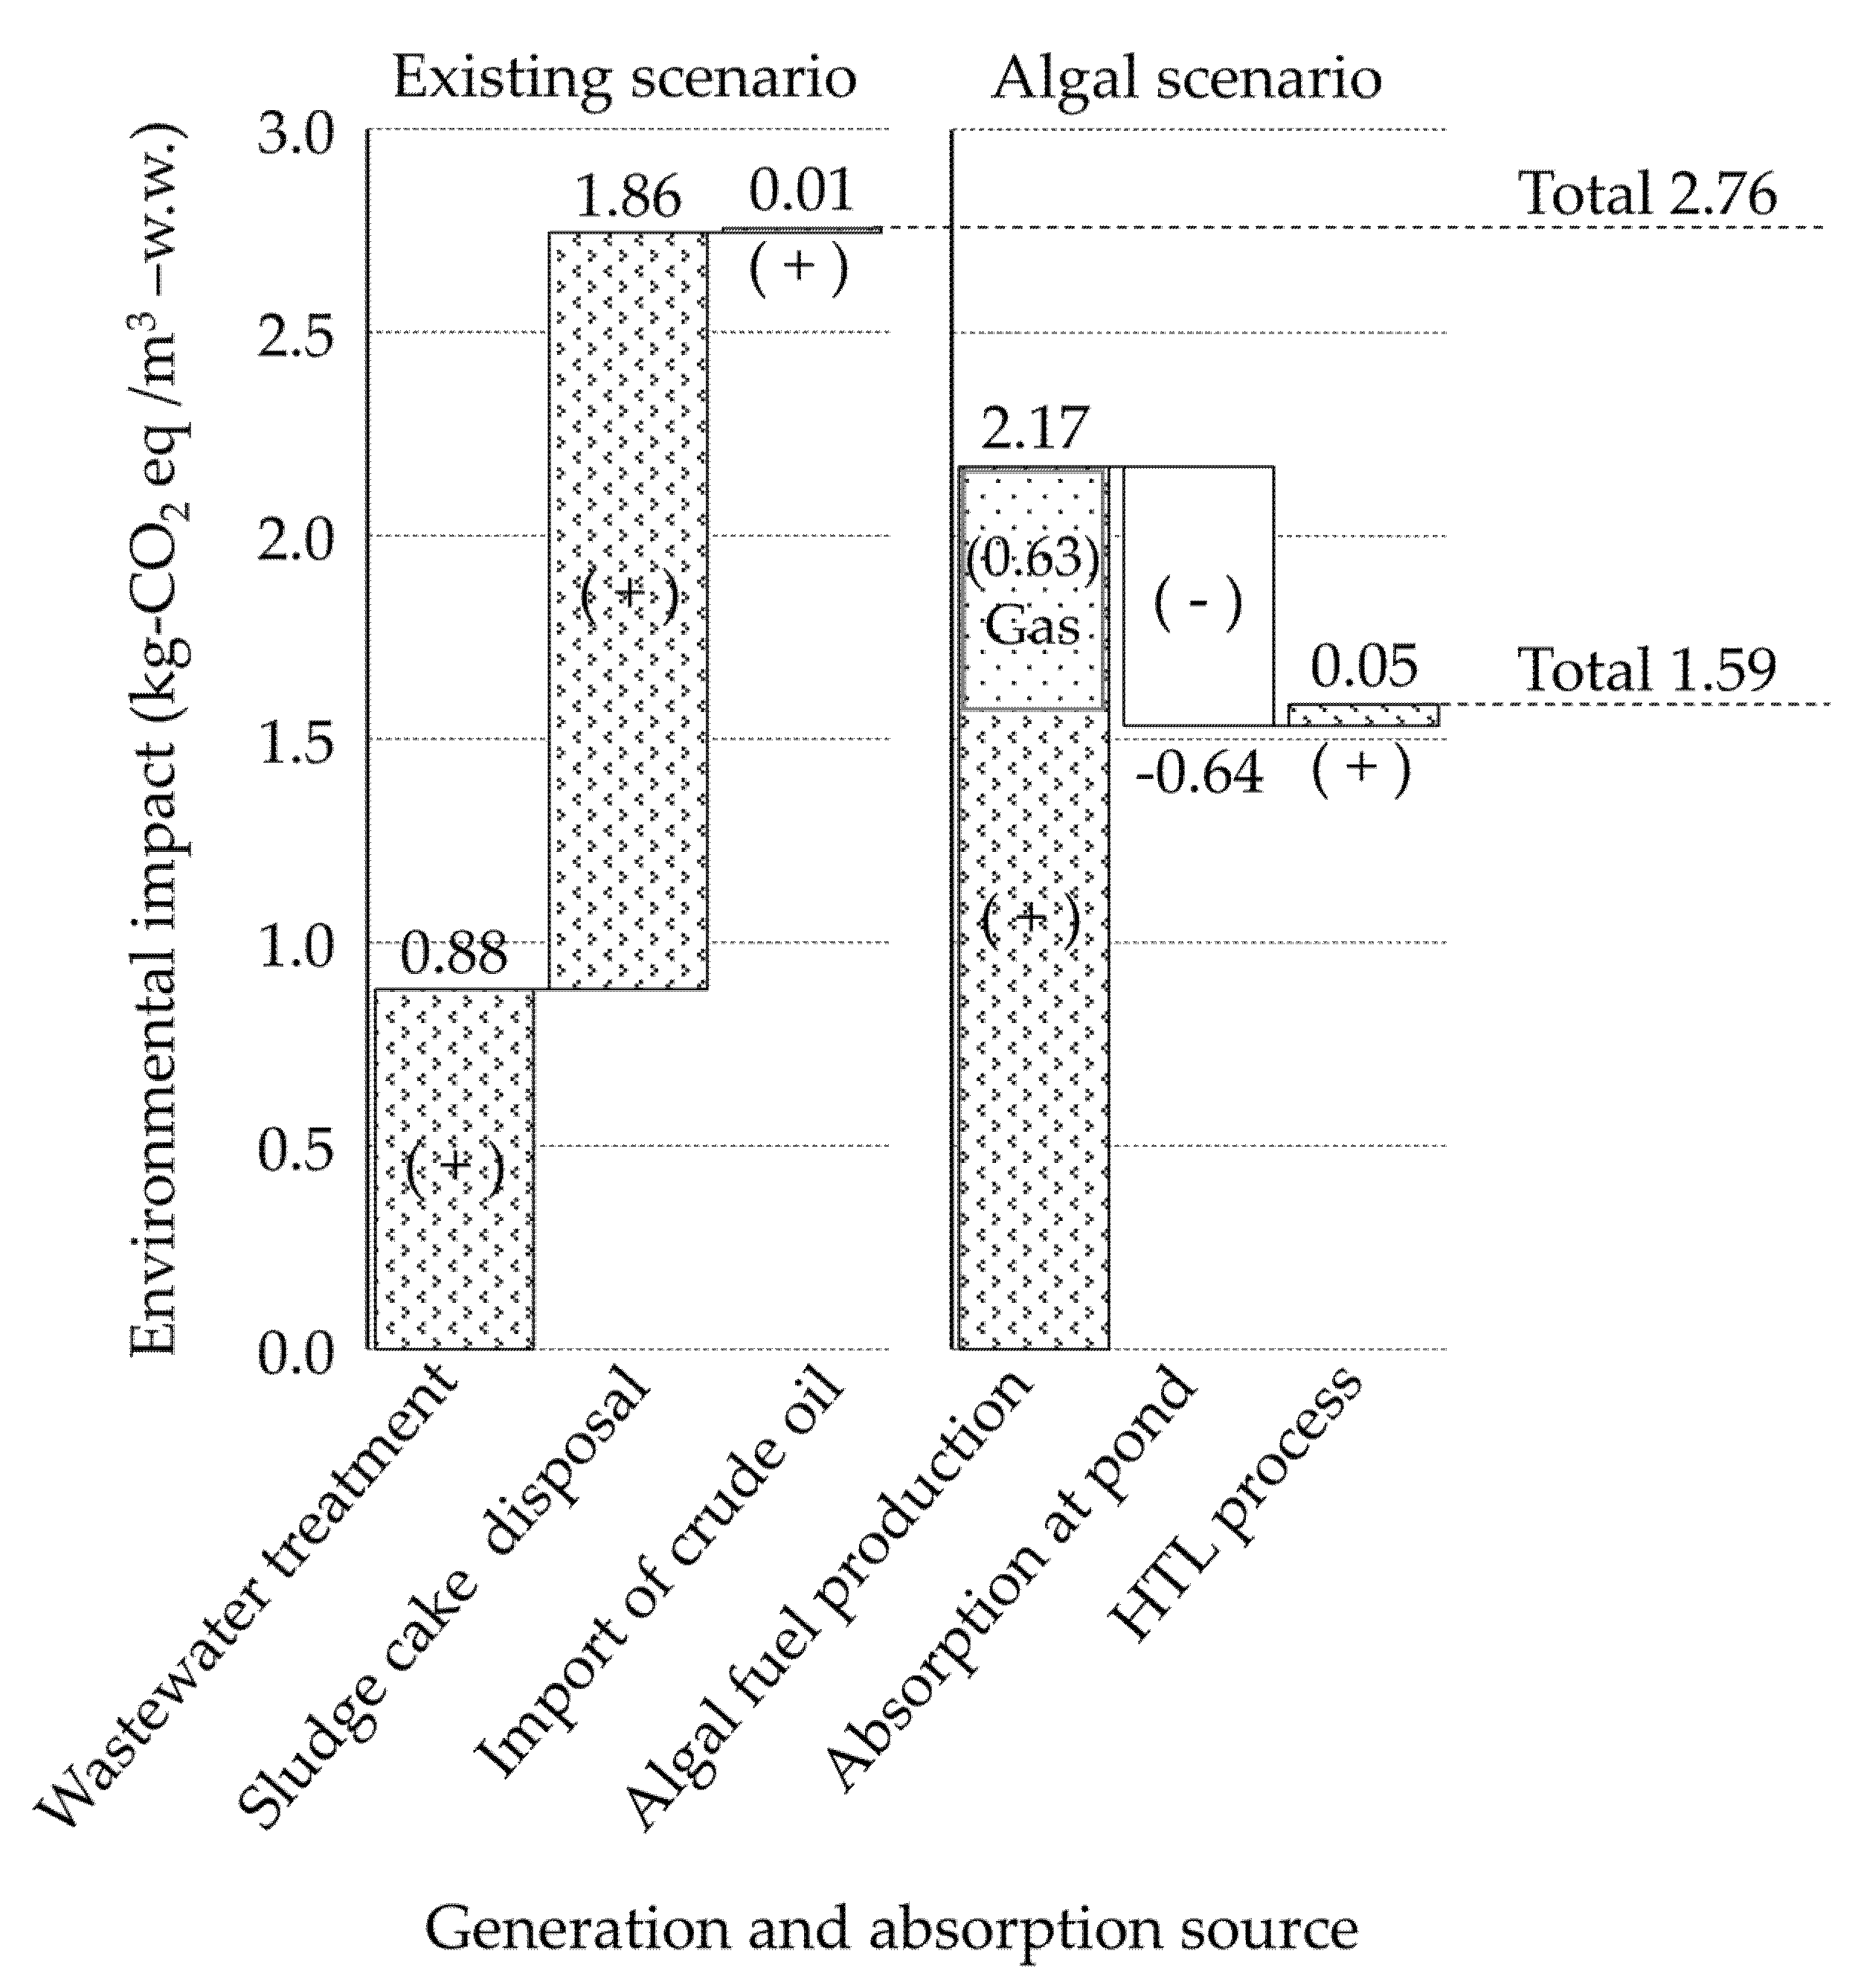
In terms of environmental impact, it was assumed that the exhaust gas and exhaust heat from the power plant could be used without any cost or environmental impact. Also, algae absorption in the culture pond was considered, as well as the emissions related to sludge cake treatment from the OD method. Therefore, two scenarios are proposed in this study: “existing wastewater treatment scenario (existing scenario)” and “algae integrated wastewater treatment scenario (algal scenario)”.
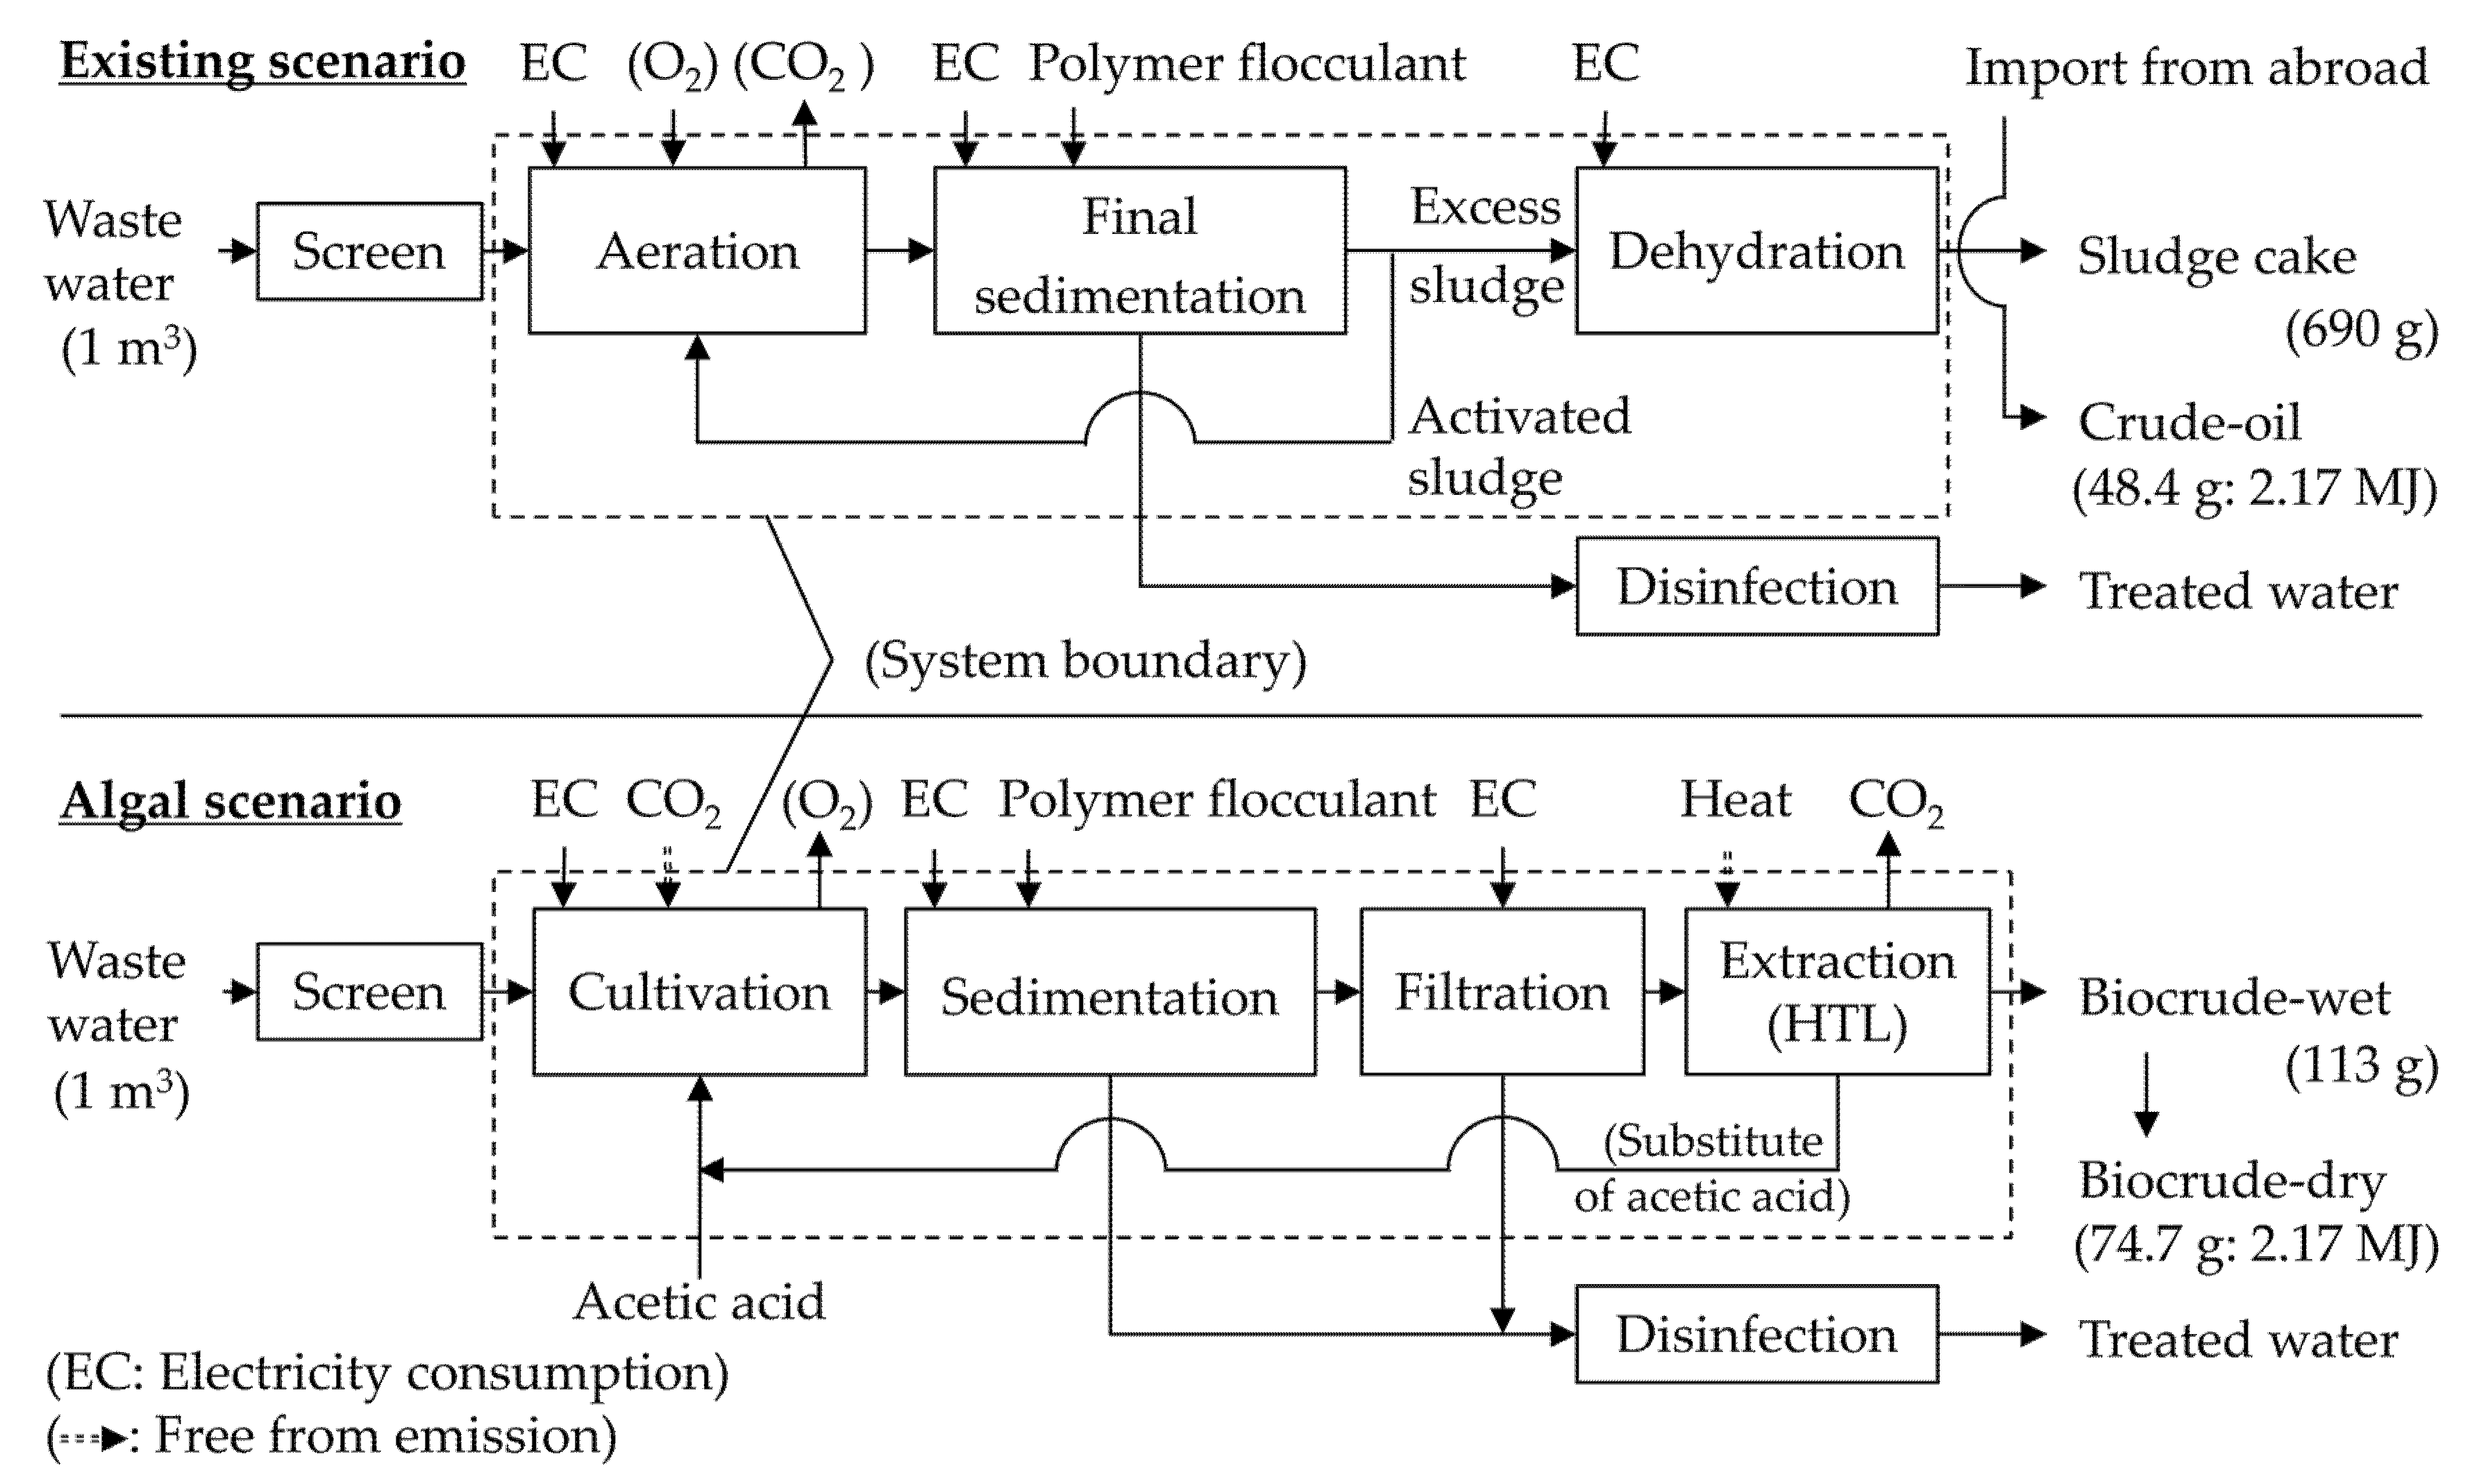
In the wastewater treatment system, the existing scenario begins with aeration and the algal scenario with cultivation (Figure 1). For comparison, both scenarios treat the same 1 m3 of wastewater and produce or import oil of 2.17 MJ. Furthermore, each process’ mass of 50-m3-based experiment was divided into 1 m3 (Table 1). Biocrude-wet was assumed as the final product in the algal scenario to compare with crude oil in the existing scenario. After the HTL process, the microalgae are converted to biocrude-wet and the aqueous phase. Subsequently, the substance that dries the biocrude-wet at a temperature of 105 °C until the weight change within 30 seconds is less than 0.01% is called biocrude-dry. The approximate value of two-third of the biocrude-wet to biocrude-dry (0.66) was obtained from the open raceway pond at Minamisoma (Dominant species: Desmodesmus sp.), under the university of Tsukuba [8]. One example, the ratio was 0.76, which calculated from below. The 798.8 g at 19.9% biomass suspended solid (SS) of biocrude-wet yielded 611.0 g of biocrude-dry. Under the experimental temperature of 350 °C and a pressure of 19.4 MPa in the HTL process. In another example, using a ratio of 0.69, a 669.7 g at 18.9% SS of biocrude-wet yielded 458.8 g of biocrude-dry. Under the experimental conditions of 350 °C and 19.5 MPa in the HTL process.
Therefore, 113 g of biocrude-wet was purified to 74.7 g (113.2 g × 0.66) of biocrude-dry. Moreover, 74.7 g of biocrude-dry was equal to 48.4 g of crude oil, based on the same higher heating value (HHV) equivalent to 2.17 MJ (0.0747 kg × 29.1 MJ/kg ≈ 0.0484 kg × 44.9 MJ/kg). The processes within the dotted lines represent the system boundary. However, input and output processes such as (O2) and (CO2) were not calculated.

2.1. Existing Wastewater Treatment Scenario (Existing Scenario)

The direct energy and materials for the existing scenario were calculated to estimate the environmental effect; 1 m3 of wastewater treatment was included in 690 g of the disposal sludge cake and 48.4 g of the imported crude oil. The construction energy and materials were not involved in this calculation because the constructed WWTP’s ditch and equipment were likely to be used for algae production. All data to calculate the existing scenario were from a related study.
The existing scenario included CO2 equivalent (eq) emissions for three operational units: emissions from the WWTP by the OD method, from the sludge cake disposal treatment, and from the imported crude oil. The OD method was selected so that the WWTP could be used as a competitor in the algal scenario. The treatment tank of the OD method was similar to the ORP for microalgae cultivation except for the water depth. The general water depth in the OD method was 2.5 m.

2.2. Algae Integrated Wastewater Treatment Scenario (Algal Scenario)

In the algal scenario, 1 m3 of wastewater can be treated by generating 113 g of biocrude-wet by cultivating the microalgae. The flocculation tank was set in this scenario because using a polymer flocculant and flocculation tank was more efficient than using centrifuges, which were used at Minamisoma (
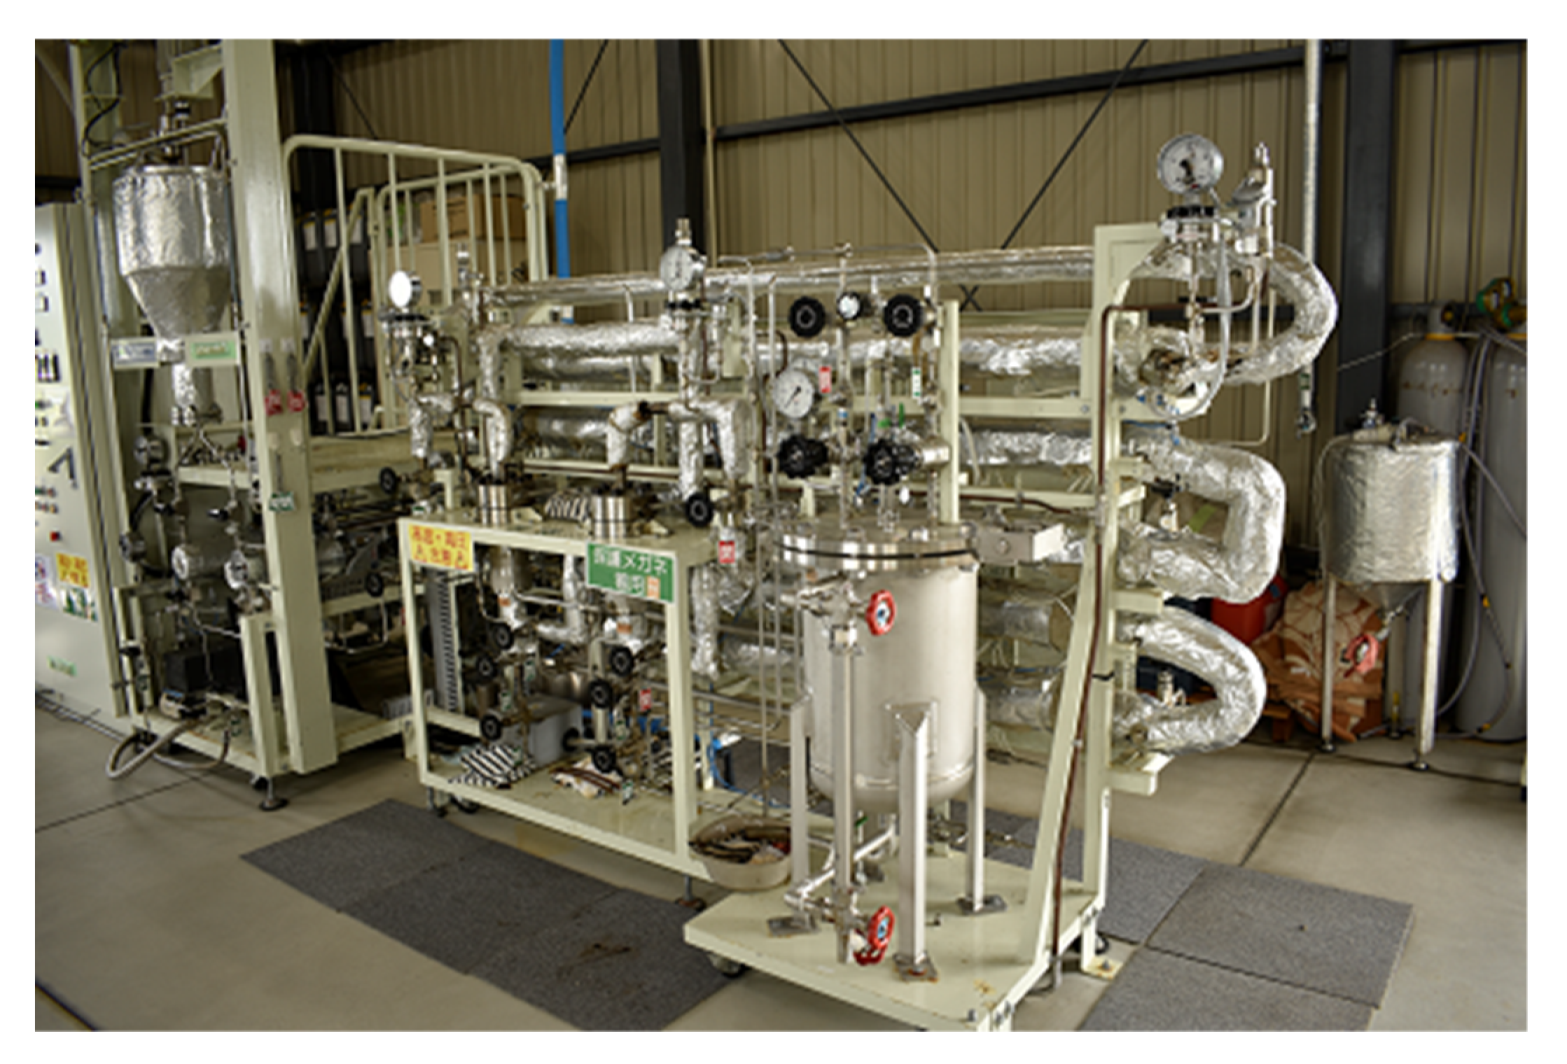
Table 2). If the centrifugal separator is used for dewatering, the energy usage will be 3–5 kWh/kg-dry-microalgae. Therefore, approximately 30 MJ/L-biocrude was required, which is comparable to the amount of heat generated by biocrude itself. Also, the flocculation system was already used in the OD method’s WWTP in Japan. In addition, a technical methodology for wastewater treatment had been established and optimized.
The environmental impact values were converted to CO2 eq using the global warming potential in 100 years’ time horizon (GWP 100) with SimaPro® v8.0.4. The SimaPro® is the name of LCA software developed by PRé Sustainability company located in the Netherlands.
Relevant data were collected from previous studies. Wastewater was introduced from a sewage facility as a nutrient for the microalgae. The production of microalgae was calculated based on the results obtained from the pilot plant of microalgae biofuel production in Minamisoma [4]. Subsequently, sufficient exhausted CO2 and waste heat were assumed for algae fuel production.
The feasibility of wastewater treatment was integrated with microalgae growth culture [4]. In that experiment, the algal system successfully treated wastewater collected from the Kokaigawa Tobu WWTP in Ibaraki prefecture in December 2018. Before the treatment, the water exhibited a 5-day biochemical oxygen demand (BOD5) of 52 mg/L, suspended solids (SS) of 140 mg/L, total nitrogen (TN) of 23 mg/L, and total phosphorus (TP) of 4.5 mg/L. Subsequently, after being treated by the algal system, the water exhibited a BOD5 of 17 mg/L, SS of 18 mg/L, TN of 7.3 mg/L, and TP of 0.19 mg/L. Meanwhile, the water treated by the WWTP exhibited a BOD5 of 11 mg/L, SS of 15 mg/L, TN of 9.1 mg/L, and TP of 1.4 mg/L. Both systems cleared the standard limit, which was a BOD5 of less than 40 mg/L and an SS of less than 40 mg/L.
Moreover, the required amounts measured from the conventionally used artificial medium [7] were TN of 14.0 mg/L and TP of 1.2 mg/L. Compared with before the treatment, the BOD5 was 52 mg/L, SS 140 mg/L, TN 23 mg/L, and TP 4.5 mg/L, and the TN and TP were sufficient for the inflow wastewater.
The algal scenario included emissions from wastewater treatment as a nutrient for the microalgae, CO2 absorption at the ORP, and CO2 emission in the HTL. Furthermore, the algal scenario included the use of CO2 containing exhaust gas in the ORP and the use of discharged heat in the HTL process from power plants.
The water depth of the ORP for producing microalgae was 0.2 m. Furthermore, experiments in the Minamisoma plant revealed that it could grow even at a depth of 0.8 m. A difference in distance exists between the OD method (2.5 m) and algae ORP (0.8 m). However, the processing capacity of a WWTP using the OD method is generally half that of Tochigi prefecture. Some WWTPs using the OD method used only 3% of its capacity. WWTPs using the OD method are in a rural area. Therefore, if the system capacity is reduced to one third, and assuming that both HRTs are the same, the algal system can be introduced by reducing the depth of the OD from 2.5 to 0.8 m.
From the experimental analysis, it was discovered that the primary overflow water at a standard activated sludge method can be used for algal cultivation. However, in this scenario, the nonprimary treated water at the OD method was set instead of the primary overflow water. Consequently, the effect of algae growth may not be the same throughout the process.

2.2.1. Datasets for Simulation

To calculate the CO2 emission and energy profit ratio (EPR) in the algal scenario, the following data were used in the simulation process. The data were based on the experiment at Minamisoma, from the input of 50 m3-wastewater (m3-w.w.) per day produced by 5.66 kg biocrude-wet. First, the calculation was done based on 50 m3-w.w./day and then divided the result by 50 to adapt to the 1 m3-w.w. of the algal scenario.
More than one hundred parameters had to be calculated in the algal scenario. For convenience, the parameters were categorized into independent, dependent, and fixed. The independent parameters imply that the parameters can be adjusted based on the situation. The dependent parameters change dynamically based on the independent and fixed parameters. The fixed parameter is fixed by experience and literature data (Table A1). The independent and dependent parameters are explained below, and part of the dependent parameters used in the functions (Table A2 and Table A3).

2.2.2. Use of Previous Research Results

The calculation of the algal scenario’s process in this study is a continuation of the theoretical energy analysis of algae fuel production [5]. The theoretical data was revised to experimental data using new experimental datasets (Table 3). The expanded calculation was performed to estimate the environmental effect.
In the algal scenario, cultivation, filtration, and extraction were used similarly as in the previous study. However, for the centrifugation process, the centrifuge equipment was replaced with a flocculation tank to reduce the energy input.
Moreover, a purification process was introduced. In a previous study [5], the HHV of biocrude-wet was set as 34.2 MJ/kg-biocrude-wet. However, in [4], the HHV of biocrude-dry was 29.1 MJ/kg-biocrude-dry for the microalgae purification in Minamisoma. Biocrude-wet was set as the final product for the flexibility of use for purifications that depend on the use purpose. Furthermore, the price is determined in the biocrude-wet condition, with consideration of moisture content.

2.2.3. Design Parameter of Raceway Pond

The basic parameters were set to calculate the CO2 emissions and EPR (Table 4). As mentioned previously, the independent parameters (Table A1) based on the situation (Figure 2) at Minamisoma, and the dependent parameters (Table A2 and Table A3) were read from the independent parameters automatically. For example, the pump capacity (83 L/min) was calculated by the daily handling volume (50 m3) divided by the working hours C (pump)(10 h/d), and divided by 60 min, in which the daily handling volume (50 m3) was obtained from the pond volume (200 m3) divided by the HRT (4 d). All calculations were based on the handling of 50 m3-w.w. per day.

2.2.4. Cultivation

In this section, the details of the parameters set and the mass balance for cultivation (ORP) in the algal scenario are provided (Table 5 and Figure 3). The wastewater was used as the liquid medium and nutrient, based on [
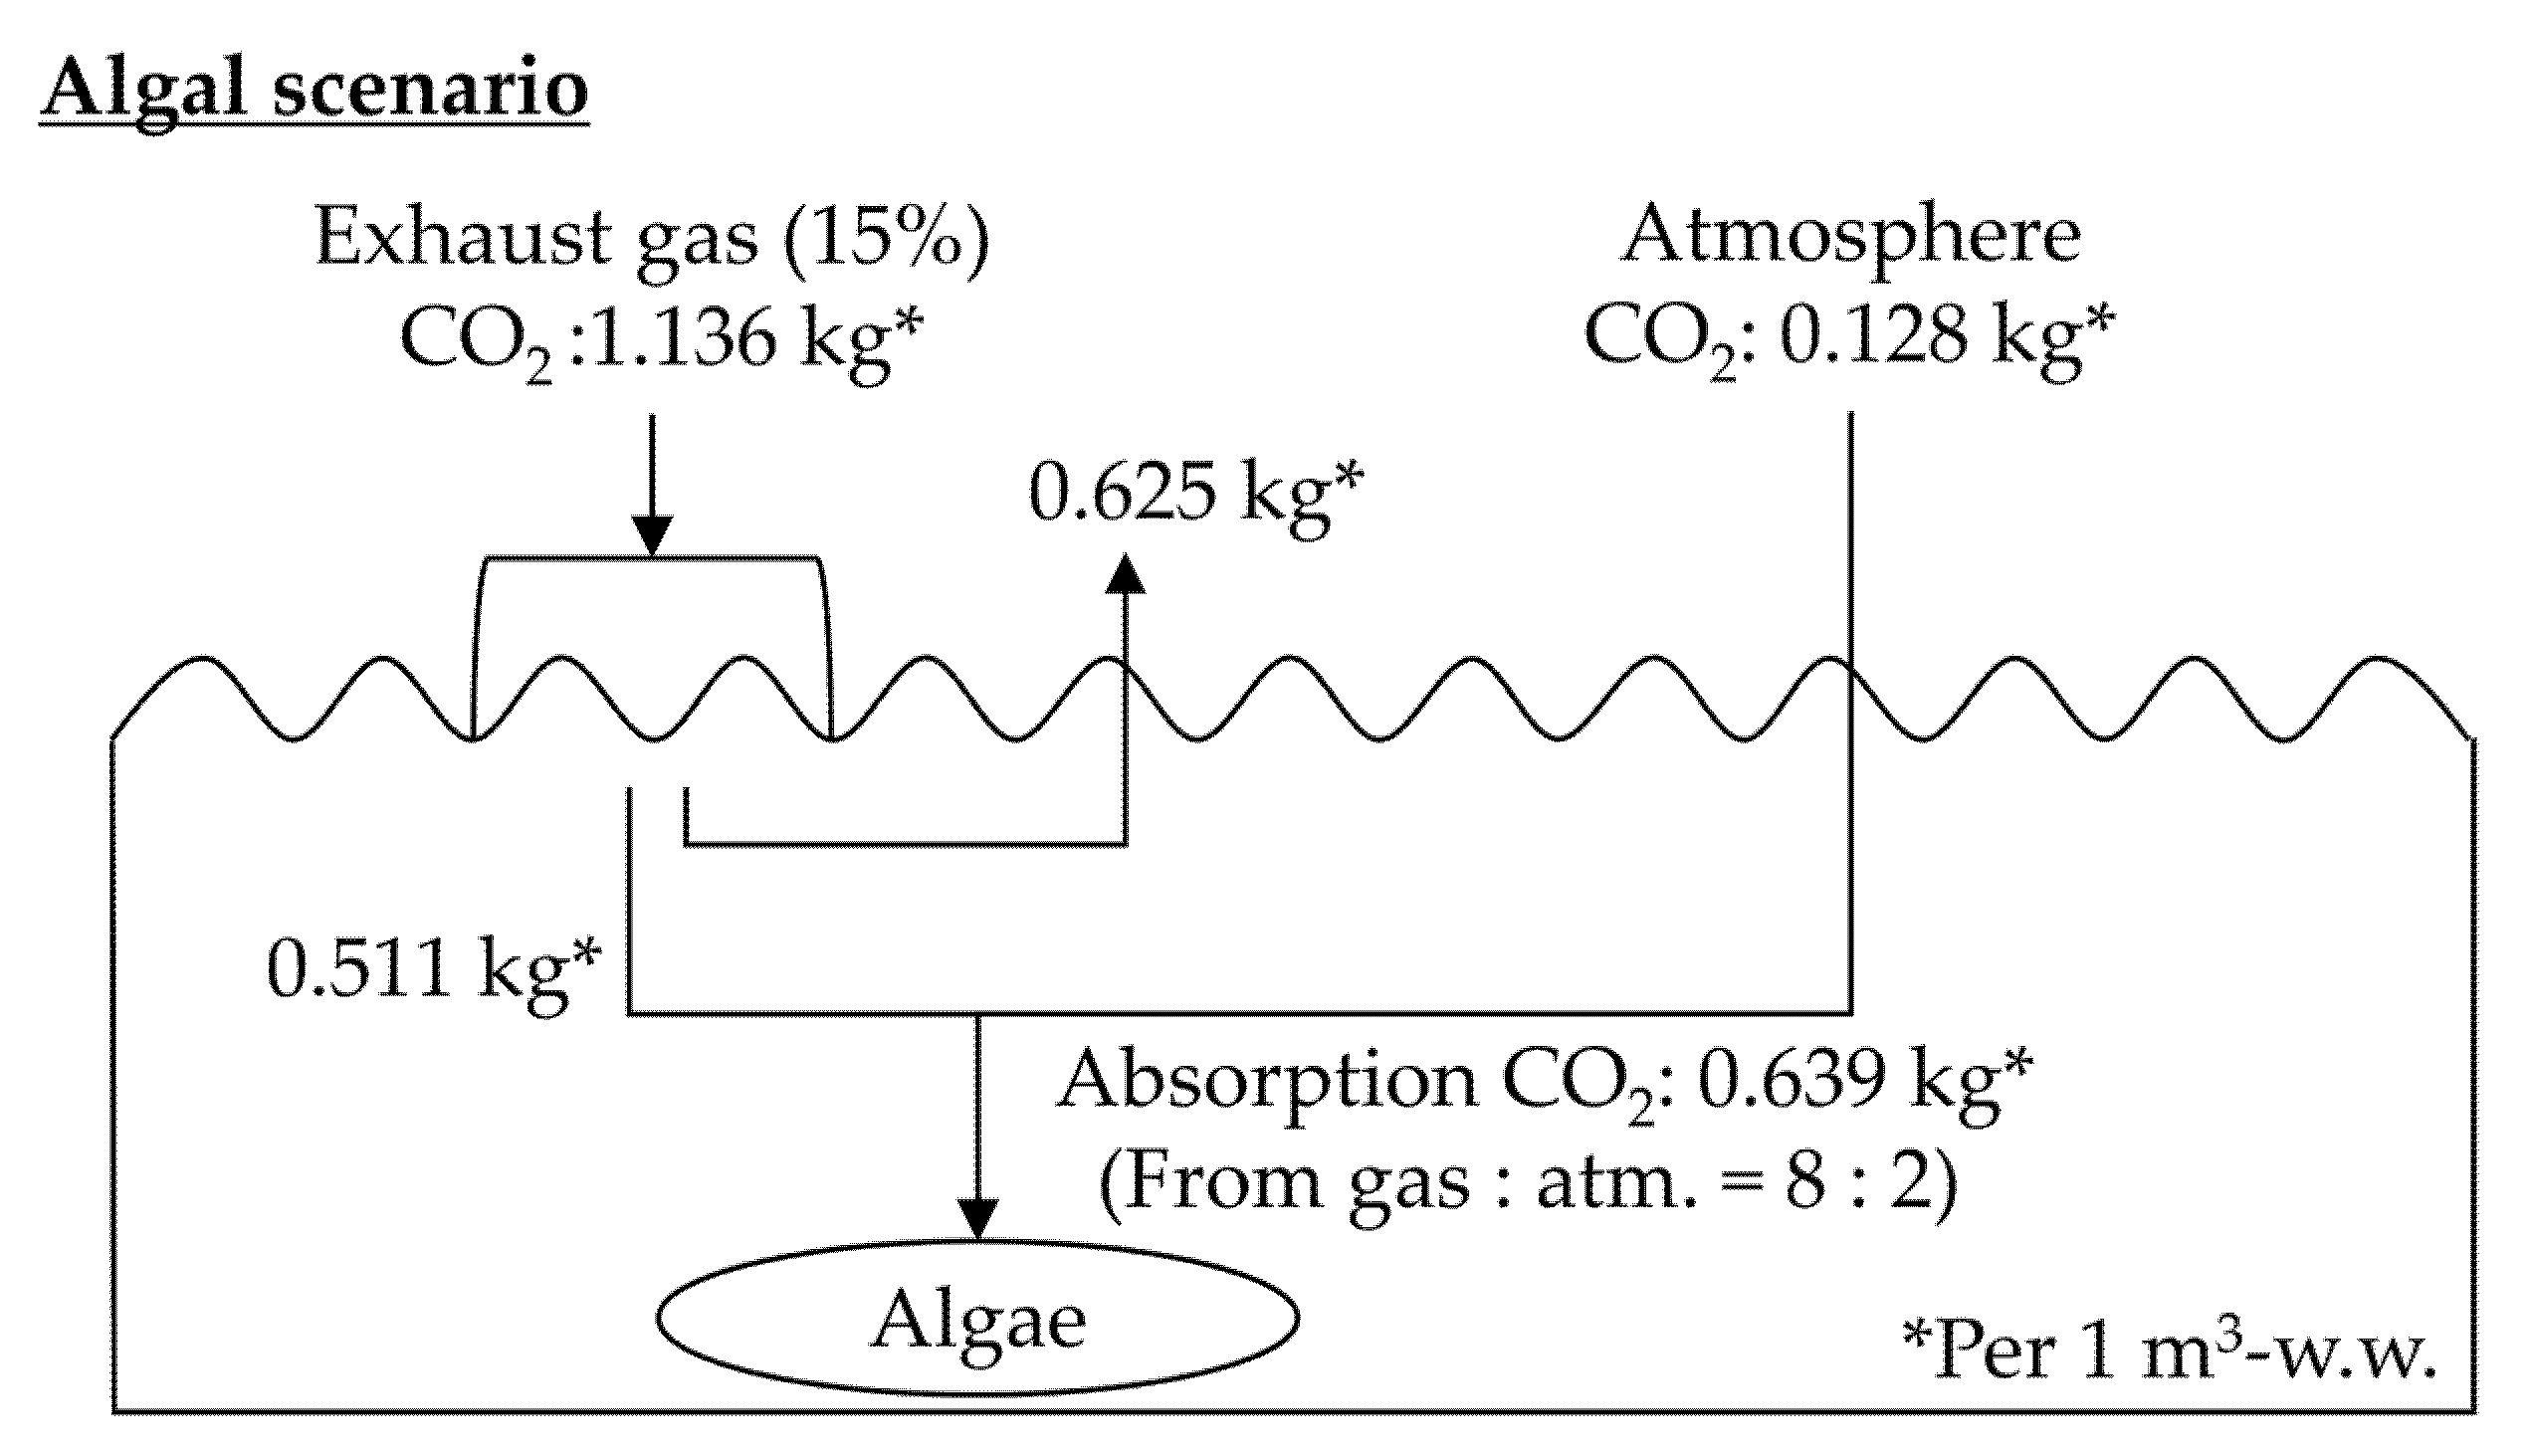
4], which refers to the possibility of wastewater as a water and nutrient supplier for the algae. As mentioned above, the additional CO2 (concentration 15%) was recycled from exhausted CO2 by a power plant or garbage incinerator. CO2 eq emissions were not observed. However, 55% (0.325 kg/m3-w.w.) of input CO2 generated an output to the atmosphere without absorption. Therefore, a direct emission in the scenario was calculated.
In the dependent parameters, the brackets are marked “(e4), (e1), and (n4).” These brackets implied that they were determined by the formulated function. For example, the electricity for the paddlewheel value of 36 MJ/day was calculated from (e4), {2.75 × 0.2 m (Depth)} kW × 18 h/day × 3.6 MJ/kWh = 36 MJ/day. Subsequently, electricity was added for a pump (Figure 4), and the total electricity was 72.7 MJ/day. The electricity of 72.7 MJ/day was calculated based on a one-day handling volume of 50 m3 in Minamisoma. The calculation standard of the algal scenario is 1 m3. To divide by 50 m3 for adopting 1 m3, the electricity consumption was observed 1.45 MJ/m3.
As mentioned in the Methodology, the exhausting nutrient from the HTL process was set in algal cultivation, because the exhausted nutrient could be used as a substitution of acetic acid [4]. Half of the acetic acid was replaced in this scenario. The total mass of acetic acid input was set at 0.3 g/L. Other masses of input, output, and waste were the same of those of a previous study [5]. The microalgae proceeded to the sedimentation process after cultivation.

2.2.5. Sedimentation

The flocculant sub-unit is a sedimentation process, described in the next sections of the cultivation system (Figure 1). In this unit, input is first received from the cultivation sub-unit and is concentrated in the flocculant tank. Subsequently, the output is passed on to the filtration sub-unit (Figure 5).
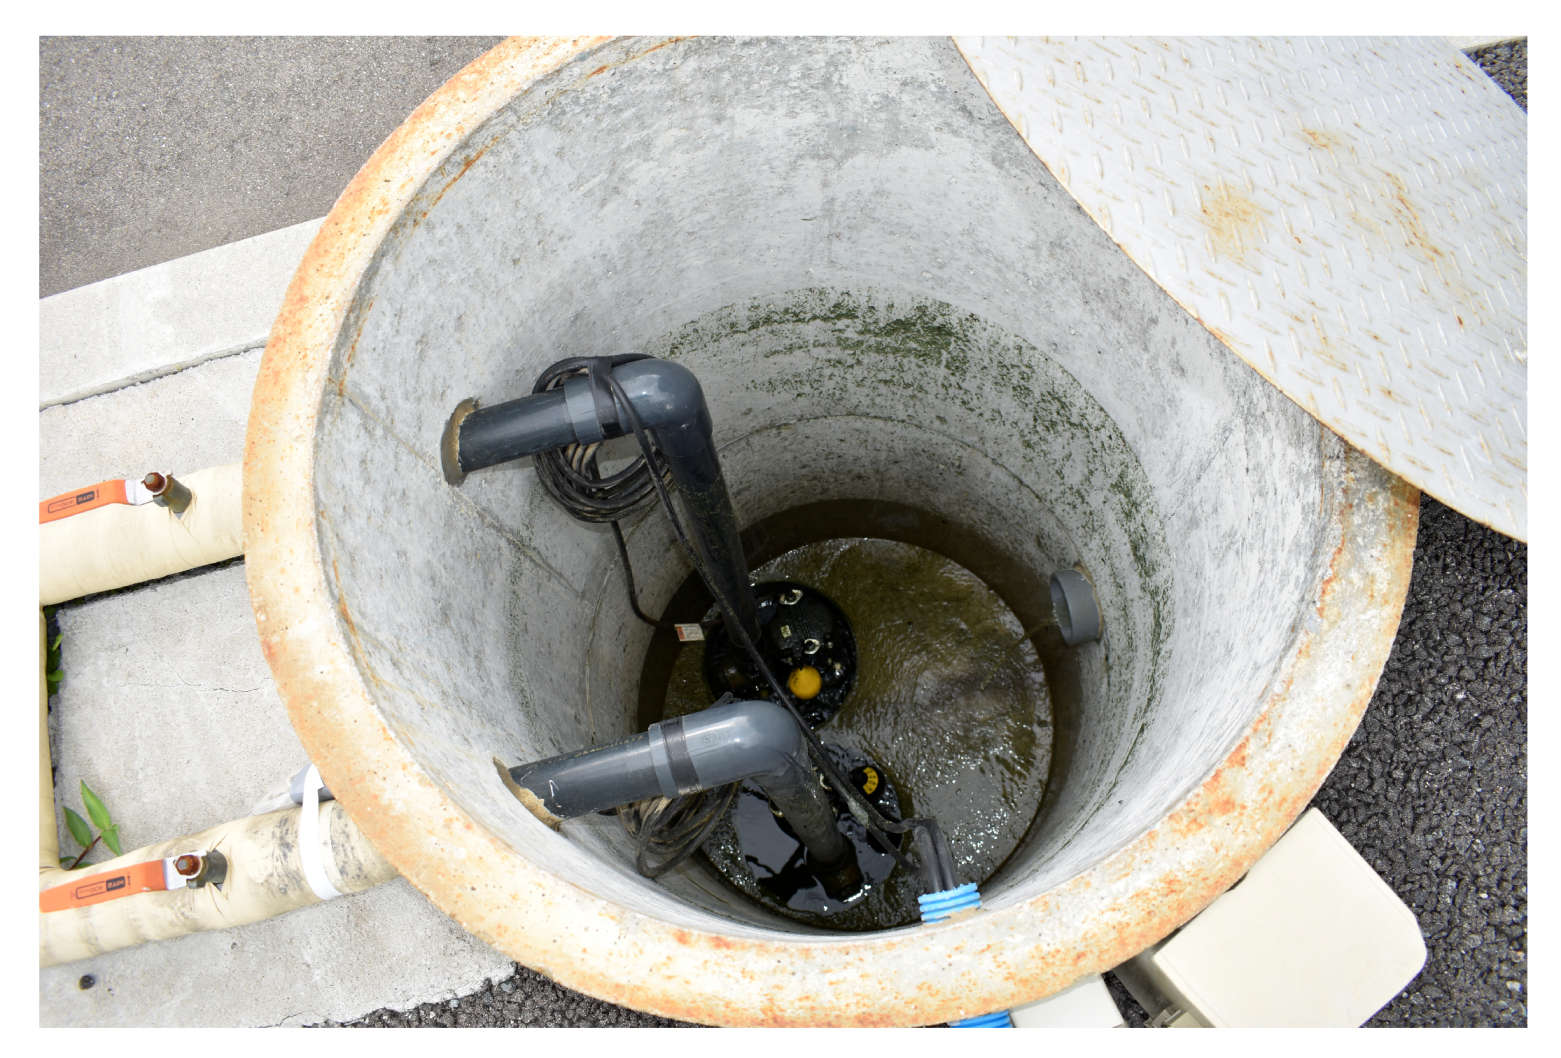
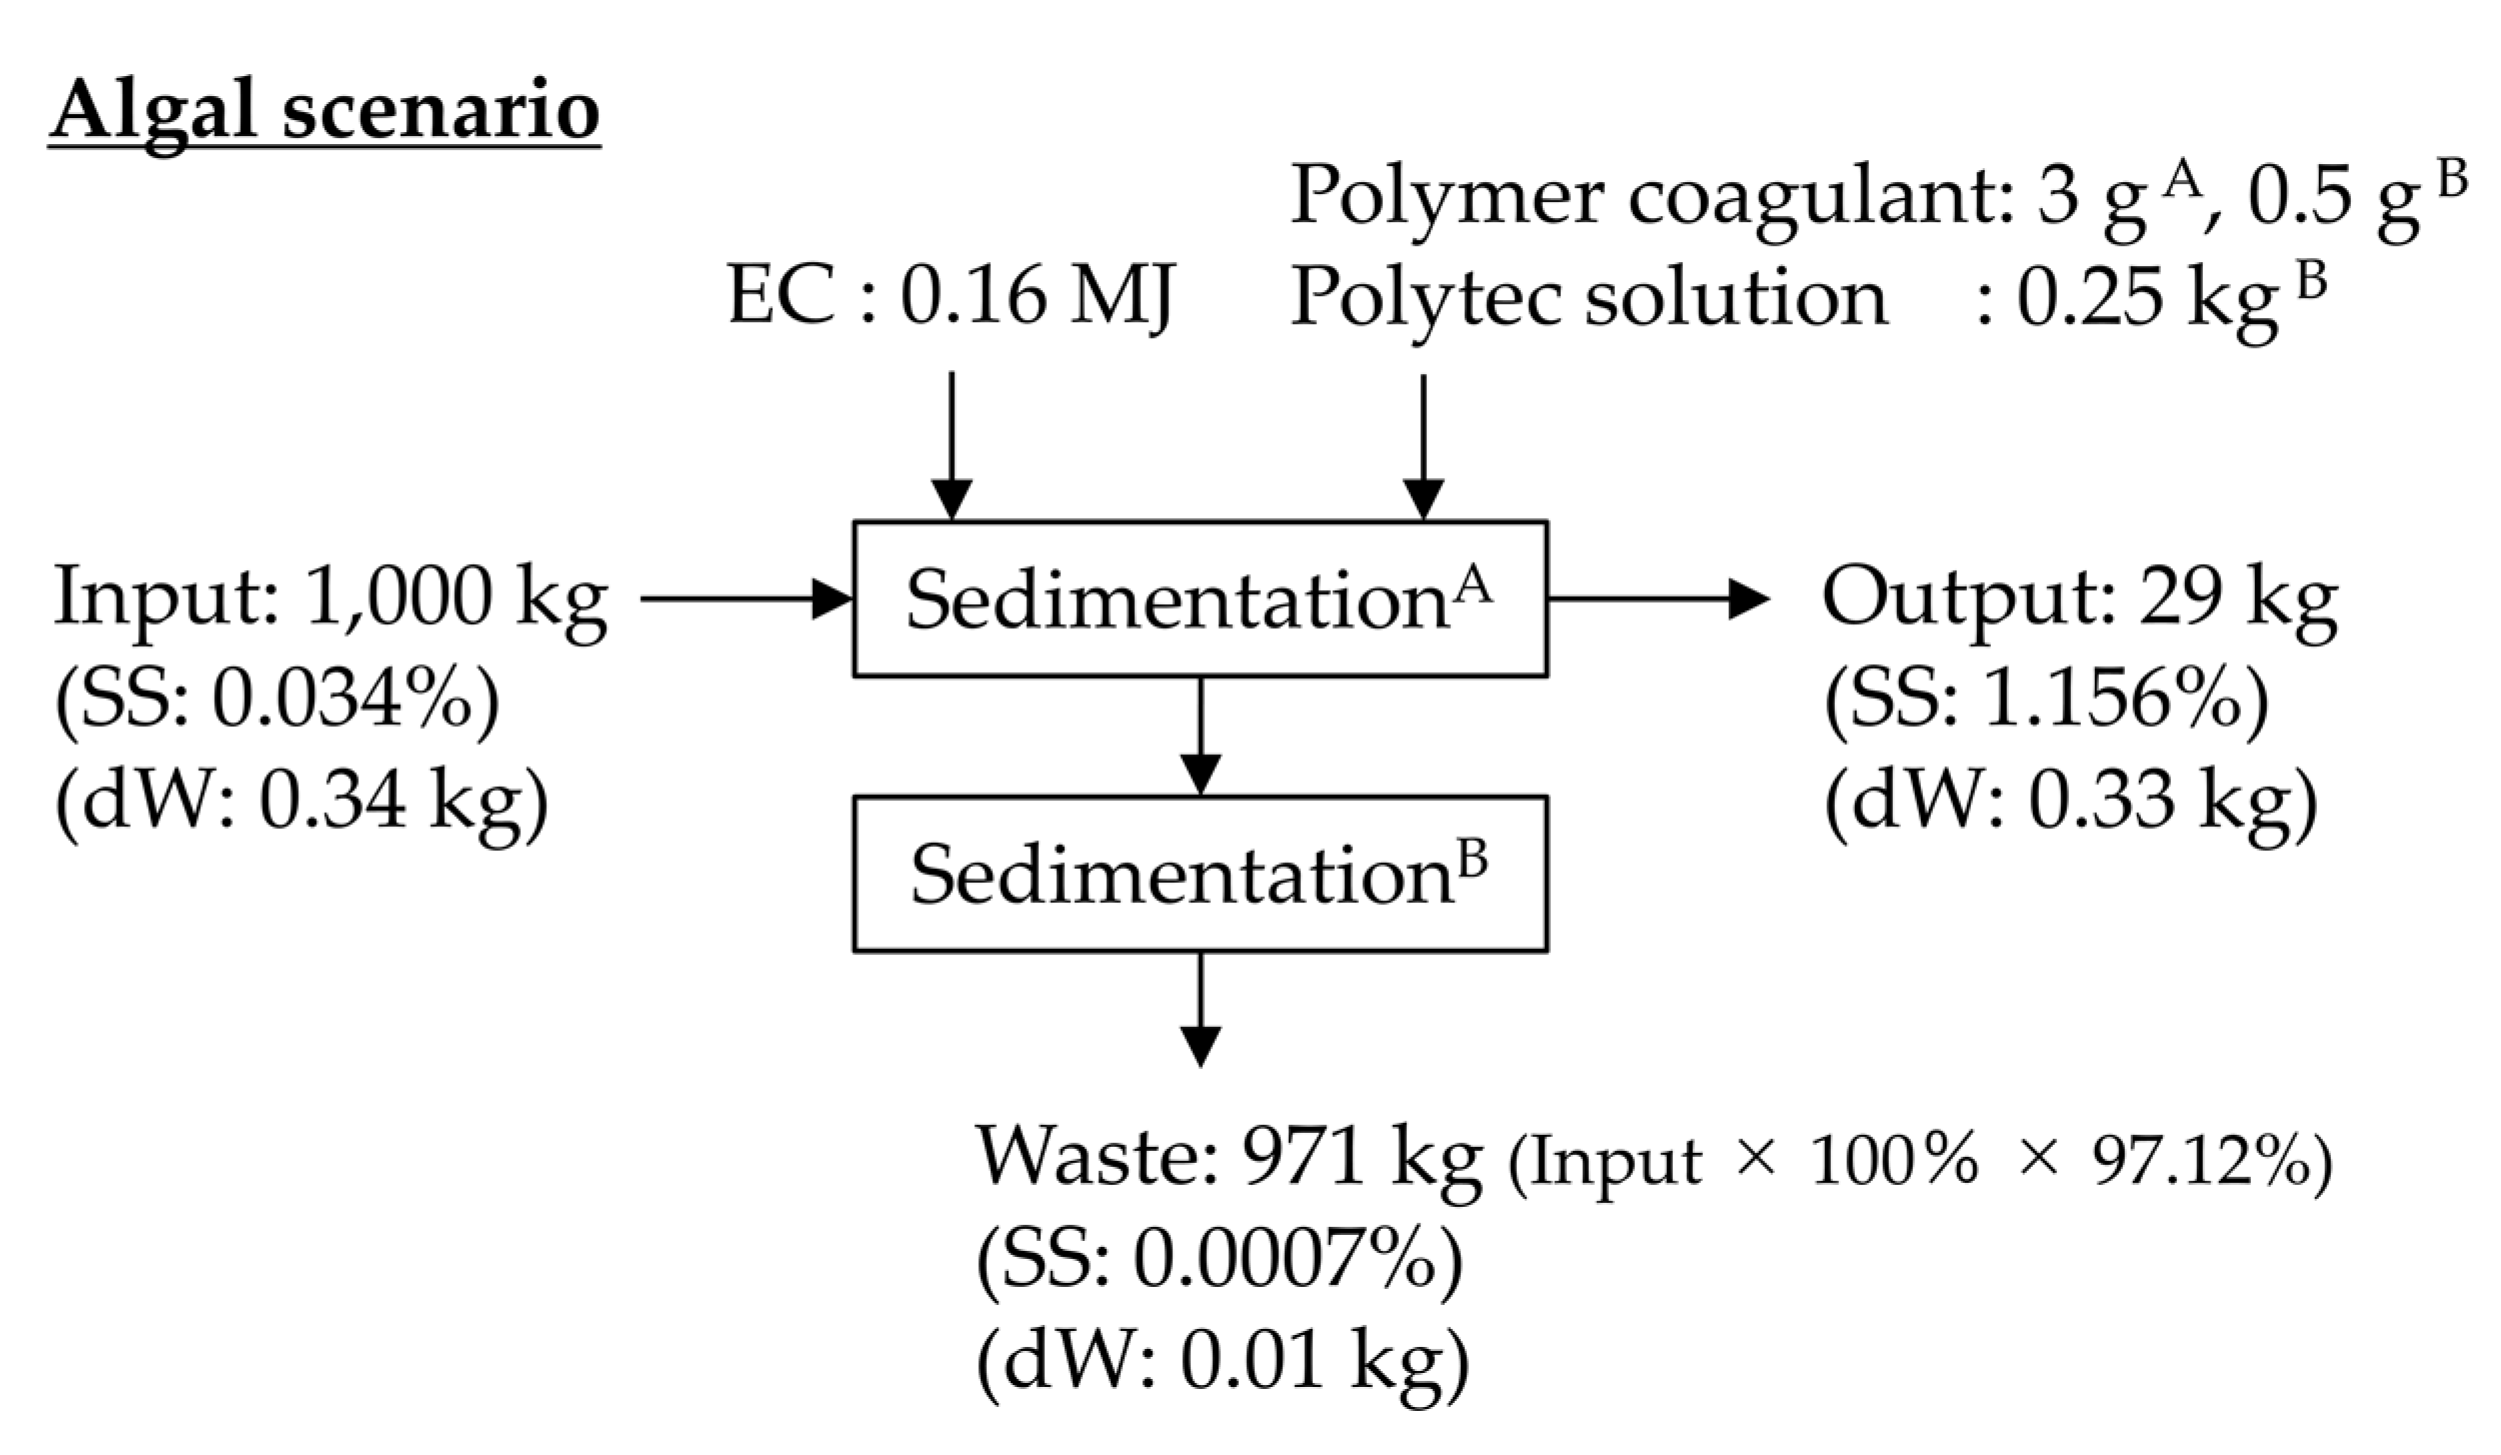
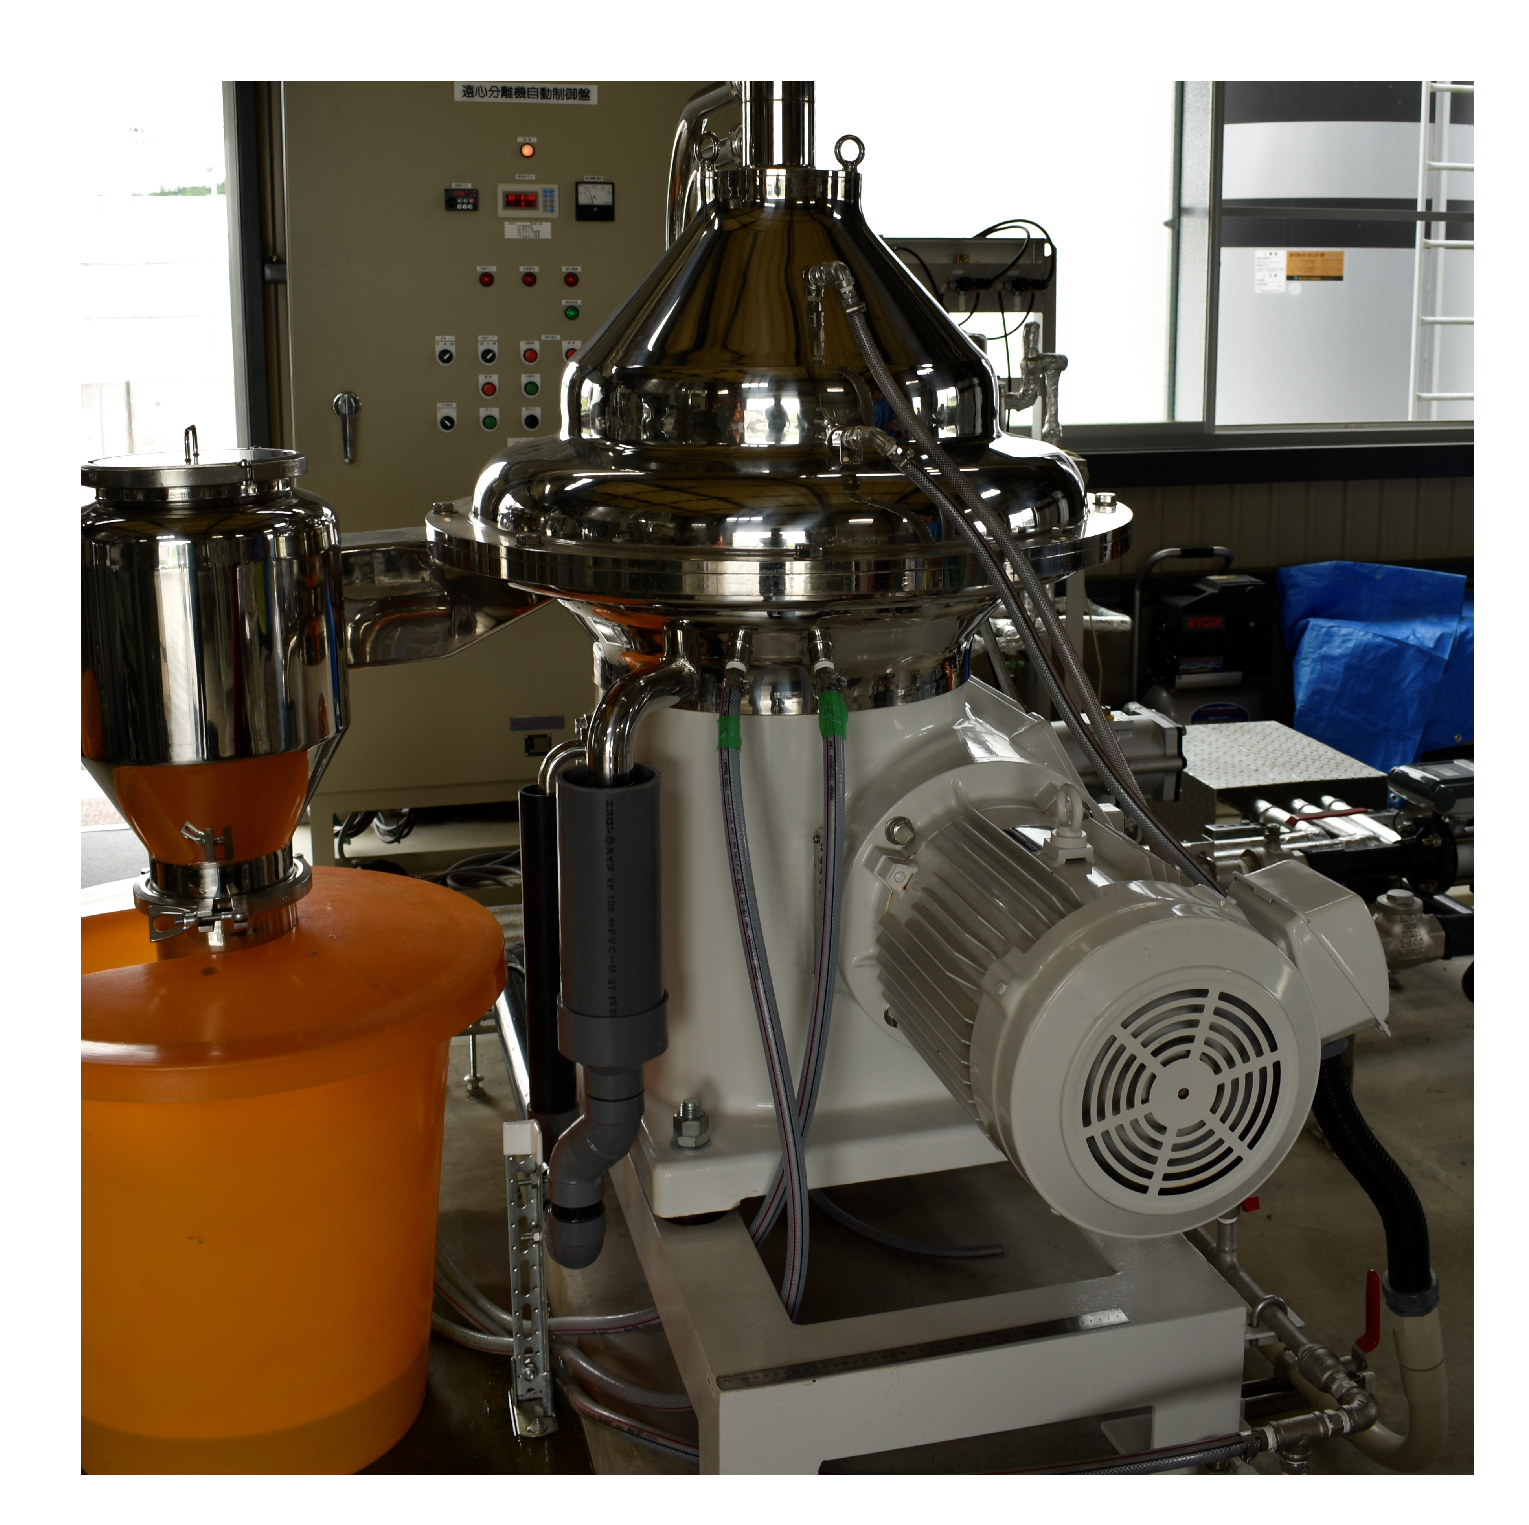
The centrifuge equipment (Figure 6) was replaced with a flocculation tank to reduce the energy input. A polymer coagulant (3 g/m3-w.w.) for harvest (Sedimentation A) and a polymer coagulant (0.5 g/m3-w.w.) with Polytec solution (0.25 kg/m3-w.w.) can be used for treating the waste (Sedimentation B); additionally, electricity (0.04 kWh/m3-w.w.) instead of centrifuge (1 kWh/m3-w.w.) can be used in the same microalgae recovery rate [4] (Table 6). The surplus material was known as “waste” instead of the term “sludge” used in [5], but their contents were the same.
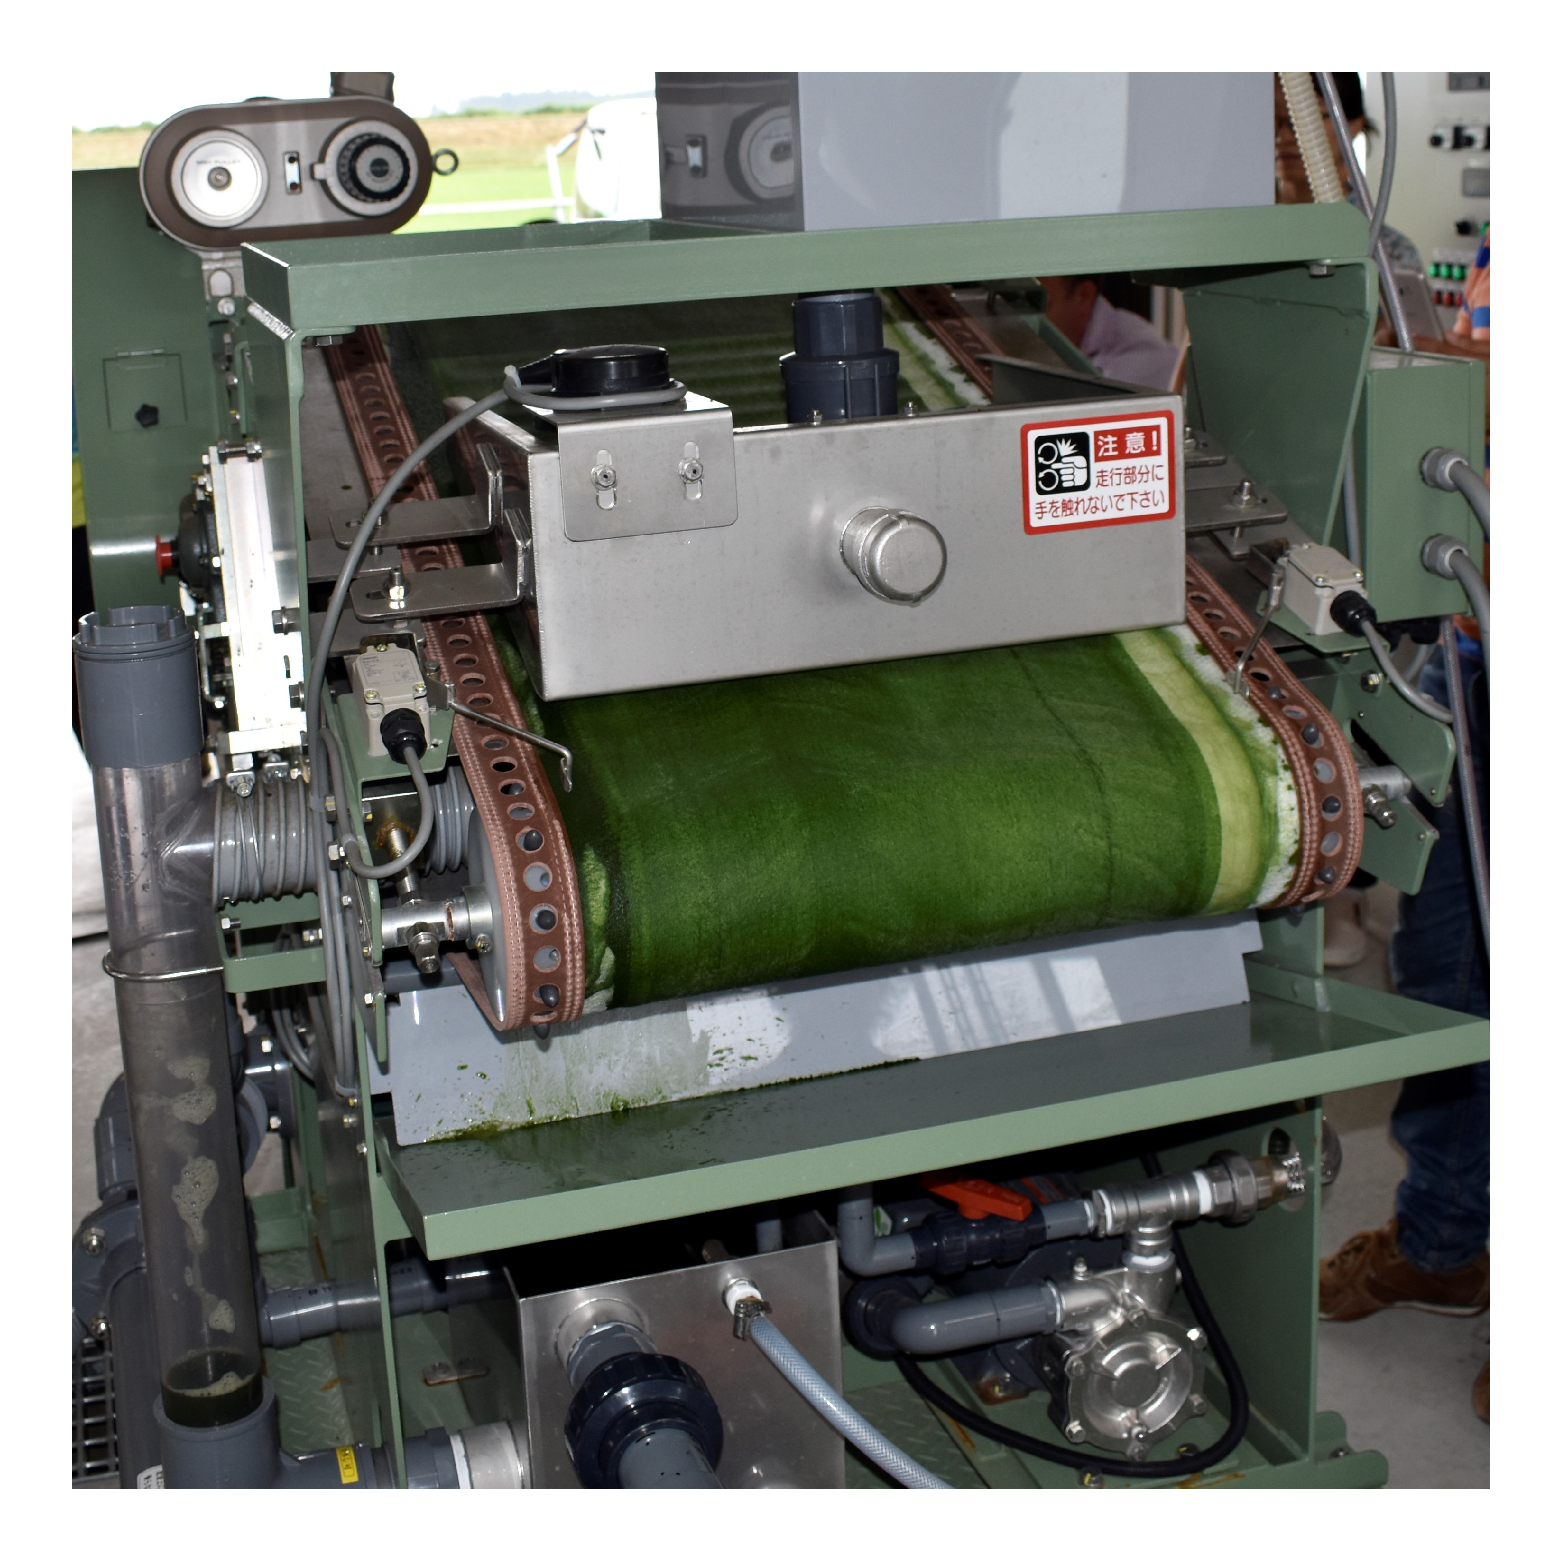
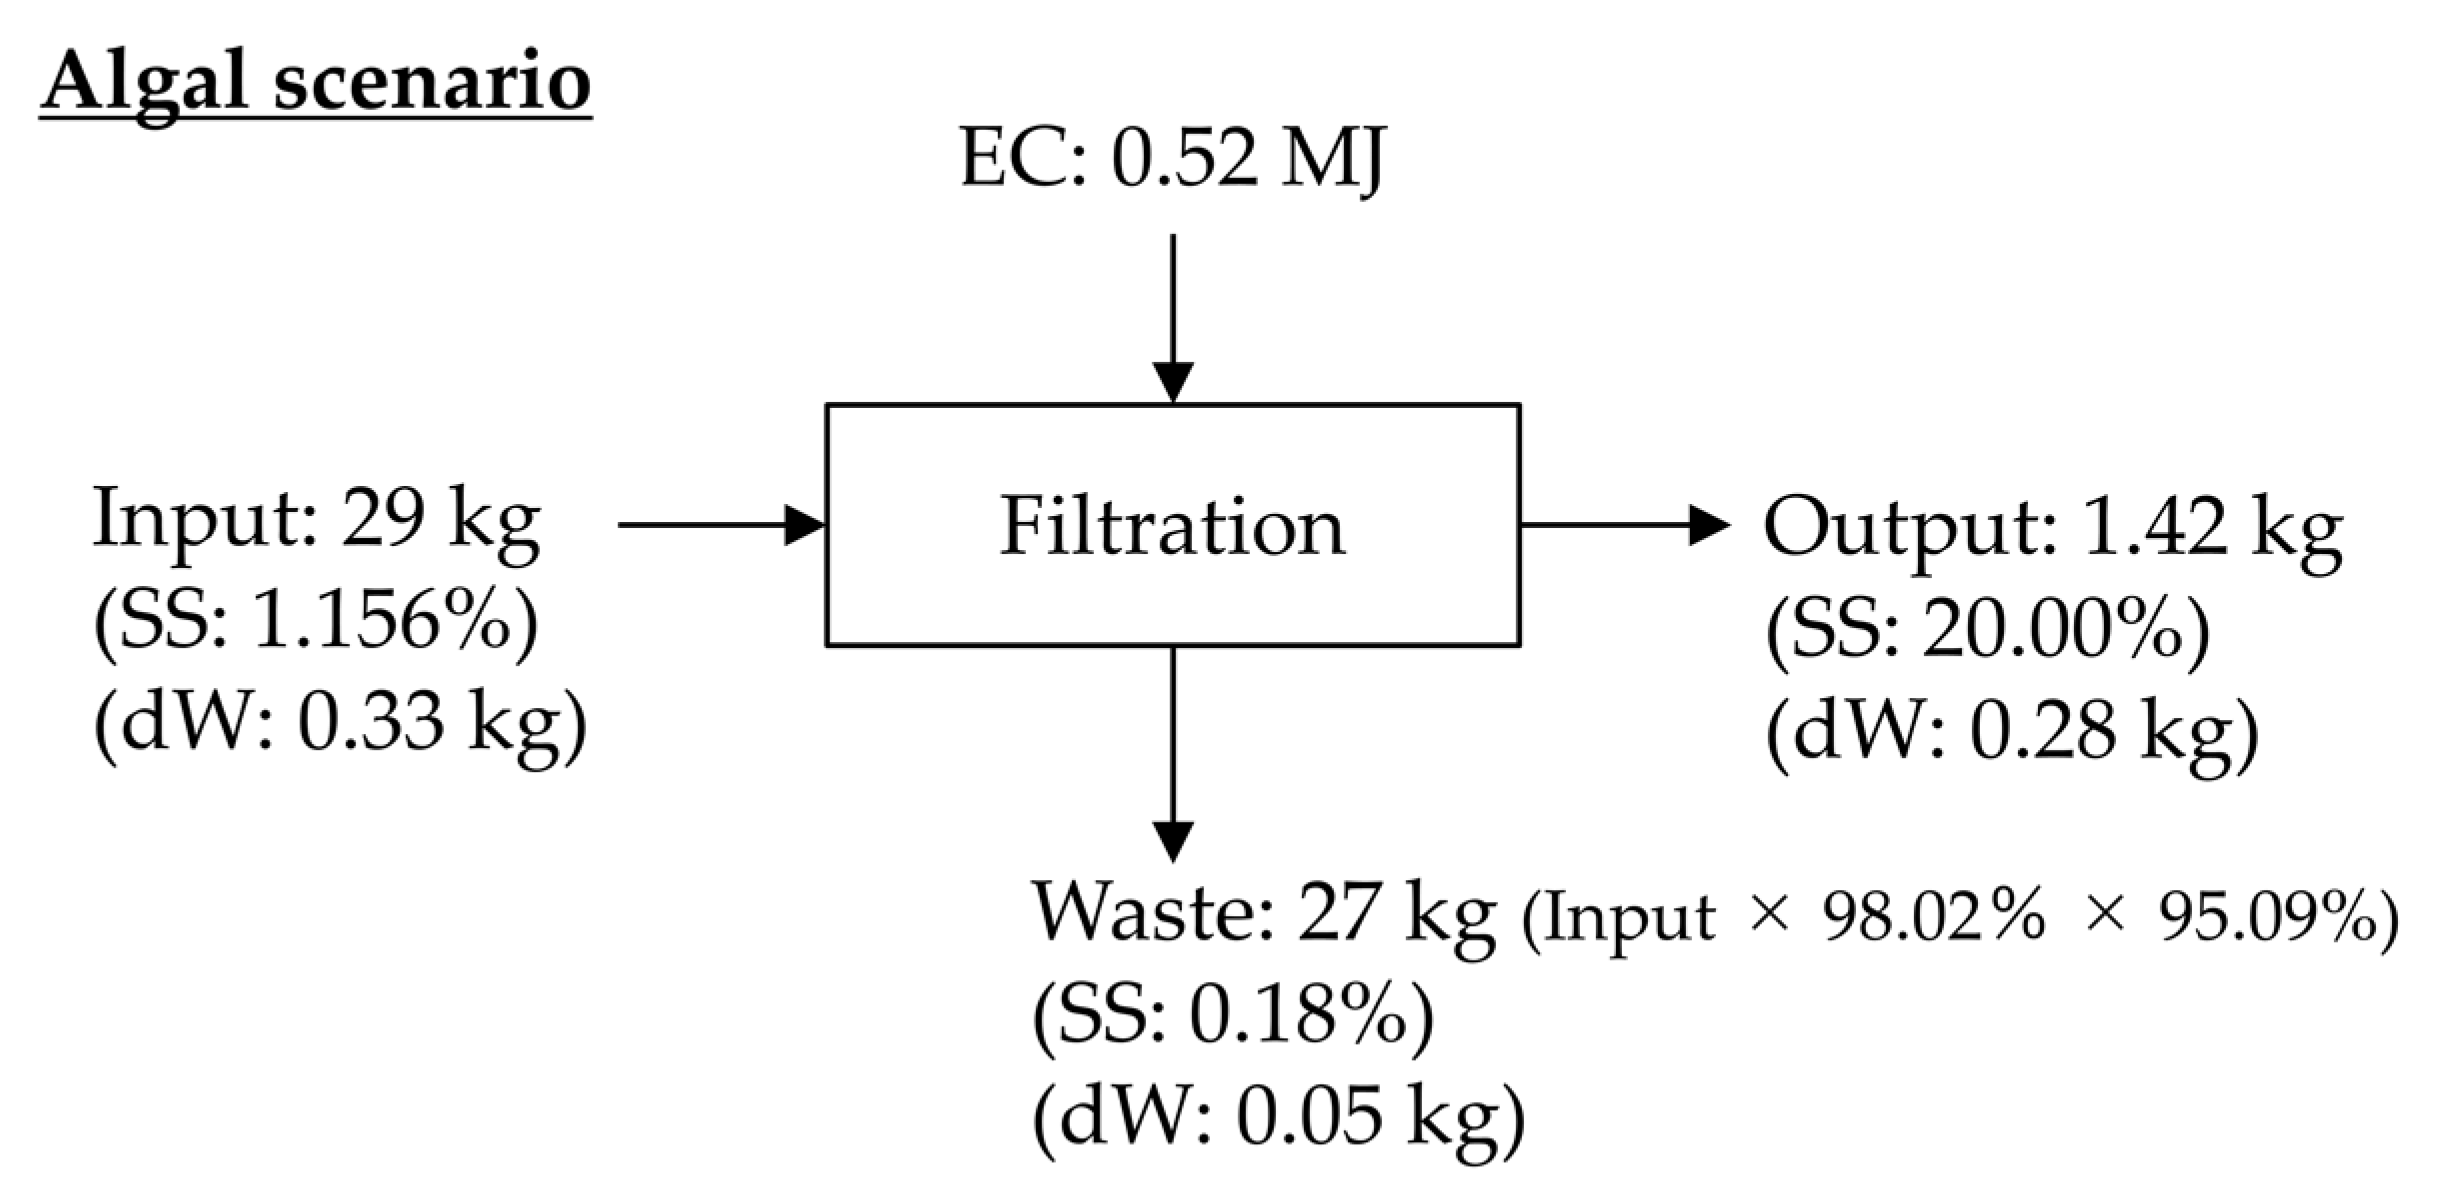
2.2.6. Filtration

In the drum filtration sub-unit, algae were concentrated by the pressure of the drum filter (Figure 7). In this unit, the input from the flocculant sub-unit was passed to the HTL sub-unit (Figure 8). The biomass microalgae (MA) passing rate was set at 98.02%, while it was set as 100% in the flocculant sub-unit because some biomass remained in the filter and were beyond the system boundary (Table 7).

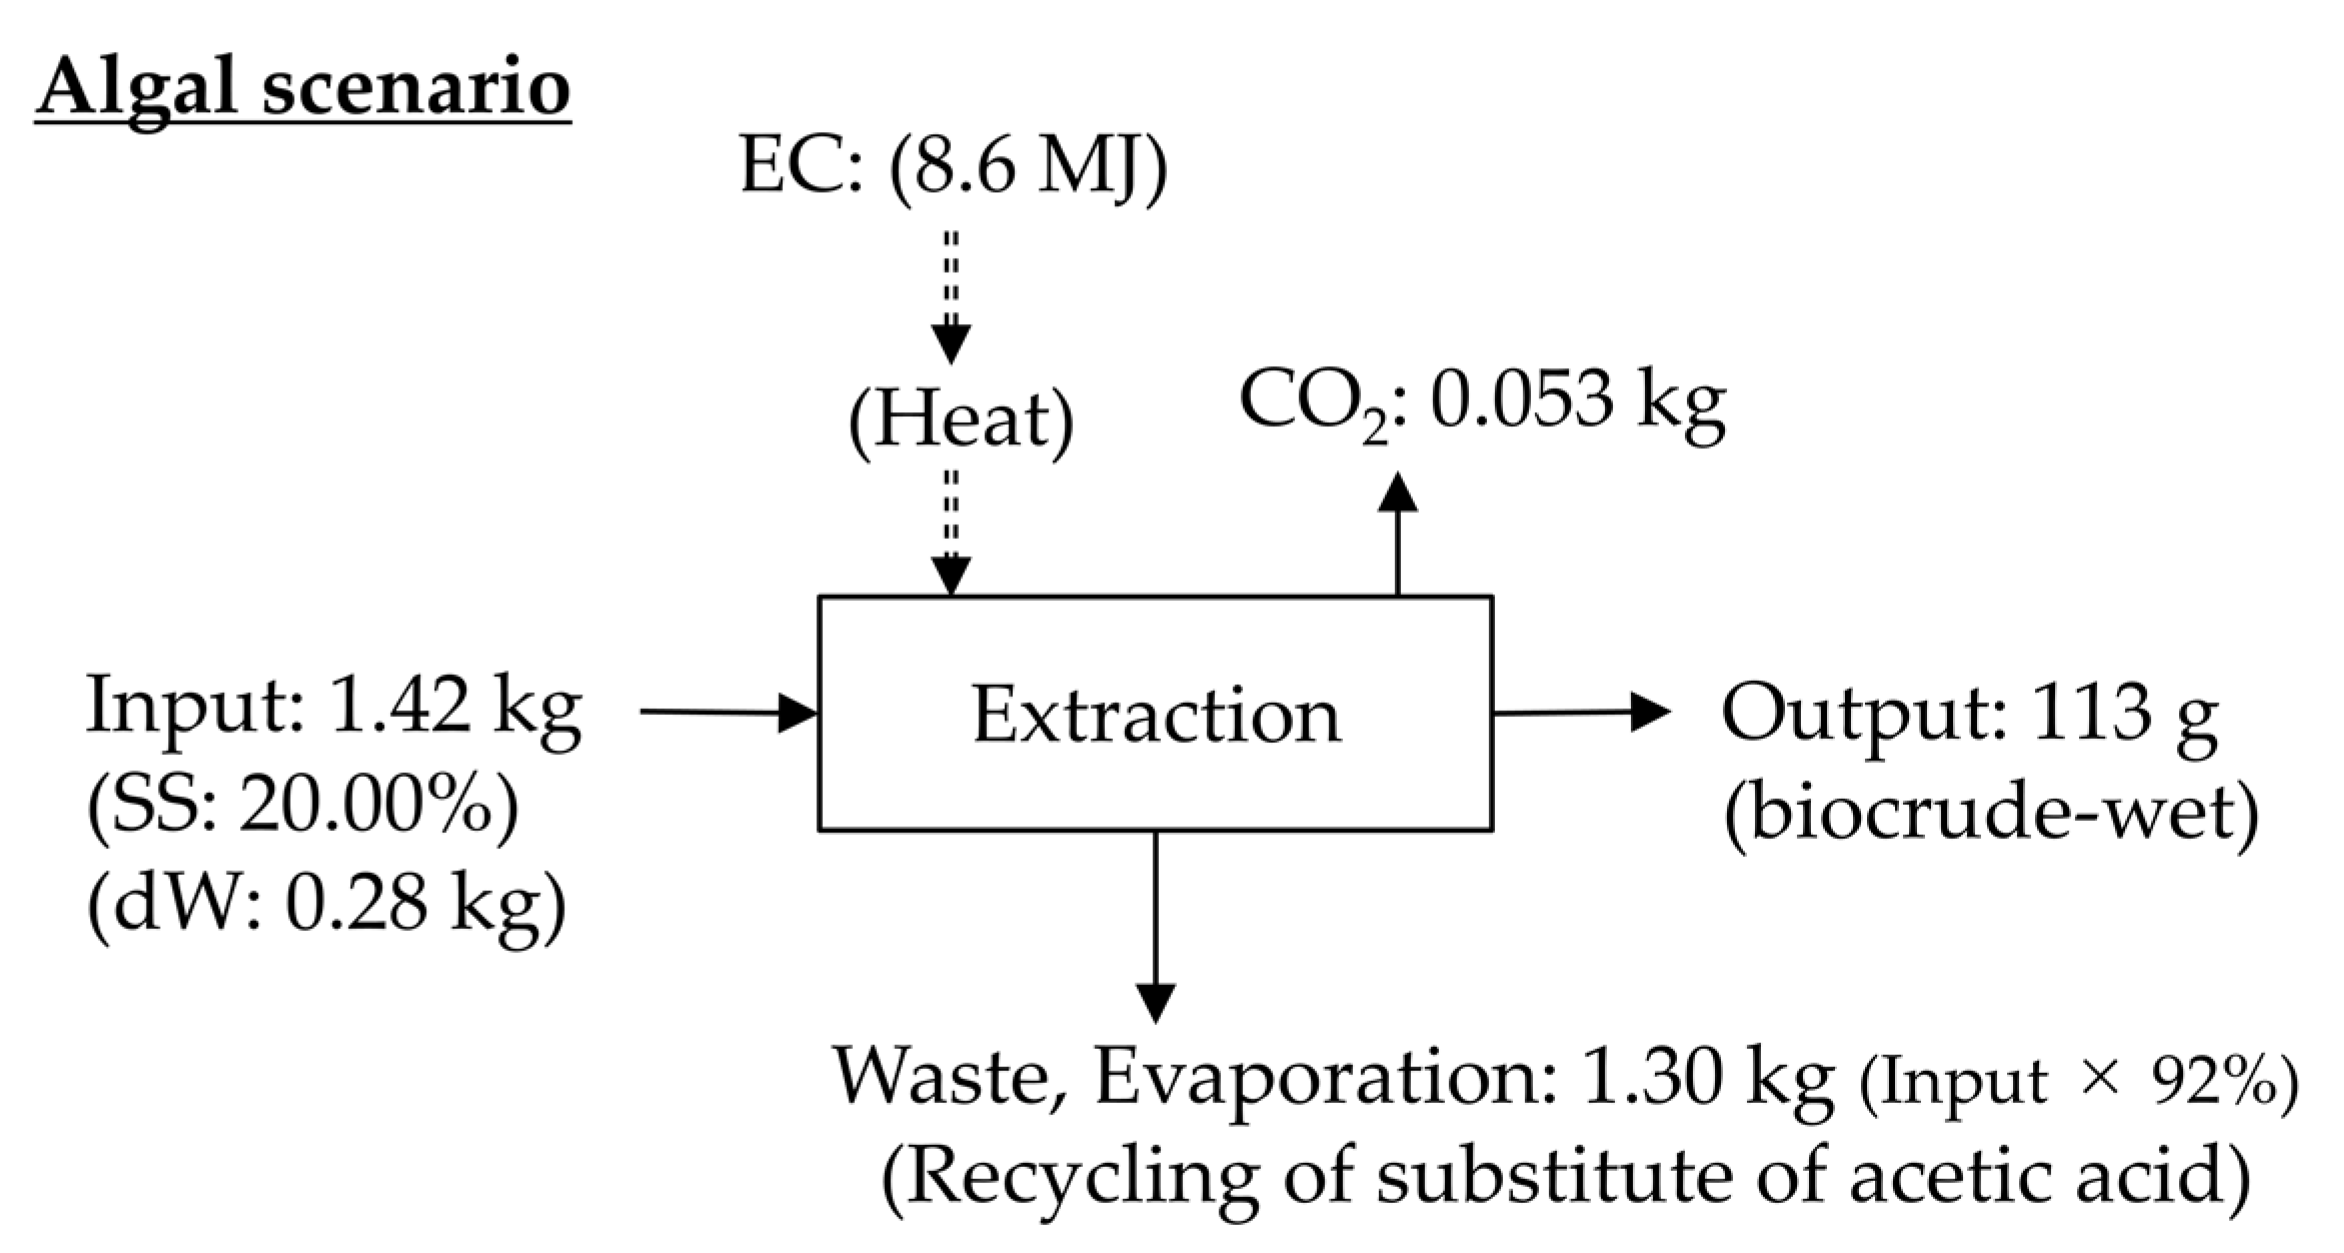
2.2.7. Extraction (HTL)

In this HTL sub-unit (Figure 9), the input from the drum filtration sub-unit produces the biocrude-wet (Figure 10). The number of HTL units was set as three by the daily handling mass of microalgae and the working hours (Table 8). In the HTL process, the waste heat energy was used, which required more than 350 °C (8.59 MJ/m3-w.w.). The CO2 emissions of 0.053 kg implied a direct CO2 emission in the HTL process, which differed from the calculated total CO2 eq. The direct CO2 emission was calculated from biomass stoichiometry. After the HTL sub-unit, 113 g of biocrude-wet was produced. The biocrude-wet contained H2O. After drying the H2O by purification, 74.7 g of biocrude-dry (HHV: 2.17 MJ/kg) was produced. However, this purification method and output ratio were different by purpose to use the biocrude. For example, in the desalter process before the distillation process in the petroleum refining industry, water is added to crude oil for desalting. Hence, the calculation was set based on biocrude-wet, which is before the purification.

3. Results and Discussion

Using the parameters above, the environmental impact and EPR of the two scenarios ware estimated.

3.1. Environmental Impact of Existing Scenario

3.1.1. Wastewater Treatment

To estimate the environmental impact of the WWTP, the technical note of the National Institute for Land and Infrastructure Management [10] was used. In the case study from the technical note, 560,164 m3 of wastewater was treated in the WWTP using the OD method in 2014. The environmental impact during wastewater treatment operation was 0.884 kg-CO2 eq/m3-w.w. and the energy demand per processing volume was 17.5 MJ/m3-w.w., in which electricity, heavy oil, caustic soda, polymer flocculants, tap water, LPG, and solid chlorine were included. However, in this algal scenario’s system boundary, the disinfection process was not included (Figure 1). Similarly, the emission from solid chlorine (0.00038 kg-CO2 eq/m3-w.w.) for disinfection was subtracted from the entire emission. The effect was small compared with the entire emission; therefore, it did not affect the result.

3.1.2. Sludge Cake Disposal

The environmental impact of sludge cake treatment was calculated by the sludge volume, sludge cake output ratio, and CO2 eq emissions by a high-temperature incineration of the sludge cake. To calculate the sludge cake output ratio, the amount of annual wastewater treatment in each OD method plant was obtained for fiscal year 2011 (Figure 11). 20 WWTPs in Tochigi prefecture were selected, which used the OD method and whose processing start date was after 1989 (30 years ago) [11]. The old treatment plants (before 1988) were excluded because they involved singular values. Subsequently, the input wastewater was represented on the x-axis and the output of the dehydrated sludge discharge on the y-axis. Hence, an approximate expression was obtained. From that expression, the dehydrated sludge of 1 m3 of wastewater was estimated to be 690 g.
The CO2 eq emissions per dehydrated sludge (DS) treatment was observed at 2.697 t-CO2 eq/t-DS [12]. In this case, the DS differs from the algae’s dry-solid, which refers to a dehydrated sludge that is not completely dry. The data was from a case study of the Wakagawa sewage treatment plant in Wakayama prefecture, Japan, in FY 2010. This DS was treated by high-temperature incineration under an annual sludge treatment of 5347 t/y, with 81.8% water content.
As a result of the environmental impact from 1 m3-w.w., 0.69 kg-DS × 2.697 kg-CO2 eq/kg-DS = 1.86 kg-CO2 eq/m3-w.w. was emitted.

3.1.3. Import of Crude Oil

The environmental impact of crude oil was based on the total amount of emissions excluding self-combustion and domestic transport, i.e., 5.63 g-C eq/Mcal (0.001345 kg-C eq/MJ) [13]. Because the unit of calorific value of crude oil is 38.28 MJ/L [9], the environmental impact of per liter import for crude oil was calculated from 0.001345 kg-C eq/MJ × 38.28 MJ/L = 0.0515 kg-C eq/L. The specific gravity of the crude oil used was 0.854 kg-crude-oil/L [14]. After changing the unit, the environmental impact was 0.0603 kg-C eq/kg-crude-oil.
0.0603 kg-C eq/kg-crude-oil was multiplied by the coefficient of 3.664 for the conversion of carbon to carbon dioxide and obtained 0.221 kg-CO2 eq/kg-crude-oil, which is the amount of CO2 eq emissions for import to Japan per kilogram of crude oil. Therefore, 48.4 g of crude oil resulted in 0.0107 kg-CO2 eq of emissions.

3.1.4. Total CO2 Emission

The results of the environmental impact from the existing scenario were revealed that the total CO2 emission in the existing scenario was 2.76 kg-CO2 eq/m3-w.w., which included the emission from the 48.4 g of imported crude oil (Figure 12).

3.1.5. EPR

In the existing scenario, the energy requirement was set from the case study. Subsequently, the yearly operating energy from electricity in the OD method was 7,691,609 MJ/560,164 m3-w.w. (13.73 MJ/m3-w.w.) [10]. In this case, the energy from electricity included the electricity for screen and disinfection. However, the system boundary of the existing scenario did not include the electricity for screen and disinfection. Therefore, the adjustment was required. One example showed that 74% of the electricity at the WWTP using the OD method was used for water treatment, sludge concentration, and sludge dehydrating [15]. Based on that example, at least an energy of 13.73 MJ/m3-w.w. × 74% = 10.16 MJ/m3-w.w. was required in the existing scenario (Table 9).
Although it was not called the EPR, if the calorific value of crude oil (2.17 MJ/m3-w.w.) was divided by the input energy (10.16 MJ/m3-w.w.), the ratio was 0.21.

3.2. Environmental Impact of Algal Scenario

3.2.1. Algae Fuel Production

For algae fuel production, the usage of equipment with energy consumption and the input of materials were calculated and then converted to 1 kilogram of biocrude-wet production. The conversion results were analyzed with SimaPro® version 8.0.4. using methods was “CML-IA baseline” version 3.02 (Table A4). The total environmental impact of the operating energy was 19.2 kg-CO2 eq/kg-biocrude-wet (Table 10). Subsequently, 1 m3 of wastewater produced 113 g of biocrude-wet, which resulted in 2.17 kg-CO2 eq/m3-w.w. of emissions.
Most of the emission was from electricity. The cultivation was the highest emitted process in the algal scenario. The process used not only the electricity from the paddlewheels and pump, but also acetic acid and carbon dioxide as direct materials.
From an annual report [4], the microalgae CO2 use rate from exhaust gas was assumed to be 45% (Figure 13). The mass balance of the CO2 absorption per 1 m3-w.w. was calculated from the experimental dataset, which compared the difference between the use of exhaust gas and without it. Consequently, the suggested algae CO2 absorption ratio of exhaust gas to the atmosphere was 8:2. When the algae absorbed 0.639 kg-CO2/m3-w.w., 80% (0.511 kg-CO2/m3-w.w.) was from the exhaust gas. Meanwhile, 20% (0.128 kg-CO2/m3-w.w.) was from the atmosphere. From the side of the input exhaust gas, 45% (0.511 kg-CO2/m3-w.w.) was absorbed by the algae and 55% (0.625 kg-CO2/m3-w.w.) was emitted to the atmosphere. CO2 contains was set as 15% of exhaust gas in this calculation.
The CO2 used in the ORP can be obtained without purchasing by using exhaust gas from power plants. Furthermore, CO2 can be used without any environmental degradation. Meanwhile, 55% (0.625 kg-CO2/m3-w.w.) of the input amount of exhaust CO2 was included as emissions during the ORP process (1.34 kg-CO2 eq/m3-w.w.). Consequently, if the emission from the exhausted CO2 was discounted, the emissions from the cultivation pond could be 0.72 kg-CO2 eq/m3-w.w. (Table 9). The total emissions could also be 1.54 kg-CO2 eq/m3-w.w. from 2.17 kg-CO2 eq/m3-w.w.
In the use of waste heat in the HTL, the heat energy of 8.6 MJ/m3-w.w. was calculated from waste heat without applying an environmental load.

3.2.2. CO2 Absorption at Pond

Microalgae can fix CO2 from the air, or exhaust gas could be introduced for photosynthesis in the ORP system. Therefore, microalgae might be set as a CO2 absorption source. For example, it is assumed to correspond to the "revegetation" part in the Kyoto Protocol [16]. Hence, the CO2 absorption was set by the microalgae biomass stoichiometry [5].
The stoichiometry of function (1) shows the microalgae CO2 absorption from the air, where 1.88 g of CO2 was absorbed in 1 g of microalgae (Table A5 in Appendix B). In the case of 1 m3 of wastewater for growing the algae, with the harvest concentration of 0.034% (0.34 g/L-DCW), the absorbed CO2 was estimated to be 0.34 kg-DCW/m3 × 1.88 kg-CO2/kg-DCW=0.64 kg-CO2/m3-w.w. The microalgae can be absorbed CO2, HNO3, H2SO4, H3PO4, and H2O. From those materials, only CO2 was calculated in this study. Consequently, the CO2 equivalent absorption at the pond was 0.64 kg-CO2 eq/m3-w.w.
CO2 + 0.148HNO3 + 0.014H2SO4 + 0.012H3PO4 + 0.751H2O → CH1.715O0.427N0.148S0.014P0.012 + 1.437O2

3.2.3. HTL Process

In the HTL process, it is presumed that the microalgae biomass stoichiometry (2) is according to the results of experimental data [17] (Table A6 in Appendix B). In the conversion process, 1 m3 of wastewater was transformed to 1.42 kg with 20% algae. In such a condition, the HTL process emission of CO2 was (1.42 kg × 20%)/m3-w.w. × 0.186 kg-CO2 = 0.053 kg-CO2/m3-w.w. Additionally, NH3 was emitted from this process; however, NH3 is carbon-free. Subsequently, the total CO2 equivalent of this process was 0.053 kg-CO2 eq/m3-w.w.
1000 C3.81H6.83N0.57O1.51 → 754C4.58H8.05N0.42O1.05 + 359CO2 + 253NH3 + H2O

3.2.4. Total CO2 Emission

In the algal scenario, an emission of 1.59 kg-CO2 eq/m3-w.w. occurred when treating 1 m3 of wastewater to produce 113 g of biocrude-wet. Compared with the existing scenarios, the total CO2 eq emissions (2.76 kg-CO2 eq/m3-w.w.) in the algal scenario could reduce the environmental impact significantly.
The primary contributor to increase the emission in algae fuel production was the narrow scale of the production system. The base scale of the WWTP in the existing scenario was 560,164 m3/y, but that of the algal scenario was 16,500 m3/y (50 m3/d), i.e., only 3%. If the algal scenario in the algae fuel production was scaled up by 30x (1500 m3/d), for comparing in the same volume. The emission of 2.17 kg-CO2 eq/m3-w.w. from the algae fuel production was estimated as 2.03 kg-CO2 eq/m3-w.w. However, land constraints must be considered. The CO2 emission of 0.625 kg from exhaust gas was included in the CO2 emission of the algae fuel production. In some cases, this number can be subtracted.
Some aspects are included, while others are excluded in the calculation of GWP 100 by each process (Table 11). In general, CH4 and N2O are directly emitted from the treatment of wastewater [18]. However, the emissions were almost the same because the treated amount of wastewater was the same as that of a similar system. Hence, both scenarios did not include the emission from them.

3.2.5. EPR

In the algal scenario, the outline of the in-out energy was verified, which did not include the energy for lighting, air conditioning, and electrical devices. Furthermore, the electricity for the screen and disinfection process was not included. Consequently, the treatment of 50 m3 of wastewater producing 5.66 kg of biocrude-wet required 106.5 MJ of electricity (Table 12). Therefore, the treatment of 1 m3 of wastewater required 2.13 MJ of electricity.
To calculate the in-out energy, the power generation efficiency was set as 40%. Therefore, the required energy was calculated from electricity, i.e., 5.32 MJ/m3-w.w. The output from 1 m3 of wastewater was 113 g of biocrude-wet, which is the same energy level as that of 74.7 g biocrude-dry. In this conversion process, the HHV was set as 29.1 MJ/kg-biocrude-dry. Consequently, that can produce 74.7 g × 29.1 MJ/kg = 2.17 MJ/m3-w.w. Hence, the EPR was 0.41 (Table 8), which implied that 40% of the input energy for the wastewater treatment could be recycled. Compare with the existing scenarios EPR 0.21, the algal scenario could reduce the operating energy requirements.

4. Conclusions

This study concludes that the microalgae’s realistic scenario using the discharged heat could be effective in treating general wastewater and emitted CO2, in terms of EPR and CO2 emissions. The EPR was 0.41 in the algal scenario as compared with the existing scenario’s 0.21. In addition, the environmental impact could be reduced from 2.76 to 1.59 kg-CO2 eq/m3-w.w. This is combined with 1 m3 of wastewater treatment, waste heat use from power plants, and CO2 absorption in algae production. The waste heat use in the HTL process was 21.5 MJ/m3-w.w. A comprehensive and realistic whole scenario from the cultivation process to biocrude purification was proposed for the first time in terms of environmental impact and energy balance as presented by this study.
Moreover, in the HTL process, experimental data from the Minamisoma plant showed that 113 g of biocrude-wet was produced from 1.42 kg of 20% microalgae (280 g dry weight). Meanwhile, based on stoichiometry, 213 g of biocrude-wet could be produced from 280 g of dry weight of microalgae. This indicated that the experimental value was only half the theoretical value. If the HTL process yielded the theoretical value, then the operating EPR would increase from 0.4 to 0.8 including wastewater treatment. Hence, the EPR could reach 1.0 by improving the efficiency of cultivation, sedimentation, filtration, HTL extraction of microalgae, and scale-up of ORP from 50 m3/day, as well as changing the production area to a warm place where algae could grow easily.
In this study, the algal scenario exhibited some limitations to scale up the pilot plant to the commercialization scale. In general, a system with low energy consumption and low GHG emissions tend to have lower costs. Therefore, it can be assumed that the algal scenario is more economical than the existing scenario. Further studies are required not only the environment but also the economical optimization together, to push up the commercialization stage of the algae scenario.

Author Contributions

This work was developed and written by R.I.; A.S.P. evaluated the technical calculation. It was conceived with R.N., S.I., T.A. and M.M.W., who provided major editorial contributions and guidance. All authors contributed to the writing of the paper. All authors have read and agreed to the published version of the manuscript.

Funding

This research received no external funding.

Conflicts of Interest

The authors declare no conflicts of interest.

Appendix A

The data set to estimate the environmental impact in the algal scenario, which collected from the Minamisoma pilot plant.
Table A1. Independent parameters for LCA calculation.
ParameterInputUnit
0. Construction of raceway pond
Working days330day/year
Pipe A721JPY/m
Pipe A depreciation3year
Pipe B (HTL)721JPY/m
Pipe B depreciation2year
Pump depreciation3year
Paddlewheel price50000JPY/item
Paddlewheel depreciation5year
Biomass conveyor price10000JPY
Biomass conveyor depreciation2year
Working hours, A (System)24h/day
Working hours, B (Equipment)18h/day
Working hours, C (Pump)10h/day
1. ORP sub-unit
Average operating energy of WWTP0.065L eq-oil/m3
Scale merit of concrete (Based on 0.1 ha)0.7-
Concrete (ORP) depreciation30year
WWTP average construction cost730000JPY/m3
WWTP depreciation20year
Transformation to industrial area-depreciation100 year
2. Flocculant sub-unit
Flocculant tank depreciation20year
Polytec solution price34.1JPY/kg
Polymer coagulant price34.1JPY/kg
3. Drum filtration sub-unit
Drum filtration depreciation10year
Drum filtration scale merit1-
Biomass conveyor scale merit1-
4. HTL sub-unit
HTL heater in Minamisoma (2.2, 2, 2.5 x 2, 0.5 x 2)10.2kW
Working time of HTL heater in Minamisoma3.9h/day
HTL equipment price4 MJPY/unit
HTL capacity21.6kg/day/unit
HTL depreciation10year
5. General information
CO2 credit1.845JPY/kgCO2
Electricity27JPY/kWh
1kWh3.6MJ/kWh
Power generation efficiency40%
The CO2 emission factor of B and C heavy oils3kgCO2/L-heavy oil
1 Barrel (Throughput oil)140kg
1 Btu (British thermal unit)1054MJ
Labor costs500 MJPY/year
Acetic acid price55JPY/kg
Acetic acid using ratio0.3g/L
Freshwater213JPY/m3
Volume of concrete for pond 415.5m3/1000 m2
Exchange rate (Dec 17, 2018)114JPY/USD
Exchange rate (Dec 17, 2018)126JPY/EUR
Table A2. Function list of “electricity” for dependent parameters. (x is derived from Table A1).
No.Parameters f(x)UnitEquation f(x) = ax + bxunitabR2
e1PumpkWf(x) = 0.0029x + 0.2725CapacityL/min0.00290.27251.00
e2Flocculant machinekWf(x) = 0.5972x + 0.5611Capacitym3/h0.59720.56110.89
e3Drum filter machinekWf(x) = 0.0202x + 1.4161Capacitym3/h0.02021.41610.94
e4PaddlewheelkWf(x) = 2.75xDepthm2.7501.00
Table A3. Function list of “number of items and workers” for dependent parameters. (x is derived from Table A1)
No.Parameters f(x)OriginalEquation
f(x) = ax, f(x) = a × Ln(x) + b
xunitab
n1Pump2+1+1Capacity change item
n2Flocculant machine1Capacity change item
n3Drum filter machine1Capacity change unit
n4Paddlewheel1f(x) = Roundup(x/1000)Pond aream21000-
n5HTL unit (20mL/min)1f(x) = Roundup(x/21.6)Biomass MA (20%)kg/day21.6-
w1Worker2f(x) = Round (0.7135 × Ln(x/10000) + 3.5714,0)Pond aream20.71353.5714
Table A4. Input and output data used in the simulation process using SimaPro® (Per 1 kg-biocrude-wet from 8.8 m3-w.w.).
1 CultivationInput ItemUnitQuantitykg-CO2 eq
OperateTotalOperate
OutputBiomass MA (0.034%)kg8834.708834.70
Direct materialAcetic acidkg2.652.654.35
Carbon dioxide, in the exhaust gaskg4.524.52
Direct energyElectricity (Paddle)MJ6.306.300.98
Electricity (Pump)MJ6.546.541.02
Building and Equipment Concretem3 0.00185
WWTP unit 0.0000268
Paddlewheelitem 0.000107
Pumpitem 0.000357
Pipem 0.00357
Land occupationTransformation to industrial aream2 0.00535
EmissionCarbon dioxide (Emission: 55%)kg5.525.525.52
2 Sedimentation Total CO211.9
OutputBiomass MA (1.156%)kg254.46254.46
InputBiomass MA (0.034%)kg8834.708834.70
Direct materialPolytec solutionkg2.212.216.30
Polymer coagulantkg0.03090.03090.08
Direct energyElectricity (Flocculation)MJ1.411.410.22
EquipmentFlocculation tankunit 0.0000268
Pumpitem 0.000178
Sludgekg8580.248580.24
3 Filtration Total CO26.6
OutputBiomass MA (20%)kg12.5012.50
InputBiomass MA (1.156%)kg254.46254.46
Direct energyElectricity (Drum filtration)MJ4.554.550.71
EquipmentDrum filtrationitem 0.0000143
Biomass conveyorm 0.000268
Sludgekg241.95241.95
4 Extraction (HTL) Total CO20.7
OutputBiocrude-wetkg11
InputBiomass MA (20%)kg12.5012.50
Direct energyElectricity (HTL)MJ(75.86)(75.86)(11.8)
EquipmentHTL equipmentitem 0.000175
Pipem 0.00401
Pumpitem 0.000178
Total CO20

Appendix B

The data set collected from the literature in the algal scenario.
Table A5. Microalgae biomass stoichiometry at ORP process [7].
CO2 +0.148HNO3 +0.014H2SO4 +0.012H3PO4 +0.751H2O→CH1.715O0.427N0.148S0.014P0.012 +1.437O2
Mass (g)22,5074769702601691912,00023,515
Ratio1.880.400.060.050.581.001.96
Table A6. Microalgae biomass stoichiometry at HTL process [17].
1000 C3.81H6.83N0.57O1.51754C4.58H8.05N0.42O1.05+359CO2+253NH3+H2O
Mass (g)84,788 64,697 15,800 4310 18
Ratio1.000.760.1860.0510.00021

References

  1. Sasongko, N.A.; Noguchi, R.; Ito, J.; Demura, M.; Ichikawa, S.; Nakajima, M.; Watanabe, M.M. Engineering Study of a Pilot Scale Process Plant for Microalgae-Oil Production Utilizing Municipal Wastewater and Flue Gases: Fukushima Pilot Plant. Energies 2018, 11, 1693. [Google Scholar] [CrossRef] [Green Version]
  2. Demura, M.; Yoshida, M.; Yokoyama, A.; Ito, J.; Kobayashi, H.; Kayano, S.; Tamagawa, Y.; Watanobe, M.; Date, N.; Osaka, M.; et al. Biomass productivity of native algal communities in Minamisoma city, Fukushima Prefecture, Japan. Algal Res. 2018, 29, 30. [Google Scholar] [CrossRef]
  3. Iasimone, F.; de Felice, V.; Panico, A.; Pirozzi, F. Experimental study for the reduction of CO2 emissions in wastewater treatment plant using microalgal cultivation. J. CO2 Util. 2017, 22, 1–8. [Google Scholar] [CrossRef]
  4. Algae Industry Incubation Consortium Japan. Annual Report of the Microalgae Pilot Project for Biofuel Production; ABES University of Tsukuba: Tsukuba, Japan, 2019; pp. 29, 35, 44, 45, 58, 110. (In Japanese) [Google Scholar]
  5. Wibawa, D.S.; Nasution, M.A.; Noguchi, R.; Ahamed, T.; Demura, M.; Watanabe, M.M. Microalgae Oil Production: A Downstream Approach to Energy Requirements for the Minamisoma Pilot Plant. Energies 2018, 11, 521. [Google Scholar] [CrossRef] [Green Version]
  6. Kodo, S. Sewer Book, 1st ed.; The Nikkan Kogyo Shimbun, LTD.: Tokyo, Japan, 2012; pp. 88–89. (In Japanese) [Google Scholar]
  7. Algae Industry Incubation Consortium Japan. Annual Report of the Microalgae Pilot Project for Biofuel Production; ABES University of Tsukuba: Tsukuba, Japan, 2018; pp. 18, 19, 30. (In Japanese) [Google Scholar]
  8. Gohara, T.; Jain, A.; Matumoto, S.; Aramaki, T.; Ito, J.; Noguchi, R.; Watanabe, M.M.; Nakajima, M.; Ichikawa, S. Continuous Production of Biocrude by Hydrothermal Liquefaction of Native Microalgae. In Proceedings of the 14th Biomass Science Conference, Higashihiroshima, Japan, 16–18 January 2019; Biomass Division of the Japan Institute of Energy: Tokyo, Japan, 2019; pp. 91–92. (In Japanese). [Google Scholar]
  9. Table of Standard Calorific Value and Carbon Emission Coefficient. Available online: https://www.enecho.meti.go.jp/statistics/total_energy/pdf/stte_016.pdf (accessed on 28 September 2019).
  10. National Institute for Land and Infrastructure Management. Guideline for Life-Cycle Assessment of Sewerage Systems. In Technical Note of National Institute for Land and Infrastructure Management; NILIM Ministry of Land, Infrastructure, Transport, and Tourism: Tsukuba, Japan, 2010; pp. 97, 105. (In Japanese) [Google Scholar]
  11. Tochigi Prefecture Prefectural land maintenance business meeting. Public Sewage of Tochigi; Tochigi prefecture: Utsunomiya, Japan, 2013; pp. 3–4. (In Japanese) [Google Scholar]
  12. Nakao, A.; Yamamoto, Y.; Yoshida, N. Evaluating Integration and Collaboration of Environmental Infrastructures and Choice of Low Carbon Technology in Declining Population Society. J. JSCE. Ser. G (Environ. Res.) 2015, 71, 480. (In Japanese) [Google Scholar]
  13. Yoon, Y.S.; Yamada, T. Life Cycle Inventory Analysis of Fossil Energies in Japan. Energy Econ. 2000, 25, 22. (In Japanese) [Google Scholar]
  14. How to Set the Fuel Constant. Available online: http://www.jari.or.jp/Portals/0/jhfc/data/report/2005/pdf/result_ref_1.pdf (accessed on 28 September 2019).
  15. Ishida, T.; Ochi, S.; Otsuki, S.; Tamura, T. Joint Research on Energy-Saving Technology of Oxidation Ditch Method. In Annual Report of JIWET 2016; Eto, T., Ed.; Japan Institute of Wastewater Engineering and Technology: Tokyo, Japan, 2017; p. 176. (In Japanese) [Google Scholar]
  16. Definitions, Modalities, Rules and Guidelines Relating to Land Use, Land-Use Change and Forestry Activities Under the Kyoto Protocol. p. 58. Available online: https://undocs.org/FCCC/CP/2001/13/Add.1 (accessed on 28 September 2019).
  17. Ankit, J. Solvent Extraction and Continuous Hydrothermal Liquefaction of Native Microalgae for Biofuel Production. Ph.D. Thesis, University of Tsukuba, Tsukuba, Japan, July 2018; p. 46. [Google Scholar]
  18. Sano, I.; Masuda, S.; Li, Y.; Nishimura, O. Greenhouse Gases Emission Factors and it’s Reduction Measures in Sewage Treatment Plant. J. JSCE Ser. G (Environ. Res.) 2012, 68, 568–569. (In Japanese) [Google Scholar]
Figure 1. System boundary for existing and algal scenarios.
Energies 13 01641 g001
Figure 2. Raceway pond (1000 m2 scale).
Energies 13 01641 g002
Figure 3. Mass balance of microalgae oil production in cultivation sub-unit per 1 m3.
Energies 13 01641 g003
Figure 4. Pumps for harvest in cultivation sub-unit at Minamisoma (0.55 kW × 2 units).
Energies 13 01641 g004
Figure 5. Mass balance of microalgae oil production in flocculant sub-unit per 1 m3.
Energies 13 01641 g005
Figure 6. Centrifuge equipment at Minamisoma (15 kW, 8000 L/h).
Energies 13 01641 g006
Figure 7. Drum filter equipment at Minamisoma (1.42 kW, 520 kg/h).
Energies 13 01641 g007
Figure 8. Mass balance of microalgae oil production in drum filtration sub-unit per 1 m3.
Energies 13 01641 g008
Figure 9. HTL equipment at Minamisoma (10.2 kW, 21.6 kg/day).
Energies 13 01641 g009
Figure 10. Mass balance of microalgae oil production in HTL sub-unit per 1 m3.
Energies 13 01641 g010
Figure 11. Annual average input of wastewater and related output of sludge cake.
Energies 13 01641 g011
Figure 12. Environmental impact of GWP 100 from operating emissions of the two scenarios.
Energies 13 01641 g012
Figure 13. Mass balance of CO2 in ORP (kg-CO2/m3-w.w.) within 4 d of HRT.
Energies 13 01641 g013
Table 1. Conversion ratio of microalgae to biocrude from the pilot plant located at Minamisoma.
Process1-d ProcessBiomass SS 1 in Eject from Each Process (%)HHV 2
(MJ/kg)
Source
Microalgae
Cultivation (ORP)50 m3(1 m3)0.034-Literature [5]
Centrifugation1441.00 kg(28.802 kg)1.156-Literature [5]
Drum filtration70.81 kg(1.415 kg)20.000-Literature [5]
Extraction (HTL)5.66 kg(113.2 g)Biocrude-wet-Literature [5]
Purification-(74.7 g *)Biocrude-dry 329.1Literature [4]
Crude oil-(48.4 g *)- 44.9Literature [9]
1 Suspended solid, 2 Higher heating value, 3 Conversion rate: 0.66, * Based on the same HHV.
Table 2. Evaluation of different methods in the primary dewatering process of microalgae production at Minamisoma [7].
Primally Dewatering ProcessCharacteristicOperating CostAdaptability
CentrifugesHuge energy consumption
(3.3 kWh/kg-dry-MA)
Energy cost is highExisting at Minamisoma
Flocculation (Sedimentation)Presently important, however the added chemical is of environmental concernLowAdopted in this paper
Gravity settlingHardly sinks after 3 h-Not applicable
Siphon type osmosis membrane0.014% to 0.030%
1.7 min/kg-MA * (0.014%)
Membrane cost is highFuture possibilities
* Microalgae.
Table 3. Analytical process for each stage of microalgae production from the pilot plant located at Minamisoma.
ProcessCultivationCentrifugationFiltrationExtractionPurification
Previous study [5]EmpiricalEmpiricalExperimentalTheoretical-
This researchEmpiricalTheoreticalExperimentalExperimentalExperimental
Table 4. Parameters set in the open raceway pond per 50 m3/day.
ParameterInputUnit
Independent
Pond volume200m3
Pond length50m
Pond width20m
Pond water depth0.2m
HRT4day
Dependent
Pond area1000m2
Pump capacity83L/min
Table 5. Parameters set at cultivation sub-unit per 50 m3/day.
ParameterInputUnit
Independent
Water (Waste: 1 or Fresh: 0)1-
WWTP for algae1item
Pump2item
Pipe A20M
Dependent
Acetic acid (50% from HTL)15kg/day
Carbon dioxide15kg/day
Wastewater50m3/day
Electricity for paddle wheel (e4)36MJ/day
Electricity for pump (e1)37MJ/day
Paddlewheel (n4)1item
Table 6. Parameters set at flocculant sub-unit per 50 m3/day.
ParameterInputUnit
Independent
SS of after concentration1.156%
Biomass MA * passing rate100%
Rate of waste and output97.12%
Flocculant tank capacity3m3/h
Flocculation tank1item
Pump1item
Dependent
Input mass of biomass MA * 50,031kg/day
SS of before flocculant0.034%
Electricity for flocculant (e2)8MJ/day
Polytec solution12.5kg/day
Polymer coagulant0.175kg/day
* Microalgae.
Table 7. Parameters set at filtration sub-unit per 50 m3/day.
ParameterInputUnit
Independent
SS of after concentration20%
Biomass MA passing rate98.02%
Rate of emission and output95.09%
Drum filtration1unit
Drum filtration-capacity300kg/h
Biomass conveyor1m
Dependent
Input mass of biomass MA 1441kg/day
SS of before flocculant1.156%
Drum filtration-usage rate27%
Electricity for drum (e3)25.8MJ/day
Table 8. Parameters set at extraction (HTL) sub-unit per 50 m3/day.
ParameterInputUnit
Independent
HTL system (n5)3unit
HTL conversion ratio8.0%
Pipe B15m
Pump1item
Dependent
Input mass of biomass MA 70.81kg/day
SS of before flocculant20%
Electricity for HTL heater(430)MJ/day
Table 9. Operating energy balance of each scenario.
Energy
MJ/m3-w.w.
Existing scenario
Input10.16
Output (Crude oil)2.17
(EPR)0.21
Algal scenario
Input5.32
Output (Algal biocrude)2.17
EPR0.41
Table 10. Emission from algal fuel production.
Process Operating Emission
kg-CO2 eq/kg-Biocrude-Wetkg-CO2 eq/m3-w.w.
ORP (Cultivation)System6.40.72
Exhaust gas5.50.63
Flocculant 6.60.75
Drum filtration 0.70.08
HTL (11.8)(1.34)
Total 19.22.17
Table 11. Included and excluded matters in the calculation of GWP 100.
ProcessTypeIncludeExclude
Wastewater treatmentCO2 eqDirect energy and materialIllumination, air conditioning, solid chlorine, CH4, N2O
Sludge cake disposalCO2 eqSelf-combustionTransport
Import of crude oilCO2 eqOverseas transportDomestic transport
Algal fuel productionCO2 eqDirect energy and materialIllumination, air conditioning, solid chlorine, CH4, N2O
Absorption at pondCO2 Direct CO2 absorption by photosynthesisExhalation by breathing
HTL process *CO2Direct CO2 emissionDirect energy
* HTL process “energy” was explained at algal fuel production.
Table 12. Operating electricity from algal fuel production.
ProcessElectricity
MJ/50 m3-w.w.
Electricity
MJ/m3-w.w.
Energy
MJ/m3-w.w.
ORP (Cultivation) 72.71.453.63
Flocculant8.00.160.40
Drum filtration25.80.521.29
HTL(429.6)(8.59)(21.5)
Total106.52.135.32

