Article

The Comparison of Solar Energy Gaining Effectiveness between Flat Plate Collectors and Evacuated Tube Collectors with Heat Pipe: Case Study

by
Piotr Olczak
1,*,
Dominika Matuszewska
2 and
Jadwiga Zabagło
3
1
Mineral and Energy Economy Research Institute, Polish Academy of Sciences, 7A Wybickiego St., 31-261 Cracow, Poland
2
AGH University of Science and Technology, 30 Mickiewicza Ave., 30-059 Cracow, Poland
3
Independent Researcher, 31-155 Kraków, Poland
*
Author to whom correspondence should be addressed.
Submission received: 29 February 2020 / Revised: 31 March 2020 / Accepted: 7 April 2020 / Published: 10 April 2020

Abstract

:
In Poland, various solar collector systems are used; among them, the most popular are flat plate collectors (FPCs) and evacuated tube collectors (ETCs). The work presents two installations located at a distance of 80 km apart, working in similar external conditions. One of them contains 120 flat plate collectors and works for the preparation of hot water in a swimming pool building; the second one consists of 32 evacuated tube collectors with a heat pipe and supports the preparation of domestic hot water for a multi-family house. During the comparison of the two quite large solar installations, it was confirmed that the use of evacuated tube solar collectors shows a much better solar energy productivity than flat plate collectors for the absorber area. Higher heat solar gains (by 7.9%) were also observed in the case of the gross collector area. The advantages of evacuated tube collectors are observed mainly during colder periods, which allows for a steadier thermal energy production.

1. Introduction

One of the biggest challenges facing humanity now is to provide the required amount of electricity and heat to society while respecting the environment, stopping the destruction of the ozone layer, and reducing greenhouse gas emissions [1]. This is even more difficult to obtain due to the increase in the number of people in the world; the International Energy Agency predicts that energy demand will increase by 30% in the years 2016–2040 [2].
The demand of non-renewable energy and air pollution stress can be significantly reduced by using solar energy [3]. It was estimated that the energy potential of the sun to use in our planet is about 6500 TW [4]; in this, the insolation in some places can reach up to more than 2200 kWh/m2 per year (e.g., horizontal plane in Africa) [5]. The estimated value of insolation in Poland during a year is about 1000 kWh/m2 [6,7]. With the right technology (for collecting and receiving solar energy), it can become a significant source that, in the future, could meet the growing demand for energy [8,9]. Increasingly, countries are also meeting social expectations and encouraging society to use renewable energy sources, including solar. There are many established policies as follows: tariff privileges (cost credit for renewable energy use [10,11]), allocation rules (certain amount of energy should be from renewable sources [12,13]), pensions (economic support for sustainable and efficient use of technologies [14]), and research fellowships and other monetary help for planned implementation of new clean technologies [9,15]. The European Union wants to reduce energy demand and emissions (mainly CO2) by 2050; therefore, solar energy technologies seem to be a good development direction for EU countries [16,17].
All the above-mentioned aspects result in renewable energy such as solar energy being increasingly used in the building industry as an effective method of reducing energy consumption from fossil fuels and minimalizing global carbon emissions [18]. For space heating and domestic hot water production, solar thermal collectors can be alternative since they can provide hot water with temperature ranges from 40 to 80 °C [19,20]. In 2019, China was a leading country in terms of using solar energy for preparing hot water with a capacity of 334.52 GW. Other leading countries were the United States, Turkey, and Germany with respective capacities of 17.76, 16.28, and 13.74 GW [21]. Currently, to utilize solar energy, other things are also considered during the designing process. Building design can allow for lower energy consumption if it is strongly correlated with climate characteristics, building material selection (including thermophysical properties of structural materials), thermal comfort, envelopes, window outline dimension optimization, direction, etc. [22]. Building orientation and glazing determine how much solar irradiance a building receives. Mostly efficient energy buildings are oriented and designed to capture irradiance from different directions [23,24]. Even though solar systems for hot water heating are a proven technology with reliable performance, their implementation conditions are still more favorable in the industrial sector than in the residential one [25]. This is because, for residential purposes, solar thermal systems are limited to usage for the need of hot water preparation and space heating, while industry applications have greater possibilities regarding the integration of solar thermal systems. The undoubted advantage of using solar systems for industrial needs is often a stable heat load in this type of installation throughout the year. Furthermore, in many cases, normal business hours of operation coincide with solar hours, resulting in a more efficient way of using solar thermal systems [26].
For solar domestic systems, flat plate collectors (FPCs) and evacuated tube collectors (ETCs) are most commonly used. From these two types, FPCs are more often chosen due to a simple design, low price, and the ability to produce heat up to 100 °C [27]. On the other hand, ETCs are more efficient collectors, but they are also more expensive than FPCs. However, during collector selection, thermal performance and economic analysis should be taken into account for each case, since the productivity of both FPC and ETC is strongly correlated with radiation, temperature, weather conditions, etc. [28]. There were several studies, both experimental and theoretical, regarding FPC and ETC in different conditions. Most of these were gathered in the work of Colangelo et al. [29].
The overall performances of conventional solar collectors can be significantly improved, e.g., by using a flat booster bottom reflector [30] and optimal inclinations of the collector and reflector [31]. Milani et al. [28] investigated how the heat capture rate change of a diffuse flat reflector is used in the back of an ETC array. For this, they used ETCs in solar water heaters in four Australian cities lying in a different zone. Their research showed that this approach led to an increase in annual energy savings (up to 95.8% for zone 1; 91.3% for zone 2; 81% for zone 3; 74% for zone 4). An investigation of the impact of flow on both the working fluid temperature and the collector efficiency was carried out by Diego-Ayala et al. [32]. They conducted thermal analysis of a solar flat plate water heater in a hot sub-humid region (Yucatan, Mexico). Figaj et al. [33] investigated the efficiency of a hybrid solar cooling system incorporating flat plate collectors and a concentrator. A solar water heating model was analyzed by Amoabeng [34] for the hospital of the Kwame Nakrumah Univeristy of Science and Technology. In this assessment, two types of collectors were considered, a flat plate and an evacuated tube collector, in terms of thermal performance indicators and economic analysis. A performance comparison of flat plate and heat pipe evacuated tube collectors for a domestic water heating system in Dublin (Ireland weather conditions) was carried out by Ayompe et al. [35]. They showed that the 4-m2 FPC system worked better in these conditions than the 3-m2 ETC when the system was connected to a 0.3-m3 hot water tank. Perers [36] compared an installation with flat plate and evacuated tube collectors in Sweden. He obtained the best performance for flat plate collectors near 400 kWh/(m2∙year) and for evacuated tube collectors near 300 kWh/(m2∙year) at an average operating temperature of 60 °C. Morrison et al. [37] found that the evacuated tube solar collectors worked with higher efficiency than flat plate collectors in conditions when the outlet temperature of the working fluid was above 100 °C.
This article investigates the effectiveness of solar thermal system for Polish conditions. Solar energy production in Poland mainly comes from household solar installations which are used in order to heat up water, as well as for central heating purpose. Additionally, the solar collector installations can be a good solution to decrease air pollution in some Polish regions [38]. For all above-mentioned purposes, flat plate solar collectors and evacuated tube solar collectors are most commonly used [39]; in 2018, the total capacity of installed FPCs was 1.24 GW, and that of ETCs was 0.34 GW [19].
In the literature, there were several simulation studies concerning solar energy [40,41] and collectors [42], as well as research evaluations [43]; however, there is a lack of examples of long-term operation in real and non-experimental conditions. The novelty of this paper is in its evaluation of two existing installations. In addition, this article compares two installations operating under almost identical outdoor conditions, with a weighted average difference in collector temperature of 2.4 K. The document raises the problem of a large gap between the efficiency obtained in experimental conditions and in real cases. This shows the importance of the proper design of heat collection systems from collectors.
All installations are not experimental ones, since they are used in a commercial way (not for scientific purpose), and their advantage is that they are working for a couple of years, which gives data for a long period of time (more than one year). The comparison of FPC and ETC effectiveness was made in the case of two solar installations (located at a distance of 80 km apart): one with flat plate solar collectors next to an indoor swimming pool building in Brzesko, and the other one with evacuated tube solar collectors supplying a multi-family building in Krosno. The paper was structured as follows: in Section 2, the compared installations are presented with both system descriptions and solar energy gains. Section 3 includes comparative data with a comparison of the results from both installations. Finally, conclusions are provided in Section 4.

2. Solar Installations

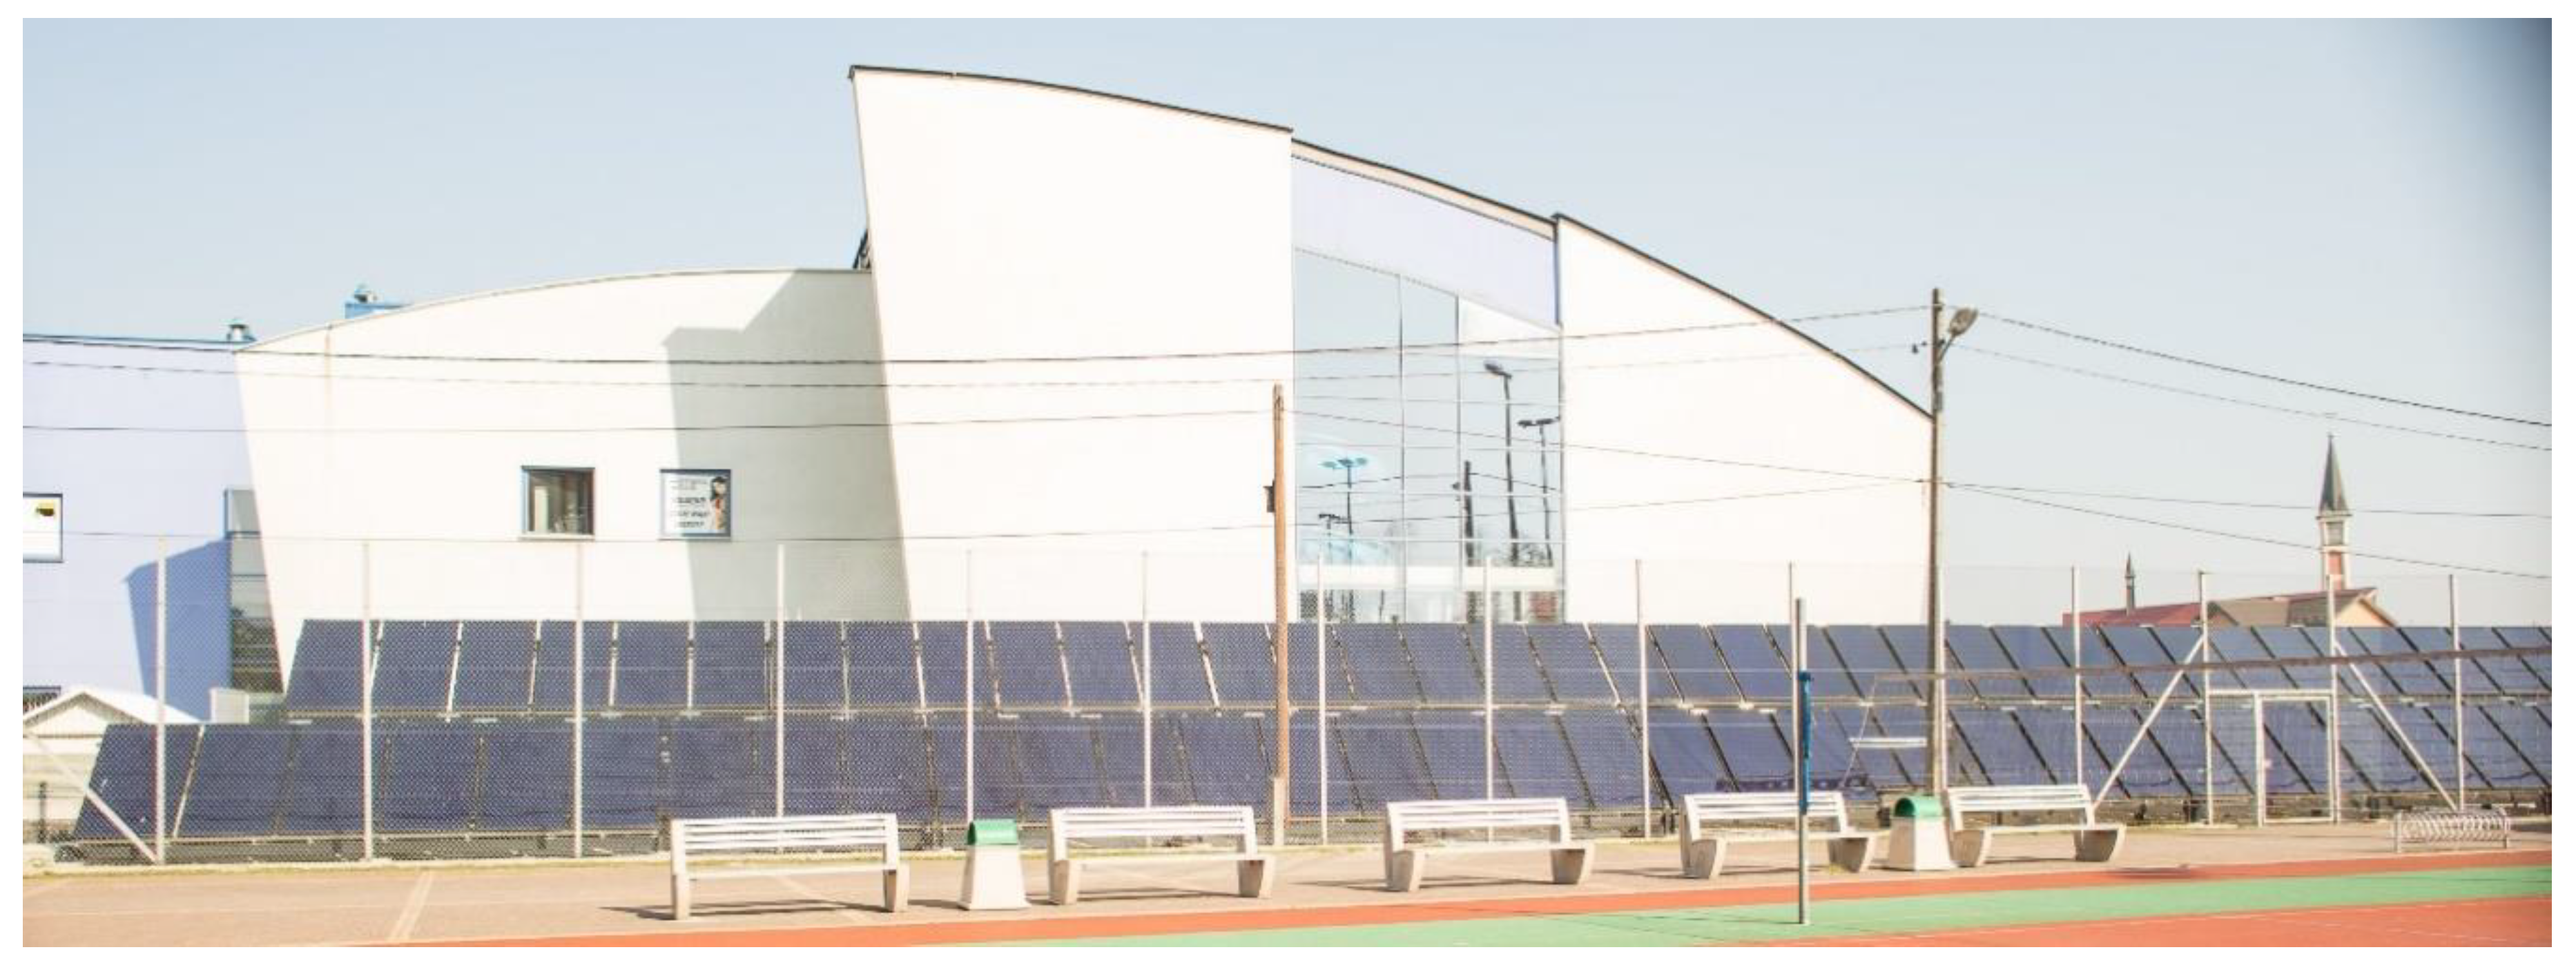
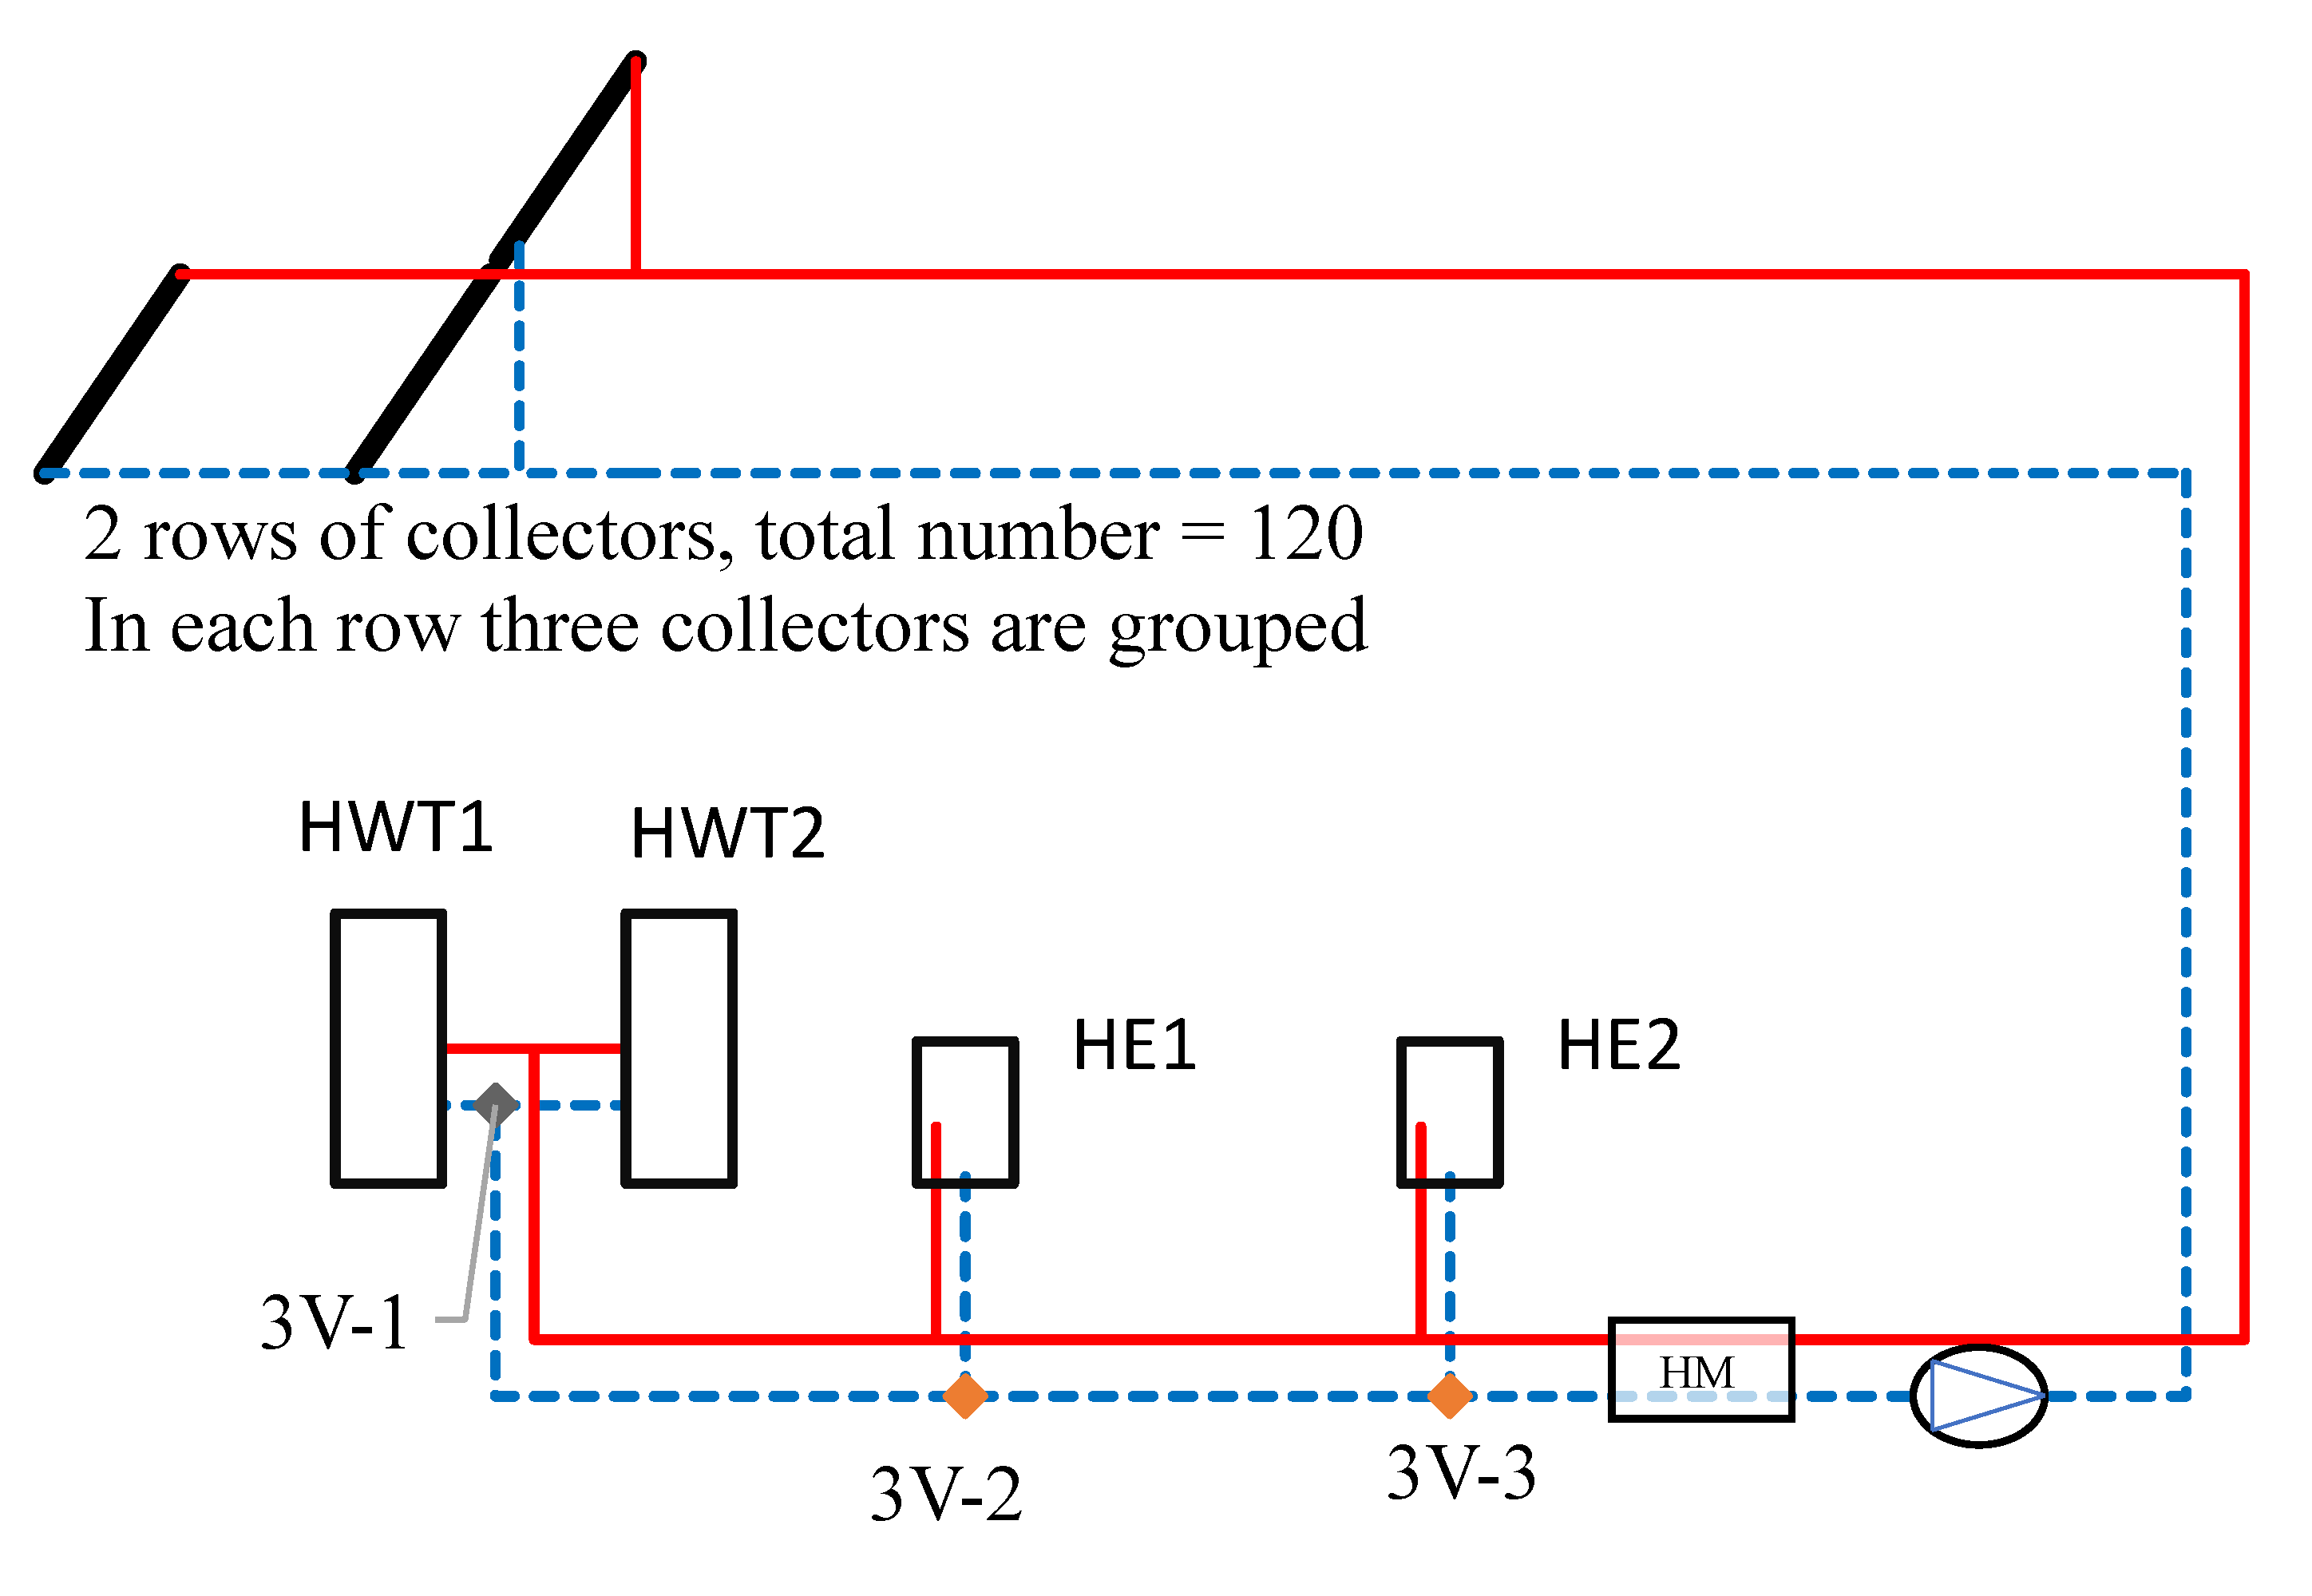
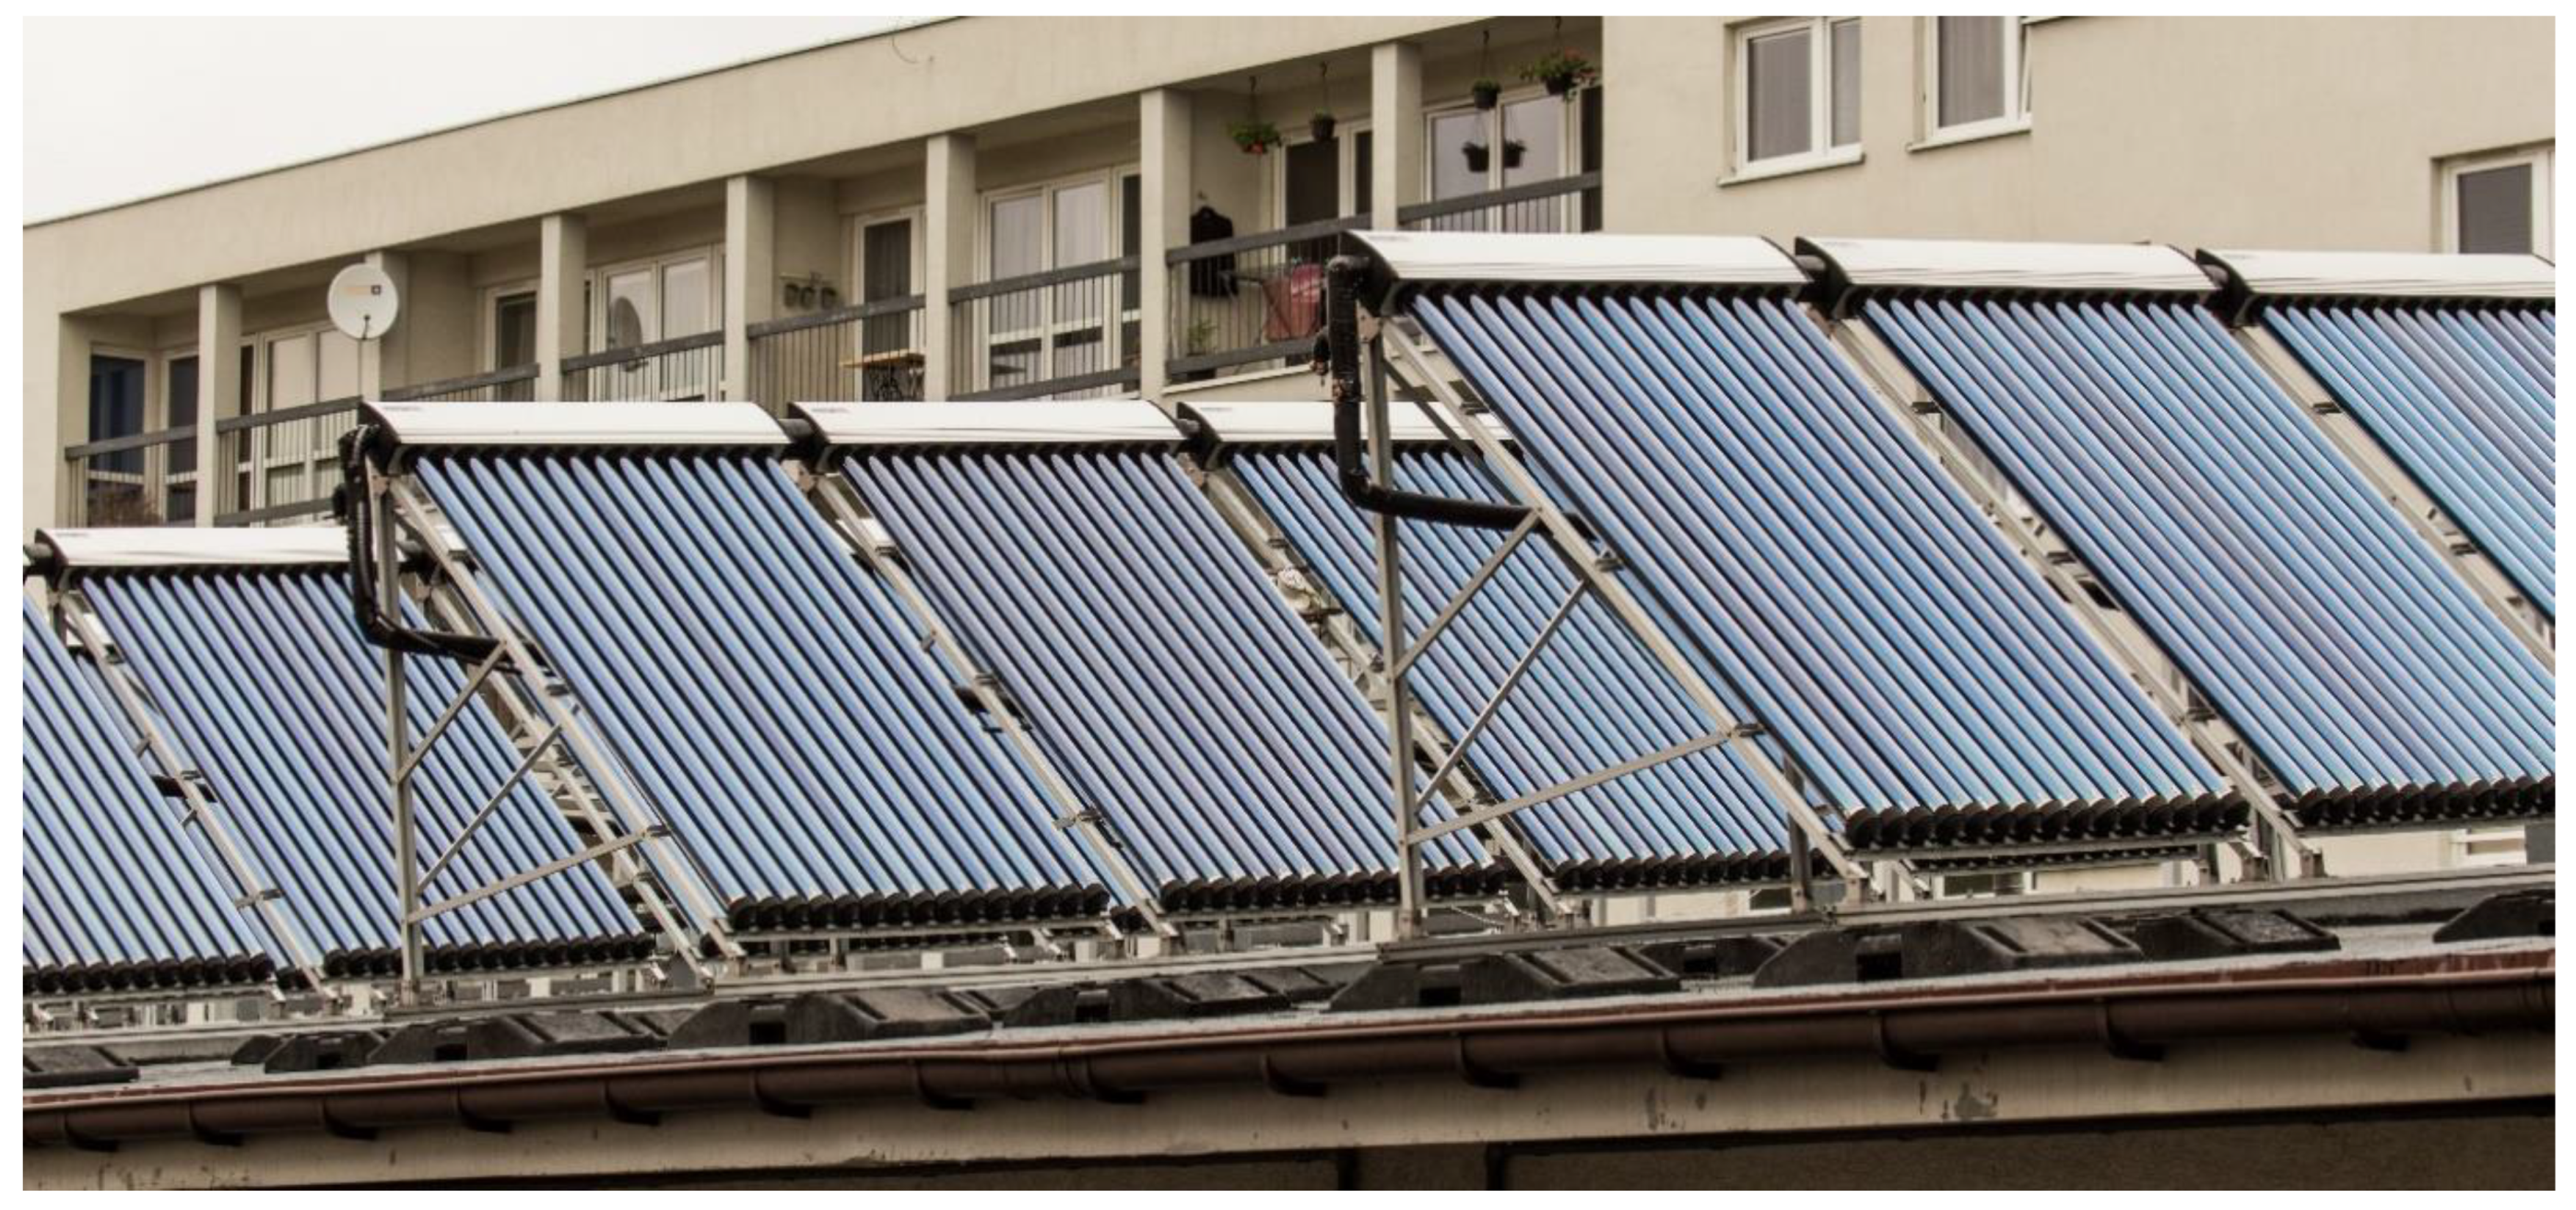
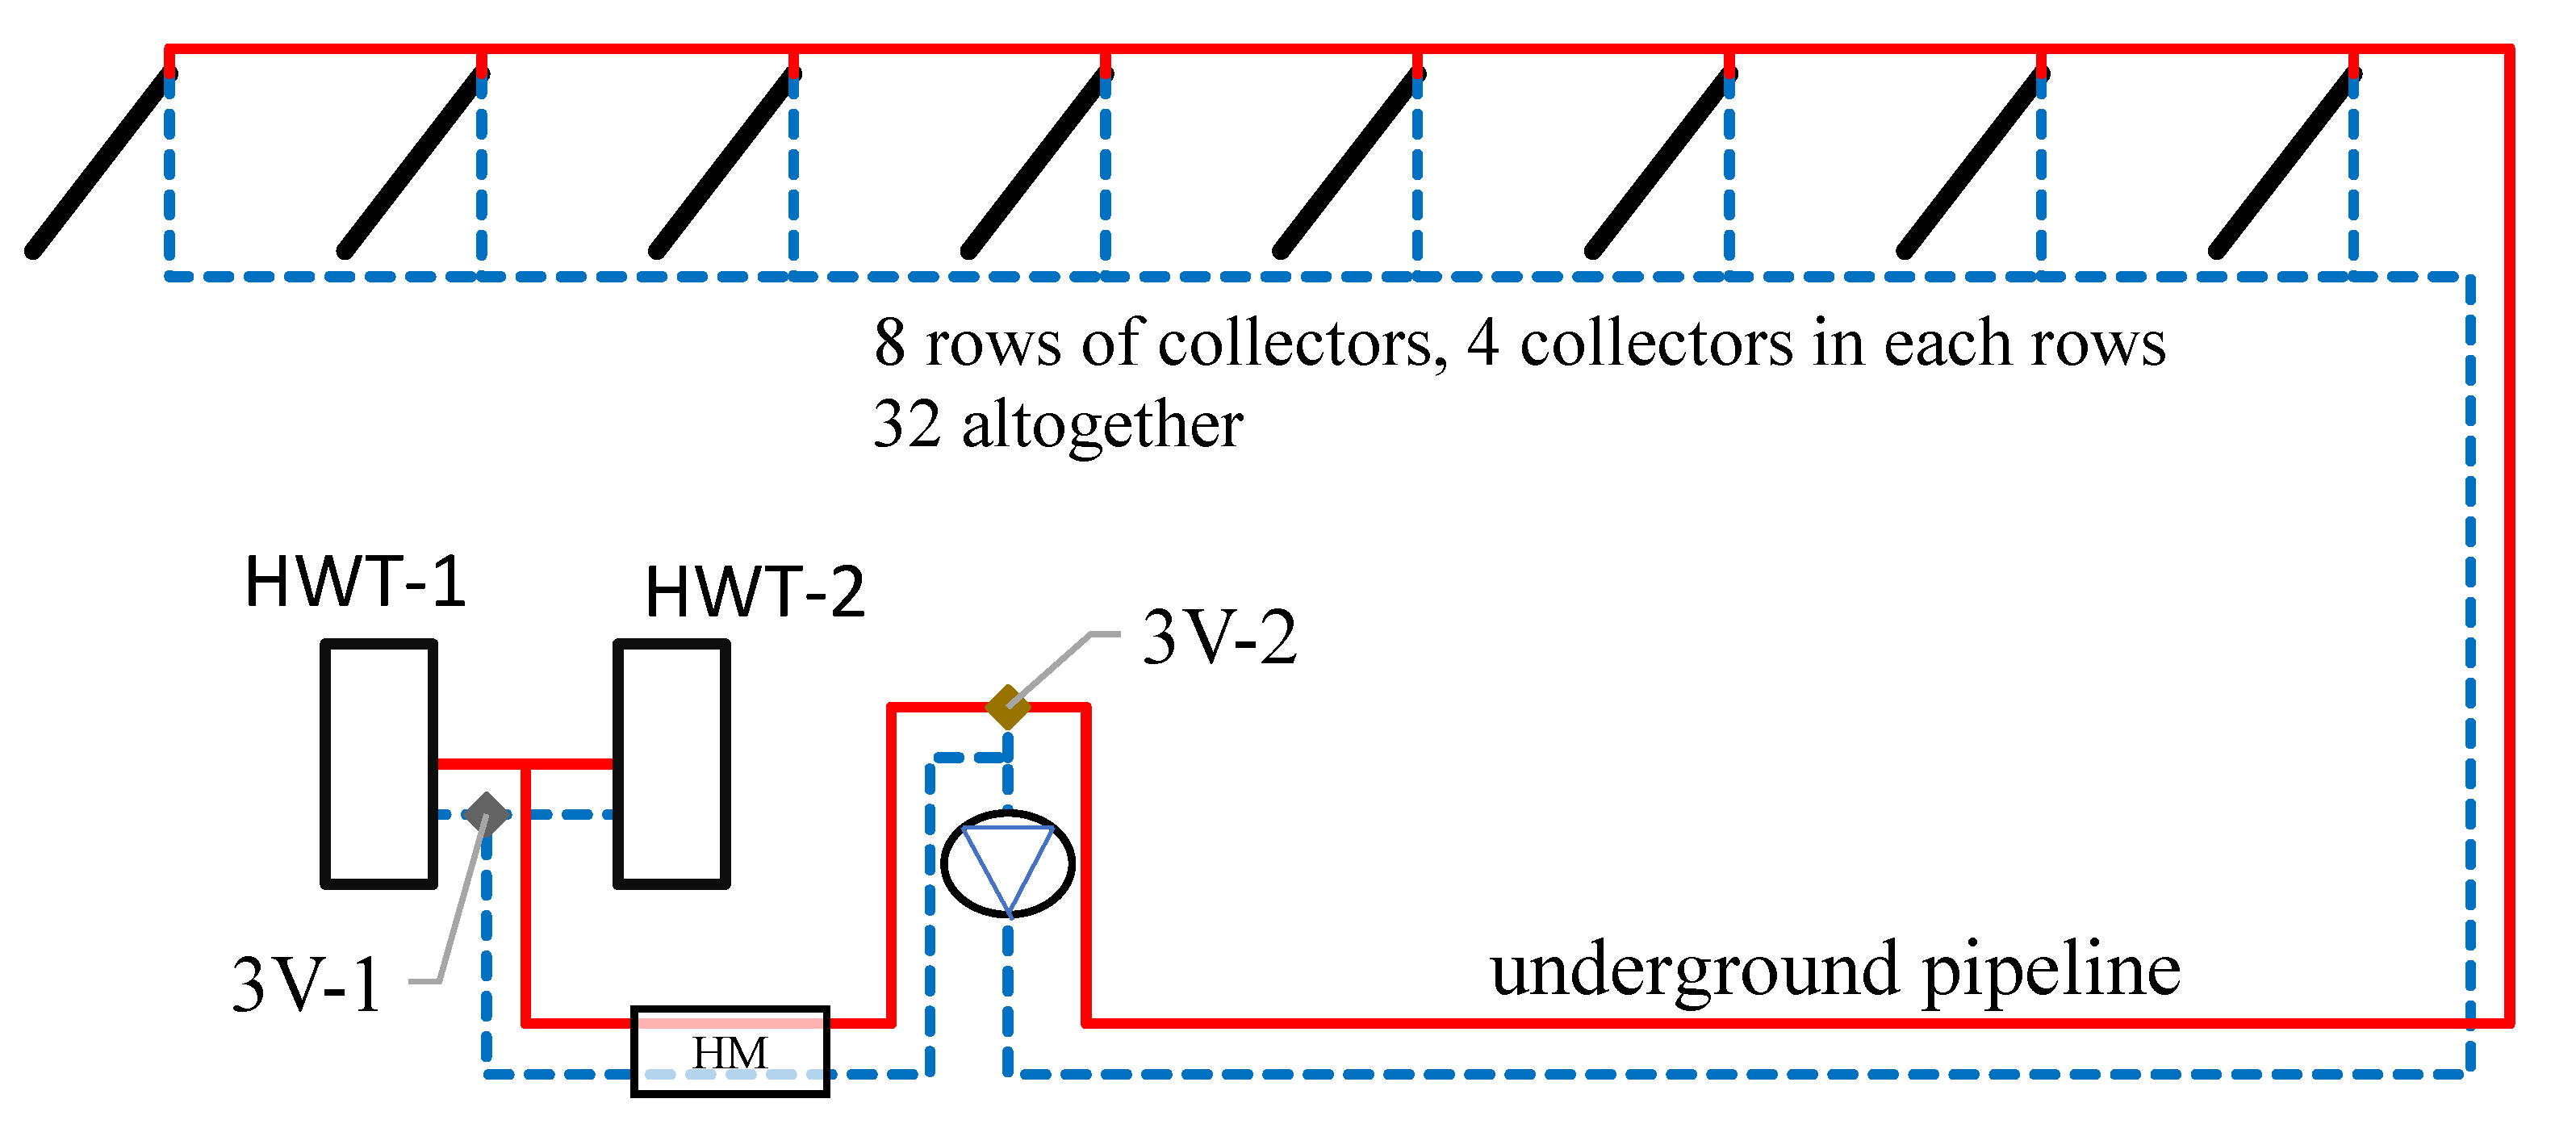
2.1. Descriptions of the Two Installations

The indoor swimming pool building of the Sport and Recreation Center is located near the Brzesko city center (Figure 1) and consists of two pools:
  • Sport swimming pool, with a capacity of about 469 m3 and a temperature of 27 °C,
  • Recreational pool, with a capacity of 105 m3 and a temperature of 29 °C.
The main heat source for the preparation of sanitary hot water and swimming pool water in this building is a gas boiler. In July 2013, the new solar installation became an additional heat source (the general scheme is shown in Figure 2, collectors specification in Table 1, while characteristics are shown in Table 2). The installation powers two hot water tanks (HWTs) with a capacity of 1500 dm3 each, as well as both pools through the heat exchangers (HEs). The sanitary hot water preparation is given priority, before the recreational and sport pools are taken into consideration. Flat plate solar collectors are in front of the building in two rows at an angle of 45°, with the second row stacked. Collectors are joined in series, with three items in each and 120 items altogether.
A multi-family building consisting of 52 flats is located in the southwestern part of Krosno city (Figure 3).
In this building, in 2011, the domestic hot water installation was modernized by adding the solar installation (characteristics in Table 2 and scheme in Figure 4). In cases where water is not heated up to the required level for domestic hot water parameters, it is additionally heated using two gas-fired boilers with a total power of 260 kW. In the wintertime, they are also used for central heating. In the “solar” part of the installation, there are two hot water tanks with a capacity of 1500 dm3 each, and, in the “gas” section, there are also two hot water tanks, but each of them has a capacity of 500 dm3. Evacuated tube collectors (each consisting of 15 evacuated tubes with a heat pipe) supplying the installation are installed on the garage roof at an angle of 45° in eight rows, with four collectors in every row (32 collectors altogether). The basic parameters of these collectors are shown in Table 1.

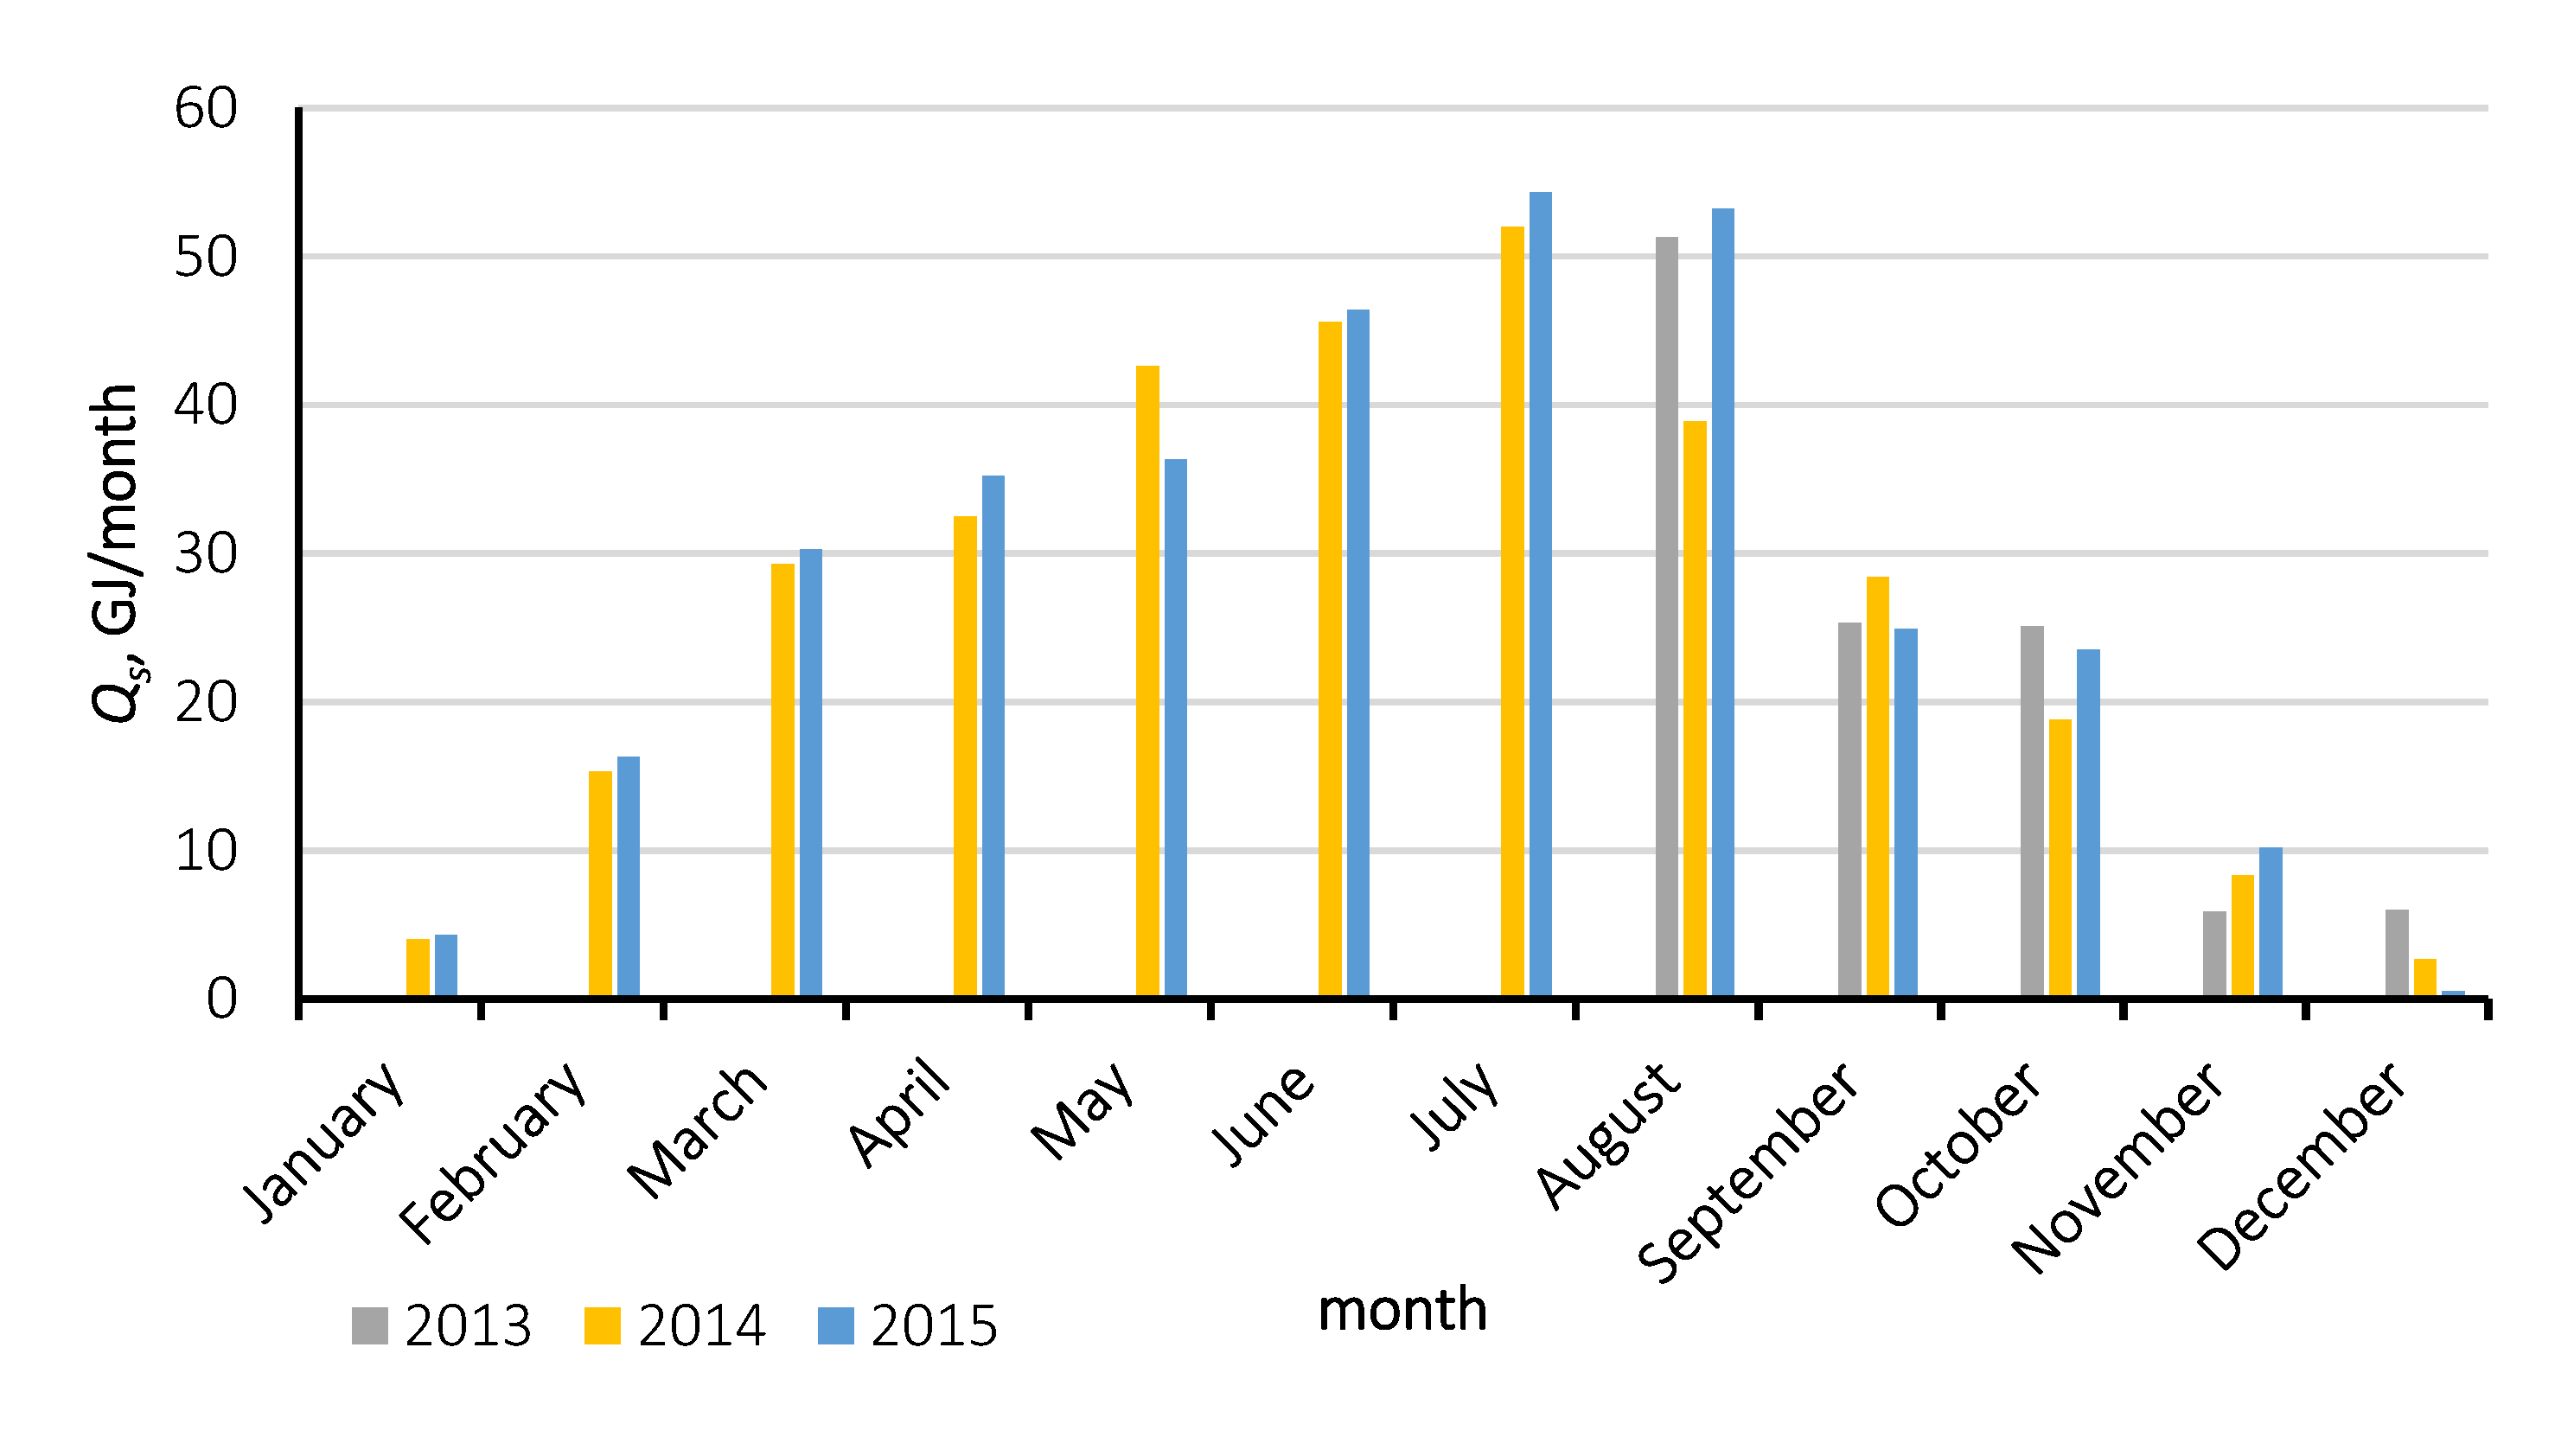
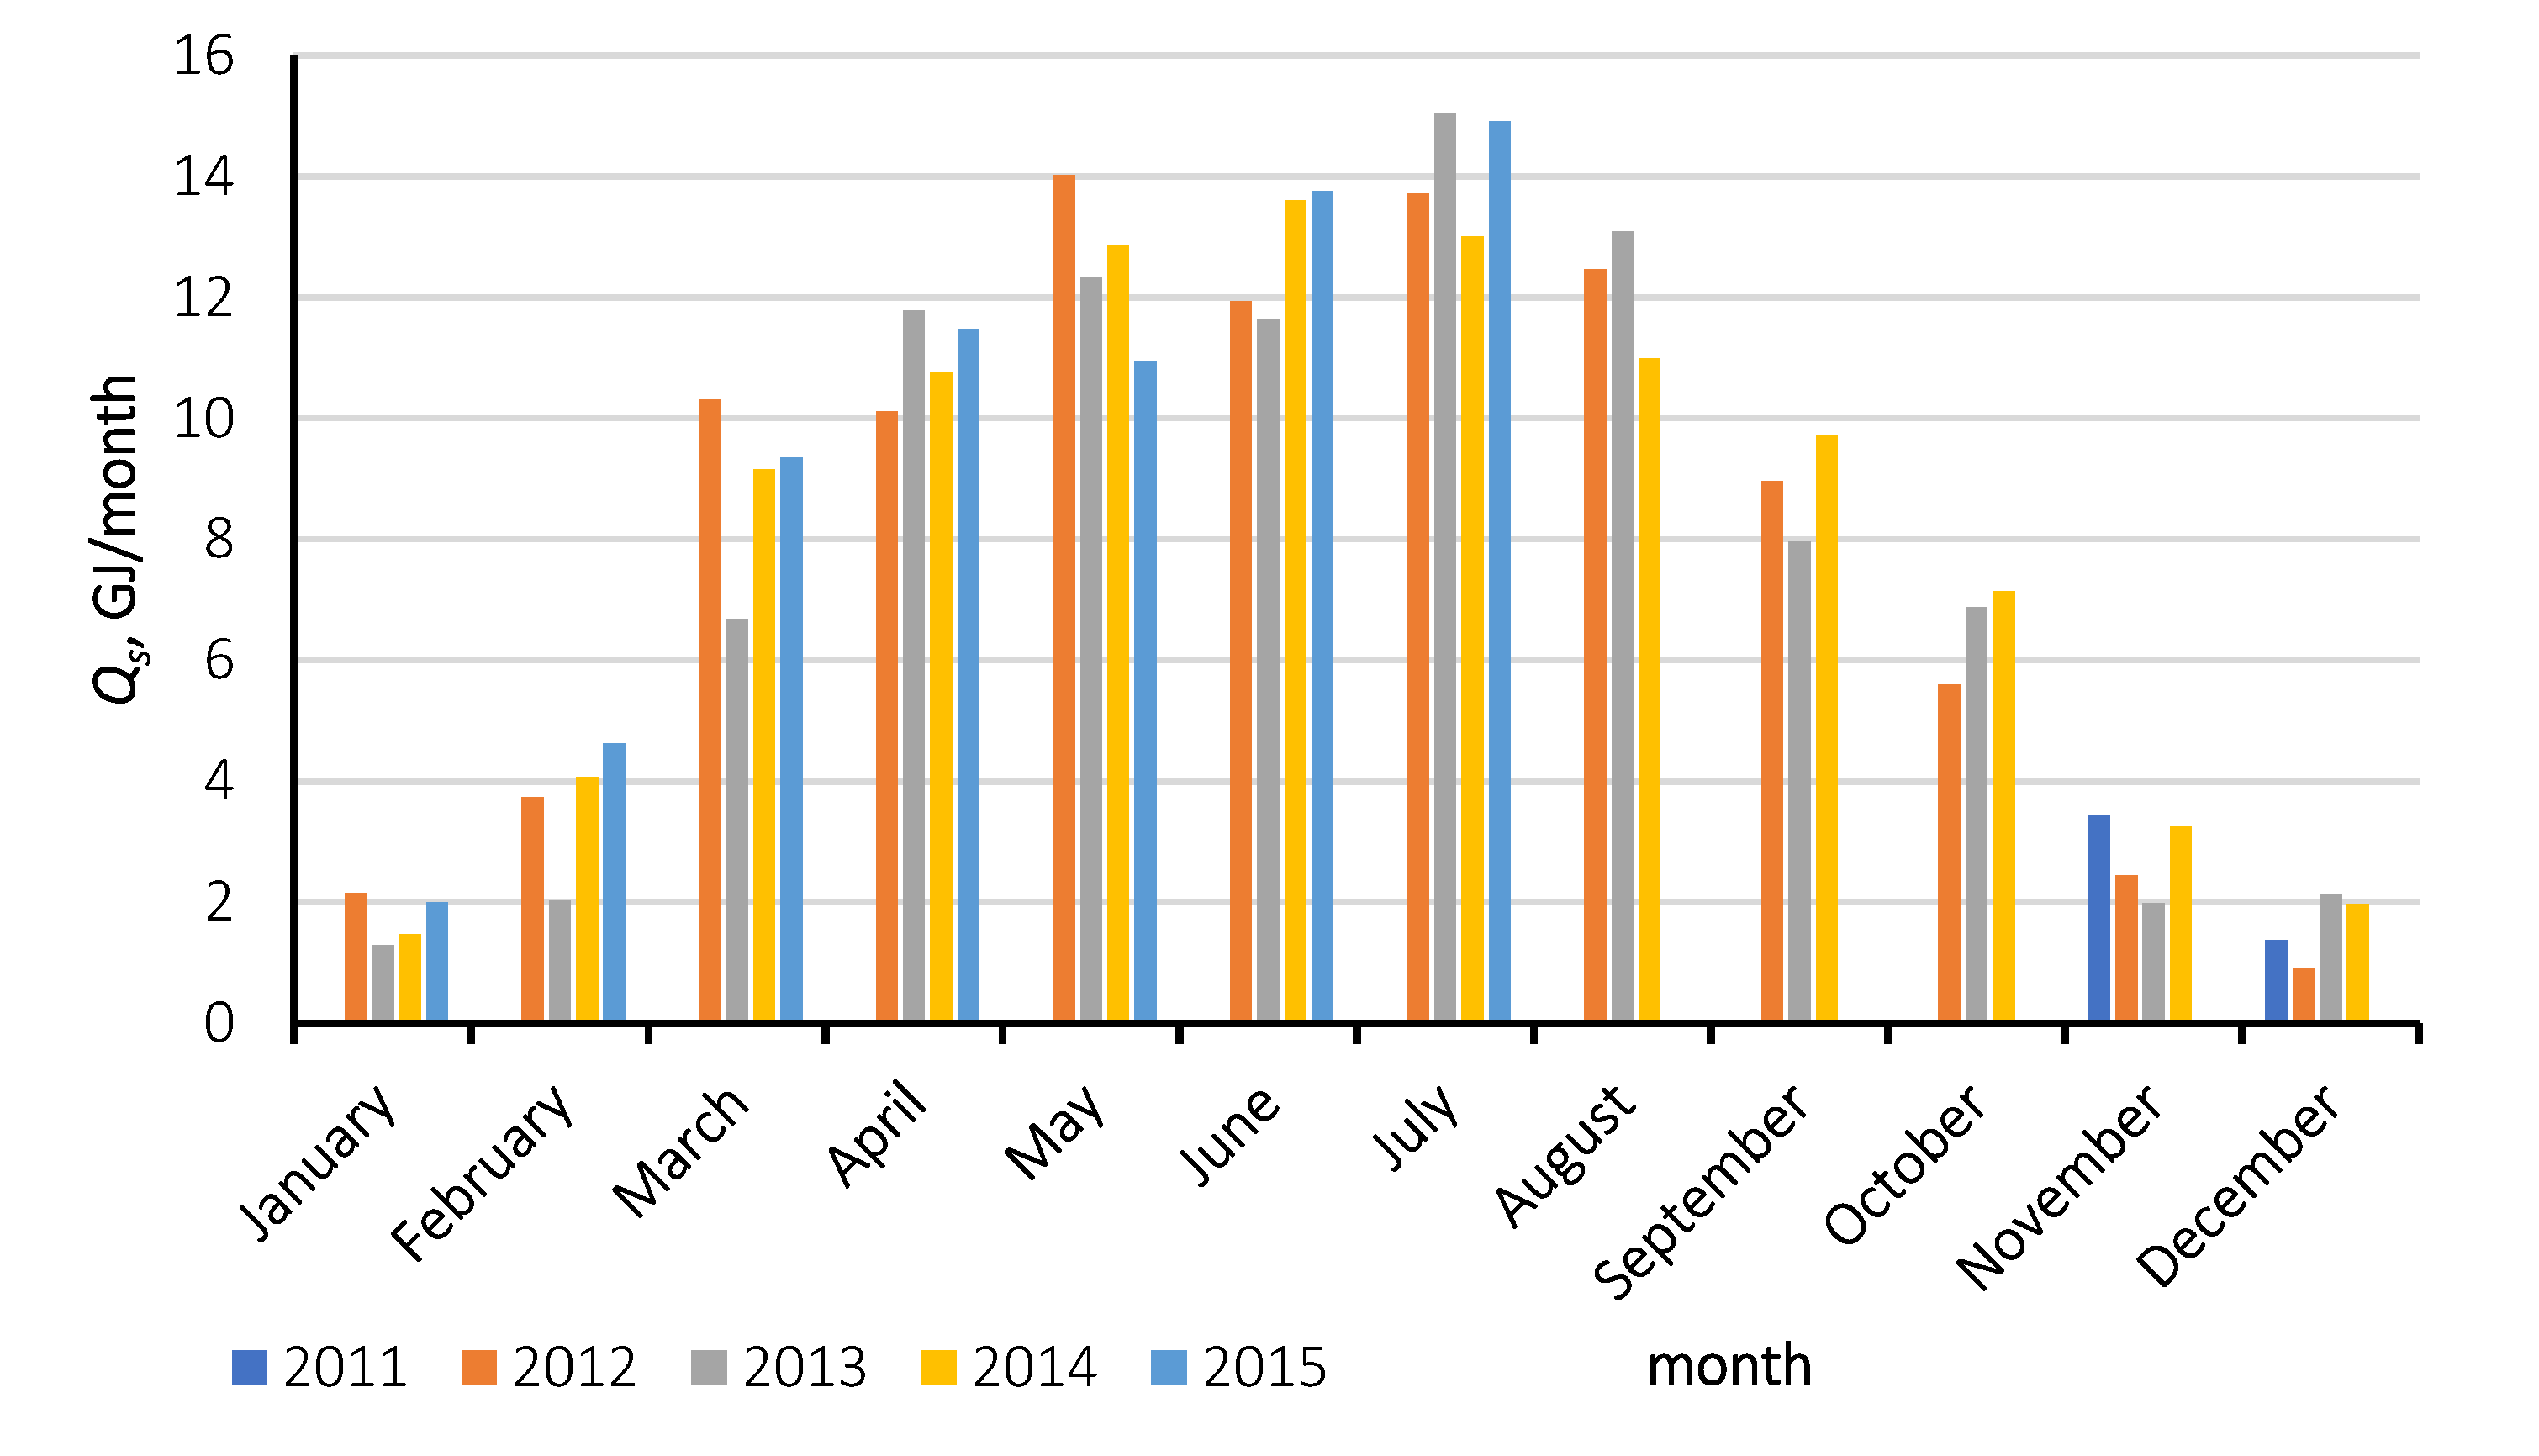
2.2. Solar Heat Gains

Data on the monthly amount of solar energy gains were taken from heat meters (similar parameters with the same producer, Table 2) installed in both installations. Initially, the heat meters were prepared by the producer to measure heat transported by water, which resulted in the obtained values of solar energy gains needing to be corrected. A correction factor (cc) was used because glycol fluid and water are characterized by different values of density and specific heat. Heat meters measure the solar heat gains through the measurement of inlet and outlet temperature and flow rate. The calculation is based on the following equation:
Q m ( month ) = month { [ T H 1 ( τ ) T H 2 ( τ ) ] × c w × ρ × V ˙ ( τ ) } / 1000000 ,
where Qm is the monthly solar heat gain (before correction) in GJ/month, TH1 and TH2 are the outlet (from collectors) and inlet temperature measured by the heat meter (see Figure 2 and Figure 4) in K, cw is the specific heat of water in kJ/(kg∙K), ρ is the density of water in kg/dm3, V ˙ is the volumetric flow rate measured by the heat meter in dm3/min, and τ is the time in min.
Finally, in this work, solar heat gains were obtained with correction using Equation (2).
Q s ( month ) = Q m ( month ) × c c ( month ) ,
where Qs is the monthly solar heat gain in GJ/month, month refers to a particular month, and cc is the correction factor based on calculation from investigation [46].
Solar heat gains (Qs), gathered and calculated from the start of installation, are shown in Figure 5 (Brzesko, up to December 2015) and Figure 6 (Krosno, up to July 2015).

3. Comparison

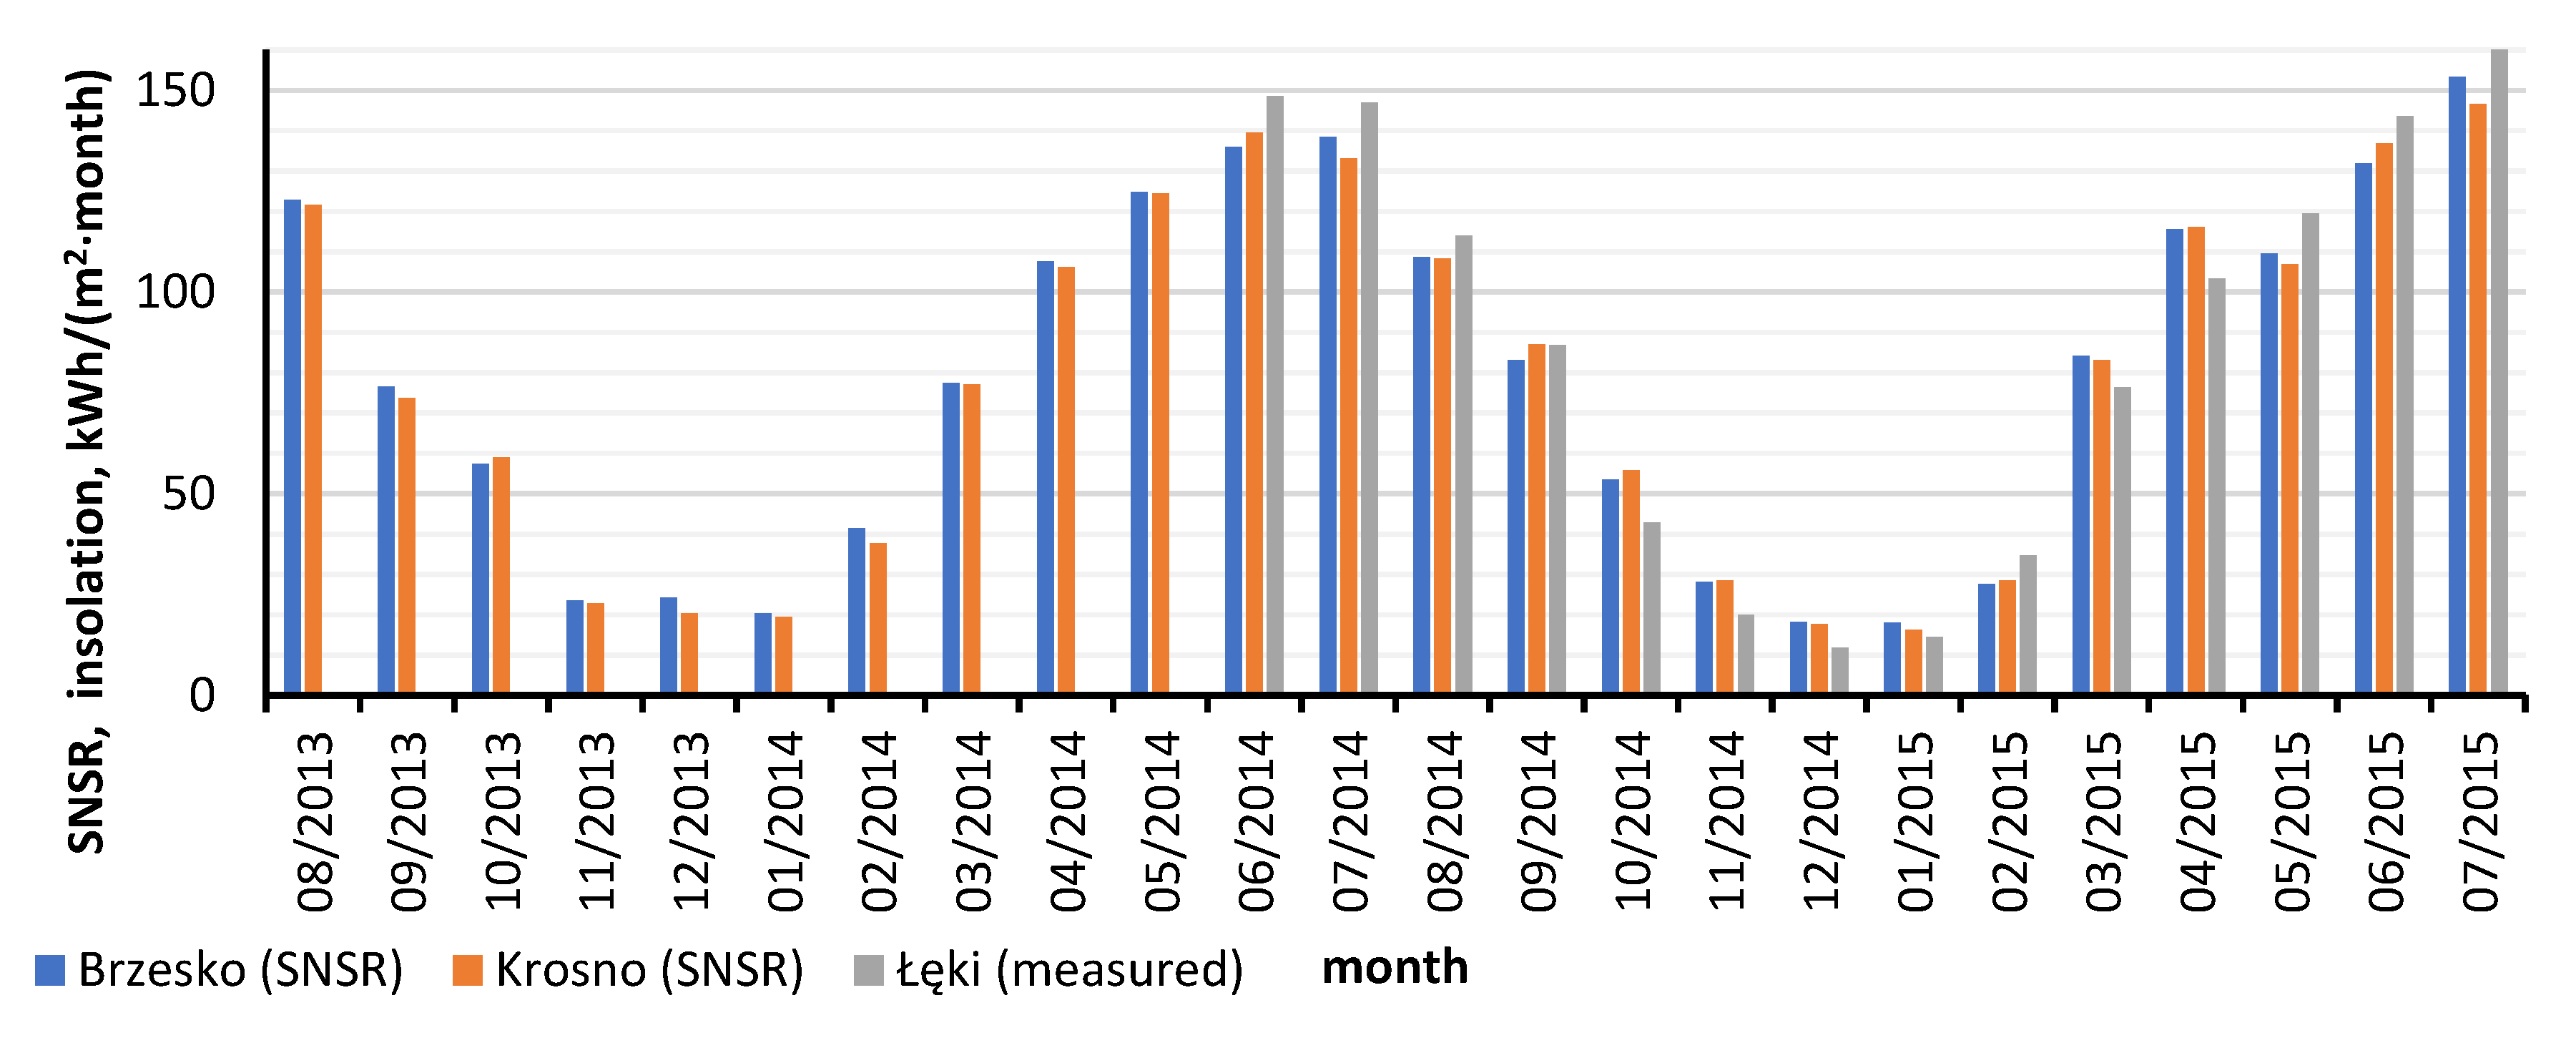
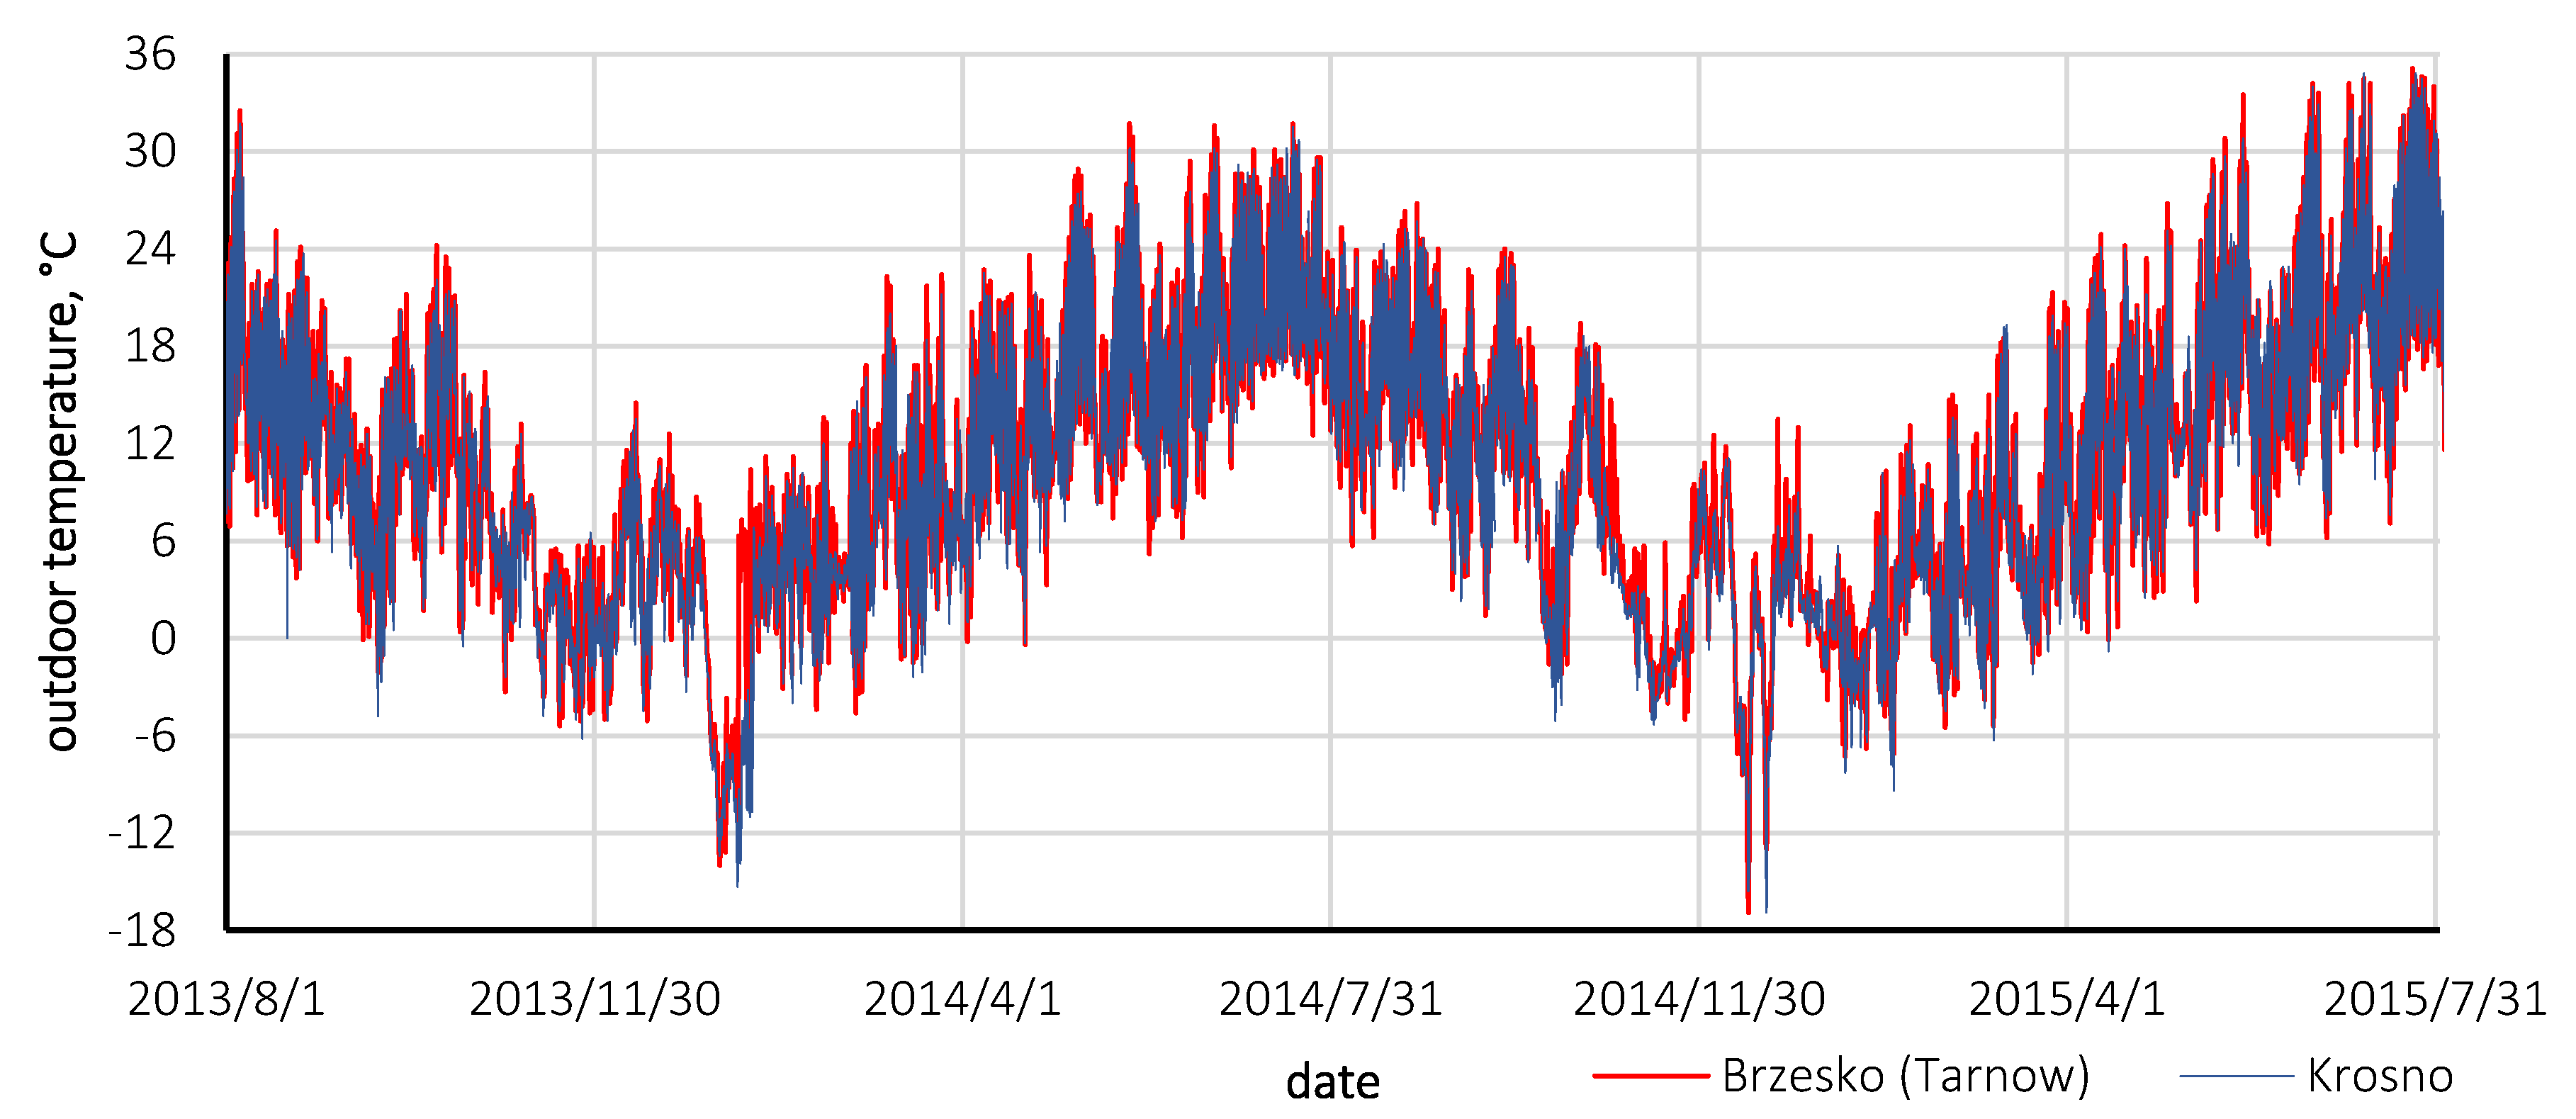
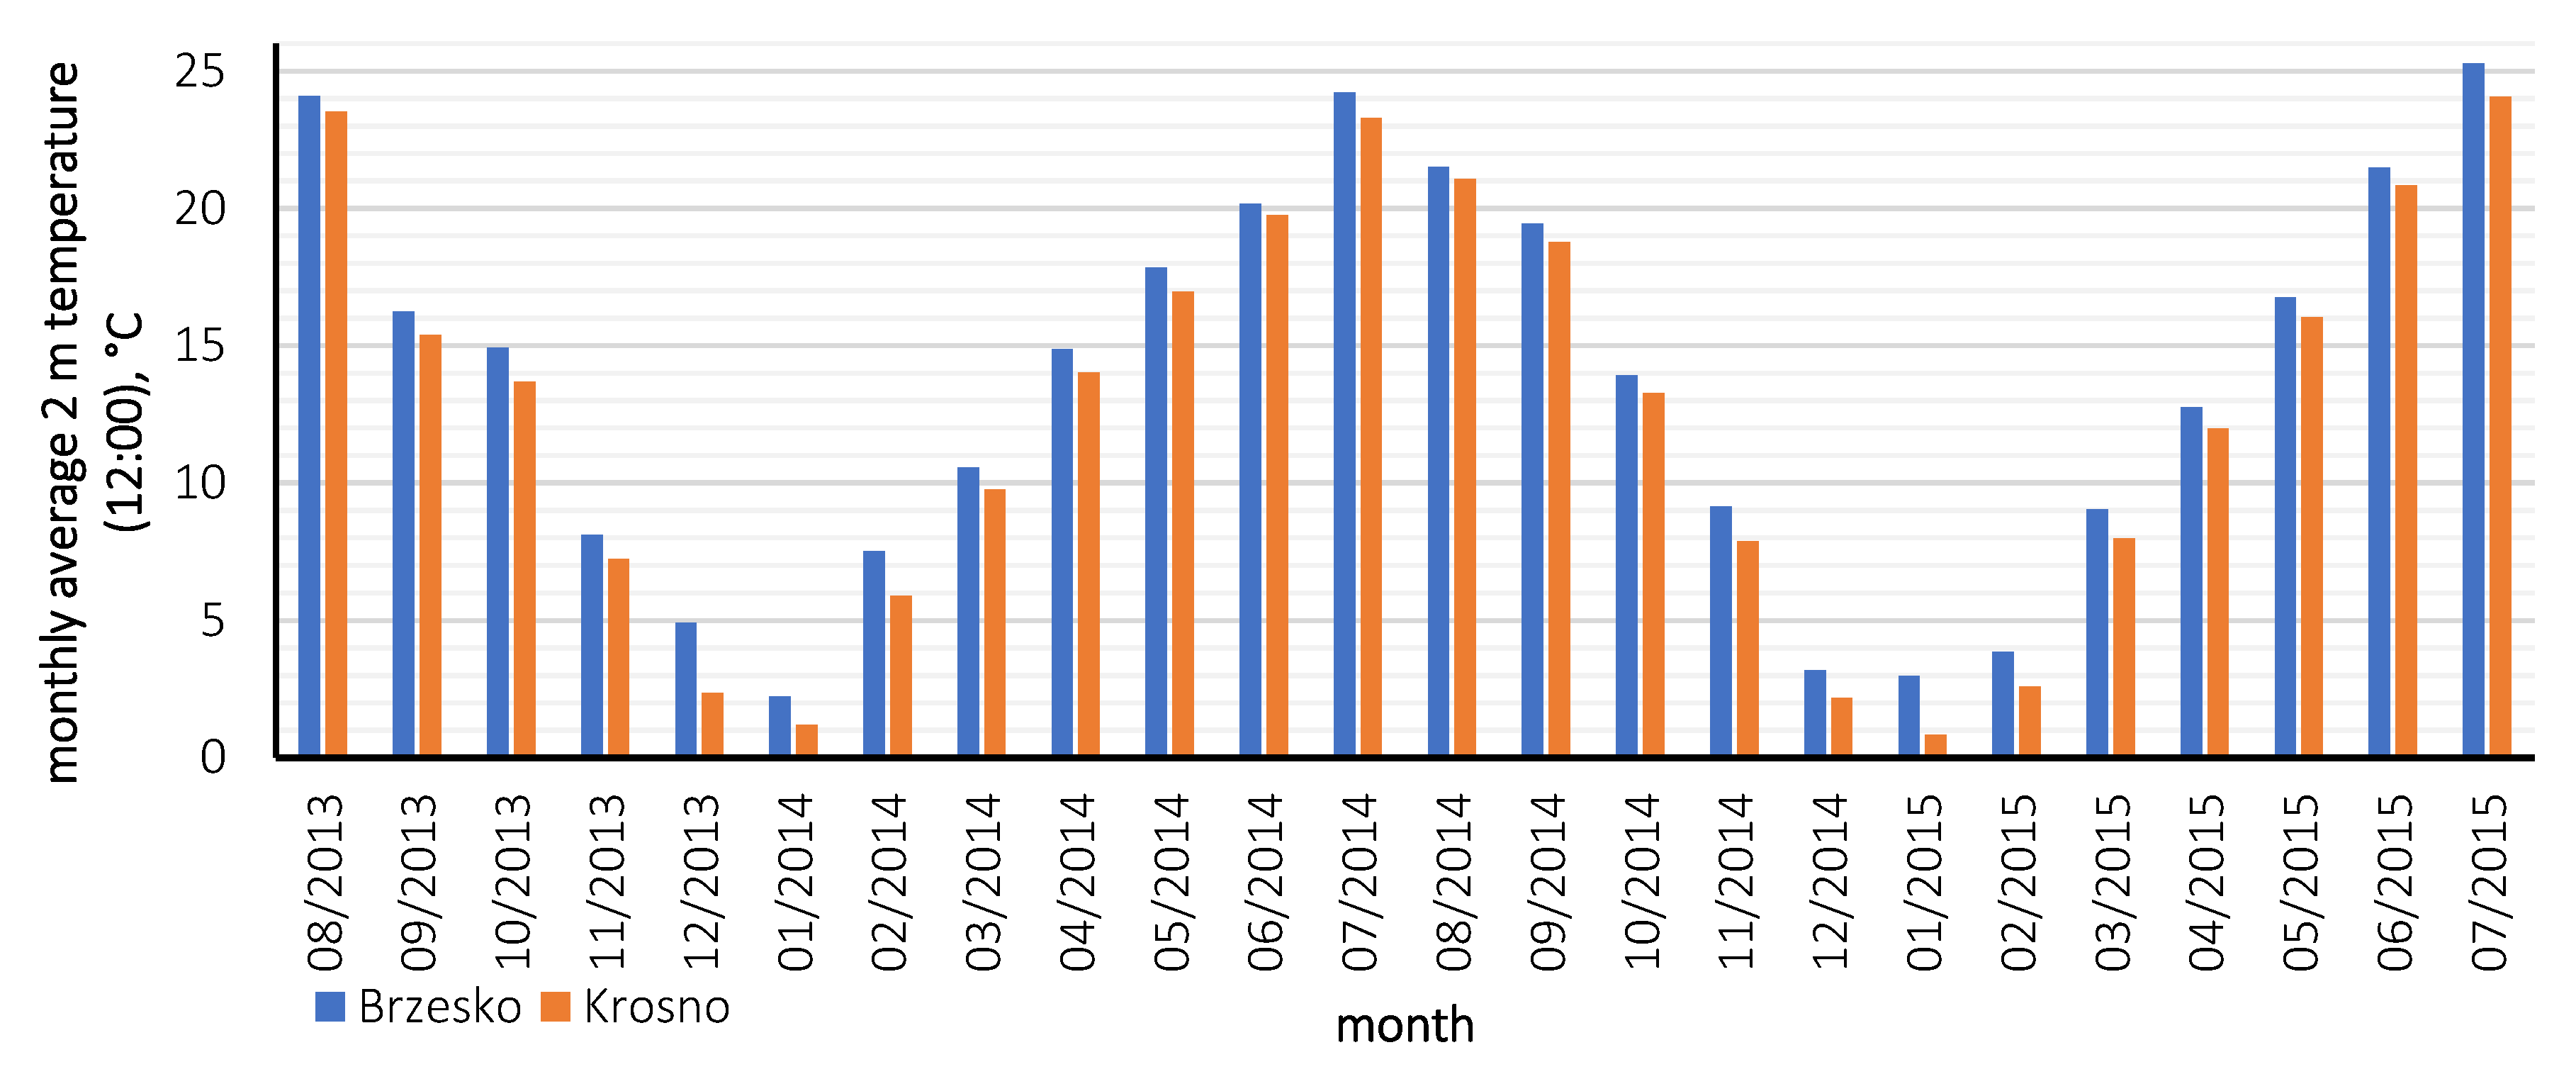
3.1. Weather Conditions Comparison

Collector efficiency is influenced not only by its absorptive properties but also by heat losses to the environment, which depend on inter alia the solar radiation value and the difference between inlet collector temperature and outdoor temperature. When two solar systems are being compared, the knowledge of these conditions may be helpful, but it is not always possible to determine them in the direct proximity of the installation.
The values of the monthly insolation directed toward a horizontal surface or the surface at an angle of 45° were taken according to the data from a typical reference year (TRY) for the installations used (1) in a multi-family house from a weather station in Krosno at 45° (1125 kWh/(m2·year)) and horizontally (1029 kWh/(m2·year)), and (2) in an indoor swimming pool building in Brzesko from the nearest weather station in Tarnów at 45° (1172 kWh/(m2·year)) and horizontally (1071 kWh/(m2·year)).
In order to confirm the above-mentioned values monthly averaged data of surface net solar radiation (SNSR) from ERA5-Land were obtained [47,48]. These data confirmed that insolation in Brzesko (latitude 50.0° north (N) and longitude 20.6° east (E)) was 0.7% higher than in Krosno (latitude 49.7° N and longitude 21.8° E). Additionally, for the period from 1 June 2014 to 31 July 2015, data from solar radiation density (G) measurements were taken in Łęki (a village located 7.6 km from the solar installation in Brzesko). Results are shown in Figure 7.
Values of actual hourly outdoor temperature (Ta) for the analyzed period were received from the meteorological weather stations in Tarnów and Krosno from the Ogimet Weather Information Service [49] (see Figure 8).
The median value of the difference in outdoor temperature between Tarnów and Krosno was 0.4 °C and the mean value was 0.5 °C. This means that in Brzesko was probably a little hotter than in Krosno. This fact was confirmed (mean difference of 1 °C) by the ERA5-Land monthly averaged data (2-m temperature at 12:00 p.m.) (see Figure 9).

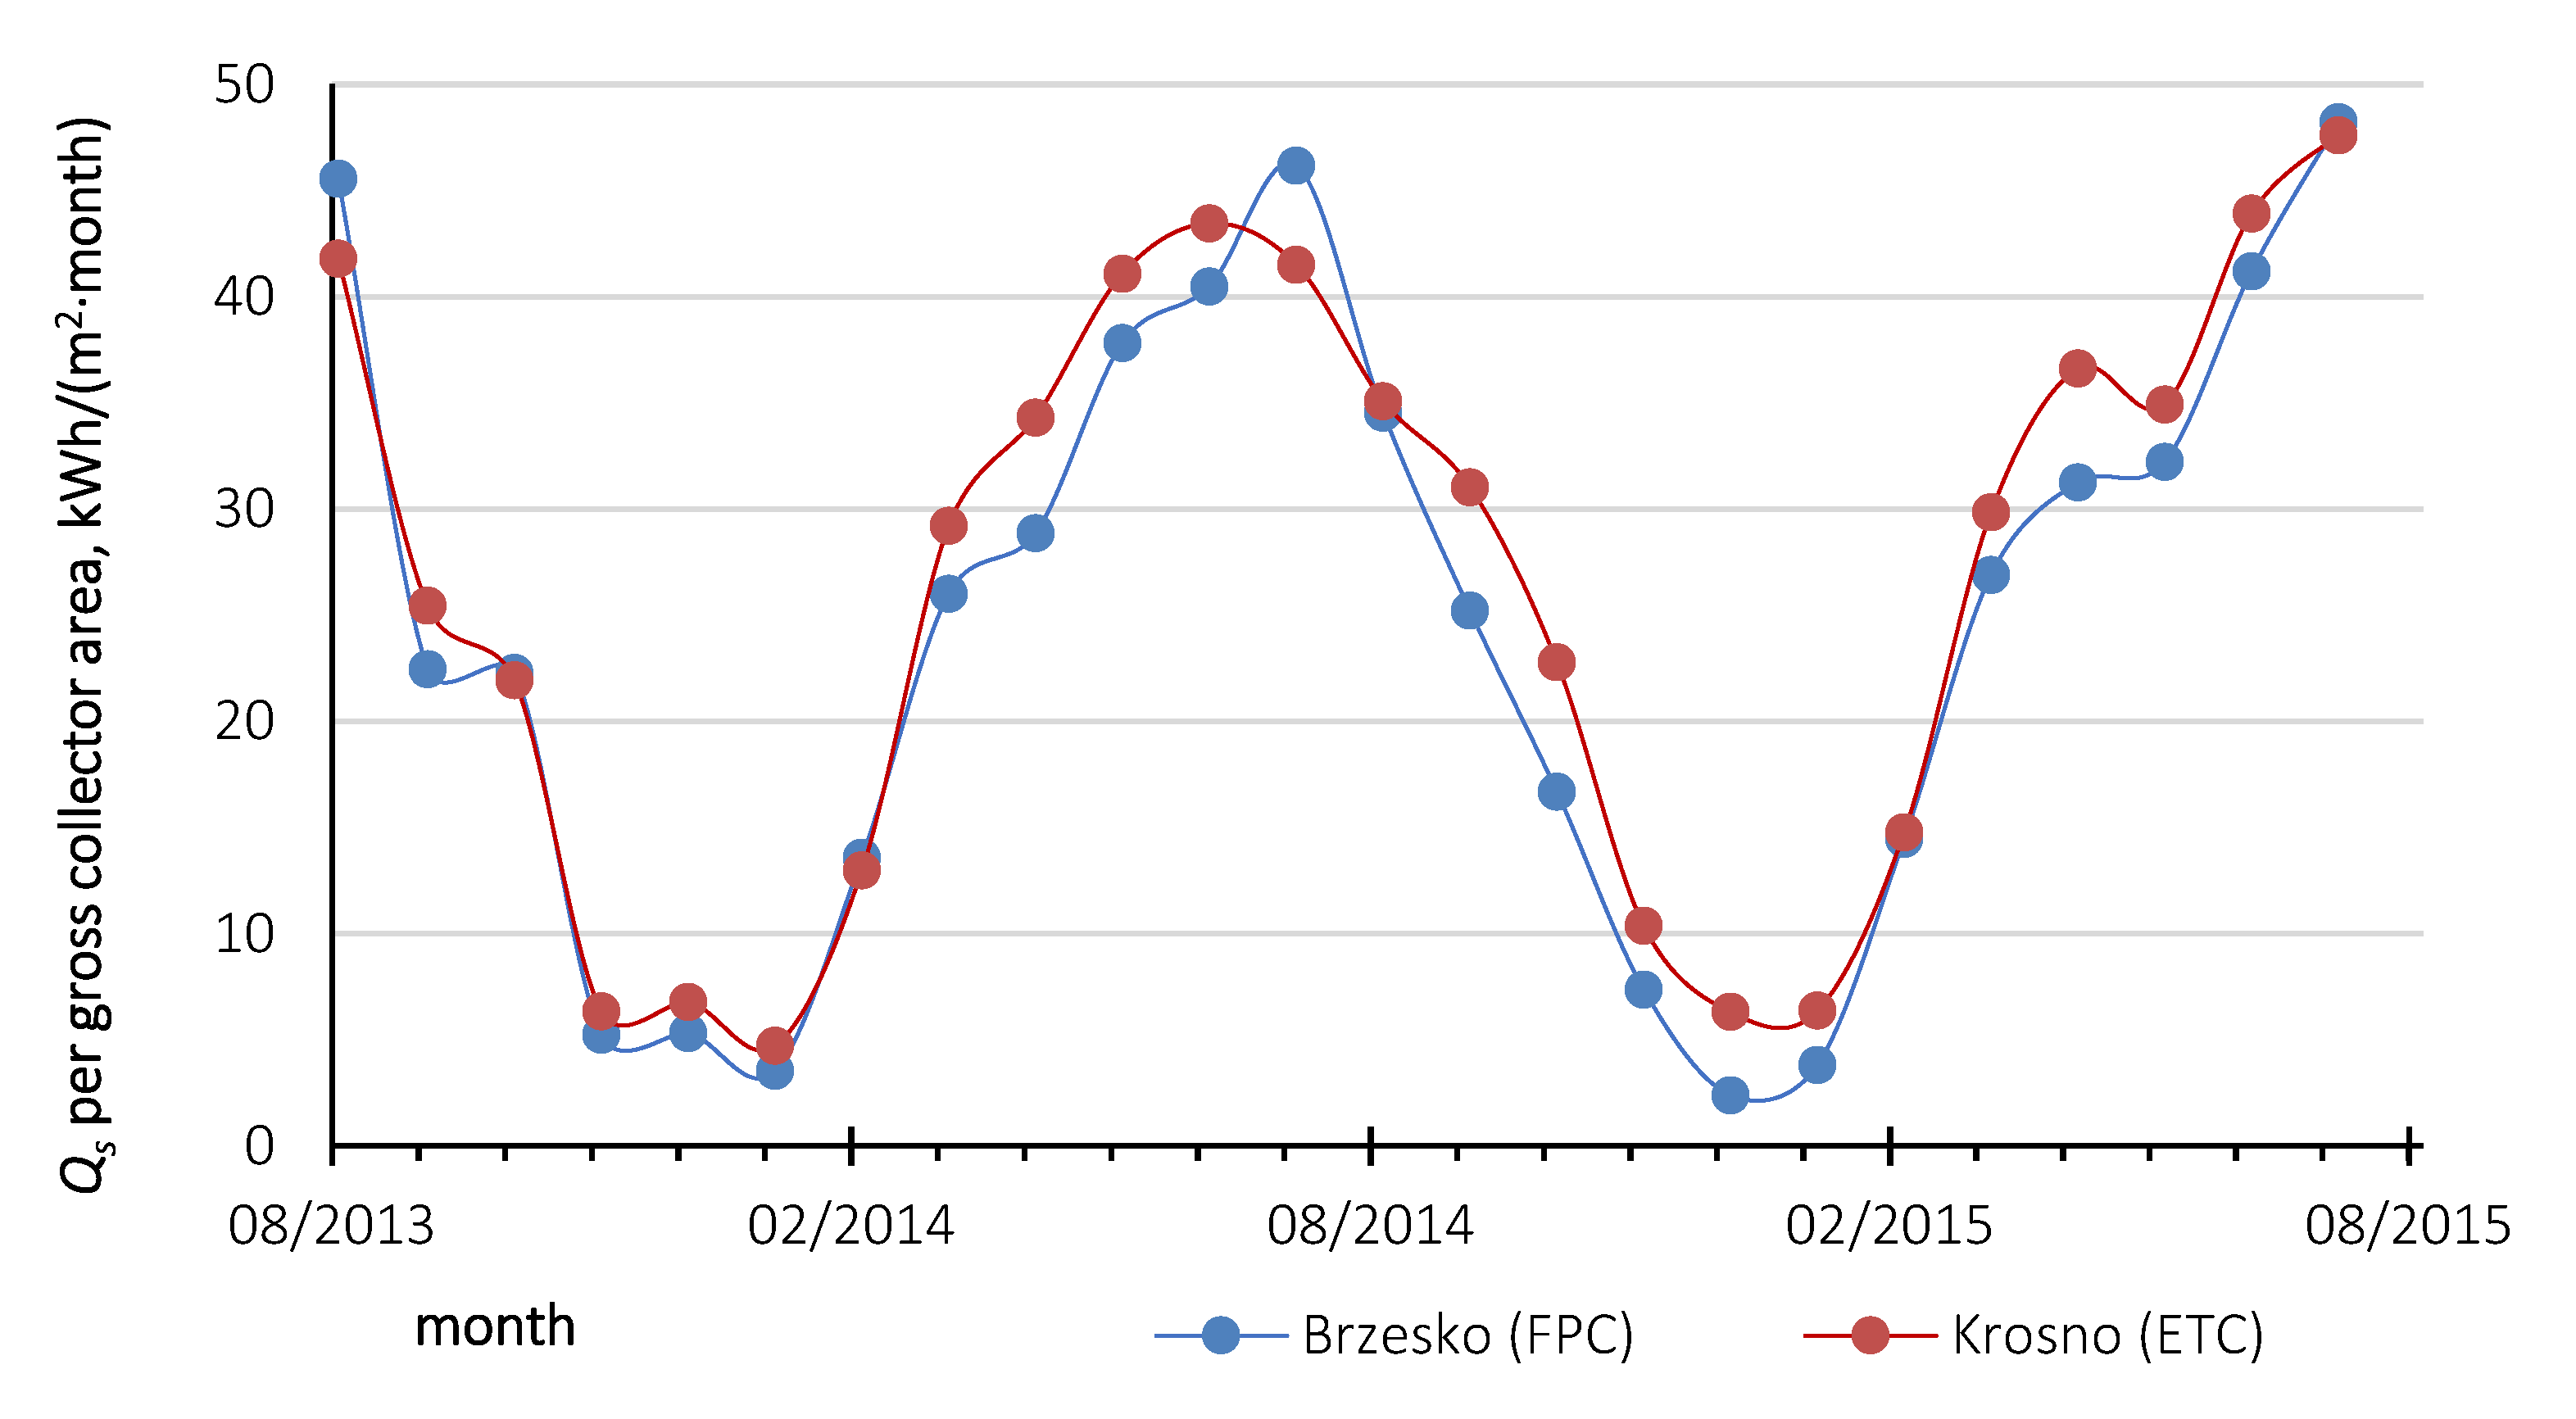
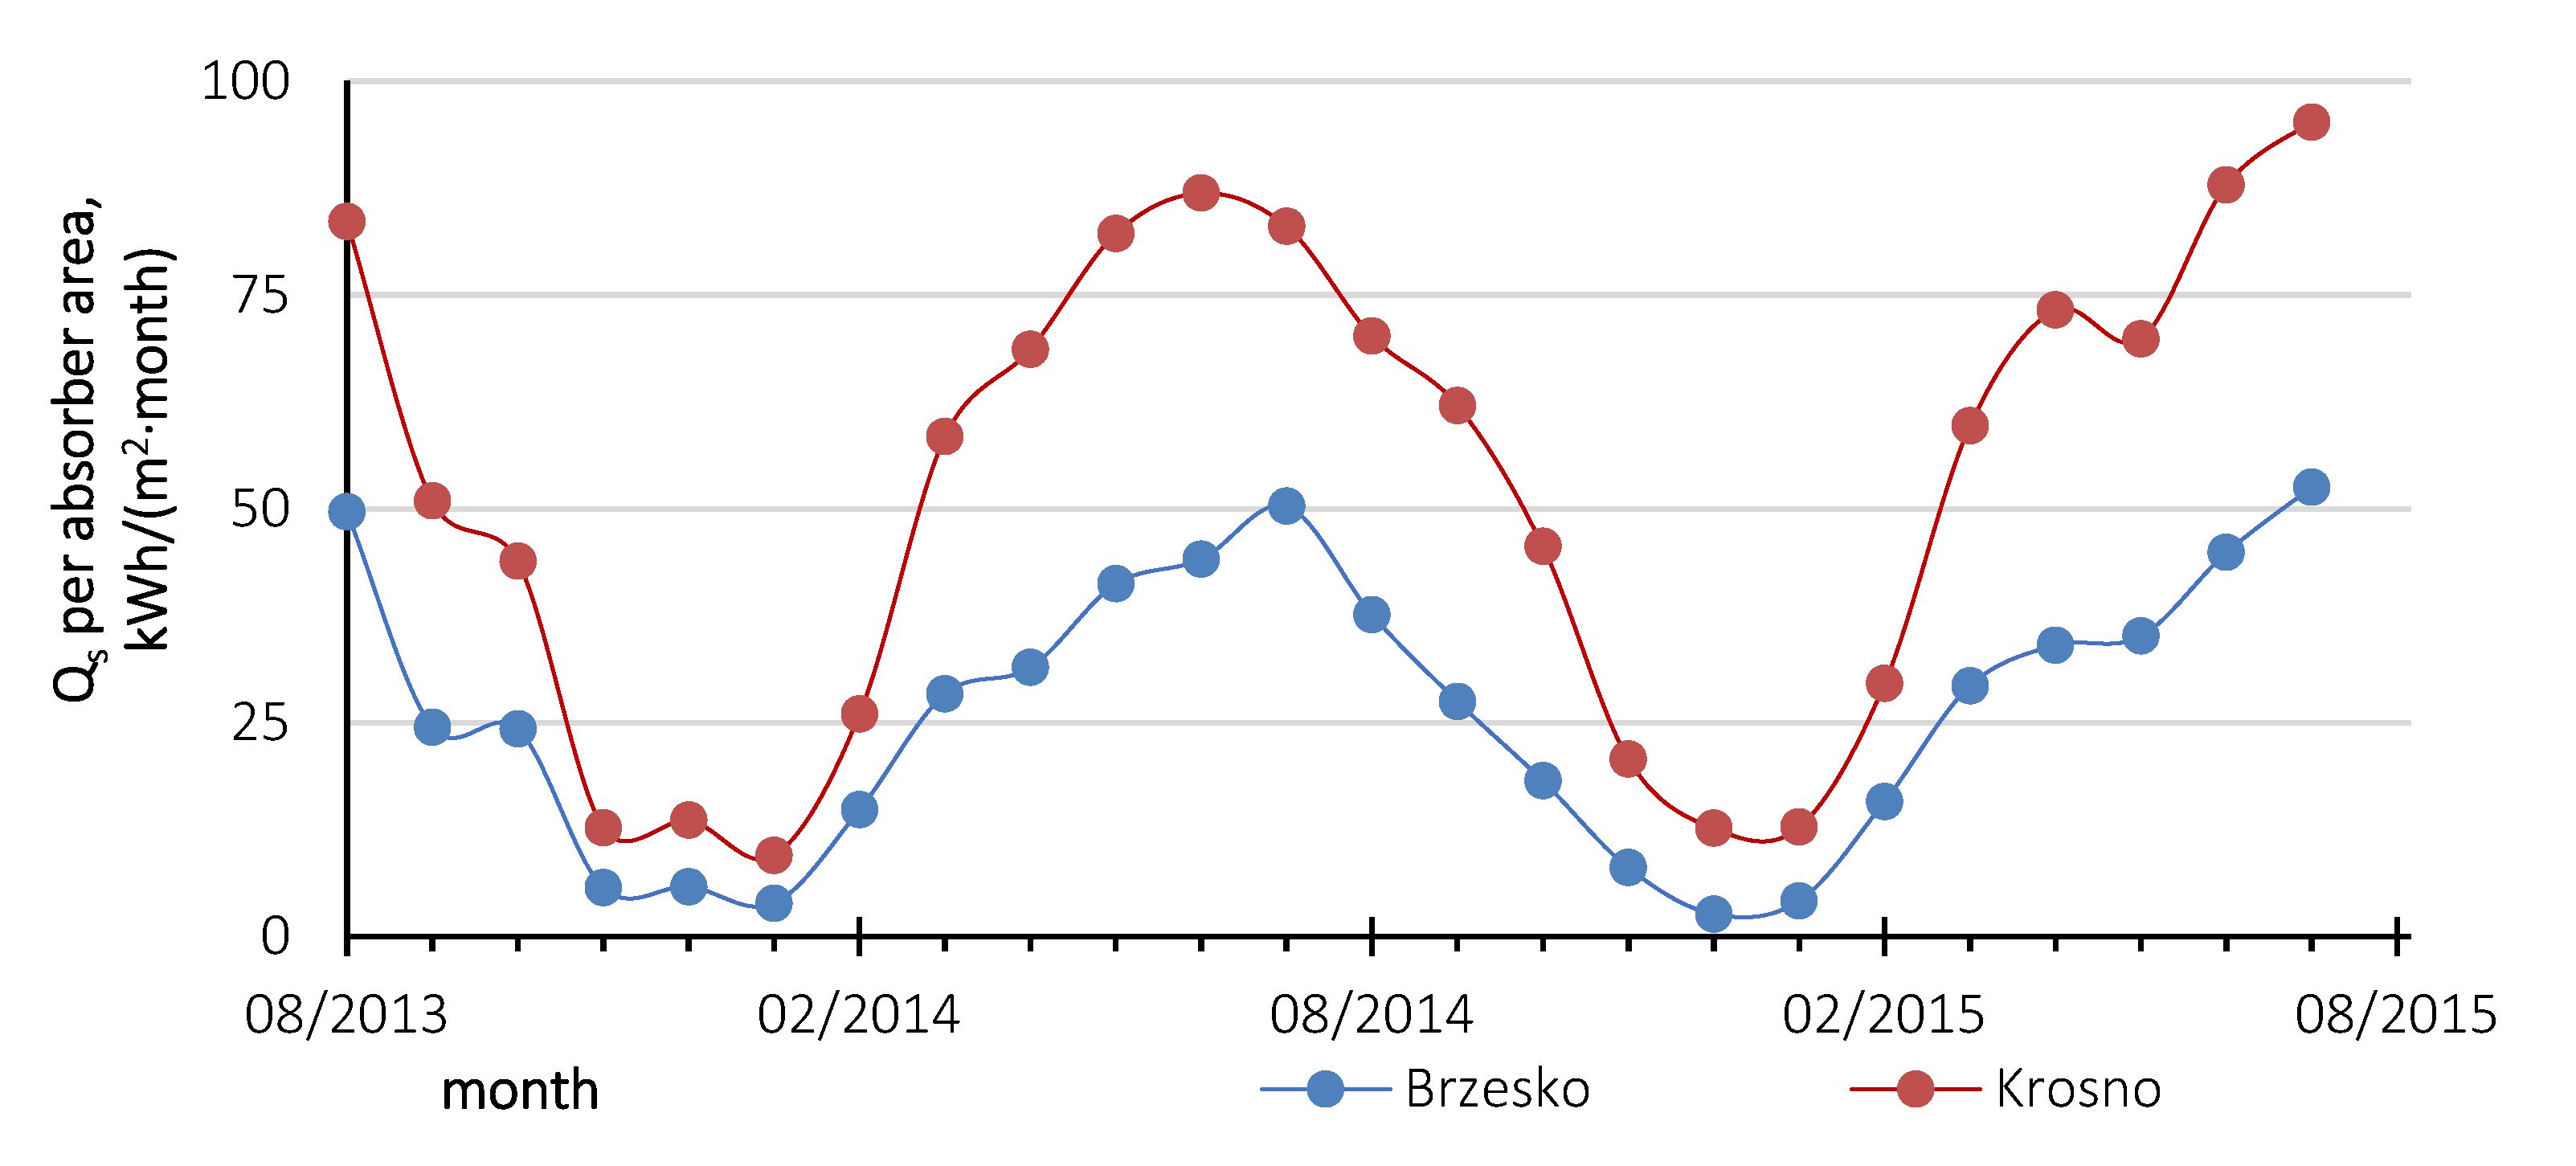
3.2. The Comparison of Results from Both Installations

The amount of gained energy referred to two different areas because of the different sizes of both installations. The comparison of solar energy gains was conducted in terms of the gross collector area (Figure 10) and the absorber area (Figure 11). The amount of heat energy received during the whole analyzed period in reference to the above-mentioned surfaces is presented in Table 3.
The superiority of the use of evacuated tube collectors in gaining heat was visible in every month of the analyzed period in the case of the absorber area. The best energy production performance of the ETCs over the FPCs was exhibited during the autumn and winter seasons. This aspect fits quite well with the lower value of the linear heat loss coefficient (a1) of evacuated tube collectors (1.771 W/(m2·K) per absorber area) with respect to the flat solar collector (2.741 W/(m2·K)). The lower thermal inertia of the evacuated tube collectors in comparison with the flat plate collectors is an additional advantage, allowing the users to benefit even from brief direct solar radiation.
Comparing the gained heat energy (Table 3) referring to the absorber surface, it can be observed that there was a great superiority in the use of evacuated tube collectors in comparison to the use of flat plate collectors (by 98.2%). However, when the solar energy gains values were referred to the gross collector area, this superiority was not so big; the energy received by the installation in the multi-family building was 7.9% higher than in Brzesko. The difference between the amount of heat calculated per square meter of absorber or gross area resulted from the method of area determination; in evacuated tube collectors, the space between the tubes was not taken into consideration during the analysis of the absorber surface.
The value of insolation measured in the horizontal plane in Brzesko (Łęki) from 1 June 2014 to 31 July 2015 was 1219 kWh/m2, and the effectiveness was calculated for this value (see Table 4).
In December 2014 and in January 2015, the ratio of the heat energy gained from the installation in Krosno to the energy in Brzesko was clearly higher than in the remaining analyzed months, even when the solar heat gains in the gross collector area (Figure 10) were taken into account. The observation showed that, during this period, the average outside temperature (Table 5) was higher than the typical reference year temperature. This is usually connected to a heavier overcast sky (in the winter), which was confirmed by the lower values of the measured radiation in comparison to the data coming from TRY corrected according to the measurement conditions in Łęki. Theoretically, heat losses between the working fluid and the environment would be lower if the outside temperature was higher than the average value from a typical reference year, but the results obtained did not confirm this. According to Roberto et al. [50], heat losses between the working fluid and the environment depend mainly on the working fluid temperature (a higher working fluid temperature corresponds to a lower system efficiency).
Additionally, from September 2014 to July 2015, inlet and outlet collector temperature was measured (results were published in another study [46]). The average collector fluid temperature (during circulation pump working hours) in collectors in Krosno was 38.7 °C, while that in Brzesko was higher by 2.4 K.

4. Conclusions

In Poland, solar thermal systems are mostly used for hot water preparation. The solar energy is mainly used in households, multi-family buildings, and public buildings. The medium insolation during a year in Poland is about 1000 kWh/(m2∙year), which allows various options to use this source of energy. Since solar thermal systems in Poland are usually based on using flat plate solar collectors or evacuated tube solar collectors, this analysis focused on these two types of installations. The paper analyzed data from two different installations based on the above-mentioned types of collectors. The hot water heating priority and the ratio of heat produced to heat demand resulted in the mean value of average fluid temperature (during circulation pump working hours) in collectors in Brzesko being higher than that in Krosno by 2.4 K.
The obtained efficiency of these installations per absorber area was 33.7% for Brzesko (for FPCs) and 67.3% for Krosno (for ETCs), including the measured horizontal insolation in the period from 1 June 2014 to 31 July 2015, which was also confirmed using ERA5-Land monthly averaged data.
For the analyzed period, higher heat solar gains in Krosno than in Brzesko (by 7.9%) were observed in the case of the gross collector area, with a difference of 98.3% based on absorber area.
During the process of designing the solar installation, the choice of collector type is one of the key decisions. Flat plate collectors and evacuated tube collectors are most commonly used. During the comparison of the two big solar installations, it was confirmed that the use of evacuated tube solar collectors shows a much better solar energy productivity than flat plate collectors for the absorber area. Bigger heat gains were also observed in the case of the gross collector area. The advantages of evacuated tube collectors are observed mainly during colder periods, which allows for a steadier thermal energy production.

Author Contributions

All authors contributed toward developing and implementing the ideas and concepts presented in the paper. All authors collaborated to obtain the results and were involved in preparing the manuscript. All authors have read and agreed to the published version of the manuscript.

Funding

This research received no external funding.

Conflicts of Interest

The authors declare no conflicts of interest.

Abbreviations

3VThree-way valve
a1Heat loss coefficient, W/(m2·K)
a2Non-linear heat loss coefficient, W/(m2·K2)
ccCorrection factor for density and specific heat
cwSpecific heat of water, kJ/(kg·K)
ETCsEvacuated tube collectors
FPCsFlat plate collectors
GSolar radiation density, W/m2
HEHeat exchanger
HWTHot water tank
QmMonthly solar heat gains (before correction), GJ/month
QsMonthly solar heat gains, GJ/month
SNSRSurface net solar radiation, kWh/(m2·month)
TaOutdoor temperature, °C
TH1Fluid temperature measured by heat meter: outlet of collectors, K
TH2Fluid temperature measured by heat meter: inlet to collectors, K
TRYTypical reference year
V ˙ Volumetric flow rate measured by heat meter, dm3/min
ρDensity of water, kg/dm3

References

  1. Pestana, D.G.; Rodrigues, S.; Morgado-Dias, F. Environmental and economic analysis of solar systems in Madeira, Portugal. Util. Policy 2018, 55, 31–40. [Google Scholar] [CrossRef]
  2. Kafka, J.L.; Miller, M.A. A climatology of solar irradiance and its controls across the United States: Implications for solar panel orientation. Renew. Energy 2019, 135, 897–907. [Google Scholar] [CrossRef]
  3. Zhao, J.; Ji, Y.; Yuan, Y.; Zhang, Z.; Lu, J. Energy-saving analysis of solar heating system with PCM storage tank. Energies 2018, 11, 237. [Google Scholar] [CrossRef] [Green Version]
  4. Dhar, A.; Naeth, M.A.; Jennings, P.D.; Gamal El-Din, M. Perspectives on environmental impacts and a land reclamation strategy for solar and wind energy systems. Sci. Total Environ. 2019, 134602. [Google Scholar] [CrossRef] [PubMed]
  5. Pillot, B.; Muselli, M.; Poggi, P.; Haurant, P.; Hared, I. Solar energy potential atlas for planning energy system off-grid electrification in the Republic of Djibouti. Energy Convers. Manag. 2013, 69, 131–147. [Google Scholar] [CrossRef] [Green Version]
  6. Chwieduk, D. Recommendation on modelling of solar energy incident. Renew. Energy 2009, 736–741. [Google Scholar] [CrossRef]
  7. Global Horizontal Irradiation. Available online: http://solargis.info/doc/_pics/freemaps/1000px/ghi/SolarGIS-Solar-map-Europe-en.png (accessed on 15 December 2019).
  8. Harrison, S.; Cruickshank, C.A. A review of strategies for the control of high temperature stagnation in solar collectors and systems. Energy Procedia 2012, 30, 793–804. [Google Scholar] [CrossRef] [Green Version]
  9. Košičan, J.; Pardo, M.Á.; Vilčeková, S. A multicriteria methodology to select the best installation of solar thermal power in a family house. Energies 2020, 13, 1047. [Google Scholar] [CrossRef] [Green Version]
  10. Abolhosseini, S.; Heshmati, A. The main support mechanisms to finance renewable energy development. Renew. Sustain. Energy Rev. 2014, 40, 876–885. [Google Scholar] [CrossRef] [Green Version]
  11. Timilsina, G.R.; Kurdgelashvili, L.; Narbel, P.A. Solar energy: Markets, economics and policies. Renew. Sustain. Energy Rev. 2012, 16, 876–885. [Google Scholar] [CrossRef]
  12. Dinica, V. Support systems for the diffusion of renewable energy technologies—An investor perspective. Energy Policy 2006, 34, 461–480. [Google Scholar] [CrossRef]
  13. Menanteau, P.; Finon, D.; Lamy, M.L. Prices versus quantities: Choosing policies for promoting the development of renewable energy. Energy Policy 2003, 31, 799–812. [Google Scholar] [CrossRef]
  14. Srinivasan, S. Subsidy policy and the enlargement of choice. Renew. Sustain. Energy Rev. 2009, 13, 2728–2733. [Google Scholar] [CrossRef]
  15. Hosenuzzaman, M.; Rahim, N.A.; Selvaraj, J.; Hasanuzzaman, M.; Malek, A.B.M.A.; Nahar, A. Global prospects, progress, policies, and environmental impact of solar photovoltaic power generation. Renew. Sustain. Energy Rev. 2015, 41, 284–297. [Google Scholar] [CrossRef]
  16. European Commission. A Clean Planet for All. A European Long-Term Strategic Vision for a Prosperous, Modern, Competitive and Climate Neutral Economy; Com (2018) 773; European Commision: Brussels, Belgium, 2018; Available online: https://ec.europa.eu/clima/sites/clima/files/docs/pages/com_2018_733_analysis_in_support_en_0.pdf (accessed on 10 February 2020).
  17. European Commission. European Semester: Assessment of Progress on Structural Reforms, Prevention and Correction of Macroeconomic Imbalances, and Results of In-Depth Reviews under Regulation (EU); No 1176/2011; European Commision: Brussels, Belgium, 2019; Available online: https://eur-lex.europa.eu/legal-content/EN/TXT/PDF/?uri=CELEX:52019DC0150&from=GA (accessed on 10 February 2020).
  18. Ma, J.; Zhao, Q.; Su, Y.; Ji, J.; He, W.; Hu, Z.; Fang, T.; Wang, H. The thermal behavior of a dual-function solar collector integrated with building: An experimental and numerical study on the air heating mode. Energies 2018, 11, 2402. [Google Scholar] [CrossRef] [Green Version]
  19. Kalogirou, S.A. Solar thermal collectors and applications. Prog. Energ. Combust. 2004, 30, 231–295. [Google Scholar] [CrossRef]
  20. Wang, W.; Tian, Z.; Ding, Y. Investigation on the influencing factors of energy consumption and thermal comfort for a passive solar house with water thermal storage wall. Energy Build. 2013, 64, 218–223. [Google Scholar] [CrossRef]
  21. Weiss, W.; Spörk-Dür, M. Global Market Development and Trends in 2018; IEA SHC: Gleisdorf, Austria, 2018. [Google Scholar]
  22. Rabah, K. Development of energy-efficient passive solar building design in Nicosia Cyprus. Renew. Energy 2005, 30, 937–956. [Google Scholar] [CrossRef]
  23. Numan, M.Y.; Almaziad, F.A.; Al-Khaja, W.A. Architectural and urban design potentials for residential building energy saving in the Gulf region. Appl. Energy 1999, 61, 401–410. [Google Scholar] [CrossRef]
  24. Aksoy, U.T.; Inalli, M. Impacts of some building passive design parameters on heating demand for a cold region. Build. Environ. 2006, 41, 1742–1754. [Google Scholar] [CrossRef]
  25. Karki, S.; Haapala, K.R.; Fronk, B.M. Technical and economic feasibility of solar flat-plate collector thermal energy systems for small and medium manufacturers. Appl. Energy 2019, 254, 113649. [Google Scholar] [CrossRef]
  26. Hassine, I.B.; Helmke, A.; Heß, S.; Krummenacher, P.; Muster, B.; Schmitt, B.; Schnitzer, H. Solar Process Heat for Production and Advanced Applications; Annex 49; IEA: Paris, France, 2014; Available online: http://task49.iea-shc.org/Data/Sites/7/150218_iea-task-49_d_b2_integration_guideline-final.pdf (accessed on 24 January 2020).
  27. Sokhansefat, T.; Kasaeian, A.; Rahmani, K.; Heidari, A.H.; Aghakhani, F.; Mahian, O. Thermoeconomic and environmental analysis of solar flat plate and evacuated tube collectors in cold climatic conditions. Renew. Energy 2018, 115, 501–508. [Google Scholar] [CrossRef]
  28. Milani, D.; Abbas, A. Multiscale modeling and performance analysis of evacuated tube collectors for solar water heaters using diffuse flat reflector. Renew. Energy 2016, 86, 360–374. [Google Scholar] [CrossRef]
  29. Colangelo, G.; Favale, E.; Miglietta, P.; De Risi, A. Innovation in flat solar thermal collectors: A review of the last ten years experimental results. Renew. Sustain. Energy Rev. 2016, 57, 1141–1159. [Google Scholar] [CrossRef]
  30. Baccoli, R.; Frattolillo, A.; Mastino, C.; Curreli, S.; Ghiani, E. A comprehensive optimization model for flat solar collector coupled with a flat booster bottom reflector based on an exact finite length simulation model. Energy Convers. Manag. 2018, 164, 482–507. [Google Scholar] [CrossRef]
  31. Baccoli, R.; Mastino, C.C.; Innamorati, R.; Serra, L.; Curreli, S.; Ghiani, E.; Ricciu, R.; Marini, M. A mathematical model of a solar collector augmented by a flat plate above reflector: Optimum inclination of collector and reflector. In Proceedings of the Energy Procedia. Energy Procedia 2015, 81, 205–214. [Google Scholar] [CrossRef] [Green Version]
  32. Diego-Ayala, U.; Carrillo, J.G. Evaluation of temperature and efficiency in relation to mass flow on a solar flat plate collector in Mexico. Renew. Energy 2016, 96, 756–764. [Google Scholar] [CrossRef]
  33. Figaj, R.; Szubel, M.; Przenzak, E.; Filipowicz, M. Feasibility of a small-scale hybrid dish/flat-plate solar collector system as a heat source for an absorption cooling unit. Appl. Therm. Eng. 2019, 163, 114399. [Google Scholar] [CrossRef]
  34. Amoabeng, K.O. Assessing the Feasibility of a Solar Water Heating System Based on Performance and Economic Analysis; Kwame Nkrumah University of Science and Technology: Kumasi, Ghana, 2012. [Google Scholar]
  35. Ayompe, L.M.; Duffy, A.; Mc Keever, M.; Conlon, M.; McCormack, S.J. Comparative field performance study of flat plate and heat pipe evacuated tube collectors (ETCs) for domestic water heating systems in a temperate climate. Energy 2011, 36, 3370–3378. [Google Scholar] [CrossRef] [Green Version]
  36. Perers, B. Comparison of Thermal Performance for Flat Plate and Evacuated Tubular Collectors. In Advances in Solar Energy Technology; Pergamon Press: Hamburg, Germany, 1988; pp. 615–619. [Google Scholar]
  37. Morrison, G.L.; Budihardjo, I.; Behnia, M. Water-in-glass evacuated tube solar water heaters. Sol. Energy 2004, 76, 135–140. [Google Scholar] [CrossRef]
  38. Kryzia, D.; Gawlik, L.; Pepłowska, M. Conditions for development of clean technologies of energy generation from fossil fuels. Energy Policy J. 2016, 19, 63–74. [Google Scholar]
  39. Pluta, Z. Evacuated tubular or classical flat plate solar collectors? J. Power Technol. 2011, 91, 158–164. [Google Scholar]
  40. Rovira, A.; Sánchez, C.; Valdés, M.; Abbas, R.; Barbero, R.; Montes, M.J.; Muñoz, M.; Muñoz-Antón, J.; Ortega, G.; Varela, F. Comparison of different technologies for integrated solar combined cycles: Analysis of concentrating technology and solar integration. Energies 2018, 11, 1064. [Google Scholar] [CrossRef] [Green Version]
  41. Sheng, H.; Li, C.; Wang, H.; Yan, Z.; Xiong, Y.; Cao, Z.; Kuang, Q. Parameters extraction of photovoltaic models using an improved moth-flame optimization. Energies 2019, 12, 3527. [Google Scholar] [CrossRef] [Green Version]
  42. Rogada, J.R.; Barcia, L.A.; Martinez, J.A.; Menendez, M.; De Cos Juez, F.J. Comparative modeling of a parabolic trough collectors solar power plant with MARS models. Energies 2018, 11, 37. [Google Scholar] [CrossRef] [Green Version]
  43. Wang, Y.; Boulic, M.; Phipps, R.; Plagmann, M.; Cunningham, C. Experimental Performance of a Solar Air Collector with a Perforated Back Plate in New Zealand. Energies 2020, 13, 1415. [Google Scholar] [CrossRef] [Green Version]
  44. Energosol Installation Project, Energosol Company. Available online: http://www.energosol.pl/oferta_kolektory_sloneczne_kolektory_prozniowe.html (accessed on 24 January 2020).
  45. Skorut Installation Project, Skorut Company. Available online: http://www.skorut-solar.pl/nasz-program/kolektory-soneczne/83 (accessed on 24 January 2020).
  46. Olczak, P.; Zabagło, J. The Efficiency of the Solar System with Heat Pipe Collectors in Apartment Building. Dist. Heat. Heat. Vent. 2015, 11, 427. [Google Scholar]
  47. European Centre for Medium-Range Weather Forecasts (ECMWF) ERA5. Available online: https://cds.climate.copernicus.eu/cdsapp#!/dataset/reanalysis-era5-land-monthly-means?tab=form (accessed on 24 March 2020).
  48. Copernicus Climate Change Service (C3S). ERA5: Fifth Generation of ECMWF Atmospheric Reanalyses of the Global Climate. Copernicus Climate Change Service Climate Data Store (CDS). Available online: https://climate.copernicus.eu/climate-data-store (accessed on 24 March 2020).
  49. Ogimet Synop Based Summary by States form 2019. Available online: http://ogimet.com/resynops.phtml.en (accessed on 24 January 2020).
  50. Roberto, B.; Ubaldo, C.; Stefano, M.; Roberto, I.; Elisa, S.; Paolo, M. Graybox and adaptative dynamic neural network identification models to infer the steady state efficiency of solar thermal collectors starting from the transient condition. Sol. Energy 2010, 84, 1027–1046. [Google Scholar] [CrossRef]
  51. Ministry of Development Typical Reference Year. Available online: https://www.gov.pl/web/fundusze-regiony/dane-do-obliczen-energetycznych-budynkow (accessed on 18 December 2019).
Figure 1. The flat plate collector (FPC) installation in Brzesko.
Energies 13 01829 g001
Figure 2. General scheme of the installation in Brzesko (HM—heat meter (TH1 and TH2 temperature and volumetric flow meter included); 3V-1—three-way valve switching storage tank charging; 3V-2 and 3V-3—three-way valve; HWT-1, HWT-2—solar hot water tank; HE1—heat exchanger for sport swimming pool; HE2—heat exchanger for recreational swimming pool).
Energies 13 01829 g002
Figure 3. The ETC installation in Krosno.
Energies 13 01829 g003
Figure 4. The scheme of the solar installation in Krosno (HM—heat meter (TH1 and TH2 temperature and volumetric flow meter included); 3V-1—three-way valve switching storage tank charging; 3V-2—three-way bypass valve; HWT-1, HWT-2—solar hot water tank).
Energies 13 01829 g004
Figure 5. Monthly values of solar heat gains (Qs) obtained from the installation in Brzesko from August 2013 to December 2015.
Energies 13 01829 g005
Figure 6. Monthly values of solar heat gains (Qs) obtained from the installation in Krosno from November 2011 to July 2015.
Energies 13 01829 g006
Figure 7. The comparison of monthly surface net solar radiation (SNSR) between Brzesko and Krosno and data from solar radiation measurements (insolation) in Łęki. Source: own study based on References [47,48].
Energies 13 01829 g007
Figure 8. The comparison of hourly outdoor temperature (Ta) taken from Tarnów and Krosno weather stations. Source: own study based on Reference [49].
Energies 13 01829 g008
Figure 9. The comparison of the monthly average outdoor 2-m temperature (at 12:00 p.m.) for Brzesko and Krosno (from 1 August 2013 to 31 July 2015). Source: own study based on References [47,48].
Energies 13 01829 g009
Figure 10. The comparison of solar heat gains per month (Qs) coming from the installations in Brzesko and Krosno, calculated in reference to the gross collector area.
Energies 13 01829 g010
Figure 11. The comparison of solar heat gains per month (Qs) coming from the installations in Brzesko (FPCs) and Krosno (ETCs), calculated in reference to the absorber area.
Energies 13 01829 g011
Table 1. Basic parameters of the FPC in the installation in Brzesko and the evacuated tube collector (ETC) in the installation in Krosno. Source: own study based on References [27,44,45,46].
ParameterUnitBrzesko (FPC)Krosno (ETC)
Gross collector aream22.312.42
Absorber aream22.131.21
Structure (type of collector) meanderwith heat pipe
Intercept efficiency (for absorber area)%81.785
Heat loss coefficient (a1)W/(m2·K)2.7411.771
Non-linear heat loss coefficient (a2)W/(m2·K2)0.01470.192
Table 2. Characteristics of solar installations. Source: own study based on References [44,45].
ParameterUnitBrzesko (FPCs)Krosno (ETCs)
Total gross collector area 277.277.44
Total absorber aream2255.638.72
Heat meter Echo CF 51CF Echo II
Heat meter producer ItronItron
Inlet flow rate per absorber areakg/(h·m2)2339
Collector slopeDegrees4545
Table 3. Solar heat gain values coming from installations in Brzesko (FPCs) and Krosno (ETCs) obtained in the whole analyzed period (from 1 August 2013 to 31 July 2015) in reference to various area types.
Reference AreaUnitBrzesko (FPCs)Krosno (ETCs)
AbsorberkWh/m2685.01357.7
GrosskWh/m2628.9678.3
Table 4. Effectiveness calculated for insolation in the horizontal plane (Łęki) and solar heat gain values coming from installations in Brzesko and Krosno obtained in the period from 1 June 2014 to 31 July 2015.
Reference AreaUnitBrzesko
(FPCs)
Krosno
(ETCs)
Effectiveness
Brzesko
Effectiveness
Krosno
AbsorberkWh/m2411.4820.333.7%67.3%
GrosskWh/m2377.8410.331.0%33.6%
Table 5. Monthly insolation (Tarnów, Łęki) and the monthly average outdoor temperature (Tarnów) in December 2014 and January 2015. Source: own study based on References [47,48,49,51]. TRY—typical reference year.
ParameterUnitDecember 2014January 2015
The actual monthly average outdoor temperature (Ta) in Tarnów°C1.61.7
The monthly average outdoor temperature from TRY in Tarnów°C−0.3−0.8
Actual insolation in Łęki (Brzesko)kWh/(m2·month)12.014.4
Corrected insolation from TRY in TarnówkWh/(m2·month)18.624.2
Surface net solar radiation (Brzesko)kWh/(m2·month)18.218

