Article

Assessment of Thermal Comfort in the Intelligent Buildings in View of Providing High Quality Indoor Environment

1
District Court, Warszawska 1, 26-610 Radom, Poland
2
Faculty of Environmental, Geomatic and Energy Engineering Kielce University of Technology, 25-314 Kielce, Poland
3
Faculty of Civil Engineering and Architecture, Kielce University of Technology, 25-314 Kielce, Poland
4
Mechatronics and Mechanical Engineering, Kielce University of Technology, 25-314 Kielce, Poland
5
Faculty of Mechanical Engineering, Cracow University of Technology, 31-864 Cracow, Poland
6
Institute of Materials Engineering, Czestochowa University of Technology, 42-200 Częstochowa, Poland
*
Author to whom correspondence should be addressed.
Submission received: 31 March 2020 / Revised: 14 April 2020 / Accepted: 15 April 2020 / Published: 16 April 2020
(This article belongs to the Special Issue Energy Performance in Buildings and Quality of Life)

Abstract

:
The paper analyses the indoor environment in two modern intelligent buildings located in Poland. Measurements of air and globe temperatures, relative humidity and carbon dioxide concentration in 117 rooms carried out in the space of 1.5 years were presented. Thermal comfort of the occupants has been investigated using a questionnaire survey. Based on 1369 questionnaires, thermal sensation, acceptability and preference votes were analysed in view of their interdependency as well as their dependency on operative temperature, which proved to be very strong. It has been found that the respondents did not completely rate thermal comfort and indoor environment quality as very high, although the overwhelming sensations were positive. Apart from the operation of heating, ventilation and air conditioning (HVAC) systems, this might have also been the cause of individual human factors, such as body mass index, as tested in the study, or the finding that people were generally in favour of a warmer environment. Moreover, thermal environment proved to be the most important element for ensuring the well-being of the occupants.

1. Introduction

Energy consumption throughout the world constantly rises. Much of it is related to the use in the building sector, especially for the development and daily operation of sophisticated modern buildings such as large-scale intelligent buildings for office and public use. Those types of buildings are equipped with services and installations such as heating, ventilation and air conditioning (HVAC) systems, whose energy consumption might be significant. In commercial facilities the main electrical loads are typically related to HVAC systems and lighting [1], in office buildings heating, ventilation and air conditioning systems may account for over 60% of energy consumption [2], while data from three years of final energy consumption in a modern educational building in France indicate over 80% energy use for heating and ventilation [3]. Thus, even a small reduction in indoor air temperature during the heating season and a small increase in indoor temperature during the summer (reducing the required cooling load) might result in both economic and environmental benefits due to reduced operational costs and lower emission of carbon dioxide if energy is generated from fossil fuels. The only question is to which extend the temperatures could be reduced/increased, so that the residents would still experience thermal comfort conditions.
Modern buildings have been considered and designed with the view to provide their occupants with comfort conditions—both in terms of indoor air quality and thermal comfort. However, these requirements might not be satisfied and people complain about the indoor air condition despite the high investment and operational costs of the buildings. Moreover, the long-term policy and development strategy of the European Union states that buildings in member states should be characterised, among other things, by reduced energy consumption and improved indoor air quality [4]. In view of these reasons, much more effort needs to be made to target the problems currently prevalent in the area of civil engineering such as sick building syndrome and, in particular, provide more knowledge on thermal comfort and indoor air quality in modern buildings.
Thermal comfort can be defined as the feeling of neither cold nor warm. It is affected by a number of parameters such as indoor air and radiant temperatures, relative humidity, air movement as well clothing thermal resistance and metabolism rate. They are incorporated in the Fanger model, which predicts collective occupants’ satisfaction taking into account six environmental and physiological parameters [5]. The author proposed the Predicted Mean Vote (PMV) and Percentage of People Dissatisfied (PPD) indices, which are now part of the commonly used building standards: EN-ISO 7730 [6] and ASHRAE-55 [
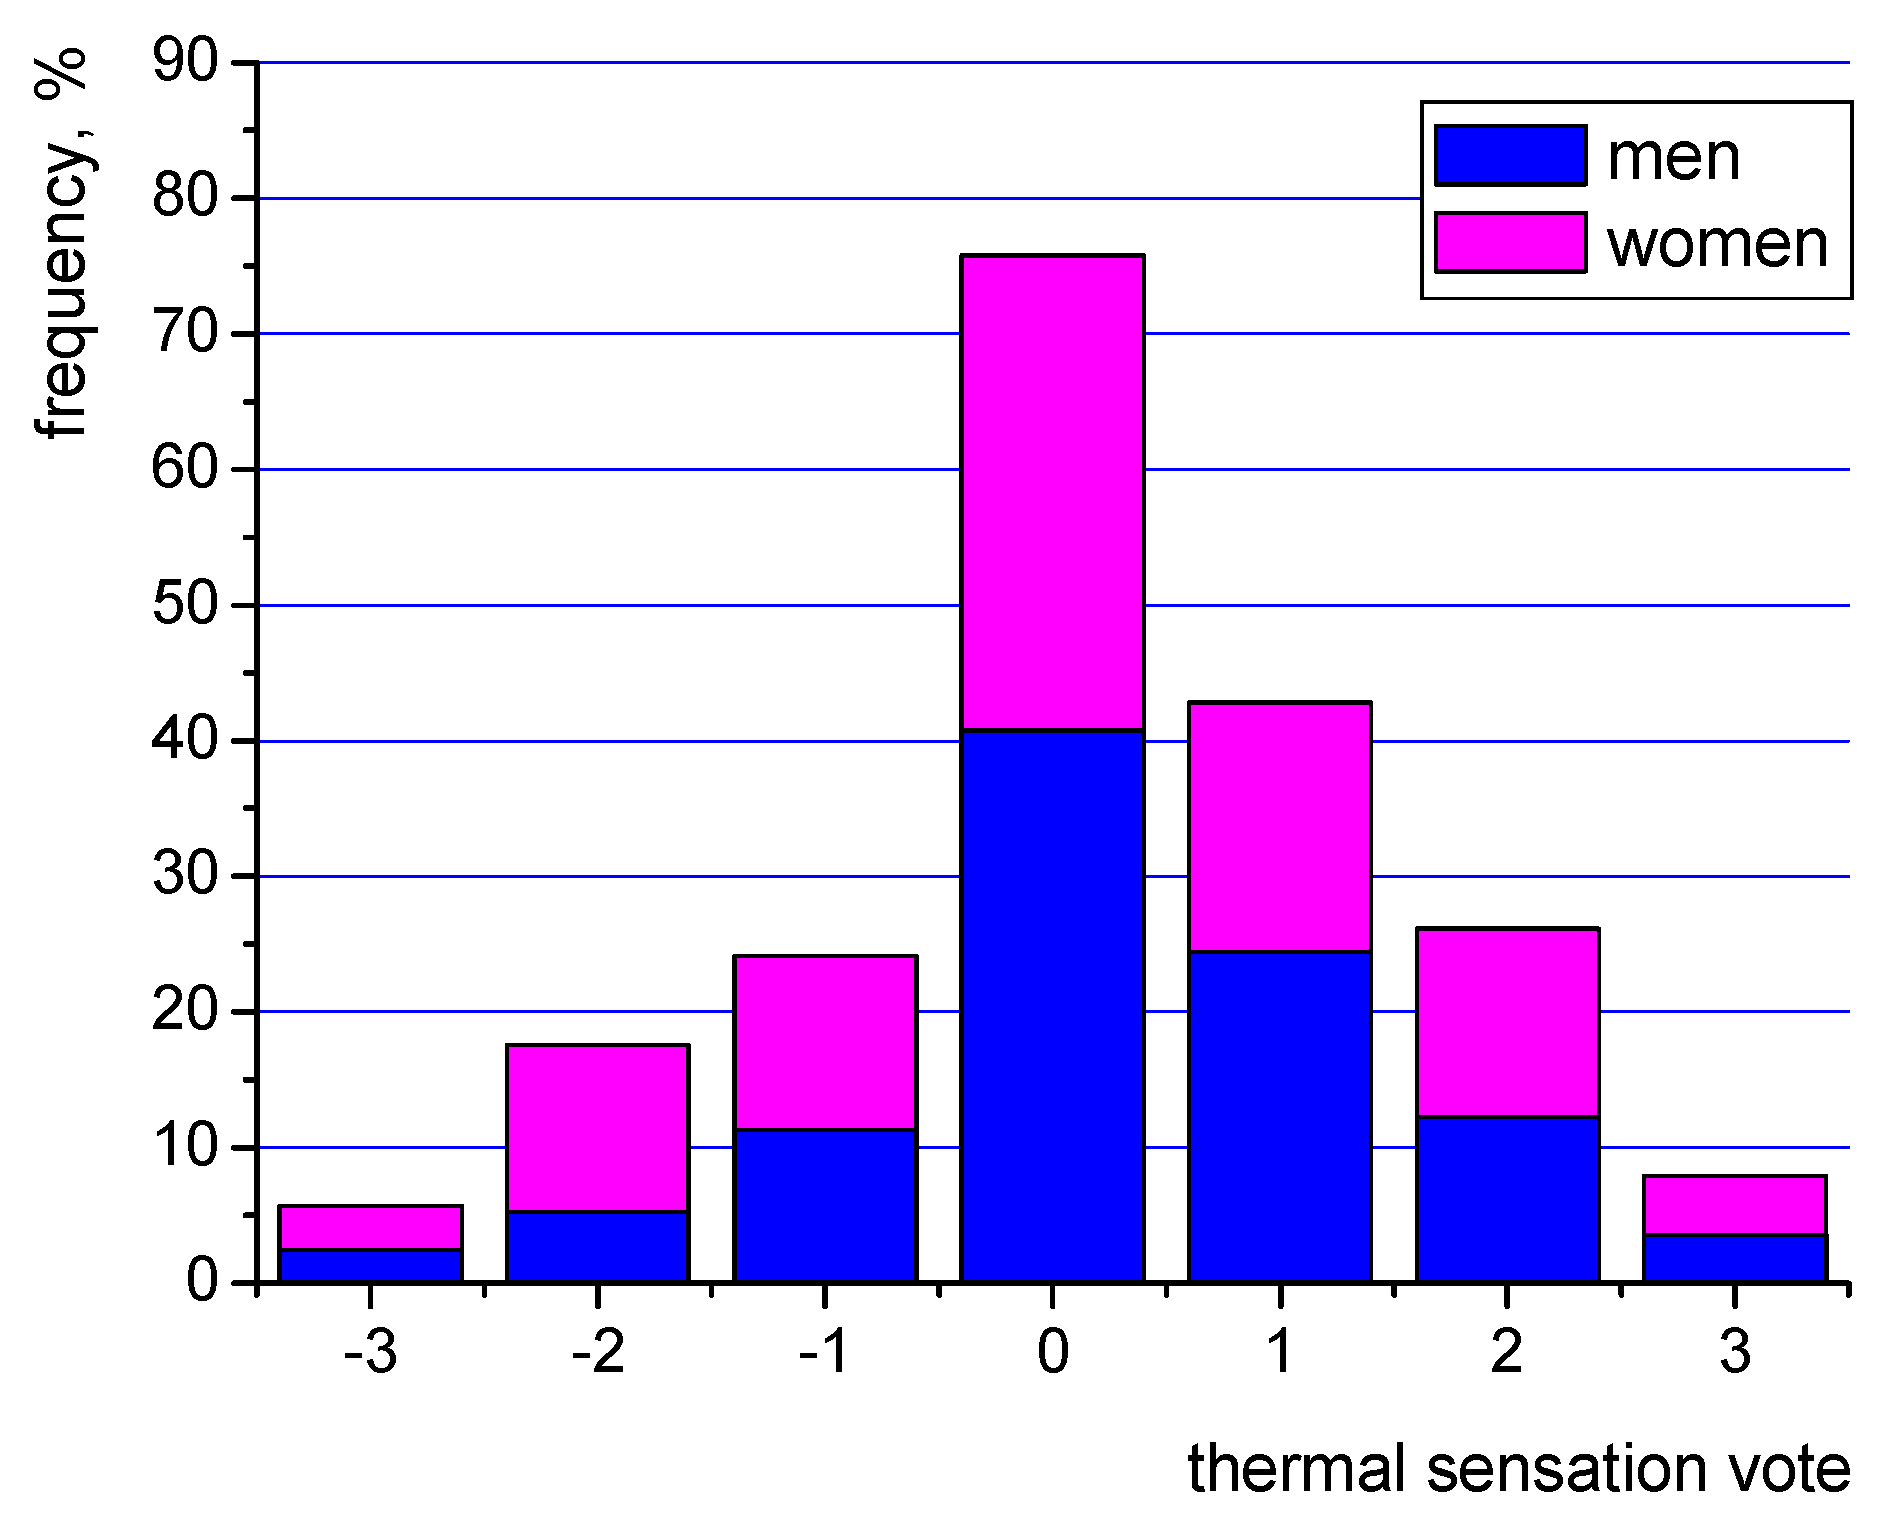
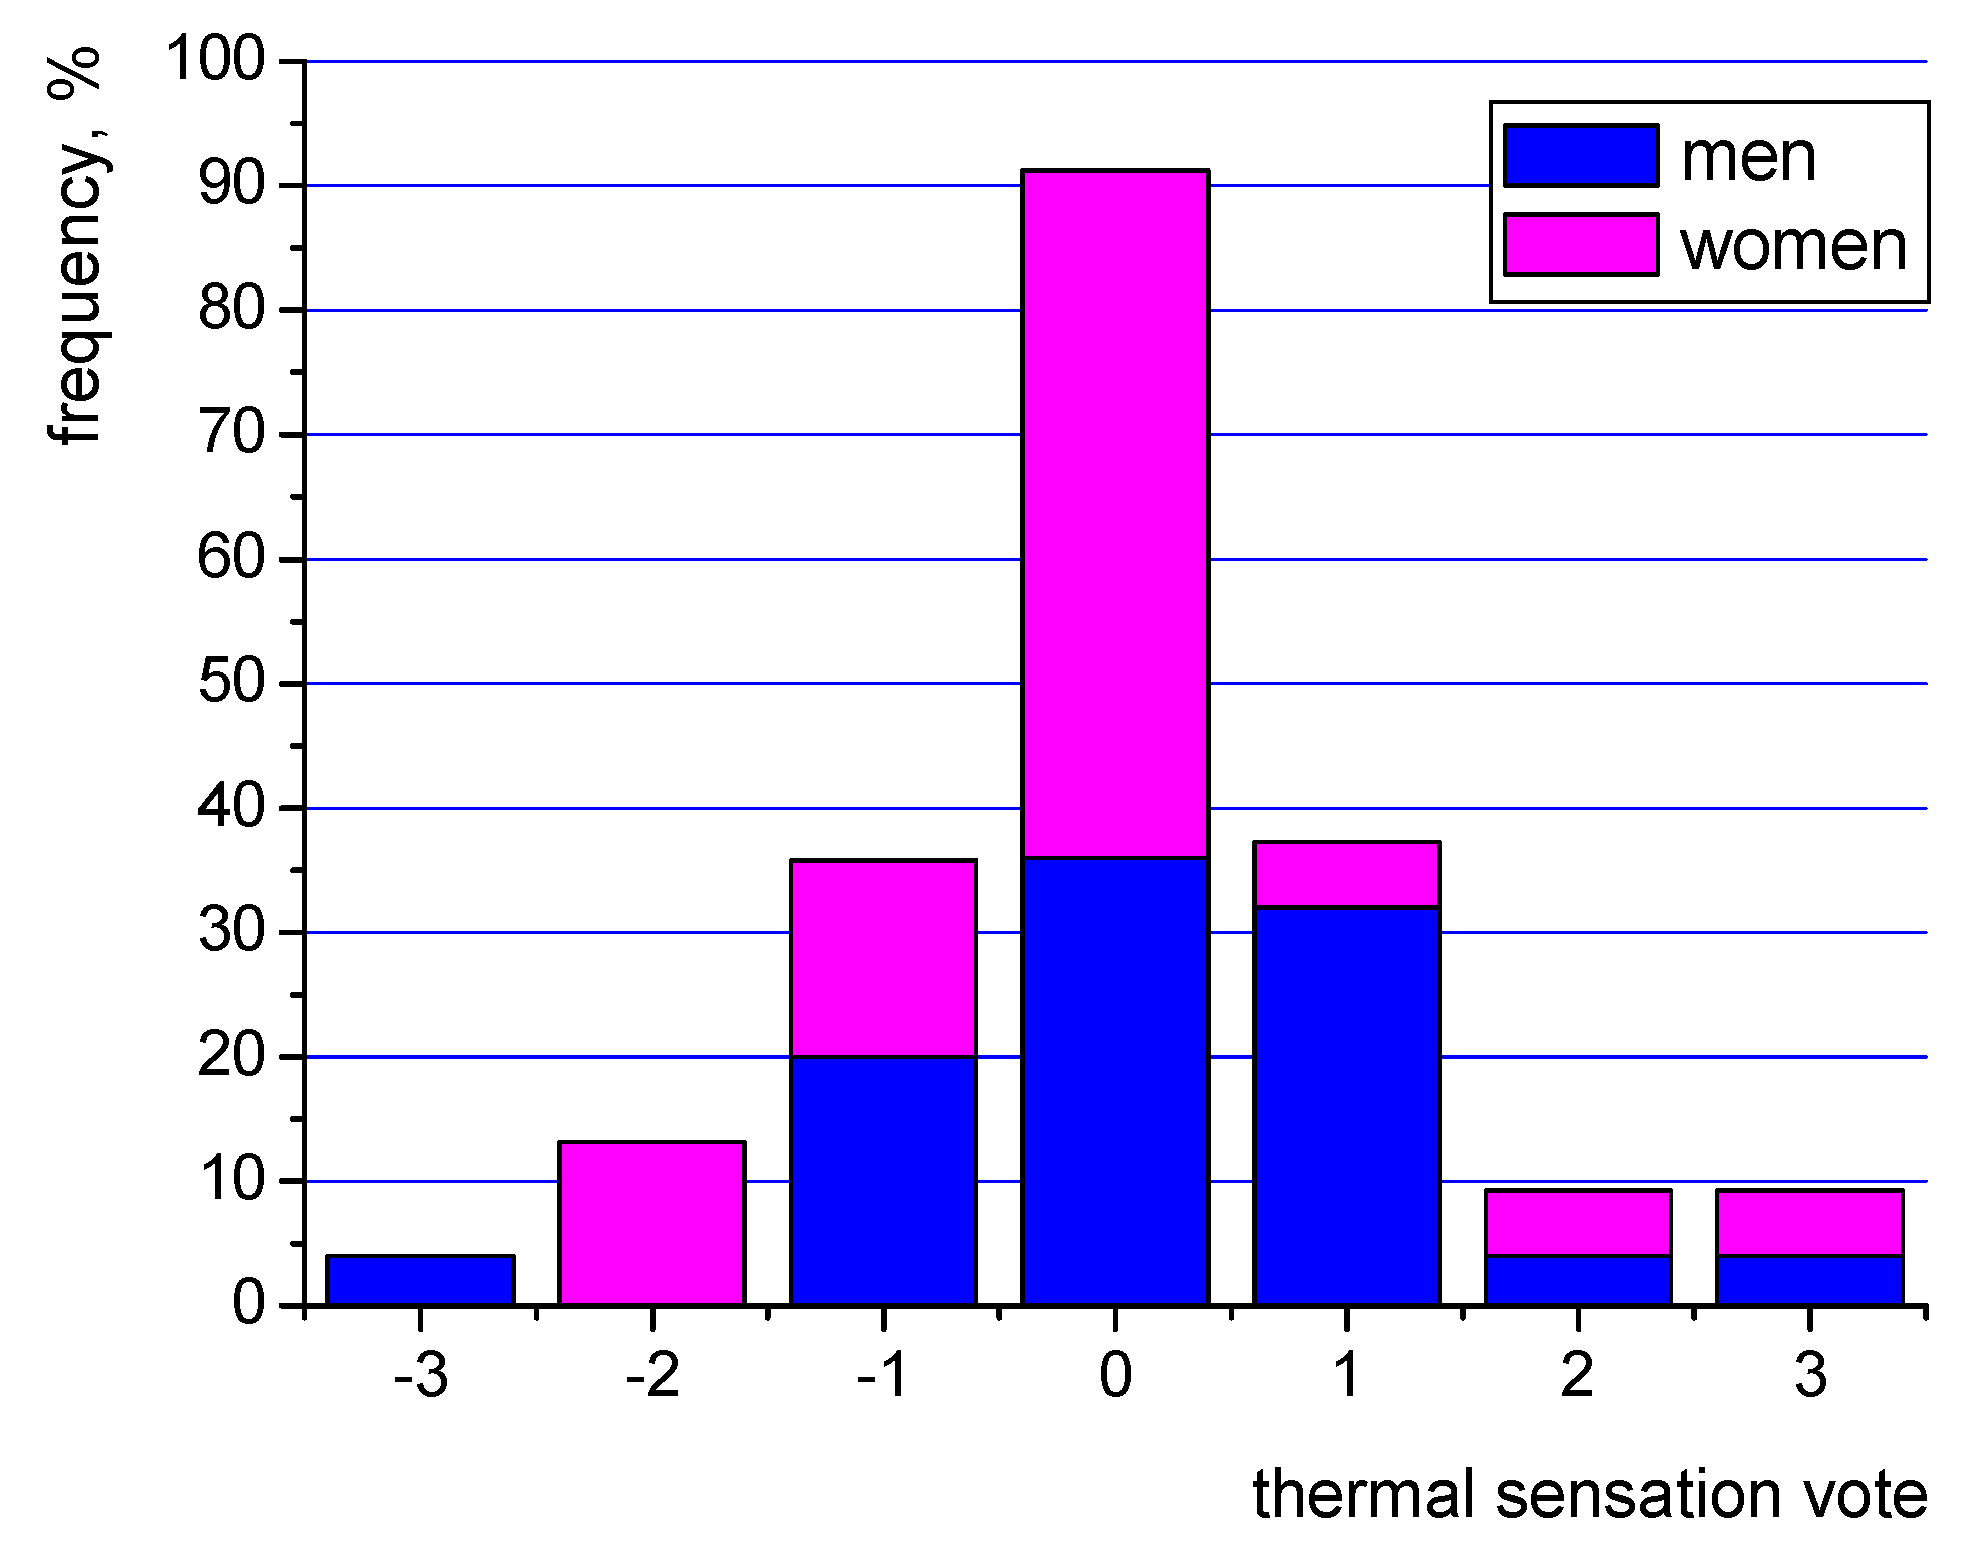
7]. The PMV is a seven-point scale ranging from cold (−3) to hot (+3) and describes the thermal sensation of a large number of people in the room. The generally preferred value is 0 (neutral thermal environment) with deviations into the positive and negative area, whose acceptable level depends on the building category and is given in the standard [8].
Thermal comfort has recently attracted a lot of scientific interest, as evidenced by a growing number of experimental papers and reviews [9,10]. This phenomenon is tested in all types of buildings such as residential [11], public utility buildings [12,13] or even means of transport [14]. In terms of public utility buildings, where people tend to spend more and more time and are less able to control the indoor environment than at their homes, educational facilities and various kinds of offices should be of particular interest both in terms of ensuring optimal thermal sensation and reducing heating/cooling costs of HVAC systems (for example a rise in indoor temperature set-point of ca. 1–2 °C in the summer can save ca. 6–10% of the electric energy for air conditioning [15]). Moreover, much attention has recently been paid to combining the issue of providing thermal comfort conditions to room users and the energy performance of buildings [16,17,18].
Almeida et al. [19] performed 32 measurements in ten spaces in six educational buildings in Portugal and obtained 490 questionnaires. PMV index was determined for each room. Air and mean radiant temperatures as well as air velocity and relative humidity were recorded using a measuring device. The questionnaire covered questions regarding thermal perception, thermal evaluation, thermal preference and thermal tolerance. High acceptability of the indoor conditions was observed. Over half of the respondents intended to keep the thermal environment unchanged. The relationship between PMV and mean thermal sensation vs. operative temperature turned out to have a moderate correlation. Krawczyk et al. [20] presented research results of temperature and relative humidity measurements in Polish and Spanish universities as well as surveys on the comfort perception. It was found that the optimal indoor air temperature differs depending on location (for students in Poland range from 21.7 to 22.3 °C, while in Spain from 23.3 to 24.8 °C). However, both indoor air temperature and humidity in both buildings are within the recommended range. Most Spanish students felt that is was cold or too cold for them, despite the fact that the temperature was within the recommended range and ca. 2 °C higher than in Poland (which was explained by adaptive models for the comfort temperature (higher values for Spain than for Poland for this month). The respondents proved to have good acceptability of dry conditions. Vilcekova et al. [21] carried out tests of indoor air quality and thermal comfort in five classrooms located in a school in Slovakia. The following parameters were measured: temperature, relative humidity, solid particles, CO2 concentration, sound level as well as lighting conditions. The number of people tested was 34 students of 6–15 years old and five teachers. Thermal sensations were overwhelmingly acceptable and perceived as good. A concern was the relatively high CO2 level (in the range from 577 to 1787 ppm) despite the fact that windows were open. The concentration of carbon dioxide fluctuated during the school hours. Fang et al. [22] analysed thermal comfort in air-conditioned classrooms located in Hong Kong. The research programme consisted of measurements of environmental parameters as well as thermal responses from 982 students. The authors found out that there was an insignificant difference between the temperature preferred by the respondents and the neutral temperature. Besides, there was a strong linear relation between the mean thermal sensation vote and the operative temperature. Buratti and Ricciardi [23] used direct measurements of the indoor microclimate parameters and the questionnaires during autumn, winter and spring in classrooms at the University of Perugia, Terni and Pavia in Italy. The internal air temperatures ranged from 20.9 to 26.4 °C, mean radiant temperatures from 20.1 to 25.1 °C, while relative humidity from 25% to 63.7%. Air movement was low, with maximal air velocity of 0.085 m/s. Thermal sensations experienced by the respondents in the considered classrooms proved to be very satisfactory (mostly falling within the acceptable range of −0.5–0.5, except for two surveys that produced the results of thermal sensation vote of 0.6 and 0.78). A later work by these authors [24] provided more diversified results. It also focused on other parameters affecting the human well-being, namely: acoustic and lightning conditions. The tests were conducted in classrooms at the University of Pavia in Italy. The tests covered measurements of physical parameters (indoor and external air temperature and relative humidity, mean radiant temperature and air velocity) and questionnaires for respondents’ responses (whose total number was 331). It was observed that the average values of PMV and PPD for women and men can differ from each other (maximally by 0.45% and 11.57%, respectively). Generally, thermal comfort could be considered as very good for three classrooms (mean thermal sensation vote ranged from 0.08 to 0.36) and unsatisfactory for two (where mean sensation vote reached 1.15 and −1.10). Aghniaey et al. [25] provided data on thermal comfort at the University of Georgia’a campus in US. The results were obtained in 11 classrooms where the number of students ranged from 18 to 54 persons. The operative temperature was between 21 and 27 °C. The study showed that the thermal environment in the analysed classrooms was overwhelmingly acceptable. The average thermal preference vote was “no change” if the indoor operative temperature was ca. 23.5 °C (thus, this temperature value can be considered optimal at the considered location). For this temperature the actual mean vote was almost neutral. Women typically preferred warmer thermal environments and on average female thermal sensation votes were lower than those for men.
It needs to be noted that the optimal human thermal conditions are subjective and depend on the climate. Experimental results on thermal comfort tests conducted in the summer season in India [26] reveal that the mean comfort temperature (determined by Griffiths’ method) was 29.8 °C. In this paper thermal comfort of 900 students (mostly males) in naturally ventilated classrooms during the summer in India was analysed. The study covered thermal sensations, preferences and acceptability as well as measurements of environmental parameters. The mean indoor air temperature was 30.4 °C (from the range of ca. 26.6 to ca. 36 °C), while mean relative humidity was 39.4% and clothing thermal resistance ranged from ca. 0.41% to ca. 59% of votes which indicated the neutral thermal sensation and 69% chose “no change” as their thermal preference. About 81% of the responses were in the comfort band. Thus, the research shows that the overwhelming majority was satisfied with the conditions that might be considered unsatisfactory for the European respondents.
One of the relatively few works on thermal comfort in intelligent educational buildings has been presented by Merabtine et al. [3]. The authors investigated indoor air quality and thermal comfort in a low energy consumption building in France. The authors tested 41 students between the ages of 17 and 22 years using questionnaires in the foyer of the building. The indoor air parameters were measured. The obtained results indicate a dissatisfaction with the thermal conditions in the considered space (beyond the 10% acceptance level of PPD). Thermal sensation votes were also outside of the acceptable range and fell below −1. When the occupancy in the building was high the CO2 levels exceeded the limit of 820 ppm, but it was rare (1–5% of occupancy hours). In the tested three teacher rooms, the indoor air temperature ranged from ca. 20.3 to 24.7 °C, while CO2 concentration from ca. over 300 up to over 1300 ppm. Based on these data, it can be concluded that even such modern buildings might not offer comfortable conditions to their users. Carbon dioxide concentration proved to exceed the upper limit at times, while thermal sensation votes of the respondents indicated the feeling of dissatisfaction.
Apart from schools and university campuses, office buildings are also locations where people spend a great deal of time, either as employees or clients. Thus, the energy performance and thermal comfort of the occupants are a crucial issue.
Moujalled et al. [2] conducted thermal comfort measurement in five naturally ventilated office buildings in the south of France. The indoor air temperatures ranged from 21.1 to 32.9 °C. In total 120 people took part in the survey, generating 374 data sets. It was concluded that during the warm season over half of the respondents were dissatisfied with the indoor microclimate. During the cold season over 90% were comfortable. The thermal sensation votes proved to be well correlated with the operative temperature. The room users turned out to be less sensitive to an increase in temperature during the warm season.
Hens [27] performed questionnaire and direct measurement surveys in two air-conditioned office buildings in Belgium. It was reported that the number of the dissatisfied at the mean vote of 0 was greater than 5% (as given in the standard based on the Fanger model). A relatively high number of health complaints was reported by the occupants, who suffered from headache (ca. 44% of respondents), dry throat or blocked nose (over 30%). This might influence the subjective thermal sensation votes expressed by the people.
Kuchen and Fisch [28] conducted tests in 148 work spaces in 25 office buildings at different locations in Germany. The total number of measurements was 345 and all took place during winter (not older than ten years). The most preferred operative temperature value was within the range of 21–22 °C (here, the average thermal sensation vote was 0.08 and 0.12, respectively). The authors observed a relatively good linear relation between the operative temperature and neutral temperature.
Ricciardi and Buratti [29] experimentally analysed thermal comfort in nine open space offices in Italy. Indoor environmental parameters were measured and 588 questionnaires were statistically considered. Indoor air temperature ranged from 22.1 to 26.2 °C. Thermal sensation proved to be generally fine with PMV values ranging from −1.38 to +2.00 and a high mean thermal dissatisfaction of 60% was observed. The correlation between operative temperature vs. PMV was considered good and between neutral and operative temperatures relatively good.
Indraganti et al. [30] conducted tests in four office buildings in Japan during the summer. Four environmental as well as two personal variables were measured together with CO2 concentration, while 435 occupants were surveyed (which produced 2402 questionnaires). The mean indoor air temperature was 28.2 °C, while mean CO2 concentration 1055 ppm. The comfort temperature turned out to be 27.1 °C. The majority of people voted in the comfort band of −1 to +1, thus thermal acceptability from the questionnaires proved to be high. The authors observed that the mean sensation vote in buildings with natural ventilation was always higher than in air conditioned buildings. This finding was partly confirmed in another paper by the same authors [31], who performed tests in 25 office buildings in India. However, in this case—having analysed 2612 questionnaires from 1658 volunteers—they found that thermal acceptability was generally low (62.5%), especially in buildings with natural ventilation.
The results of the experimental work of Jazizadeh et al. [32] on thermal comfort in office buildings reveal that ambient temperature is the most important parameter in terms of the thermal sensation of users. However, other factors (not often investigated) such as carbon dioxide concentration and light intensity also play a role—in some rooms their impact in smaller and in some larger in comparison to humidity. Szabo and Kajtar [33] investigated the influence on the type HVAC system on thermal comfort in three office buildings. The best results were obtained for the ducted fan-coil with suspended ceiling installation. The indoor air quality measured with the CO2 concentration proved to be high in all the buildings. Fedorczak-Cisak et al. [34] considered the impact of external shading equipment in office rooms with large glazed areas on indoor thermal comfort. It was observed that the application of external Venetian blinds reduced the ambient air temperatures and the number of discomfort hours by 92%. However, the tests did not cover the actual thermal sensation measurements based on human responses—only calculated results of PMV and PPD were provided according to the standard.
Due to the fact that heating, ventilation and air conditioning systems in buildings consume much thermal and electrical energy, any reduction in heating during the cold season (linked with decreased indoor temperatures) and in cooling requirements in summer (leading to elevated indoor temperatures) may provide significant economic and environmental savings. However, such adjustments should not have an unfavourable impact on the thermal comfort of the occupants. Thus, more information is needed as to the acceptable levels of indoor microclimate parameters. Moreover, the indoor environment might have an impact on work productivity [35] and learning performance [36,37]. Thus, the issue of ensuring thermal comfort conditions needs to be considered already at an early design stage of public utility buildings.
The paper analyses thermal comfort and general sensation experienced by people in two intelligent buildings located in Poland, seventy kilometers apart from each other. Based on the literature review, it needs to be noted that such a comprehensive study focused on the eastern European region, as presented in this paper, has not been found in literature.

2. Materials and Methods

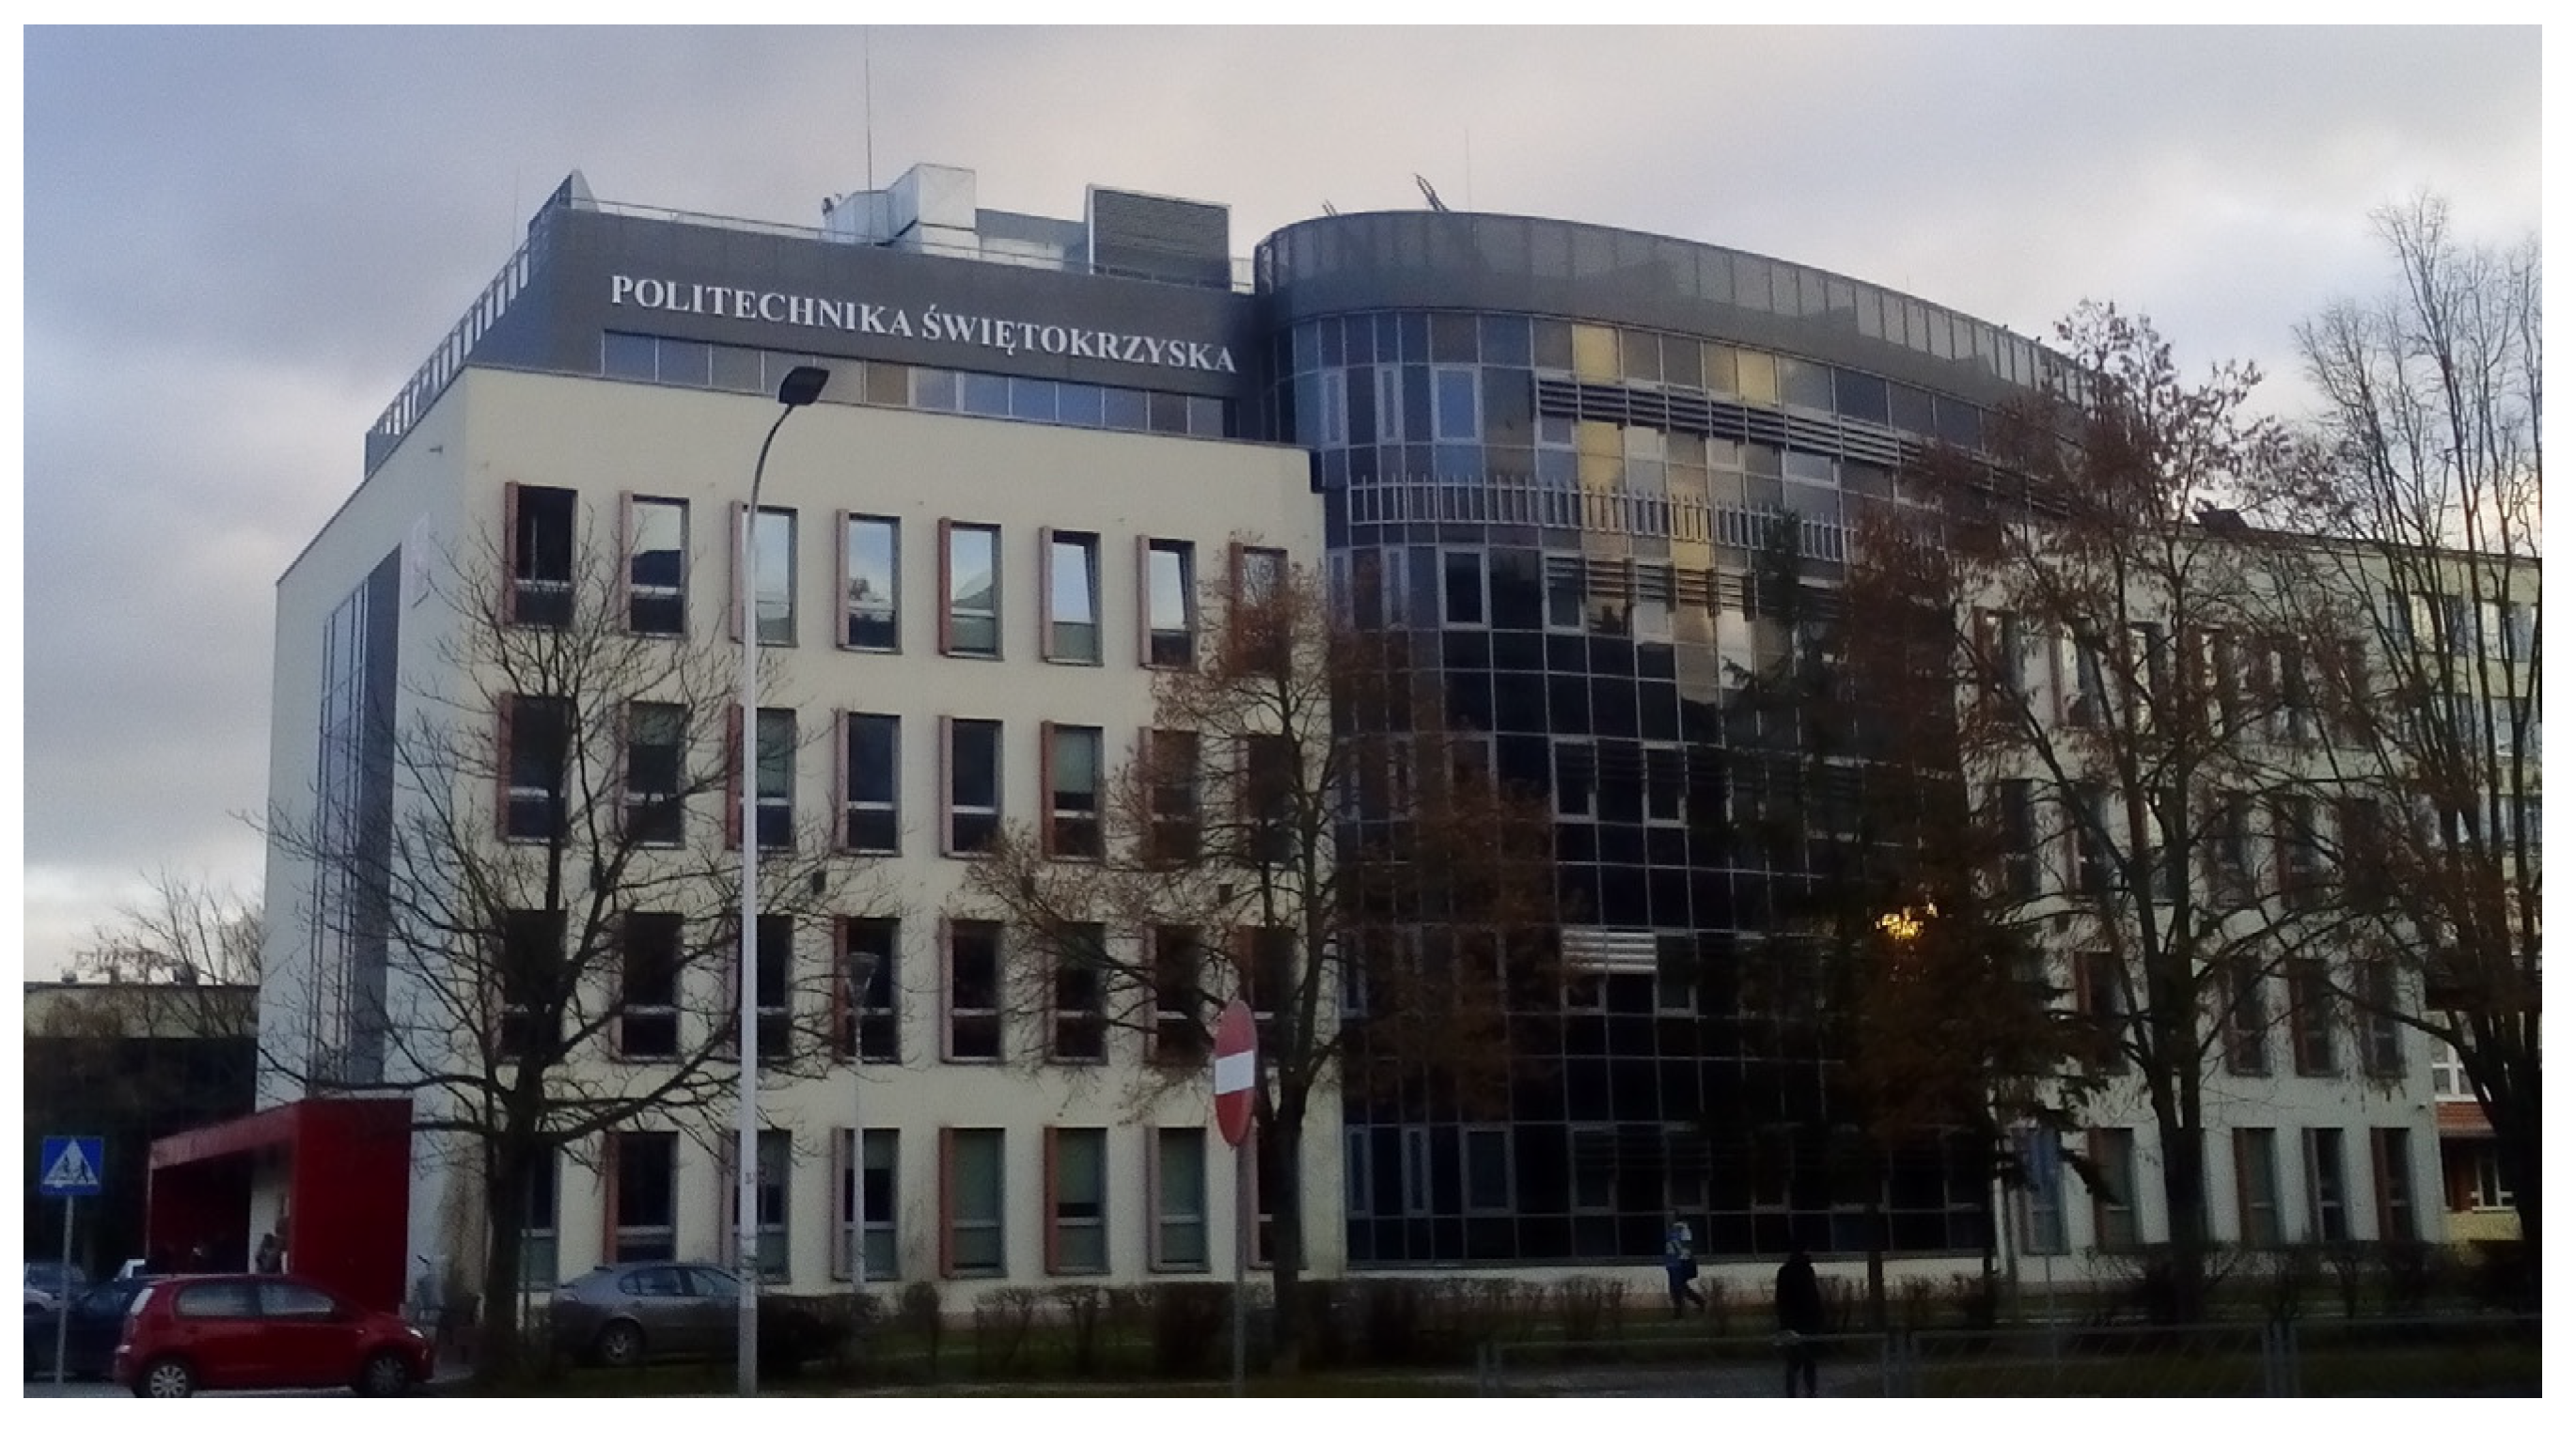
The analysis covered two modern intelligent buildings in Poland. The first one is an educational facility “Energis” housing the Faculty of Environmental, Geomatic and Energy Engineering of Kielce University of Technology (
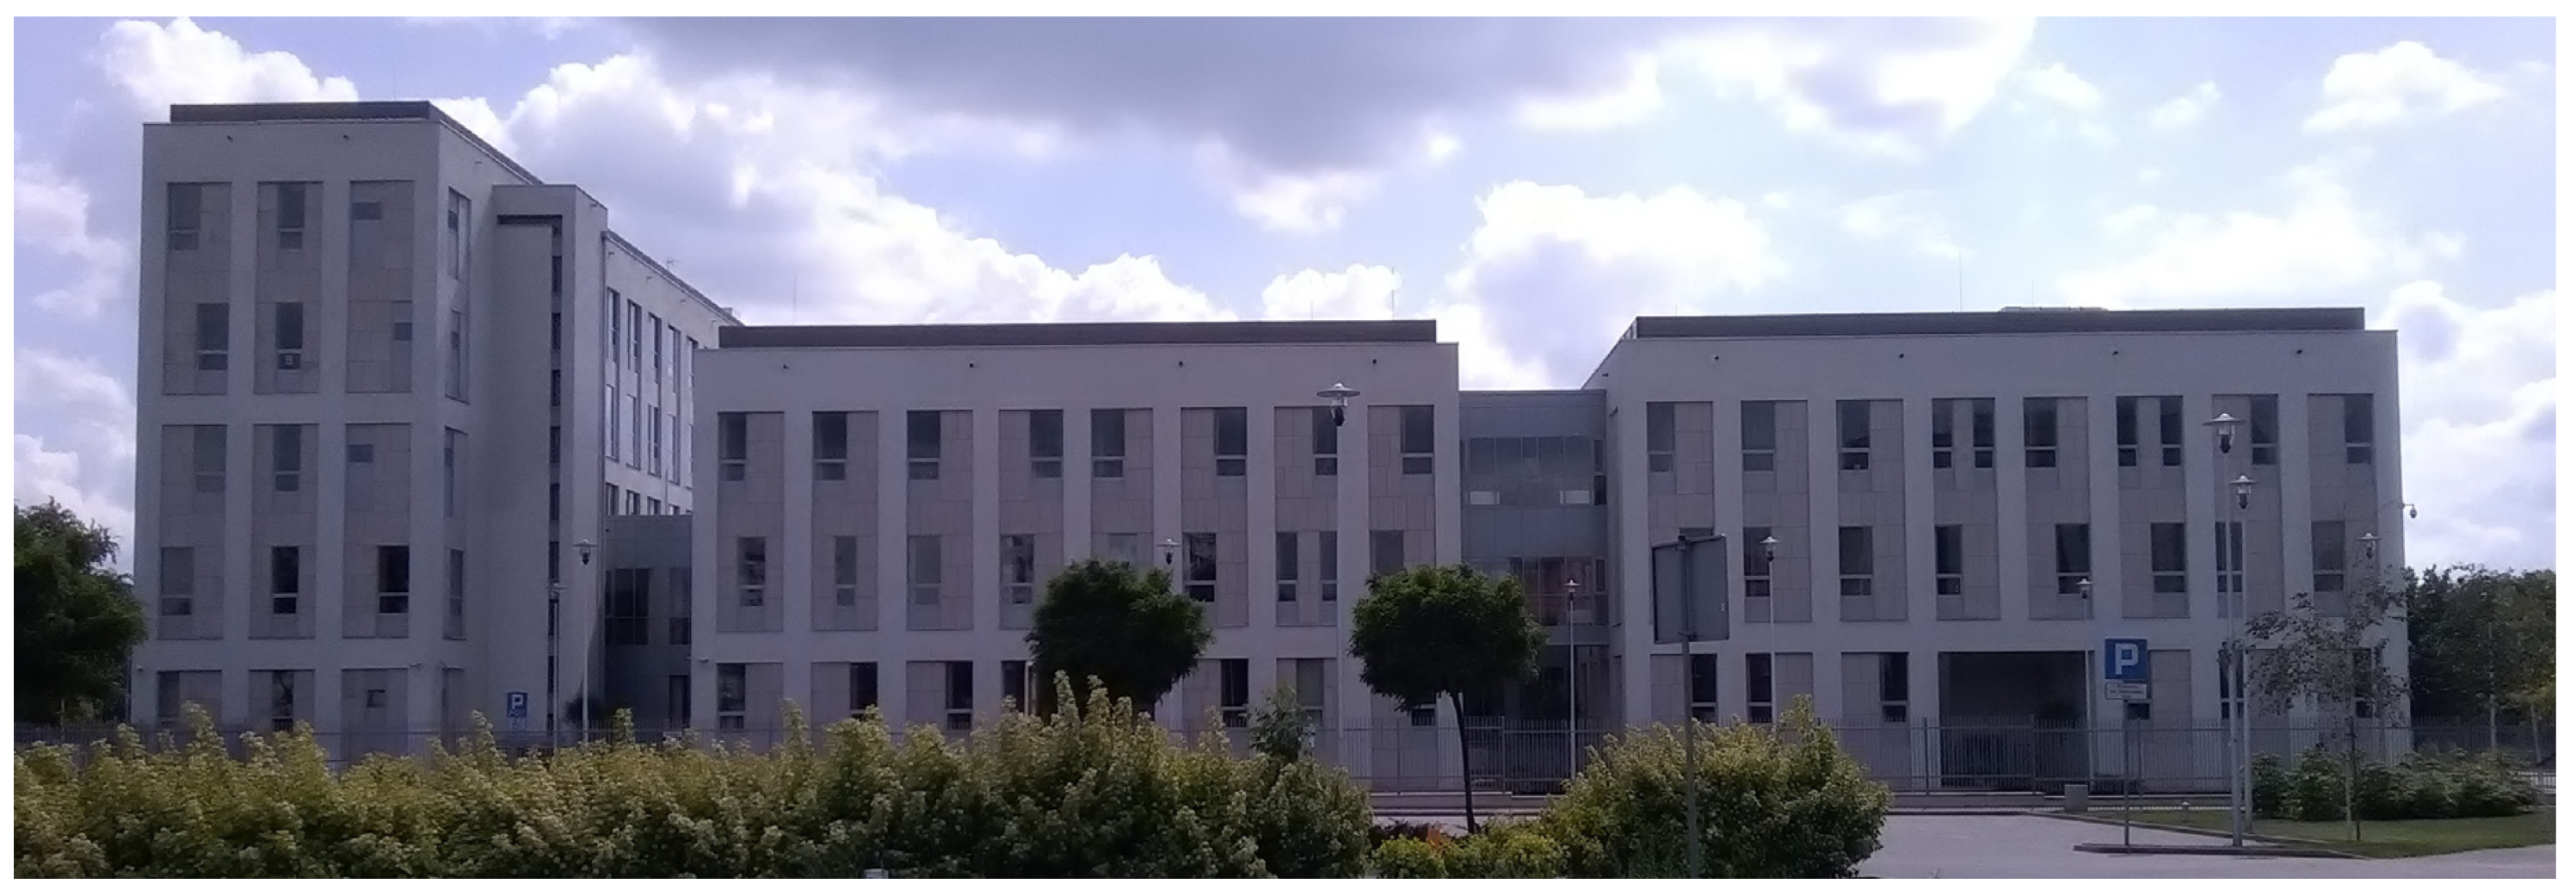
Figure 1), while the second is the courthouse in Radom (Figure 2).
Definitions of “intelligent buildings” have changed and evolved over time as pointed out in the review paper [38], however according to the classic definition proposed by Leifer [39] the fundamental constituents of such buildings are, among others: automation, building management systems, information communication networks.
Both the considered buildings are equipped with heating, ventilation and air conditioning as well as building management systems. The air processing units filter the outside air and preheat it (if necessary) before it is supplied via the ductwork to individual rooms. In those units, moisture and heat are recovered with the rotary heat exchangers. However, radiators and floor heating (only in the Energis building) are the main sources of heat. Cooling is provided with fan-coil devices in the courthouse and with 4-way ceiling-mounted indoor units in Energis. The cooling liquid (solution of ethylene glycol) is cooled with chillers located on the rooftops and circulated to indoor units if there is such a need. Each room is equipped with temperature control panel that enables occupants to set the required temperature value. However, this parameter can also be set by the building operator using the building management system (BMS) interface. This system also enables full monitoring of the buildings’ parameters, including energy consumption and generation (only in Energis, where electricity is produced from photovoltaic panels, while heat is provided using heat pumps and solar collectors), lighting, access to rooms as well as weather data. Apart from that, it integrates visual anti-theft monitoring, fire protection systems and other functions. BMS can be accessed via internet and the operators can maintain constant remote control over the buildings. Thus, such a complete integration of the HVAC and monitoring systems with BMS as well as the use of automation and control in order to provide the occupants with the adequate indoor conditions can be considered as building “intelligence”. Individual occupants of rooms can also consider the building as intelligent, because it can maintain the pre-set indoor conditions despite changes occurring outdoors or indoors.
Both these buildings are fairly new and are located about seventy kilometers from one another. The Energis building was completed in the year 2012, while the courthouse in 2017. Table 1 summarises their main technical data.
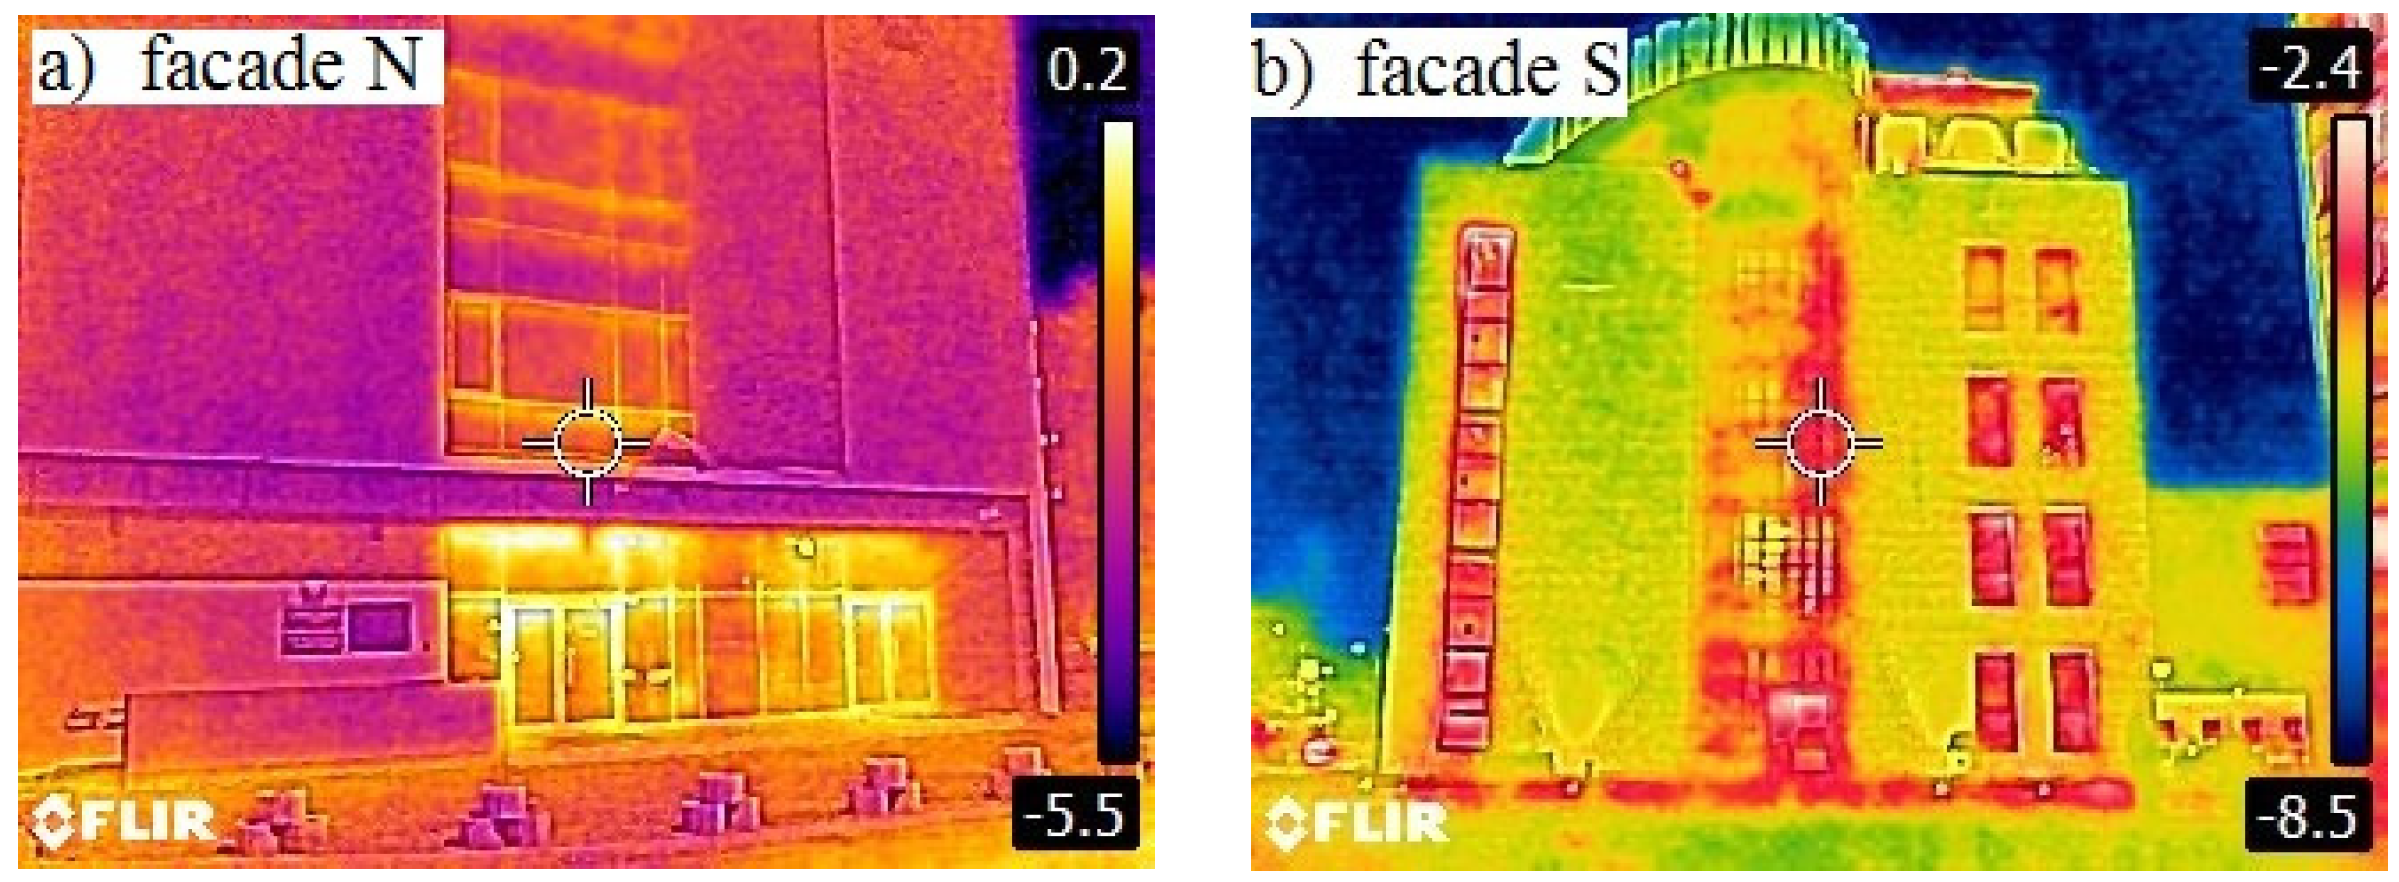
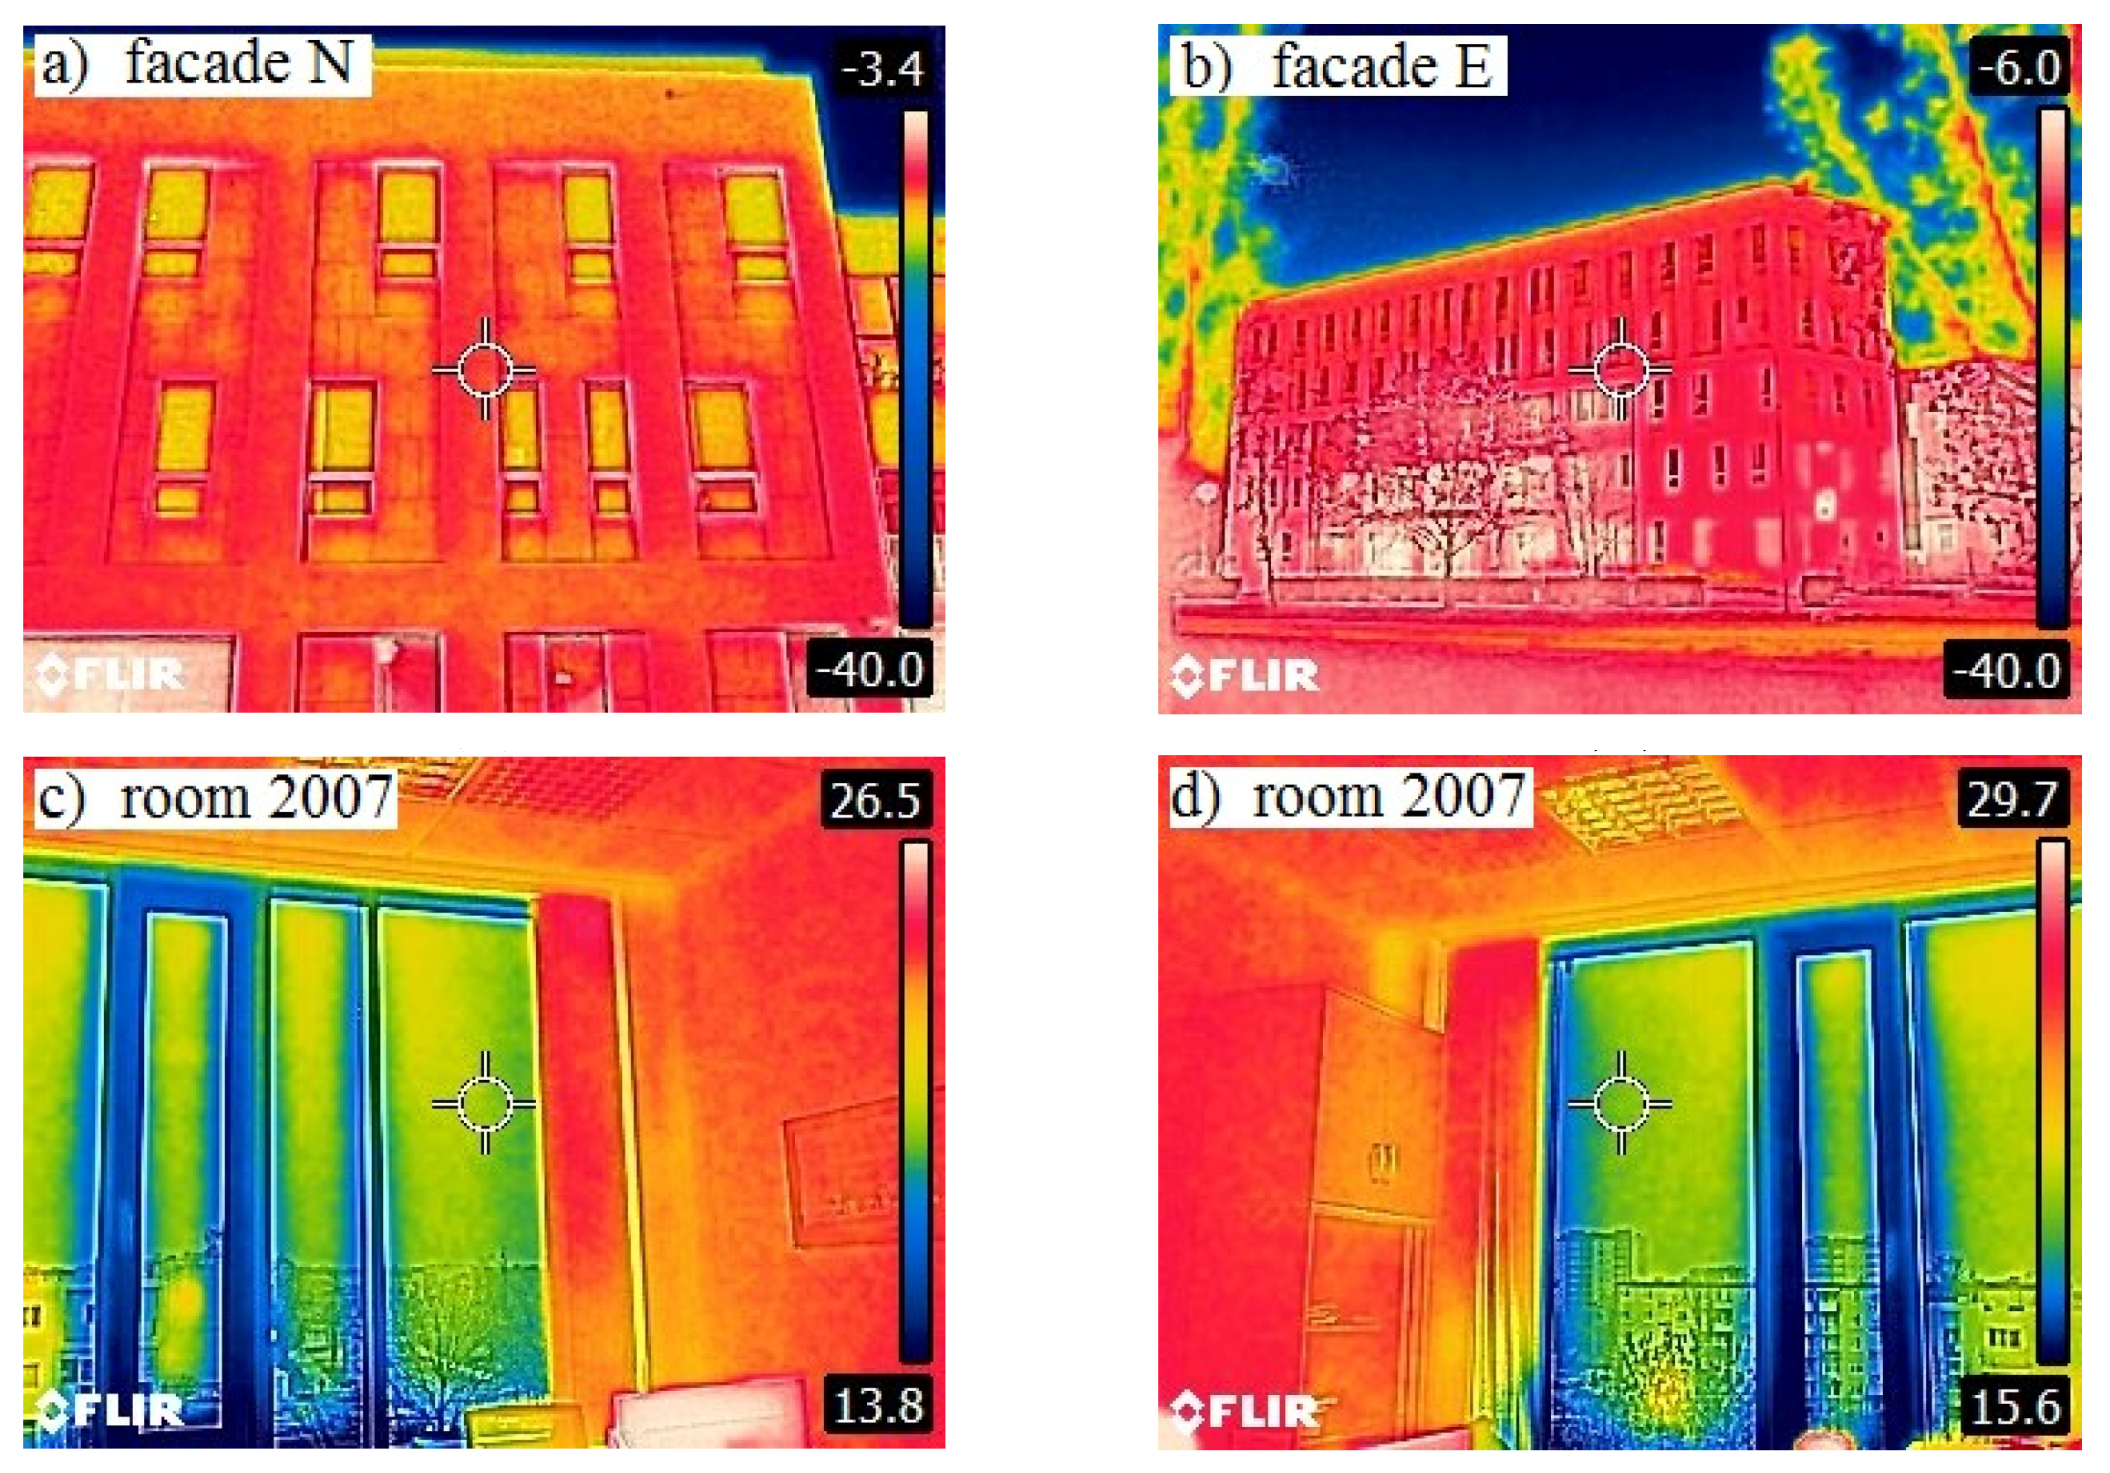
The buildings have been properly insulated to ensure low heat losses to the environment, which is particularly important in Poland, where winters can be severe with outside air temperatures falling to ca. −25 °C. The thermographic analysis conduced in both buildings revealed no major problems or defects. Figure 3 and Figure 4 present the investigation results of thermal fields observed from the outside and in selected rooms.
It needs to be noted that Energis is close to the passive building standard. It utilises a number of renewable energy sources such as ground and air source heat pumps, solar panels as well as photovoltaic systems.
The tests were conducted in the space of 1.5 years, between February 2017 and July 2018, which enabled us to cover all the seasons. They consisted of simultaneous measurement of environmental physical parameters in rooms, namely: air temperature, globe temperature, air velocity, relative humidity and carbon dioxide concentration. The tests have been performed with two devices, first of all with BABUC-A data logger (by the Italian company Lsi-Lastem) as well as a microclimate meter Sensotron PS32 (by the Polish company Sensotron). Additionally, the infrared images were obtained with FLIR E5 thermovision camera in order to determine possible presence of thermal bridges. Table 2 presents the details of the testing equipment.
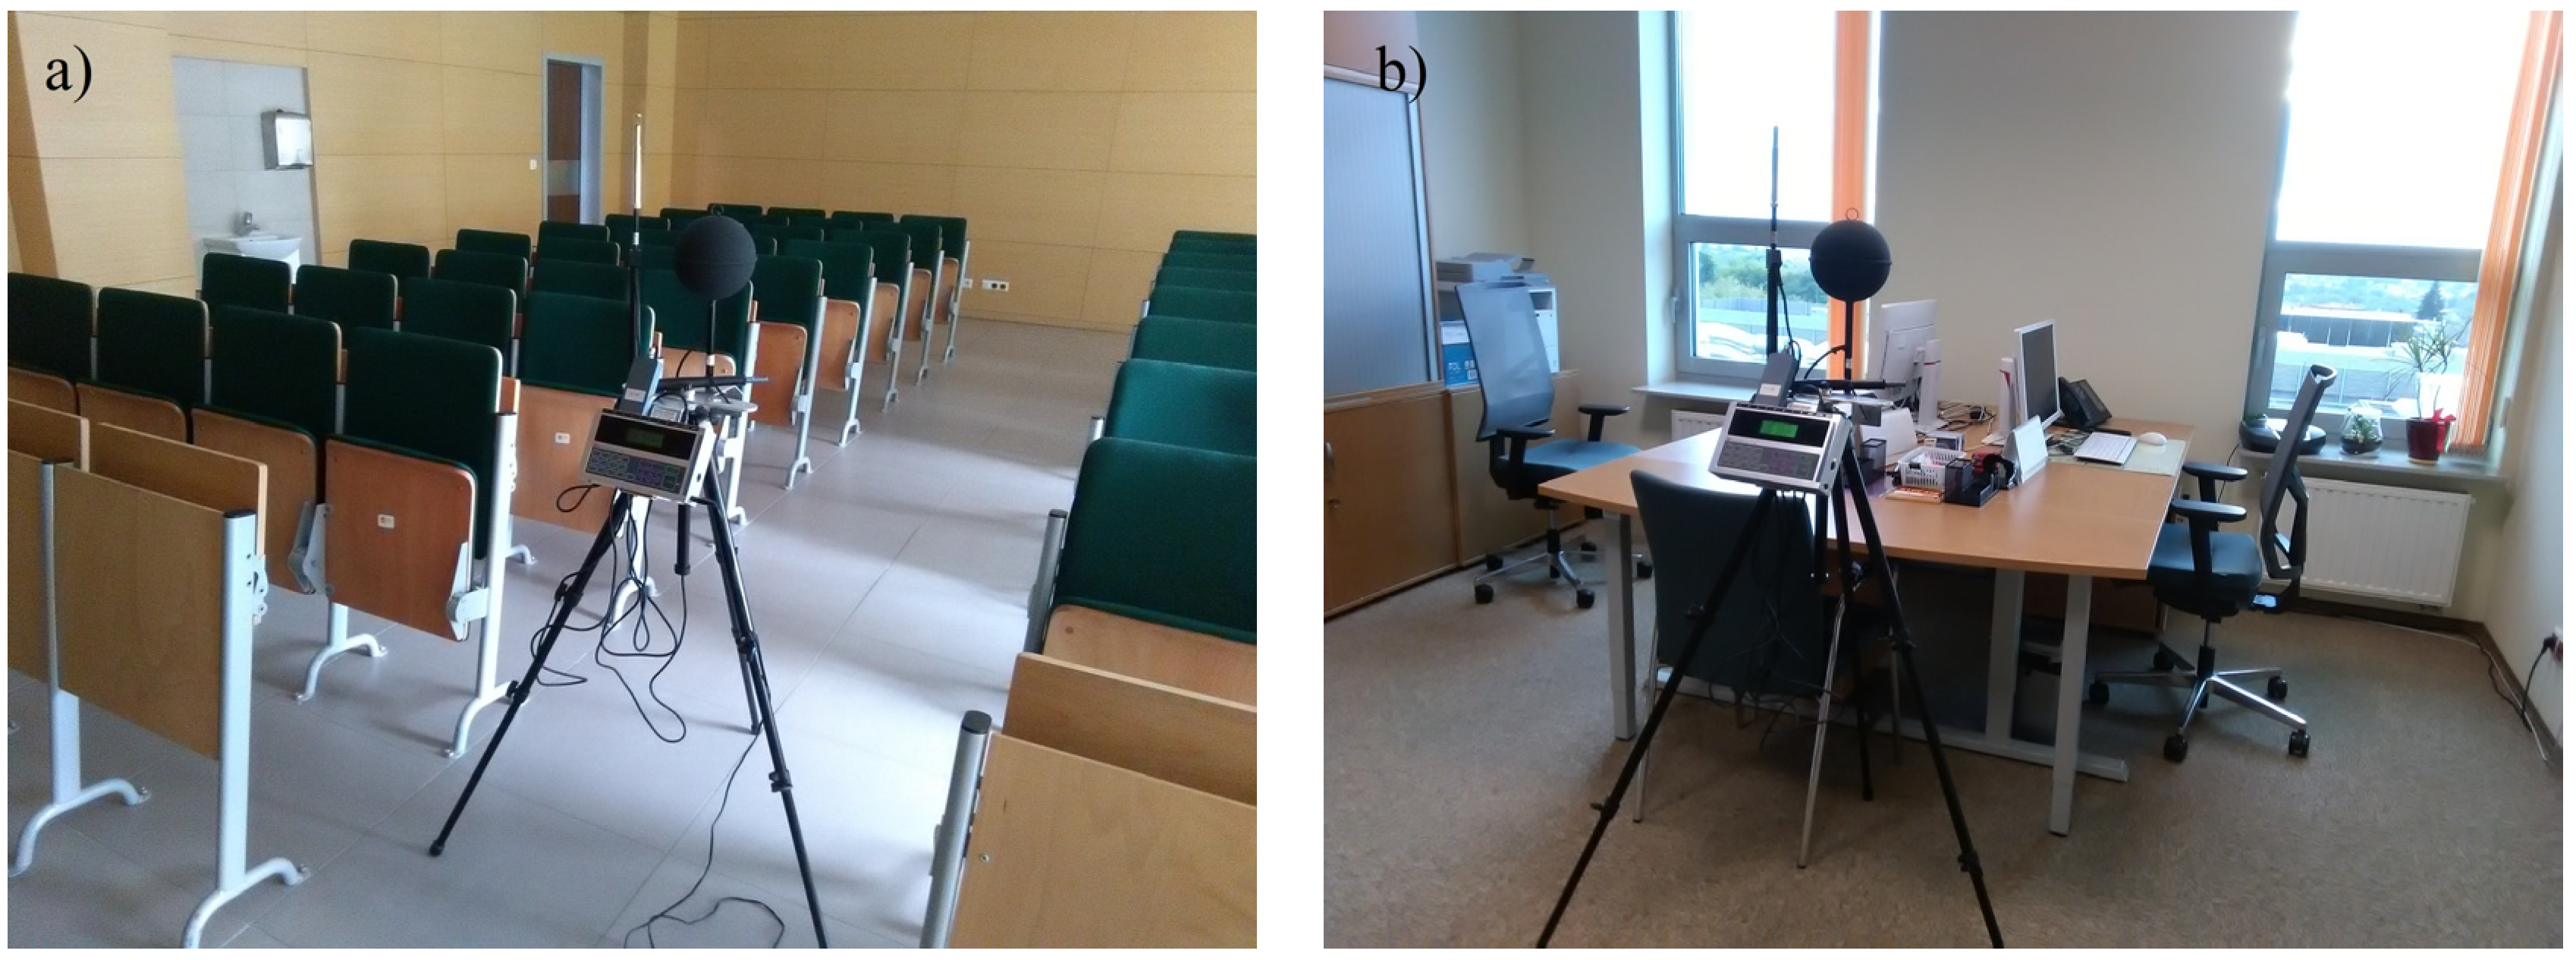
The measuring device was located on the tripod in the central part of the analysed rooms. Figure 5a and b present the experimental set-up in a lecture room in the Energis building and in an office in the courthouse, respectively.
The tests were carried out in 47 different rooms in both buildings. The largest number of people in one room (a lecture theater in the Energis building) was 65. The data obtained in the course of the experiment were recorded and stored for further processing. At the same time as the measurements were taken, the occupants of a given room were provided with questionnaires. These volunteers were asked to answer 36 questions regarding their thermal sensation, preference and acceptability as well as humidity, air quality, activity level before coming to the room, and clothing etc. In total, 118 measurements were taken in different rooms (some were used more than once)—77 comprised of rooms with at least 5 people while 41 in rooms of fewer than 5 users. The total number of questionnaires was 1501, while 1369 of these related to rooms containing at least 5 people. The database consisted of votes from healthy people only (questionnaires, in which the respondent expressed that he/she was ill were not considered). It results from the fact that thermal sensation of people who are unwell might not be objective. The measurements and the questionnaire survey were performed after at least 30 min of the occupants entering the room. This time is enough to adopt to the new environment, as pointed out by Mishra et al. [40].
The monitoring activities in each room lasted up to 1–1.2 h. Upon switching on, the measuring system required a certain amount of time to stabilise and the respondents needed to accommodate to the environment and its conditions (up to 30–40 min). After that time the volunteers were asked to fill in the questionnaires. The sampling rate was set at 1 min. The measurement results of the physical parameters taken during and shortly before the respondents filled in the questionnaires indicate that the levels of all the parameters, except for the carbon dioxide concentration, were quite stable (with standard deviation values not exceeding the measurement error, as given in 
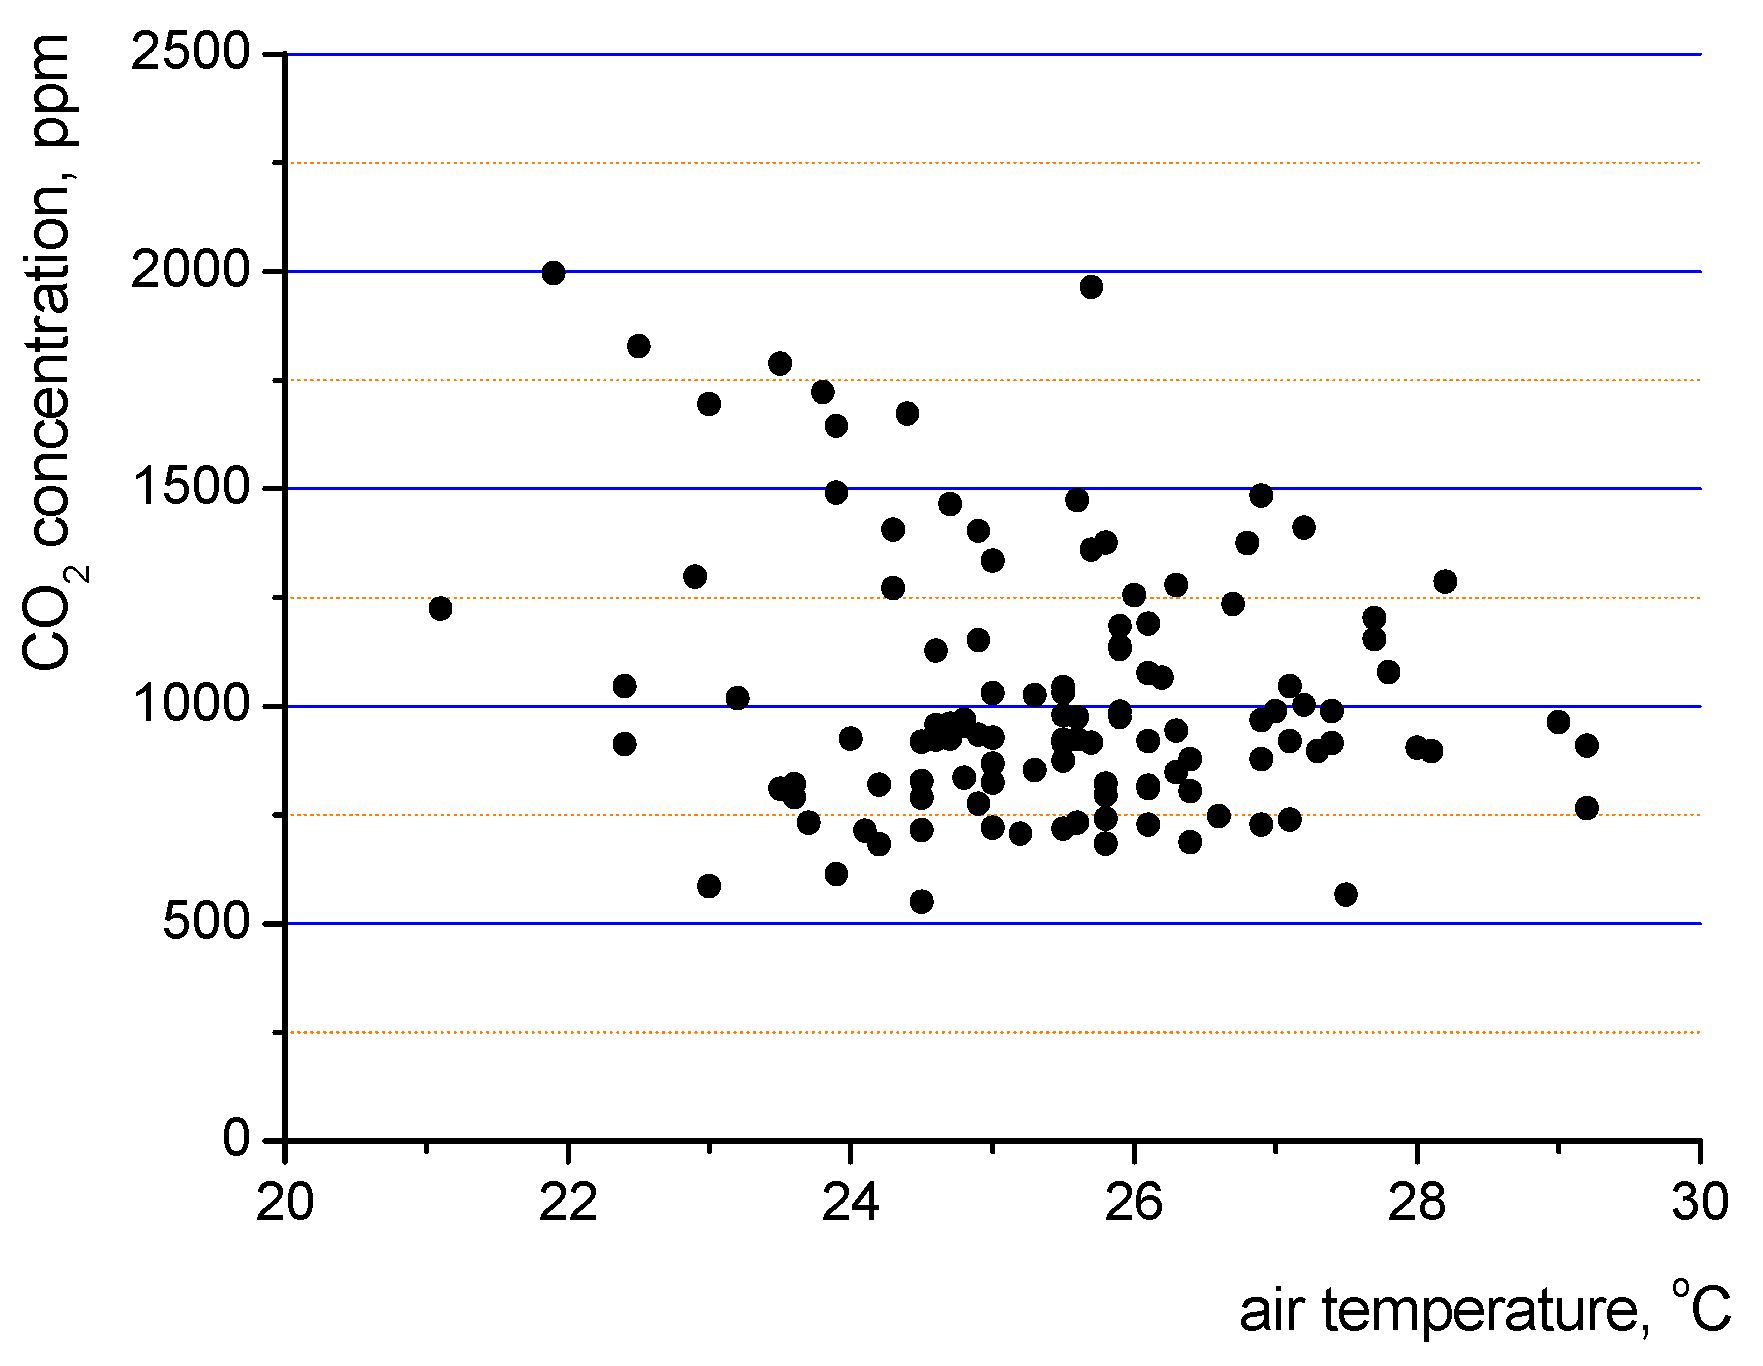
Table 2). In terms of the CO2 concentration, it is significantly dependent on the number of people in each room. Generally, room occupancy was high for the office rooms in the courthouse and varied considerably during lectures in the Energis building (Table S1 in the Supplementary material provides details on room occupancy, while Table S2 shows carbon dioxide concentration). Generally, almost all the lecture rooms and classrooms in the building were occupied at the time of measurements. However, sometimes the attendance was low and/or a relatively small group occupied a large room.
The largest number of respondents were full-time students in the Energis building. Their age typically ranged from 19 to 24 years old, while the age of office workers employed at the courthouse varied significantly and was up to 63 years old. Generally, the average age of all the respondents was 25.1 (standard deviation 8.5), while the median age was 22. The body mass index (BMI) ranged from 15.1 to 43.9, with a mean value of 22.8 (standard deviation 3.5) and a median of 22.2. Women made up 55.7% of the population in the survey, while men accounted for 44.3%.

3. Results and Discussion

3.1. Indoor Air Parameters in the Intelligent Buildings

Both Energis and Courthouse intelligent buildings have been designed and built to ensure proper indoor air conditions for people, who are currently there. However, despite much investment cost, the indoor air parameters determined in the course of the experimental programme sometimes proved to be less then satisfactory. Figure 6 presents the test results of relative humidity and operative temperature for 118 rooms (some tested more than once). The operative temperature has been calculated as the arithmetic mean of indoor air and mean radiant temperatures (as in [25]) due to the low values of air velocity.
For some rooms the test results indicate that the indoor microclimate can be considered unsatisfactory. Operative temperature exceeds the maximal value of 26 °C as given in the standard [8] for eleven measurement sets (ca. 9% of cases). Although, it needs to be noted that this might have happened due to the preference of the room occupants, who might have liked such warm environments and were unwilling to switch on air cooling. In terms of relative humidity, its optimal value depends on a number of parameters, however some data points in Figure 6 fall below the 25% level (almost 7% of cases). Consequently, a sensation of discomfort might be generated, if solid particles or other air contaminants are present in the air.
During the surveys carbon dioxide concentration was also determined. Its required value, like in the case of operative temperature, depends on the building category. For the buildings within category II (to which both analysed buildings belong) the upper limit is 800 ppm plus the outside air CO2 level [8]. Figure 7 presents the data of indoor air temperature and carbon dioxide concentration from 118 measurement sets. The analysis of the figure indicate that some measurements are characterised by elevated levels of carbon dioxide concentration.
Undoubtedly, the indoor air parameters can be improved in order to provide more comfort to the occupants. Another issue is the subjective assessment and responses of room users to such indoor conditions. It was reflected in the questionnaires filled in at the same time as the measurements of the physical parameters were taken. The following sections discuss this problem in detail.

3.2. Thermal Sensation, Acceptability and Preference of the Occupants

The individuals expressed their responses to the thermal environment in the questionnaire survey. The average value for each room was calculated based on the answers. Thus, only rooms with at least five people were considered to generate the average (arithmetic mean) value of a given parameter. The first question in the questionnaire was: “How do you assess your current thermal sensation”. The possible responses to choose from were: “too hot” (+3), “too warm” (+2), “pleasantly warm” (+1), “neutral” (0), “pleasantly cool” (−1), “too cool” (−2), “too cold” (−3). The comfort area ranged from −1 to +1. Other responses indicate unsatisfactory thermal comfort of the respondents. Figure 8 presents the combined results of 1369 responses as measured in 77 rooms (some were used more than once). Male and female votes were calculated separately, but placed in the same graph for comparison.
The research has shown that 66.3% of women and 76.4% of men felt comfortable (votes in the range of −1 to +1), while the rest felt uncomfortable (those defined as the total number of votes: +3, +2, −2, −3). The standards [6,8] stipulate that the percentage of people dissatisfied (PPD) with the microclimate should not exceed 10% for the buildings registered as category II. Thus, it can be concluded that generally the analysed modern intelligent buildings did not offer the proposed level of microclimate comfort conditions at the considered time span, during which the tests were performed. This phenomenon will be further considered in Figure 9 and Figure 10, which present the thermal acceptability and thermal preference votes.
The acceptability of room users was determined by them in the questionnaires as the answer to the question: “How do you rate your thermal environment?” The possible answers were: “absolutely acceptable” (+2), “still acceptable” (+1), “already unacceptable” (−1), “absolutely unacceptable” (−2). Figure 9 presents the combined results of 1369 responses.
Although Figure 8 suggested a large number of people dissatisfied, the acceptability vote (Figure 9) does not reflect that assumption completely. It has been determined that ca. 17% of women rated the environment as unacceptable (votes: −2 and −1) and only almost 12% of men. It has also been revealed that almost 28% of women and over 32% of men were absolutely pleased with the indoor environment conditions.
The questionnaire also contained the question about thermal preference. The occupants were asked to express their opinion on the following issue: “I would like in this room to be: “much warmer” (+2), “warmer” (+1), “no change” (0), “cooler” (−1), “much cooler” (−2). Figure 10 presents the combined results of 1369 responses as in the previous figures. The greatest number of respondents (ca. 46% of women and 57% of men) opted for “no change” answer. The others wanted a smaller or larger change. Many room users would like the environment to be cooler (ca. 24% for both men and women) or warmer (20.5% for women and 11.5% for men). The other votes, namely those of “much warmer” and “much cooler” did not exceed 5.5%.
The analysis of the data on thermal sensation, acceptability and preference indicate that the buildings, despite their sophistication and energy input, did not offer the highest level of thermal comfort. Since this parameter is considered to be mostly influenced by indoor thermal parameters, the following figures present the relationships between the operative temperature and thermal sensation (Figure 11), acceptability (Figure 12) and preference (Figure 13) in order to investigate the impact of operative temperature in detail. Here, average votes of thermal sensation, acceptability and preference have been considered for 77 groups of respondents in the considered rooms. Each group consisted of between 5 and 65 people.
Based on the test results of a large number of people, it has been found that the relationship between the operative temperature and thermal sensation vote of the respondents is linear. The correlation takes the form of:
TSV = 0.4063 T op   9.5123 ,
and is relatively strong for this type of research (R2 = 0.74). It shows a significant influence of both air and radiant temperatures on thermal comfort. Other parameters, as will be discussed later, have a much lower impact. It is worth noting that Aghniaey et al. [25] has recently proposed a non-linear formula:
TSV = 0.055 T op 2 2.25 T op + 22.26 ,
However, the R2 value was much lower (0.51).
The analysis of the acceptability of indoor conditions reveals that occupants voted overwhelmingly in favour of the thermal environment (over 80% of cases) when the operative temperature was in the range of 22–26.5 °C. The 90% level of acceptability was generally achieved for 22.5–25.5 °C (Figure 12), albeit with some exceptions.
The obtained fitting curve is characterised by the following formula:
TAV = 1.7782 T op 2 + 87.6605 T op 989.92 ,
the research performed in [25] produced a correlation in the form of:
TAV = 0.06 T op 2 + 2.66 T op 29.7 ,
however, only 15 measurement points were considered in [25].
The relationship between the thermal preference of the occupants and the operative temperature has been given in Figure 13. A strong linear correlation can be observed, indicating a crucial influence of air and radiant temperatures on this parameter.
The linear fitting procedure generated the following equation:
TPV = 0.2108 T op + 4.972 ,
whose R2 was 0.71. In [25] a much lower value of R2 was obtained (0.52) for considerably fewer measurement data points, while the formula took the form of:
TPV = 0.05 T op 2 + 1.99 T op 19.55 .
A study on human thermal perceptions reveal other interesting facts. A relationship between thermal acceptability and thermal sensation votes has been presented in Figure 14. A strong correlation between these two parameters exists.
Based on the figure above, it can be concluded that the range of thermal sensation vote of −0.5–0.5, as proposed in the standards [6,8] for buildings category II, might not be the most preferable range. The large experimental data gathered in the project indicate that the respondents in the investigated intelligent buildings were in favour of a warmer environment. The most optimal range of thermal sensation vote proved to be −0.5–1.0.
It is also worth noting that people’s preference vote—namely, the will to increase, decrease or maintain the temperature in the room—should be absolutely correlated with their thermal sensation vote. If the occupants consider the indoor environment to be “too hot” (+3) then their thermal preference should be: “much cooler” (−2). Similarly, if they rate the environment to be “too warm” (+2), their preference response should be: “cooler” (−1). If their thermal sensation is fine, they would require “no change” (0). The same situation would occur in the “cold” range of thermal sensation votes. Such a theoretical correlation has been presented in Figure 15 as the blue line. The figure also contains experimental data obtained during the study and their linear fit.
As can be seen in the figure both lines are in almost identical alignment, although the research was carried out in different buildings and throughout all the seasons. It proves that the testing procedure was performed correctly and that the proposed methodology of combining physical measurements and a questionnaire survey is very effective. Moreover, it can be concluded that the key element in thermal comfort analysis is the impact of air and radiant temperatures.

3.3. Thermal Comfort in the Lecture Theater

The largest lecture theater with 200 seats was selected for the analysis. At the time of the test 65 students were present there (39 women and 26 men). During the measurements, the indoor air temperature amounted to 26.8 °C, relative humidity 46.6% and the carbon dioxide concentration 1375 ppm. The occupants indicated their thermal sensation votes during the questionnaire survey. The mean value of TSV (thermal sensation vote) was 0.02. Thus, it can be concluded that the conditions in the room, despite quite a high air temperature, are optimal according to the standards [6,8], namely in the range of −0.5–0.5. Figure 16 presents the distribution of individual TSV values of the occupants.
As can be seen the largest number of women (ca. 55%) and men (36%) rated the indoor conditions as very good (a neutral “0”). Generally, almost 85% of occupants expressed positive opinions (from “−1” do “+1”) about their thermal sensations, which almost meets the requirements of the standards [6,8] of 90%.
Although, the mean thermal sensation was 0.02 the calculated results according to the standard [6] generated the PMV value of −0.09. The explanation of the discrepancy between the actual and predicted values might be linked with the influence of other parameters, not included in the methodology presented in the standard such as carbon dioxide concentration or BMI (body mass index) of individual respondents. Figure 17 presents the relationship between thermal sensation votes of the students in the lecture room 4.09 of the Energis building and their BMI values for the largest group of 65 people (1a) as well as two other groups, consisting of 60 (2a) and 57 people (3a).
There seems to be a weak dependence of BMI on thermal sensation of the respondents. People of large body mass index would generally consider the environmental conditions as warmer than those of low BMI. However, this issue needs further studies and clarification, especially considering that this problem is hardly ever considered in the literature.

3.4. General Sensation Vote

Apart from the thermal environment in the intelligent buildings, other factors such as noise, smell, and light intensity etc. might have an impact on the well-being of the occupants. It should also be considered as part of the study, since the analysed buildings ought to provide the overall positive sensations. Thus, a final question in the survey dealt with a general sensation of a respondent. Here, the volunteers were asked to provide the answer to the question on how they felt at the moment of filling in the questionnaire. The possible answers to choose from were: “very good” (+2), “good” (+1), “neutral” (0), “bad” (−1), “very bad” (−2). Figure 18 presents the distribution of the votes as taken from 1369 questionnaires.
The majority of both women and men were either satisfied with the environment (“+1”) or had a natural feeling towards it (“0”). Some men and few women felt very good (“+2”). The rest, however, did not share those positive or neutral sensations. The negative feelings were expressed by ca. 18.5% of women and ca. 12% of men. Naturally, it might be related to various factors, other than thermal environment. In order to clarify the relationship between the general sensation and thermal sensation votes, a graph has been constructed (Figure 19) based on average data from 77 rooms to investigate the interdependence of these two parameters.
General sensation vote above 0 indicates the positive assessment of the environmental conditions. It occurs mostly in the range of thermal sensation votes from −0.75 to +1.25. It further proves the idea already mentioned in Section 3.2. that people tend to like warmer environments. At the same time, the respondents tend to assess the environment as negative (general sensation vote below 0), if the thermal conditions are perceived to be too hot or too cold, albeit with some exceptions. A deviation from this trend might be attributed to the influence of other factors, such as air humidity, carbon dioxide concentration as well as other individual factors such as BMI.

4. Conclusions

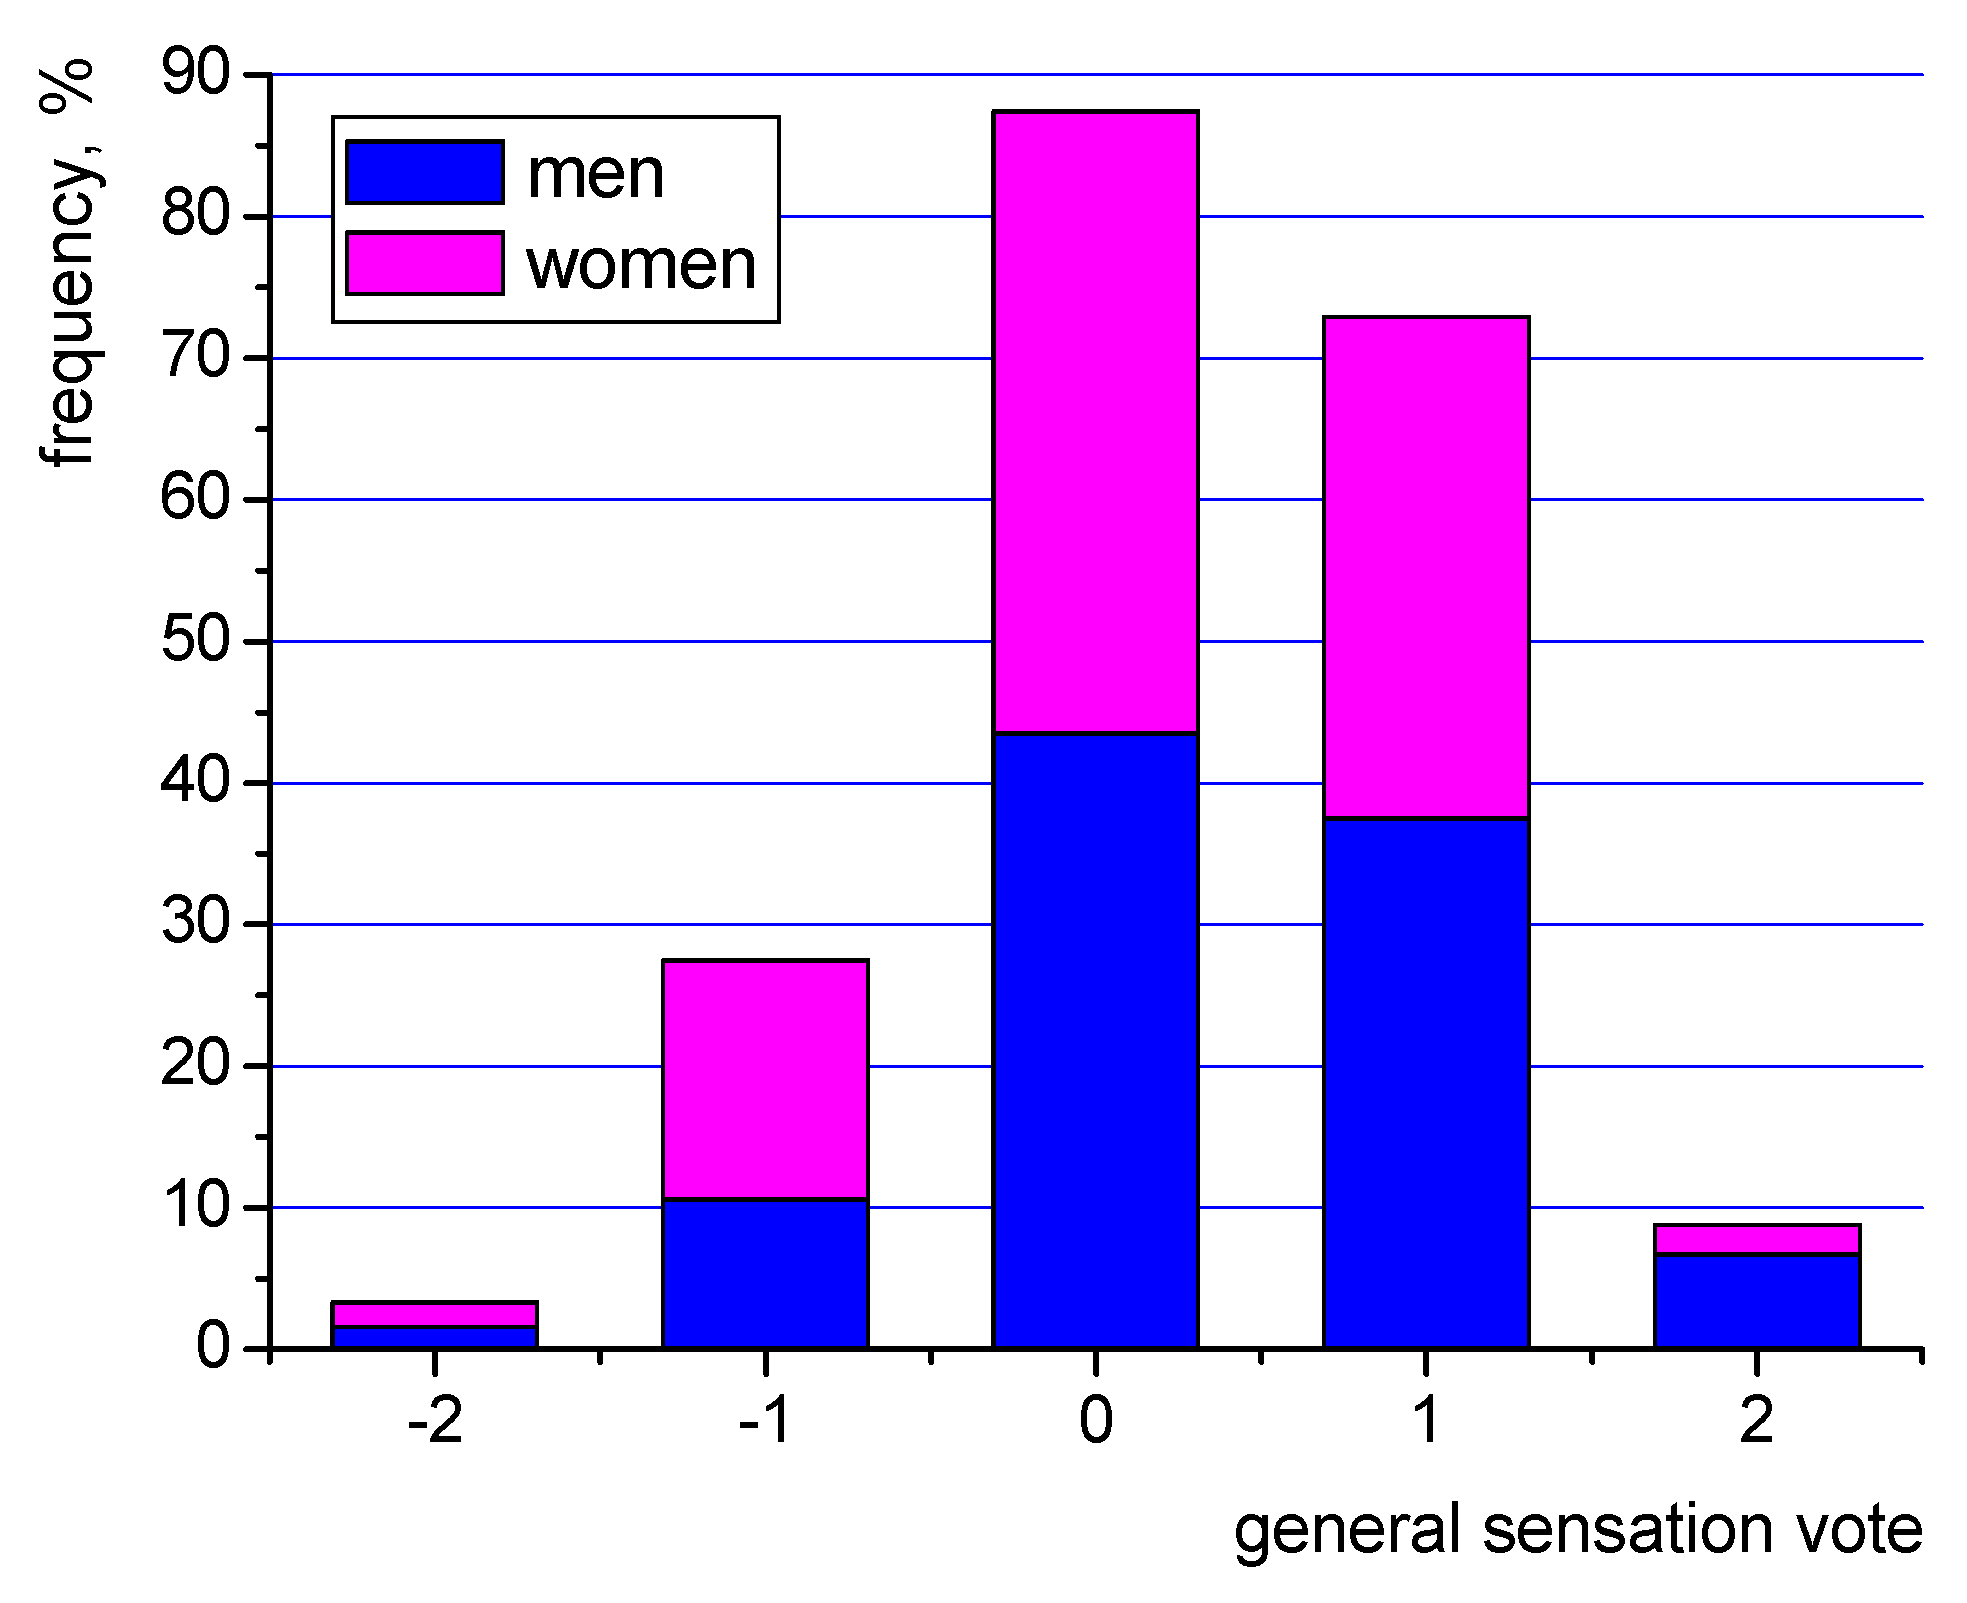
The tests performed in two modern intelligent buildings in the space of 1.5 years have generally shown that despite their sophistication and energy input, they did not offer the highest level of thermal comfort as evidenced by the data on thermal sensation, acceptability and preference of the respondents. General sensation vote, which is directly related to the quality of the indoor environment experienced by the occupants, has also proved to reveal that a number of people were unsatisfied.
The measurements of indoor air parameters showed that operative temperature sometimes exceeded the required value, although this might be caused by the occupants themselves and their thermal preferences. A similar situation occurred with relative humidity, whose value fell below 25% during some measurements. Based on the thermal sensation vote it turned out that only 66.3% of women and 76.4% of men felt comfortable throughout the whole study. This is especially important, since thermal environment proved to be the most important element for ensuring the well-being of the occupants, as expressed by the general sensation vote of the occupants.
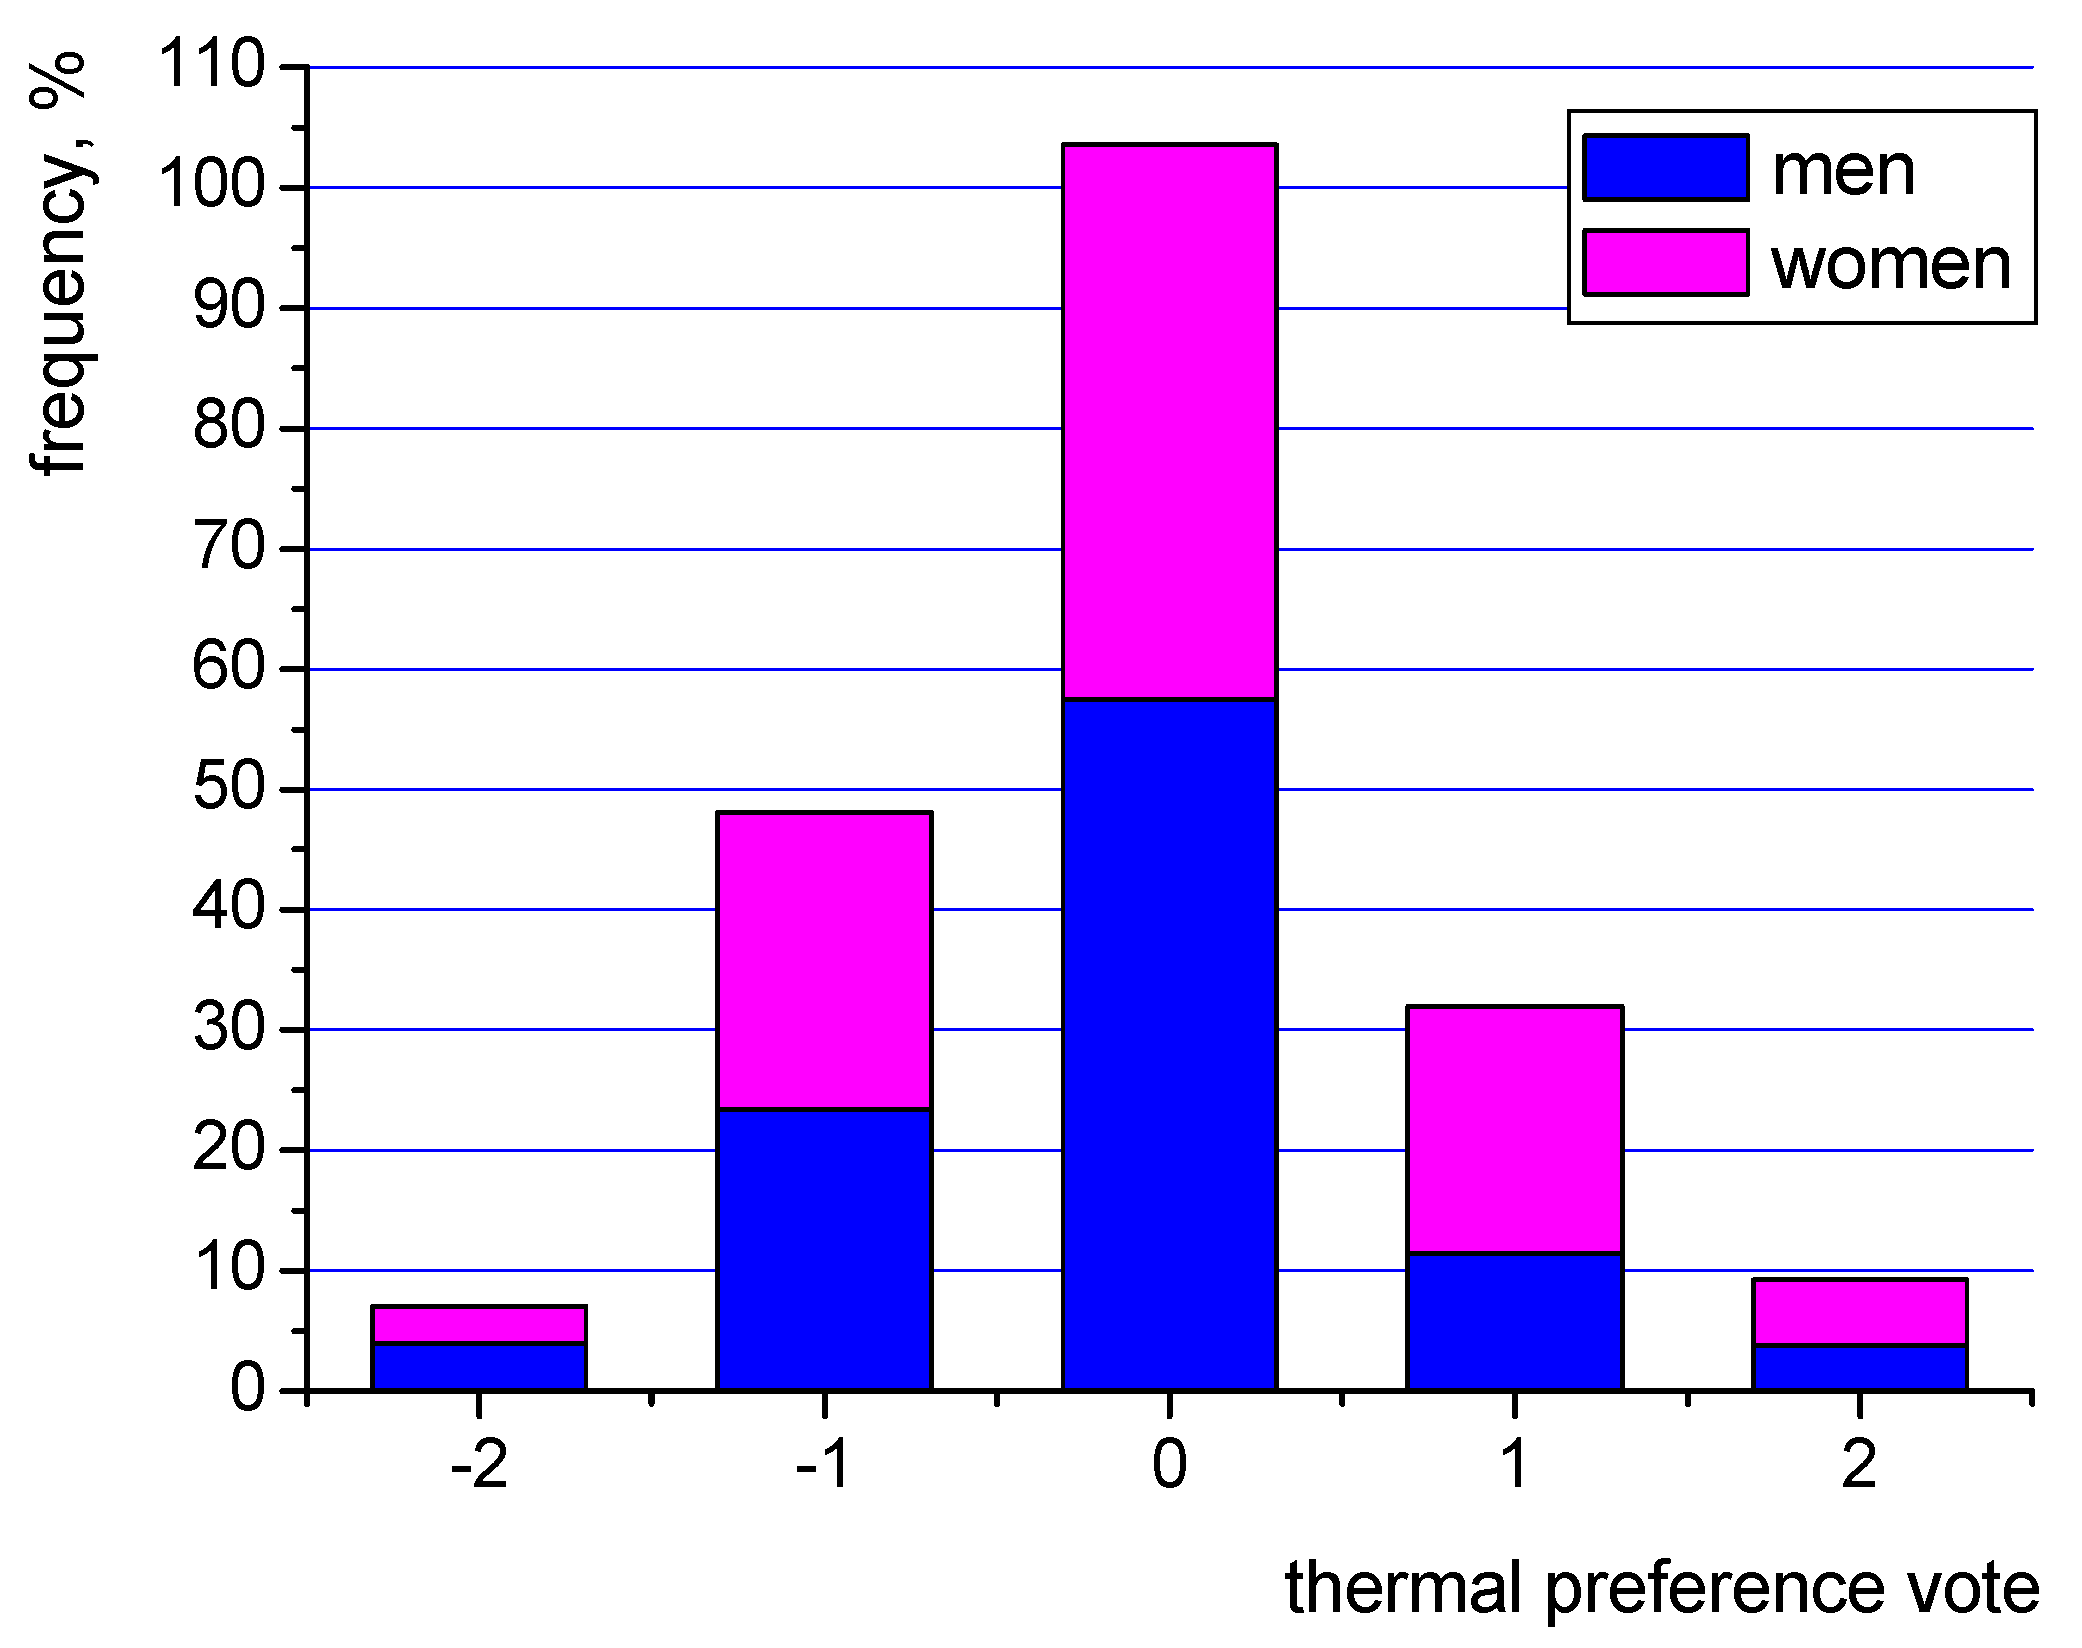
The obtained data have shown that people are generally in favour of a warmer environment. It might, to some extent, explain the number of people dissatisfied. Thus, the building operators might consider this fact for the settings of the HVAC systems. Actually, the role of the HVAC systems combined with BMS (building management system) is very important in ensuring high quality conditions. Their operation should be monitored constantly, so that comfort conditions are provided to the occupants at all times.
Broadening the experimental database will enable the development of control algorithms for the building management system that will be optimised to provide maximal thermal comfort conditions for building occupants while minimizing the energy consumption of modern and intelligent buildings. Such papers are rare and are usually based on computer simulations only [41], without backing the findings with real life research results. Thus, the future experimental work of the authors might have a scientific, but also a significant practical value.

Supplementary Materials

The following are available online at https://0-www-mdpi-com.brum.beds.ac.uk/1996-1073/13/8/1973/s1. Table S1: Data on room occupancy during the study in 77 rooms, Table S2: Data on carbon dioxide concentration measurements in 77 rooms, Table S3: Data on thermal sensation, thermal acceptability, thermal preference and general sensation votes in 77 rooms according to 1369 questionnaires.

Author Contributions

Conceptualization, Ł.J.O. and G.M.; methodology, Ł.J.O. and M.T.; software, Ł.J.O., N.R., J.P. and A.D.; literature review, Ł.J.O.; investigation, G.M.; resources, Ł.J.O., M.T. and N.R.; writing—original draft preparation, Ł.J.O.; writing—review and editing, Ł.J.O., G.M., M.T., funding acquisition, Ł.J.O., N.R., J.P. and A.D. All authors have read and agreed to the published version of the manuscript.

Funding

This research was funded by the funds from the Polish Ministry of Science and Higher Education.

Conflicts of Interest

The authors declare no conflict of interest.

References

  1. Siano, P. Demand response and smart grids—A survey. Renew. Sustain. Energy Rev. 2014, 30, 461–478. [Google Scholar] [CrossRef]
  2. Moujalled, B.; Cantin, R.; Guarracino, G. Comparison of thermal comfort algorithms in naturally ventilated office buildings. Energy Build. 2008, 40, 2215–2223. [Google Scholar] [CrossRef]
  3. Merabtine, A.; Maalouf, C.; Waheed Hawila, A.A.; Martaj, N.; Polidori, G. Building energy audit, thermal comfort, and IAQ assessment of a school building: A case study. Build. Environ. 2018, 145, 62–76. [Google Scholar] [CrossRef]
  4. Directive (EU) 2018/844 of the European Parliament and of The Council of 30 May 2018 Amending Directive 2010/31/EU on the Energy Performance of Buildings and DIRECTIVE 2012/27/EU on Energy Efficiency. OJ 2018, 156, 75–91.
  5. Fanger, P.O. Calculation of thermal comfort: Introduction of a basic comfort equation. ASHRAE Trans. 1967, 73, 4.1–4.20. [Google Scholar]
  6. ISO Standard 7730. Ergonomics of the Thermal Environment—Analytical Determination and Interpretation of Thermal Comfort Using Calculation of the PMV and PPD Indices and Local Thermal Comfort Criteria; International Organization for Standardization: Geneva, Switzerland, 2005. [Google Scholar]
  7. Thermal Environmental Conditions for Human Occupancy; ANSI/ASHRAE Standard 55-2017; American Society of Heating, Refrigerating and Air-conditioning Engineering: Peachtree Corners, GA, USA, 2017.
  8. CEN Standard EN 16798-1. Energy Performance of Buildings—Ventilation for Buildings—Part 1: Indoor Environmental Input Parameters for Design and Assessment of Energy Performance of Buildings Addressing Indoor Air Quality, Thermal Environment, Lighting and Acoustics—Module M1-6; European Committee for Standardisation: Brussels, Belgium, 2019. [Google Scholar]
  9. Enescu, D. Models and indicators to assess thermal sensation under steady-state and transient conditions. Energies 2019, 12, 841. [Google Scholar] [CrossRef] [Green Version]
  10. Šujanová, P.; Rychtáriková, M.; Sotto Mayor, T.; Hyder, A.A. Healthy, Energy-efficient and comfortable indoor environment, a review. Energies 2019, 12, 1414. [Google Scholar] [CrossRef] [Green Version]
  11. Djamila, H.; Chu, C.M.; Kumaresan, S. Field study of thermal comfort in residential buildings in the equatorial hot-humid climate of Malaysia. Build. Environ. 2013, 62, 133–142. [Google Scholar] [CrossRef]
  12. Guedes, M.C.; Matias, L.; Santos, C.P. Thermal comfort criteria and building design: Field work in Portugal. Renew. Energy 2009, 34, 2357–2361. [Google Scholar] [CrossRef]
  13. Ricciardi, P.; Buratti, C. Thermal comfort in the Fraschini theatre (Pavia, Italy): Correlation between data from questionnaires, measurements, and mathematical model. Energy Build. 2015, 99, 243–252. [Google Scholar] [CrossRef]
  14. Pala, U.; Oz, H.R. An investigation of thermal comfort inside a bus during heating period within a climatic chamber. Appl. Ergon. 2015, 48, 164–176. [Google Scholar] [CrossRef] [PubMed]
  15. Yang, W.; Zhang, G. Thermal comfort in naturally ventilated and air-conditioned buildings in humid subtropical climate zone in China. Int. J. Biometeorol. 2008, 52, 385–398. [Google Scholar] [CrossRef] [PubMed]
  16. Alamin, Y.I.; Del Mar Castilla, M.; Álvarez, J.D.; Ruano, A. An Economic model-based predictive control to manage the users’ thermal comfort in a building. Energies 2017, 10, 321. [Google Scholar] [CrossRef]
  17. Hong, S.H.; Lee, J.M.; Moon, J.W.; Lee, K.H. Thermal comfort, energy and cost impacts of PMV control considering individual metabolic rate variations in residential building. Energies 2018, 11, 1767. [Google Scholar] [CrossRef] [Green Version]
  18. Robledo-Fava, R.; Hernández-Luna, M.C.; Fernández-de-Córdoba, P.; Michinel, H.; Zaragoza, S.; Castillo-Guzman, A.; Selvas-Aguilar, R. Analysis of the influence subjective human parameters in the calculation of thermal comfort and energy consumption of buildings. Energies 2019, 12, 1531. [Google Scholar] [CrossRef] [Green Version]
  19. Almeida, R.M.S.F.; Ramos, N.M.M.; de Freitas, V.P. Thermal comfort models and pupils’ perception in free-running school buildings of a mild climate country. Energy Build. 2016, 111, 64–75. [Google Scholar] [CrossRef]
  20. Krawczyk, D.A.; Gładyszewska-Fiedoruk, K.; Rodero, A. The analysis of microclimate parameters in the classrooms located in different climate zones. Appl. Therm. Eng. 2017, 113, 1088–1096. [Google Scholar] [CrossRef]
  21. Vilcekova, S.; Meciarova, L.; Burdova, E.K.; Katunska, J.; Kosicanova, D.; Doroudiani, S. Indoor environmental quality of classrooms and occupants’ comfort in a special education school in Slovak Republic. Build. Environ. 2017, 120, 29–40. [Google Scholar] [CrossRef]
  22. Fang, Z.; Zhang, S.; Cheng, Y.; Fong, A.M.L.; Oladokun, M.O.; Lin, Z.; Wua, H. Field study on adaptive thermal comfort in typical air conditioned classrooms. Build. Environ. 2018, 133, 73–82. [Google Scholar] [CrossRef] [Green Version]
  23. Buratti, C.; Ricciardi, P. Adaptive analysis of thermal comfort in university classrooms: Correlation between experimental data and mathematical models. Build. Environ. 2009, 44, 674–687. [Google Scholar] [CrossRef]
  24. Ricciardi, P.; Buratti, C. Environmental quality of university classrooms: Subjective and objective evaluation of the thermal, acoustic, and lighting comfort conditions. Build. Environ. 2018, 127, 23–36. [Google Scholar] [CrossRef]
  25. Aghniaey, S.; Lawrence, T.W.; Sharpton, T.N.; Douglass, S.P.; Oliver, T.; Sutter, M. Thermal comfort evaluation in campus classrooms during room temperature adjustment corresponding to demand response. Build. Environ. 2019, 148, 488–497. [Google Scholar] [CrossRef]
  26. Singh, M.K.; Kumar, S.; Ooka, R.; Rijal, H.B.; Gupta, G.; Kumar, A. Status of thermal comfort in naturally ventilated classrooms during the summer season in the composite climate of India. Build. Environ. 2018, 128, 287–304. [Google Scholar] [CrossRef]
  27. Hens, H.S.L.C. Thermal comfort in office buildings: Two case studies commented. Build. Environ. 2009, 44, 1399–1408. [Google Scholar] [CrossRef]
  28. Kuchen, E.; Fisch, M.N. Spot Monitoring: Thermal comfort evaluation in 25 office buildings in winter. Build. Environ. 2009, 44, 839–847. [Google Scholar] [CrossRef]
  29. Ricciardi, P.; Buratti, C. Thermal comfort in open plan offices in northern Italy: An adaptive approach. Build. Environ. 2012, 56, 314–320. [Google Scholar] [CrossRef]
  30. Indraganti, M.; Ooka, R.; Rijal, H.B. Thermal comfort in offices in summer: Findings from a field study under the ‘setsuden’ conditions in Tokyo, Japan. Build. Environ. 2013, 61, 114–132. [Google Scholar] [CrossRef]
  31. Indraganti, M.; Ooka, R.; Rijal, H.B. Field investigation of comfort temperature in Indian office buildings: A case of Chennai and Hyderabad. Build. Environ. 2013, 65, 195–214. [Google Scholar] [CrossRef]
  32. Jazizadeh, F.; Marin, F.M.; Becerik-Gerber, B. A thermal preference scale for personalized comfort profile identification via participatory sensing. Build. Environ. 2013, 68, 1440–1449. [Google Scholar] [CrossRef]
  33. Szabo, J.; Kajtar, L. Thermal comfort analysis in office buildings with different air—Conditioning systems. Int. Rev. App. Sc. Eng. 2018, 9, 59–63. [Google Scholar] [CrossRef] [Green Version]
  34. Fedorczak-Cisak, M.; Nowak, K.; Furtak, M. Analysis of the effect of using external venetian blinds on the thermal comfort of users of highly glazed offce rooms in a transition season of temperate climate—Case study. Energies 2020, 13, 81. [Google Scholar] [CrossRef] [Green Version]
  35. Lipczynska, A.; Schiavon, S.; Graham, L.T. Thermal comfort and self-reported productivity in an office with ceiling fans in the tropics. Build. Environ. 2018, 135, 202–212. [Google Scholar] [CrossRef] [Green Version]
  36. Zeiler, W.; Boxem, G. Effects of thermal activated building systems in schools on thermal comfort in winter. Build Environ. 2009, 44, 2308–2317. [Google Scholar] [CrossRef]
  37. Cui, W.; Cao, G.; Ho Park, J.; Ouyang, Q.; Zhu, Y. Influence of indoor air temperature on human thermal comfort, motivation and performance. Build. Environ. 2013, 68, 114–122. [Google Scholar] [CrossRef]
  38. Ghaffarianhoseini, A.; Berardi, U.; AlWaer, H.; Chang, S.; Halawa, E.; Ghaffarianhoseini, A.; Clements-Croome, D. What is an intelligent building? Analysis of recent interpretations from an international perspective. Arch. Sci. Rev. 2016, 59, 238–257. [Google Scholar] [CrossRef] [Green Version]
  39. Leifer, D. Intelligent Buildings: A Definition. Arch. Aust. 1988, 77, 200–202. [Google Scholar]
  40. Mishra, A.K.; Derks, M.T.H.; Kooi, L.; Loomans, M.G.L.C.; Kort, H.S.M. Analysing thermal comfort perception of students through the class hour, during heating season, in a university classroom. Build. Environ. 2017, 125, 464–474. [Google Scholar] [CrossRef]
  41. Chen, X.; Wang, Q.; Srebric, J. Model predictive control for indoor thermal comfort and energy optimization using occupant feedback. Energy Build. 2015, 102, 357–369. [Google Scholar] [CrossRef] [Green Version]
Figure 1. “Energis” building of Kielce University of Technology (Western façade).
Energies 13 01973 g001
Figure 2. Courthouse in Radom (Northern façade).
Energies 13 01973 g002
Figure 3. Energis: thermal images of the Northern (a) and Southern (b) façades as well as lecture rooms on the fourth (c) and first floor (d).
Energies 13 01973 g003aEnergies 13 01973 g003b
Figure 4. The courthouse: thermal images of the Northern (a) and Eastern (b) façades as well as room 2007 on the second floor (c,d).
Energies 13 01973 g004
Figure 5. Experimental set-up: microclimate meter in the lecture room in Energis building (a) and in the office room in the courthouse (b).
Energies 13 01973 g005
Figure 6. Operative temperature and relative humidity values in selected rooms between February 2017 and July 2018.
Energies 13 01973 g006
Figure 7. Indoor air temperature and carbon dioxide concentration in selected rooms between February 2017 and July 2018.
Energies 13 01973 g007
Figure 8. Thermal sensation vote of the room occupants in both intelligent buildings based on 1369 questionnaires (description in the text).
Energies 13 01973 g008
Figure 9. Thermal acceptability of the room occupants in both intelligent buildings based on 1369 questionnaires (description in the text).
Energies 13 01973 g009
Figure 10. Thermal preference of the room occupants in both intelligent buildings based on 1369 questionnaires (description in the text).
Energies 13 01973 g010
Figure 11. Relationship between average thermal sensation and operative temperature based on 1369 questionnaires.
Energies 13 01973 g011
Figure 12. Relationship between average thermal acceptability and operative temperature based on 1369 questionnaires.
Energies 13 01973 g012
Figure 13. Relationship between average thermal preference and operative temperature based on 1369 questionnaires.
Energies 13 01973 g013
Figure 14. Relationship between average thermal acceptability and average thermal sensation vote based on 1369 questionnaires.
Energies 13 01973 g014
Figure 15. Relationship between average thermal sensation vote and average thermal preference vote based on 1369 questionnaires.
Energies 13 01973 g015
Figure 16. Thermal sensation votes in the lecture theater.
Energies 13 01973 g016
Figure 17. Relationship between thermal sensation votes and body mass index (BMI) for 3 different groups of people; 1a: survey on 65 people, 2a: survey on 60 people, 3a: survey on 57 people; 1b, 2b, 3b: linear fits of 1a, 2a and 3a, respectively.
Energies 13 01973 g017
Figure 18. General sensation vote of the room occupants in both intelligent buildings based on 1369 questionnaires (description in the text).
Energies 13 01973 g018
Figure 19. Average general sensation and thermal sensation votes based on 1369 questionnaires.
Energies 13 01973 g019
Table 1. The main technical data of the analysed intelligent buildings.
No.ParameterEnergis Building
in Kielce
Courthouse
in Radom
1Building area925 m23239.30 m²
2Total floor area6288.92 m214,822.48 m2
3Usable floor area5121.24 m25640.17 m2
4Cubature21,211 m361,661.48 m3
5External wall (construction material/thickness)Ceramic hollow trick/25 cm, 30 cmReinforced concrete/15 cm, 25 cm, 30 cm
6U value of the external wall0.17 W/(m2K)0.28 W/(m2K)
Table 2. Technical details of the measuring system.
NumberParameterMeasuring RangeResolutionAccuracy
1Air temperature10–45 °C0.1 °C0.5 °C
2Relative humidity0–100%0.1%3%
3Globe temperature−50–70 °C0.1 °C1 °C
4CO2 concentration0–5000 ppm1 ppm20 ppm + 3% of the measured value
5Air velocity0–30 m/s0.01 m/s3 % (at 25 °C)

