Article

Numerical and Experimental Analysis of the Thermal Performances of SiC/Water and Al2O3/Water Nanofluid Inside a Circular Tube with Constant-Increased-PR Twisted Tape

1
Faculty of Engineering and Built Environment, National University of Malaysia, Bangi 43600 UKM, Malaysia
2
Solar Energy Research Institute (SERI), National University of Malaysia, Bangi 43600 UKM, Malaysia
*
Author to whom correspondence should be addressed.
Submission received: 11 March 2020 / Revised: 12 April 2020 / Accepted: 20 April 2020 / Published: 22 April 2020

Abstract

:
The simultaneous use of two passive methods (twisted tape and a nanofluid) in a heat transfer system will increase the average Nusselt number (Nu) of the system. However, the presence of inserts and nanoparticles inside the tube will create higher pressure drop (ΔP) in the system, which can eventually affect the overall enhancement ratio (η), especially at higher Reynolds numbers (Re). Several modifications of twisted tapes have been made to reduce ΔP, but most showed a decreasing trend of η as Re increased. The objective of this study is to design a new geometry of twisted tape that yields a larger value of Nu and a smaller value of ΔP, which can result in a larger value of η especially at higher Re. A simulation and experimental analysis are conducted in which Re ranges from 4000–16,000 with two types of nanofluids (SiC/Water and Al2O3/Water) at various values of the volume fraction, (φ) (1–3%). ANSYS FLUENT software with the RNG k-ɛ turbulent model is adopted for the simulation analysis. Three types of twisted tape are used in the analysis: classic twisted tape with a pitch ratio of 2 (TT PR2), constant-increasing-pitch-ratio twisted tape (TT IPR) and constant-decreasing-pitch-ratio twisted tape (TT DPR). The use of TT IPR generates a stronger swirling flow at the inlet of the tube and smaller ∆P, especially near the outlet region. The highest value of η is obtained for 3% SiC/Water nanofluid that is flowing through a smooth circular tube with TT IPR inserts at Re of 10,000.

1. Introduction

The use of heat exchangers in industrial applications consumes an undesirable amount of energy and has become a matter of concern, especially in the effort to reduce energy waste, which can lead to climate change. Thus, increasing Nu and reducing ∆P are highly important for the realization of a higher performance heat exchanger. An approach for increasing the thermal performance of a thermal system is to adopt a passive method, such as alteration of the fluid flow inside a tube including having a corrugated channel/tube or using insert inside the channel/tube [1,2]. Therefore, several modifications have been made to the twisted tape by researchers to produce better fluid mixing with lower ∆P including serrated twisted tape (TPP) [3], multiple twisted tape [4], square and V-cut twisted tape [5], segmented twisted tape [6], and self-rotating twisted tape [7]. Even though all these methods are able to enhance η at a certain point, a decreasing trend is shown as Re increases. Another promising passive method that can be applied in the effort of increasing thermal performance in heat exchanger systems is using nanofluid as the working fluid. The simultaneous use of these two methods will result in higher Nu but at the expense of higher ∆P due to flow blockage by the twisted tape insert and higher viscosity of the fluid due to nanoparticles.
These modified approaches include a cross-cut twisted tape with an alternate axis (CCTA) with a Cu/Water nanofluid as the working fluid [8,9], twin co-twisted tapes and twin counter-twisted tapes (CoTs and CTs) with a graphene-platinum nanofluid as the working fluid [10], overlapped dual twisted tapes (O-Dts) with a TiO2/Water nanofluid as the working fluid [11], helical twisted tape with an Al2O3/ water nanofluid as the working fluid [12], twisted tape with dimples and protrusions with an Al2O3/Water nanofluid as the working fluid [13], dual co-twisted tapes and dual counter-twisted tapes (D-Co-TTs and D-C-TTs) with an Al2O3/Water nanofluid as the working fluid [14], rectangular-cut-on-its-rib twisted tape with four types of nanofluids as working fluids (TiO2/Water, BeO/Water, ZnO/Water, and CuO/Water) [15], twisted tapes with various progression ratios (RGPR and IGPR) with an Al2O3/Water nanofluid as the working fluid [16], spiky twisted tape with three types of nanofluids as the working fluid (Cu/Water, Fe/Water, and Ag/Water) [17], and trapezoidally cut twisted tape with an Fe3O4/Water nanofluid as the working fluid [18]. The simultaneous use of these two passive methods increased η by a factor 1.2–1.5 for Re between 4000–10,000 compared to classic twisted tape with water as the working fluid. The utilization of multiple twisted tapes such as O-Dts and D-Co-TT can create a stronger swirling flow inside the tube that results in higher Nu. However, multiple twisted tapes yielded 20% higher pressure drop and pumping power compared to the classic single twisted tape under the same PR condition due to the additional contact surface between the working fluid and the inserts [10]. Modifications to a single twisted tape, such as perforation, notching and jagged cutting, have been made by Rahimi et al. [19]. Numerical and experimental analyses have been conducted to select the best modification of the twisted tape. According to the results, jagged twisted tape yielded the largest value of η, followed by classic, notched and perforated twisted tapes. Even though the classic twisted tape yielded the strongest swirl flow among the modifications, the jagged twisted tape created a higher turbulence intensity field, especially at the jagged edge region, which led to better fluid mixing and higher Nu.
Most of the available modifications to the twisted tape yielded larger values of η than that of the classic twisted tape but showed a decreasing trend in η as Re increased. Tabatabaeikia, et al. [20], however, found out that perforated twisted tape and notched twisted tape do not give much difference in Overall Enhancement Ratio (η) as compared to other modifications. Eiamsa-ard et al. [21] investigated the effect of modified twisted tape with triangle/rectangular/trapezoidal wings (O- Tri/O-Rec/O-Tra/P-Tri/P-Rec/P-Tra) on heat transfer (h), friction factor (f) and Overall Enhancement Ratio (η). The result shows that the modified twisted tapes give higher η compared to classic twisted tape. Khoshvaght-Aliabadi and Eskandari [22] conducted an experimental analysis on the overall performance of a low-to-high twisted tape insert with a Cu/Water nanofluid. The results demonstrated that the low-to-high PR twisted tape yielded an increasing trend of η as Re increased. However, the maximum η value of the low-to-high twisted tape was lower than those of other modifications, such as RGPR and rotation of the twisted tape [23]. This is due to differences in terms of other parameters that influenced the system’s performance.
In addition to the modification of the twisted tape, the type, size, shape and volume fraction of the nanoparticles are important parameters for heat transfer augmentation [24]. Due to superior thermophysical properties, such as thermal conductivity (k), specific heat (cp), density (ρ) and viscosity (µ), a nanofluid is a superior substitute as a working fluid. However, similar to the inserts (twisted tape), the addition of nanoparticles into the system caused a higher ∆P due to the higher viscosity of the fluid [25]. Therefore, the selection of a suitable value of φ is important for ensuring that larger η is realized [26].Due to that, further exploration and analysis are necessary of the type of nanofluid and the value of φ that can result in an increasing value of η as Re increases. Vajjha and Das [27] analyzed the effects of three types of nanofluids (CuO, Al2O3 and SiO2) on the pumping power of a system. All types of nanofluids required less pumping power than water at 2% of φ. However, at 43% of φ, the CuO/Water nanofluid required more pumping power than water due to an additional pressure drop and higher fluid viscosity. Previous experimental and numerical studies were all carried out based constant PR twisted tape. Therefore, the effect of dynamic PR (different pitch ratio at inlet and outlet) towards improvement of η was not studied. Therefore, the main aim of this technical study is to study the effect of dynamic PR on a given twisted tape arrangement towards the improvement of fluid flow, heat transfer, friction loss and ultimately η. Determining the most optimum nanofluid that works best with such configuration is also part of the study. So, the objective of the study is to investigate the turbulent forced convection flow of Al2O3/Water and SiC/Water at different φ with two different types of modified twisted tape inserts: Increasing Pitch Ratio (IPR) and Decreasing Pitch Ratio (DPR). TT IPR and TT DPR are different from the classic twisted tape due to variation in PR from the inlet to the outlet. The effect of Re, φ and type of modified twisted tape to the Nu, f and η will be analyzed numerically and experimentally. The analysis is conducted under constant wall heat flux with Re from 4000 to 16,000.

2. Materials and Methods

Research methods are comprising of two categories: numerical and experimental methods. The analysis was first conducted using numerical and later validated through experimental methods. Results from both methods are compared and analyzed.

2.1. Numerical Method

The geometry and dimensions of the twisted tape are presented in Figure 1. The first geometry is classic TT with PR equal to 2, the second geometry is TT IPR with PR of 1.5 at the inlet and increasing by 0.25 towards the outlet, and the third geometry is TT DPR with PR of 6 at the inlet and decreasing by 0.25 towards the outlet. Al2O3/Water and SiC/Water nanofluids flow in a circular tube that is equipped with twisted tape for various values of φ (1–3%). The full images of the test sections are illustrated in Figure 2. Table 1 presents the values of the defined parameters. Turbulent flow is chosen for the simulation analysis because it is more relevant to the practical scenario. The prediction of the turbulent flow model and the heat transfer behaviour are considered in the selection of the most relevant mathematical model. A simulation analysis is conducted using the ANSYS Fluent software 16.1 [28].

2.1.1. Simulation and Boundary Condition

The pressure-based finite volume method is used to conduct the simulation. The SIMPLE algorithm is used for velocity-pressure coupling [29]. To discretize the turbulent kinetic energy, the momentum, the turbulent dissipation rate, and the energy equations, the second-order upwind scheme is employed. The convergence criteria for the residues of the continuity, the momentum, the velocities, and the energy are set to 10−6. The Al2O3/Water and SiC/Water nanofluids enter the test section at an inlet temperature Tin, which is set to 300 K. For the inlet, the velocity-inlet condition is applied, while the pressure-outlet condition is applied at the outlet. The heat flux at the tube wall is maintained at a constant value of 1000 W/m2.

2.1.2. Governing Equations

Three Navier-Stokes equations for the swirl-dominant turbulent flow are solved: continuity, momentum and energy equations. The assumptions that were adopted in the modelling of the fluid flow and the heat transfer process inside the tube with twisted tape are steady 3-D flow, constant fluid properties, and neglect of the natural and thermal radiation. The twisted tape produced a swirl flow inside the tube. Hence, the RNG k-ɛ epsilon model with the enhanced wall treatment method is selected for the prediction of the turbulent flow characteristics inside the tube due its performance in analysing the small scale of the flow and the swirl-dominant flow with a reasonable computation time. The RNG k-ɛ model is derived from the instantaneous Navier Stokes equation via the “renormalized group” (RNG) method. Two transport equations for the turbulent model are as follows:
t ρ k + x i ρ k u i = x i α k μ e f f k x j + G k + G b ρ ϵ Y M + S k
t ρ ϵ + x i ρ ϵ u i = x j α ϵ μ e f f ϵ x j + C 1 ϵ ϵ k G k + C 3 ϵ G b C 2 ϵ ρ ϵ 2 k R ϵ + S ϵ
where Gk denotes the generated turbulence kinetic energy that is due to the mean velocity gradients; Gb denotes the generated turbulence kinetic energy that is due to the buoyancy; YM denotes the contribution of the fluctuating dilatation in compressible turbulence to the overall dissipation rate; αk and αє are the inverse effective Prandtl numbers for k and є, respectively; and Sk and Sє are user-defined source terms. The effective viscosity is expressed as
μ t = ρ C μ k 2 ϵ
All the constant values for the transport equations are presented in Table 2. Although nanofluid is the mixture of nanoparticles and base fluid, which in general is a two-phase liquid, it is assumed that the nanoparticles can be easily fluidized and it is valid to be considered as a conventional single-phase (homogenous) fluid having average physical properties of individual phases [30,31]. The thermophysical properties of the nanofluid are calculated by employing a single-phase model assumption that neglects the temperature-dependence of thermophysical properties and nanoparticles Brownian motion [32]. The expressions of nanoparticles properties are as follows:
Density [33]:
ρ n f = 1 φ ρ f + φ ρ p
Specific heat [34]:
C p , n f = 1 φ ρ f C p , f + φ ρ p C p , p ρ n f
Viscosity [35]:
μ n f = μ f 1 ϑ 2.5
Thermal conductivity [36]:
k n f k f = k p + 2 k f + 2 φ k p k f k p + 2 k f φ k p k f
k n f k f where φ is the nanoparticle volume fraction (1%, 2% and 3%), and f and p denote fluid and particle, respectively.

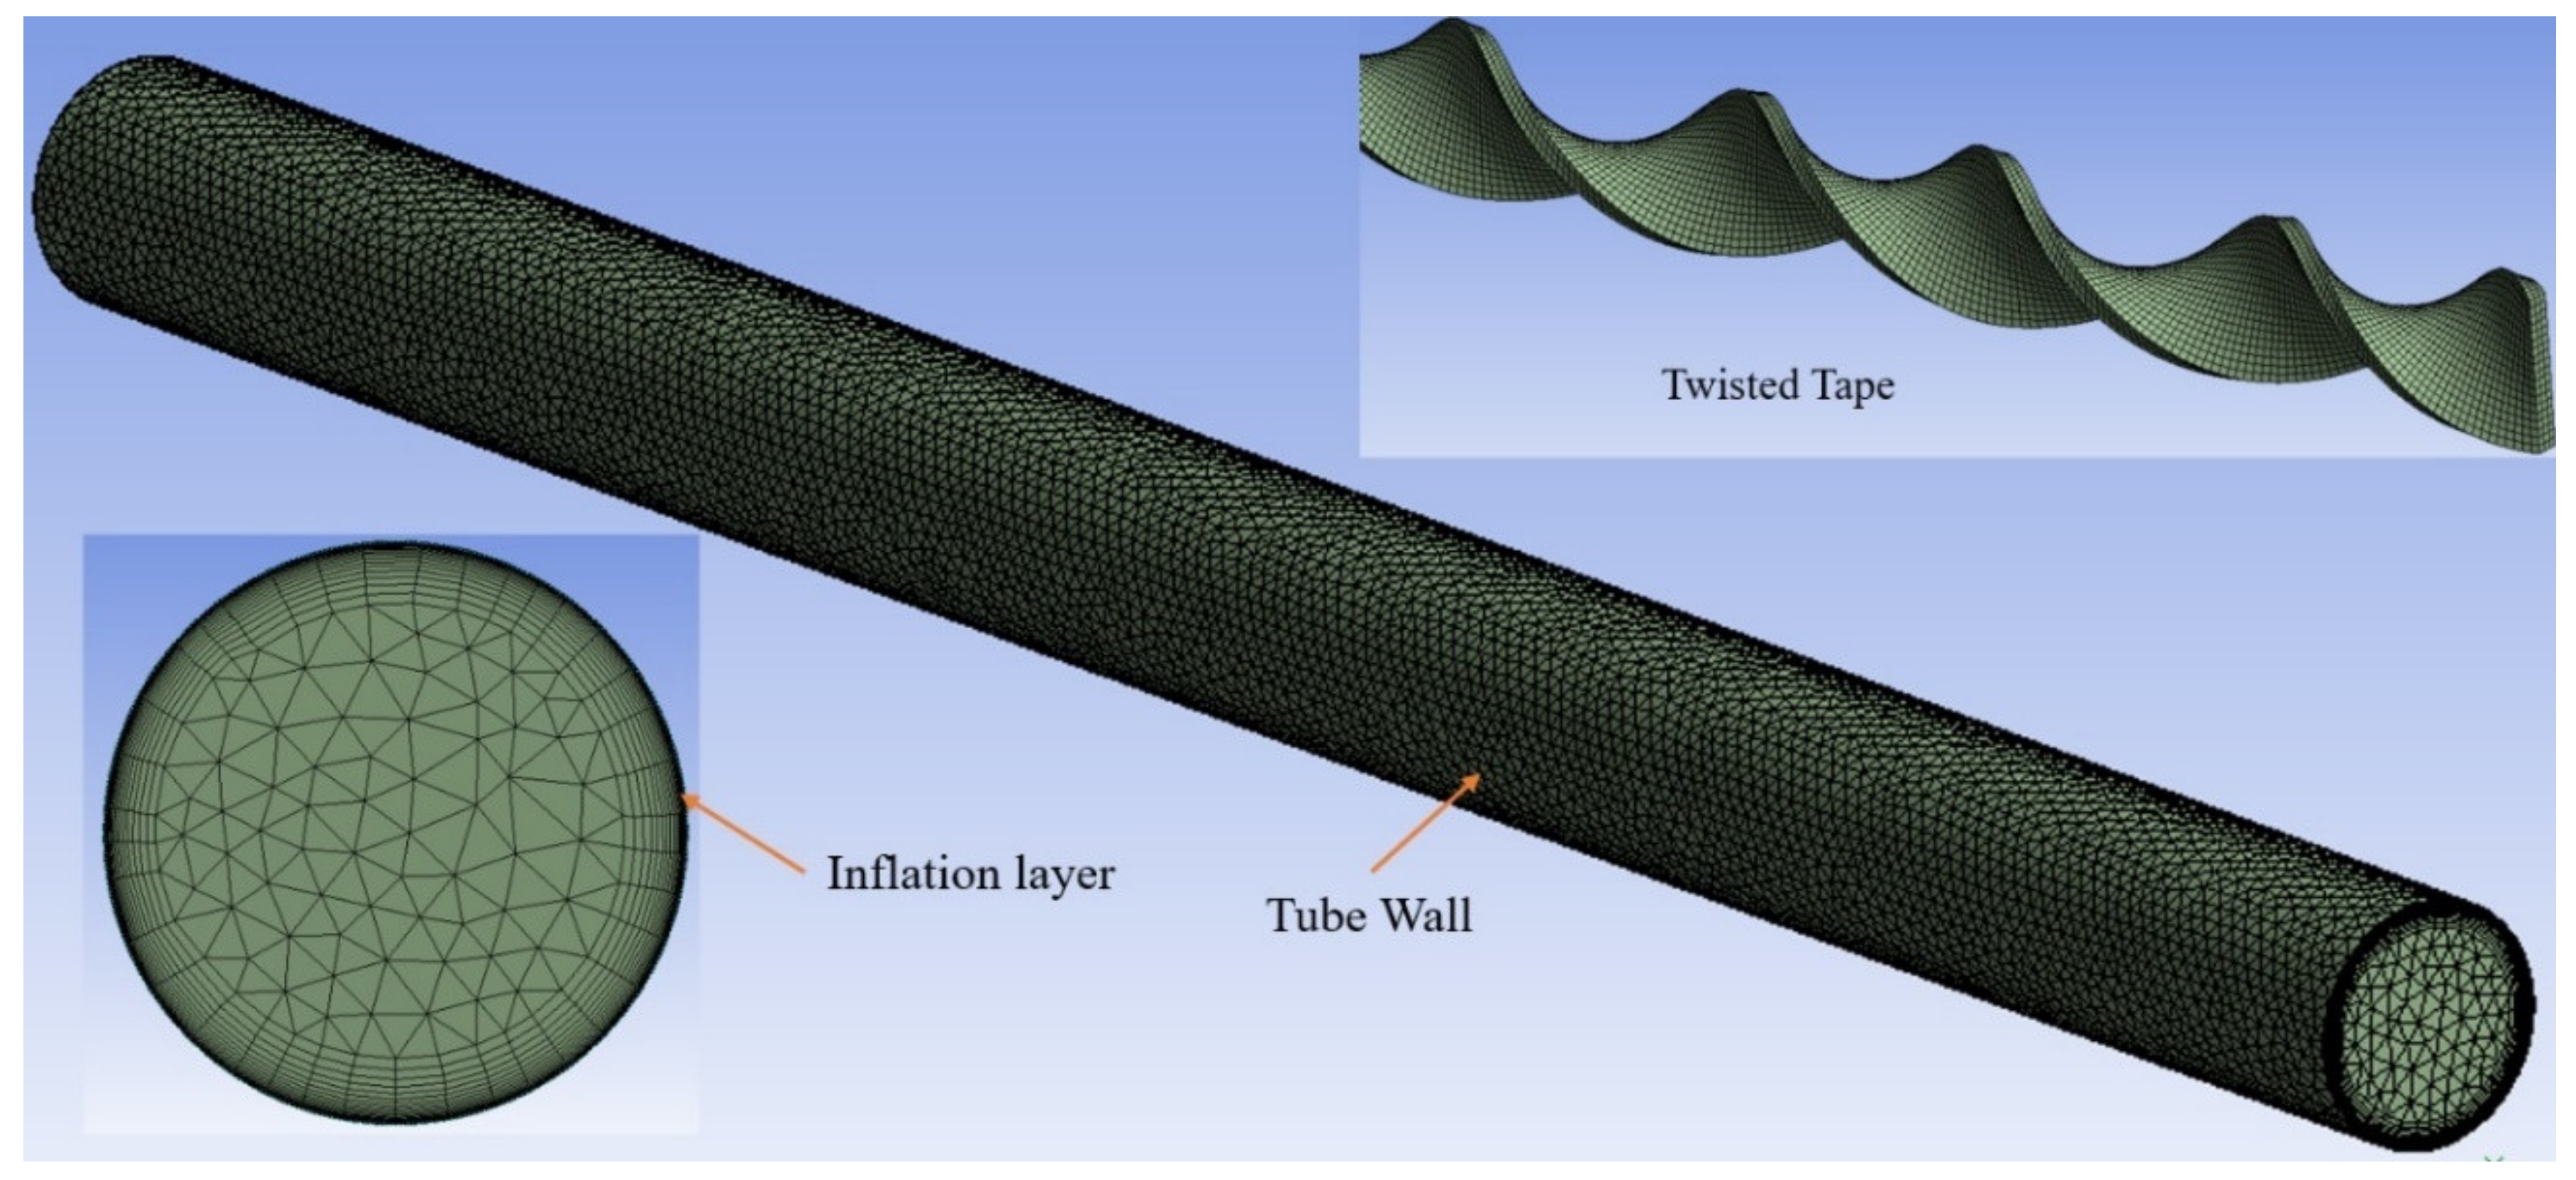
2.1.3. Mesh Generation

Figure 3 presents the generated mesh of the physical model, the twisted tape and the circular tube. Inflation-layer mesh control is applied at the tube wall to accurately simulate the boundary-layer region where the velocity and temperature are rapidly changing. Tetrahedral grids are used to generate the mesh at the tube wall due to the temperature–boundary–layer region. Fine mesh sizing is employed on the twisted tape to capture the narrow and curved regions of the tape. To ensure that the selected mesh does not depend on the cell size, a grid independence test is conducted using TTPR2 twisted inside a circular tube with water as the working fluid. Table 3 summarizes the values of Nu and ∆P that were obtained for four numbers of cells under the same simulation conditions. The main objectives of the test are to ensure that the selected grid mesh yields satisfactory accuracy within a reasonable computation time [13]. The results demonstrate that the differences in Nu and ∆P among the four selected grids are relatively small, namely, less than 1%. Even though a grid with 1,134,125 cells yields the largest values of Nu among the grids with the examined numbers of cells, it takes four times longer to converge than the grid with 519,393 cells. Hence, the grid with 519,393 cells is selected for simulation.

2.2. Experimental Method

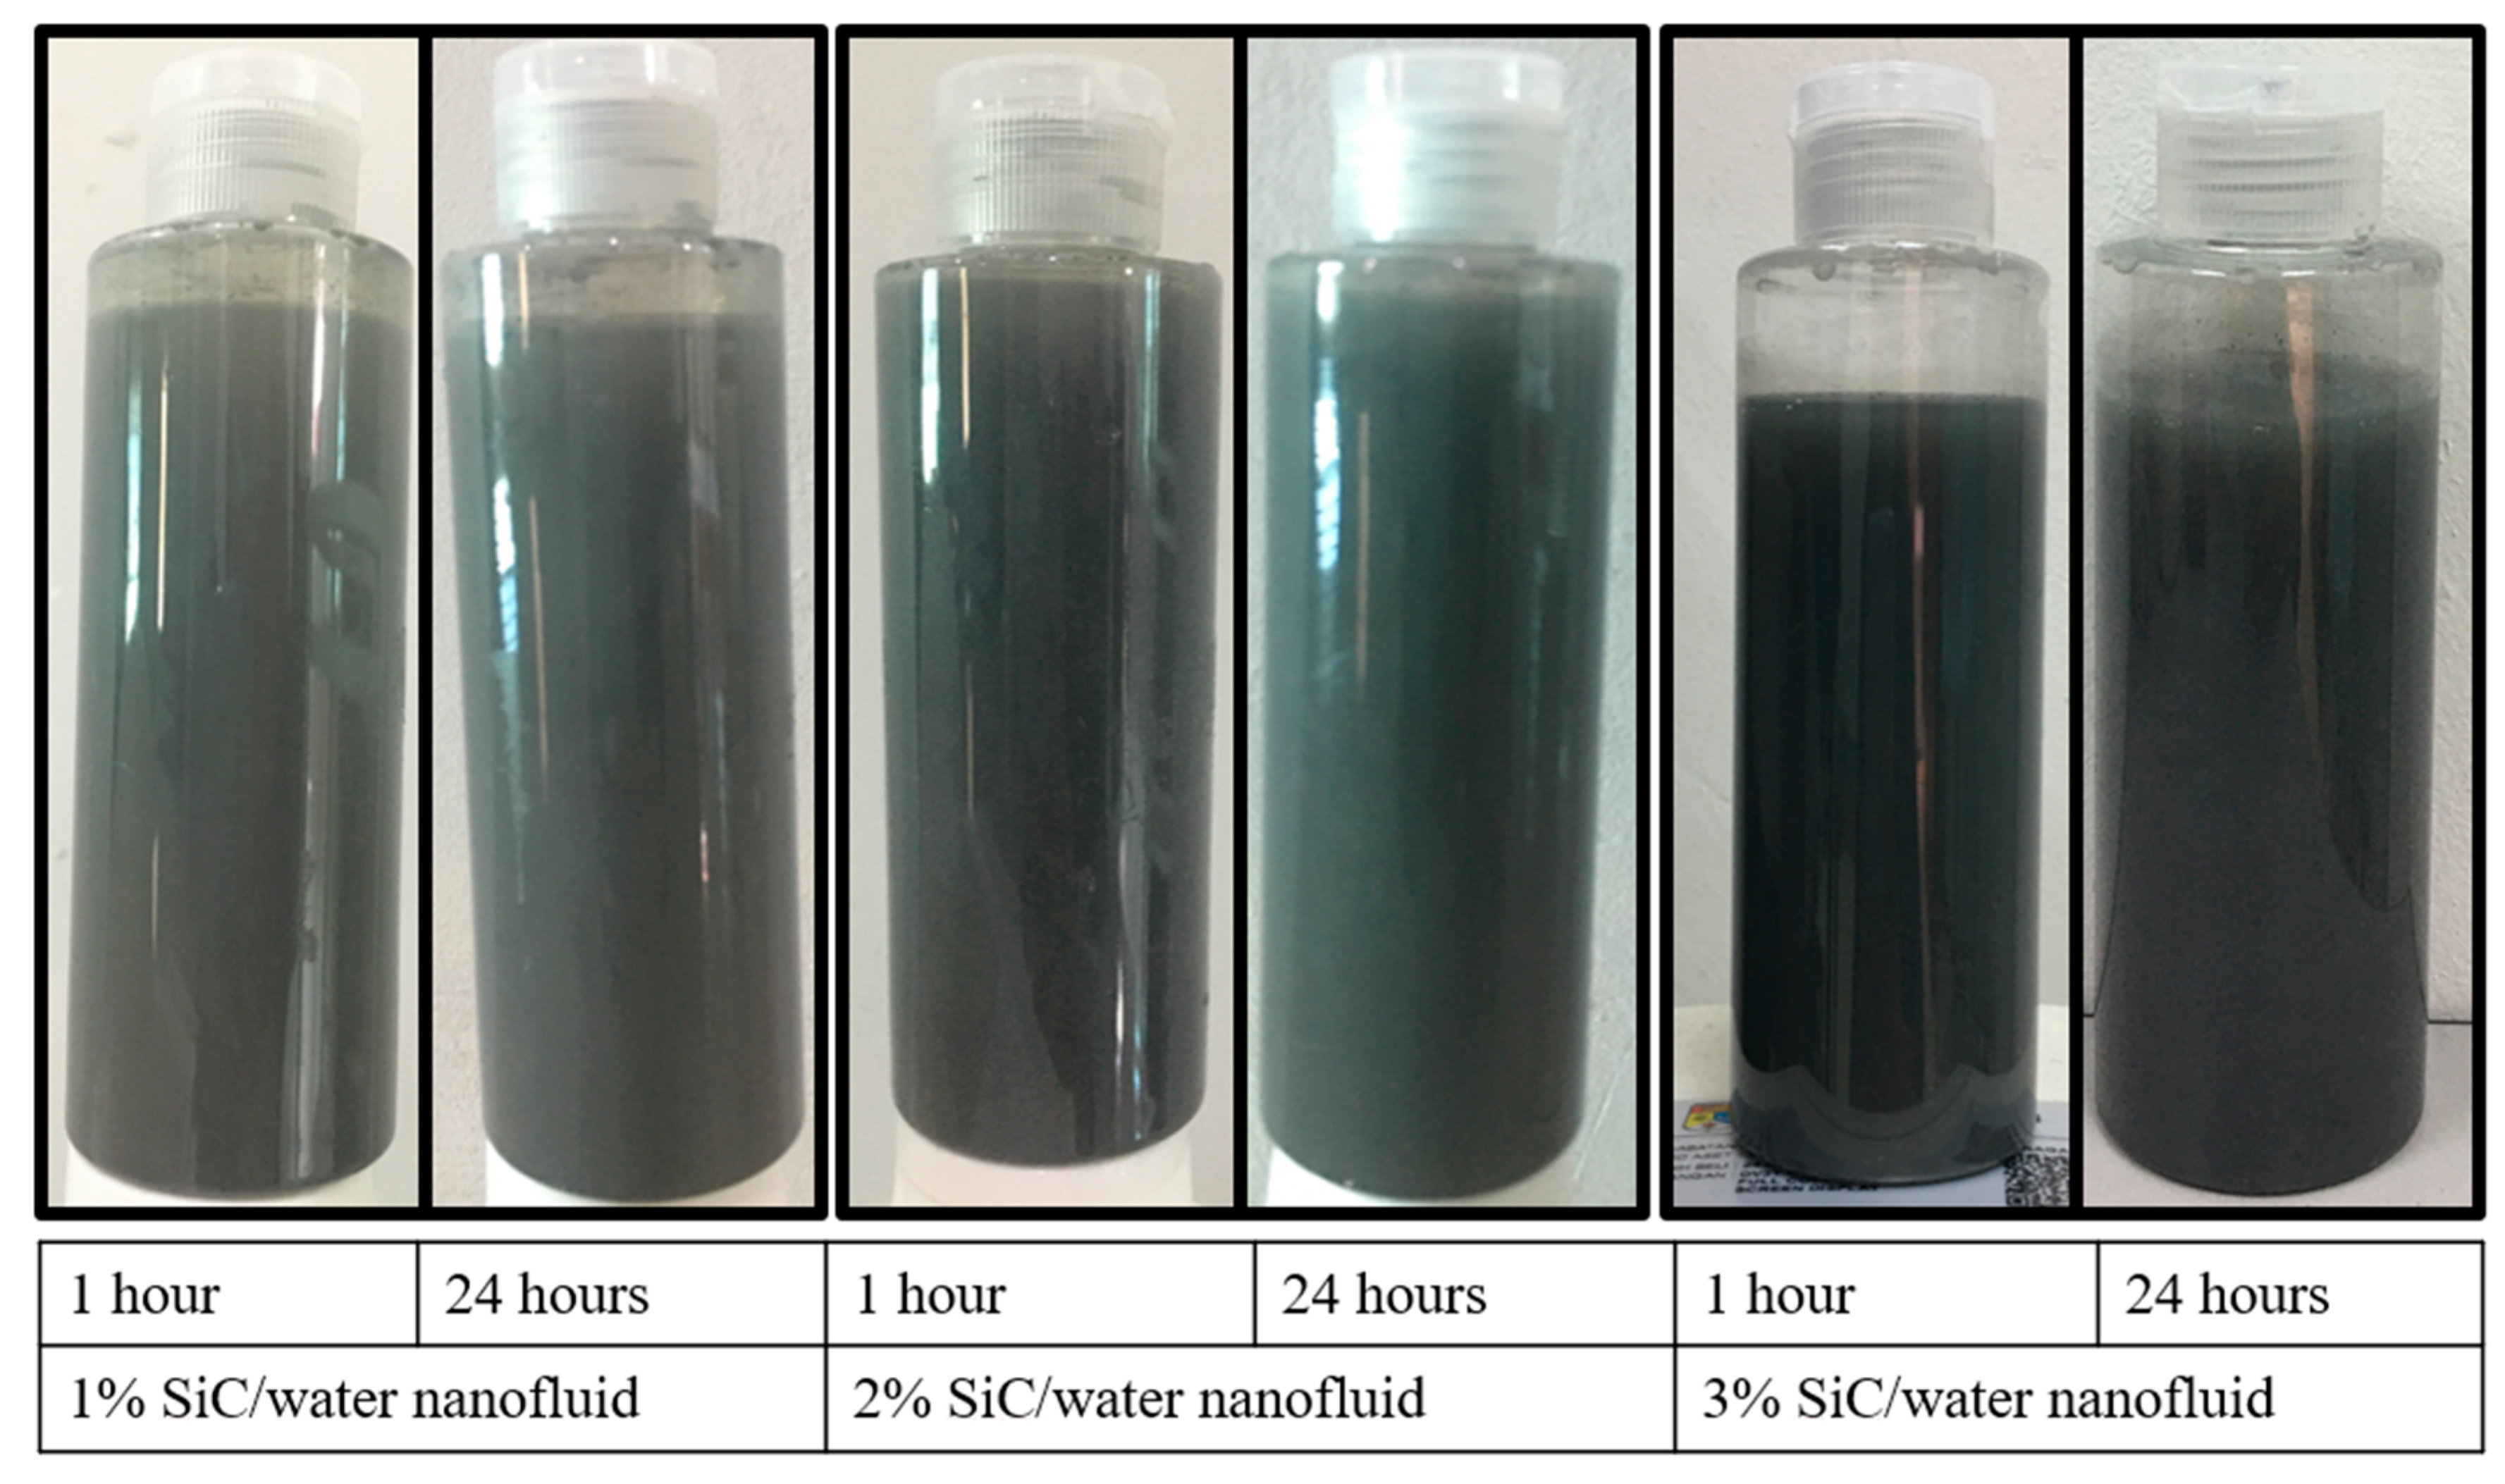
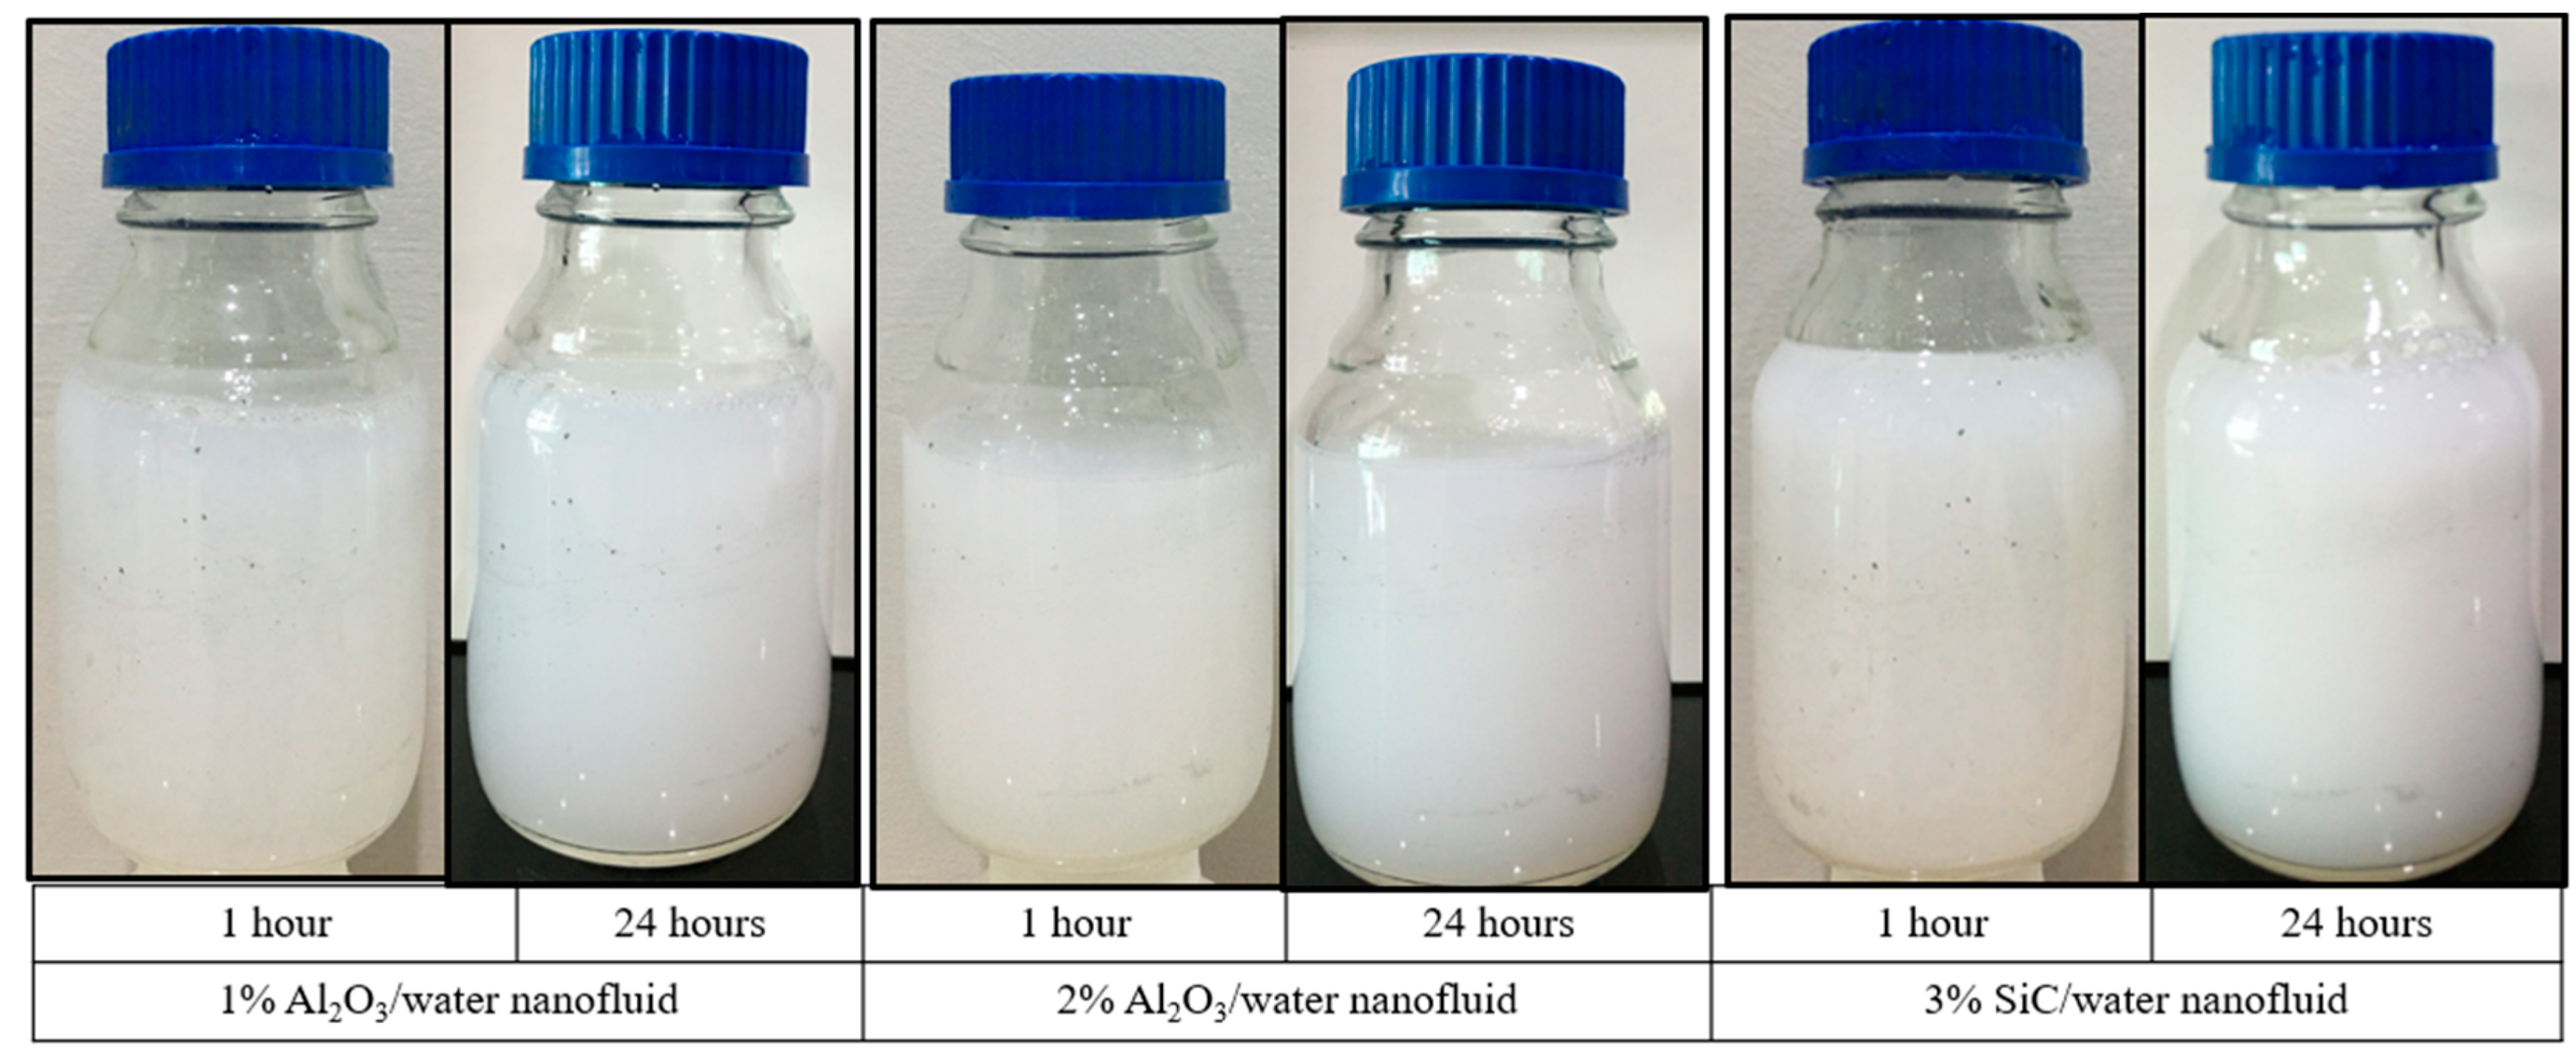
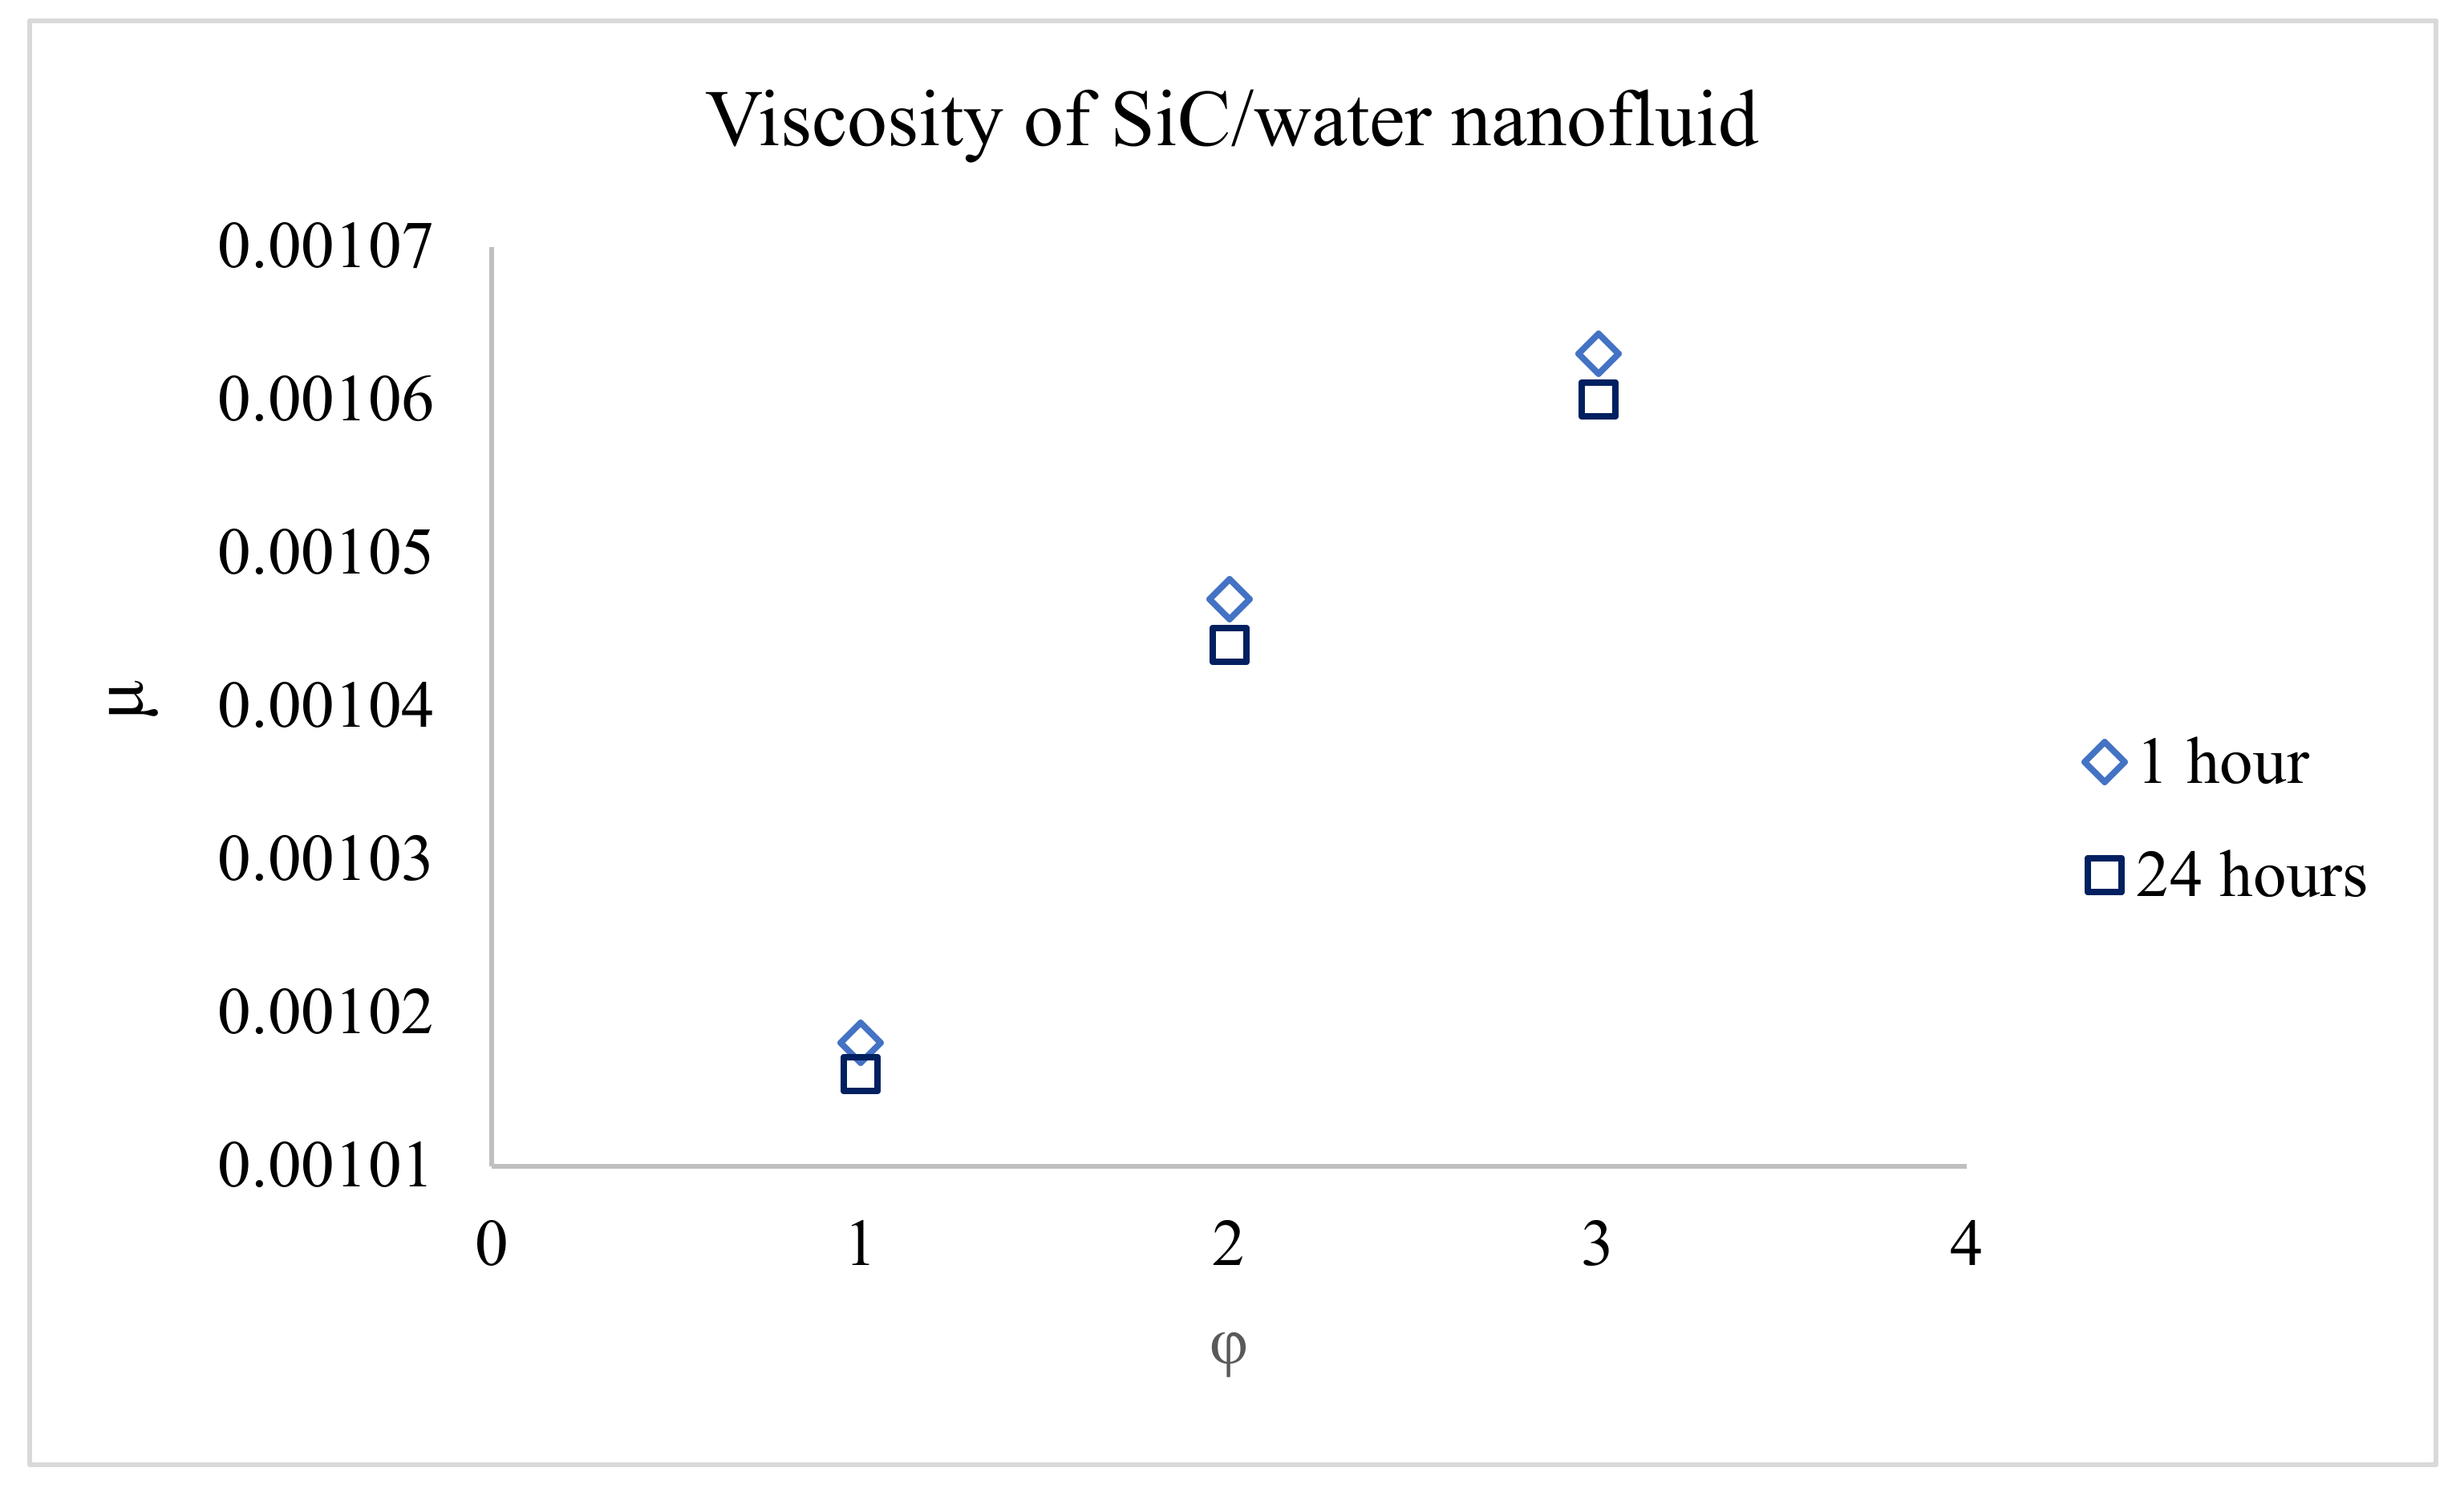
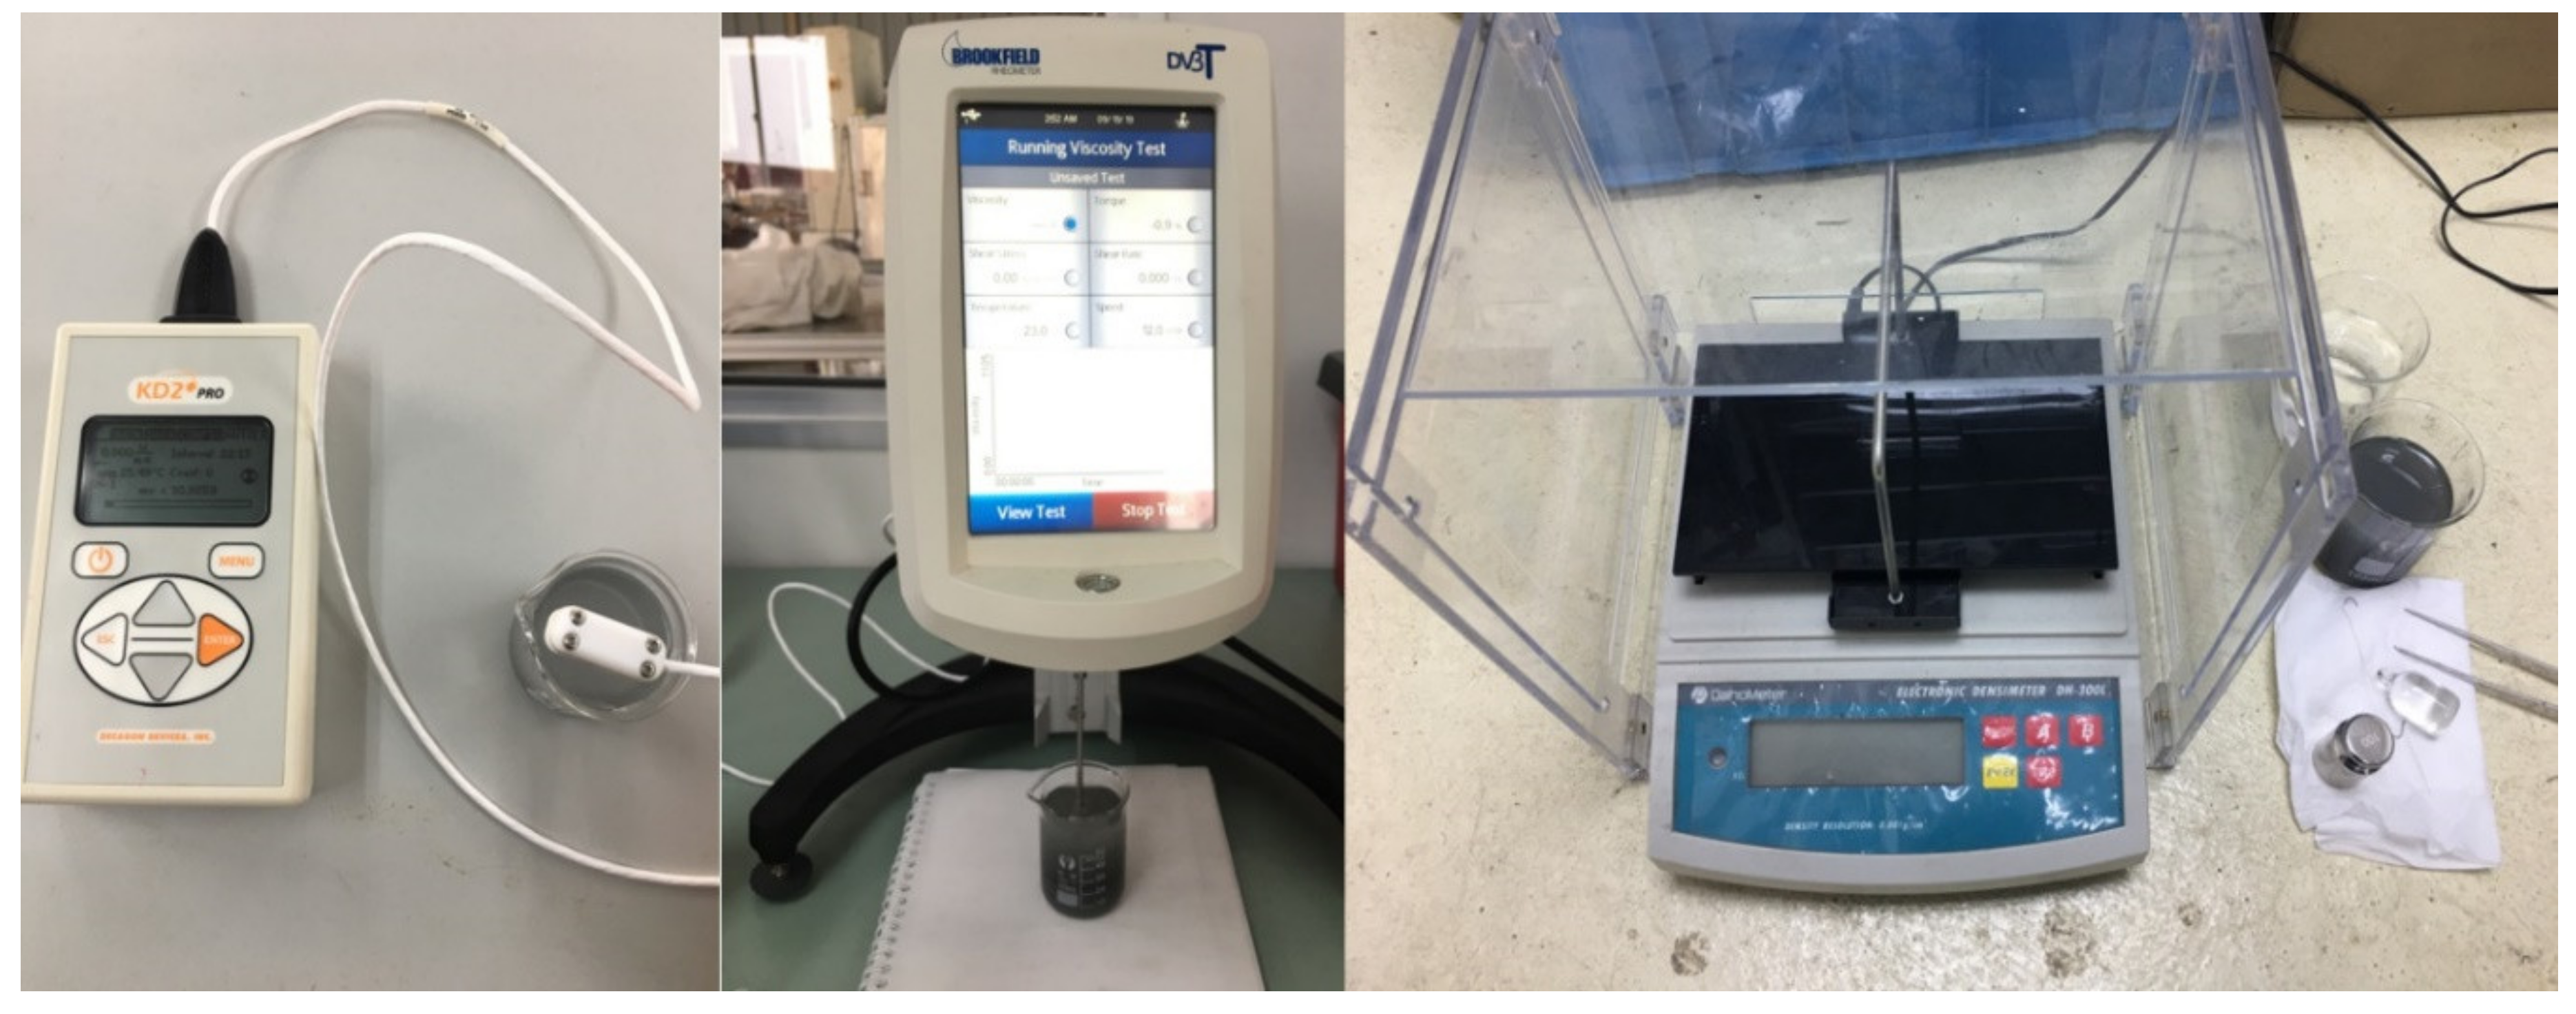
2.2.1. Preparation and Characterization of Nanofluid

Two type of nanoparticles with the same diameter and shape are selected to produce nanofluid; SiC and Al2O3. Field Emission Scanning Electron Microscopy is used to check on the particles size and shape. Result showed that both SiC and Al2O3 nanoparticles are approximately circle with 40 nm diameter, which is in agreement with the datasheet from the supplier. Two-step method is used to produce nanofluid due to its lower cost and being more practical in producing a higher volume of nanofluid. The minimum amount of nanofluid that needs to be produced for one run of the experiment is 7 litres. Nanofluid is prepared by dispersing nanoparticles with the desired amount (1%, 2% and 3%) into distilled water (base fluid) by using sonication bath. The mixture is well homogenized at 120W, 40 kHz and 328 K with 2 hrs of sonication time. The stability of nanofluid is checked through visual inspection and viscosity measurement. After 24 h, there is no trace of sedimentation at the bottom of the SiC/Water and Al2O3/Water nanofluid (shown in Figure 4 and Figure 5). Figure 6 shows the viscosity values for both SiC/Water and Al2O3/Water nanofluid after 1 h and 24 h of preparation at the same temperature (298 K). The difference in viscosity is very small (approximately 0.19% difference), hence the nanofluid is considered stable during the period the experiments are conducted (within 24 h). Thermal physical properties of nanofluid are characterised by measuring thermal conductivity (k), specific heat (cp), viscosity (μ), and density (ρ). The equipment used to measure all the thermal physical properties are Kd2 Pro Thermal Properties Analyzer, Brookfield Rheometer DV3T-7 inch and electronic densimeter DH-300L (shown in Figure 7). The reading for each property is taken three times and the mean value is used for the analysis.

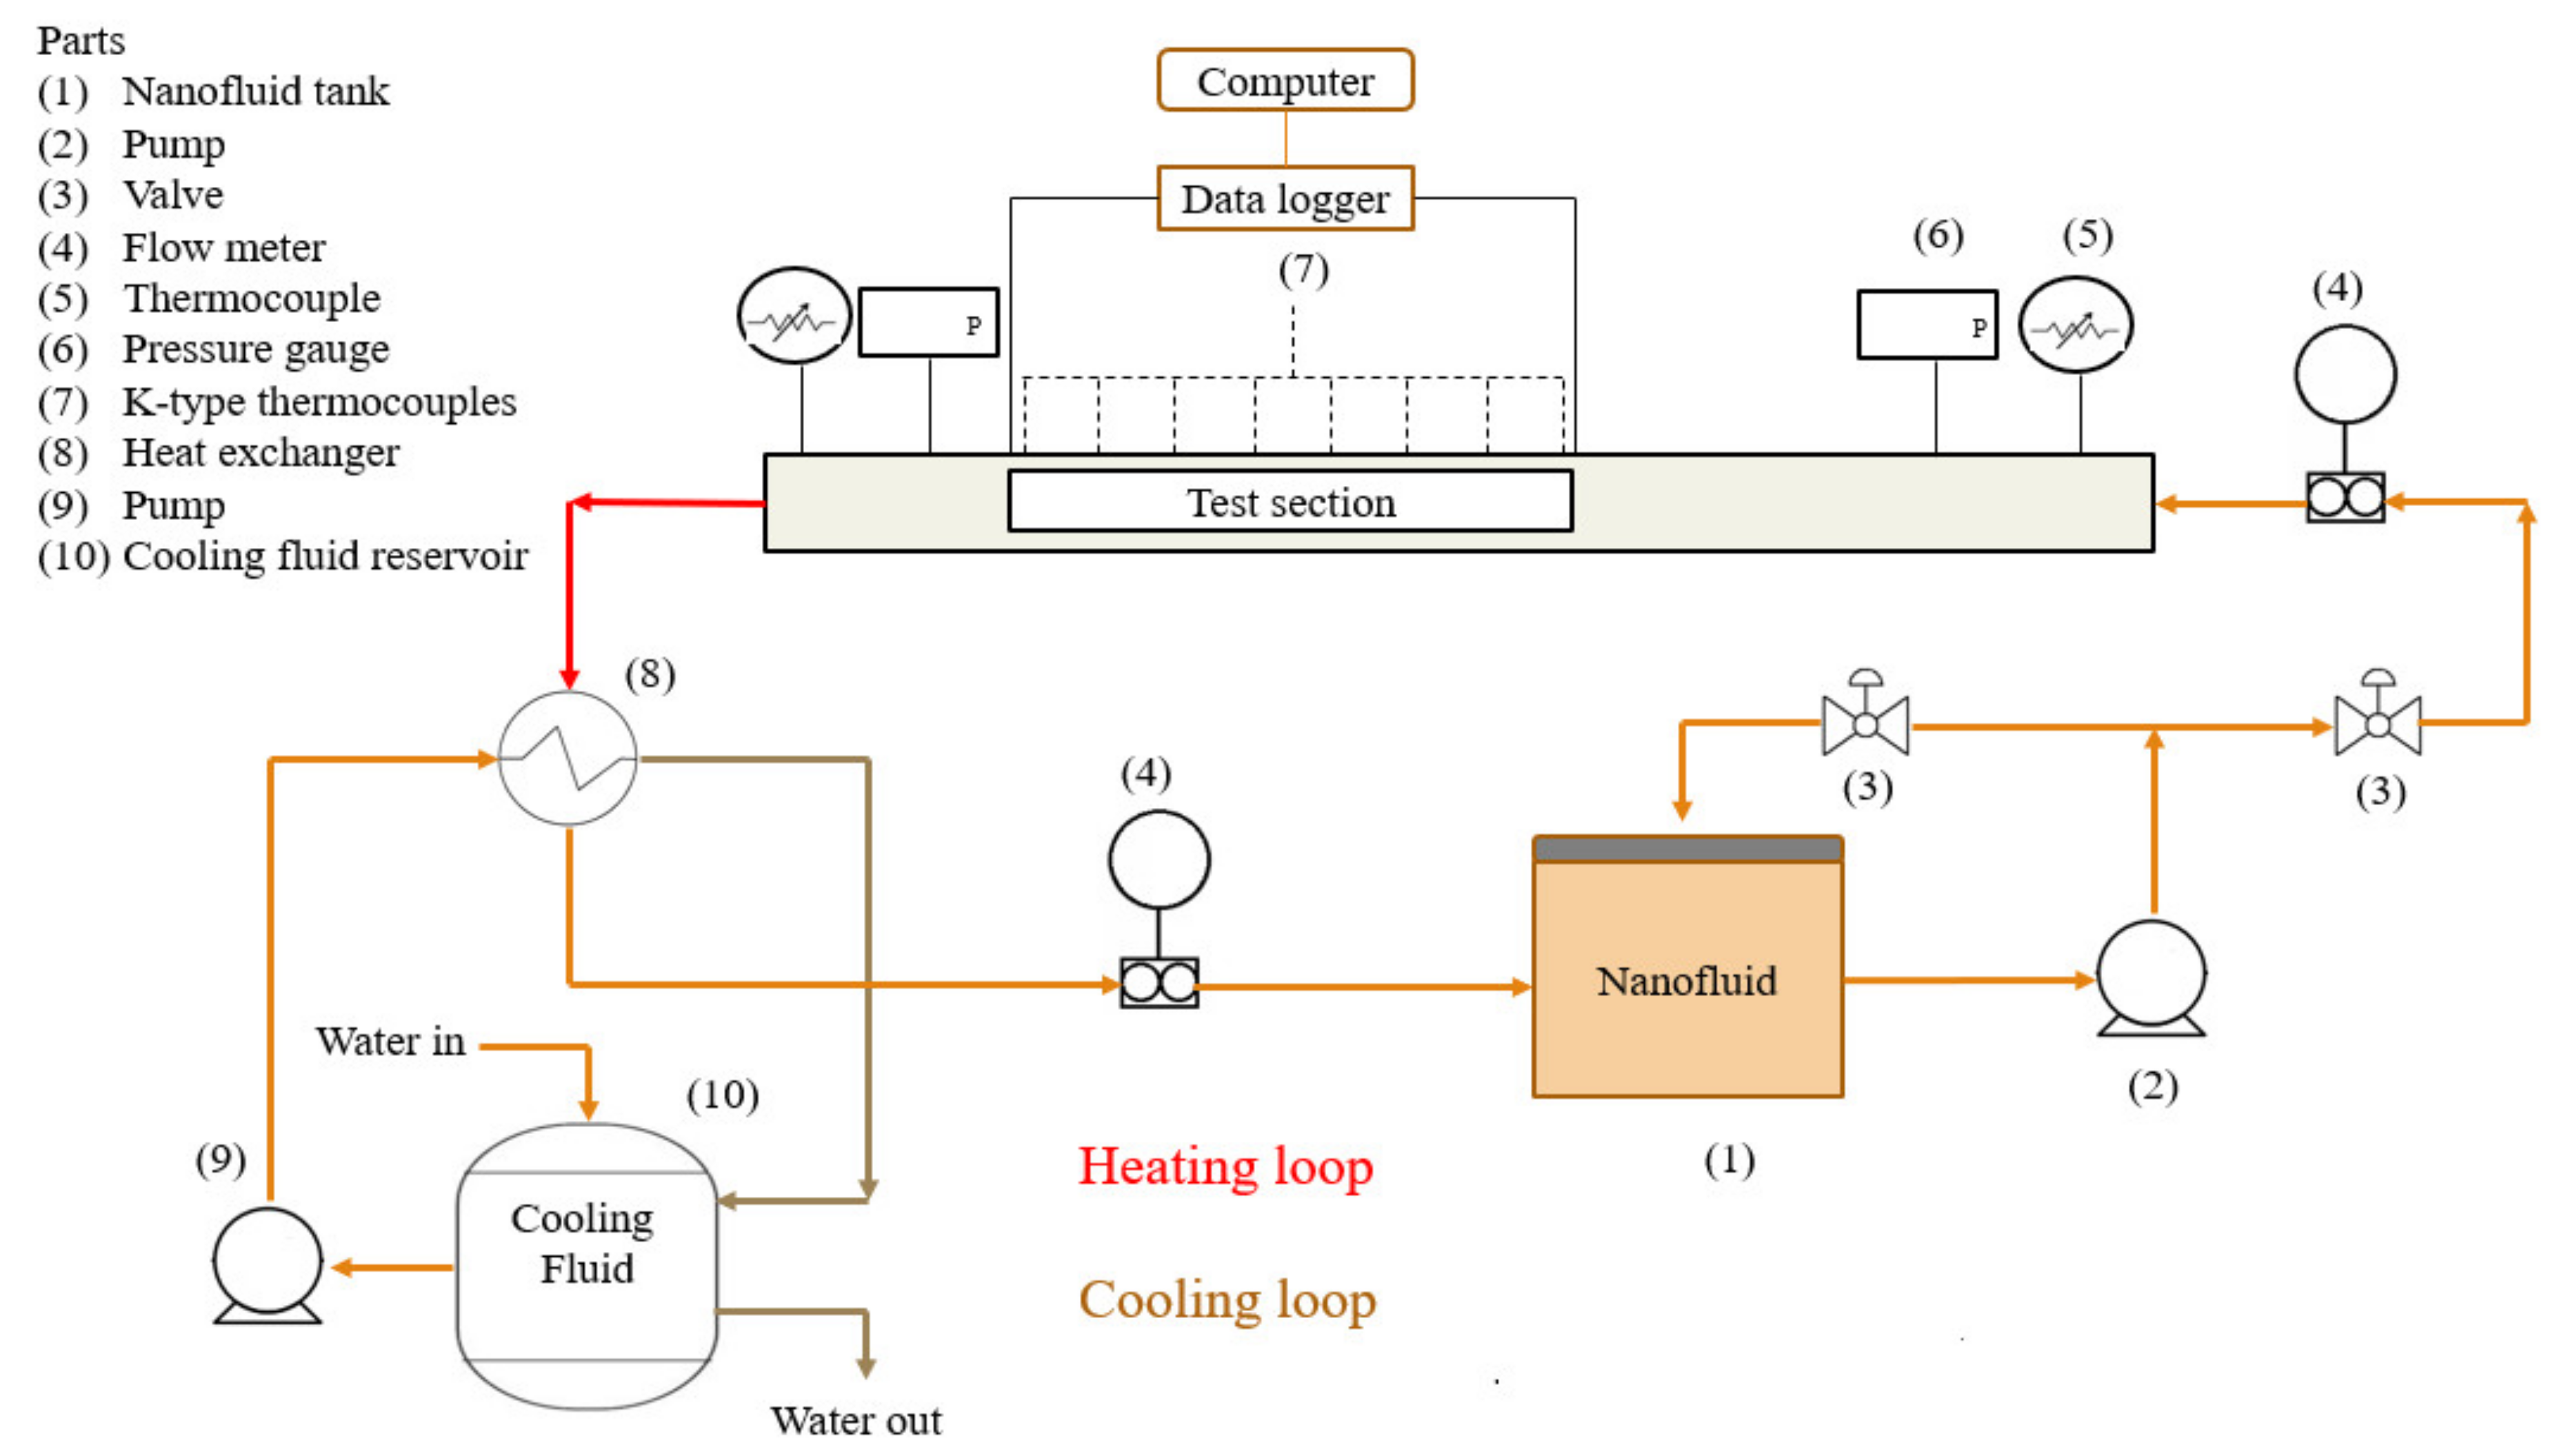
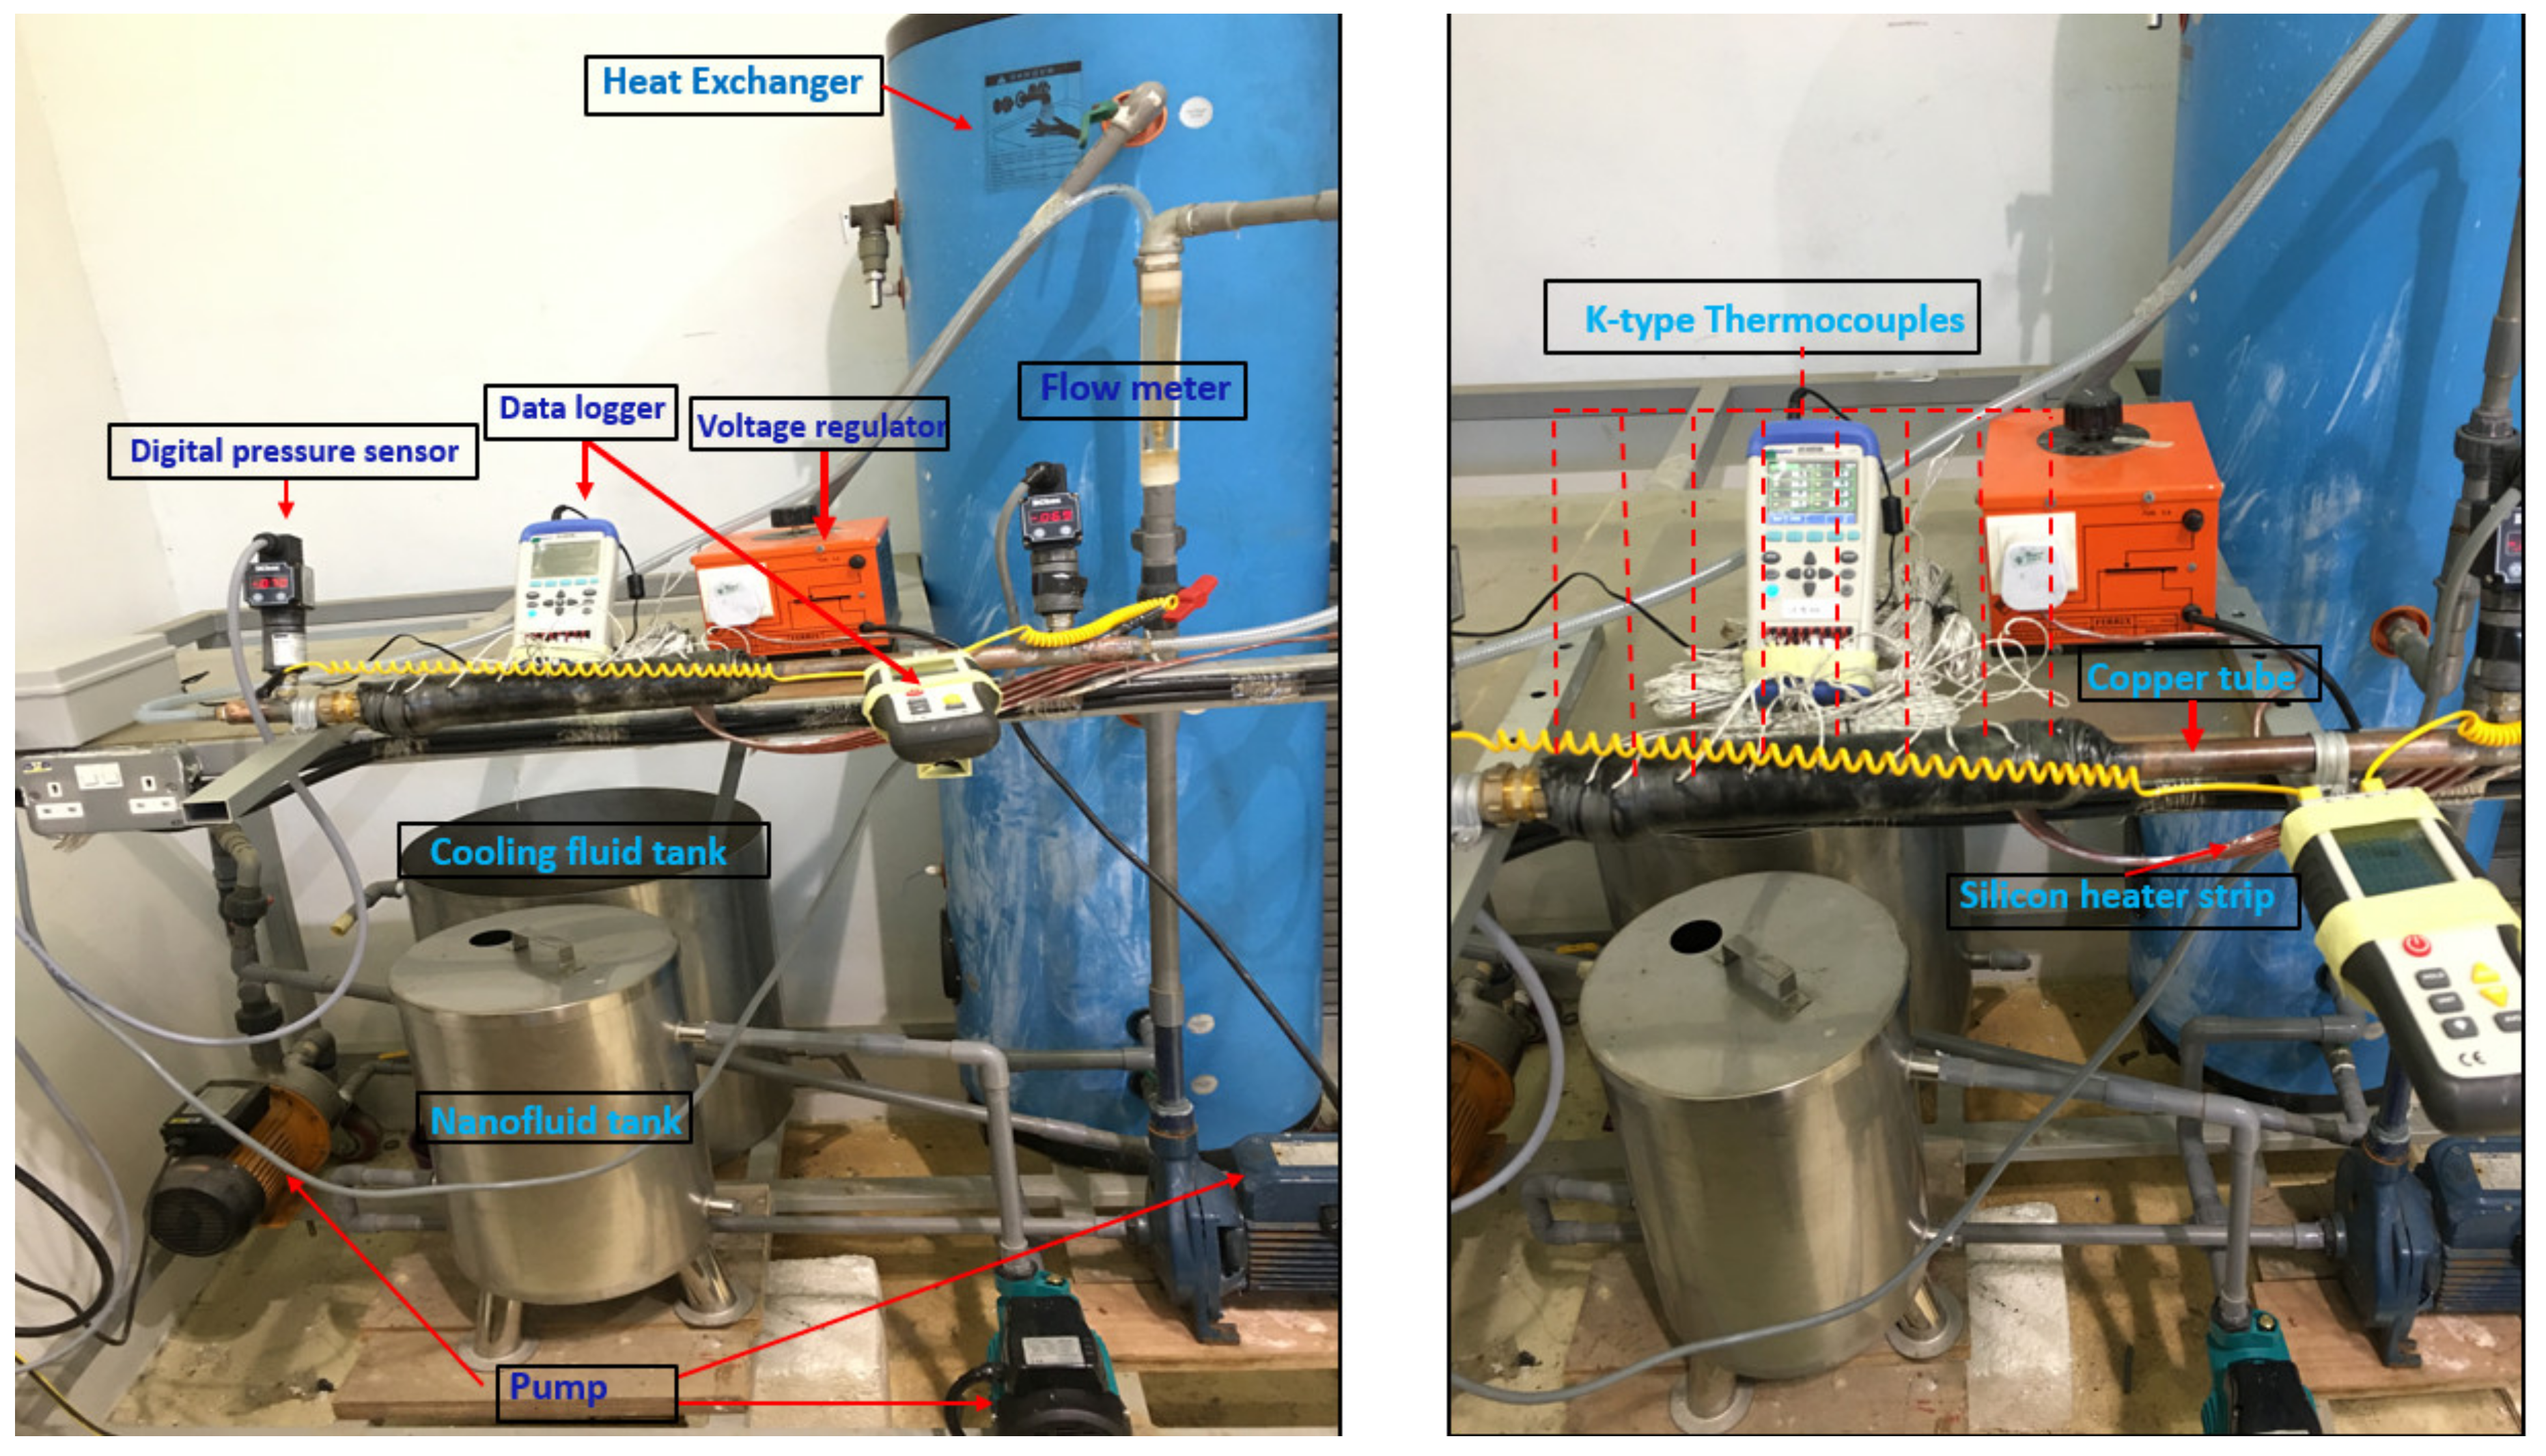
2.2.2. Experimental Setup

The schematic diagram of the experimental setup that consisted of a 1) heating loop, 2) cooling loop, 3) test section, and 4) twisted tape is shown in Figure 8. Nanofluid is flowing from the nanofluid tank at room temperature (~300K) through a flow meter (used to set the inlet velocity of the working fluid) into a copper tube. Pressure sensors and K-type thermocouples are inserted at the inlet and outlet of the copper tube to measure both the inlet and outlet pressure and temperature. From the test section, the heated nanofluid will flow through a heat exchanger to release the heat before flowing into the nanofluid tank, and the cycle continues. The experiment is set up in the Solar Energy Research Institute (SERI), UKM as shown in Figure 9.

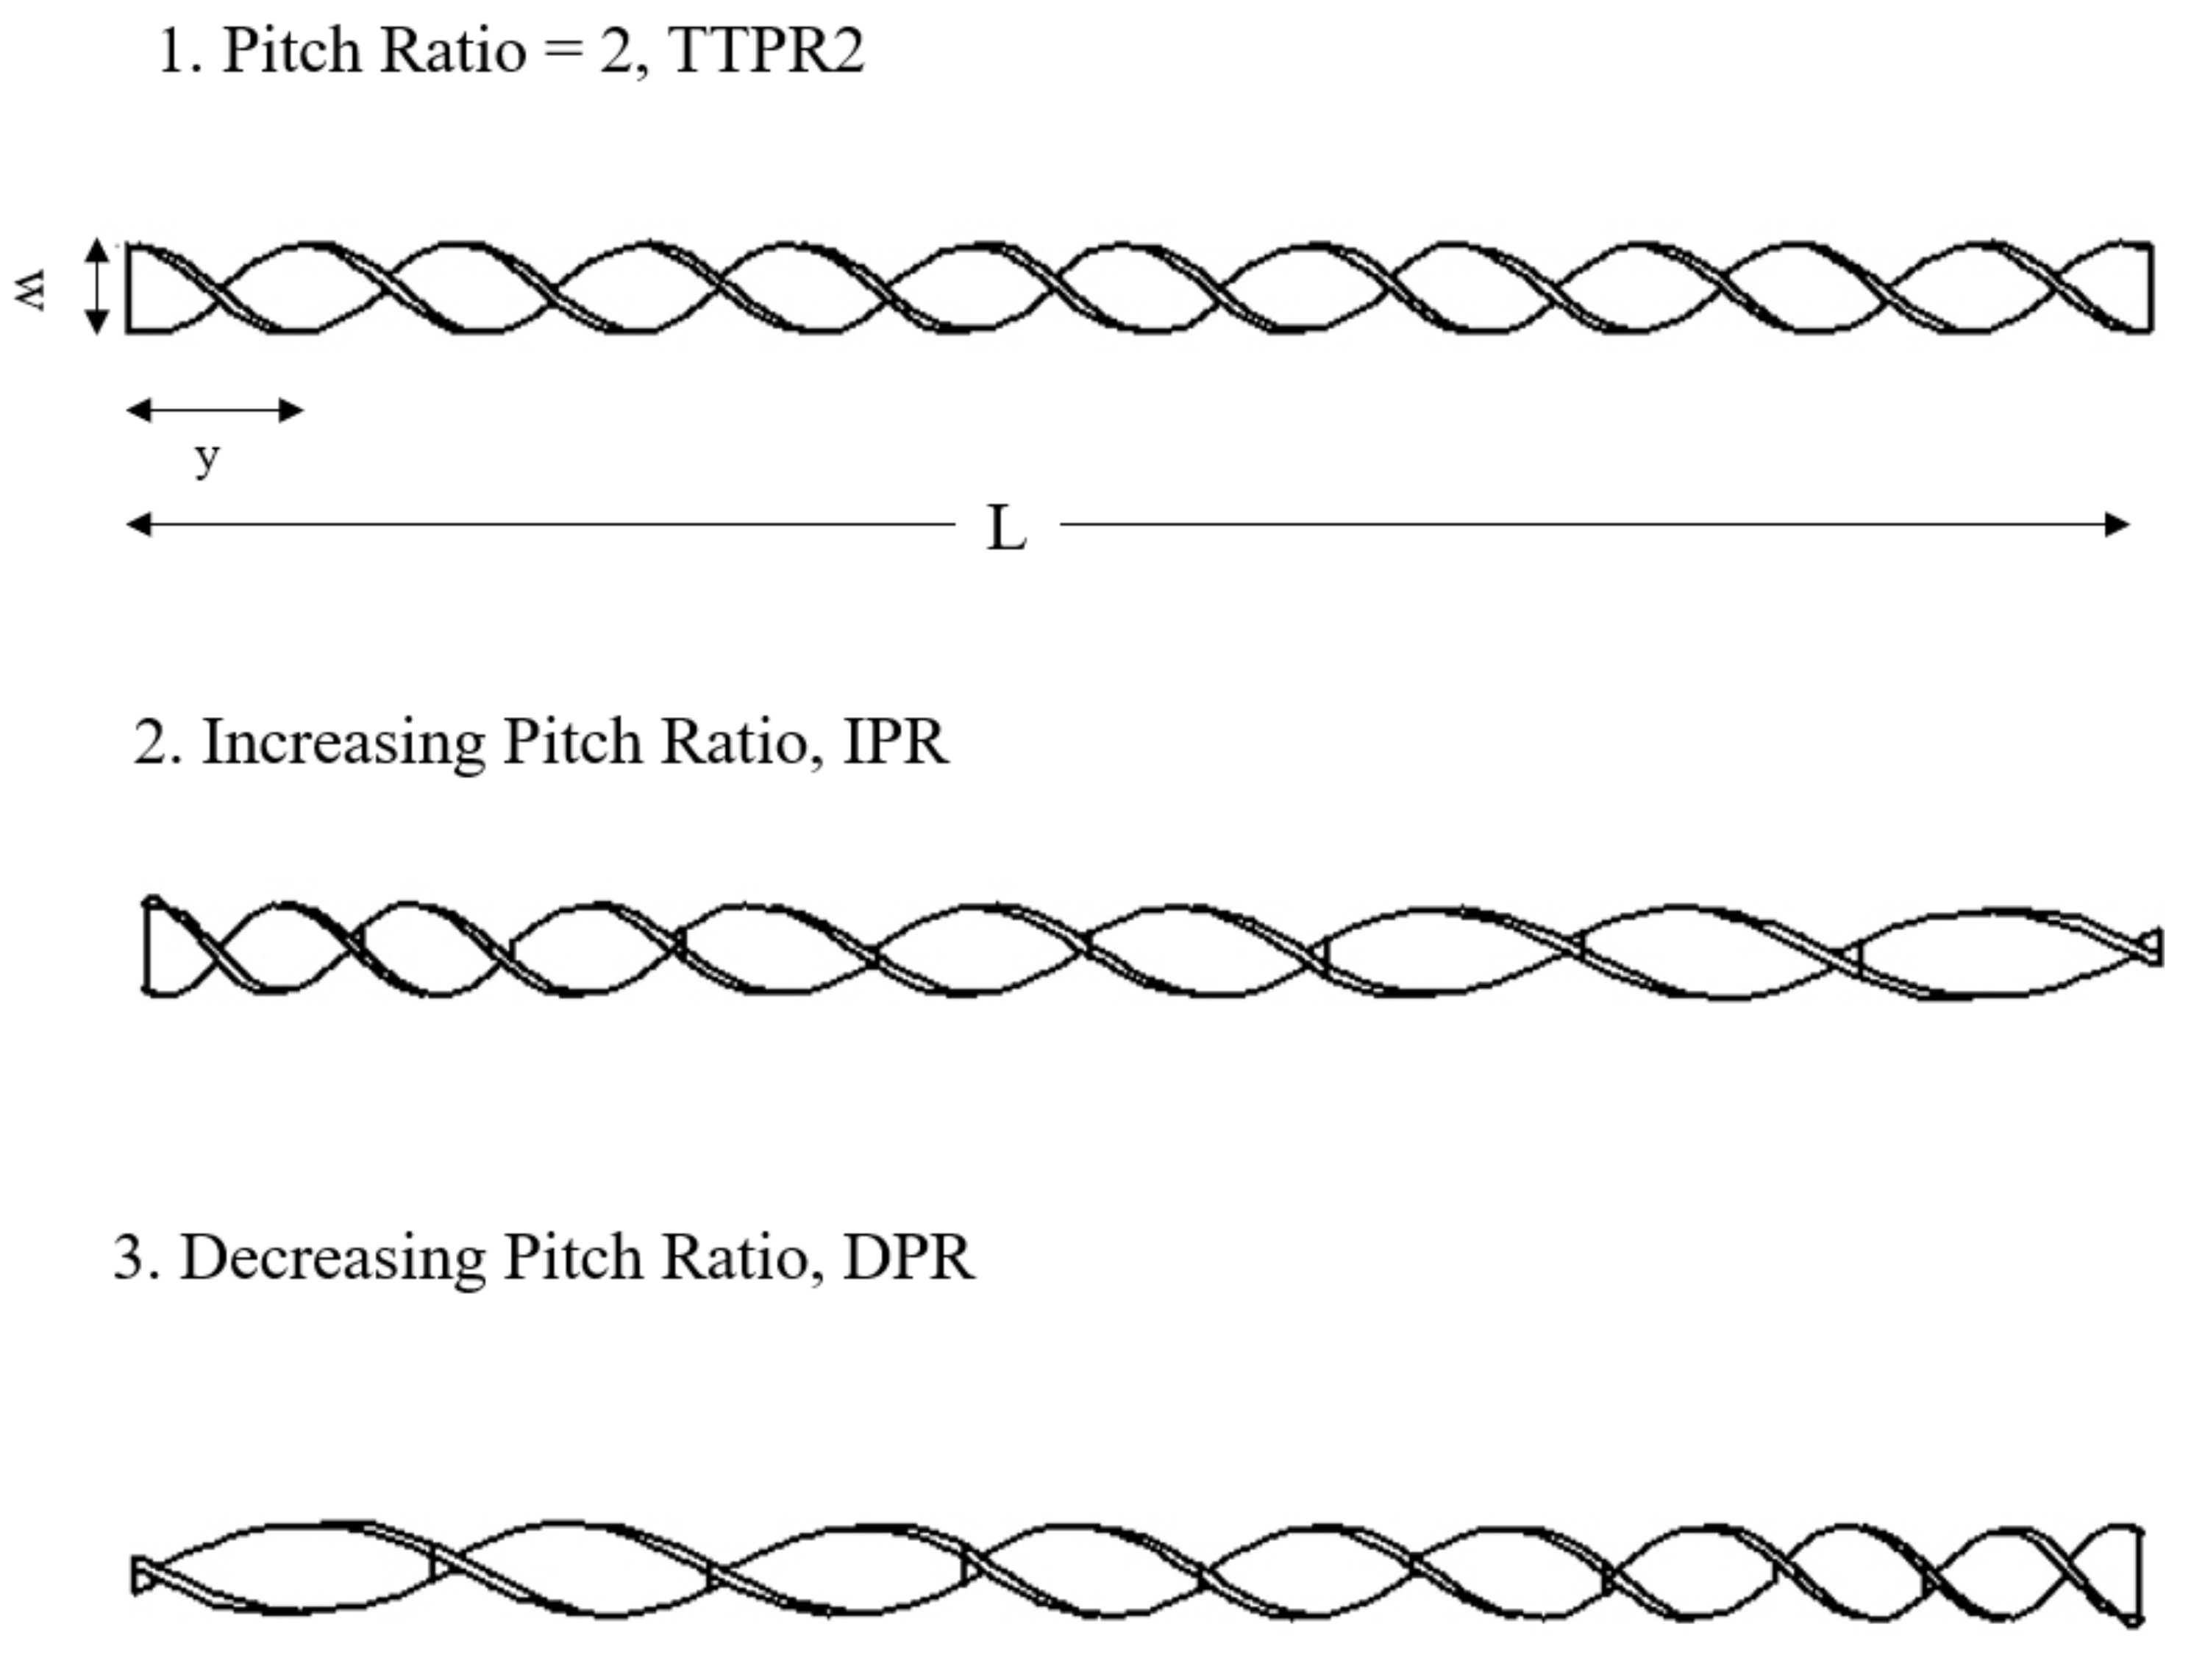
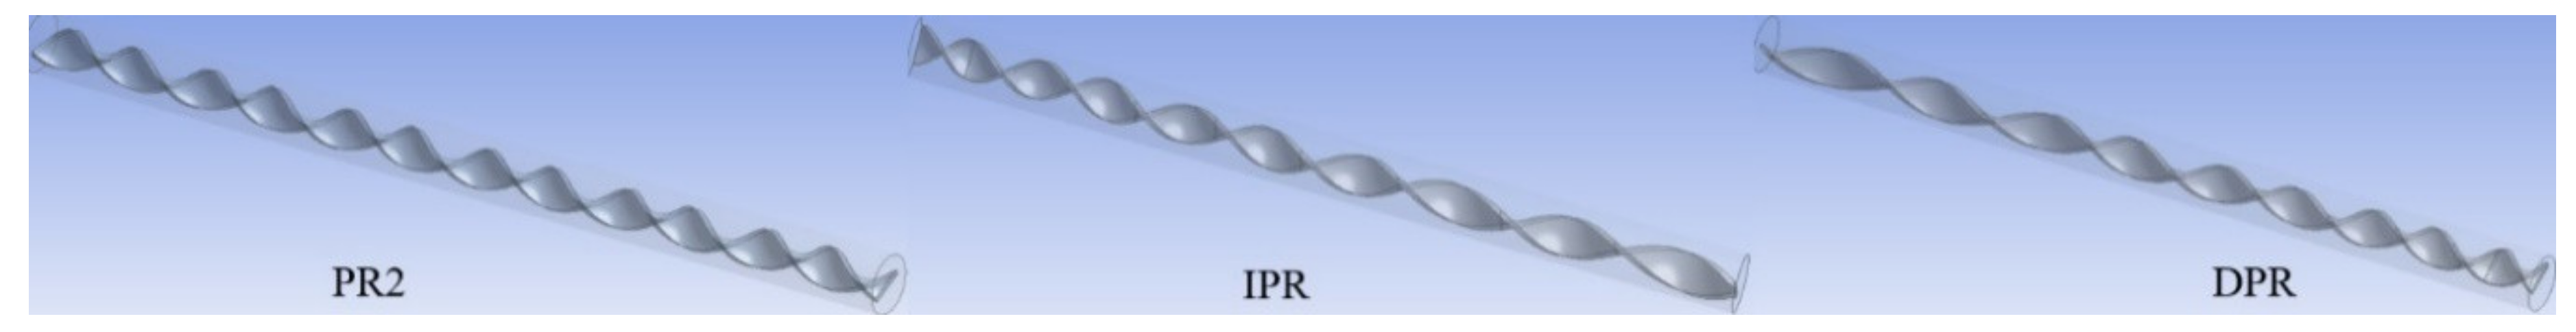
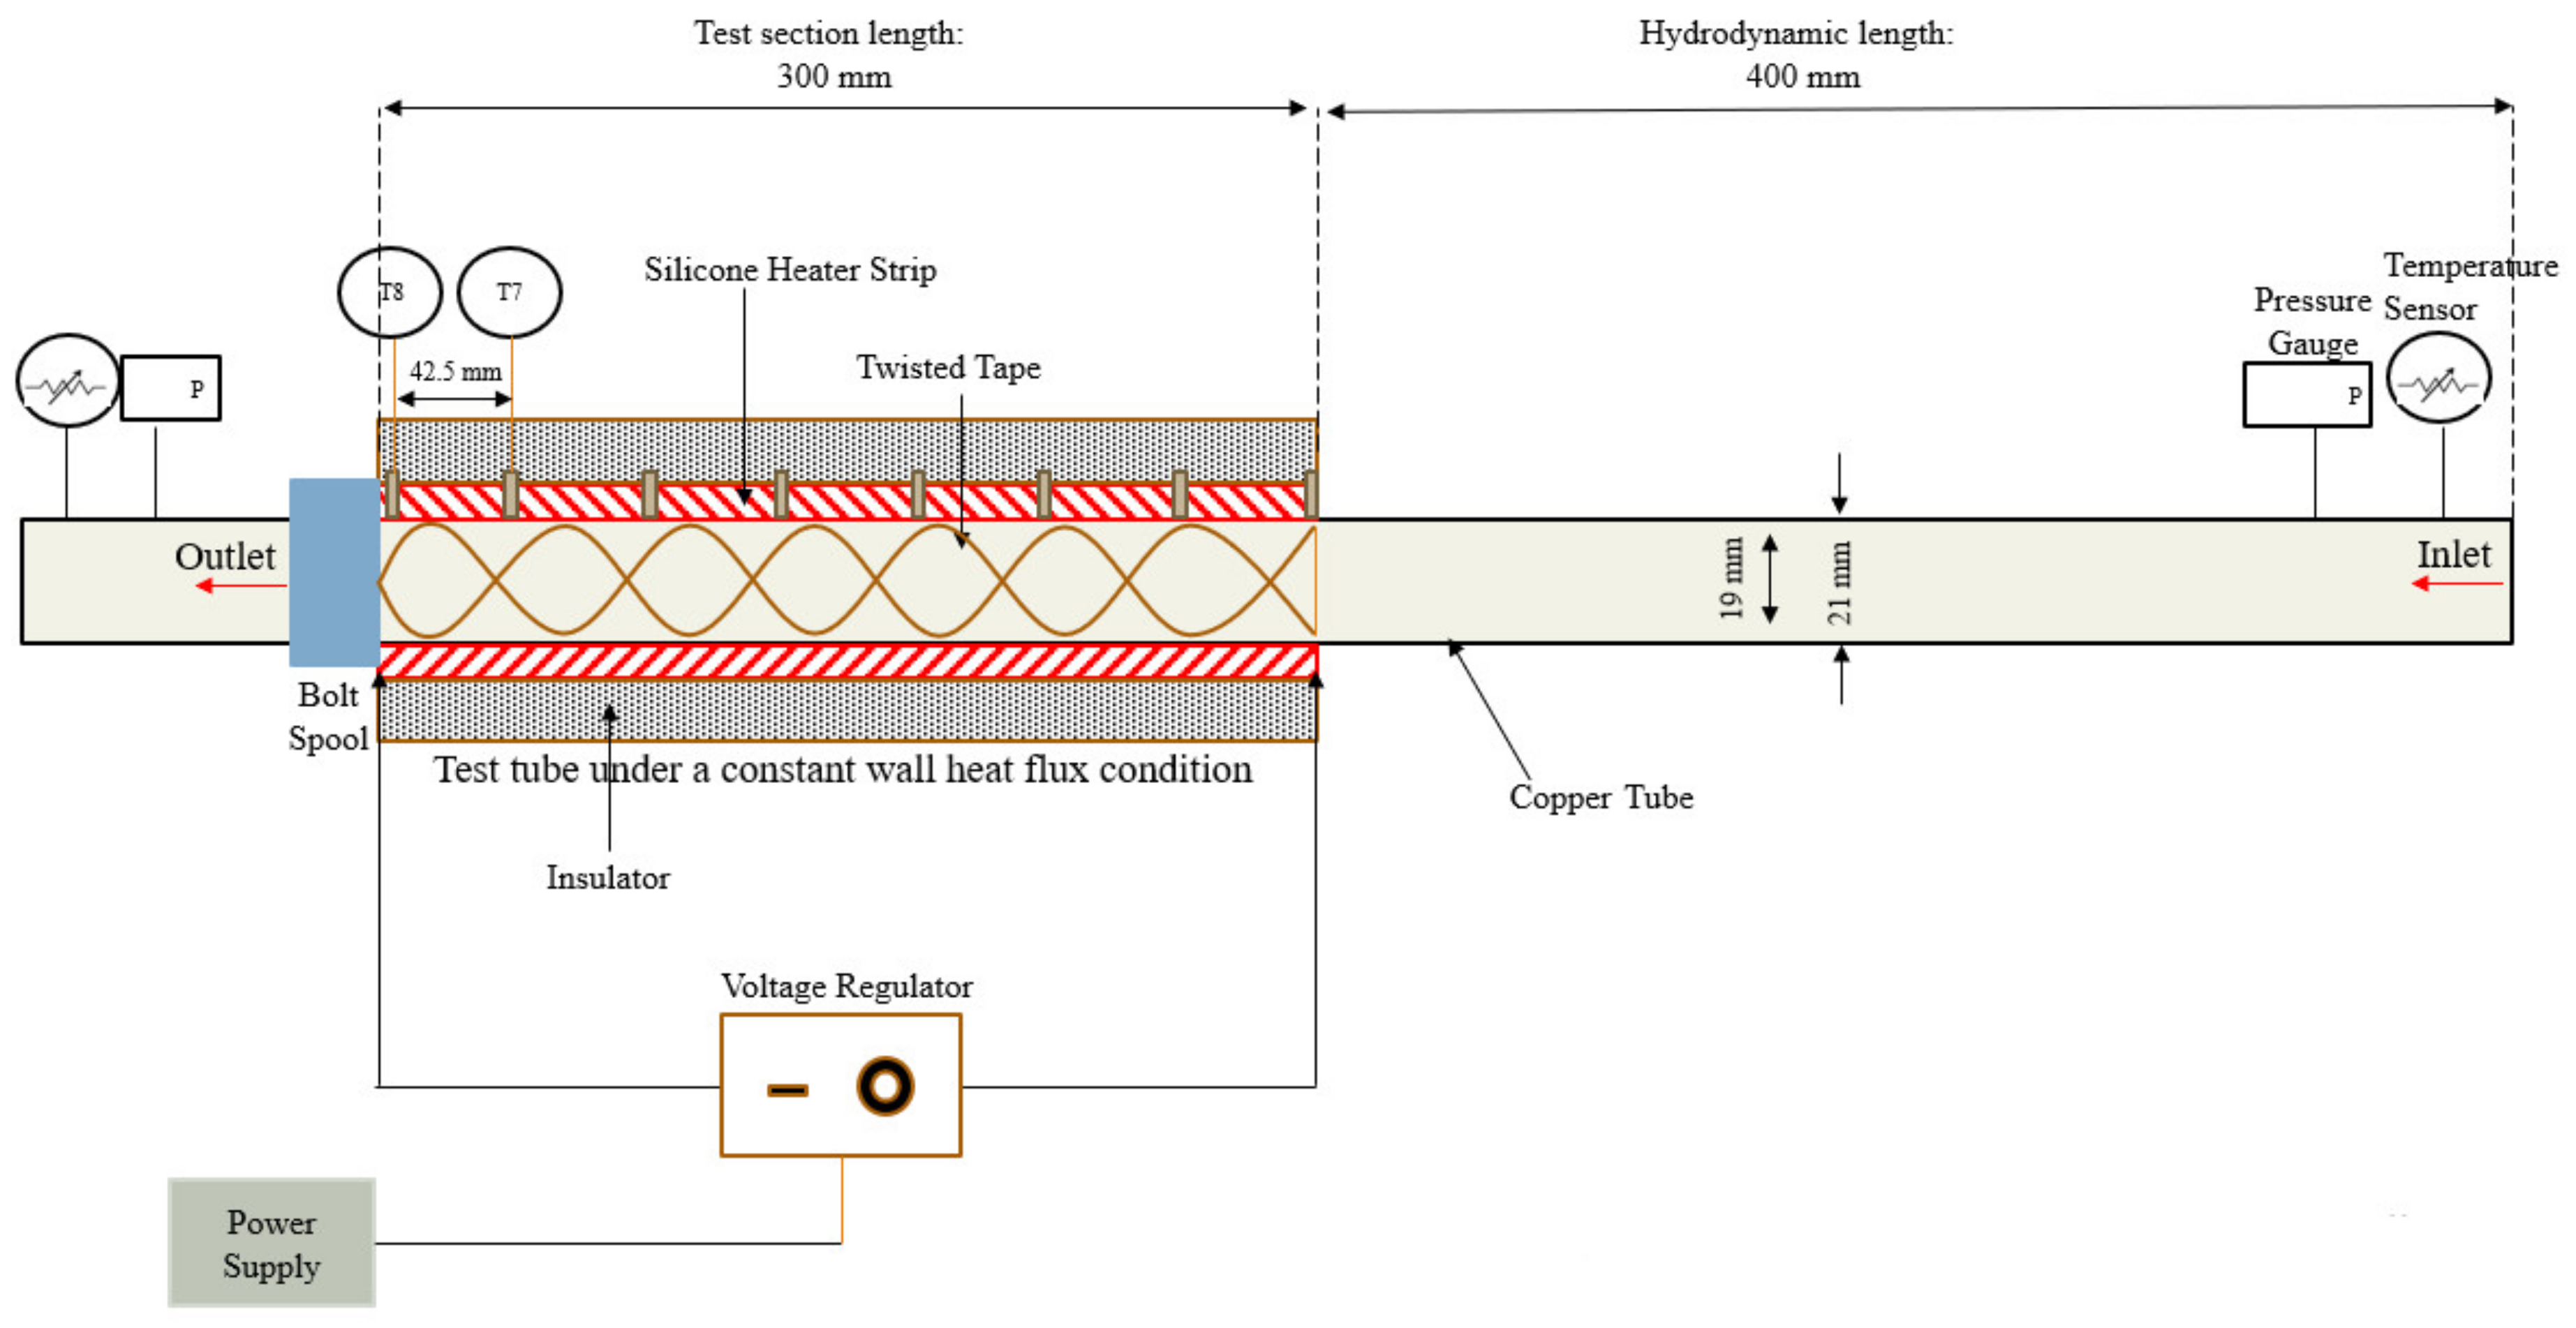
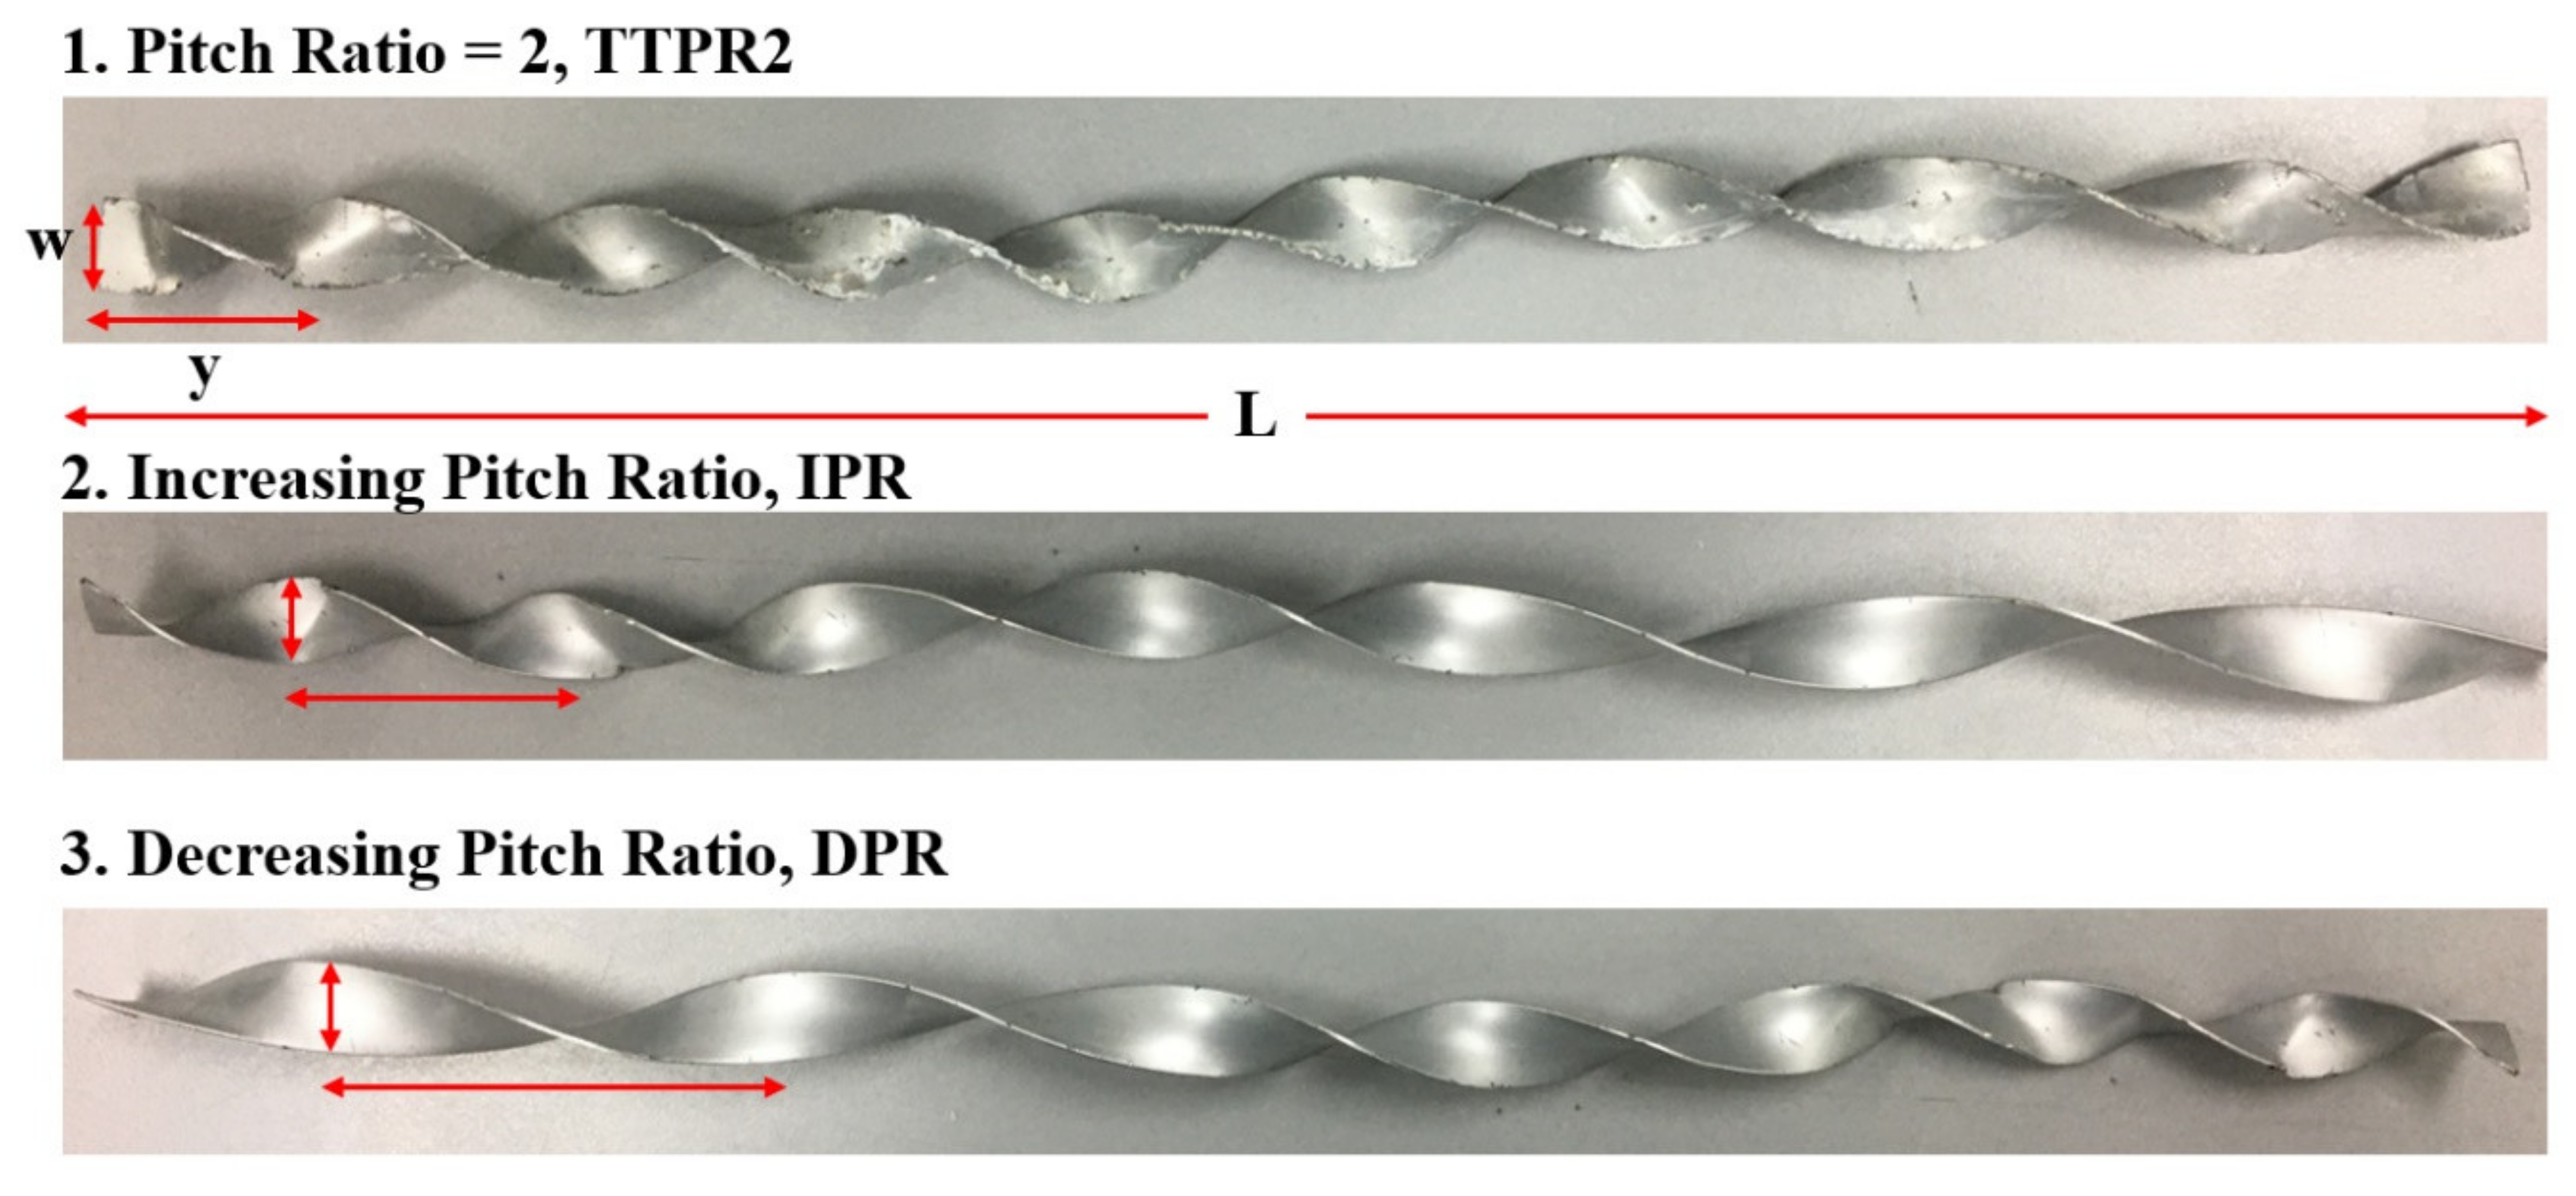
2.2.3. Test Section and Twisted Tape Geometry

The test section consisted of 1) a developing section, 2) eight thermocouples, 3) a silicone heater strip, 4) a voltage regulator, and 5) a power supply, as is shown in Figure 10. Four-hundred millimetres of the developing section is set prior to the inlet in order to make sure that the fully developed flow is entering the test section. A 1-meter silicone heater strip is rolled along the tube wall with a 19 mm inner diameter. At the tube wall, eight thermocouples are attached at constant distance by using thermal epoxy. Voltage regulator and power supply are connected to the tube wall in order to keep the heat flux constant at 1000w/m2 throughout the experiments. The test section is well insulated to make sure there is no heat lost during the experiment. Twisted tapes are made of straight aluminium bar with 18.5 mm width and 1 mm thickness, which have been manually twisted to the desired design. Figure 11 shows three different geometries of twisted tapes that are used for the experiments.

2.3. Data Reduction

The heat transfer enhancement was calculated based on the following dimensionless parameters:
Reynolds number:
R e = ρ u D μ
where u is the average fluid velocity in the tube
Friction factor:
f = 2 D Δ P ρ L u 2
Nusselt Number:
N u = h D k
By applying a constant-heat-flux condition at the tube wall, the convective heat transfer coefficient h is calculated as follows [37]:
h = q T w T f
where Tw and Tb denote the pipe wall temperature and the bulk temperature, respectively.
Overall enhancement ratio:
N u / N u p ( f / f p ) 1 3
where Nup and fp are the values of Nu and f, respectively, that are obtained for a plain circular tube with water.

3. Results and Discussion
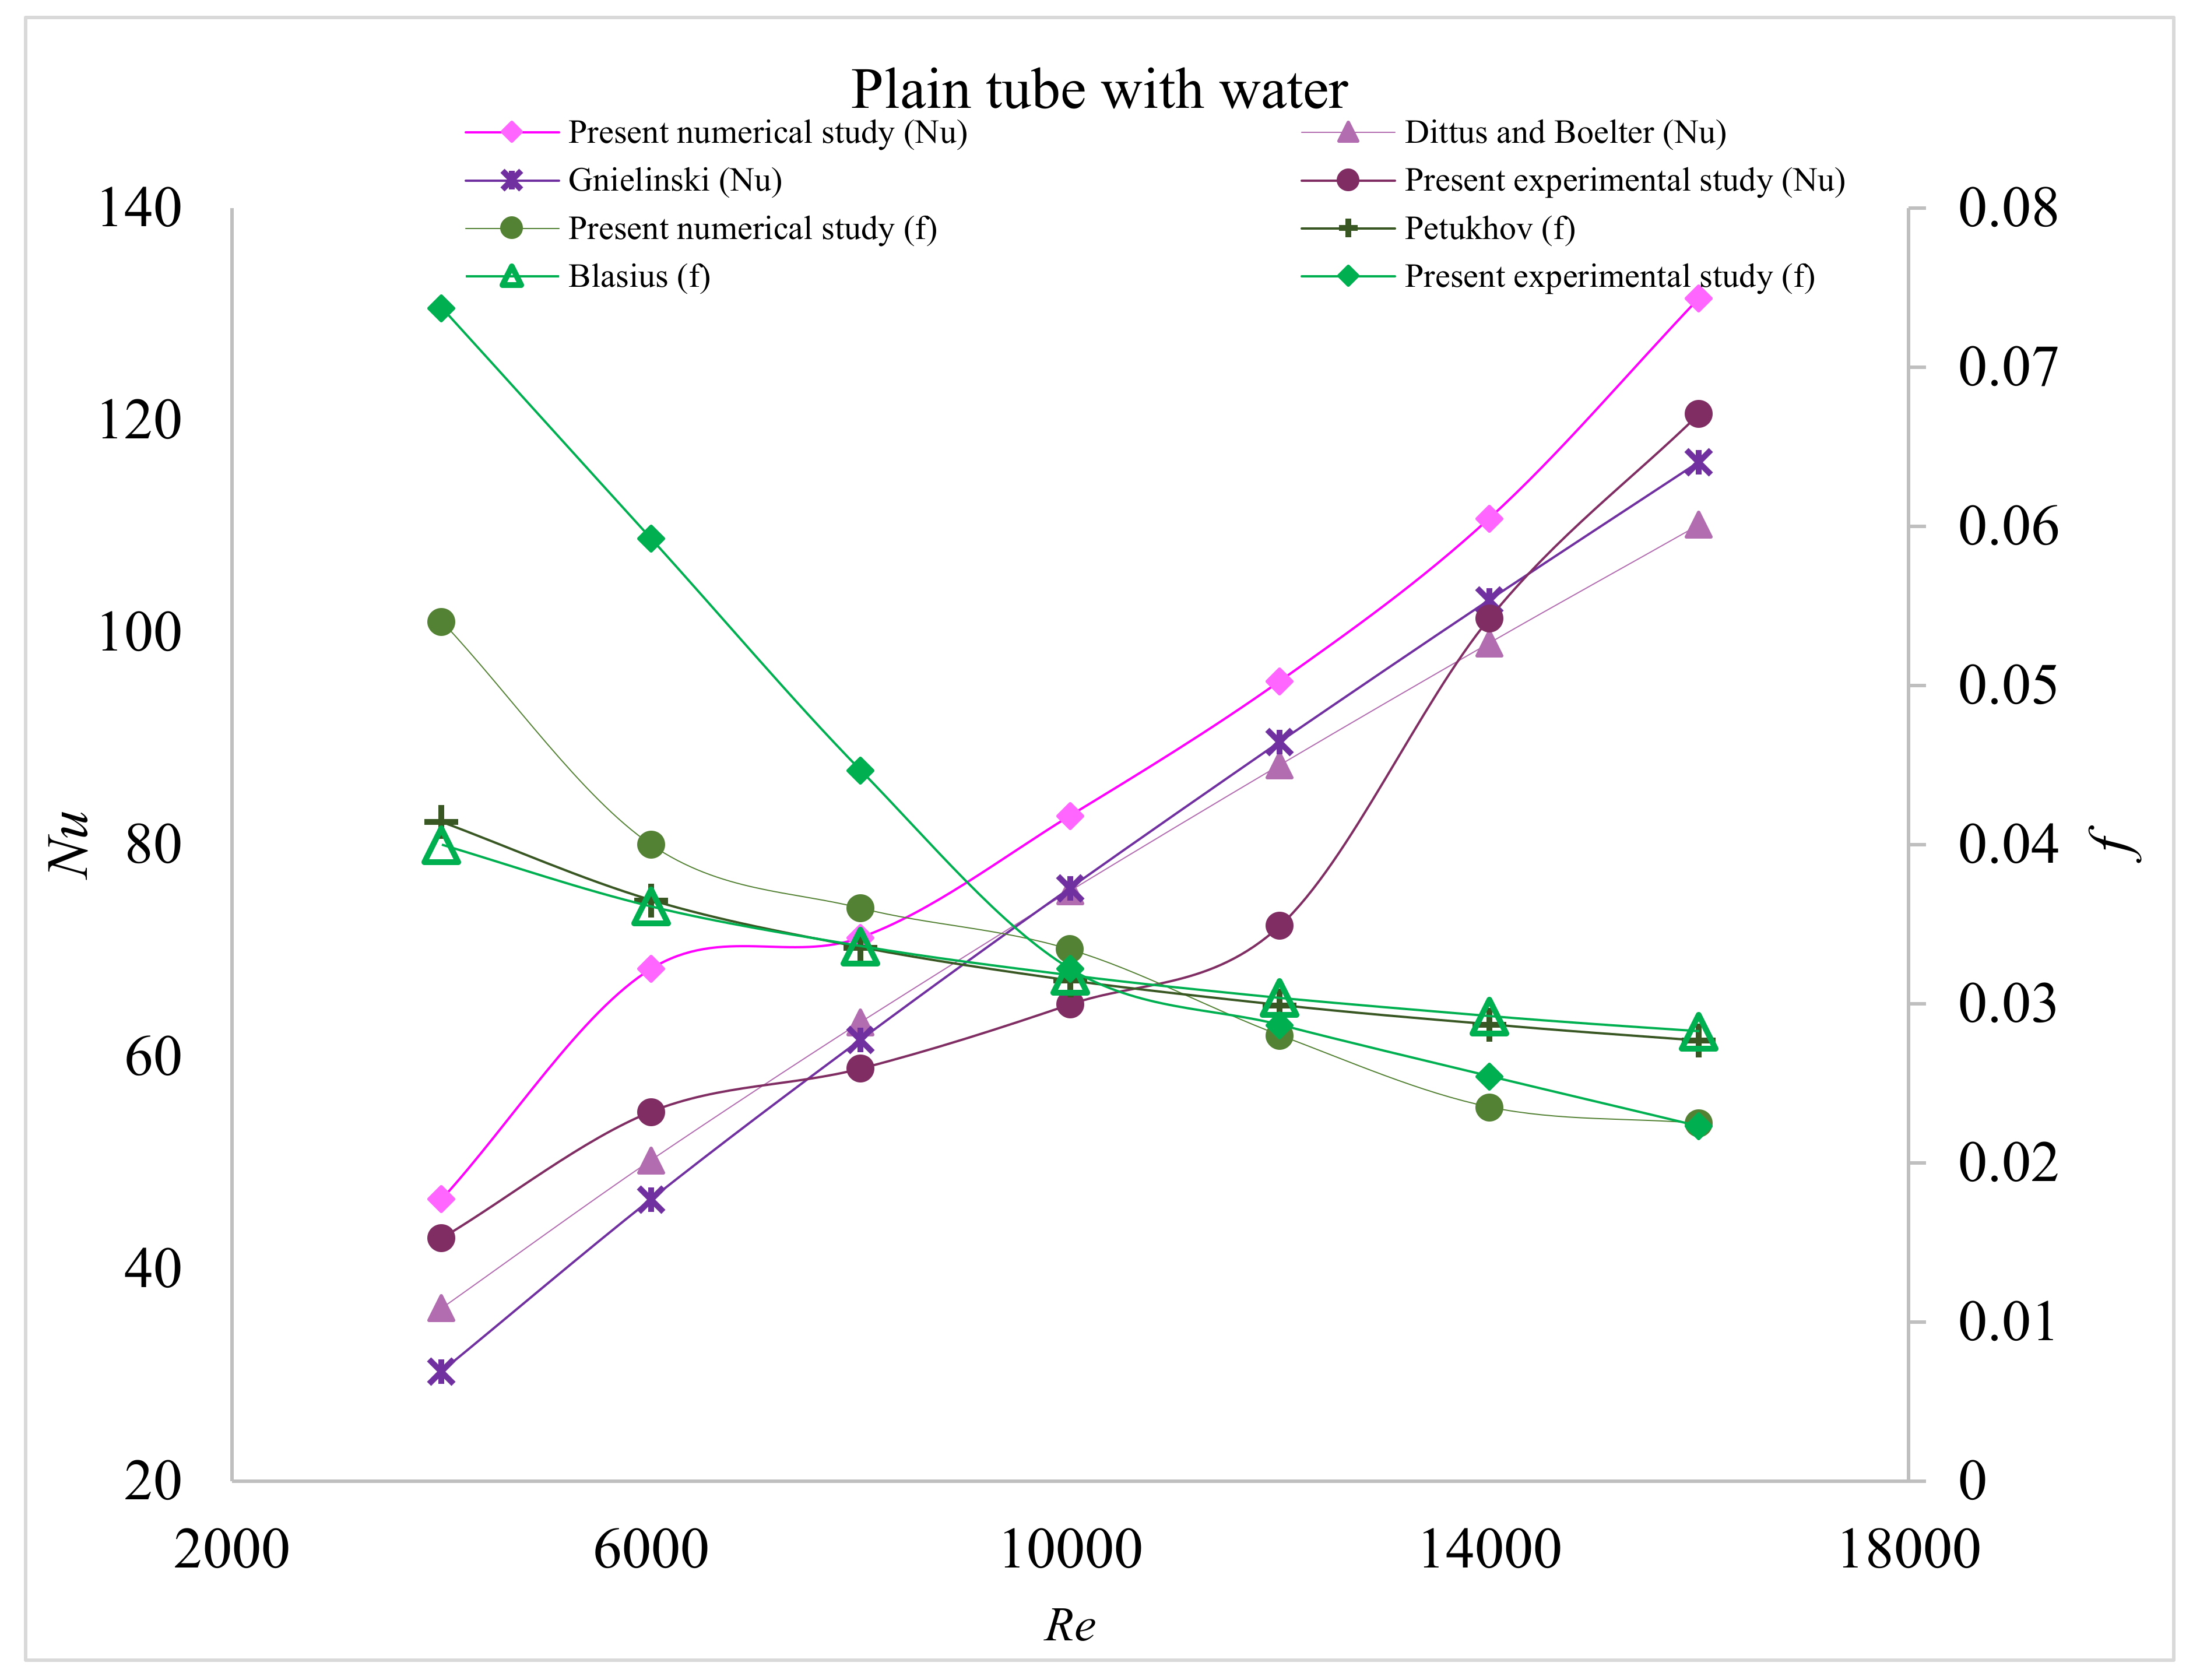
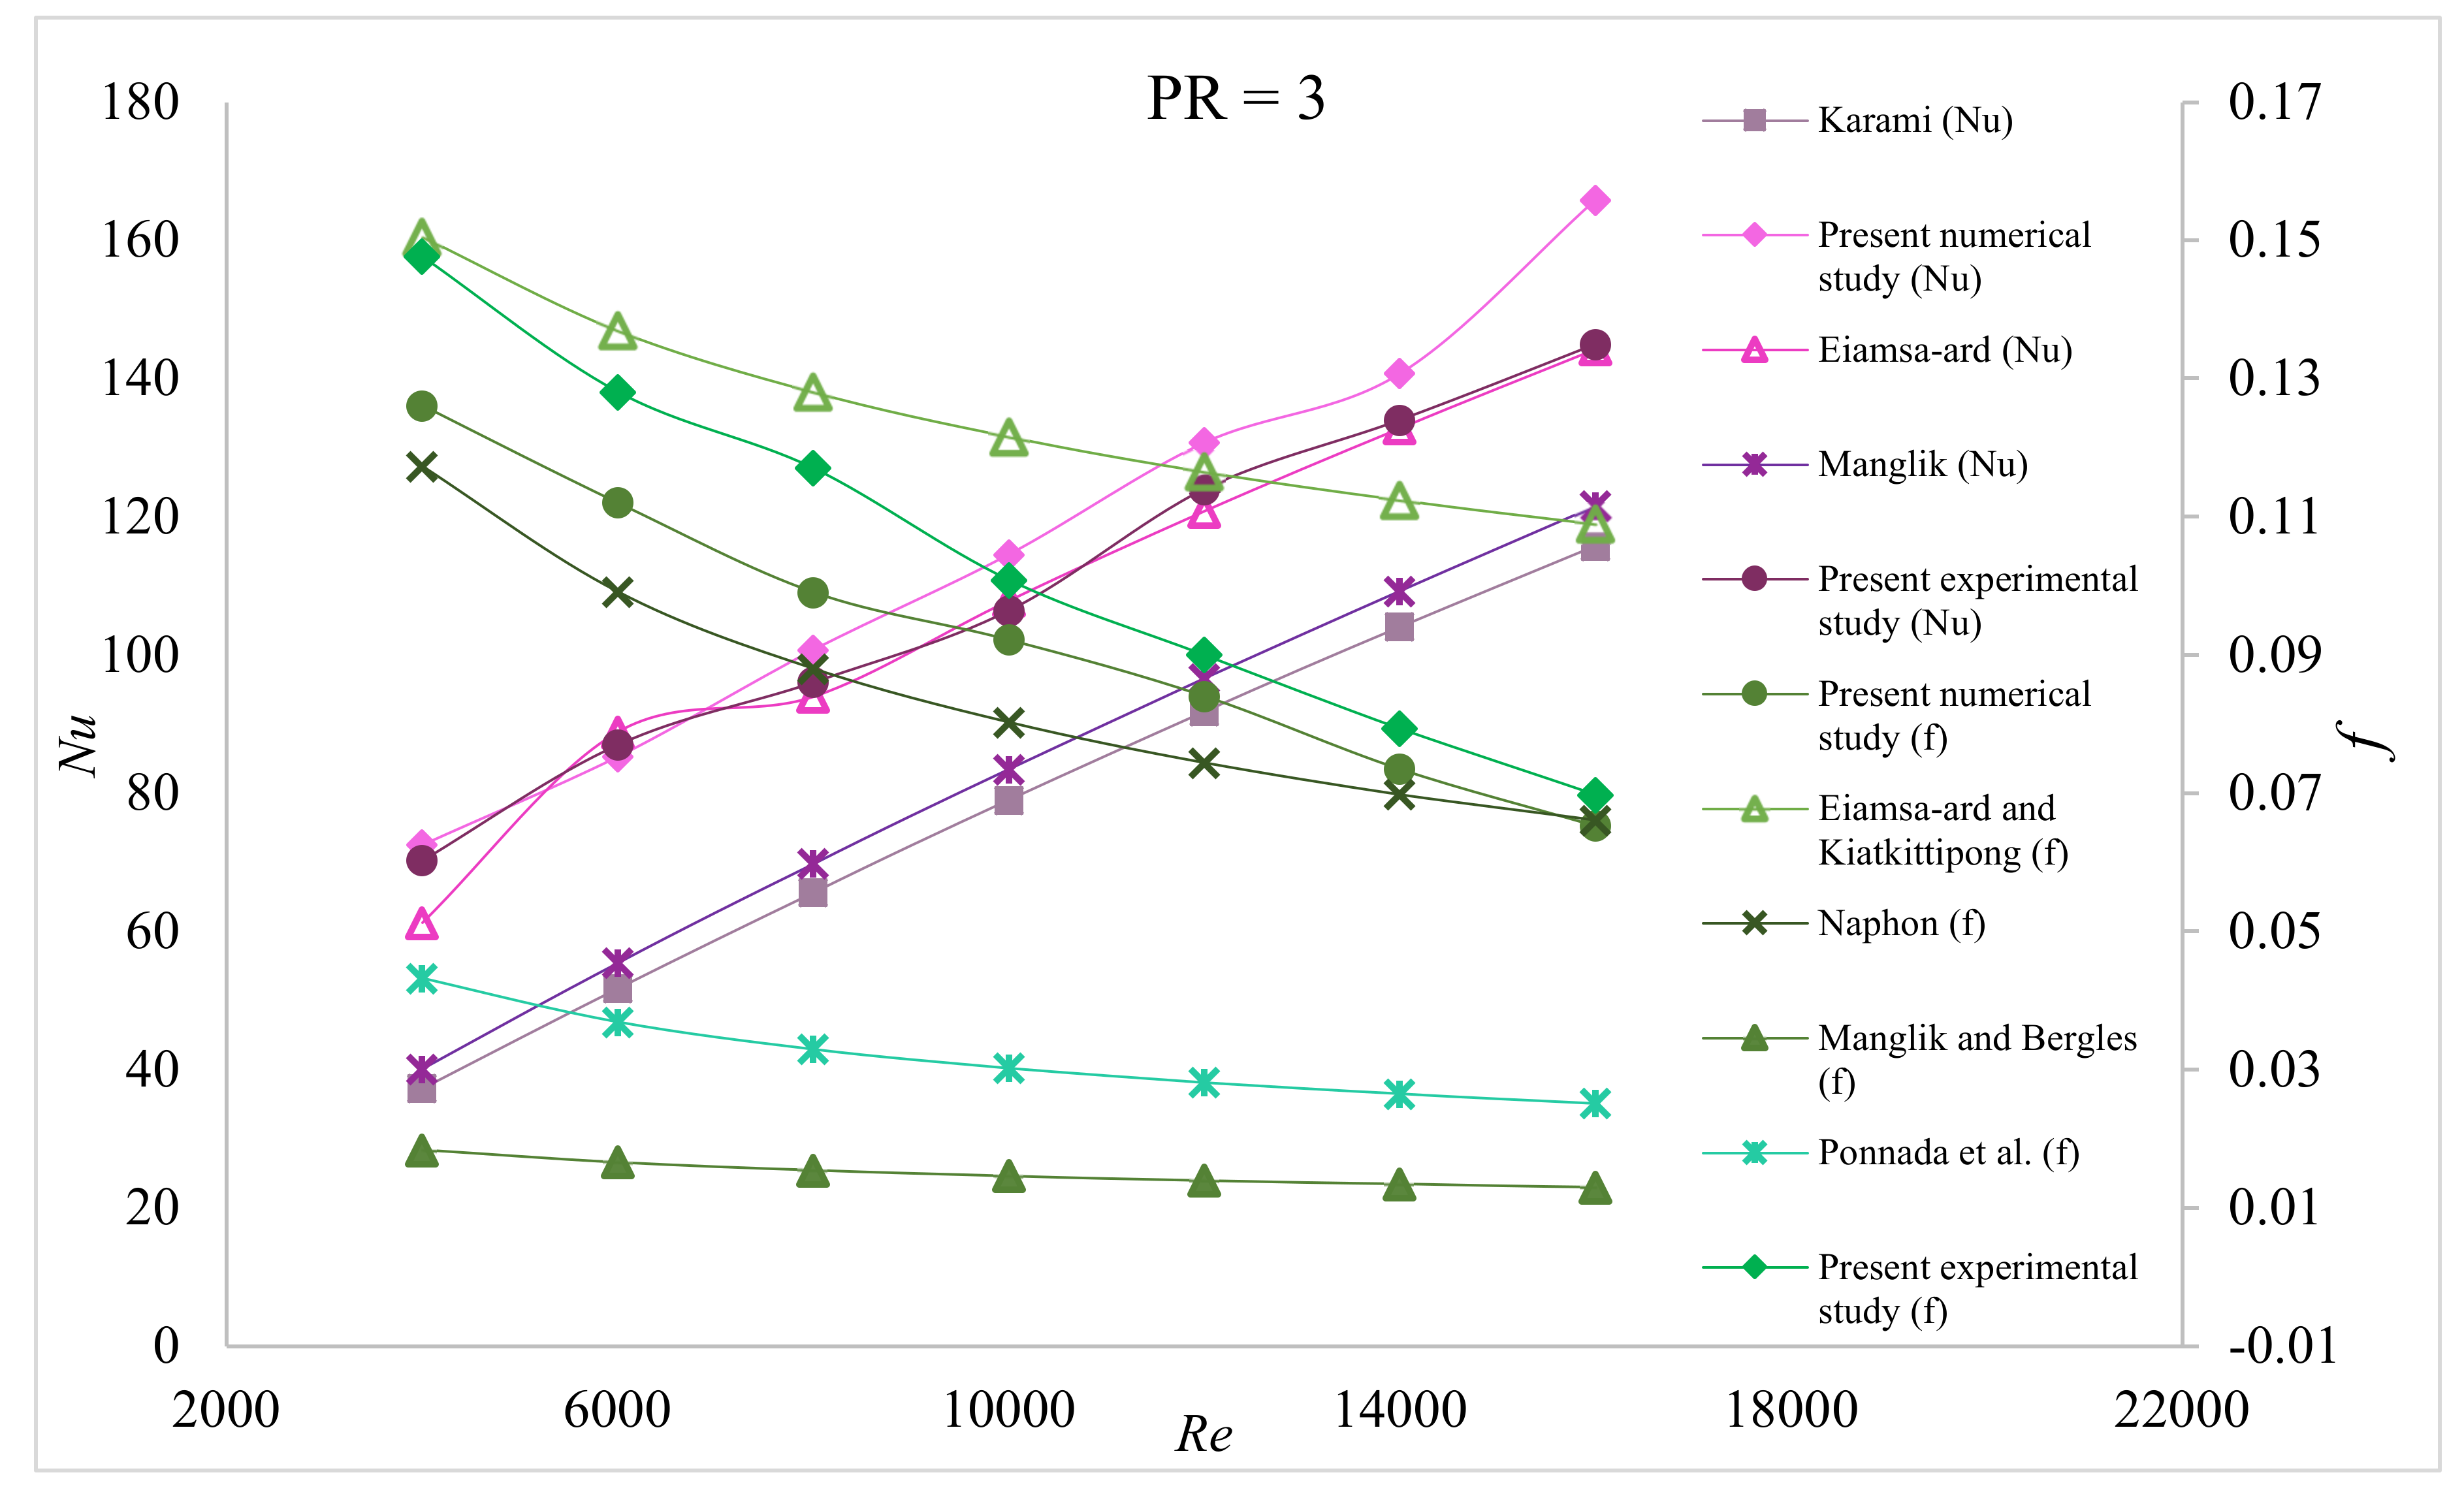
This section may be divided by subheadings. It should provide a concise and precise description of the experimental results, their interpretation as well as the experimental conclusions that can be drawn.

3.1. Evaluation

The accuracy of the numerical and experimental analysis for a smooth tube with water flowing through the test section is evaluated based on the following values from the literature [38]: the Dittus-Boelter and Gnielinski correlations for Nu and the Pethukov correlations for the friction factor. According to Figure 12, the values for both Nu and f obtained from the present study are in accord with the values obtained from previous studies. There is an abrupt change in the slope of the Nu curve for the experimental result potentially due to data sampling and measurement errors. For instance, during the experimental run at high Reynolds Number, the setup was observed to be a bit unstable due to high vibration and digital sensor readings were impacted. The recorded measurements were highly dynamic at that time and it was challenging to extract the precise bulk temperatures. The accuracy of the numerical and experimental analysis for a tube that is equipped with a twisted tape is evaluated using experimental data from Eiamsa-ard and Kiatkittipong [39], Karami et al. [40], Naphon [41], Manglik and Bergles [42], and Ponnada et al. [43]. All the comparisons are conducted with a PR of 3 under a turbulent flow with Reynolds numbers from 4000 to 16,000. From Figure 13, the numerical results that are obtained for Nu show an average deviation of 10.5% compared to the experimental data, with a similar increasing trend as Re increases. The deviation is due to experimental error, which mostly is contributed to by Tin deviation between the numerical and experimental. Due to a deficiency in the experimental setup (i.e. the chiller was not installed to cool down the Tout of fluid), Tin was not able to be kept at room temperature of 300 K, hence causing the slight inaccuracy of the result. For f, the data that were obtained from the numerical and experimental results accord with those that were obtained by Eiamsa-ard and Kiatkittipong [39] and Naphon [41]. The significant difference in f values might be due to the difference in the thickness of the twisted tape, as some experimental analyses assumed a very small thickness of the twisted tape, while the actual thickness for the simulation is 1 mm. However, the graph shows similar decreasing trends as Re increases. Nu is increasing with Re due to the higher temperature gradients at the boundary layer of the tube. Moreover, f is inversely proportional to Re due to an increase in the tangential velocity, and the trends are similar to the Moody chart for turbulent flows. In addition, the Y+ values are calculated and presented in Table 4 to provide a more accurate prediction of the flow field at the boundary layer, especially near the wall region, where the limit on Y+ for k-ɛ with the enhanced wall treatment method should be less than 5.

3.2. Uncertainties

In order to make sure that all instruments used for data measurement and experimental procedures are reliable and have a good accuracy, the calibration process is conducted prior to use. Dependent variables such as Nu, f, Re, and η are influenced by independent variables such as temperature, local pressure and volumetric flow rate. Hence, the following equation is used [44] to measure the uncertainties of the experimental parameters.
σ R = ± R x 1 σ x 1 2 + R x 2 σ x 2 2 + + R x n σ x n 2
where σ R is the uncertainties of the dependent variables, and σ x 1 is the uncertainties of the independent variables. Table 5 and Table 6 show the uncertainties of the experimental instrument and the dependent variables, respectively
The experimental data of Nu, f and η are provided in Supplementary Materials. Figure 14 illustrates the mechanism of the fluid flow inside the tube for various inserts. The figure emphasizes the differences in terms of the velocity streamlines, the temperature distribution and the turbulent kinetic energy among four conditions. The comparisons are conducted for a 1% SiC/Water nanofluid that is flowing through a tube that is equipped with various types of inserts with Re equal to 10,000. The plain tube creates a straight path of the velocity streamline, while the presence of inserts creates a helical flow around the inserts, which is also known as a swirl flow. TT with constant PR generates a constant swirl flow along the tube, while IPR and DPR yield stronger flows at the inlet and outlet, respectively. The formation of a fluid flow from the inner tube to the tube wall is visualized in the velocity vector image over cross-sectional plane XY of the tube. According to the velocity vector image, TT IPR yields the densest velocity vector field near the tube wall among the considered inserts; hence, TT IPR creates the largest temperature disruption near the wall region among the geometries. The temperature contours showed that the presence of TT disrupts the temperature gradient in the tube, which results in the reduction of the temperature boundary layer thickness near the wall region. According to the turbulent kinetic energy image, the tubes that are equipped with twisted tapes (PR2, IPR and DPR) show significant differences in their fluid energy contours compared to the plain tube. TT IPR showed fewer contours in TKE; hence, the energy is well dispersed from the tube wall towards the centre of the tube. This is also due to better fluid mixing, which can result in a higher heat transfer rate. However, the twisted tape inserts can create a higher-pressure gradient along the flow direction due to an abrupt change in velocity, which causes higher flow resistance. Using a constant PR (TT PR2) caused higher ∆P to occur along the tube due to increased tangential contact between the fluid and the tube surface. However, using TT with increasing and decreasing PR (IPR and DPR) can reduce the tangential contact, thereby resulting in a smaller pressure drop. Figure 15 shows the pressure drop across the tube.
Figure 16 and Figure 17 plot the effects of the twisted tape designs for the 1% SiC/Water nanofluid on Nu using the numerical and experimental method respectively. Nu increases with increasing Re for all conditions. At lower Re (4000–6000), TT PR2 shows the largest Nu values, while at higher Re, TT IPR shows the largest Nu values. At lower Re, TT PR2 creates a constant strong swirl flow across the tube, which can result in better fluid mixing and more efficient thermal boundary layer disruption compared to other TTs. However, at higher Re, where fluid is having higher vorticity and the eddy turbulence is dominant, TT IPR can create a more uniform turbulence intensity inside the tube, which leads to higher heat transfer rate across the tube and results in larger Nu values [45]. As the fluid approaches the outlet region for TT IPR, the turbulence intensity is slightly reduced due to the gradually increasing PR. However, the intensity drop is small compared to the higher heat transport performance that it offers. The addition of inserts into the tube will cause additional resistance to the fluid flow, which can result in a higher ∆P, which is due to the generation of a larger contact surface by the flow and the surfaces of the inserts. The average deviations between numerical and experimental results for TT PR2, TT IPR and TT DPR are approximately 9.8%, 9.1% and 9.7%, respectively. Figure 18 and Figure 19 plot the variation of f with Re at various conditions of the inserts using the numerical and experimental method respectively. The tube that is equipped with TT IPR yields the lowest f values, followed by TT PR2 and TT DPR due to lower PR near the outlets of the inserts, which creates a smaller fluid-insert contact area and results in less fluid friction. The average deviations between numerical and experimental results of f for TT PR2, TT IPR and TT DPR are approximately 2.1%, 1.9% and 2.4%, respectively. Based on Figure 20 and Figure 21, at a similar condition (1% SiC/Water nanofluid), TT IPR shows the highest η, followed by TT PR2 and TT DPR. TT IPR yields lower PR at the inlet, which gradually increases near the outlet, thereby resulting in stronger swirling flow near the inlet region, which slightly weakens as it approaches the outlet. However, the lower intensity of the turbulence is countered by a smaller pressure drop near the outlet, which is due to the lower fluid friction (higher PR), which results in larger η for the TT IPR geometry.
In addition to the geometry of the inserts, the type of nanofluid is a parameter that is considered in the analysis. Figure 22 illustrates the variations of Nu with Re for the SiC/Water and Al2O3/Water nanofluids at 1% φ that are flowing inside a circular tube that is equipped with TT IPR. The graphs illustrate that the SiC/Water and Al2O3/Water nanofluids show similar increasing trends in the Nu. SiC/Water nanofluid yields a slightly larger value compared to Al2O3/Water. The SiC/Water nanofluid has a larger value of k than the Al2O3/Water nanofluid, which contributes to higher Nu. The Nu values obtained using the numerical method are higher compared to the experimental method due to uncertainties from experimental instruments. Figure 23 illustrates the variation of f with Re for SiC/Water Al2O3/Water nanofluids at similar conditions. The graphs show decreasing trends in f values with increasing Re. SiC/Water nanofluid creates a slightly higher ∆P at lower Re but shows almost the same value at higher Re. Hence, the SiC/Water nanofluid shows a slightly larger value of η compared to that of Al2O3/Water. However, the type of nanoparticles does not have a substantial effect on η due to small difference in nanoparticles thermal properties [46], in contrast to other parameters such as the geometry of the inserts and φ. Hence, further analysis is conducted on parameter φ.
Figure 24 and Figure 25 plot the variation of Nu with increasing Re at various values of φ for the SiC/Water nanofluid that is flowing inside a smooth tube that is equipped with TT IPR using numerical and experimental methods, respectively. The average deviations between numerical and experimental results for 1% SiC/Water, 2% SiC/Water and 3% SiC/Water are approximately 6.8%, 7.1% and 6.5%, respectively. Nu increases with increasing φ (1–3%). This is because the higher concentration of nanoparticles inside the fluid yields a higher thermal conductivity and the drastic movement of the nanoparticles can enhance the heat transfer performance of the system. However, the higher concentration of nanoparticles can lead to a higher ∆P (referring to Figure 26 and Figure 27), where 3% volume fraction produces a higher pressure drop, which is due to the higher viscosity of the fluid. Hence, selecting the optimal value of φ is highly important for ensuring that the largest value of η is attained. The average deviations between numerical and experimental results of f for 1% SiC/Water, 2% SiC/Water and 3% SiC/Water approximately are 3.9%, 4.3% and 4.8%, respectively. Figure 28 and Figure 29 illustrate the effect of φ to the η. The highest value of η is obtained for SiC/Water nanofluid at φ, which equals to 3% with the range of Re from 10,000 to 12,000.

4. Conclusions

In this study, Nu, f and η of SIC/Water and Al2O3/Water nanofluids that are flowing inside a circular tube with twisted tape inserts (TTPR2, TT IPR and TT DPR) are presented. The main conclusions from the analysis are as follows:
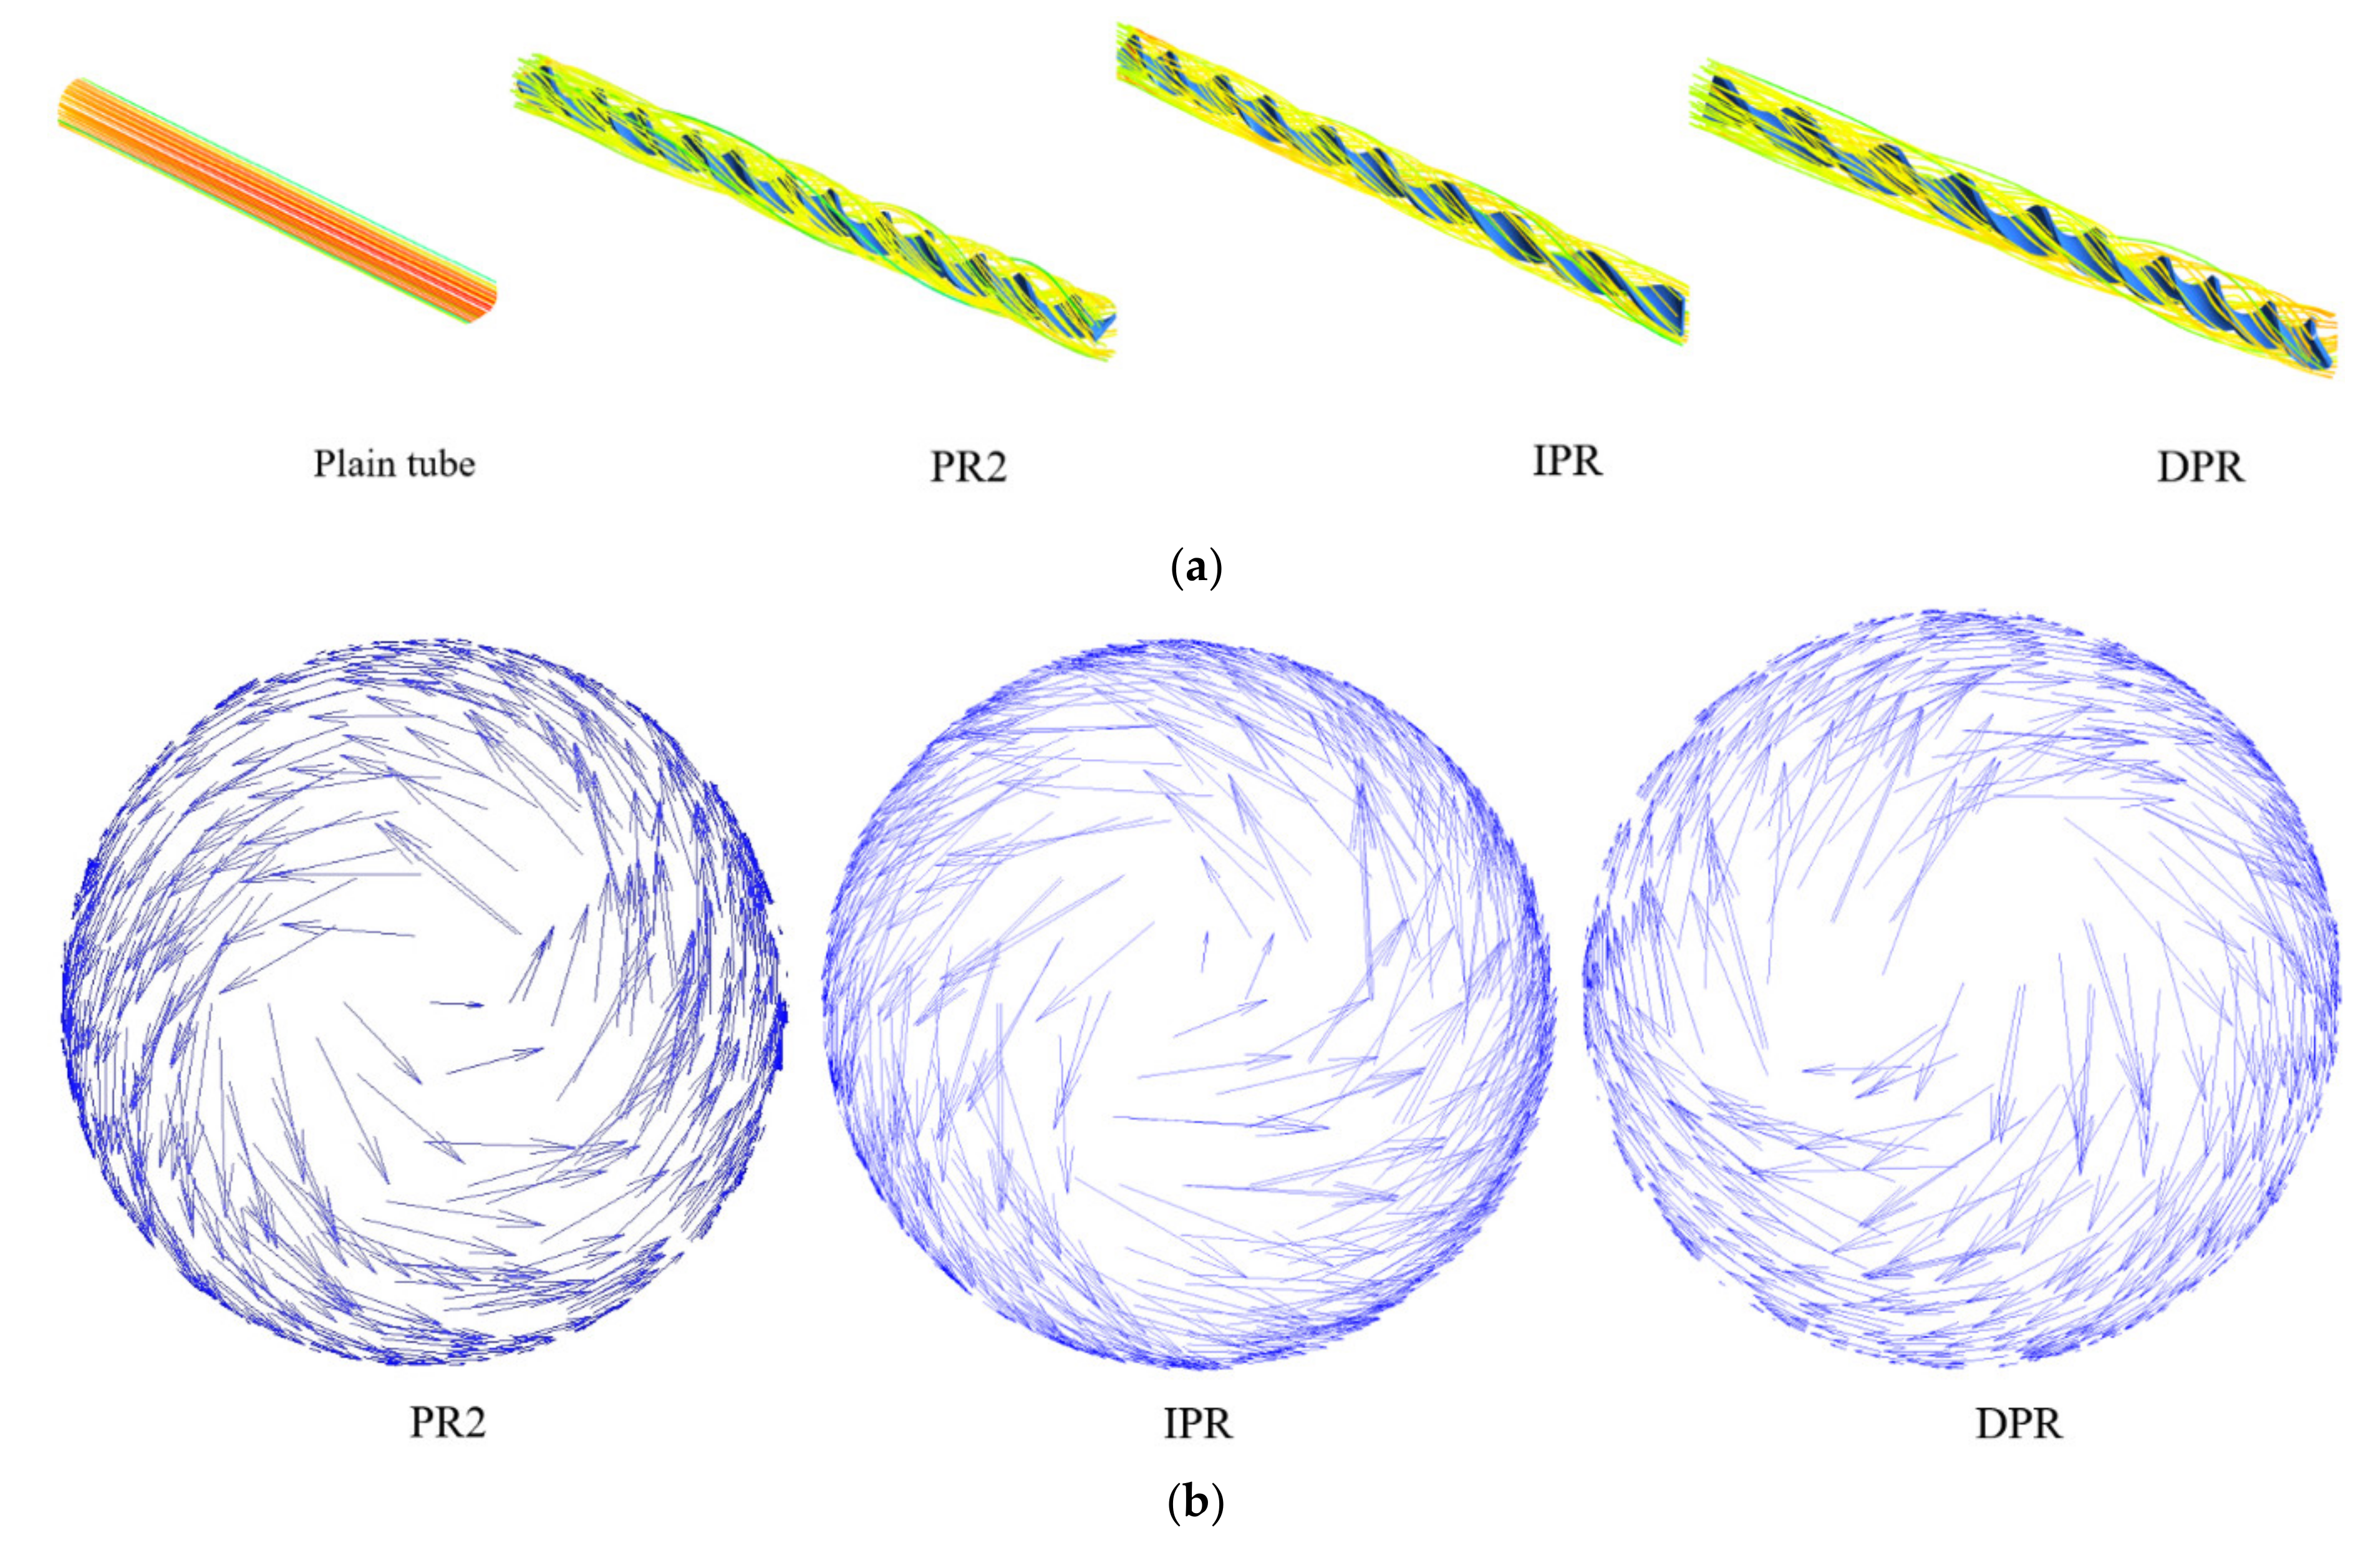
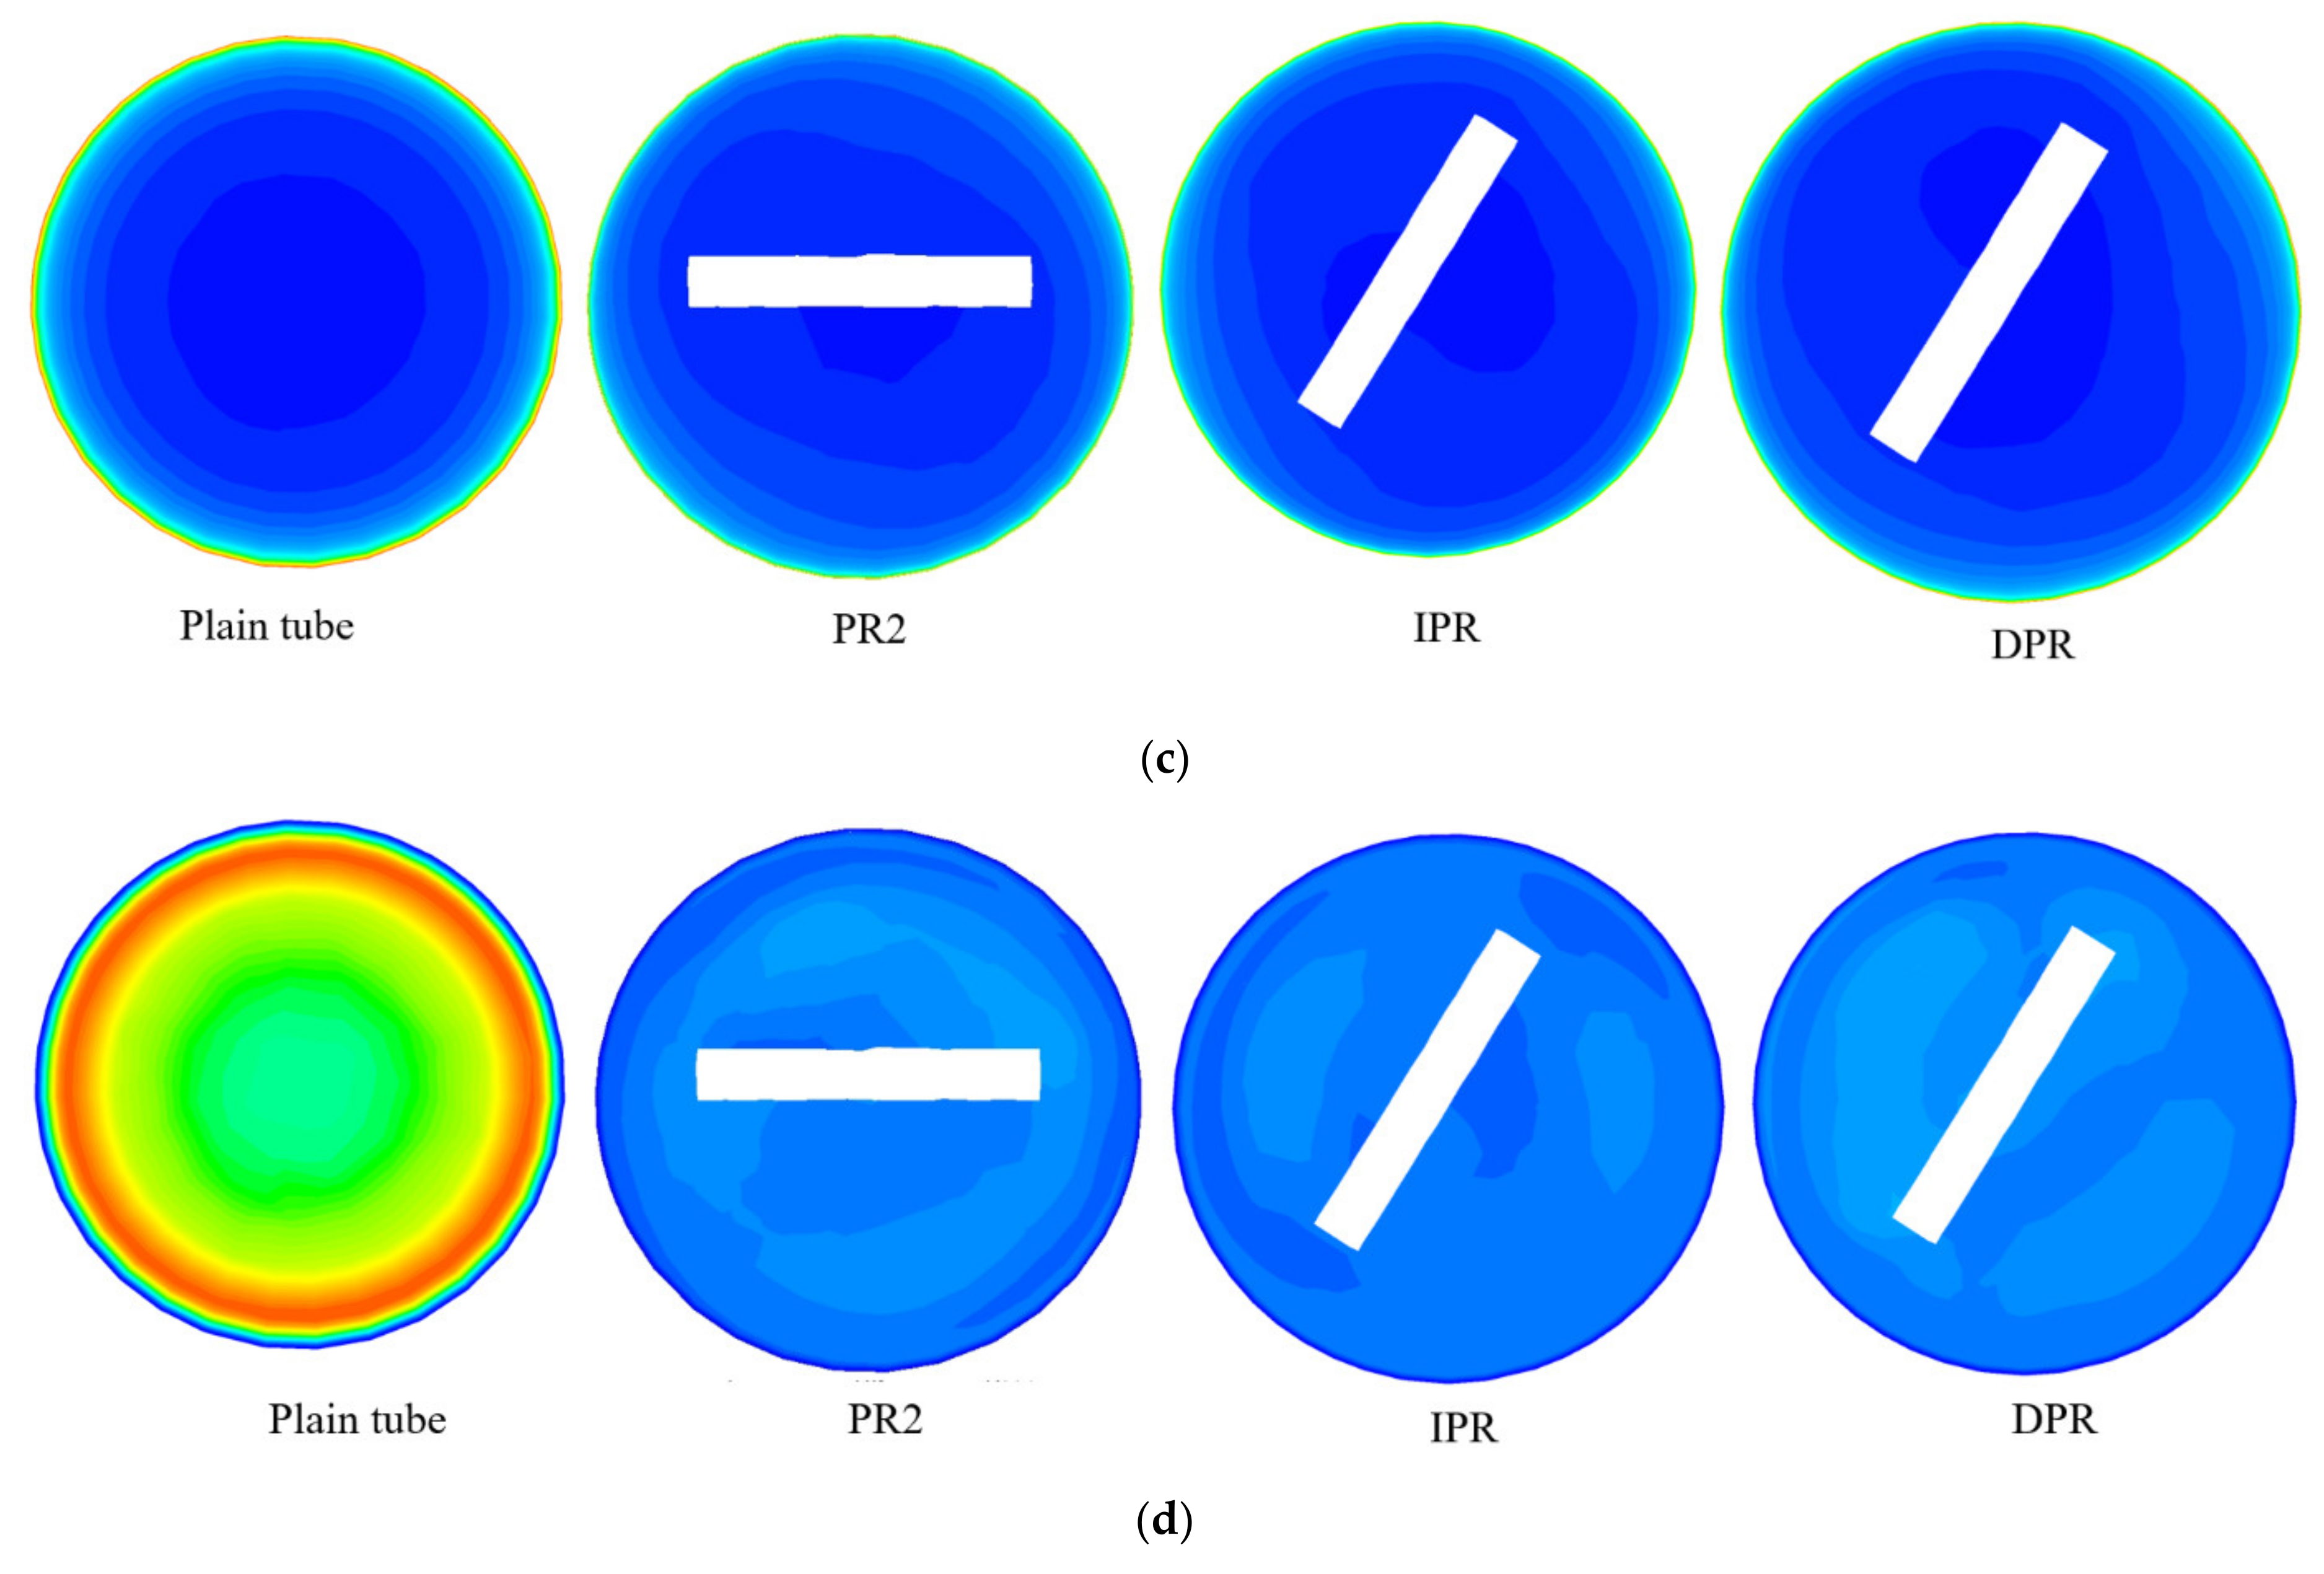
  • Utilizing TT IPR inside a tube able to manipulate the fluid flow path inside the tube and create a higher swirl flow intensity that improves the heat transfer rate.
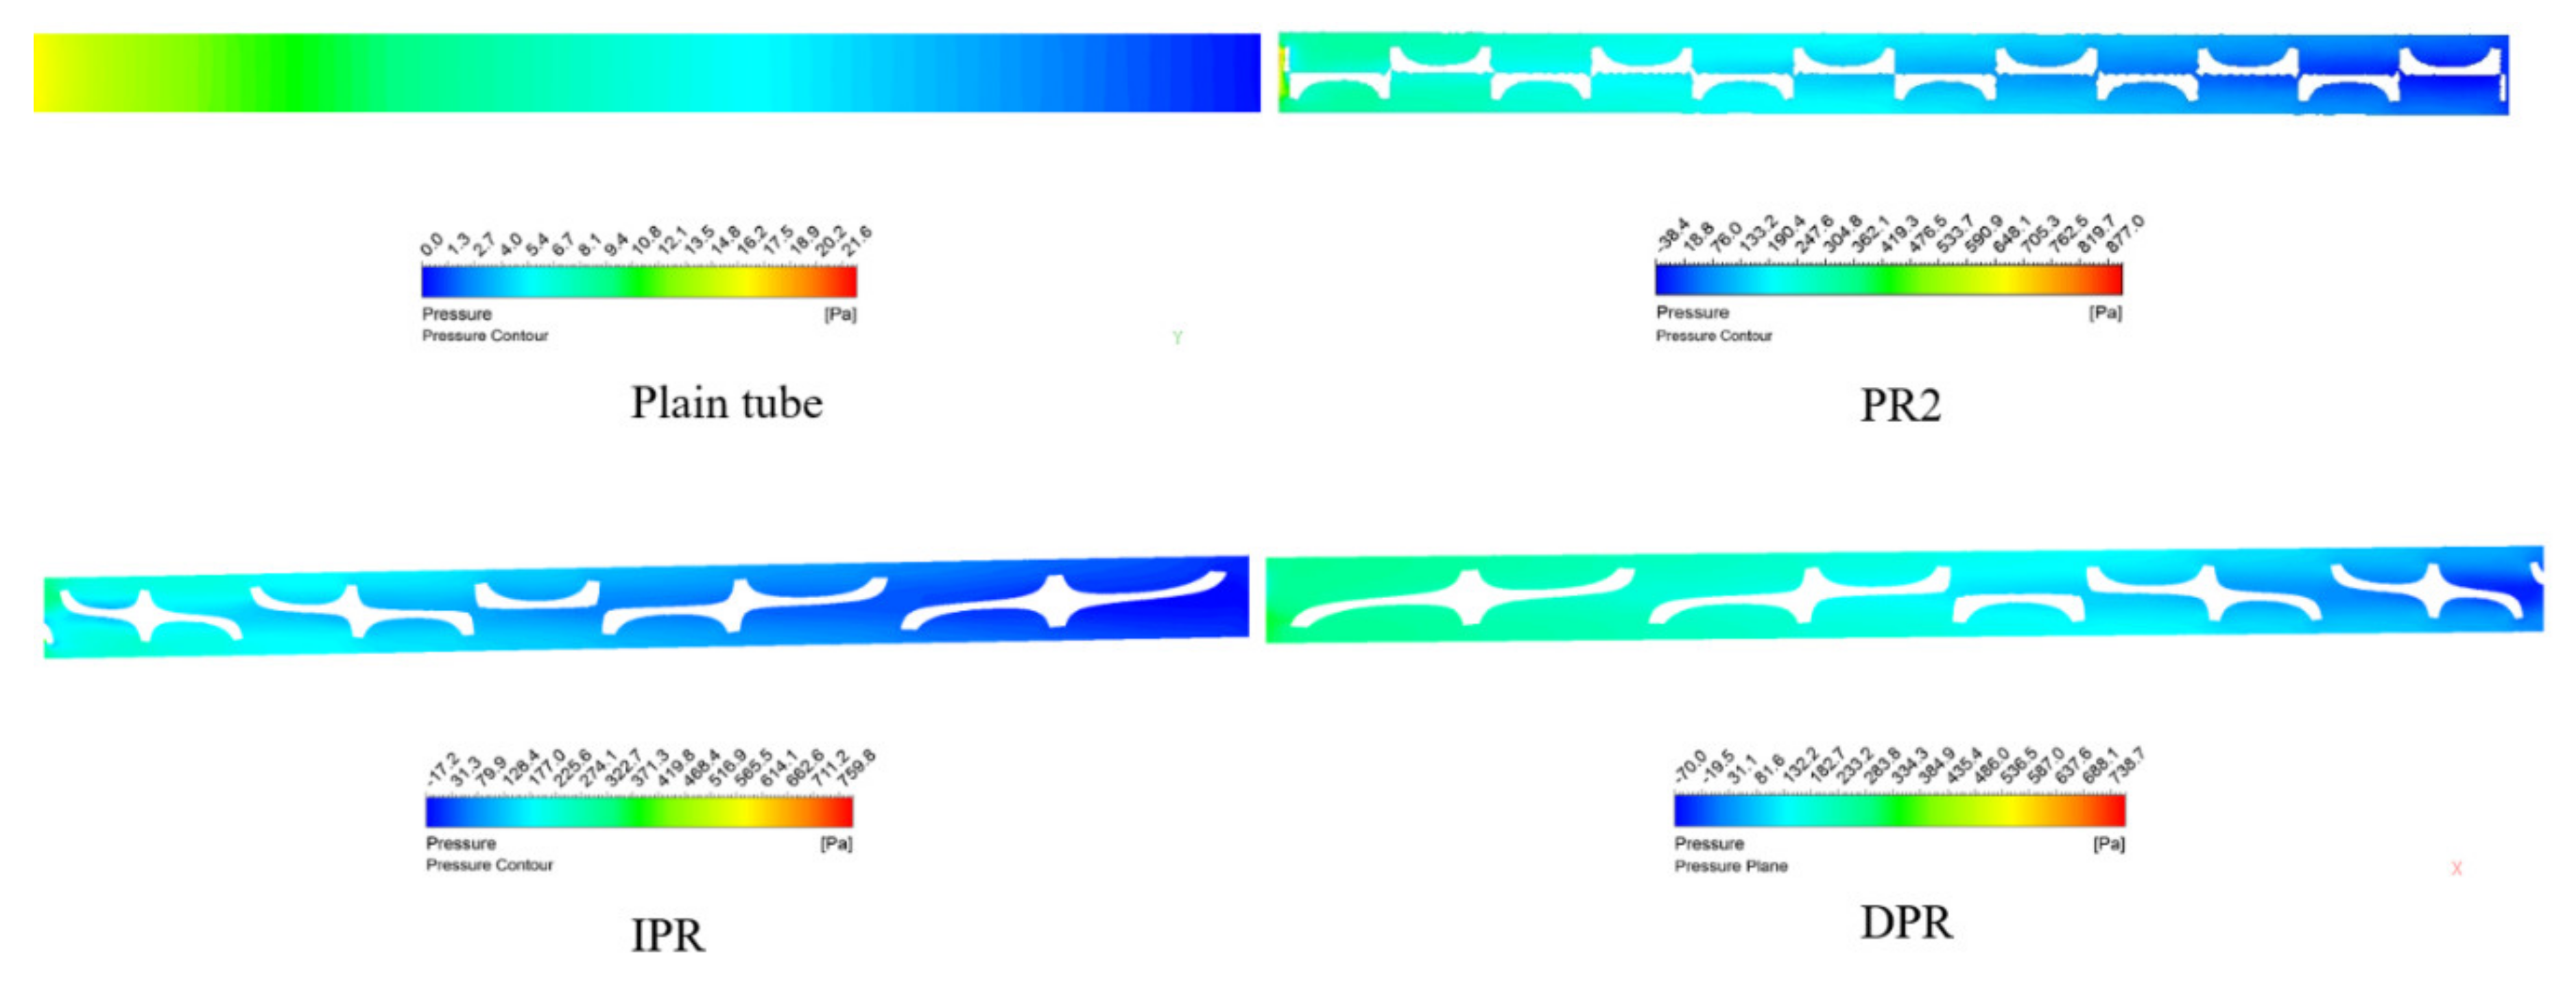
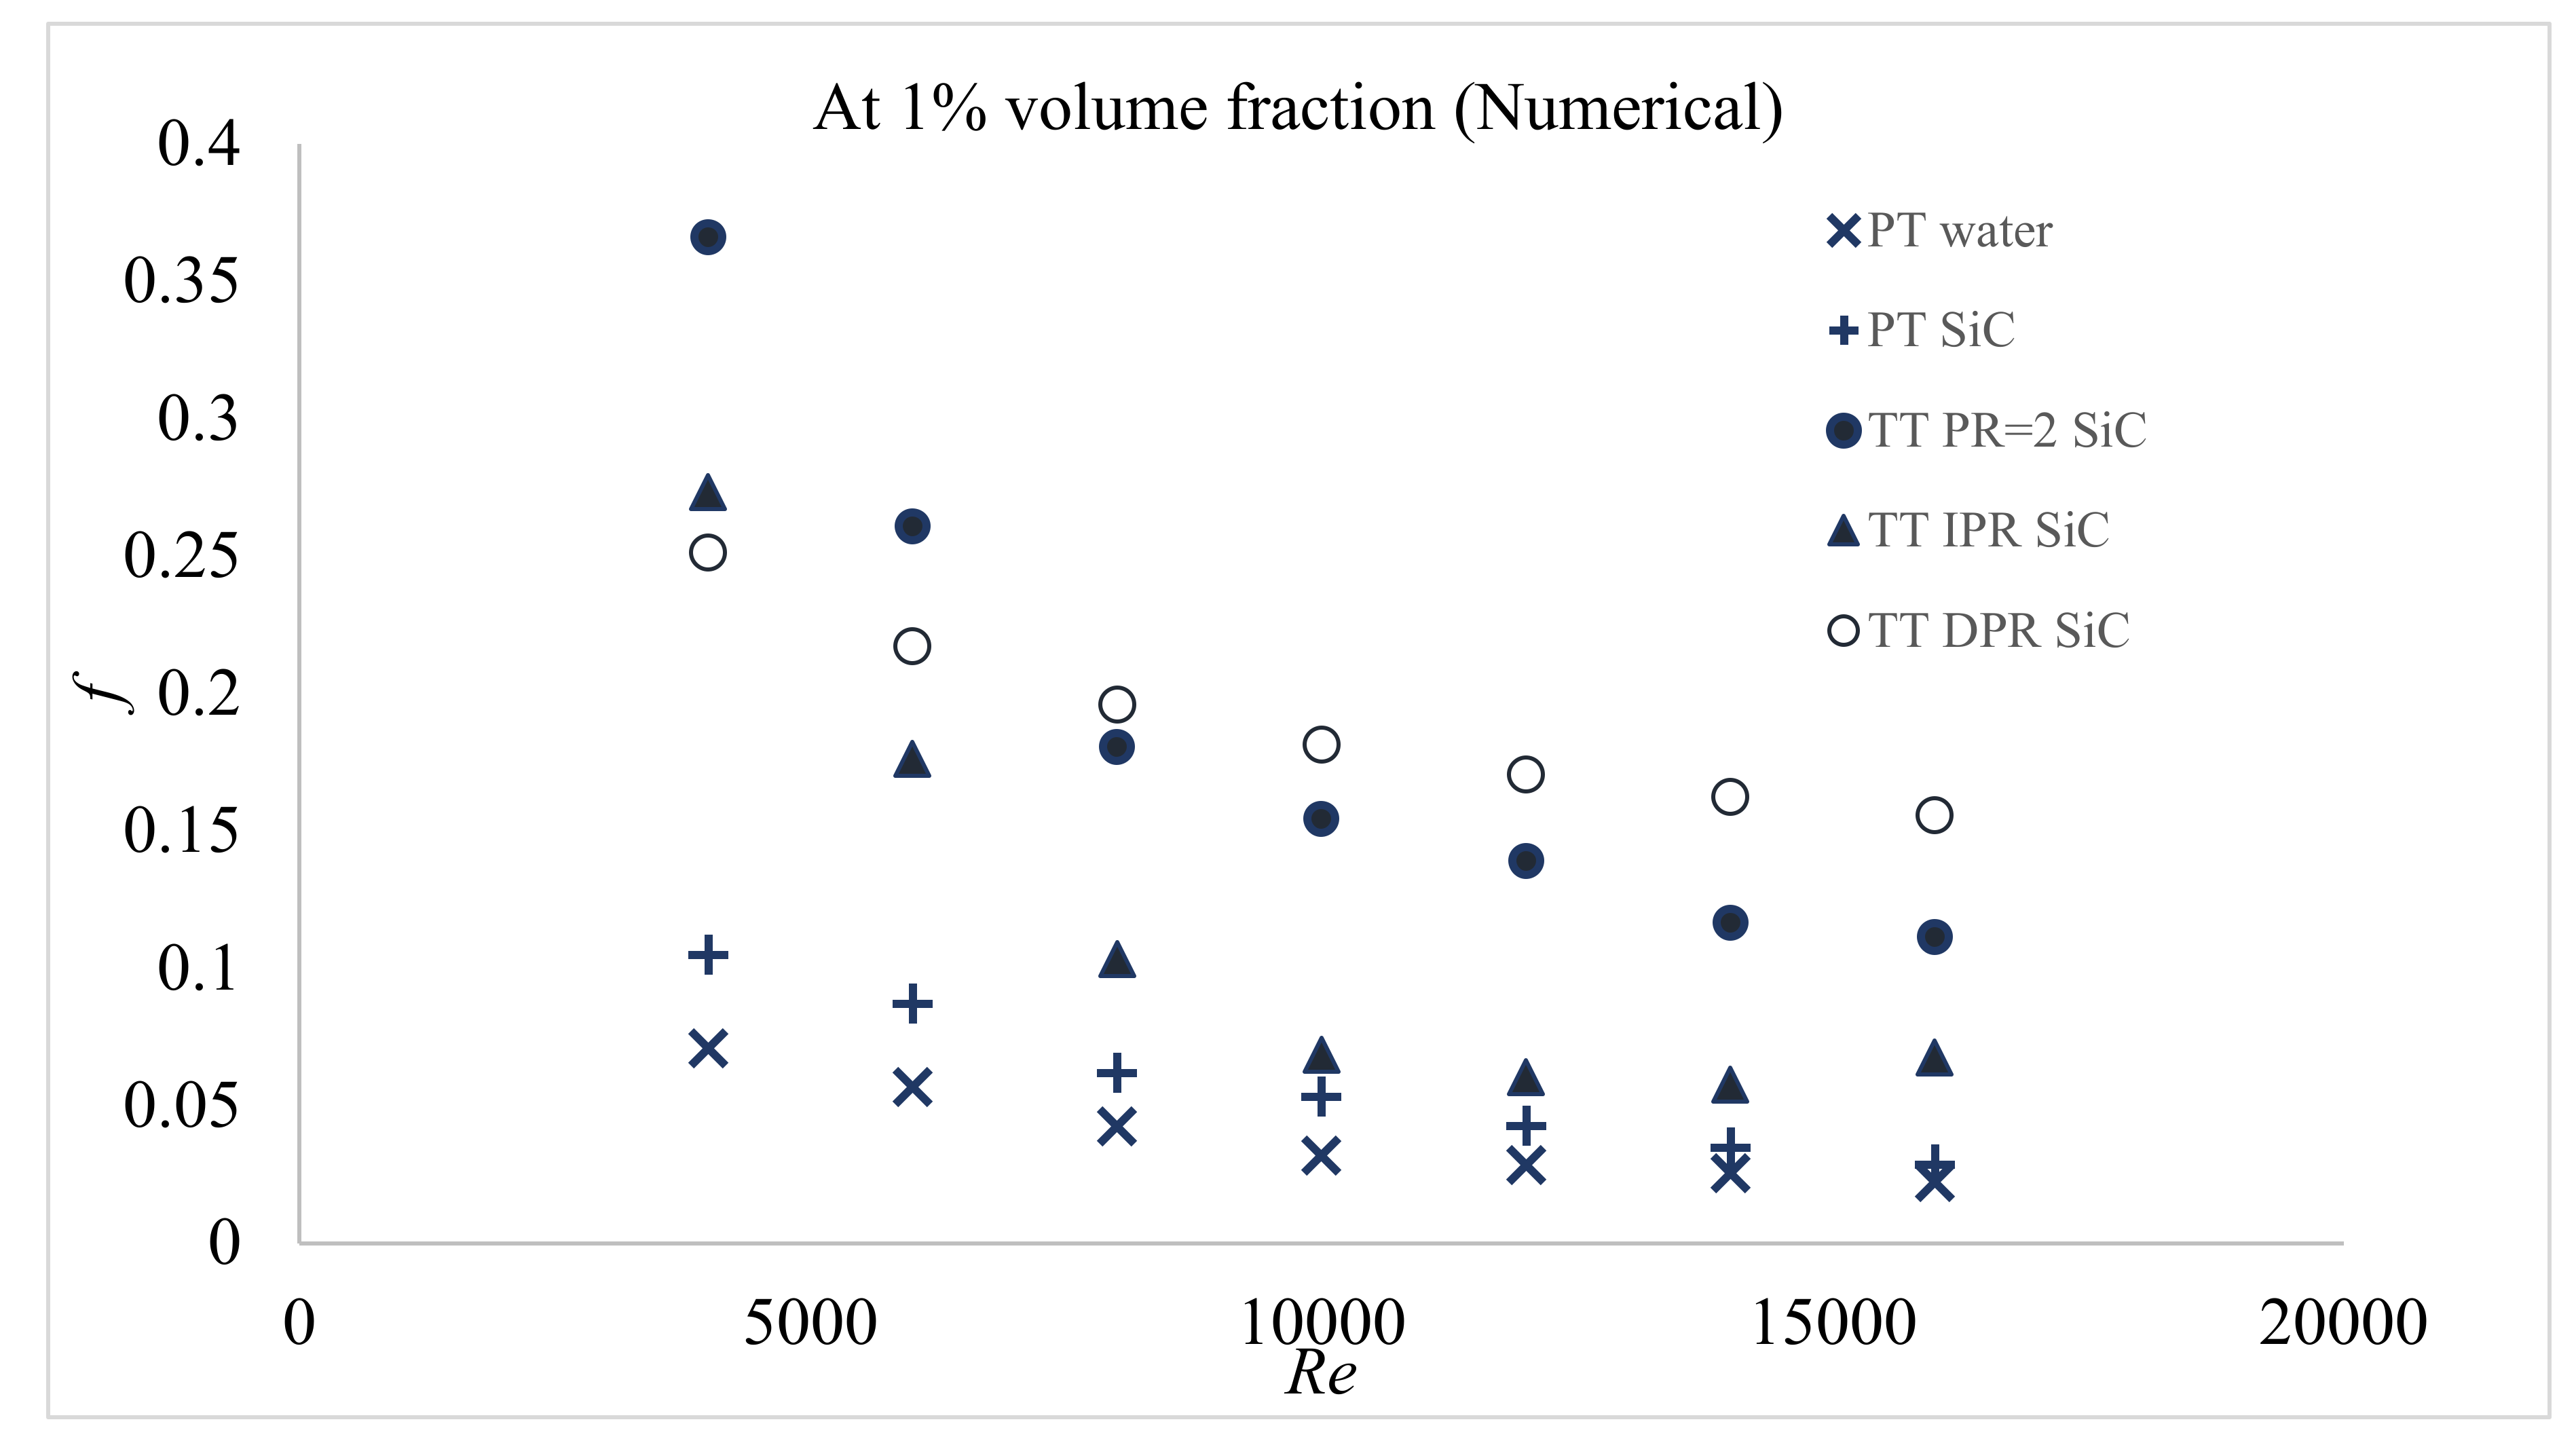
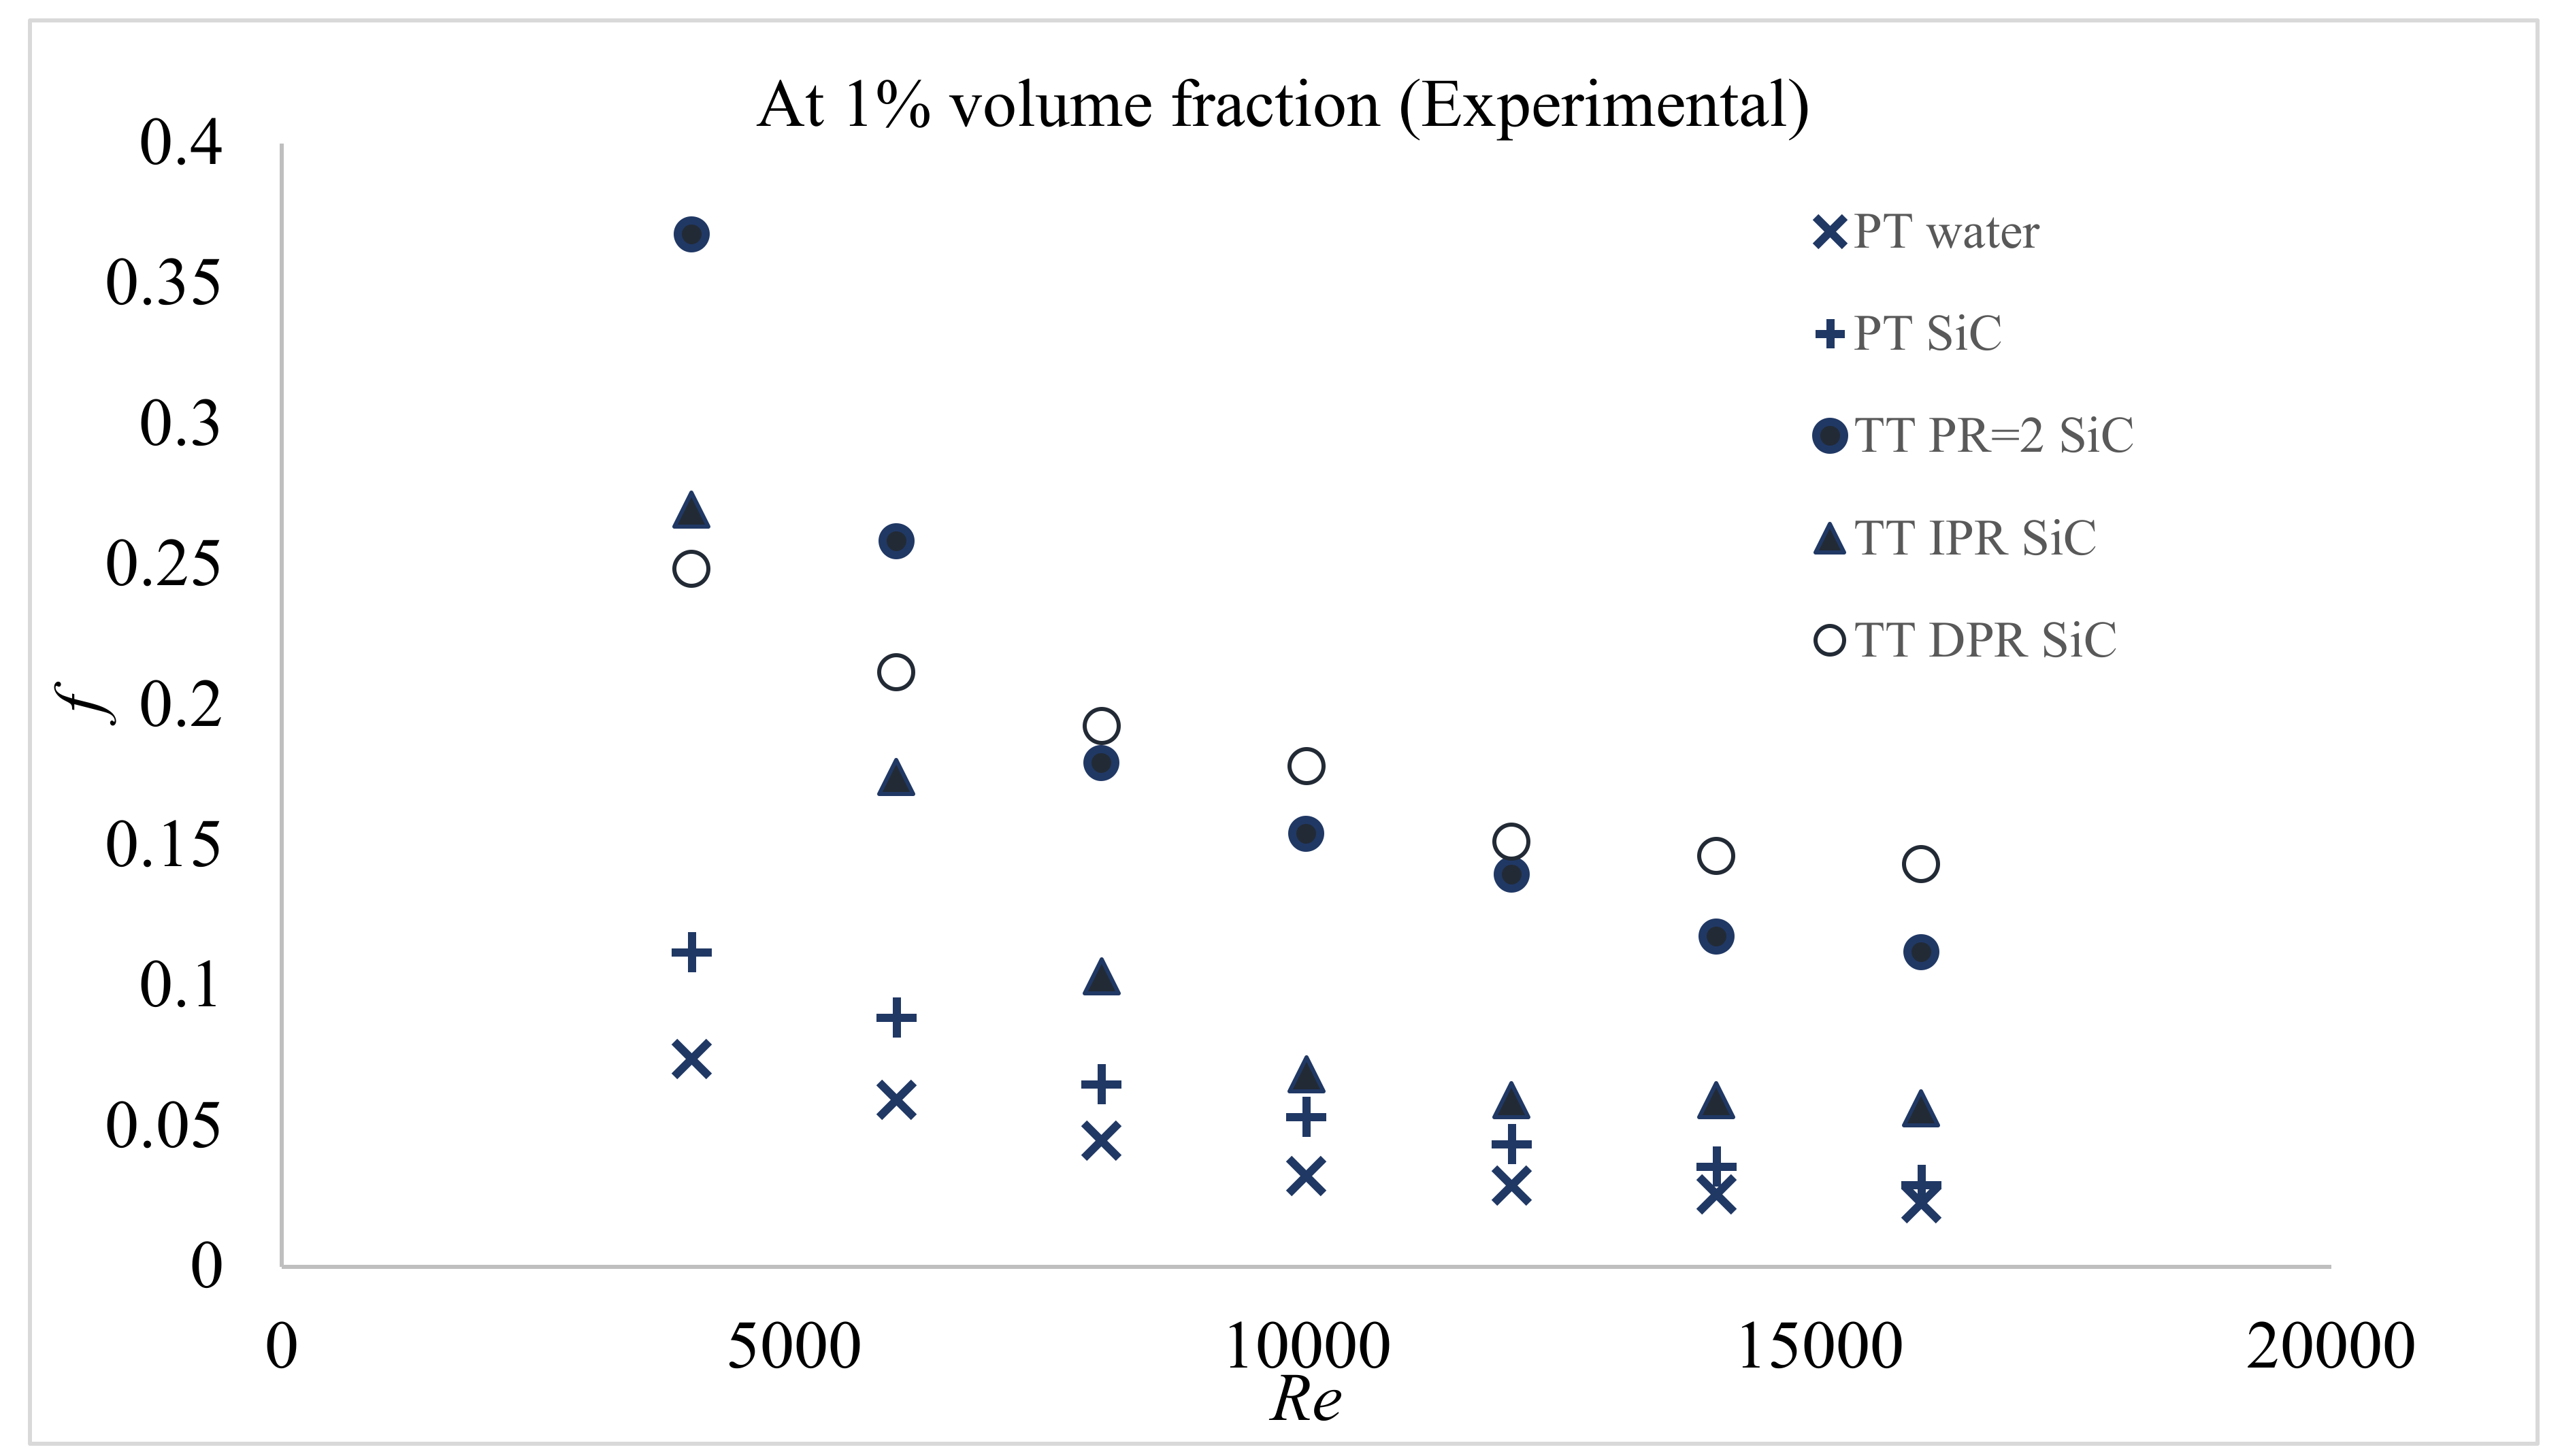
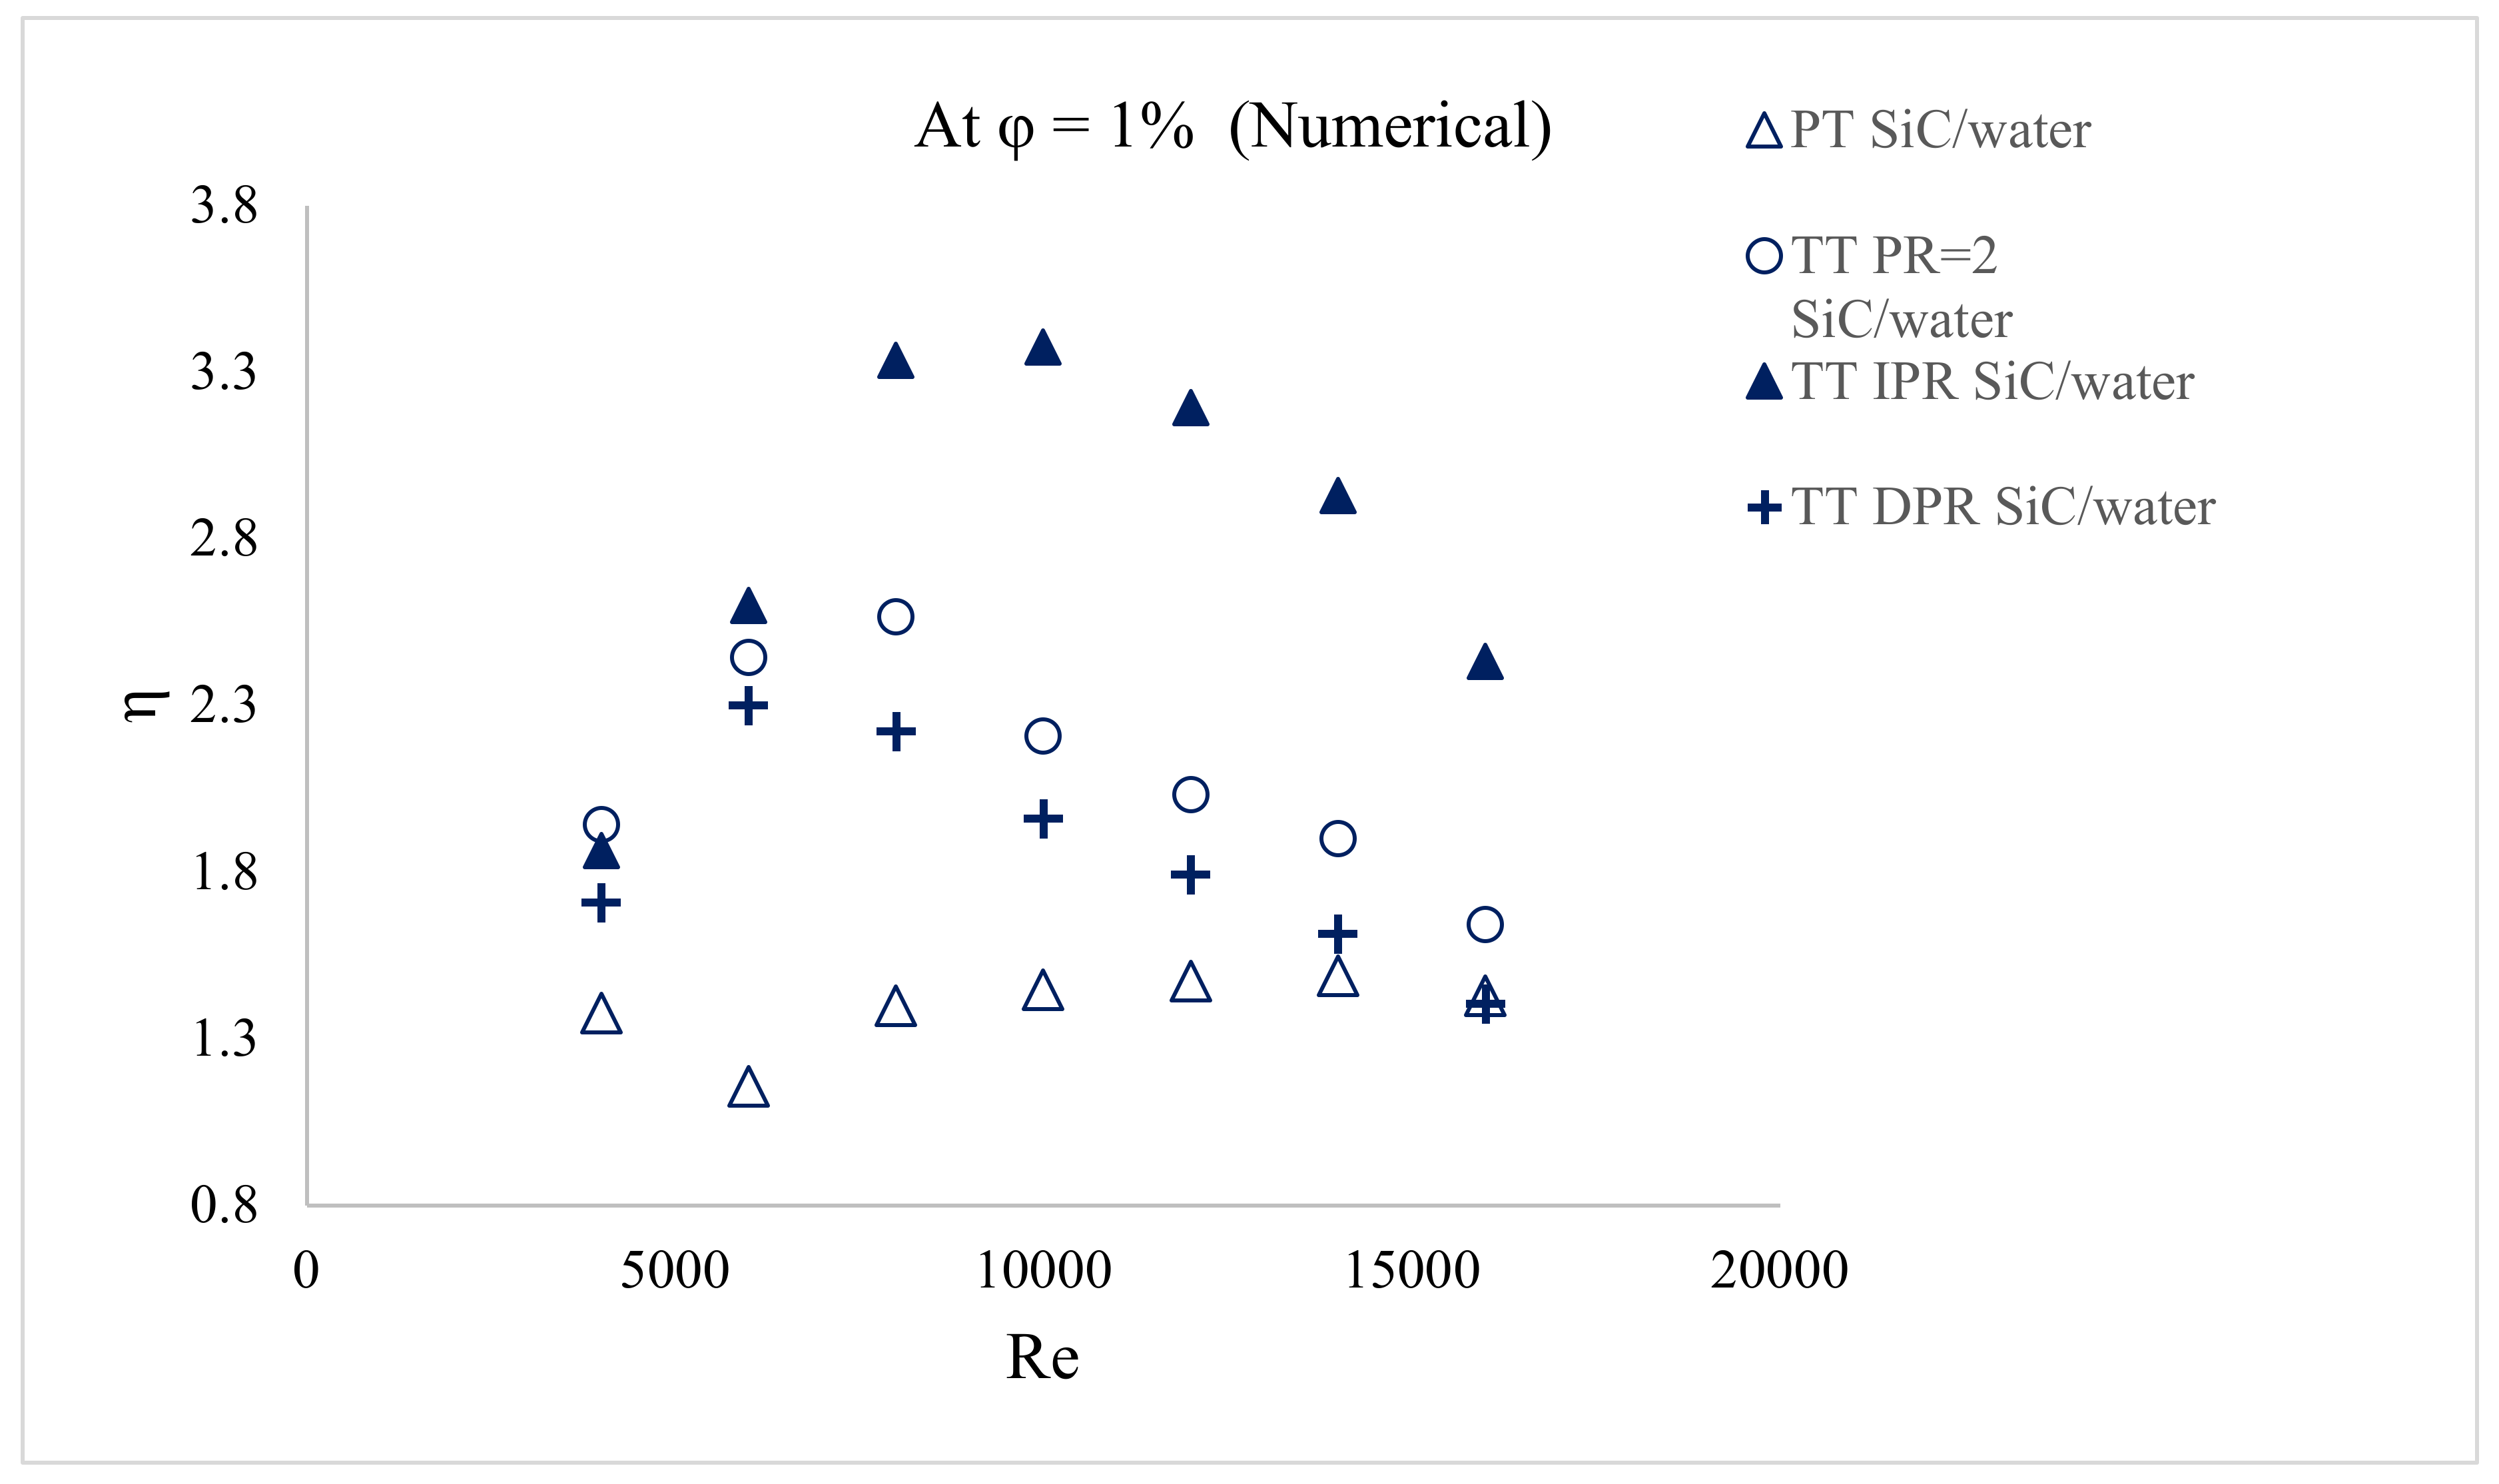
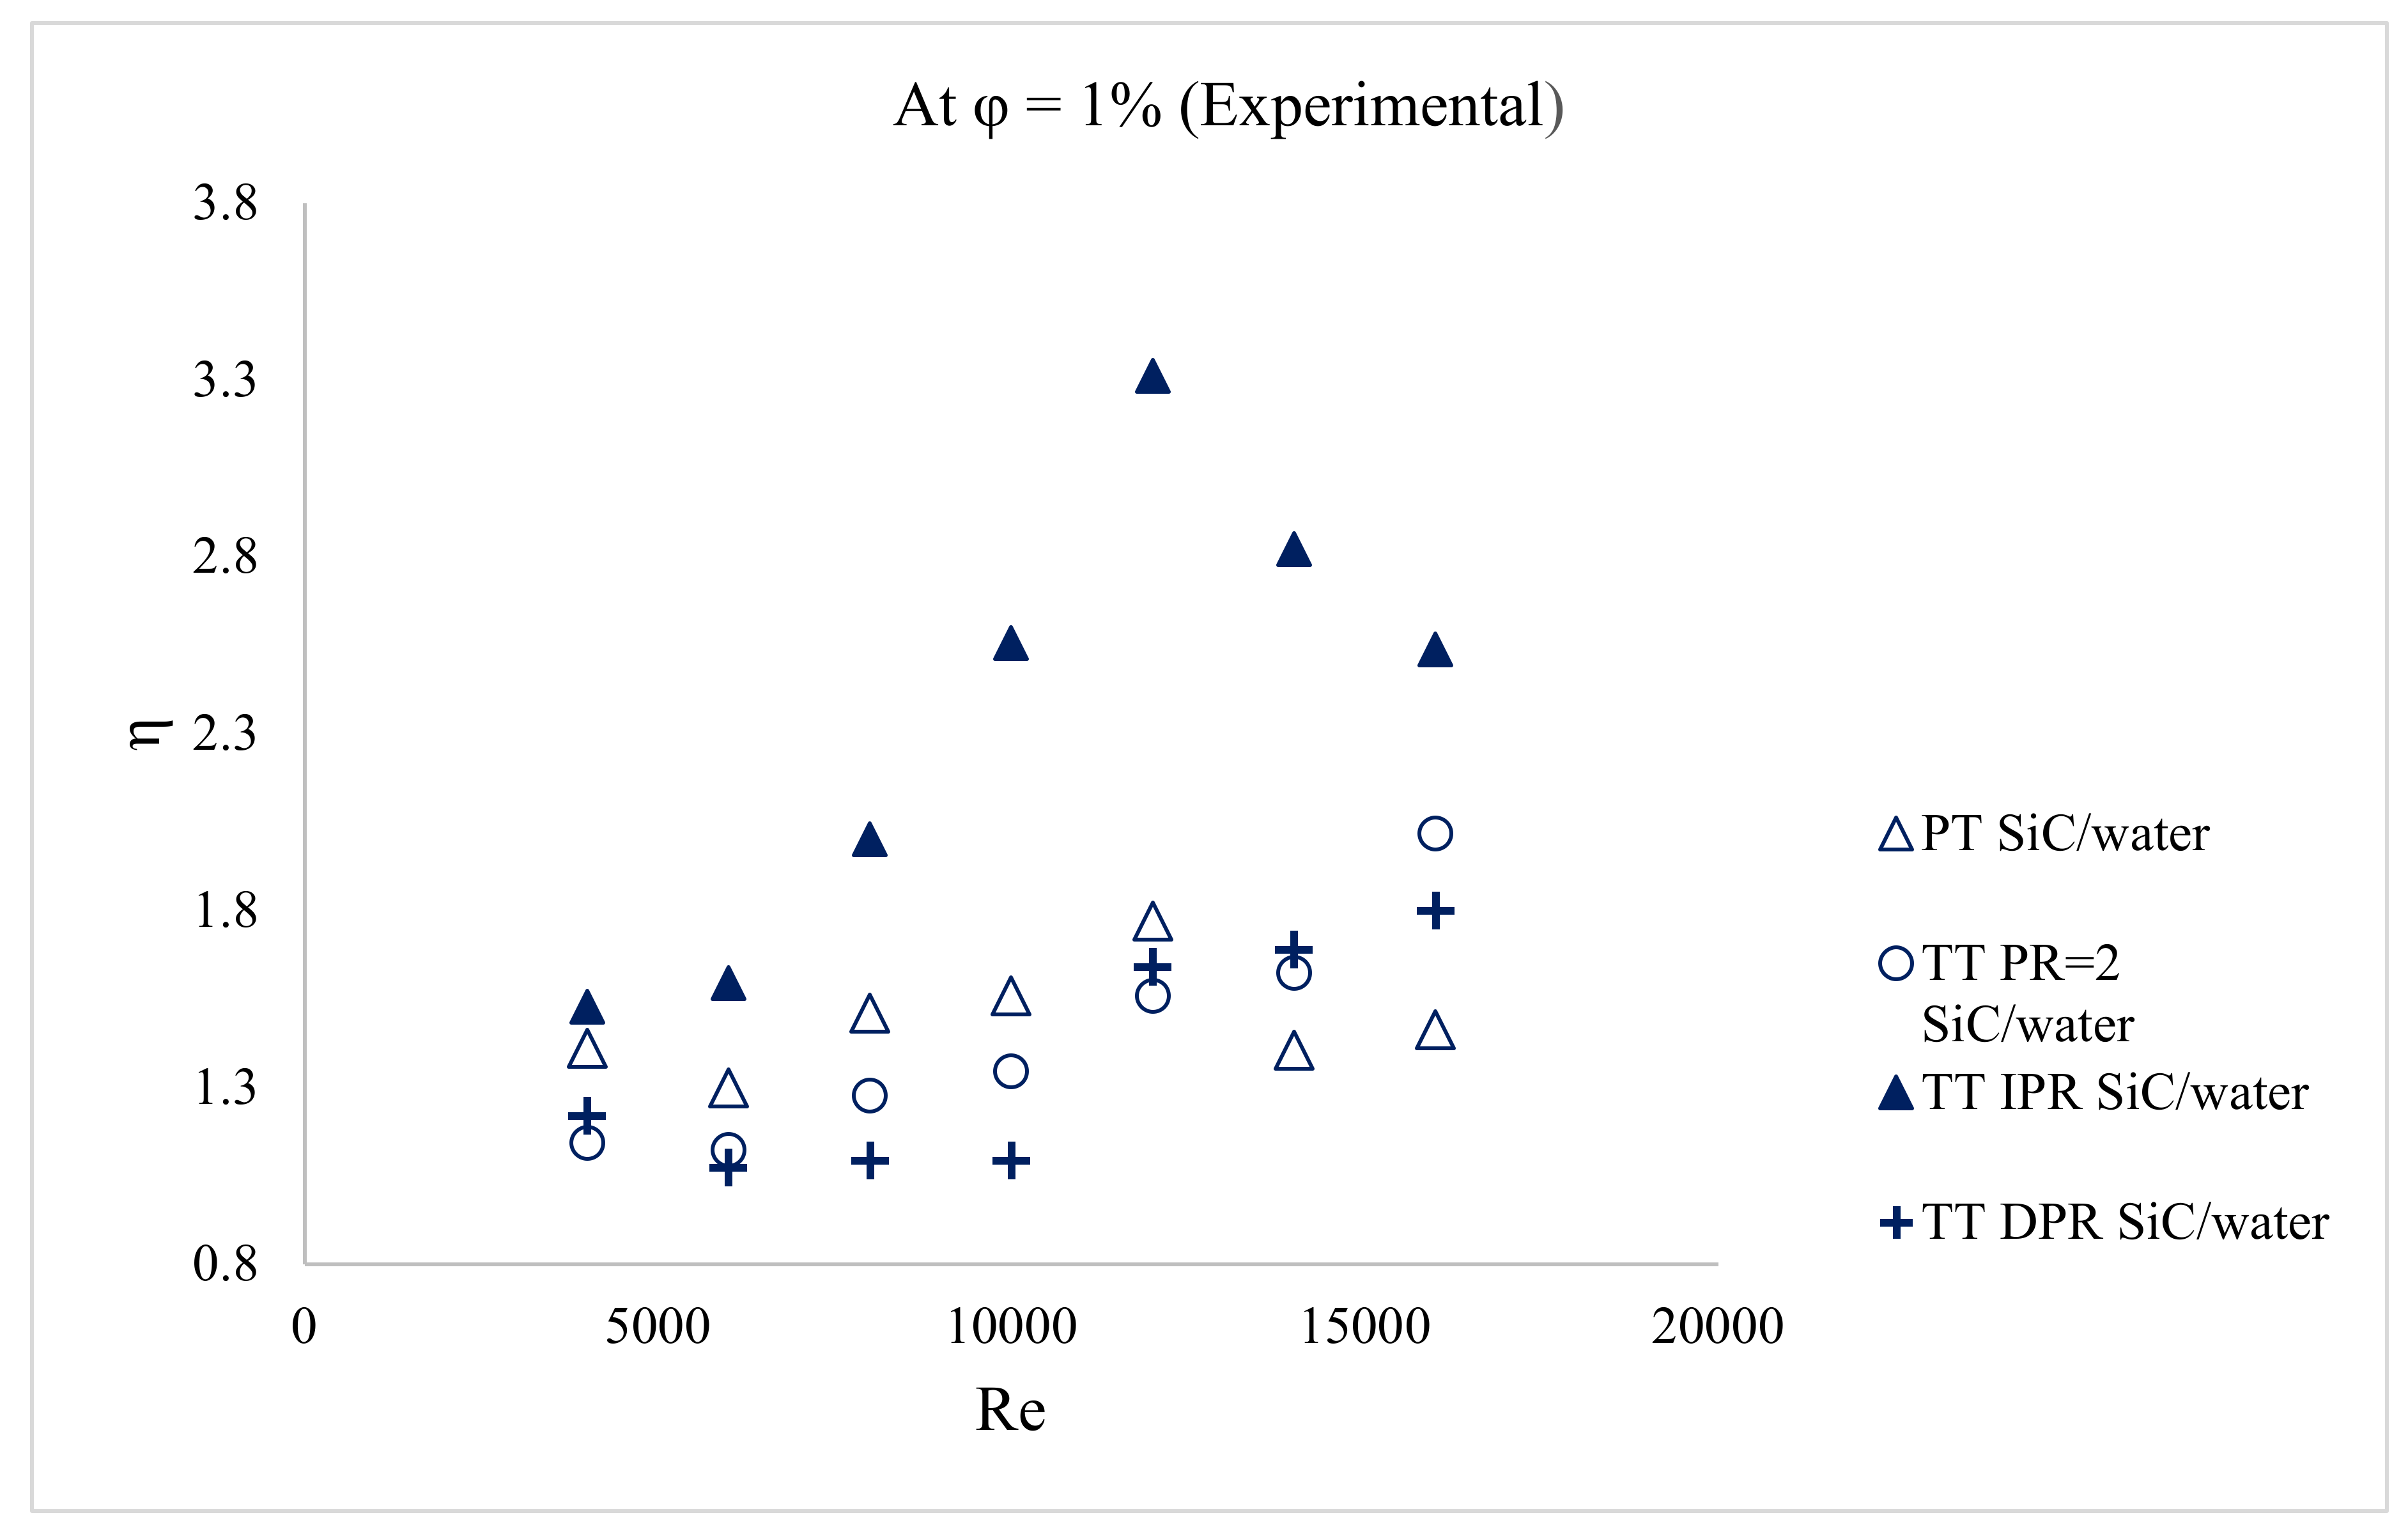
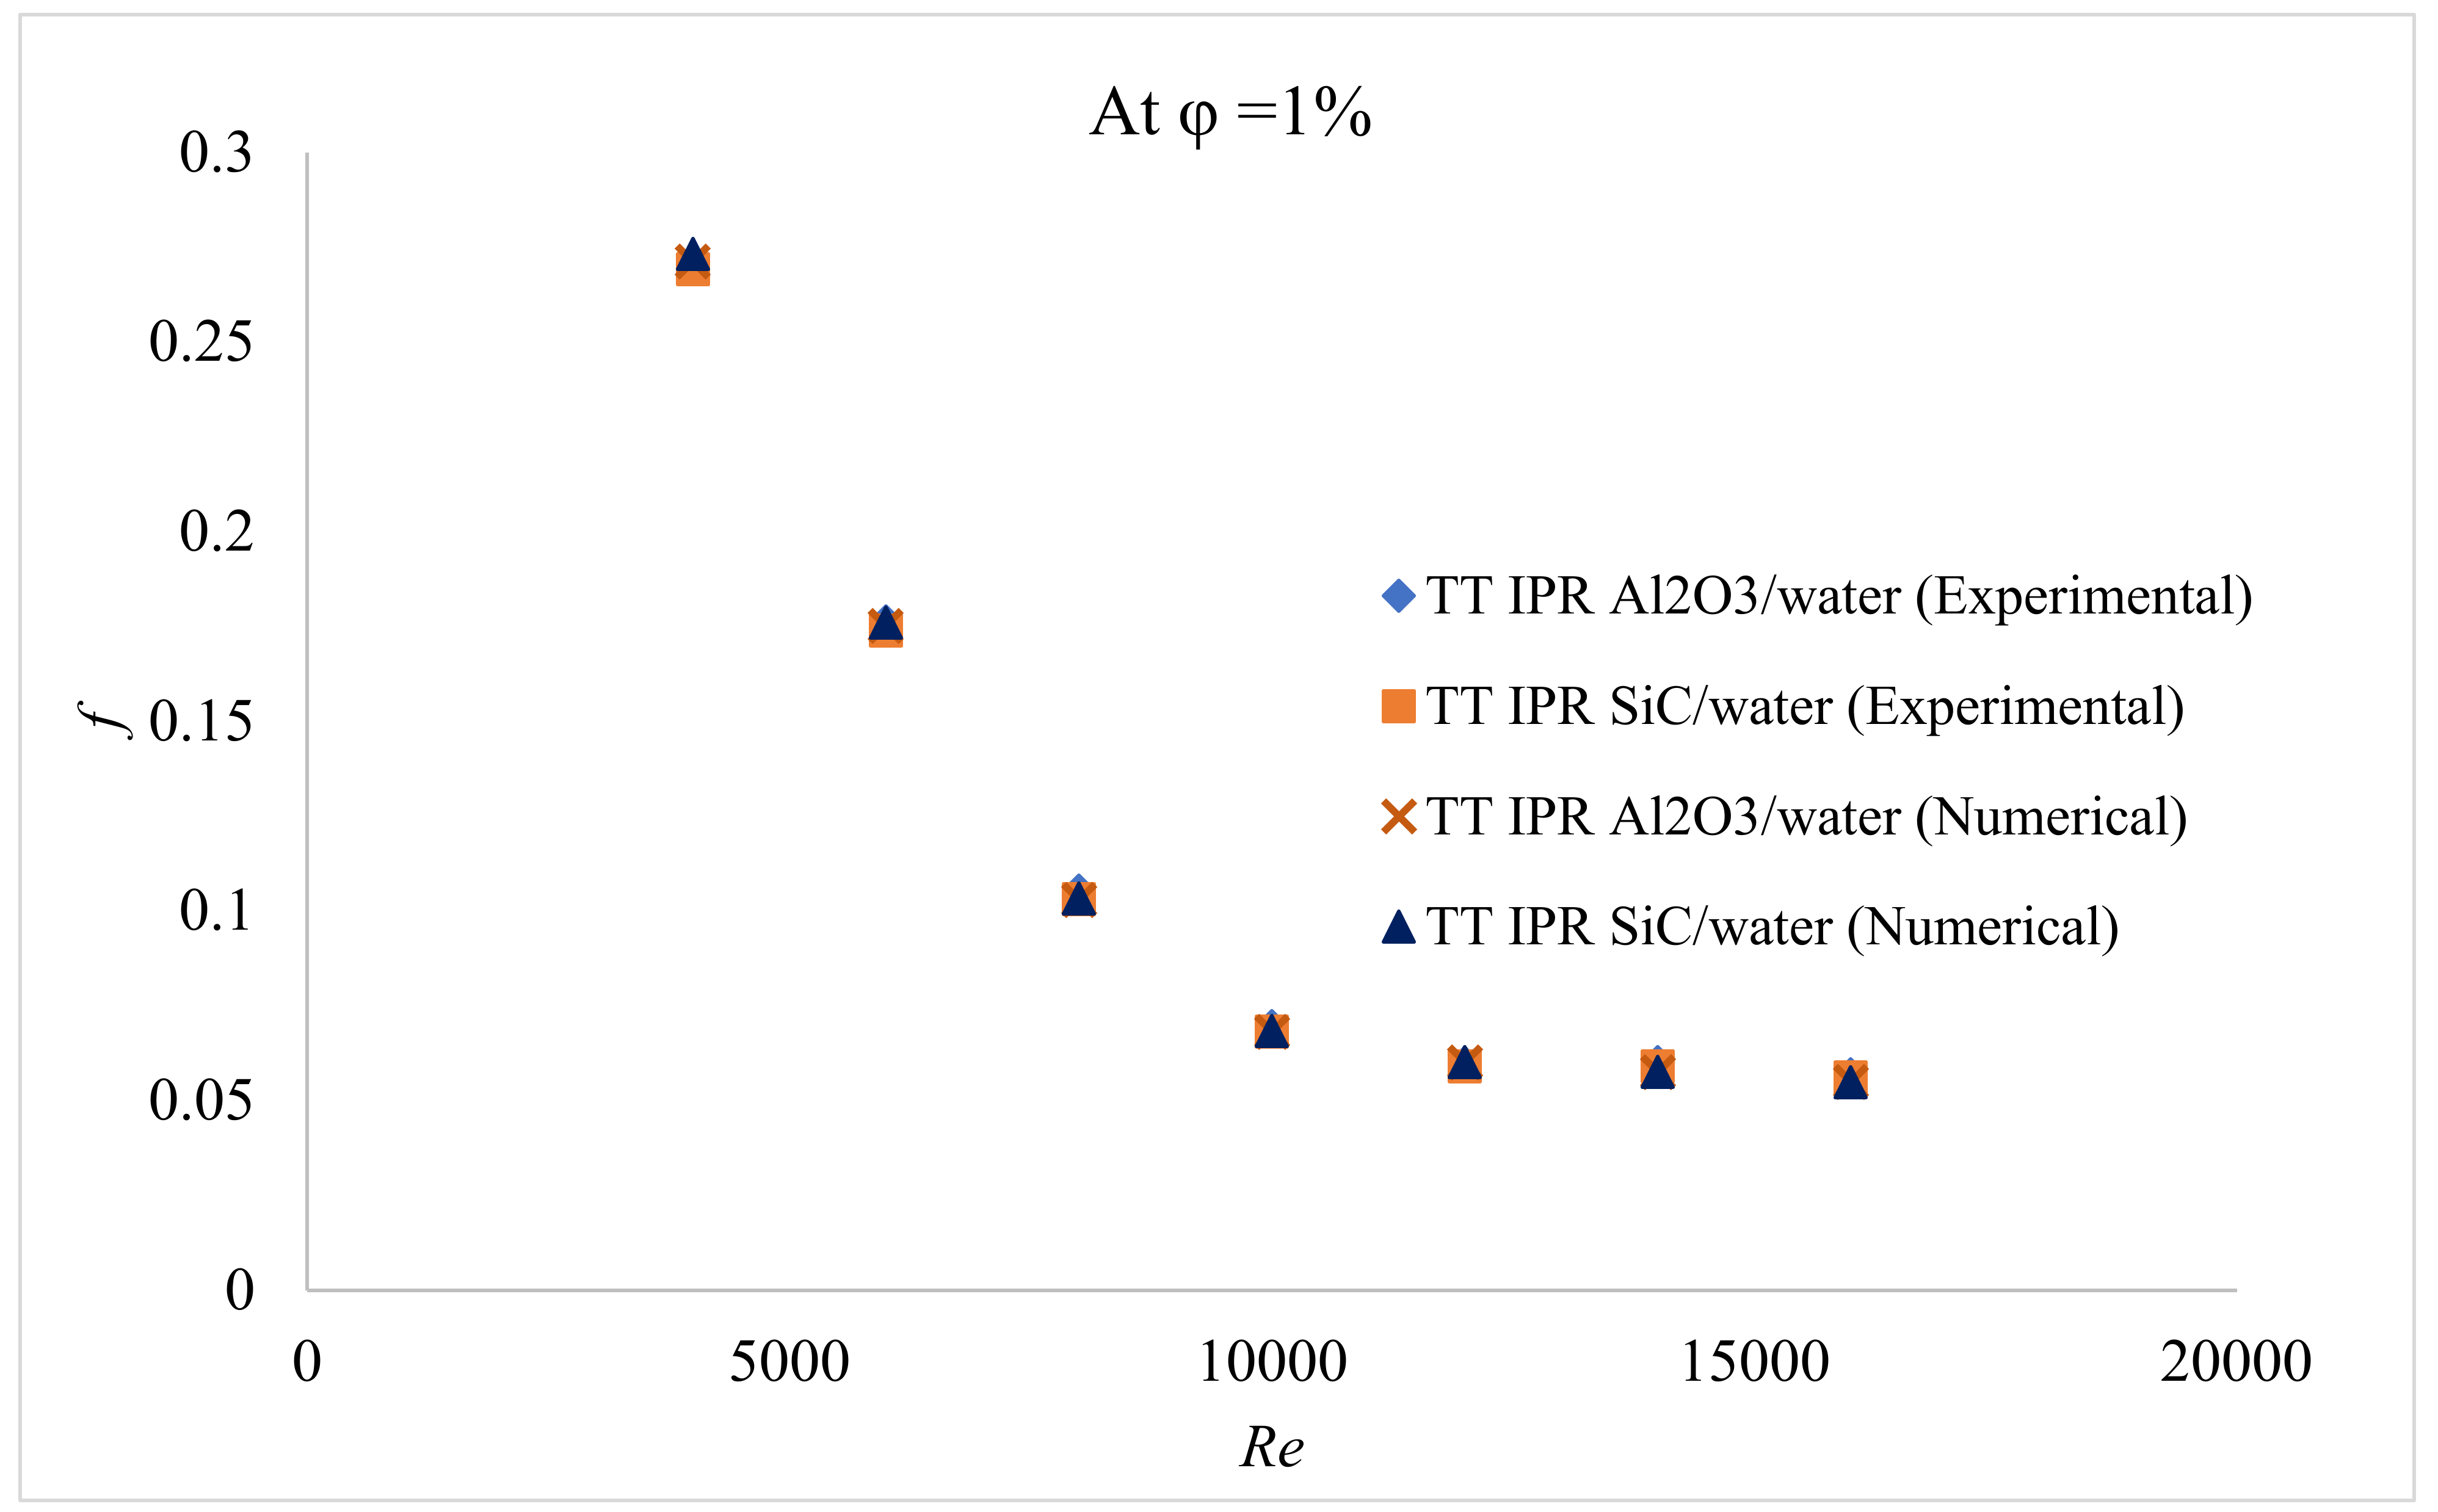
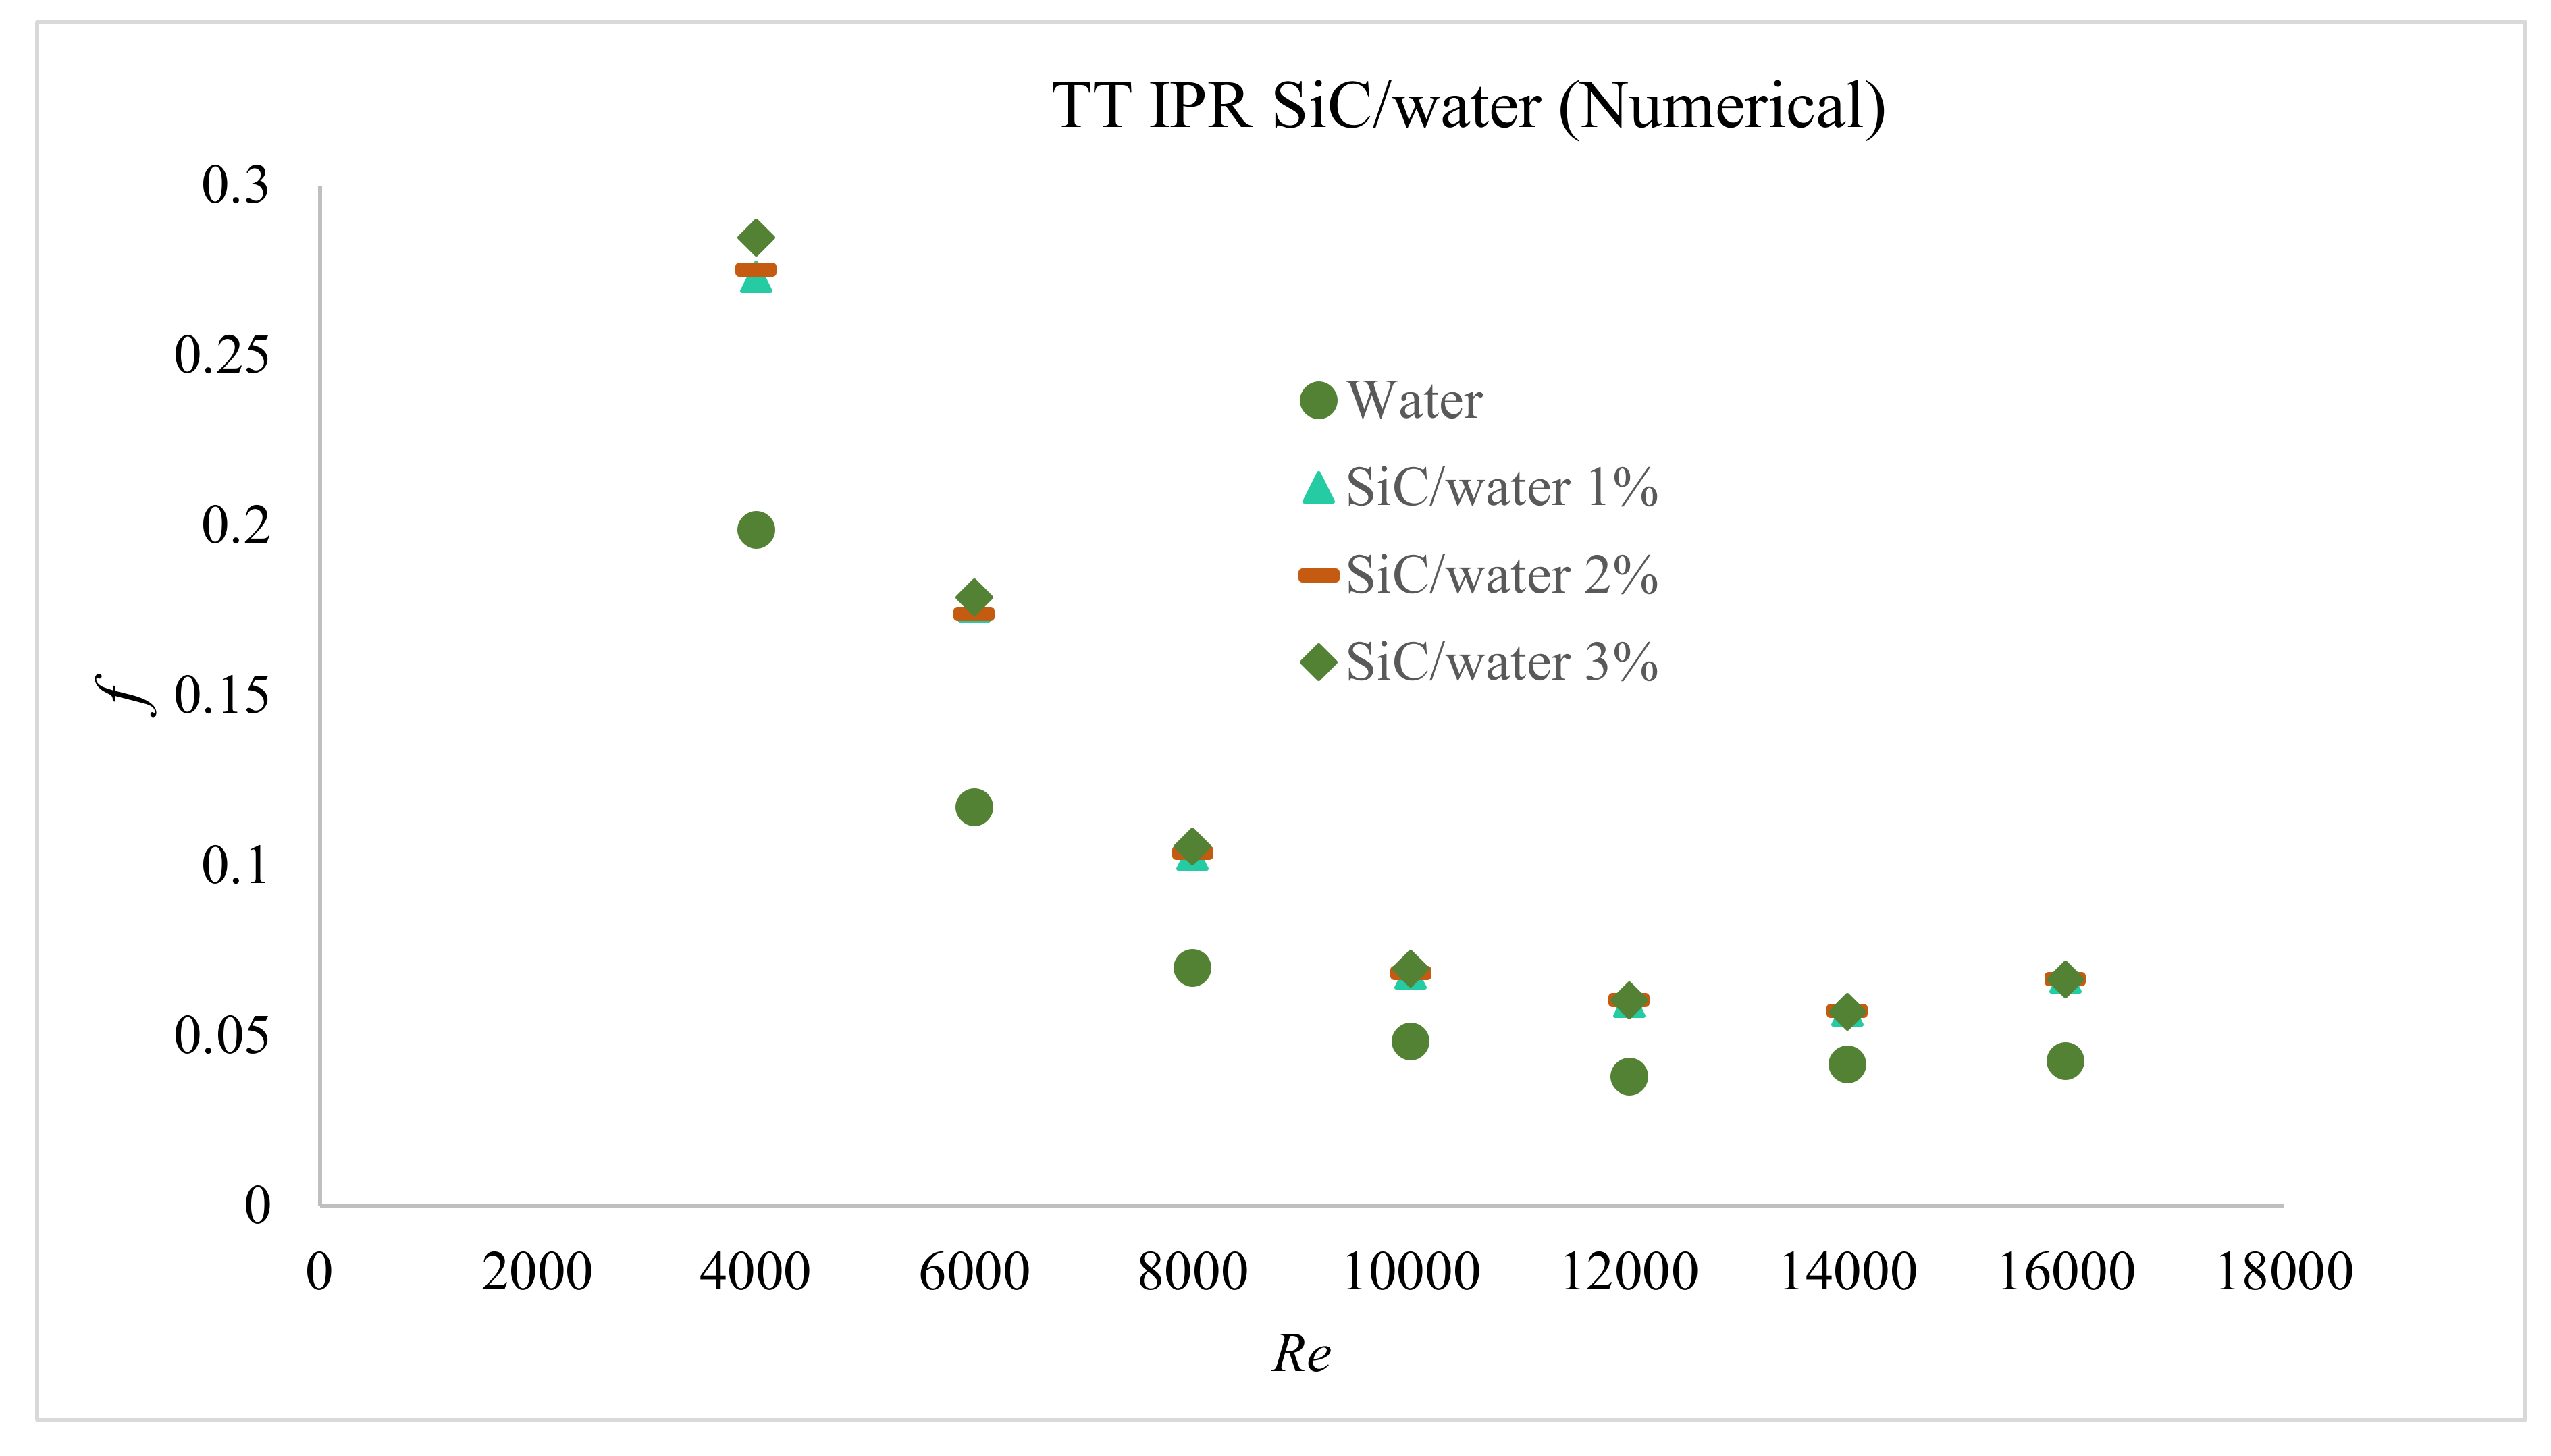
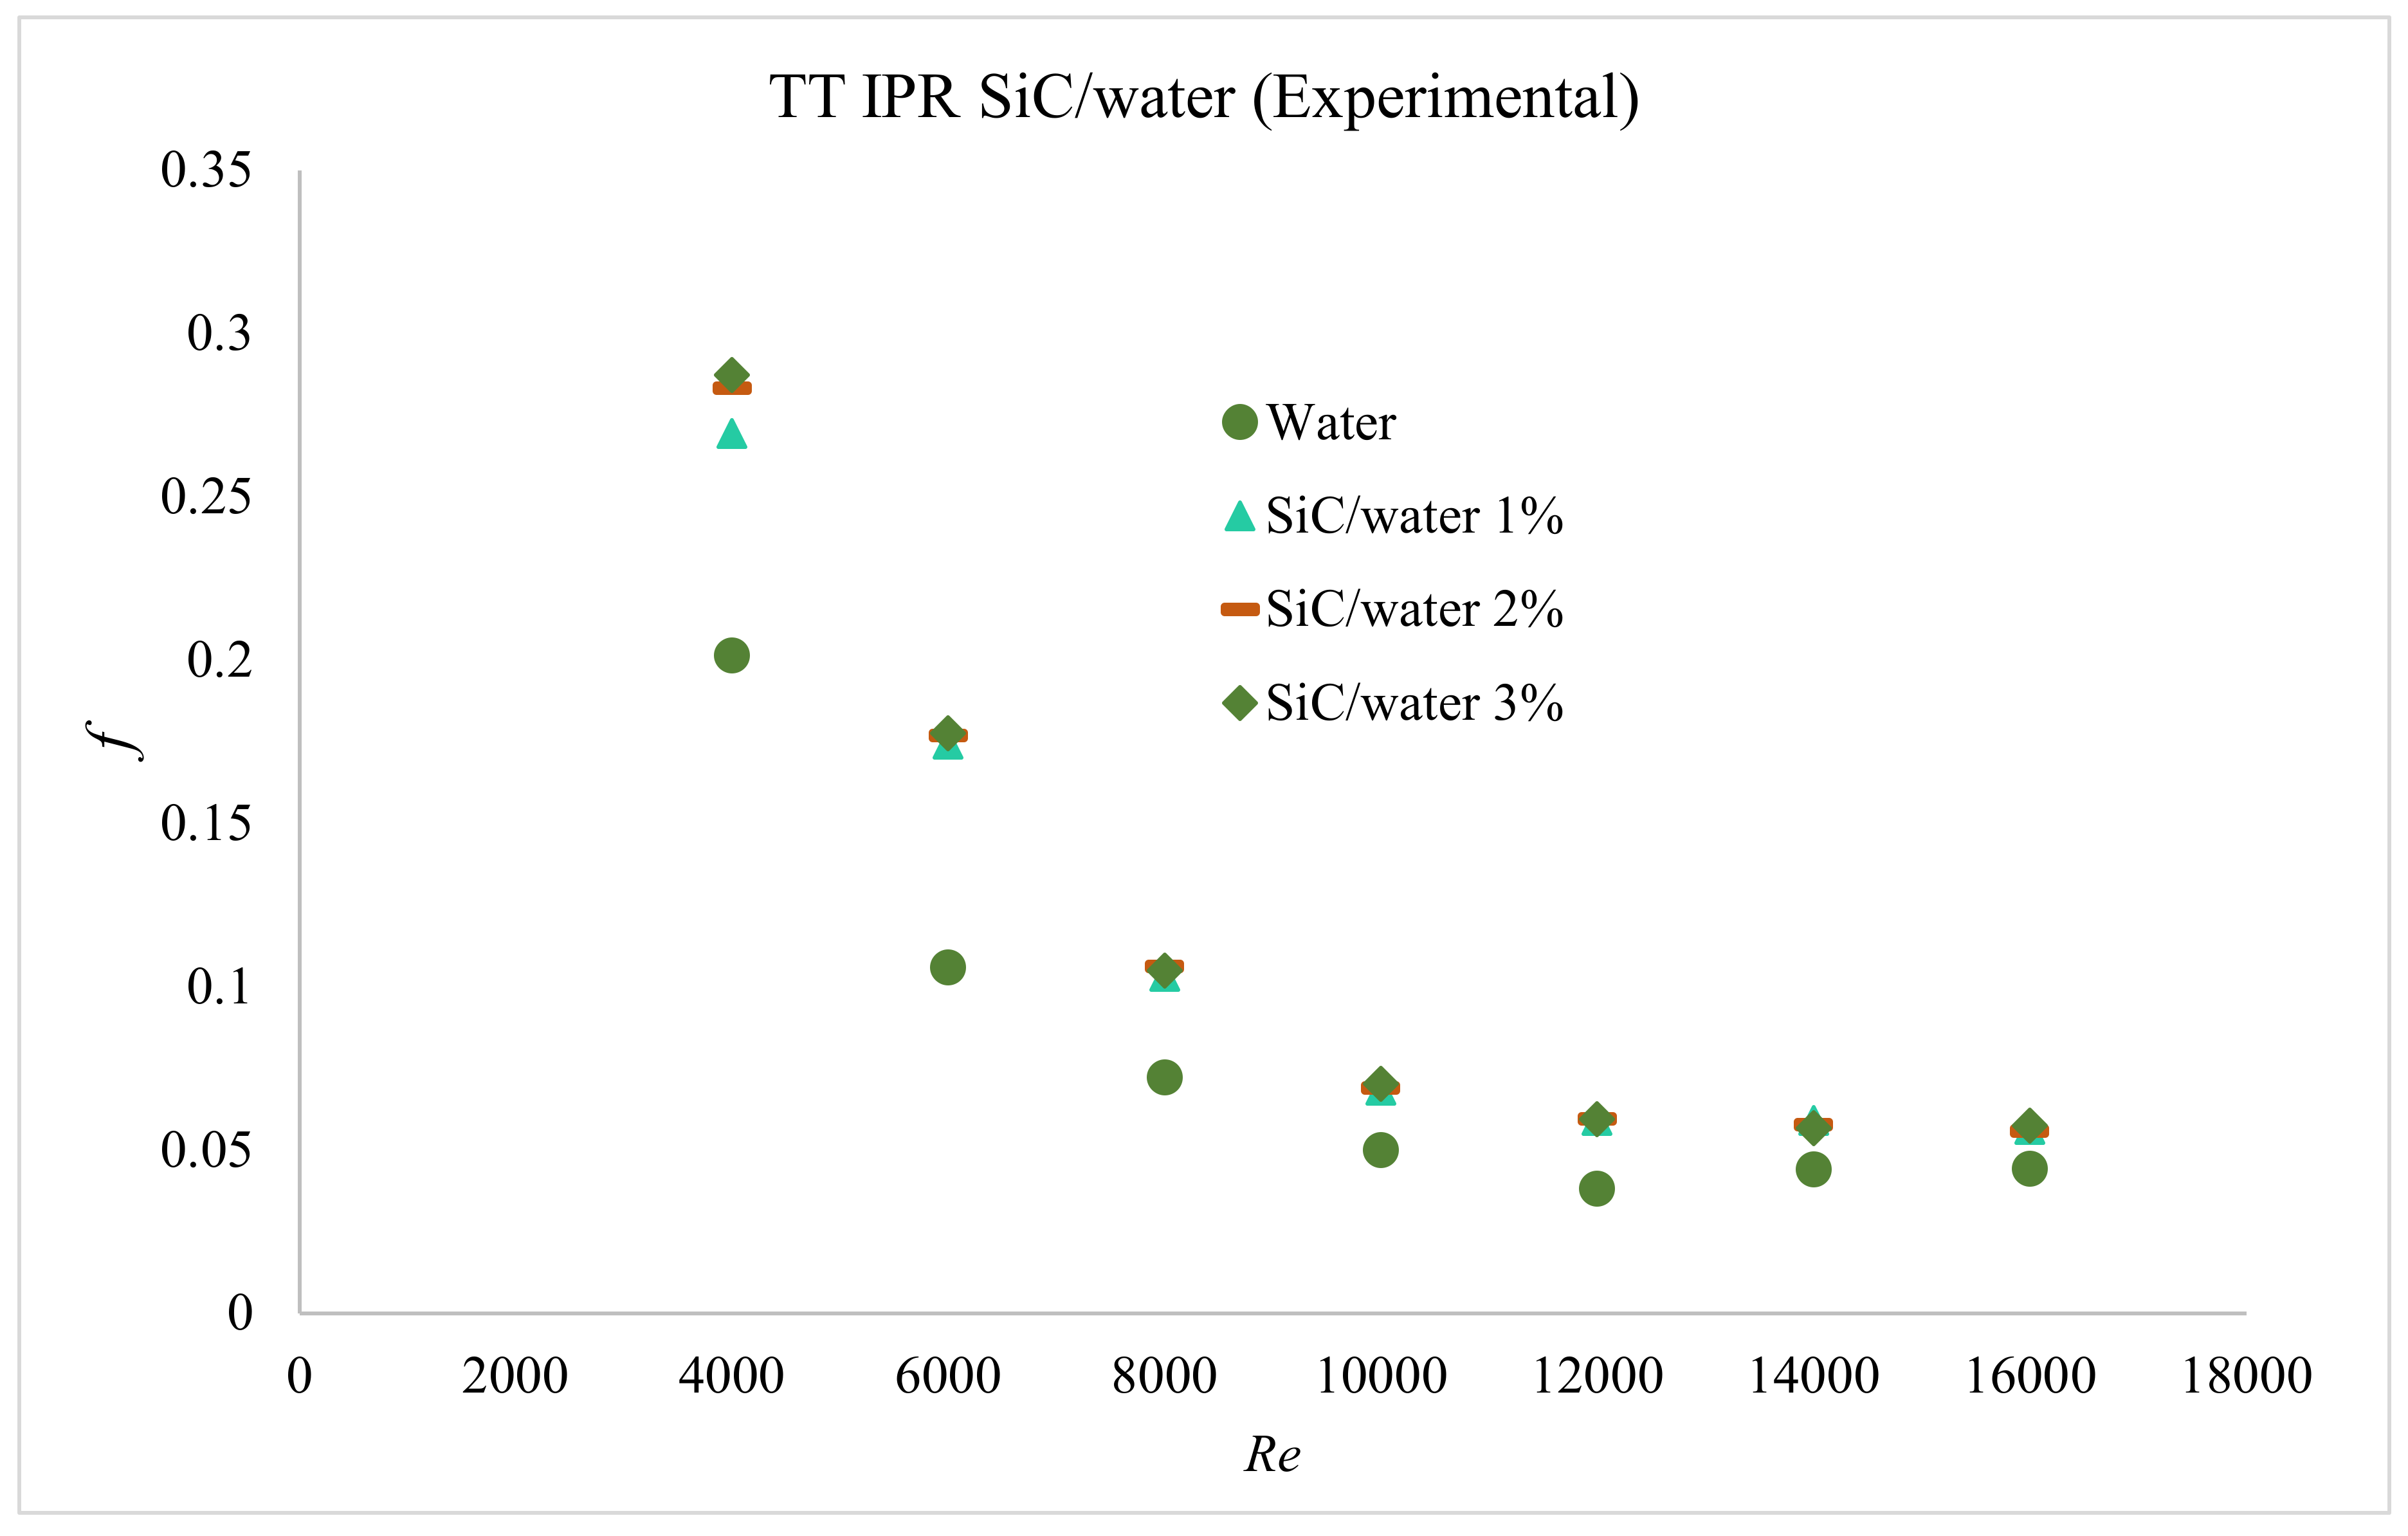
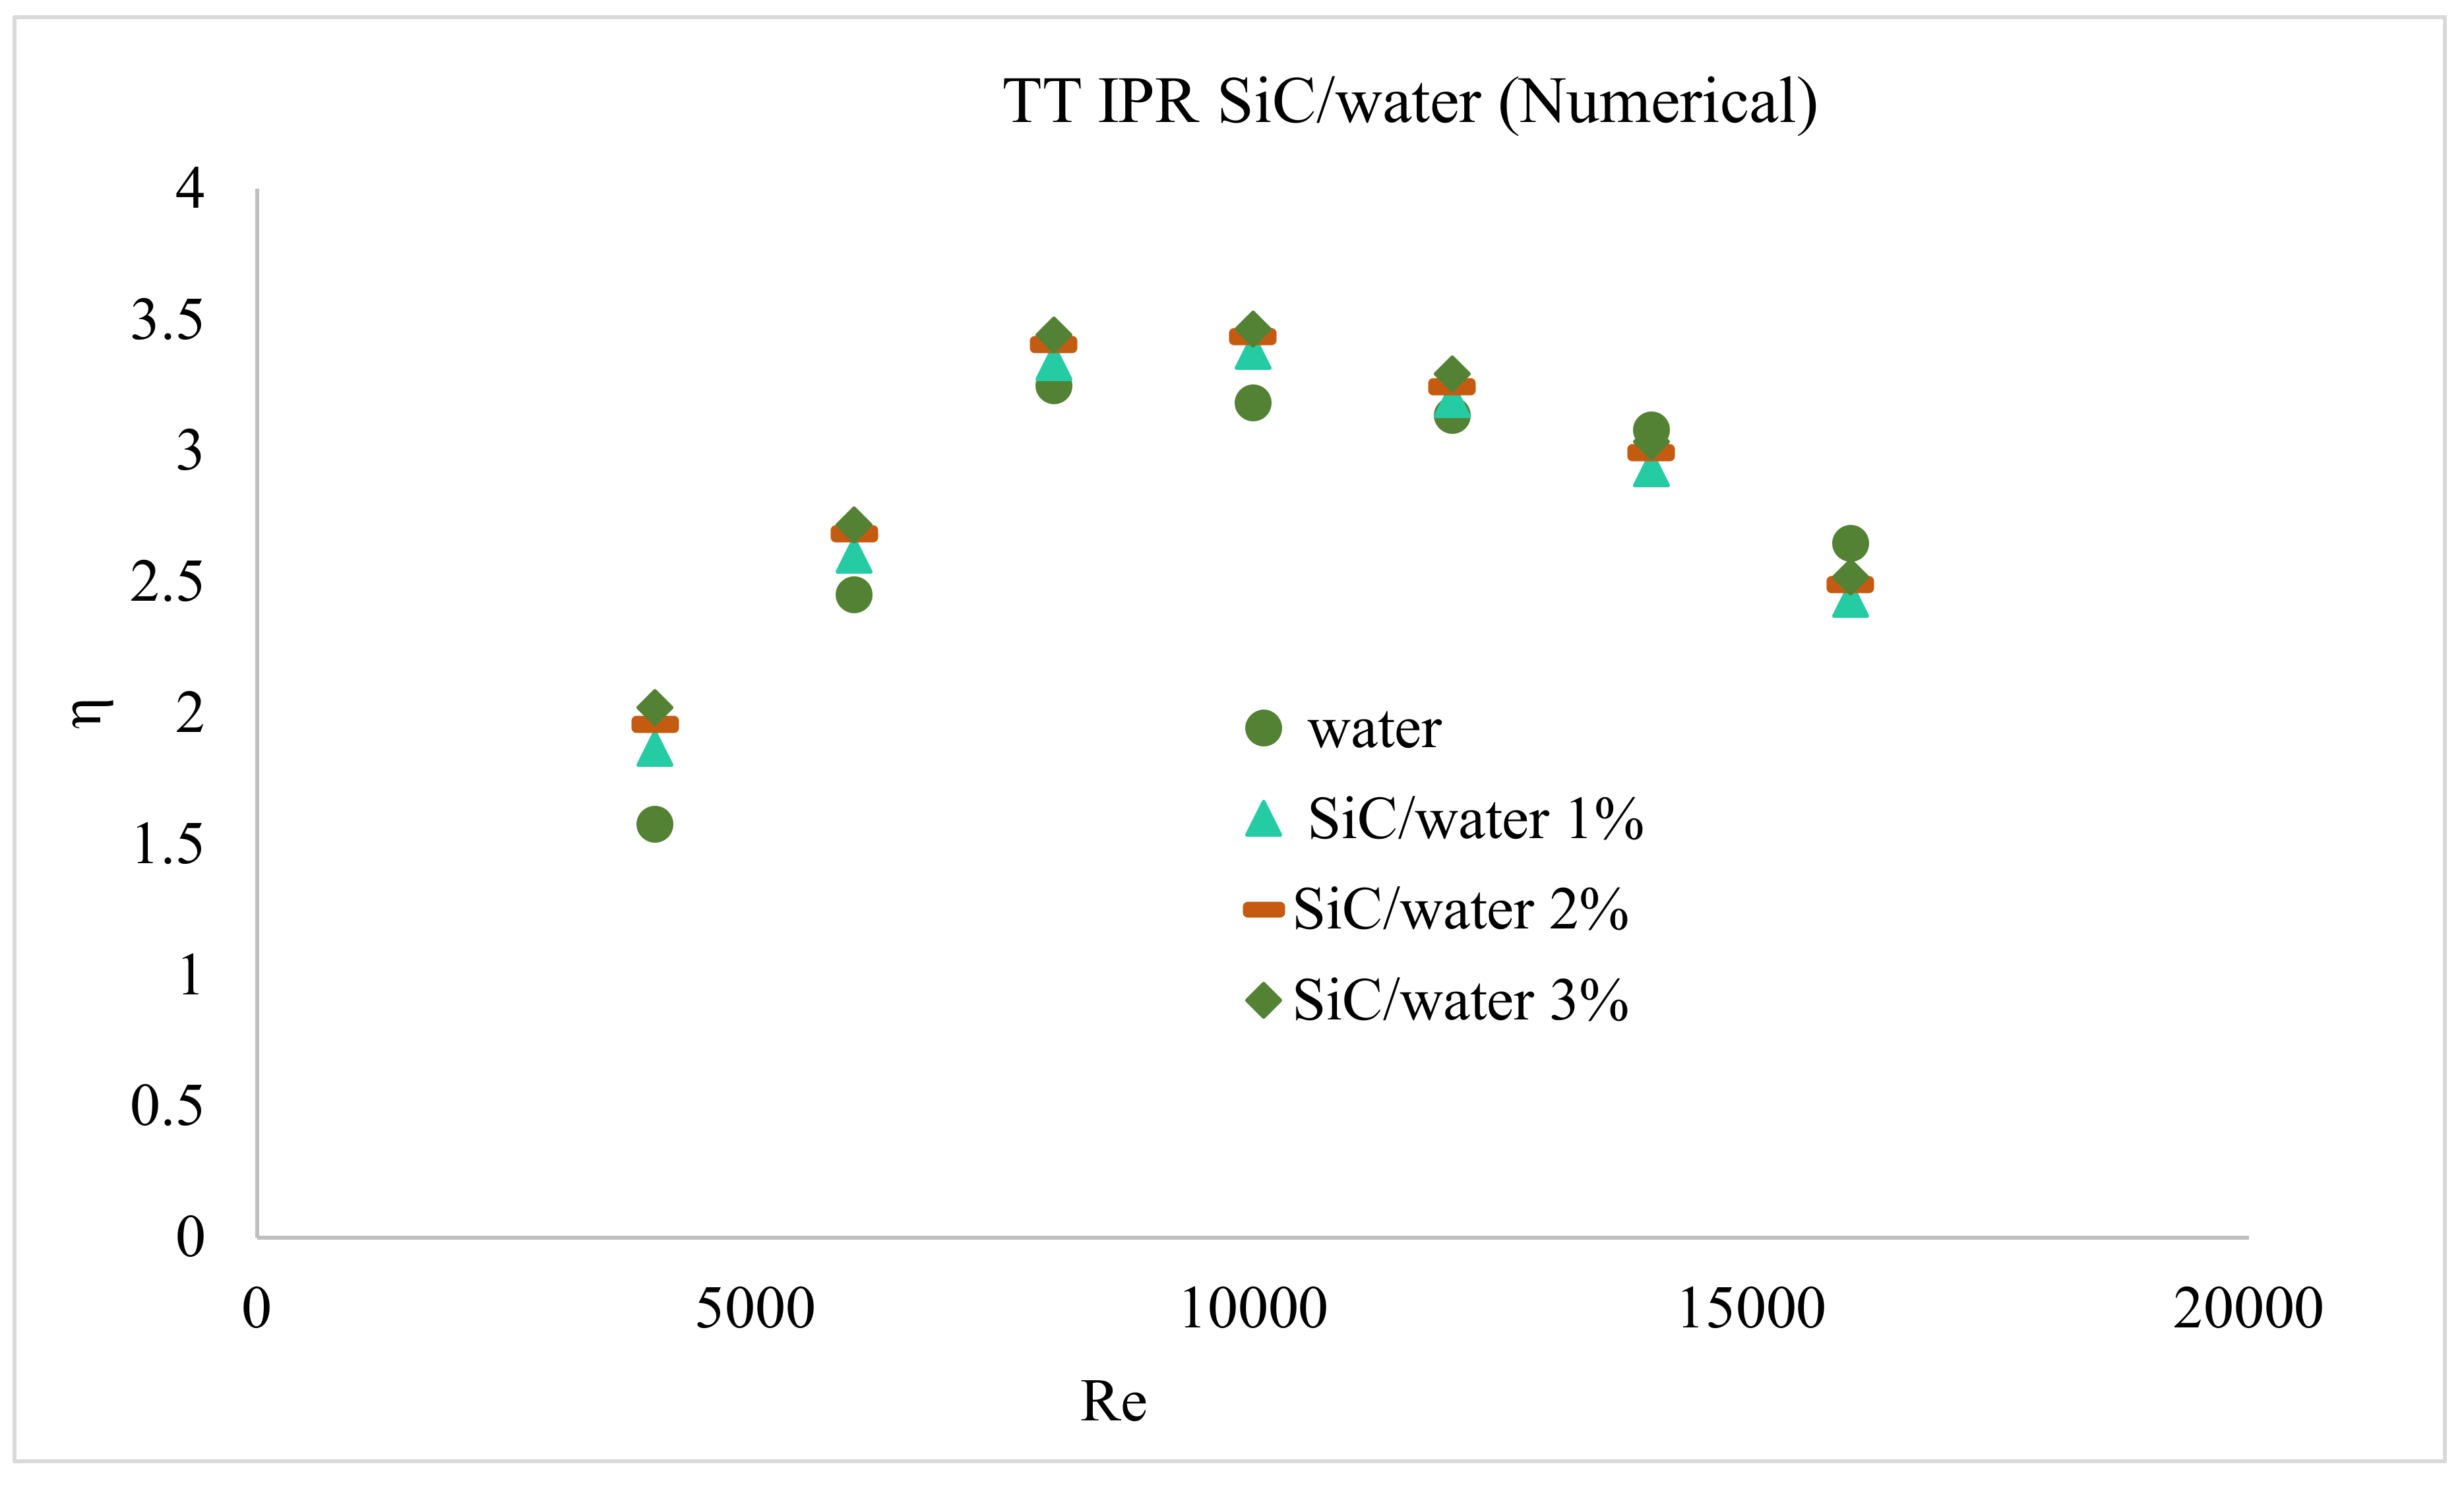
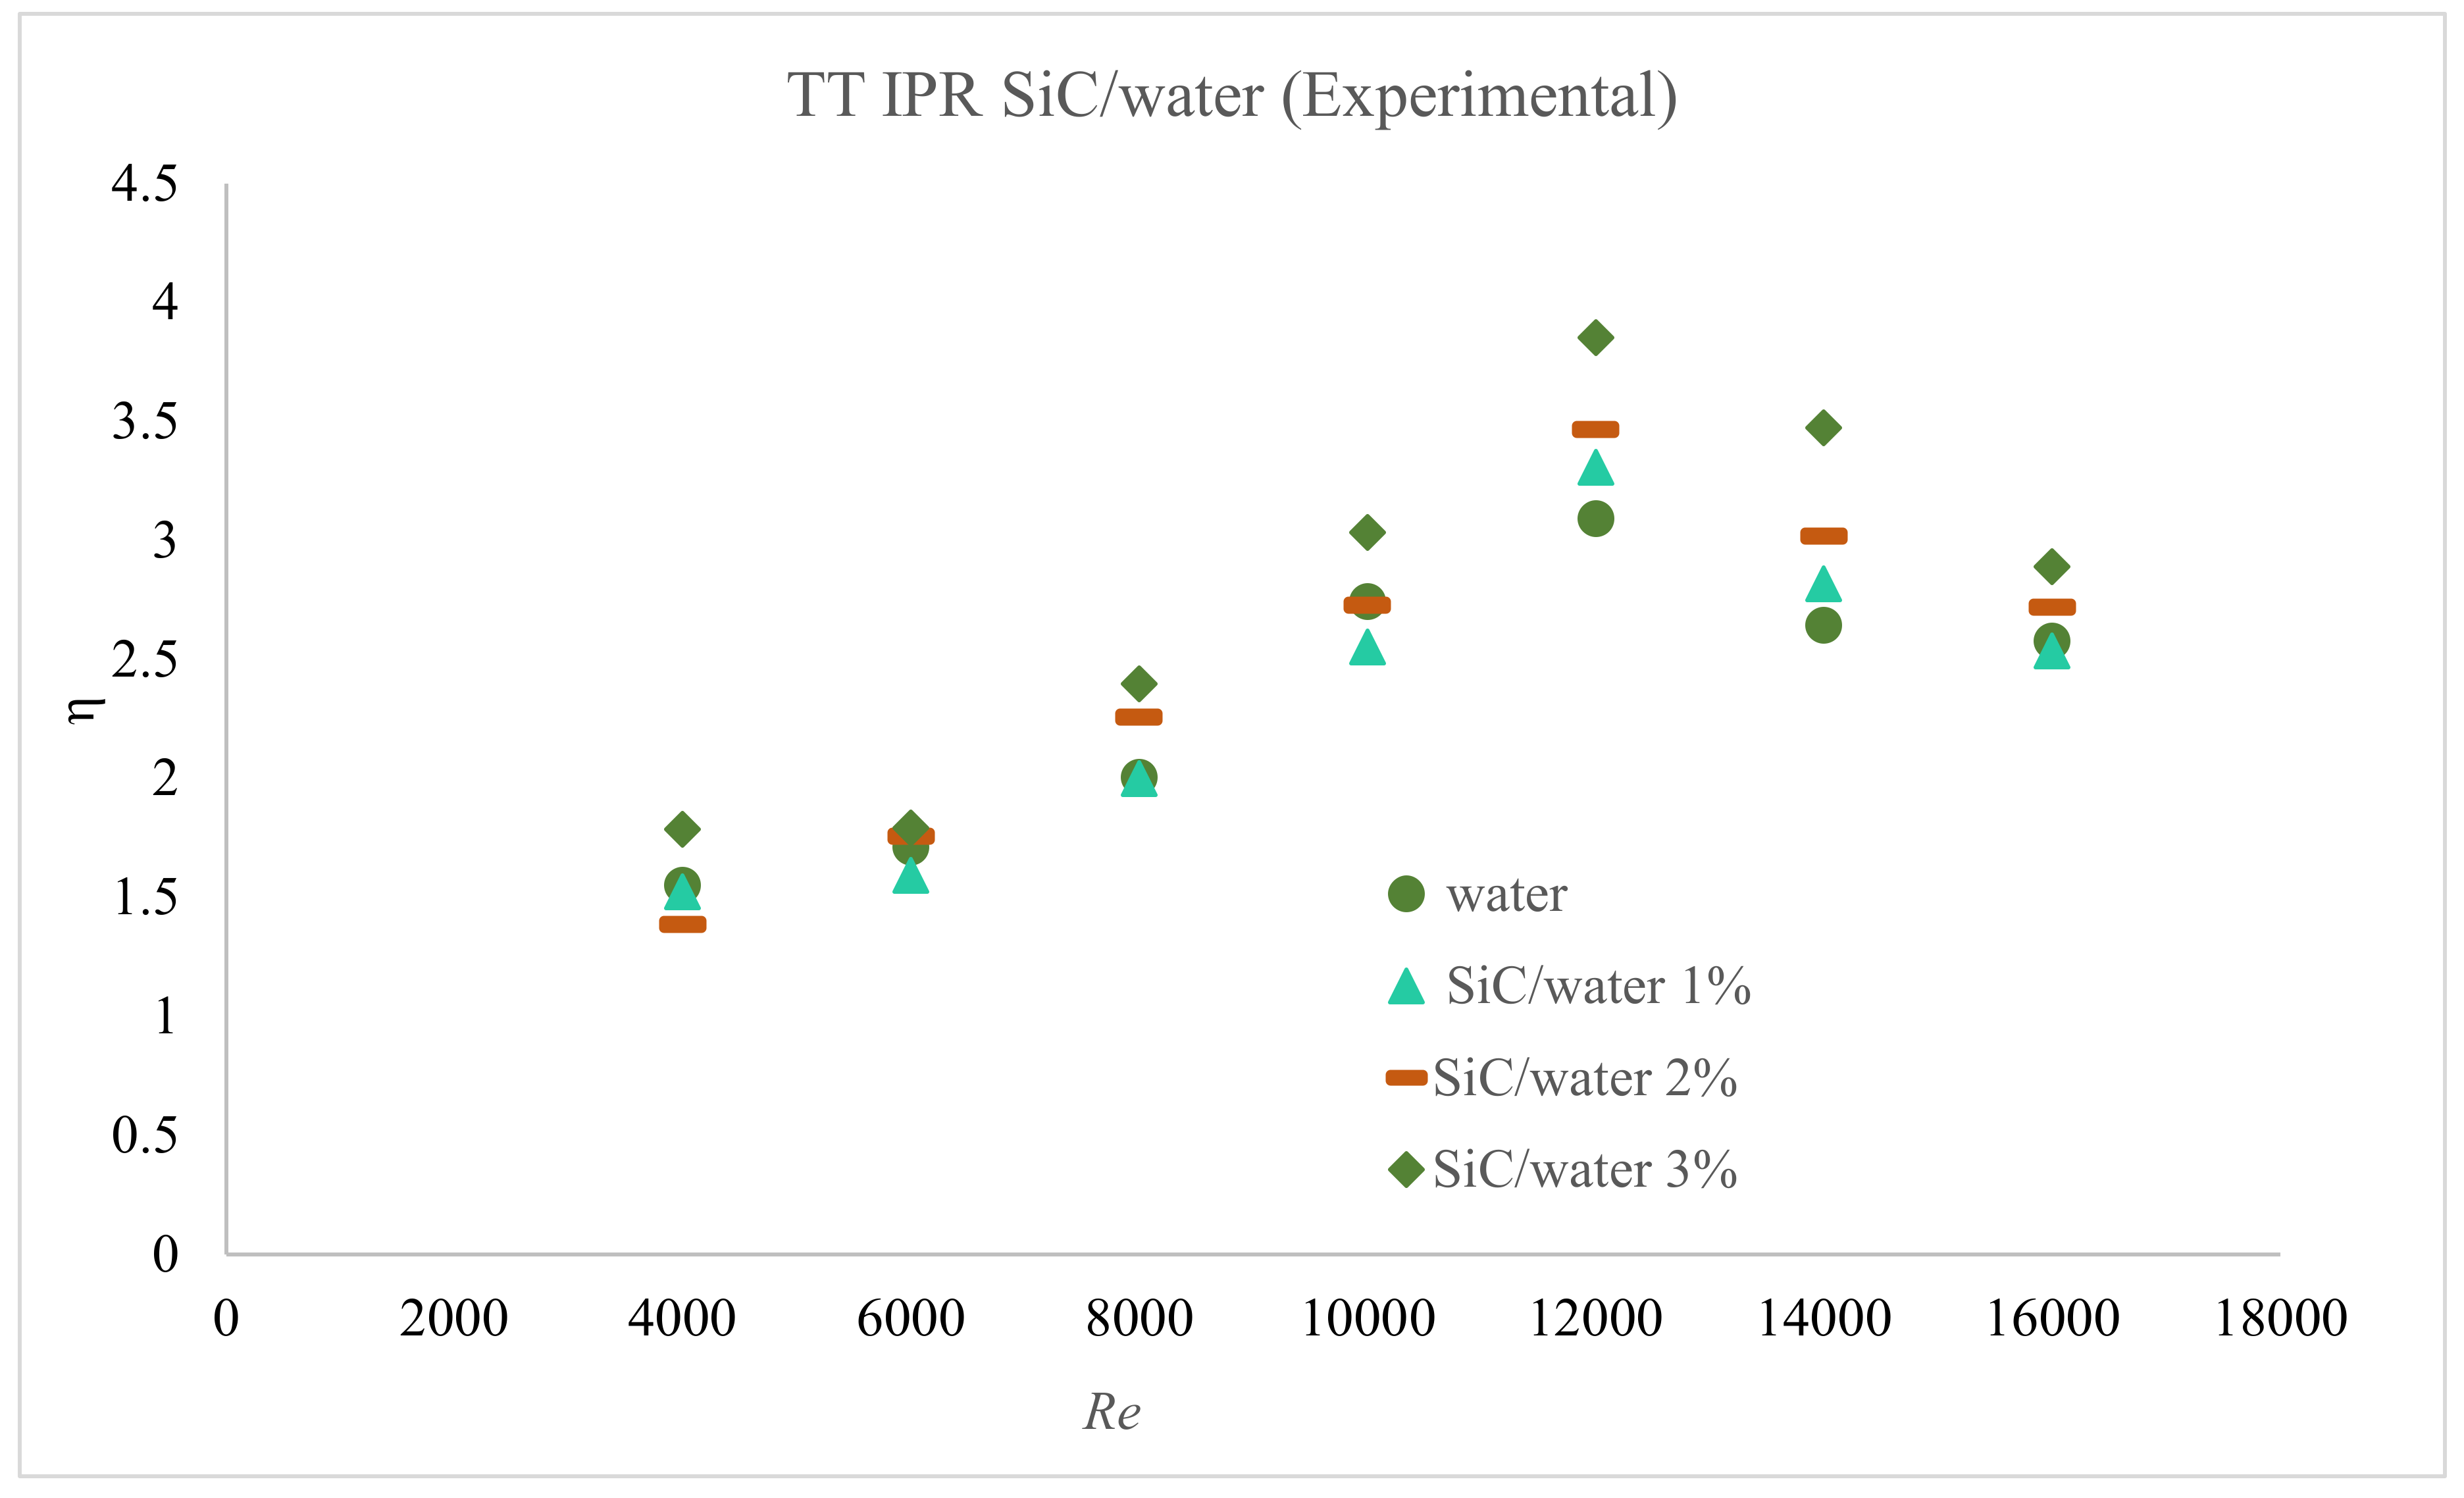
  • TT IPR having dynamic PR (lower at the inlet) caused higher secondary flow vortexes at the inlet while higher PR to the outlet contributes to lower f towards the outlet of the tube, which eventually results in improvement in η. The value of η is improved up to 10% with the use of SiC/Water nanofluid compared to using TT IPR alone.
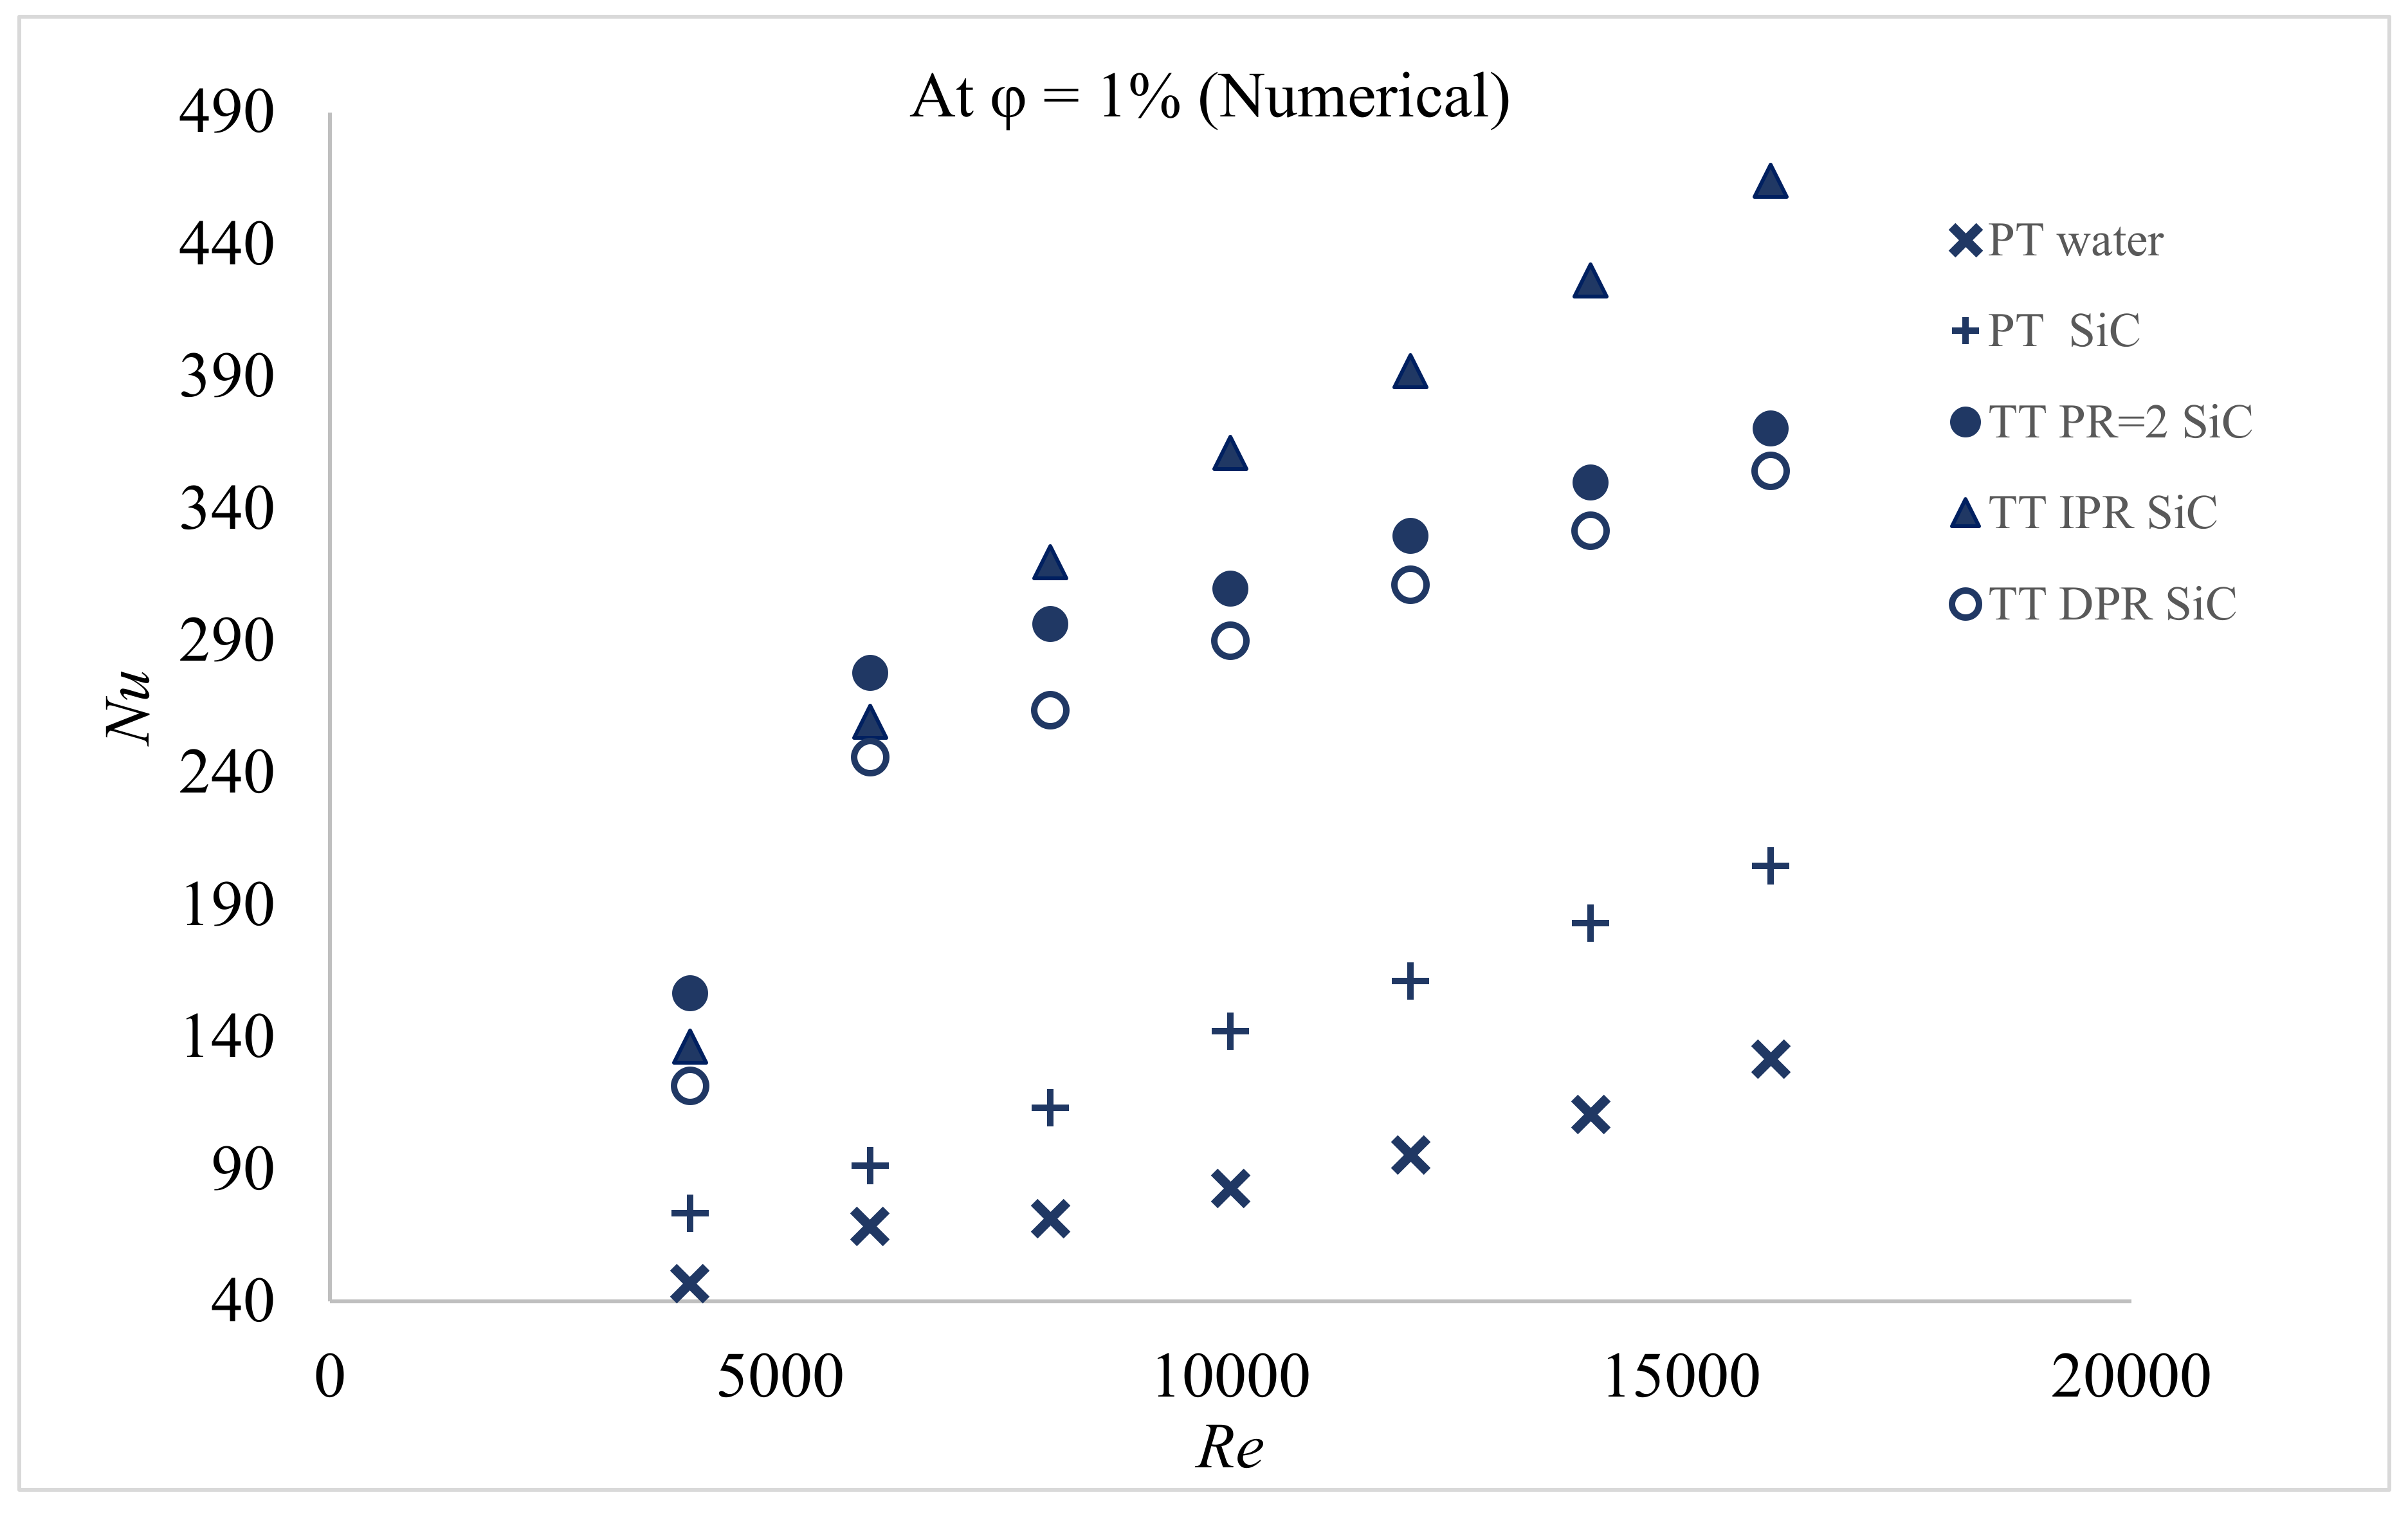
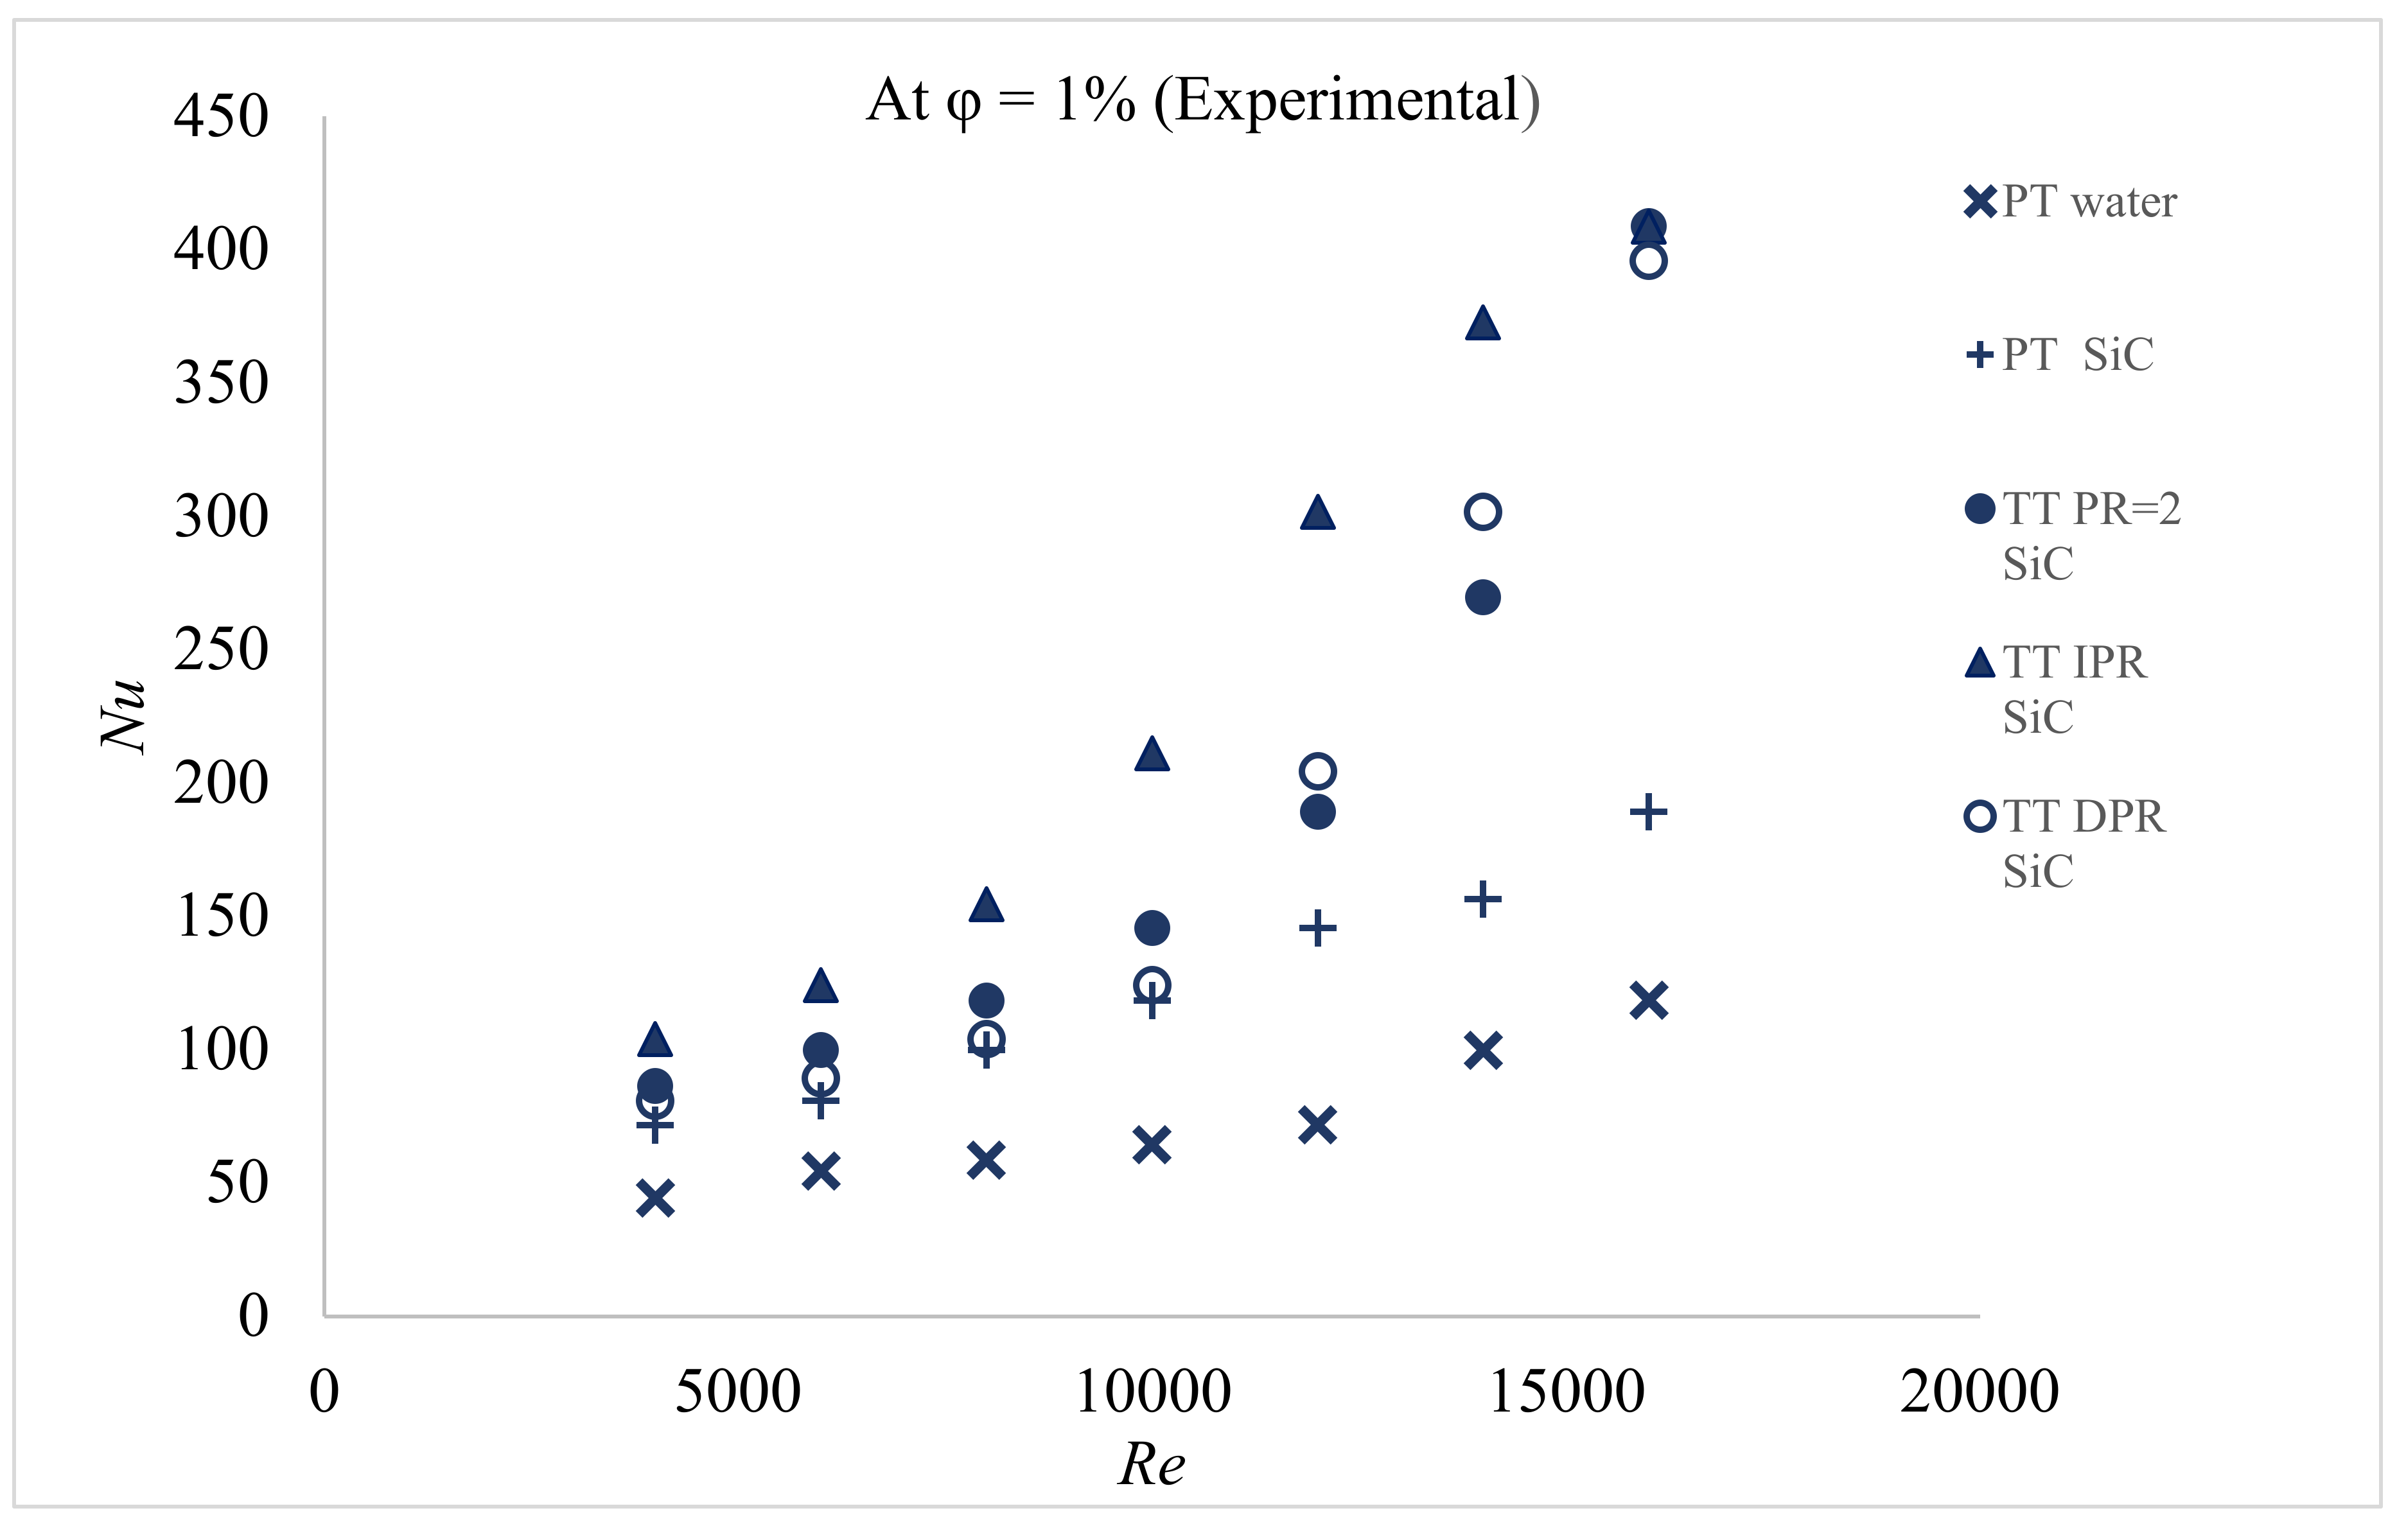
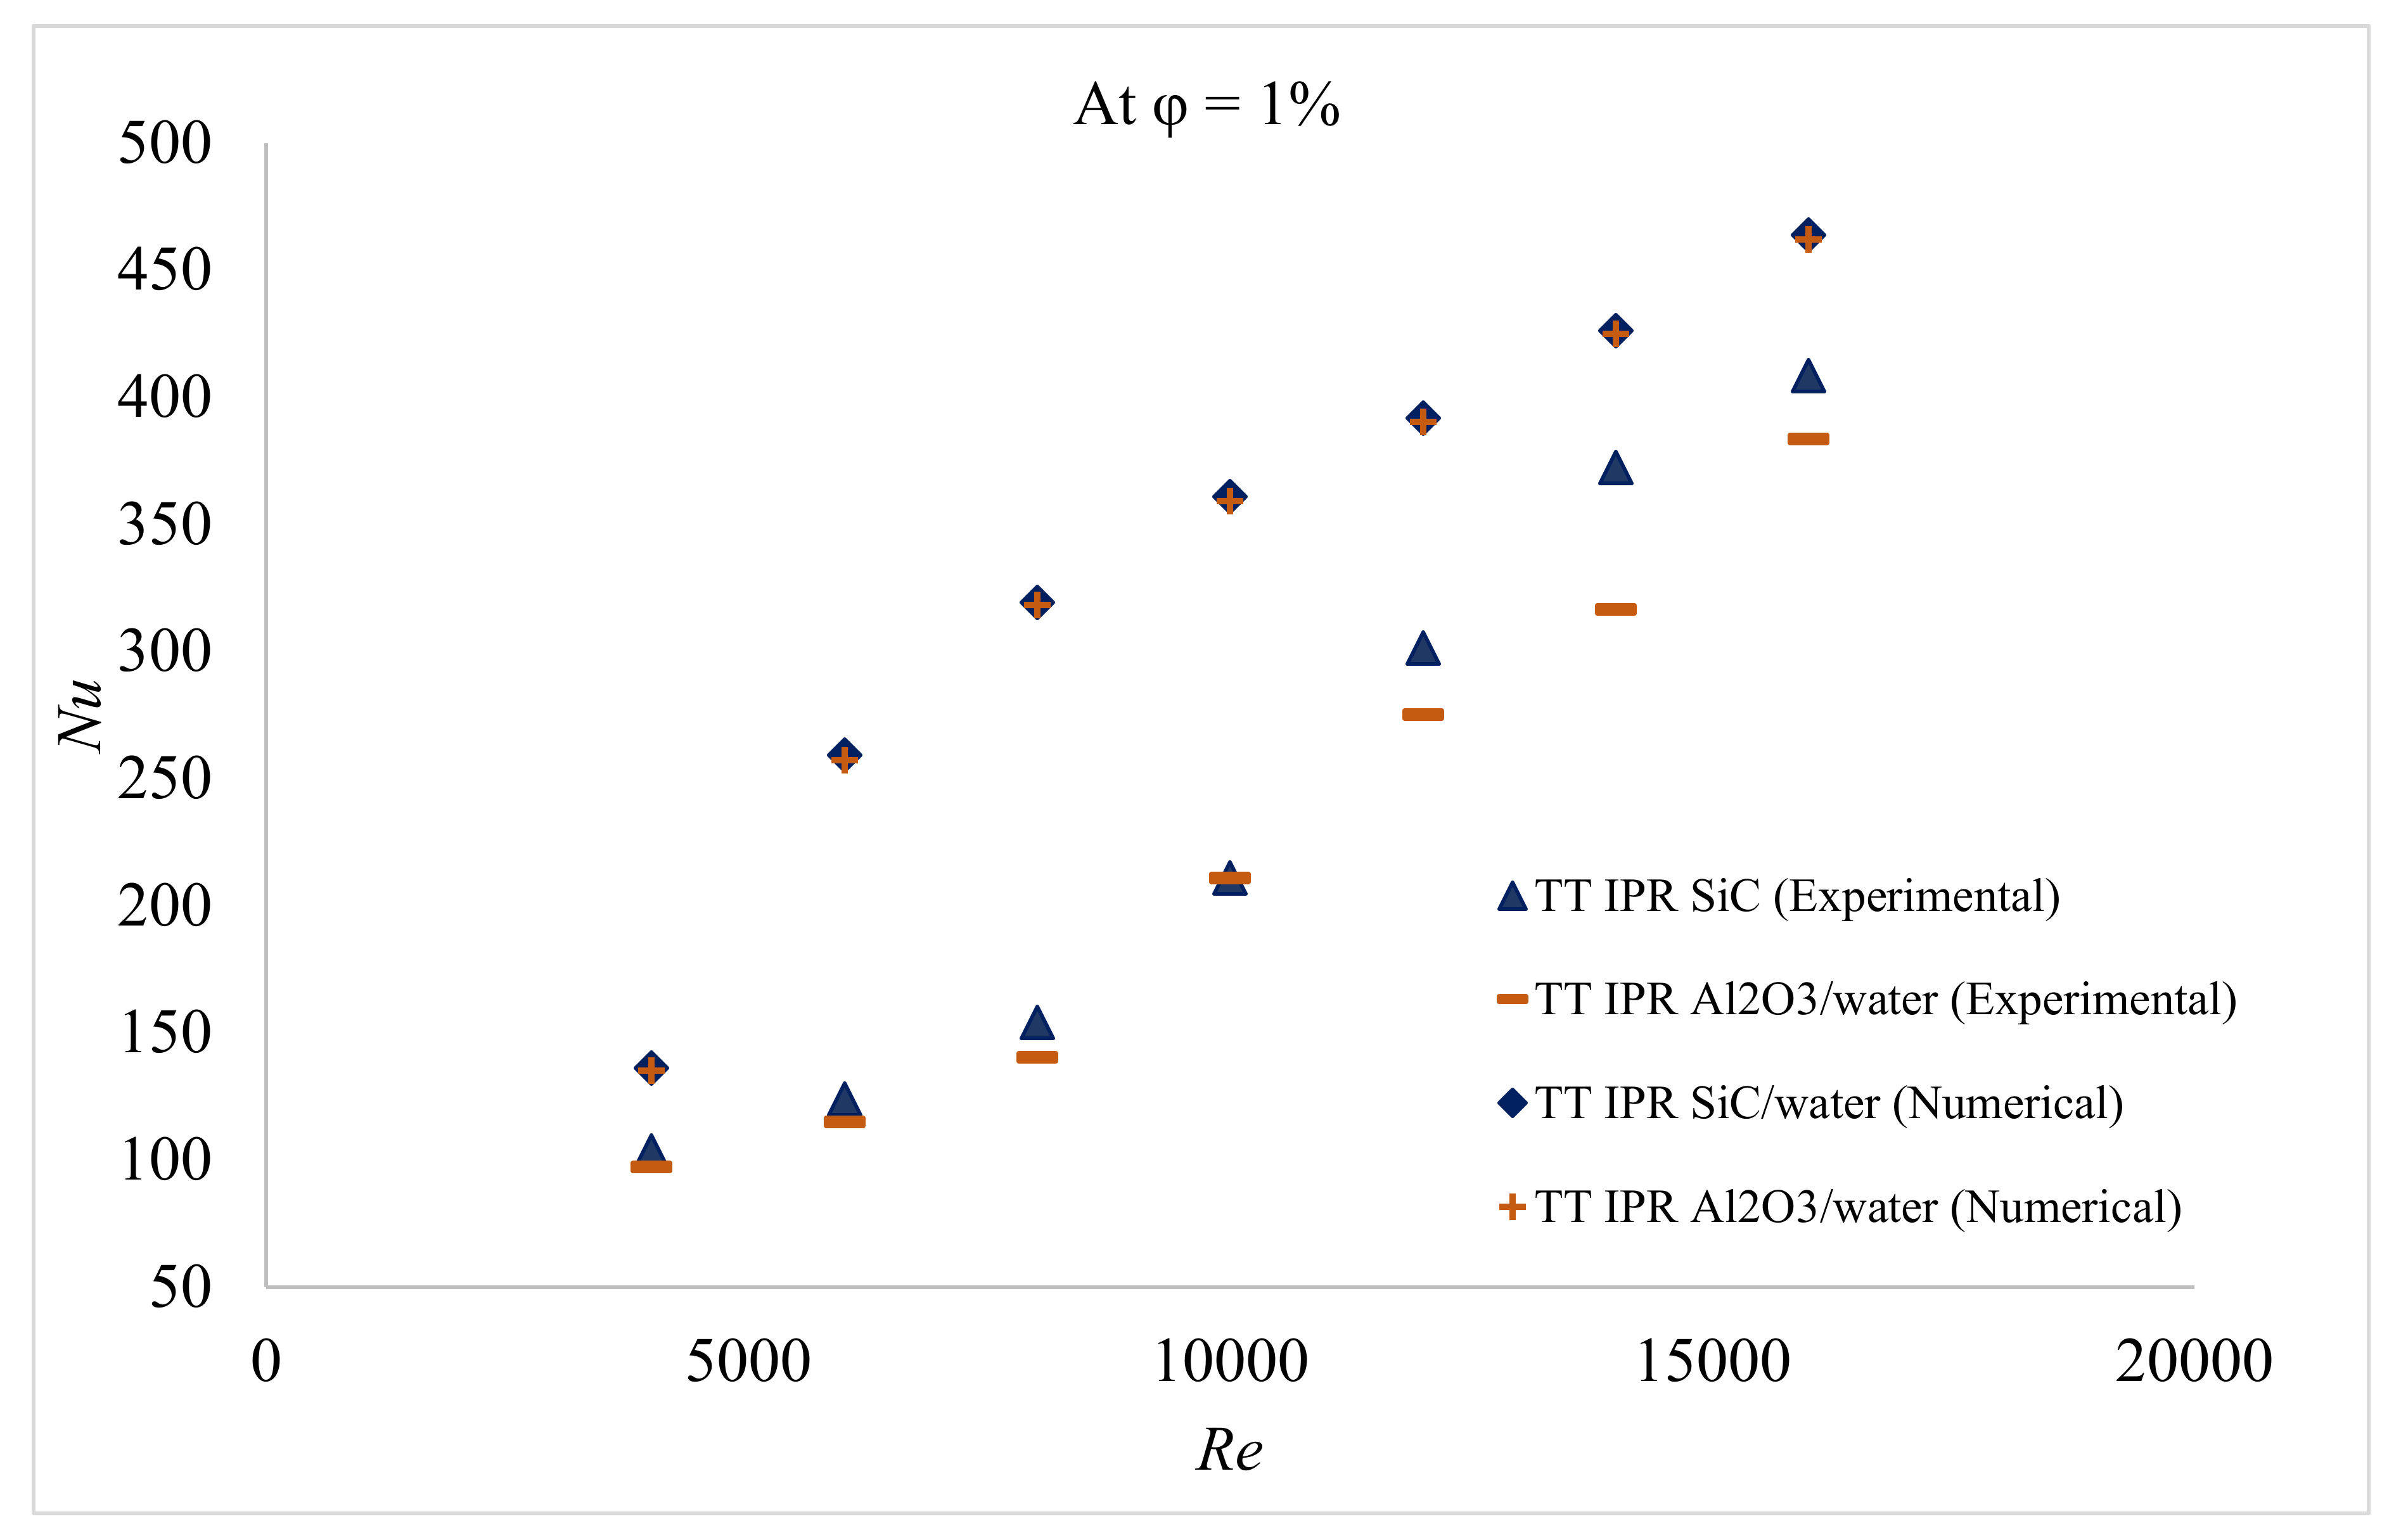
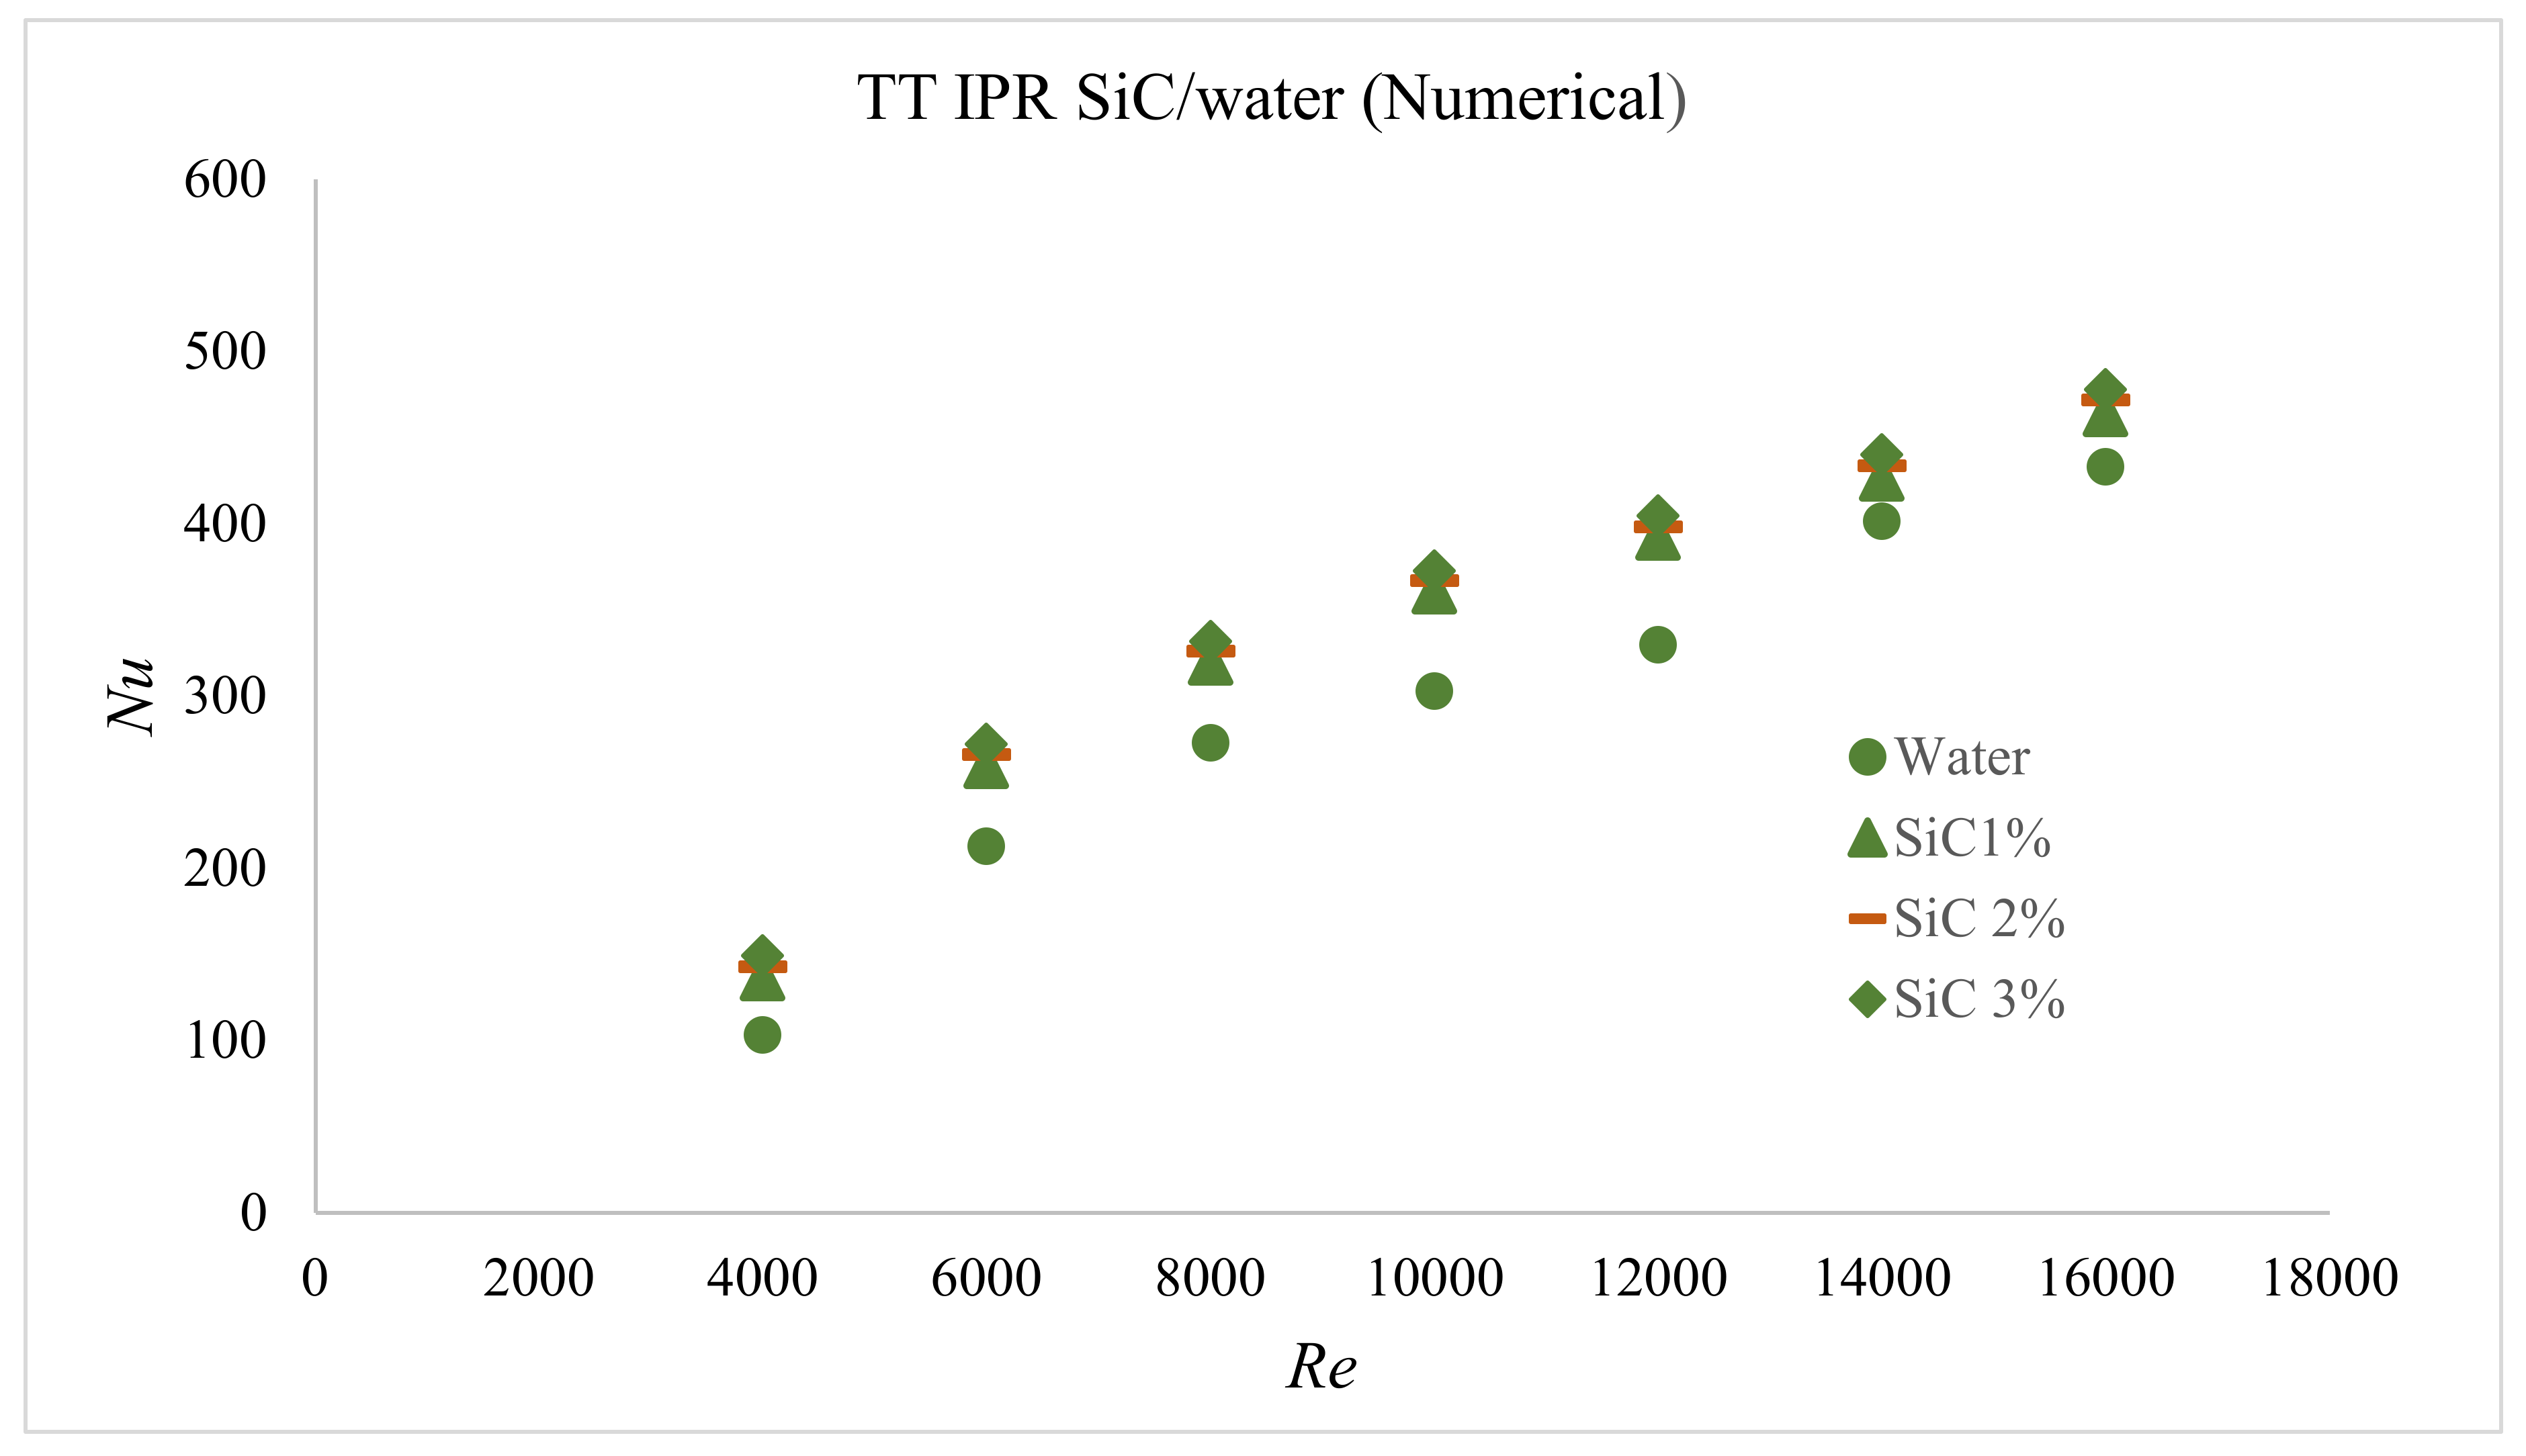
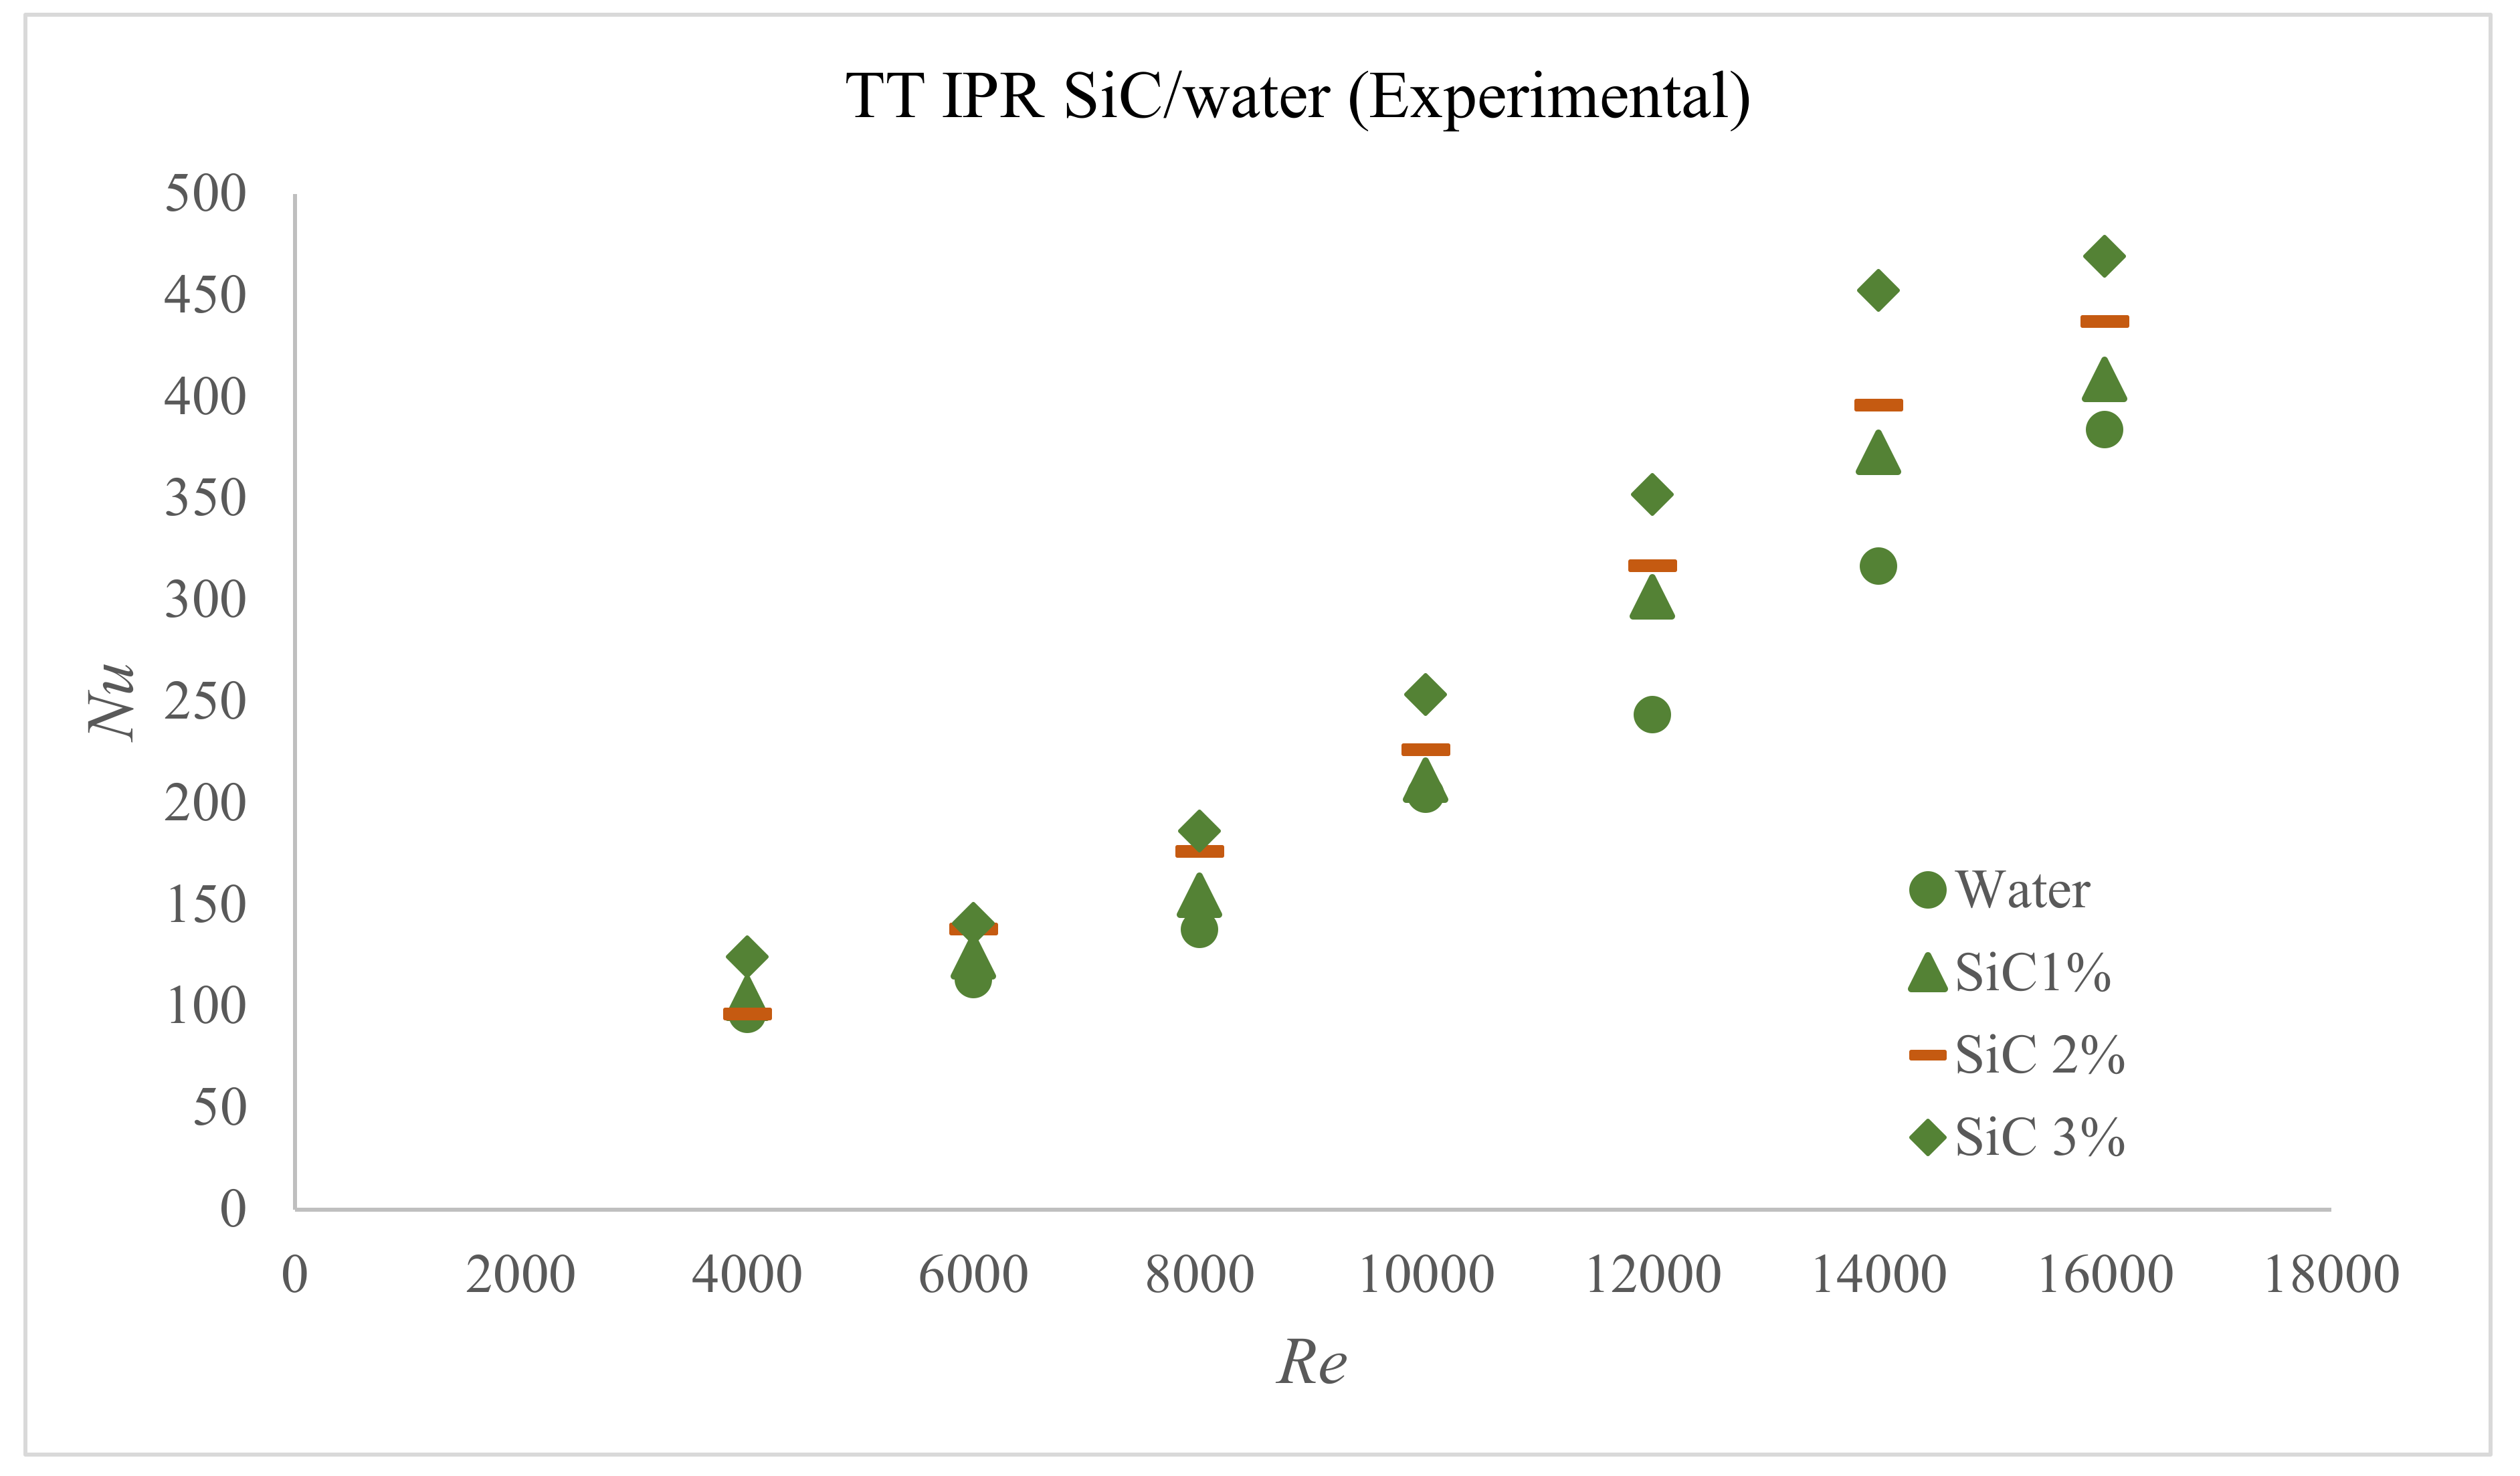
  • All Nu values increase with increasing Re for all modifications (TT IPR TT DPR and TT PR 2). However, the impact of changing Re is more significant for TT IPR as compared to TT DPR and TT PR 2, especially at Re > 10,000.
  • For all modifications of the twisted tape, the values of Nu, f and η is increased with increasing φ from 1% to 3%. Increasing the value of φ shows a maximum increase up to ~23.7%, ~10% and 15% of Nu, f and η respectively as compared to water.
  • Using TT IPR inserts enhanced η by ~62.2% compared to the plain tube, while increasing φ of the SiC/Water nanofluid up to 3% enhanced η by 31.6%. This demonstrates that the use of inserts has a more significant effect on the thermal efficiency of the system than using a nanofluid as the working fluid. However, the simultaneous use of these two passive methods increased η up to 71.14% compared with using a plain tube with water as the working fluid.
  • Utilization of twisted tape with dynamic PR (TT IPR) gives 50% higher η compared to constant PR (TT PR2) at the same value of φ. Hence, this new geometry is the best choice for enhancement in η for the heat exchanger device.

Future Recommendations

In the future, a thorough experimental study must be conducted to better compare and evaluate the simulation result for example upgrading the current experimental rig by using a sensor with better accuracy and using a chiller to keep the inlet temperature constant. Dynamic PR twisted tape is proven to be good geometry for heat transfer enhancement. Hence, a thorough study into this geometry including finding the optimum value for the progression rate of PR is important for future research. In addition, nanoparticles will tend to create agglomerations within a limited period of time. Hence, the preservation of the stability of the nanofluid is crucial and should be considered in the future.

Supplementary Materials

The following are available online at https://0-www-mdpi-com.brum.beds.ac.uk/1996-1073/13/8/2095/s1, Table S1: Experimental data of Nu, Table S2: Experimental data of ∆P, Table S3: Experimental data of f, Table S4: Experimental data of Nu/Nup, Table S5: Experimental data of f/fp, Table S6: Experimental data of η.

Author Contributions

Conceptualization, S.A. (Saadah Ahmad) and K.S.; methodology, S.A. (Saadah Ahmad); software, S.A. (Saadah Ahmad) and S.A. (Shahrir Abdullah); validation, S.A. (Saadah Ahmad); formal analysis, S.A. (Saadah Ahmad); investigation, S.A. (Saadah Ahmad); resources, S.A. (Saadah Ahmad); data curation, S.A. (Saadah Ahmad); writing—original draft preparation, S.A. (Saadah Ahmad); writing—review and editing, S.A. (Saadah Ahmad); visualization, S.A. (Saadah Ahmad); supervision, S.A. (Shahrir Abdullah) and K.S.; project administration, S.A. (Shahrir Abdullah); funding acquisition, K.S. All authors have read and agreed to the published version of the manuscript.

Funding

This research was funded by Universiti Kebangsaan Malaysia, grant number DIP-2019-019 and FRGS/1/2019/TK07/UKM/01/3.

Acknowledgments

The authors would like to thank to the Universiti Kebangsaan Malaysia for the use of its laboratory facilities.

Conflicts of Interest

The authors declare no conflict of interest.

Nomenclature

Al2O3.Aluminum Oxide
cpSpecific Heat
DTube diameter
kThermal conductivity
LTube Length
NuNusselt number
PRPitch Ratio
ΔPPressure drop
ReReynolds number
RNGRenormalized group
SiCSilica oxide
tTwisted tape thickness
TfBulk temperature
TinInlet temperature
TwPipe wall temperature
TT DPRConstant-Decreased pitch ratio twisted tape
TT IPRConstant-Increased pitch ratio twisted tape
TT PR2Twisted tape with pitch ratio 2
wTwisted tape width
yPitch Length
ηOverall Enhancement Ratio
φNanoparticles Volume Fraction
ρDensity
µViscosity

References

  1. Ajeel, R.K.; Salim, W.S.-I.; Sopian, K.; Yusoff, M.Z.; Hasnan, K.; Ibrahim, A.; Al-Waeli, A.H.A. Turbulent convective heat transfer of silica oxide nanofluid through corrugated channels: An experimental and numerical study. Int. J. Heat Mass Transf. 2019, 145, 118806. [Google Scholar] [CrossRef]
  2. Abed, A.M.; Alghoul, M.A.; Sopian, K.; Mohammed, H.A.; Majdi, H.S.; Al-Shamani, A.N. Design characteristics of corrugated trapezoidal plate heat exchangers using nanofluids. Chem. Eng. Process. Process Intensif. 2015, 87, 88–103. [Google Scholar] [CrossRef]
  3. Eiamsa-Ard, S.; Promvonge, P. Thermal characteristics in round tube fitted with serrated twisted tape. Appl. Therm. Eng. 2010, 30, 1673–1682. [Google Scholar] [CrossRef]
  4. Piriyarungrod, N.; Kumar, M.; Thianpong, C.; Pimsarn, M.; Chuwattanakul, V.; Eiamsa-Ard, S.; Chuwattabakul, V. Intensification of thermo-hydraulic performance in heat exchanger tube inserted with multiple twisted-tapes. Appl. Therm. Eng. 2018, 136, 516–530. [Google Scholar] [CrossRef]
  5. Saravanan, A.; Senthilkumaar, J.; Jaisankar, S. Performance assessment in V-trough solar water heater fitted with square and V-cut twisted tape inserts. Appl. Therm. Eng. 2016, 102, 476–486. [Google Scholar] [CrossRef]
  6. Liu, G.; Yang, C.; Zhang, J.; Zong, H.; Xu, B.; Qian, J.-Y. Internal Flow Analysis of a Heat Transfer Enhanced Tube with a Segmented Twisted Tape Insert. Energies 2020, 13, 207. [Google Scholar] [CrossRef] [Green Version]
  7. Zhang, S.; Lu, L.; Dong, C.; Hyun, S. Performance evaluation of a double-pipe heat exchanger fi tted with self- rotating twisted tapes. Appl. Therm. Eng. 2019, 158, 113770. [Google Scholar] [CrossRef]
  8. Nakhchi, M.; Esfahani, J. Cu-water nanofluid flow and heat transfer in a heat exchanger tube equipped with cross-cut twisted tape. Powder Technol. 2018, 339, 985–994. [Google Scholar] [CrossRef]
  9. Salman, S.D.; Kadhum, A.A.H.; Takriff, M.S.; Mohamad, A.B. CFD Simulation of Heat Transfer Augmentation in a Circular Tube Fitted with Alternative Axis Twisted Tape in Laminar Flow under a Constant Heat Flux. Heat Transf. Res. 2014, 43, 384–396. [Google Scholar] [CrossRef]
  10. Bahiraei, M.; Mazaheri, N.; Hassanzamani, S.M. Efficacy of a new graphene–platinum nanofluid in tubes fitted with single and twin twisted tapes regarding counter and co-swirling flows for efficient use of energy. Int. J. Mech. Sci. 2019, 150, 290–303. [Google Scholar] [CrossRef]
  11. Eiamsa-ard, S.; Kiatkittipong, K.; Jedsadaratanachai, W. Heat transfer enhancement of TiO2/Water nanofluid in a heat exchanger tube equipped with overlapped dual twisted-tapes. Eng. Sci. Technol. Int. J. 2015, 18, 336–350. [Google Scholar] [CrossRef] [Green Version]
  12. Li, Z.; Sheikholeslami, M.; Jafaryar, M.; Shafee, A.; Chamkha, A.J. Investigation of nanofluid entropy generation in a heat exchanger with helical twisted tapes. J. Mol. Liq. 2018, 266, 797–805. [Google Scholar] [CrossRef]
  13. Zheng, L.; Xie, Y.; Zhang, D. Numerical investigation on heat transfer performance and flow characteristics in circular tubes with dimpled twisted tapes using Al 2 O 3-water nanofluid. Int. J. Heat Mass Transf. 2017, 111, 962–981. [Google Scholar] [CrossRef]
  14. Safikhani, H.; Abbasi, F. Numerical study of nanofluid flow in flat tubes fitted with multiple twisted tapes. Adv. Powder Technol. 2015, 26, 1609–1617. [Google Scholar] [CrossRef]
  15. Gnanavel, C.; Saravanan, R.; Chandrasekaran, M. Materials Today: Proceedings Heat transfer enhancement through nano-fluids and twisted tape insert with rectangular cut on its rib in a double pipe heat exchanger. Mater. Today Proc. 2019. [Google Scholar]
  16. Maddah, H.; Alizadeh, M.; Ghasemi, N.; Rafidah, S.; Alwi, W. Experimental study of Al 2O3/Water nanofluid turbulent heat transfer enhancement in the horizontal double pipes fitted with modified twisted tapes. Int. J. Heat Mass Transf. 2014, 78, 1042–1054. [Google Scholar] [CrossRef]
  17. Khoshvaght-aliabadi, M.; Davoudi, S.; Dibaei, M.H. Chemical Engineering Research and Design Performance of agitated-vessel U tube heat exchanger using spiky twisted tapes and water based metallic nanofluids. Chem. Eng. Res. Des. 2018, 133, 26–39. [Google Scholar] [CrossRef]
  18. Murali, G.; Nagendra, B.; Jaya, J. Materials Today: Proceedings CFD analysis on heat transfer and pressure drop characteristics of turbulent flow in a tube fitted with trapezoidal-cut twisted tape insert using Fe3O4 nano fluid. Mater. Today Proc. 2019. [Google Scholar]
  19. Rahimi, M.; Shabanian, S.R.; Alsairafi, A.A. Experimental and CFD studies on heat transfer and friction factor characteristics of a tube equipped with modified twisted tape inserts. Chem. Eng. Process. Process. Intensif. 2009, 48, 762–770. [Google Scholar] [CrossRef]
  20. Tabatabaeikia, S.; Mohammed, H.A.; Nik-Ghazali, N.; Shahizare, B. Heat Transfer Enhancement by Using Different Types of Inserts. Adv. Mech. Eng. 2014, 6, 250354. [Google Scholar] [CrossRef] [Green Version]
  21. Eiamsa-Ard, S.; Pimsarn, M.; Thianpong, C. Performance Assessment in a Heat Exchanger Tube with Opposite/Parallel Wing Twisted Tapes. Adv. Mech. Eng. 2014, 7, 652536. [Google Scholar] [CrossRef] [Green Version]
  22. Khoshvaght-aliabadi, M.; Eskandari, M. Influence of twist length variations on thermal—Hydraulic specifications of twisted-tape inserts in presence of Cu – water nanofluid. Exp. Therm. Fluid Sci. 2015, 61, 230–240. [Google Scholar] [CrossRef]
  23. Qi, C.; Wang, G.; Yan, Y.Y.; Mei, S.; Luo, T. Effect of rotating twisted tape on thermo-hydraulic performances of nanofluids in heat-exchanger systems. Energy Convers. Manag. 2018, 166, 744–757. [Google Scholar] [CrossRef]
  24. Abdullah, M.F.; Zulkifli, R.; Harun, Z.; Abdullah, S.; Wan Ghopa, W.A.; Najm, A.S.; Sulaiman, N.H. Impact of the TiO2 nanosolution concentration on heat transfer enhancement of the twin impingement jet of a heated aluminum plate. Micromachines. 2019, 10, 176. [Google Scholar] [CrossRef] [PubMed] [Green Version]
  25. Chang, T.; Syu, S.; Yang, Y. Effects of particle volume fraction on spray heat transfer performance of Al 2 O 3—Water nanofluid. Int. J. Heat Mass Transf. 2012, 55, 1014–1021. [Google Scholar] [CrossRef]
  26. Duangthongsuk, W.; Wongwises, S. An experimental study on the heat transfer performance and pressure drop of TiO2-water nanofluids flowing under a turbulent flow regime. Int. J. Heat Mass Transf. 2010, 53, 334–344. [Google Scholar] [CrossRef]
  27. Vajjha, R.S.; Das, D.K. A review and analysis on influence of temperature and concentration of nanofluids on thermophysical properties, heat transfer and pumping power. Int. J. Heat Mass Transf. 2012, 55, 4063–4078. [Google Scholar] [CrossRef]
  28. Kane, J.M. Ansys Fluent 12.0 User’s Guide. 2009. Available online: https://www.afs.enea.it/project/neptunius/docs/fluent/html/ug/main_pre.htm (accessed on 20 November 2018).
  29. Patankar, S.V.; Spalding, D.B.A. A calculation procedure for heat, mass and momentum transfer in three-dimensional parabolic flows. Int. J. Heat Mass Transf. 1972, 15, 1787–1806. [Google Scholar] [CrossRef]
  30. Godson, L.; Raja, B.; Lal, D.M.; Wongwises, S. Enhancement of heat transfer using nanofluids—An overview. Renew. Sustain. Energy Rev. 2010, 14, 629–641. [Google Scholar] [CrossRef]
  31. Ebrahimi, A.; Rikhtegar, F.; Sabaghan, A.; Roohi, E. Heat transfer and entropy generation in a microchannel with longitudinal vortex generators using nanofluids. Energy 2016, 101, 190–201. [Google Scholar] [CrossRef]
  32. Mahian, O.; Kolsi, L.; Amani, M.; Estellé, P.; Ahmadi, G.; Kleinstreuer, C.; Marshall, J.S.; Siavashi, M.; Izadgoshasb, I.; Niazmand, H.; et al. Recent advances in modeling and simulation of nanofluid flows-Part I: Fundamentals and theory. Phys. Rep. 2019, 790, 1–48. [Google Scholar] [CrossRef]
  33. Hamilton, R.L.; Crosser, O.K. Thermal Conductivity of Heterogeneous Two-Component Systems. Ind. Eng. Chem. Fundam. 1962, 1, 187–191. [Google Scholar] [CrossRef]
  34. Zhou, S.-Q.; Ni, R. Measurement of the specific heat capacity of water-based Al[sub 2]O[sub 3] nanofluid. Appl. Phys. Lett. 2008, 92, 93123. [Google Scholar] [CrossRef]
  35. Brinkman, H.C. The Viscosity of Concentrated Suspensions and Solutions. J. Chem. Phys. 1952, 20, 571. [Google Scholar] [CrossRef]
  36. Maxwell, J.C. A Treatise on Electricity and Magnetism, 2nd ed.; Oxford University Press: Oxford, UK, 1904. [Google Scholar]
  37. Ramakumar, B.V.N.; Arsha, J.D.; Tayal, P. Tapered Twisted Tape Inserts for Enhanced Heat Transfer. J. Heat Transf. 2015, 138, 011901. [Google Scholar] [CrossRef]
  38. Incropera, F.P.; DeWitt, D.P.; Bergman, T.L.; Lavine, A.S. Fundamentals of Heat and Mass Transfer; John-Wiley & Sons: Hoboken, NJ, USA, 2006. [Google Scholar]
  39. Eiamsa-Ard, S.; Kiatkittipong, K. Heat transfer enhancement by multiple twisted tape inserts and TiO2/Water nanofluid. Appl. Therm. Eng. 2014, 70, 896–924. [Google Scholar] [CrossRef]
  40. Karami, A.; Rezaei, E.; Shahhosseni, M.; Aghakhani, M. Optimization of heat transfer in an air cooler equipped with classic twisted tape inserts using imperialist competitive algorithm. Exp. Therm. Fluid Sci. 2012, 38, 195–200. [Google Scholar] [CrossRef]
  41. Naphon, P. Heat transfer and pressure drop in the horizontal double pipes with and without twisted tape insert. Int. Commun. Heat Mass Transf. 2006, 33, 166–175. [Google Scholar] [CrossRef]
  42. Manglik, R.M.; Bergles, A.E. Heat Transfer and Pressure Drop Correlations for Twisted-Tape Inserts in Isothermal Tubes: Part II—Transition and Turbulent Flows. J. Heat Transf. 1993, 115, 890–896. [Google Scholar] [CrossRef]
  43. Ponnada, S.; Subrahmanyam, T.; Naidu, S.V. A comparative study on the thermal performance of water in a circular tube with twisted tapes, perforated twisted tapes and perforated twisted tapes with alternate axis. 2018, 136, 530–538. [Google Scholar] [CrossRef]
  44. Moffat, R.J. Describing the uncertainties in experimental results. Exp. Therm. Fluid Sci. 1988, 1, 3–17. [Google Scholar] [CrossRef] [Green Version]
  45. Van Buren, S.; Miranda, A.C.; Polifke, W. Large eddy simulation of enhanced heat transfer in pulsatile turbulent channel flow. Int. J. Heat Mass Transf. 2019, 144, 118585. [Google Scholar] [CrossRef]
  46. Leong, K.Y.; K. Z. Ku Ahmad, K.Z.; Ong, H.C.; Ghazali, M.J.; Baharum, A. Synthesis and thermal conductivity characteristic of hybrid nanofluids—A review. Renew. Sustain. Energy Rev. 2017, 75, 868–878. [Google Scholar] [CrossRef]
Figure 1. Geometries of the twisted tape.
Energies 13 02095 g001
Figure 2. Smooth circular tube with twisted tape inserts.
Energies 13 02095 g002
Figure 3. Mesh generation of a circular tube and twisted tape.
Energies 13 02095 g003
Figure 4. SiC/Water nanofluid at different φ.
Energies 13 02095 g004
Figure 5. Al2O3/Water nanofluid at different φ.
Energies 13 02095 g005
Figure 6. Comparison of viscosity values for SiC/Water nanofluid after 24 h of preparation.
Energies 13 02095 g006
Figure 7. Equipment for thermal physical characterization.
Energies 13 02095 g007
Figure 8. Schematic diagram of experimental set-up.
Energies 13 02095 g008
Figure 9. Experimental set-up.
Energies 13 02095 g009
Figure 10. Schematic diagram of the test section.
Energies 13 02095 g010
Figure 11. Geometries of twisted tape.
Energies 13 02095 g011
Figure 12. Validation of water flowing inside a smooth circular tube.
Energies 13 02095 g012
Figure 13. Validation of water flowing inside a circular tube with a twisted tape insert.
Energies 13 02095 g013
Figure 14. (a) The velocity streamlines, (b) velocity vectors, (c) temperature contours, and (d) turbulent kinetic energy of a nanofluid that is flowing inside a tube.
Energies 13 02095 g014aEnergies 13 02095 g014b
Figure 15. Pressure contours across the tube.
Energies 13 02095 g015
Figure 16. Effect of the type of inserts on Nu (Numerical).
Energies 13 02095 g016
Figure 17. Effect of the type of inserts on Nu (Experimental).
Energies 13 02095 g017
Figure 18. Effect of the type of inserts on f (Numerical).
Energies 13 02095 g018
Figure 19. Effect of the type of inserts on f (Experimental).
Energies 13 02095 g019
Figure 20. Effect of type of inserts on the overall enhancement ratio, η (Numerical).
Energies 13 02095 g020
Figure 21. Effect of type of inserts on the overall enhancement ratio, η (Experimental)
Energies 13 02095 g021
Figure 22. Effects of the type of nanoparticles on Nu.
Energies 13 02095 g022
Figure 23. Effects of the type of nanoparticles on Nu and f.
Energies 13 02095 g023
Figure 24. Effect of the nanofluid volume fraction φ on Nu (Numerical).
Energies 13 02095 g024
Figure 25. Effect of the nanofluid volume fraction φ on Nu (Experimental).
Energies 13 02095 g025
Figure 26. Effect of the nanofluid volume fraction φ on f. (Numerical).
Energies 13 02095 g026
Figure 27. Effect of the nanofluid volume fraction φ on f (Experimental).
Energies 13 02095 g027
Figure 28. Effect of the nanofluid volume fraction φ on η (Numerical).
Energies 13 02095 g028
Figure 29. Effect of the nanofluid volume fraction φ on η (Experimental).
Energies 13 02095 g029
Table 1. Parameter definitions.
ParameterDefinition
D = 19 mmTube diameter
t = 1.9 mmTwisted tape thickness
w = 12.7 mmTape width
L = 300 mmTube length
yPitch length
PRPitch ratio (y/w)
Re = 6000 – 14 000Reynolds number
φ = 1%, 2% and 3%Nanoparticle volume fraction
Table 2. Constant values of the transport equations.
ConstantValue
C μ 0.0845
σ k 0.7194
σ ϵ 0.7194
C ϵ 1 1.42
C ϵ 2 1.68
η 0 4.38
β 0.012
Table 3. Values of Nu and ∆P with four numbers of cells.
Number of CellsNu∆P
519,393125.7872.543
723,435125.9872.673
874,532126.12372.689
1,134,125126.23472.698
Table 4. Y+ values for various simulation conditions.
CaseType of TTReY+
1PR24000 0.4940
2PR210,0000.9483
3IPR40000.4579
4IPR10,0000.8949
5DPR40000.6115
6DPR10,0000.8724
Table 5. Uncertainty of experimental instrument.
SensorNumberVariable MeasuredModelUncertainty
Thermocouple8Wall temperature K-type0.2%
Digital pressure sensor2Local pressure Huba Control0.1%
Flow meter1Volumetric flow rate ZYIA Rotameter2.0%
Temperatures probe2Bulk temperature K-type thermocouple with probe0.2%
Digital multimeter1Current of the electric heater UNI-T Multimeter0.1%
Table 6. Uncertainty of dependent variables.
Dependent VariablesUncertainty
Nu ±3.99
Re ±4.13
f ±5.21
η ±6.66

