Article

Fatigue Reliability Analysis of Wind Turbine Drivetrain Considering Strength Degradation and Load Sharing Using Survival Signature and FTA

State Key Laboratory of Mechanical Transmissions, Chongqing University, Chongqing 400044, China
*
Author to whom correspondence should be addressed.
Submission received: 8 March 2020 / Revised: 14 April 2020 / Accepted: 17 April 2020 / Published: 23 April 2020
(This article belongs to the Section A3: Wind, Wave and Tidal Energy)

Abstract

:
The wind turbine drivetrain suffers significant impact loads that severely affect the reliability and safety of wind turbines. Bearings and gears within the drivetrain are critical components with high repair costs and lengthy downtime. To realistically assess the system reliability, we propose to establish an electromechanical coupling dynamic model of the wind turbine considering the control strategy and environmental parameters and evaluate the system’s reliability of wind turbine drivetrain based on loads of gears and bearings. This paper focuses on the dynamic reliability analysis of the wind turbine under the control strategy and environmental conditions. SIMPACK (v9.7, Dassault Systèmes, Gilching, Germany) is used to develop the aero-hydro-servo-elastic coupling dynamic model with the full drivetrain that considers the flexibility of the tower and blade, the stochastic loads of wind and waves, gear meshing features, as well as the control strategy. The system reliability level of wind turbine drivetrain at different wind conditions is assessed using survival signature and fault tree analysis (FTA), and the influences of strength degradation of the transmission components on the system reliability are explored. Following this, the bending fatigue reliability and contact fatigue reliability concerning different wind conditions are compared in this paper. A case study is performed to demonstrate the effectiveness and feasibility of the proposed methodology.

Graphical Abstract

1. Introduction

Due to climate change and energy crises across the world, it is an urgent task to develop renewable energy sources to replace fossil fuels. In the past two decades, the energy obtained through wind has been praised as a sustainable, environmentally friendly option that has achieved global acclaim. What is less often noted is that wind turbines rely on a complex electromechanical system, which has been designed to specify various design load cases, including power production, normal shutdown, and power production in the case of faults [1]. Given the popularity of wind power, there have been continuous advancements in wind turbine technology. At present, most turbines are built with the variable-speed and variable blade-pitch-to-feather configuration. This configuration allows the turbine’s blades to rotate through the pitch system. In comparison with fixed-pitch wind turbines, these turbines can guarantee more stable output power and a greater wind capture efficiency with the blades acting as brakes. One downside, however, is that the blade-pitch system frequently reacts against the stochastic wind, which is affected by the control strategy and uncertain environment, resulting in wind turbines operating under a complicated and unsteady load. As a result, wind turbine drivetrains have a relatively high failure rate. Maintenance costs and drivetrain downtime due to wind curtailment are also high, lowering the net economic gain of using wind power. Therefore, there is a clear need to study the dynamic characteristics and assess the dynamic reliability of wind turbine drivetrains in order to mitigate operational and maintenance costs, reduce downtime, and enhance the dynamic reliability and safety of wind turbines.
Some scholars have performed research on wind turbine dynamic behaviors and reliability analysis of the wind turbine drivetrain. Helsen et al. [2] discussed the influences of the flexibility within the multi-body approach for wind turbine gearbox modeling. Zhang et al. [3] explored the influences of the supporting tower flexibility and investigated the natural characteristics of a megawatt wind turbine drivetrain. Chen et al. [4] established an electromechanical coupling dynamic model of the entire wind turbine, which considered the flexibility of blades, main-shaft, and hub. They studied the dynamic behaviors using the measured load spectrum. Guo et al. [5] explored the coupling effects of bearing clearance, gravity, input torque, and bending moment on the load-sharing characteristics of planetary gears. Wang et al. [6] investigated the influence of gear modifications on the dynamic behaviors of the wind turbine gearbox with consideration of elastic support. Girsang et al. [7] enhanced the capability of FAST (Fatigue, Aerodynamics, Structures, and Turbulence, v7, NREL, Golden, CO, USA) through the integration of a drivetrain’s dynamic model, which was built by SIMPACK using MATLAB/Simulink (v8.6, MathWorks, Natick, MA, USA). They evaluated the internal drivetrain loads caused by excitations from the wind and generator. Li et al. [8] presented a high-fidelity method to perform the aero-elastic simulation for wind turbine using a dynamic overset computational fluid dynamics code coupled with a multibody dynamics. Amir et al. [9] adopted the decoupled analysis approach for the load effect analysis and built a detailed gearbox model for multibody simulation with the inputs of the rotor torque and the non-torque loading on the main-shaft from an aero-elastic simulation. However, the investigations mentioned above ignore the effects of the drivetrain dynamics on the entire wind turbine responses.
There are few studies on the time-dependent reliability analysis of a wind turbine considering the control strategy and the environmental parameters. Huang and Coolen [10] studied the reliability and reliability sensitivity of a wind turbine based on the survival signature concerning components’ impacts on the system’s reliability. Li et al. [11] developed a dynamic model of planetary gear systems in helicopters under the partial load considering the unequal load-sharing. Zhu et al. [12] established a dynamic model of planetary gear systems with both the pins’ flexibility and the gyroscopic effect taken into consideration. Qin et al. [13] conducted a dynamic reliability analysis of the gear transmission system under stochastic wind load by the lumped-parameter method. Huang et al. [14] analyzed the reliability of the kinematic accuracy of gear mechanisms using the presented method and explored the influences of original errors on the transmission error of a gear mechanism. Xiao et al. [15] proposed a reliability analysis method for structural systems with multiple failure modes and mixed variables, which is suitable for complex systems. Nejad et al. [16] calculated the long-term fatigue damage of the gear tooth and analyzed the reliability of the geared transmission system using the first-order reliability method (FORM). They also established a vulnerability map of the gearbox that can help rank the short-term fatigue damage of the gears and bearings of the gearbox [17]. Jiang et al. [18] calculated the fatigue damage of the planet bearing of a wind turbine gearbox under different wind speed distributions using HAWC2 (Horizontal Axis Wind turbine simulation Code 2nd generation, v2, DTU Wind Energy, Lyngby, Denmark), SIMPACK, and Calyx (The three-dimensional finite element code, v1, Advanced Numerical Solutions LLC, Hilliard, OH, USA). Calderon et al. [19] built a dynamic model of the gearbox using the lump-parameter method and explored the dynamic behavior of the planet bearing under extreme loads.
However, these studies did not explore the influences of random wind speed and the control strategy on the reliability of wind turbine drivetrain, and therefore cannot represent the actual performance and reliability of the system. The traditional stress and strength interference (SSI) model can only be used in cases where there is a single load. Moreover, the SSI method is often applied to calculate the reliability index of a component with the known strength and load distribution, which ignores the influences of random wind loads and the control strategy on the system reliability. The results calculated by the traditional method are, therefore, very different from the reality in the wind industry and may lead to significant errors.
This paper is aimed at developing the aero-elastic-servo-hydro dynamic model of a wind turbine with the full drivetrain, which considers the flexibility of tower and blades, the stochastic loads of wind and waves, the gear meshing features, as well as the control strategy. Then, we develop reliability models for gears and bearings. The system reliability model of wind turbine drivetrain is modeled based on the fault tree using the survival signature. To make the paper readable and logical, the rest of this paper is structured as follows. Section 2 introduces the structure and transmission principles of wind turbine drivetrain, including design parameters, the schematic layout of the gearbox, and the topology of wind turbine drivetrain. Section 3 proposes the dynamic model of the wind turbine with considerations of the control system and environmental parameters. Section 4 shows the gear reliability model and the bearing reliability model. Following this, we develop the fault tree of the wind turbine drivetrain considering bearings and gears. The system reliability model is established based on the fault tree using the survival signature. Section 5 presents the preparations of the reliability analysis. Results and discussions are given in Section 6. Section 7 summarizes some conclusions of this paper.

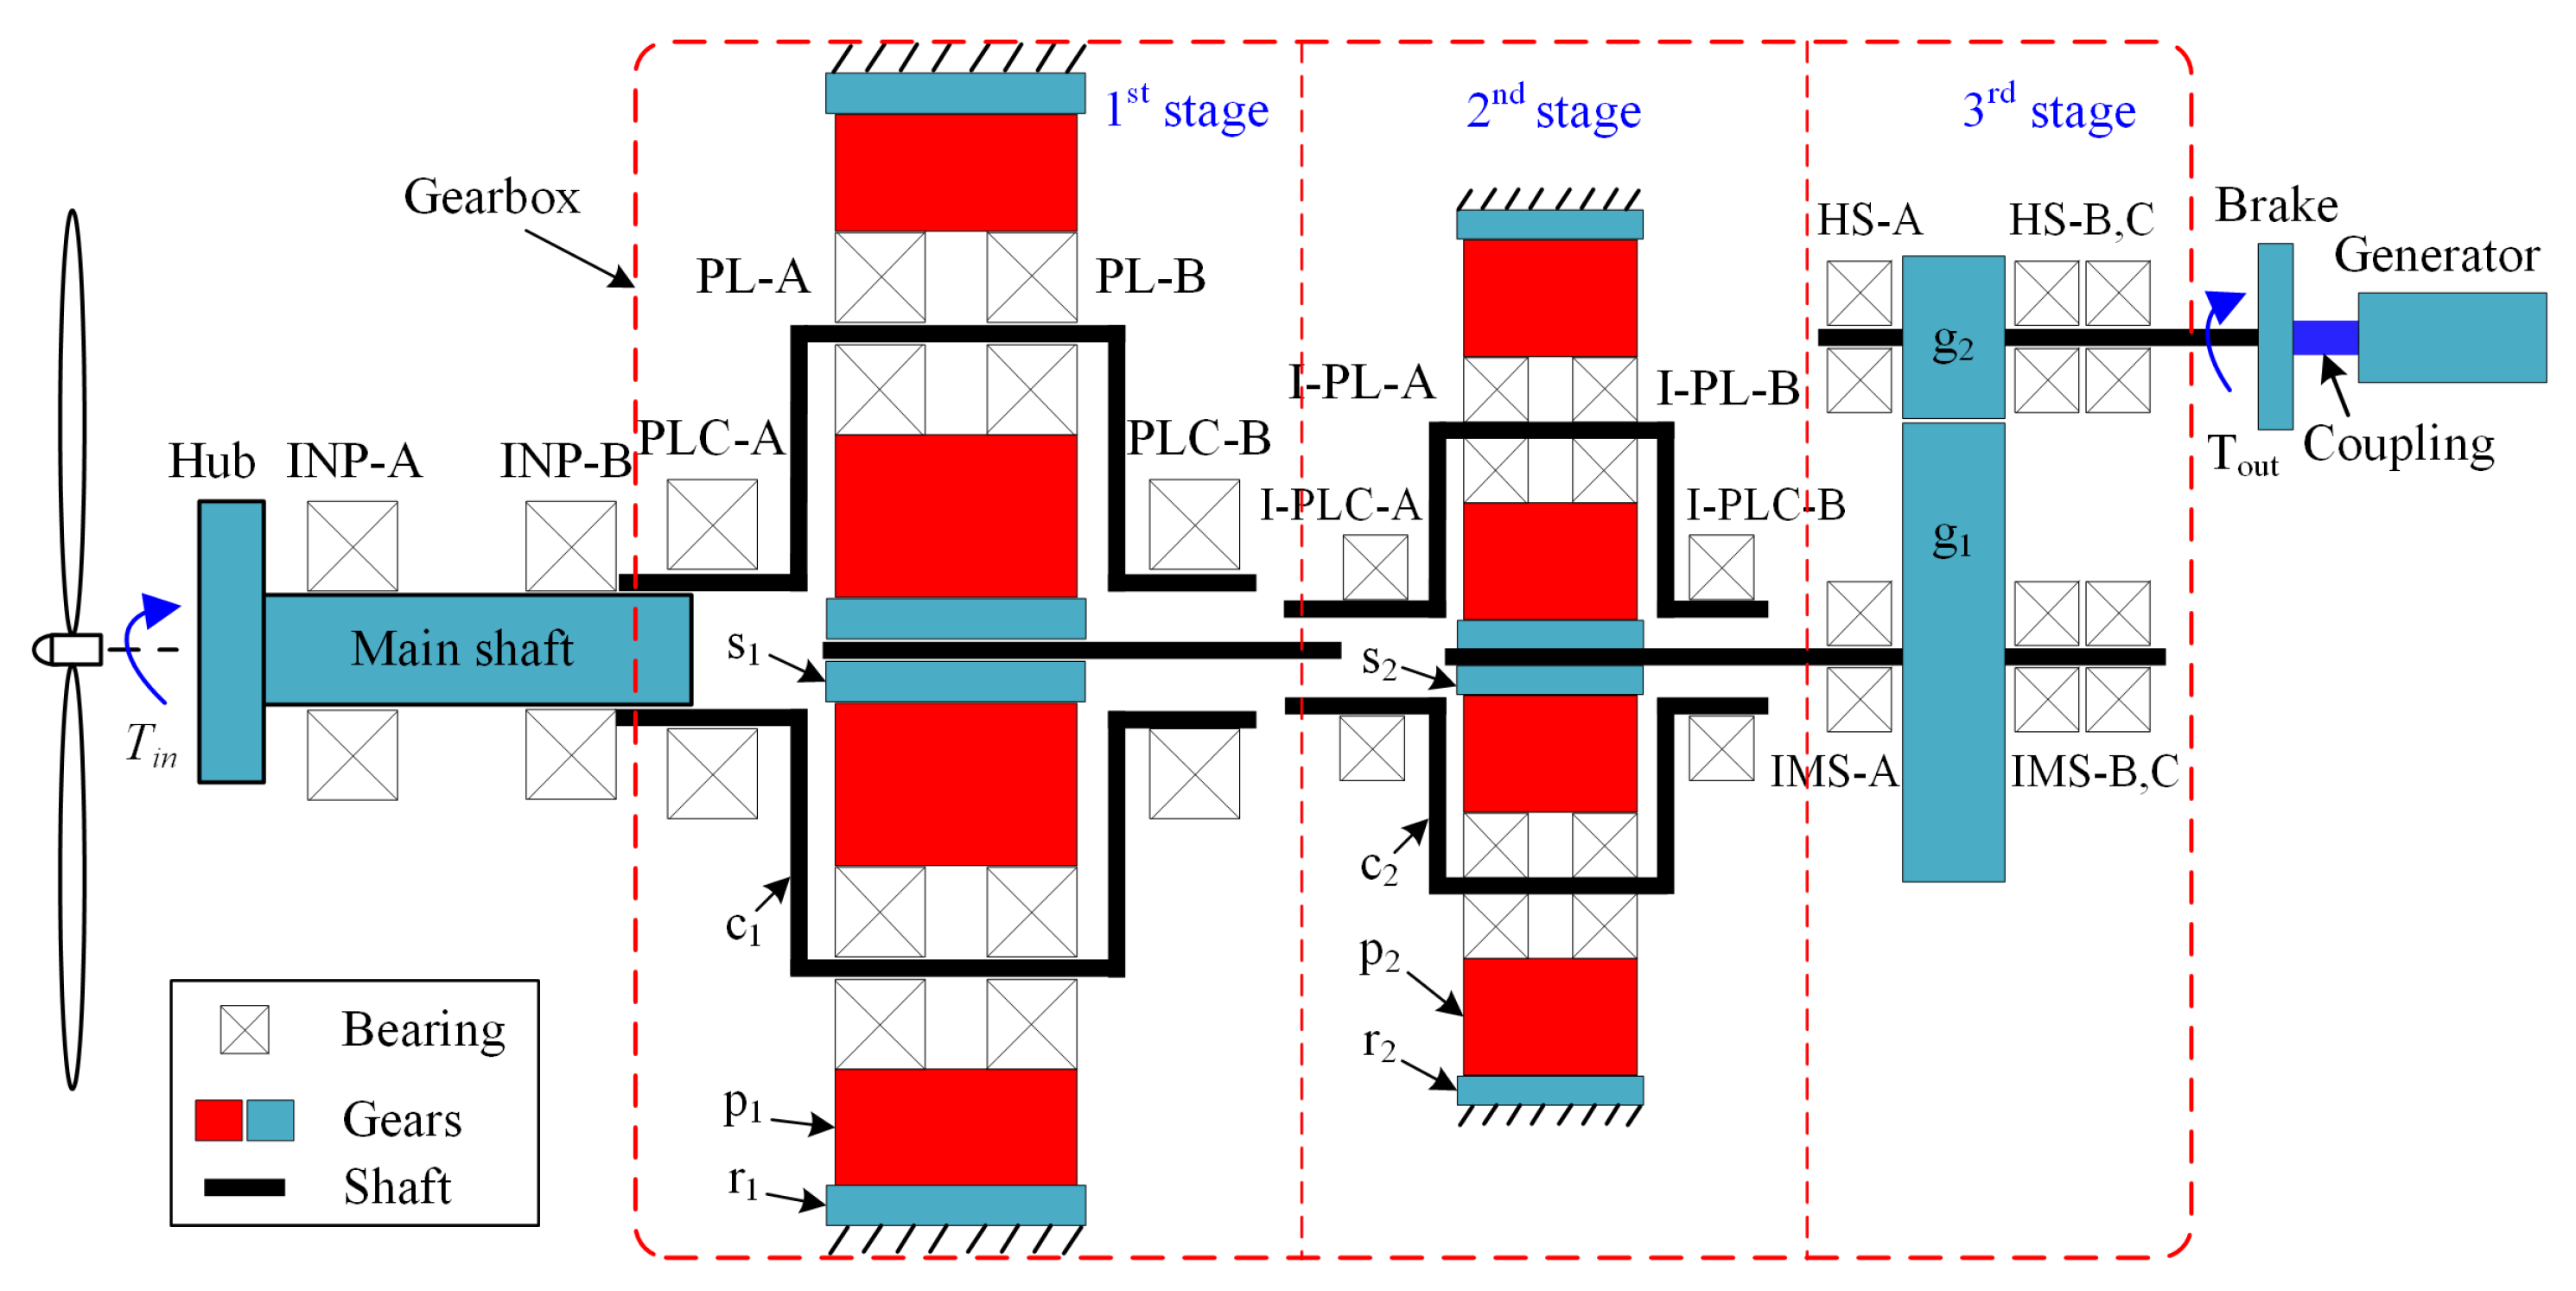
2. Structure and Transmission Principles of Wind Turbine Drivetrain

Due to the complex and harsh operating environment, wind turbines are confronting daunting challenges from service reliability issues. The drivetrain is one of the most critical subsystems of wind turbines. The failures of the wind turbine drivetrain often lead to high repair cost and long downtime. High reliability is, therefore, crucial to wind turbines. In this study, a 5 MW reference drivetrain for a wind turbine is considered, whose structure is shown in Figure 1. The NREL 5 MW wind turbine is a typical three-bladed, upwind, variable-speed, variable blade-pitch-to-feather-controlled turbine [20]. The rated wind speed and the rated rotor speed are 11.4 m/s and 12.1 rpm, respectively. Table 1 shows the 5 MW wind turbine specification. More parameters are described in [20].
The wind turbine drivetrain is supported by the tower that is fixed to the seabed by monopoles. The wind turbine drivetrain consists of the blade, hub, main shaft, main shaft bearing, gearbox, brake, generator, etc. The transmission system of the gearbox has three stages: two planetary gear stages and one parallel gear stage. Both the first stage and second stage are helical gear transmissions with three planets. The parallel gear stage is also helical gear transmission with two downwind bearings. The carrier of the first planetary gear stage is connected to the main shaft, and the pinion gear of the parallel gear stage is connected to the generator. The schematic layout and the bearing designations of wind turbine drivetrain are shown in Figure 2. INP-X is the main shaft bearing, PLC-X means planet carrier bearing, PL-X represents planet bearings, I-PLC-X and I-PL-X represent the mean planet carrier bearing and planet bearing of the intermediate stage, IMS-X is intermediate shaft bearing, and HS-X is the high-speed shaft bearing (X=A, B, and C). A and B (C) represent the locations of bearings installed at the upwind and downwind of the gear mesh. From the layout of the wind turbine drivetrain shown in Figure 2, two main bearings support the main shaft and two torque arms support the gearbox housing. It is, therefore, a four-point suspension wind turbine drivetrain. The geometrical specification of the gears and bearings of the wind turbine drivetrain can be found in the literature [21]. Bearing types are as per SKF 55 terminology.

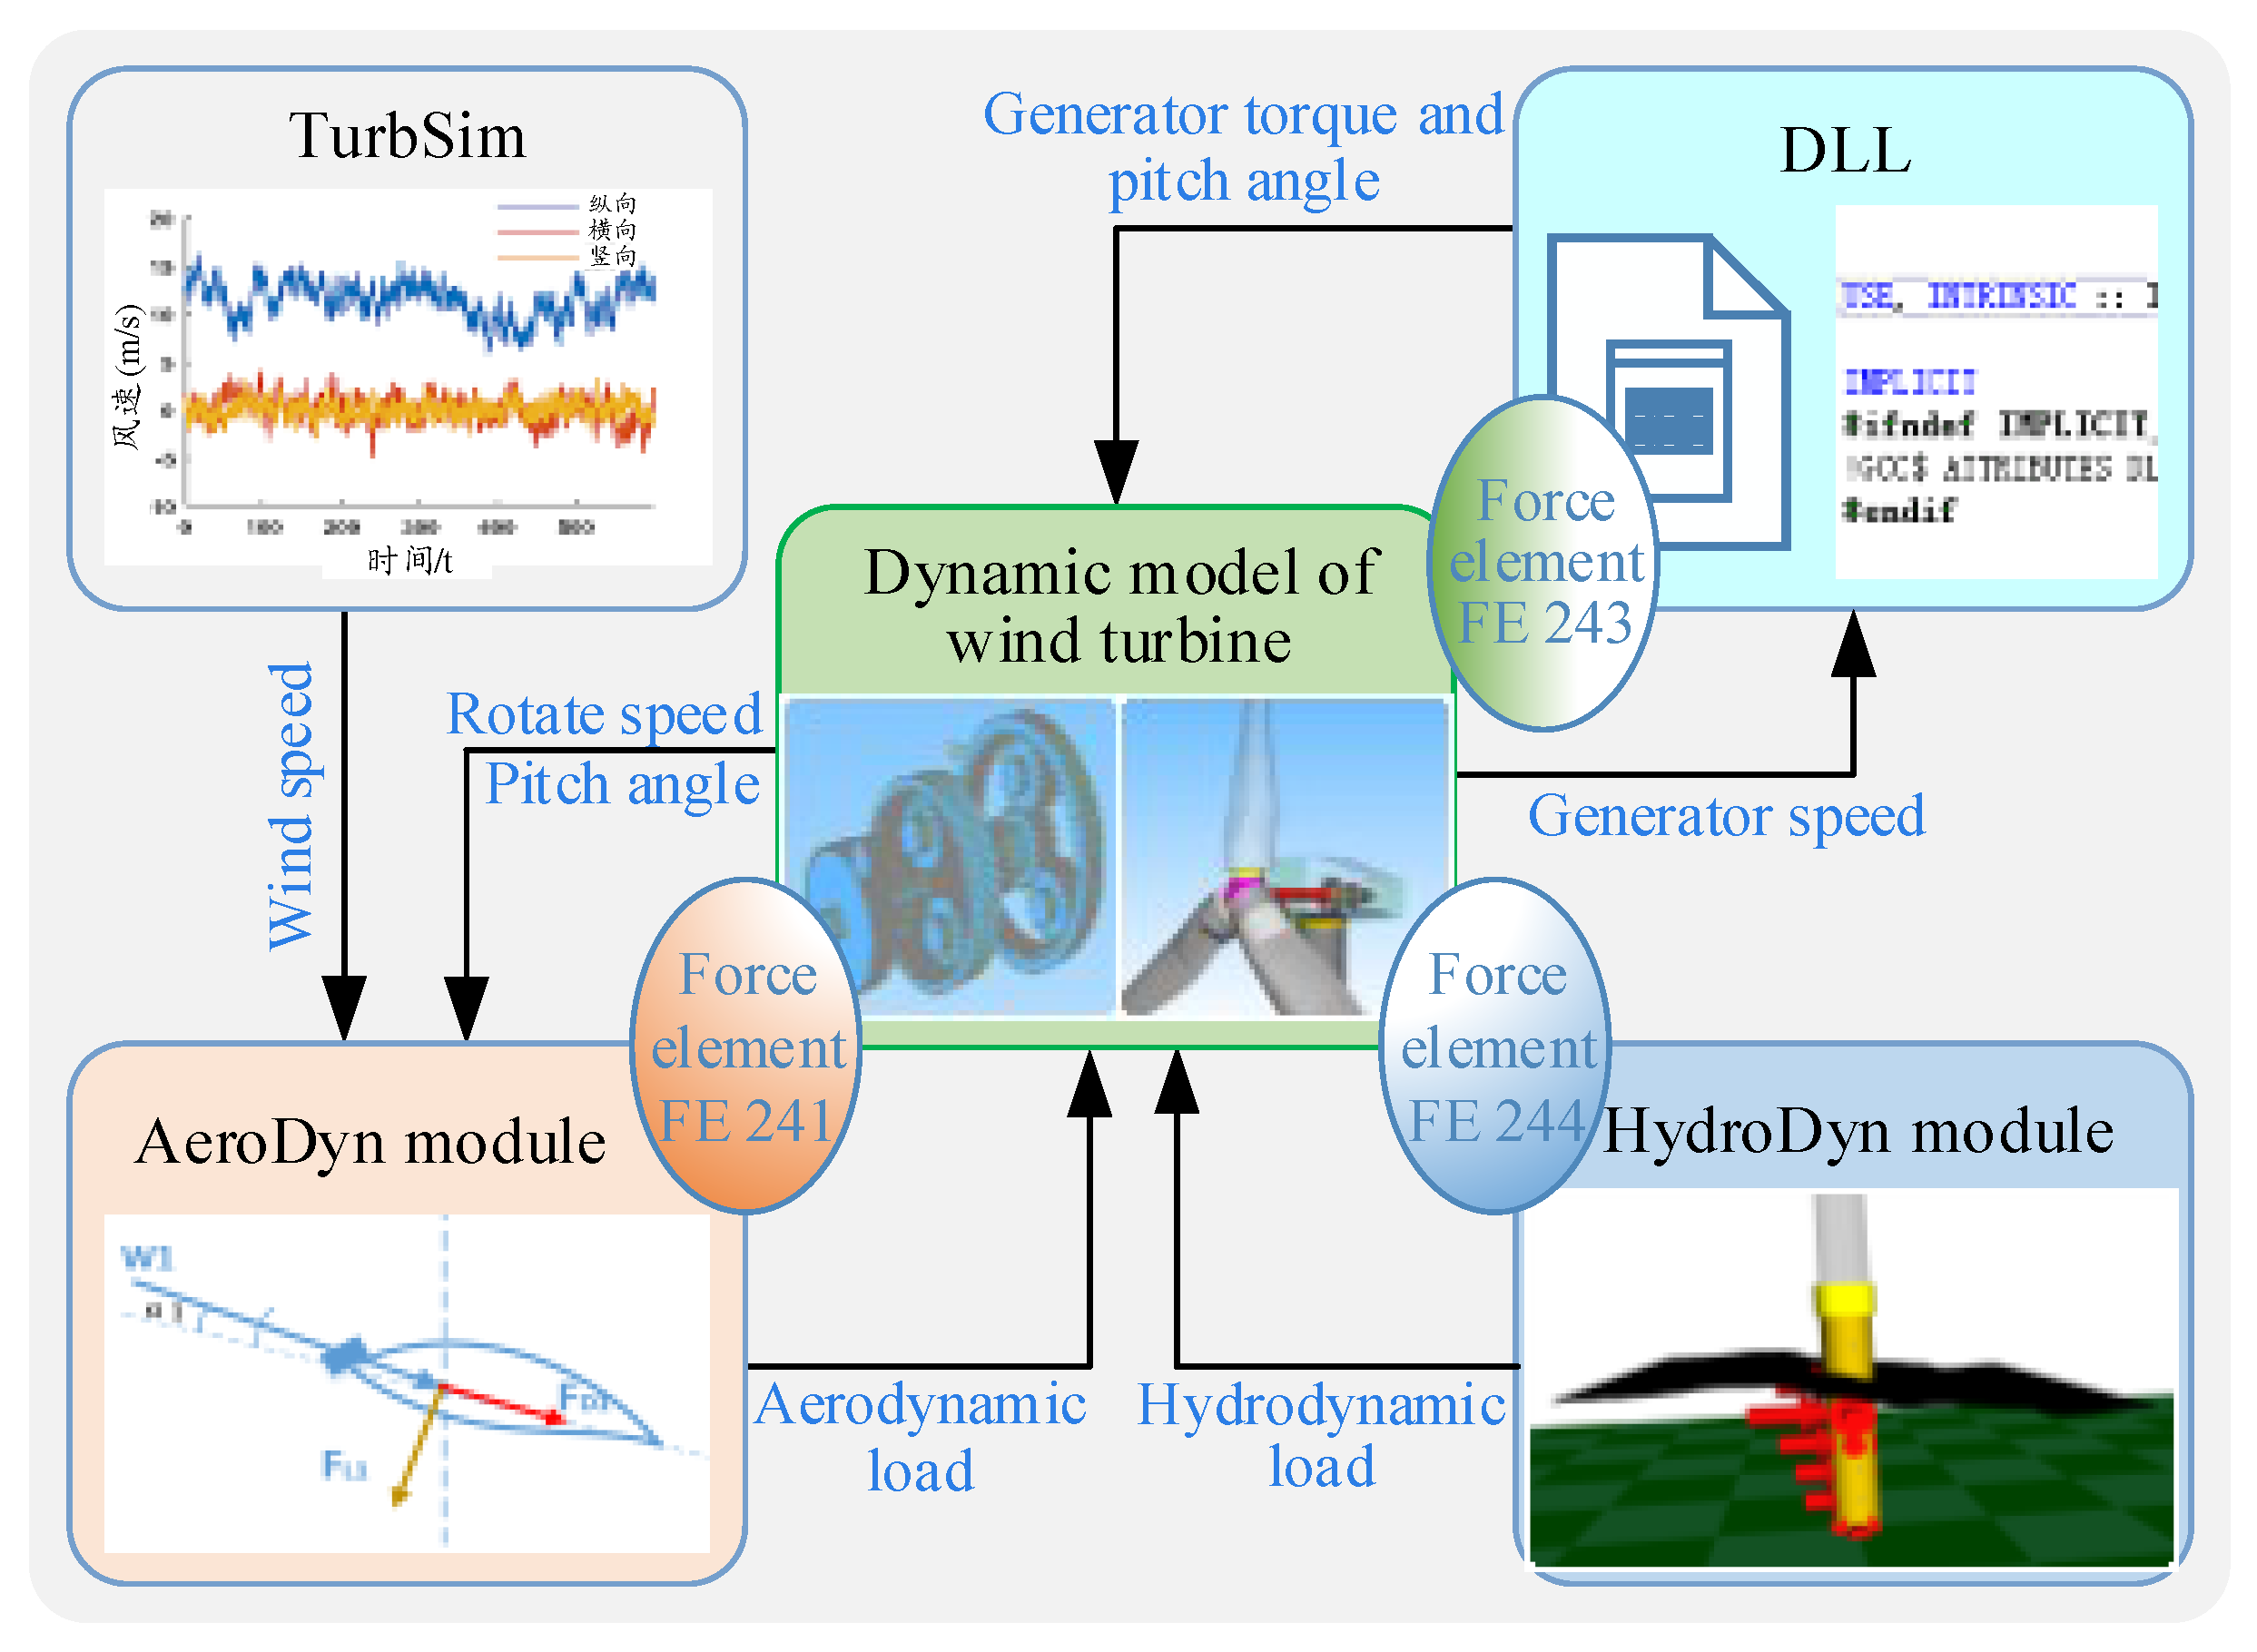
3. Electromechanical Coupling Dynamic Model of Wind Turbines

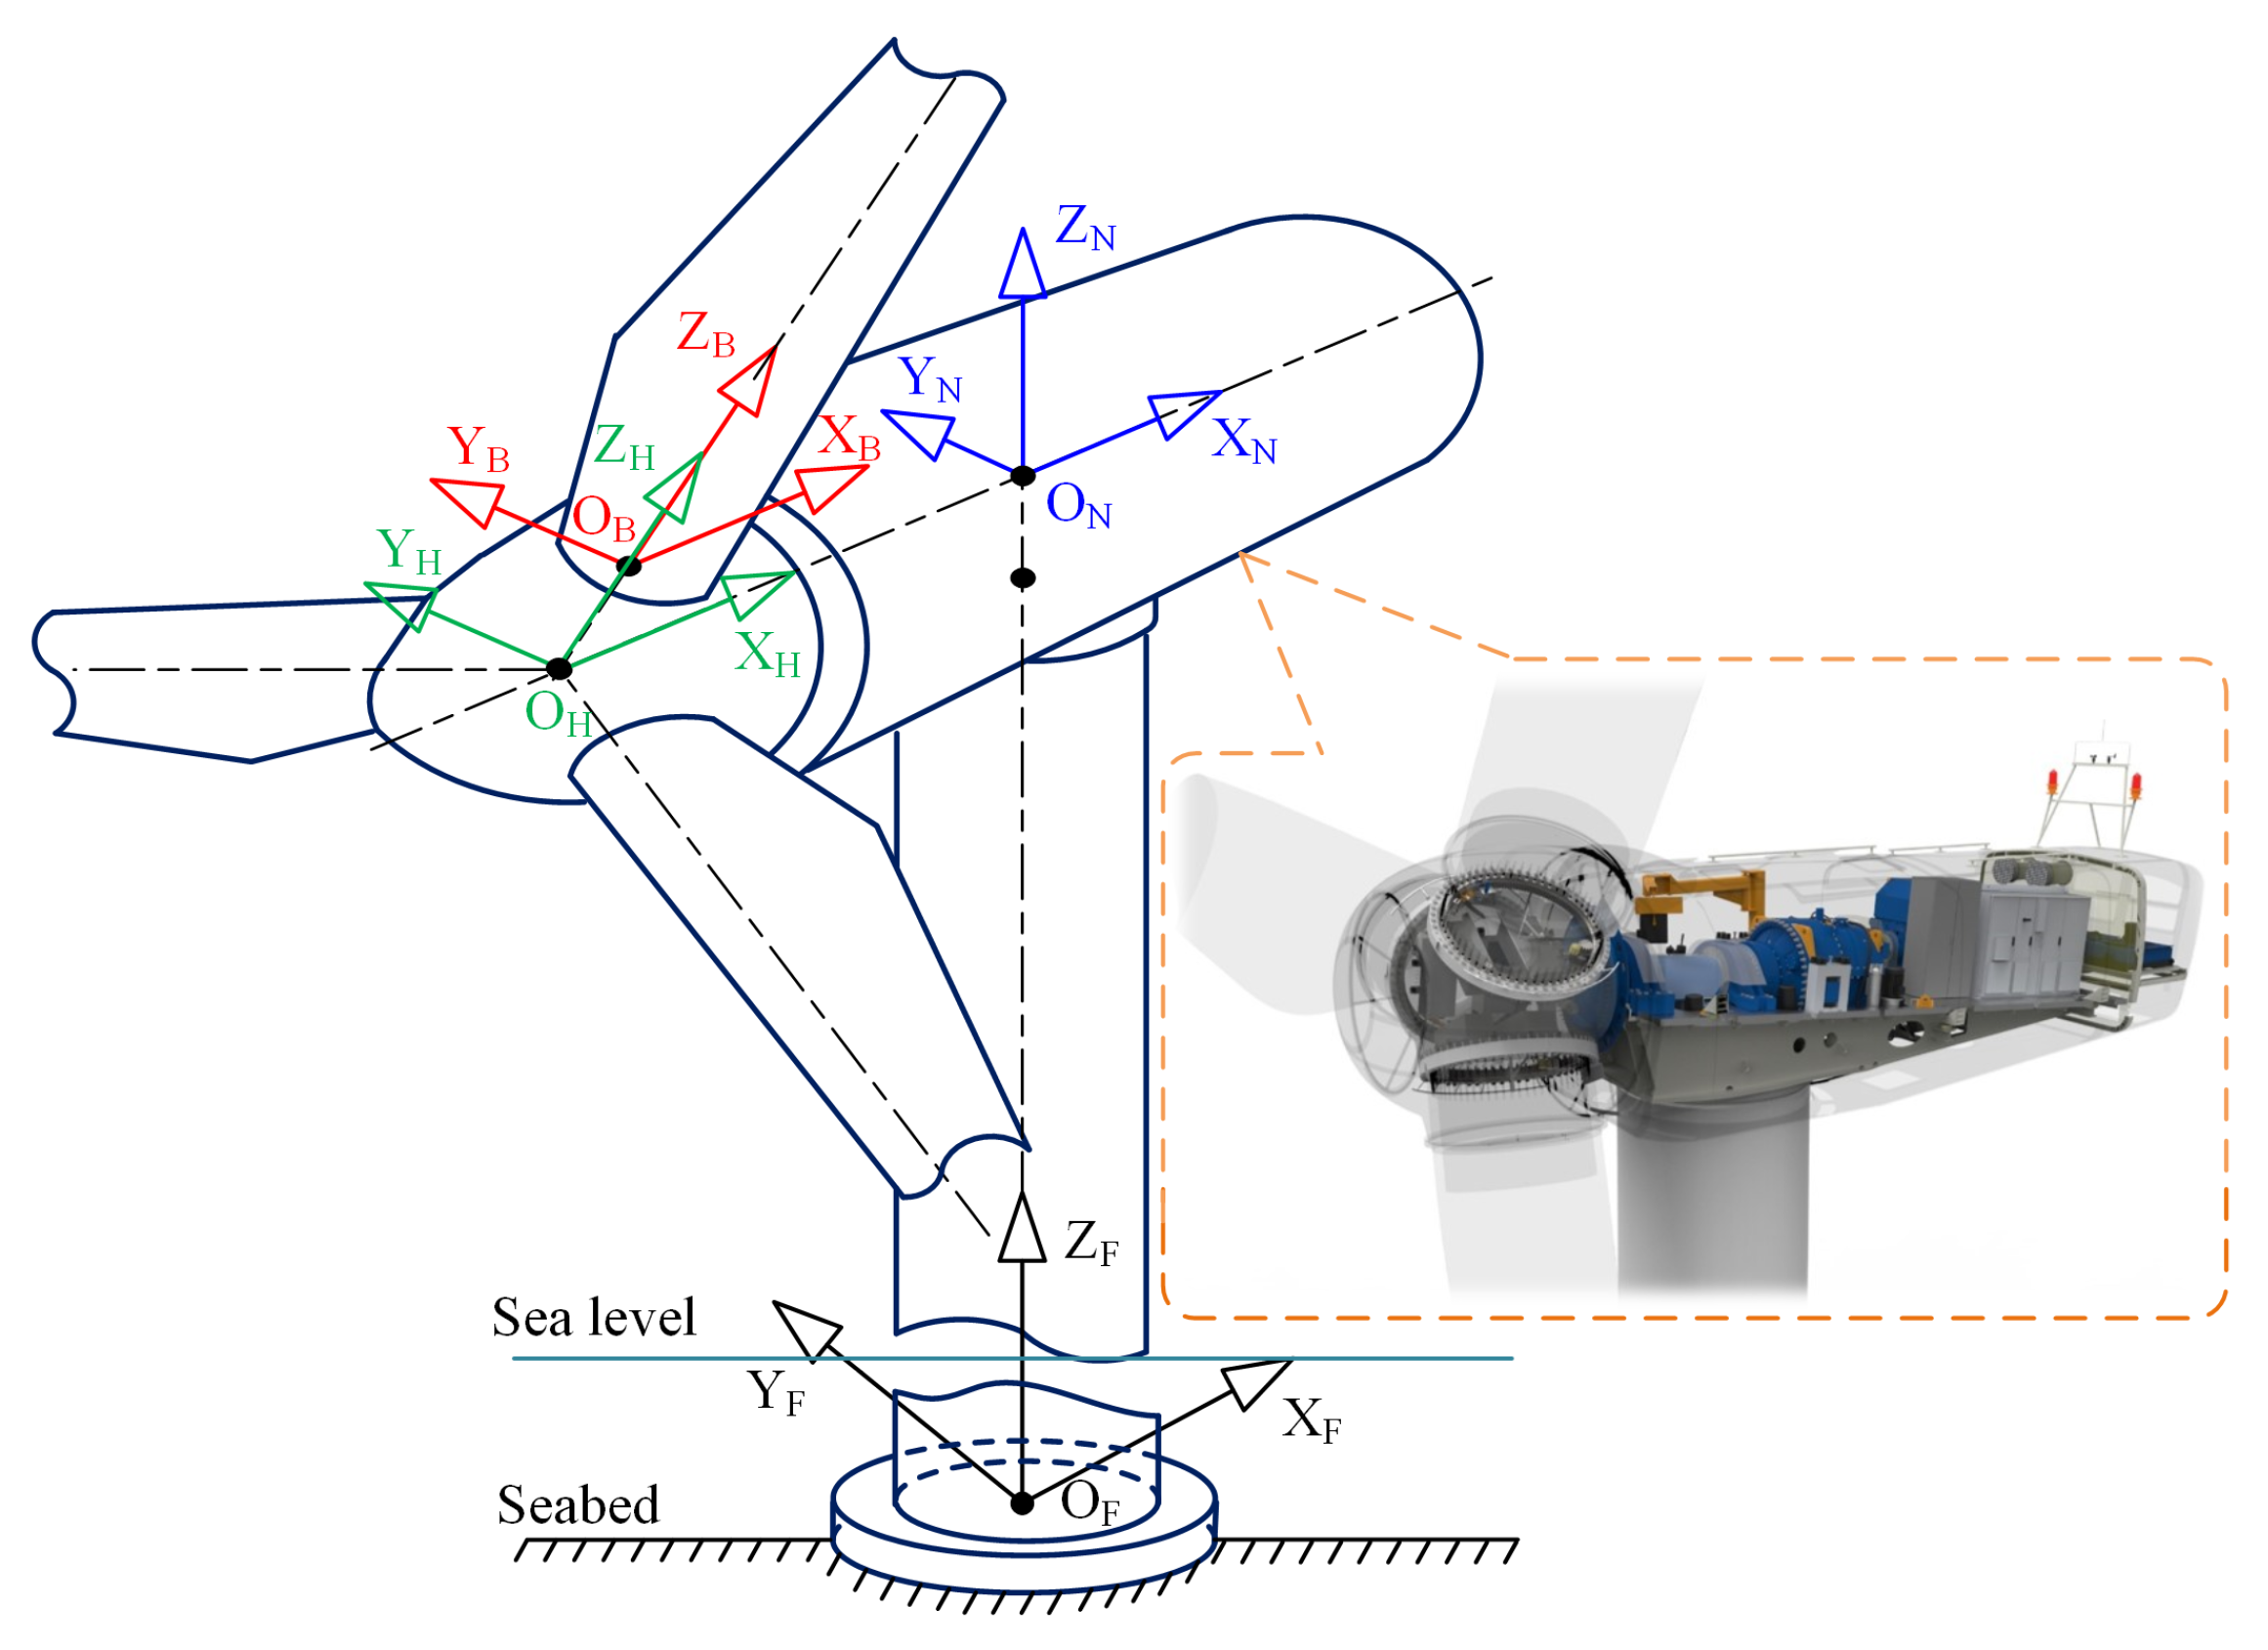
3.1. Coordinate System Definition

The bodies’ motions are defined by relative coordinates in multibody systems (MBS). The relative coordinate has significant advantages for dealing with the equations of motion of elastic bodies. Moreover, the relative coordinate can be used to represent the absolute coordinate due to the body’s free motion relative to the inertial system [22].
As shown in Figure 1, the coordinate systems of the foundation, blade, hub, and nacelle are defined as O F X F Y F Z F , O B X B Y B Z B , O H X H Y H Z H , and O N X N Y N Z N , respectively. The relative coordinate of tower (O F X F Y F Z F ) is attached to the foundation, the relative coordinate of blade (O B X B Y B Z B ) is attached to the blade root, the relative coordinate of hub (O H X H Y H Z H ) is located in the hub center, and the relative coordinate of nacelle (O N X N Y N Z N ) is fixed to the nacelle center that is above the tower tip. One coordinate can be transformed into another using the coordinate transformation. Each component has six DoFs, and the generator rotor has a axial rotational DoF [3,23].

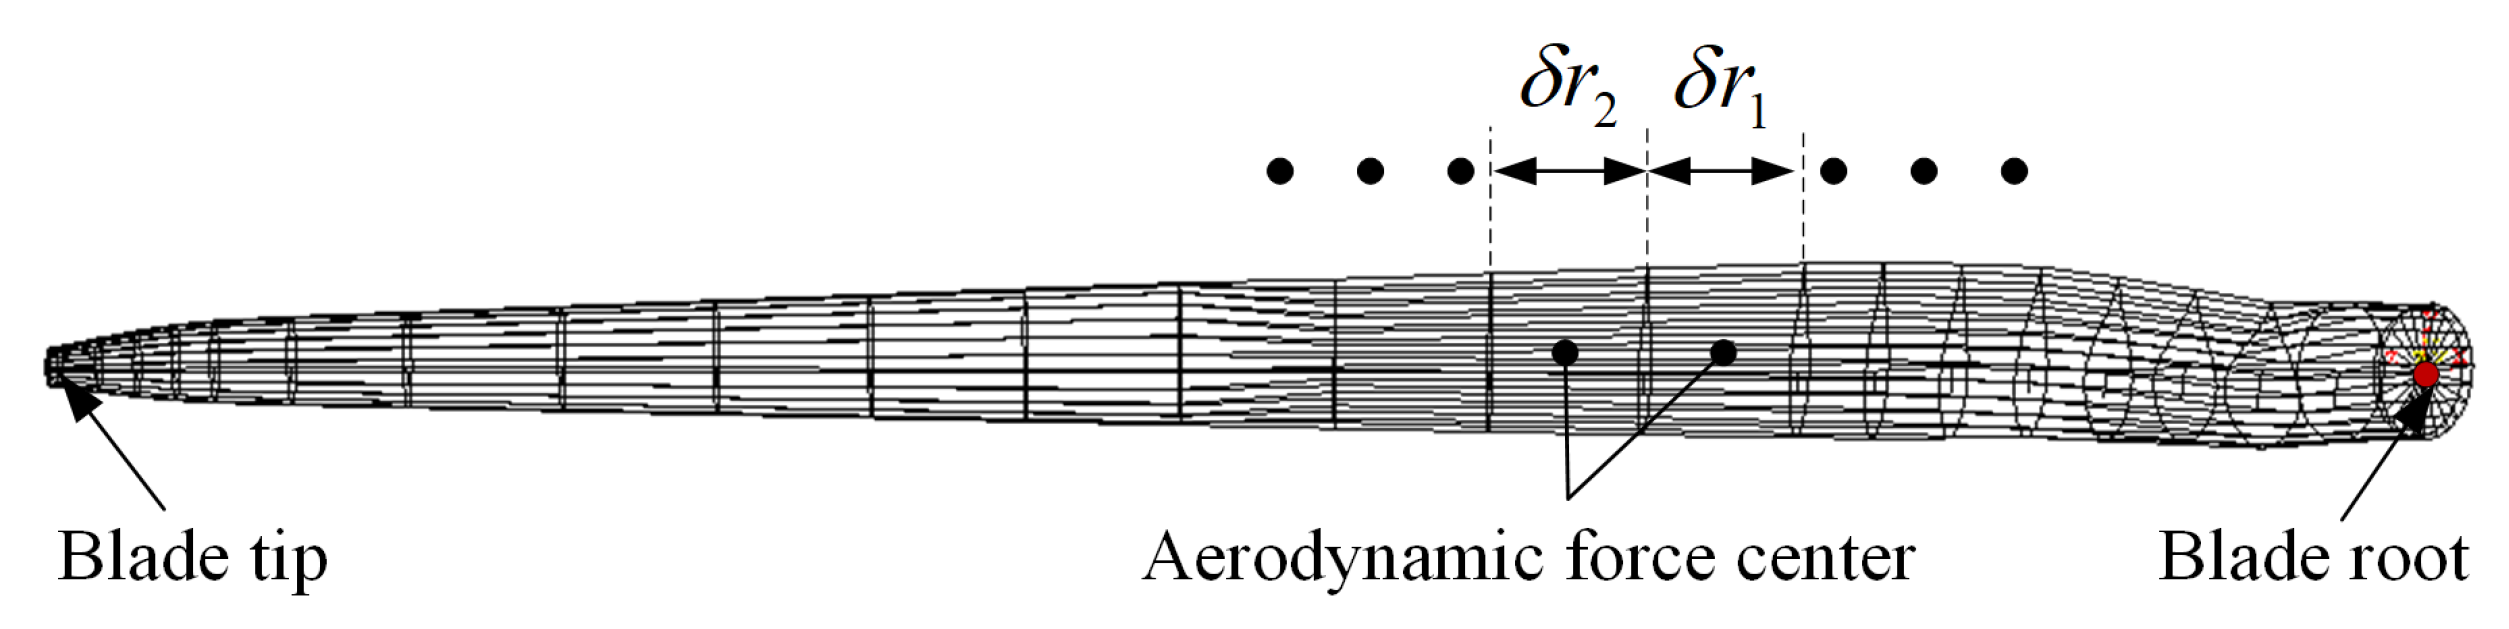
3.2. Aerodynamic and Wave Model
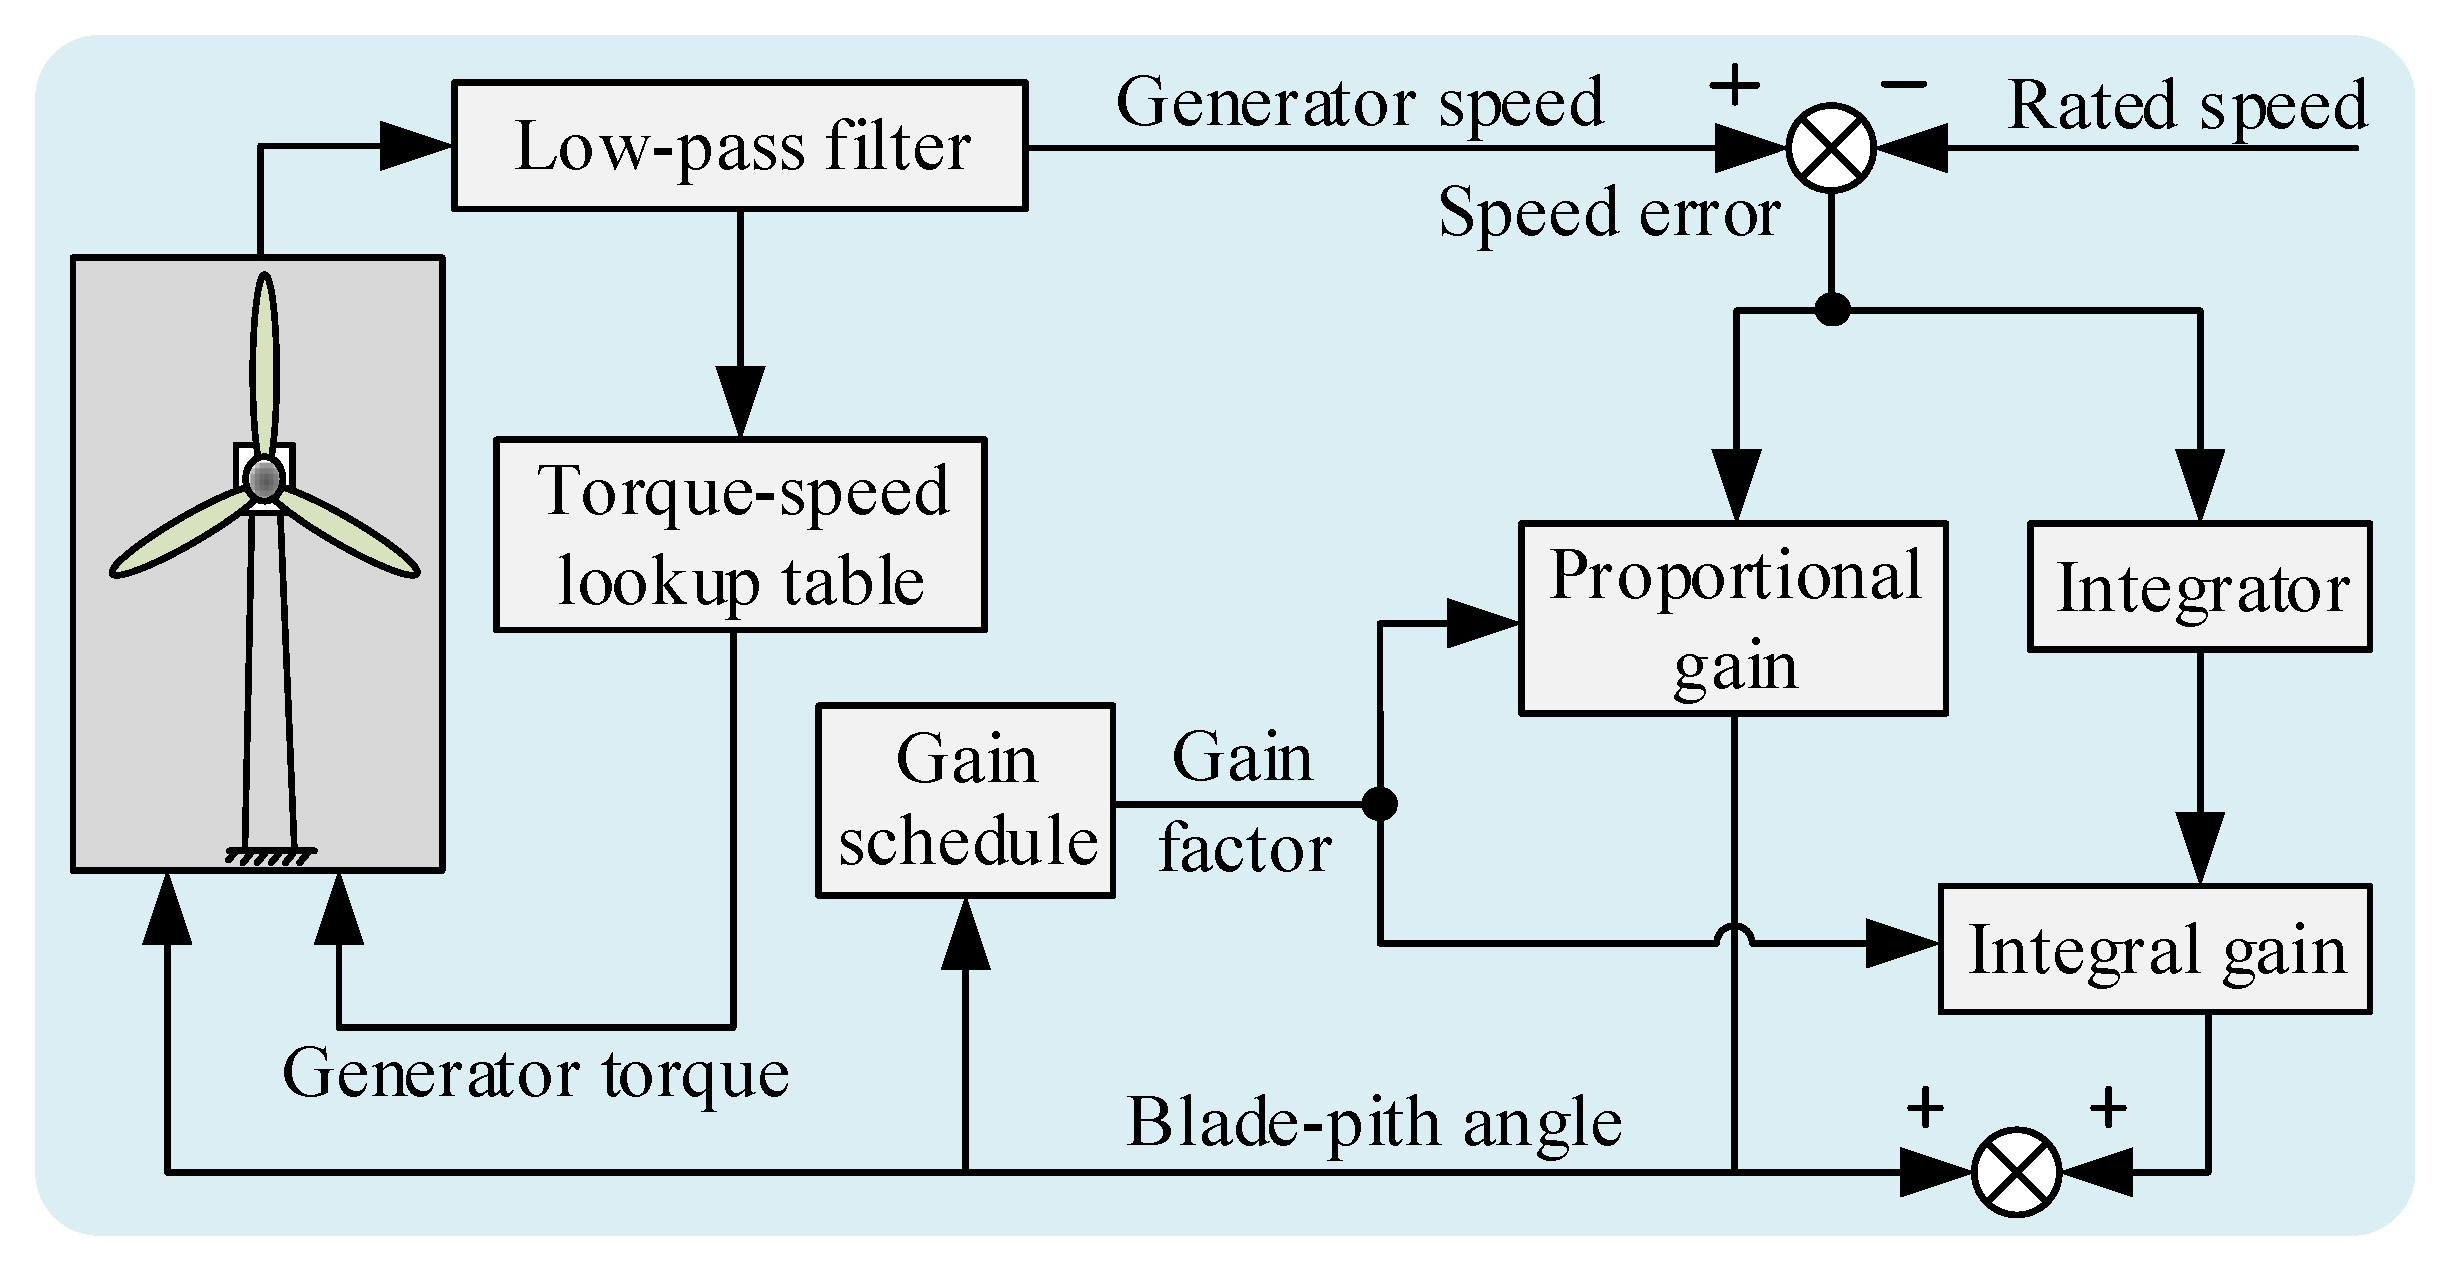
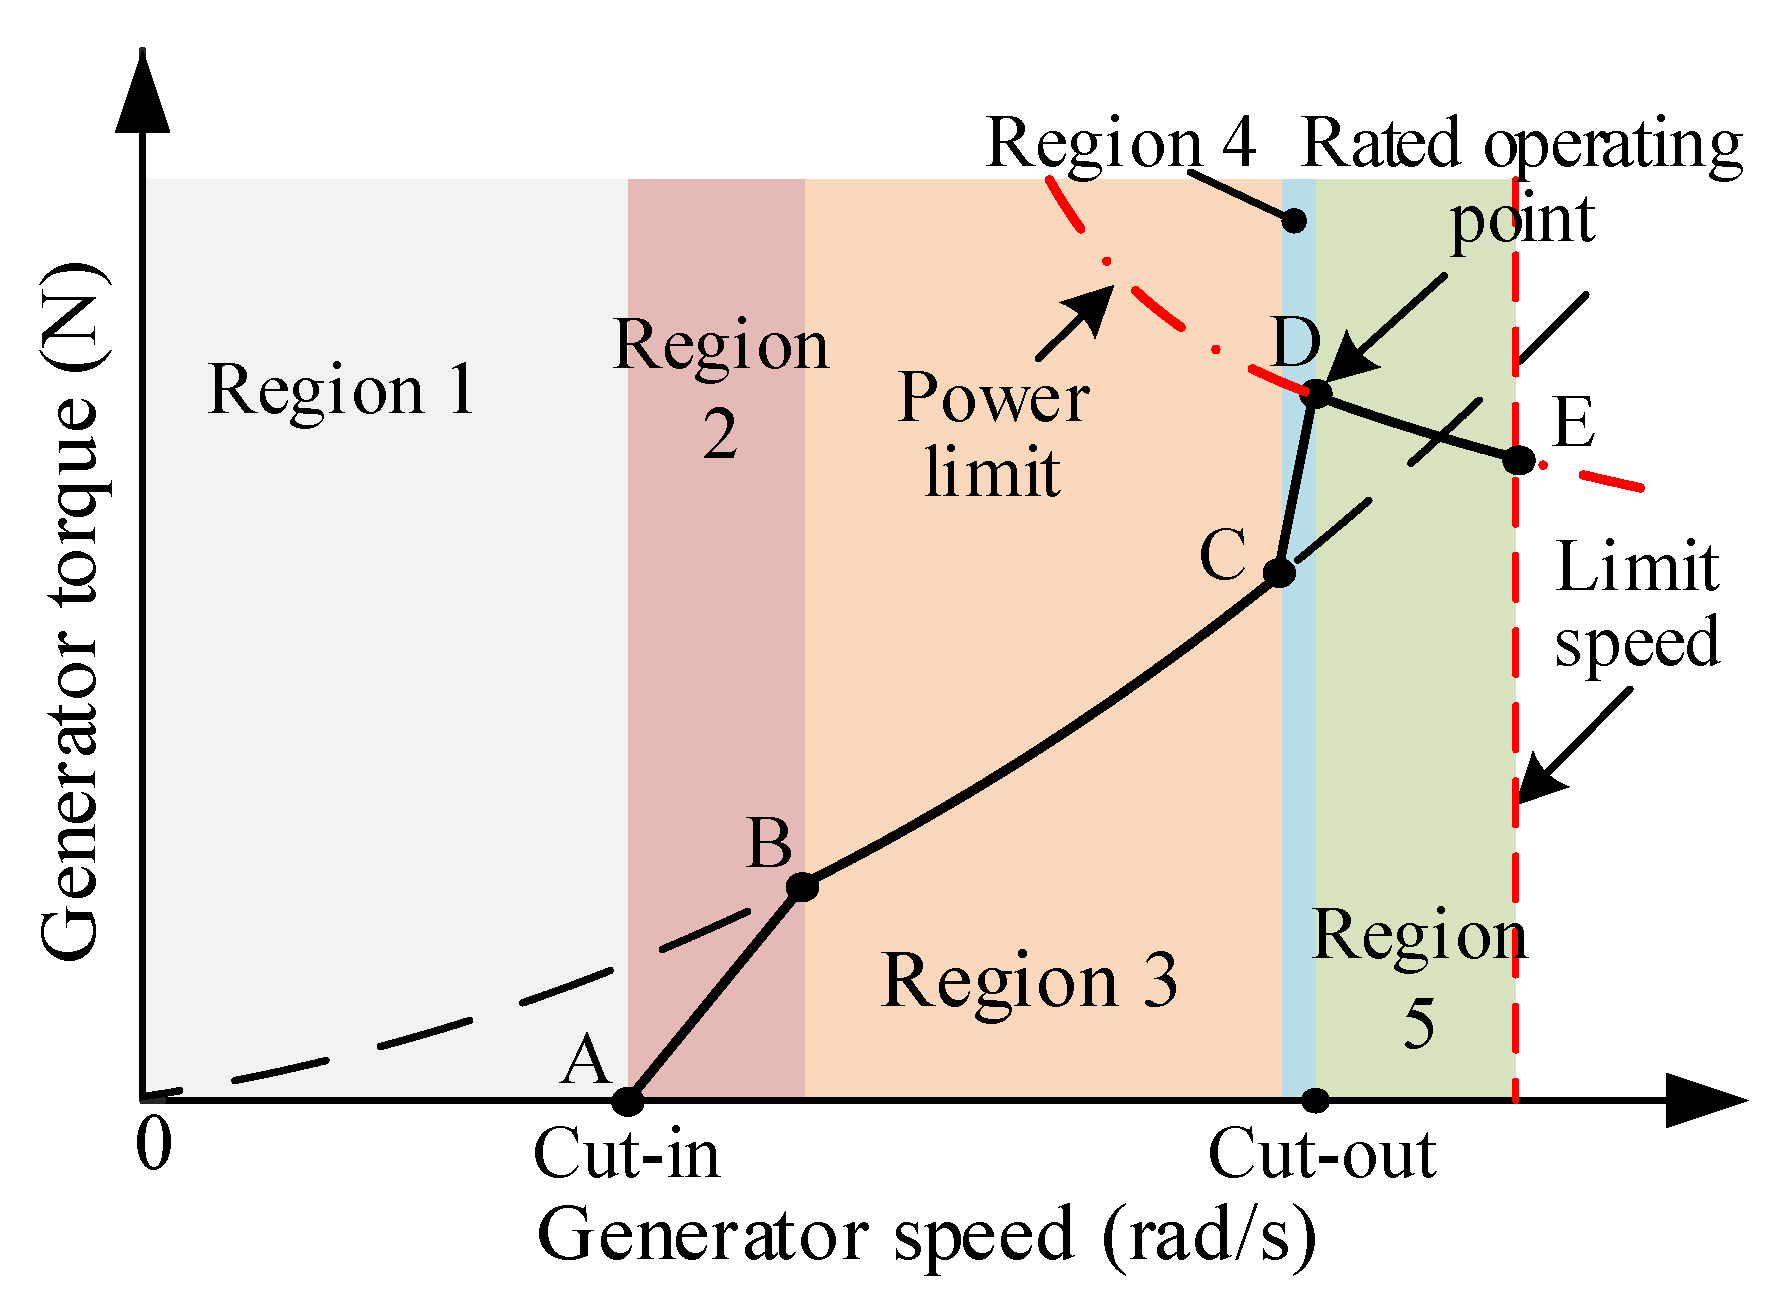
The wind and waves are the main external excitations with randomness, but they also have a specific correlation. This paper adopts a joint probabilistic model of the mean wind speed (v), significant wave height ( H s ), and spectral peak period ( T p ) for long-term prediction. Based on this, the joint density function can be derived as follows [24],
f v H s T p ( v , h , t ) = f v ( v ) · f H s | v ( h | v ) · f T p | H s v ( t | h , v )
where v is chosen as the primary parameter.
The Kaimal spectrum is used to model the short-term wind distribution according to the IEC 61400-1, and the dimensionless equation of the power spectral density function is shown in Equation (2) [25],
S k ( f ) = 4 σ k 2 L k / V h u b ( 1 + 6 f L k / V h u b ) 5 3
where V h u b denotes the wind speed at the hub height, f is the frequency, subscript k represents the wind speed component ( u , v , and w mean the longitudinal, lateral, and vertical directions, respectively), σ k is the velocity component standard deviation, and L k represents the velocity component integral scale parameter.
The wind profile V ( z ) that denotes the mean wind speed is a function with respect to the height (z), which is given by the power-law as follows,
V ( z ) = V h u b / ( z z h u b ) α
where z h u b represents the hub height, and the power-law exponent α denotes vertical wind shear factor.
The aerodynamic force acting on the blades can be calculated using the blade element momentum theory [24]. For a blade section with a length δ r , the lift force and the drag force can be expressed, respectively, as follows,
d L = 1 2 ρ V r e l 2 c C L δ r , d D = 1 2 ρ V r e l 2 c C D δ r
where ρ means the air’s density; C L and C D are the lift and drag coefficients, respectively; and V r e l is the relative velocity related to the induced velocity. Each blade is divided into 17 sections [20], and the calculated aerodynamic force of each section is applied to the aerodynamic center point as shown in Figure 3.
The wave loads can be calculated using Morison’s formula. This approach is well-suited when the wavelength is longer than the monopoles diameter. The horizontal force on a trip of length ( d z ) is expressed as follows,
d F = C M ρ w π D 2 4 u ˙ d z + C D ρ w π D 2 | u | u d z
where C M and C D represent the mass and drag coefficients, respectively; ρ w is the mass density of the water; D represents the diameter of the cylinder; and u is the horizontal undisturbed fluid velocity evaluated at the strip center and a dot indicates a time derivative.

3.3. Control System

The flowchart of the integrated control system is presented in Figure 4. The generator-torque controller is applied to maximize power capture under the rated operating condition, and the generator torque is calculated by a tabulated function, as shown in Figure 5. Region 1 represents a control region, in which the generator does not function before the cut-in wind speed (point A). Regions 2 and 4 are linear transitions. In Region 3, the generator torque is proportional to the square of the filtered generator speed to maintain an optimal tip-speed ratio, which can optimize power capture. In Region 5, the generator torque is inversely proportional to the filtered generator speed to hold the generator power constant above the cut-out wind speed.
The blade-pitch controller aims to regulate generator speed if the speed is higher than the rated operation point. The blade pitch angle commands are calculated using a gain-scheduled proportional-integral, which can be expressed as follows,
P ( θ ) = K P ( θ = 0 ) · G K ( θ ) , K I ( θ ) = K I ( θ = 0 ) · G K ( θ ) , G K ( θ ) = 1 / ( 1 + θ / θ k )
where θ is the blade pitch angle; K P ( θ ) , K I ( θ ) , and G K ( θ ) are the proportional gain, the integral gain, and the dimensionless gain-correction factor, respectively. They are all dependent on the blade pitch angle θ .

3.4. Dynamic Model of the Wind Turbine Drivetrain

The electromechanical coupling dynamic model of the wind turbine is established in SIMPACK based on the rigid-flexible coupled multibody dynamics method [26]. This model includes the blade, main-shaft, gearbox, generator, and tower, as shown in Figure 6. Aerodynamics and hydrodynamics are calculated using the third-party modules of the NREL AeroDyn (Aerodynamics, v15, NREL, Golden, CO, USA) [27] and HydroDyn (Hydrodynamics, v2.05.00, NREL, Golden, CO, USA) [28], respectively. The wind turbine control module is implemented using an external dynamic link library (DLL) in the style of Garrad Hassan’s Bladed wind turbine package. A Timoshenko beam formulation is used to represent the blade and tower as finite element models. The bending, torsional, and coupling modes can be considered at the same time based on the Timoshenko beam theory. Moreover, the first six and the first ten modes are taken into account respectively according to the GL (Germanischer Lloyd) certification guide [29]. Bearings are simplified to a 6 × 6 diagonal matrix. Gears are modeled as rigid bodies with six degrees of freedom (DoFs), and the gear contact analysis takes the time-dependent tooth meshing into consideration by fluctuating mesh stiffness according to the AGMA 2006 standard. To consider the influences of gear tilt and obtain the load distribution across the tooth face width, gears are modeled using the slicing approach.
The equations of motion for the MBS is derived by the Second Kind Lagrange Equation. Using generalized co-ordinates, the dynamic differential equations of the MBS can be expressed as follows,
[ M ] { q ¨ } + [ C ] { q ˙ } + [ K ] { q } = { F }
where [ M ] , [ K ] , and [ C ] represent the mass, stiffness, and damping matrix of the system, respectively. { q ¨ } , { q ˙ } , and { q } represent the vectors of the accelerations, speeds, and displacements, respectively. { F } is the load vector that is equal to ( F x , F y , F z , M x , M y , M z ) T . The displacement matrix { q } in a six DoFs system is equal to q = ( x , y , z , α , β , γ ) T .
The generator torque ( T g e n ) could be calculated by [21]
T g e n = K p · e + K I · 0 t e d t
where K p and K I are proportional and integral gain, respectively; e = w w r e f denotes the difference between angular velocity of the generator shaft obtained by the MBS model and reference value obtained from the global analysis. The detailed properties of generator can be found in [20].

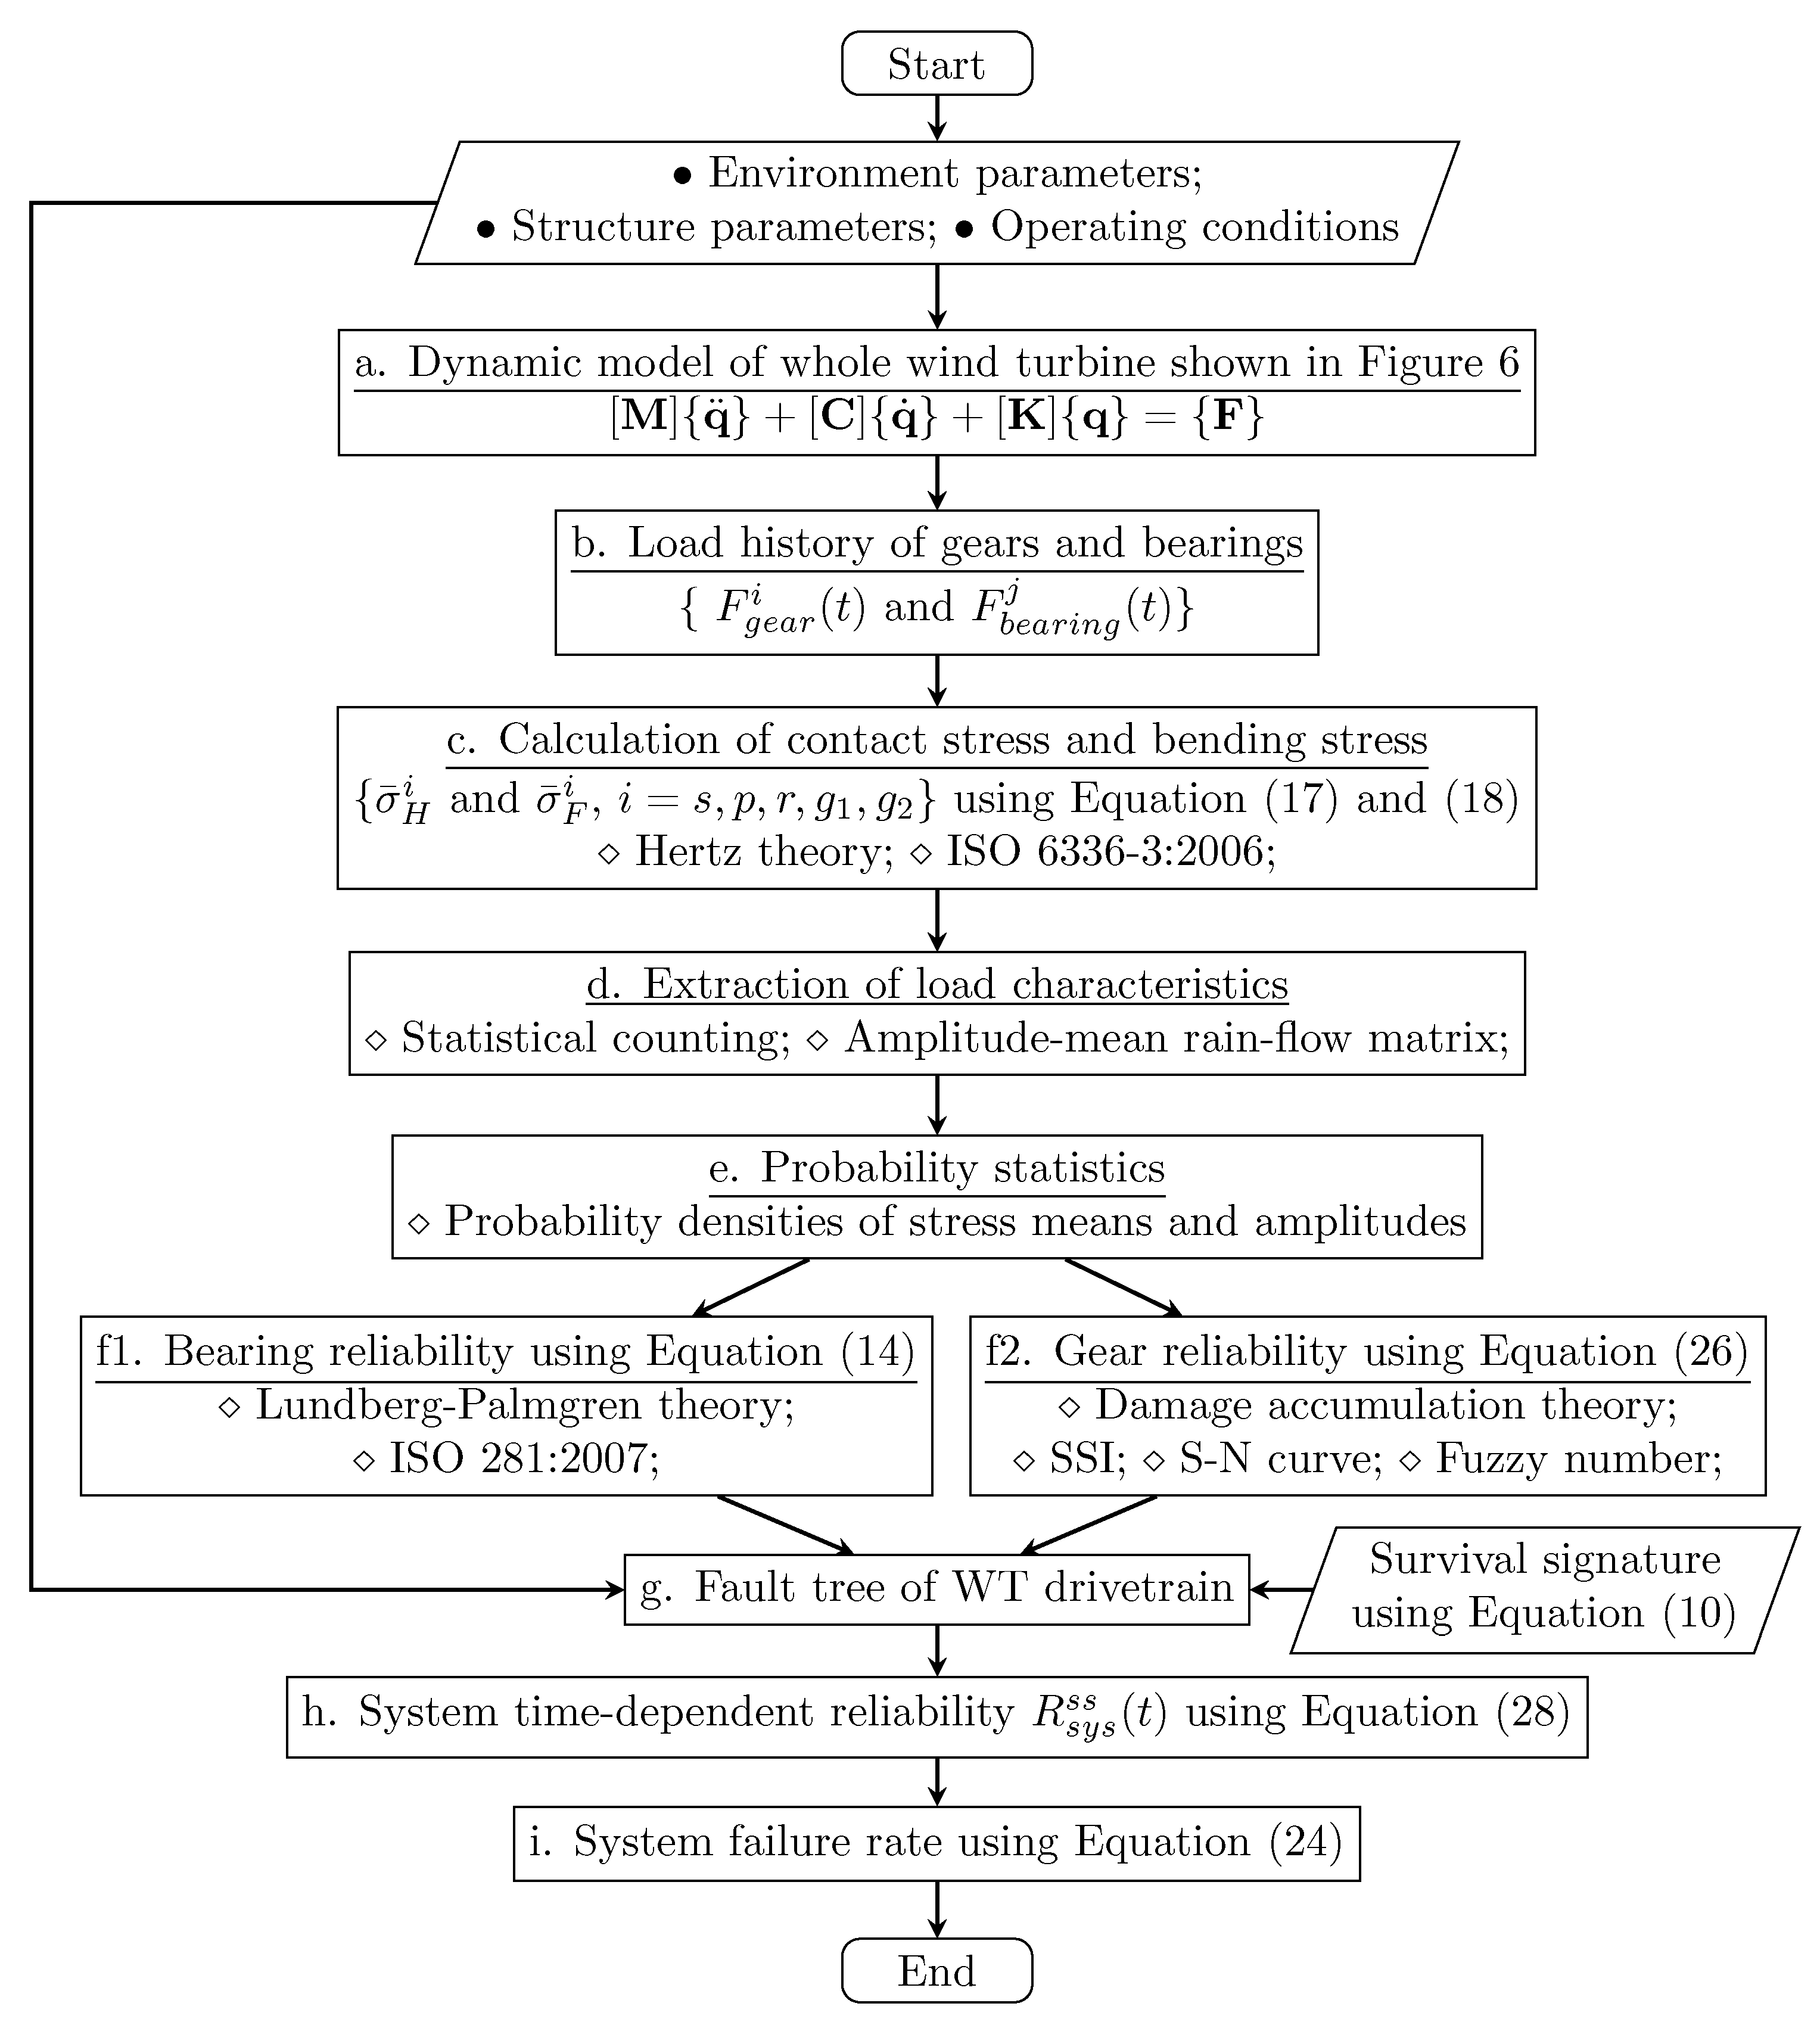
4. Dynamic Reliability Model of the Wind Turbine Drivetrain

The wind turbine drivetrain is treated as a series-parallel connection system in this paper. The survival signature is adopted to build the system reliability model of wind turbine drivetrain with multiple types of components. The realistic reliability models of bearings and gears play an essential role in the reliability assessment of wind turbine drivetrain. Therefore, based on the international standard and the Lundberg–Palmgren theory, the reliability formula of bearings is derived in Section 4.2. The gear reliability model is studied based on the Hertz theory and the fatigue damage accumulation rules. Moreover, a fuzzy reliability model of gears with consideration of fatigue damages is proposed in Section 4.3. All proposed approaches are used to establish the system reliability model of the wind turbine drivetrain. The technical flowchart of the system reliability is given in Figure 7.

4.1. Survival Signature

Assume a coherent system with m components of K 2 types, with m k components of type k { 1 , 2 , , K } and k = 1 K m k = m . The probability that the system functions is denoted as Φ ( l ) ( l = 1 , 2 , , m ). If the system has l components that function, the rest m l components in the system do not function. The state vector x ̲ = ( x ̲ 1 , x ̲ 2 , , x ̲ K ) { 0 , 1 } m with the sub-vector x ̲ k = ( x 1 k , x 2 k , , x m k k ) is used to express the components’ states of the type k ( i = 1 m k x i k = l k ). The structure function ϕ ( x ̲ ) is equal to 0 if the system does not function and ϕ ( x ̲ ) = 1 if the system functions. The system’s survival function is defined as Φ ( l 1 , l 2 , , l K ) , which denotes a probability that the system functions while l k components of type k function, for l k = 0 , 1 , , m k [30].
Considering that there are m k l k state vectors x ̲ k with l k components of its m k components x i k = 1 . The set of the state vectors for components of type k is denoted by S l k . Let S l 1 , , l K represent the set of all state vectors for the system. All the state vectors x ̲ k S l k are equally likely to occur under the condition that the failure times of m k components of type k are able to be interchanged. Therefore, Φ ( l 1 , l 2 , , l K ) can be obtained by
Φ ( l 1 , l 2 , , l K ) = k = 1 K m k l k 1 × S l 1 , , l K ϕ ( x ̲ )
The number of type k components of the system that function at time t can be mathematically represented as C t k { 0 , 1 , , m k } ( t > 0 ) . By applying the failure times and the reliability function ( R k ( t ) = 1 F k ( t ) ) of components of different types, the probability that the entire system functions at time t can be derived as follows,
R s y s ( t ) = l 1 = 0 m 1 l K = 0 m K Φ ( l 1 , , l K ) k = 1 K m k l k R k ( t ) l k 1 R k ( t ) m k l k

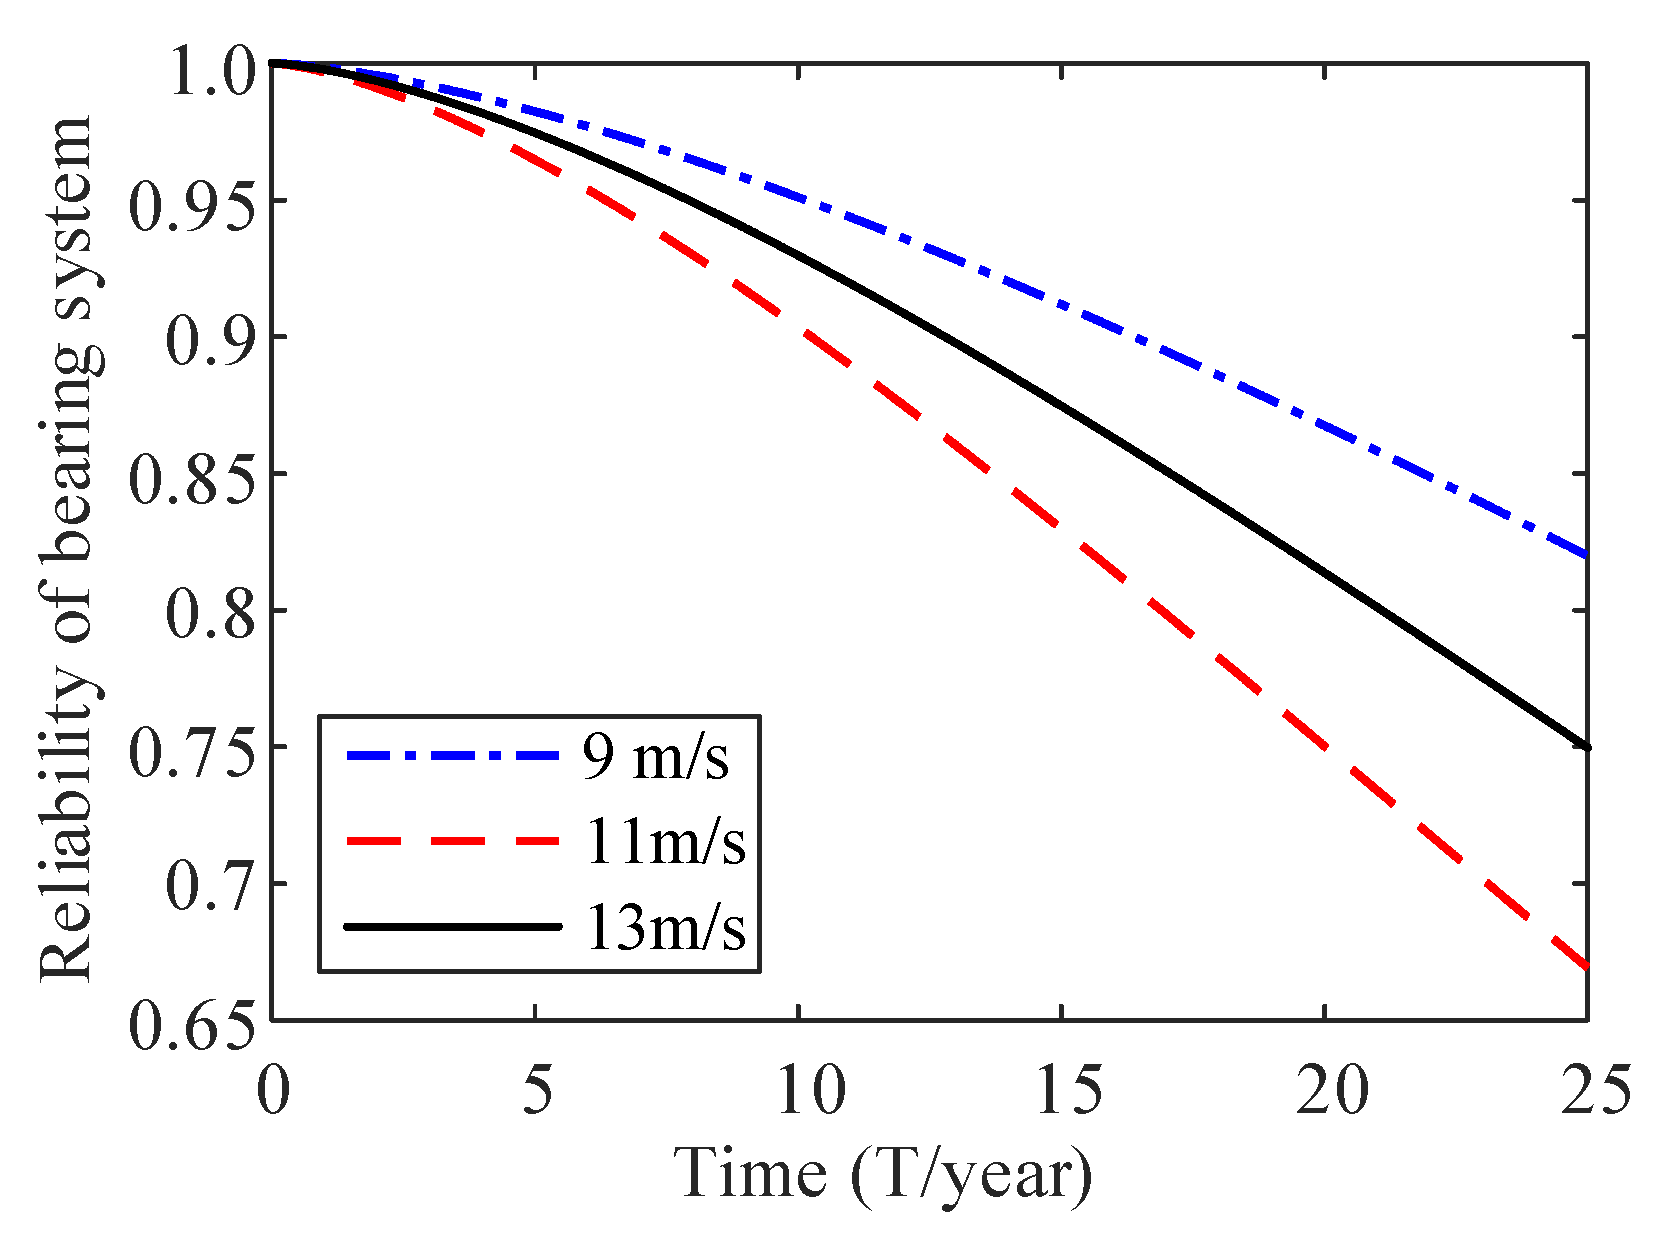
4.2. Bearing Reliability

Bearings are standard mechanical components, and the lifetime of bearings follows three-parameter Weibull distribution [31]. According to the lifetime distribution function, the bearing reliability can be calculated by
R b ( t ) = e t γ η β
where t is the function time; γ denotes the position parameter; and η and β represent the scale parameter and the shape parameter, respectively.
According to the international standard (ISO 281:2007) and the Lundberg–Palmgren theory [32,33,34], the rating life of the roller bearing can be obtained by
L h = α 1 · α S K F · 10 6 60 n w C P 10 3
where L h is the basic rating life (h), C is the basic rating load (kN), P means the equivalent dynamic load (kN), n w means the rotation speed of the bearing (r/min), α 1 is life adjustment factor for reliability, and α S K F represents life modification factor.
The basic rating life is defined as the basic rating life with statistical reliability of 90%. In engineering practice, the reliability of the rolling bearing under the rated lifetime equals to 0.9, then we can obtain the following additional relation,
η β = ( L h γ ) β / ln 1 0.9
Then, according to Equations (11)–(13), the reliability of the rolling bearing can be expressed as follows.
R b L ( t ) = exp t γ L h γ β · ln 0.9

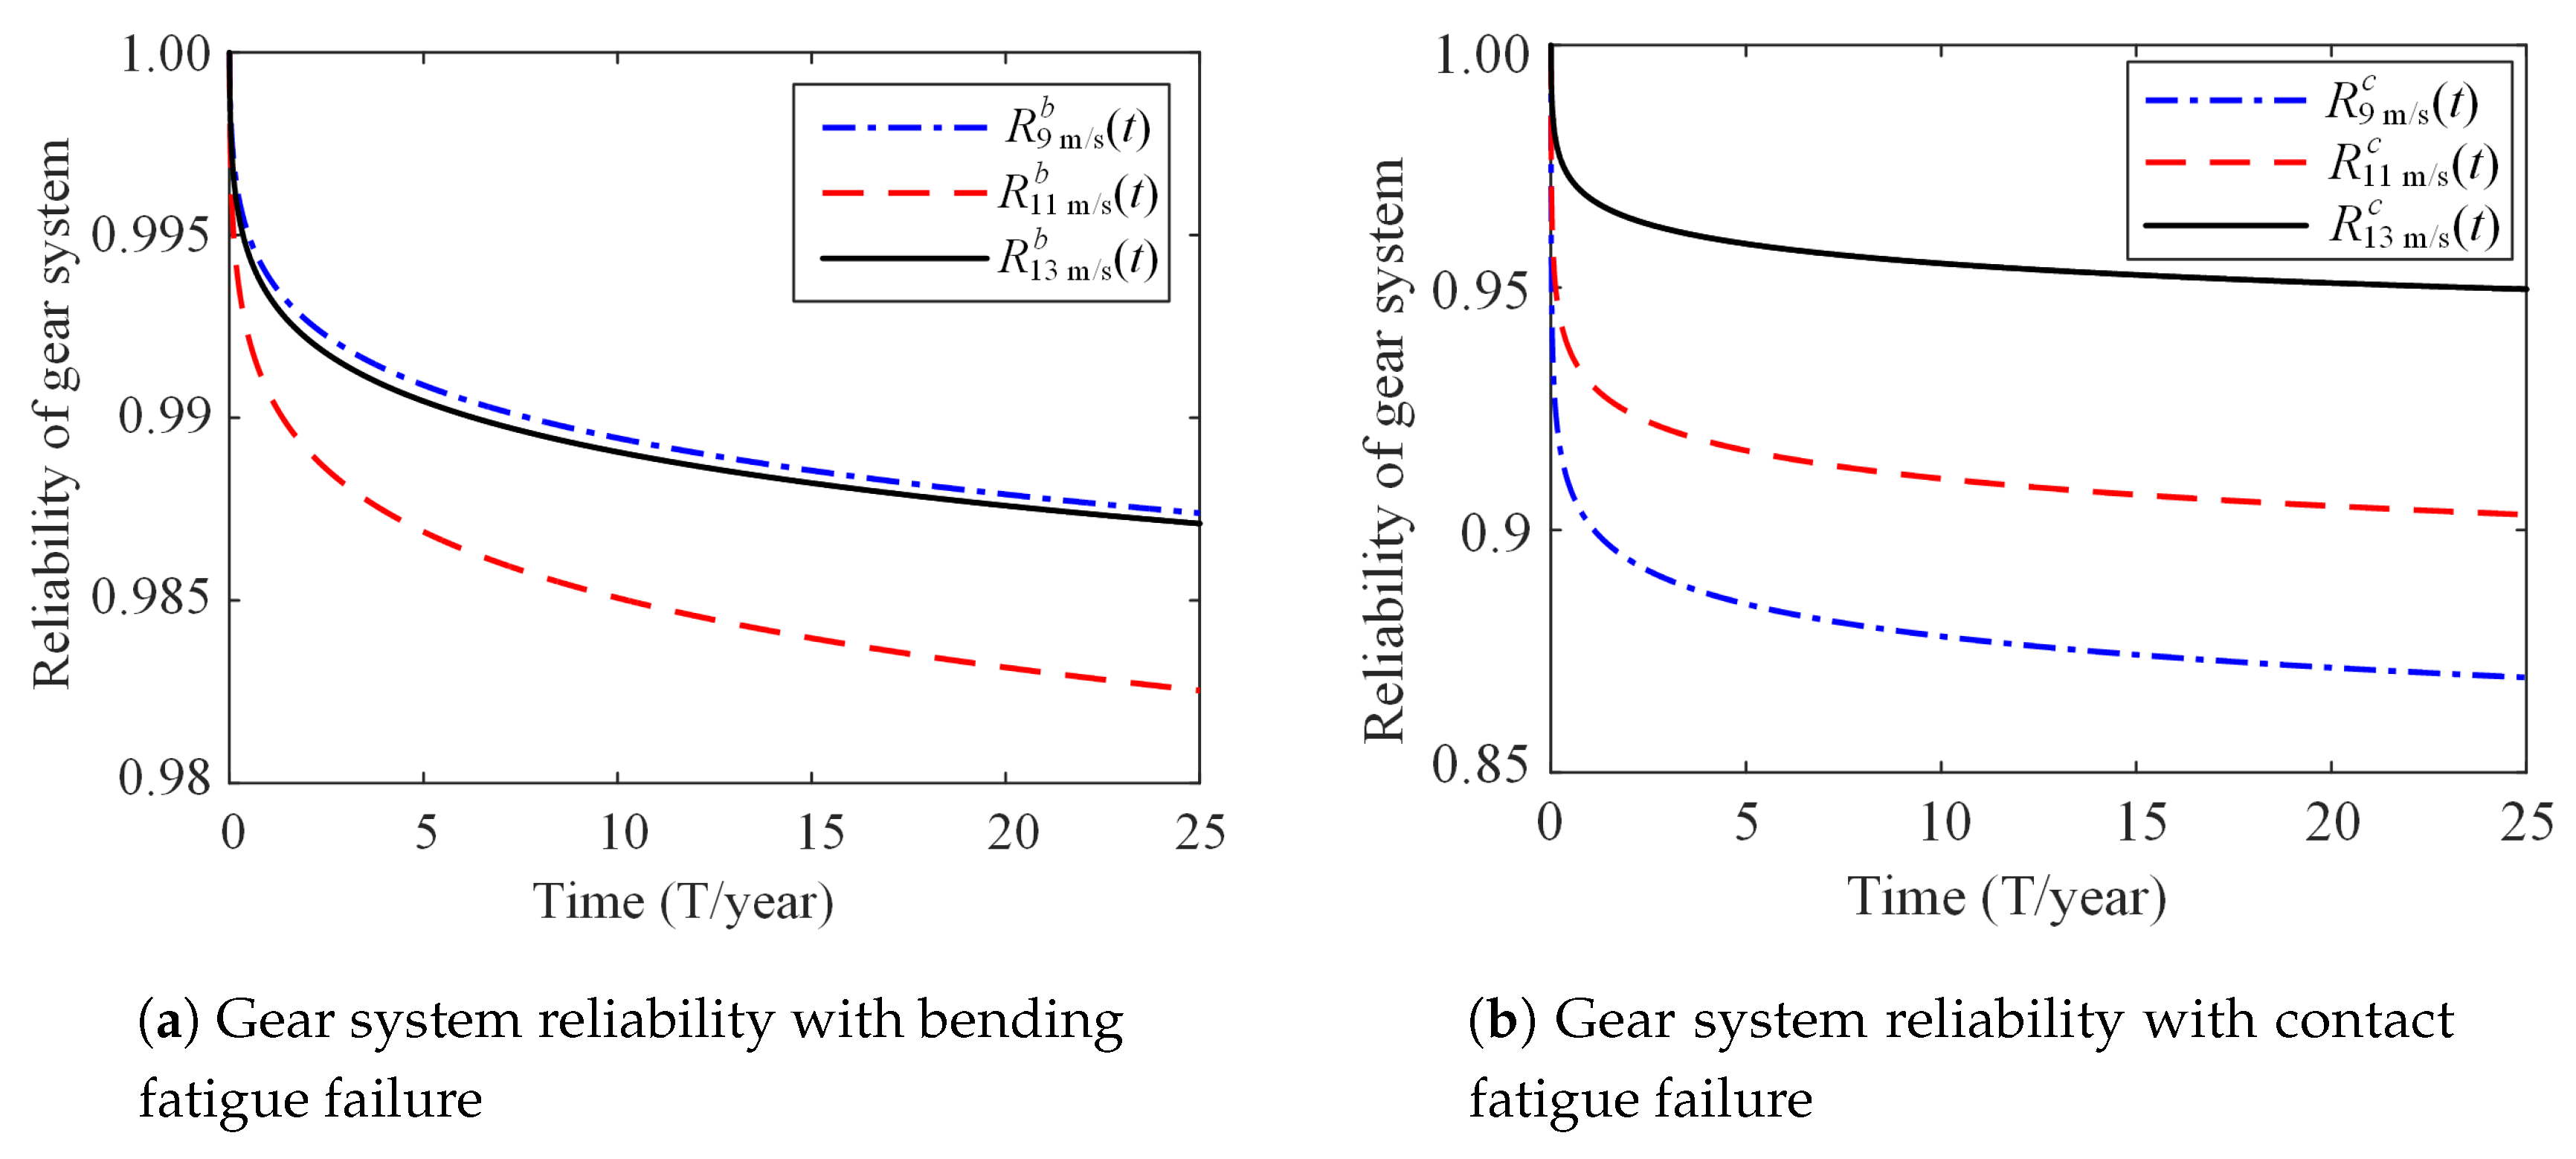
4.3. Gear Reliability Considering Fatigue Damage Accumulation

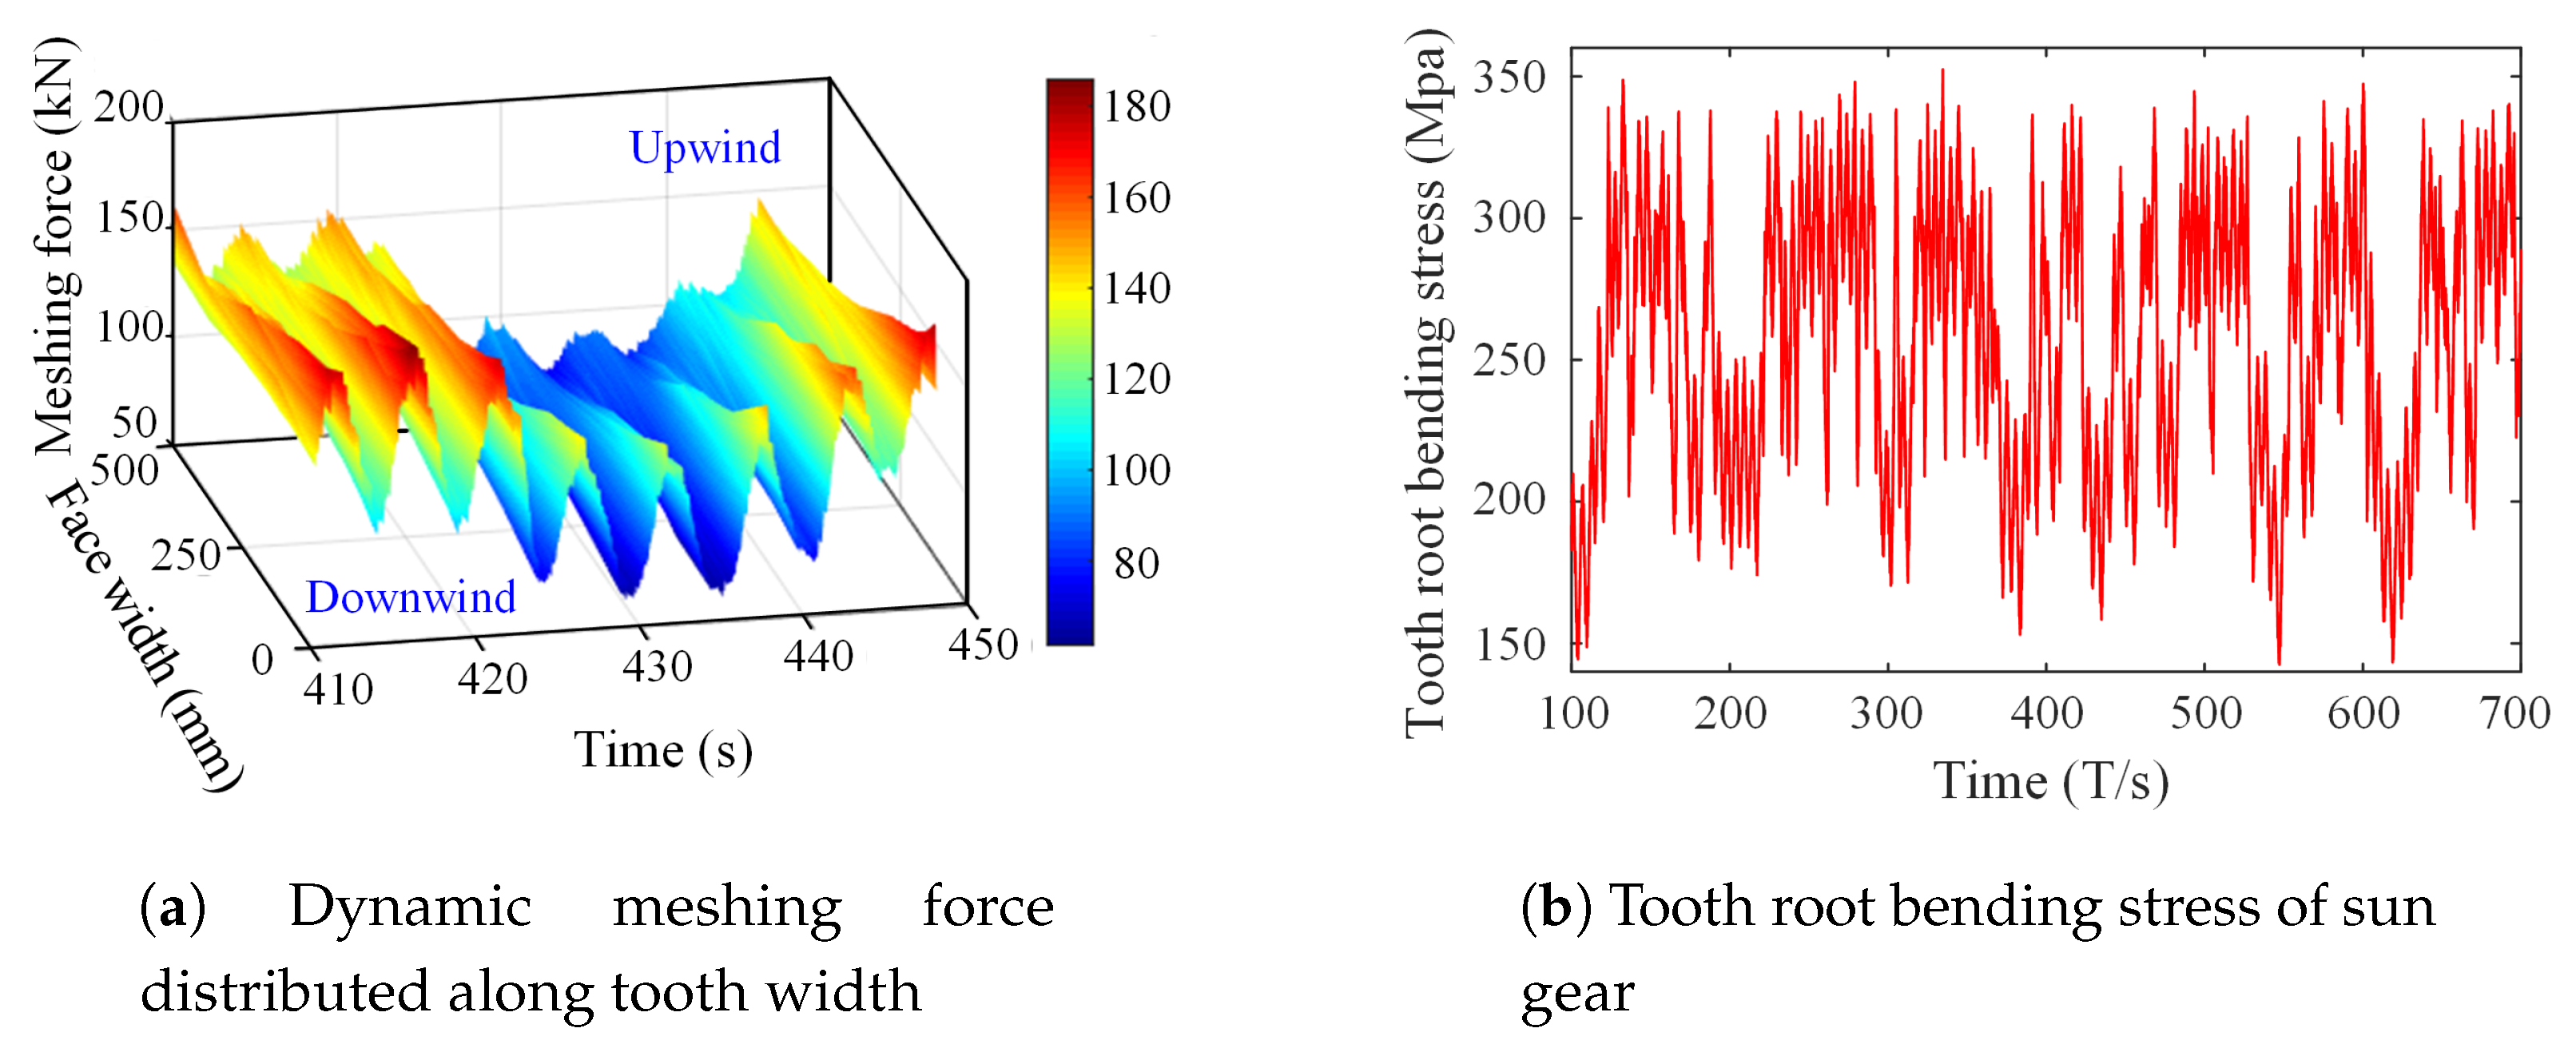
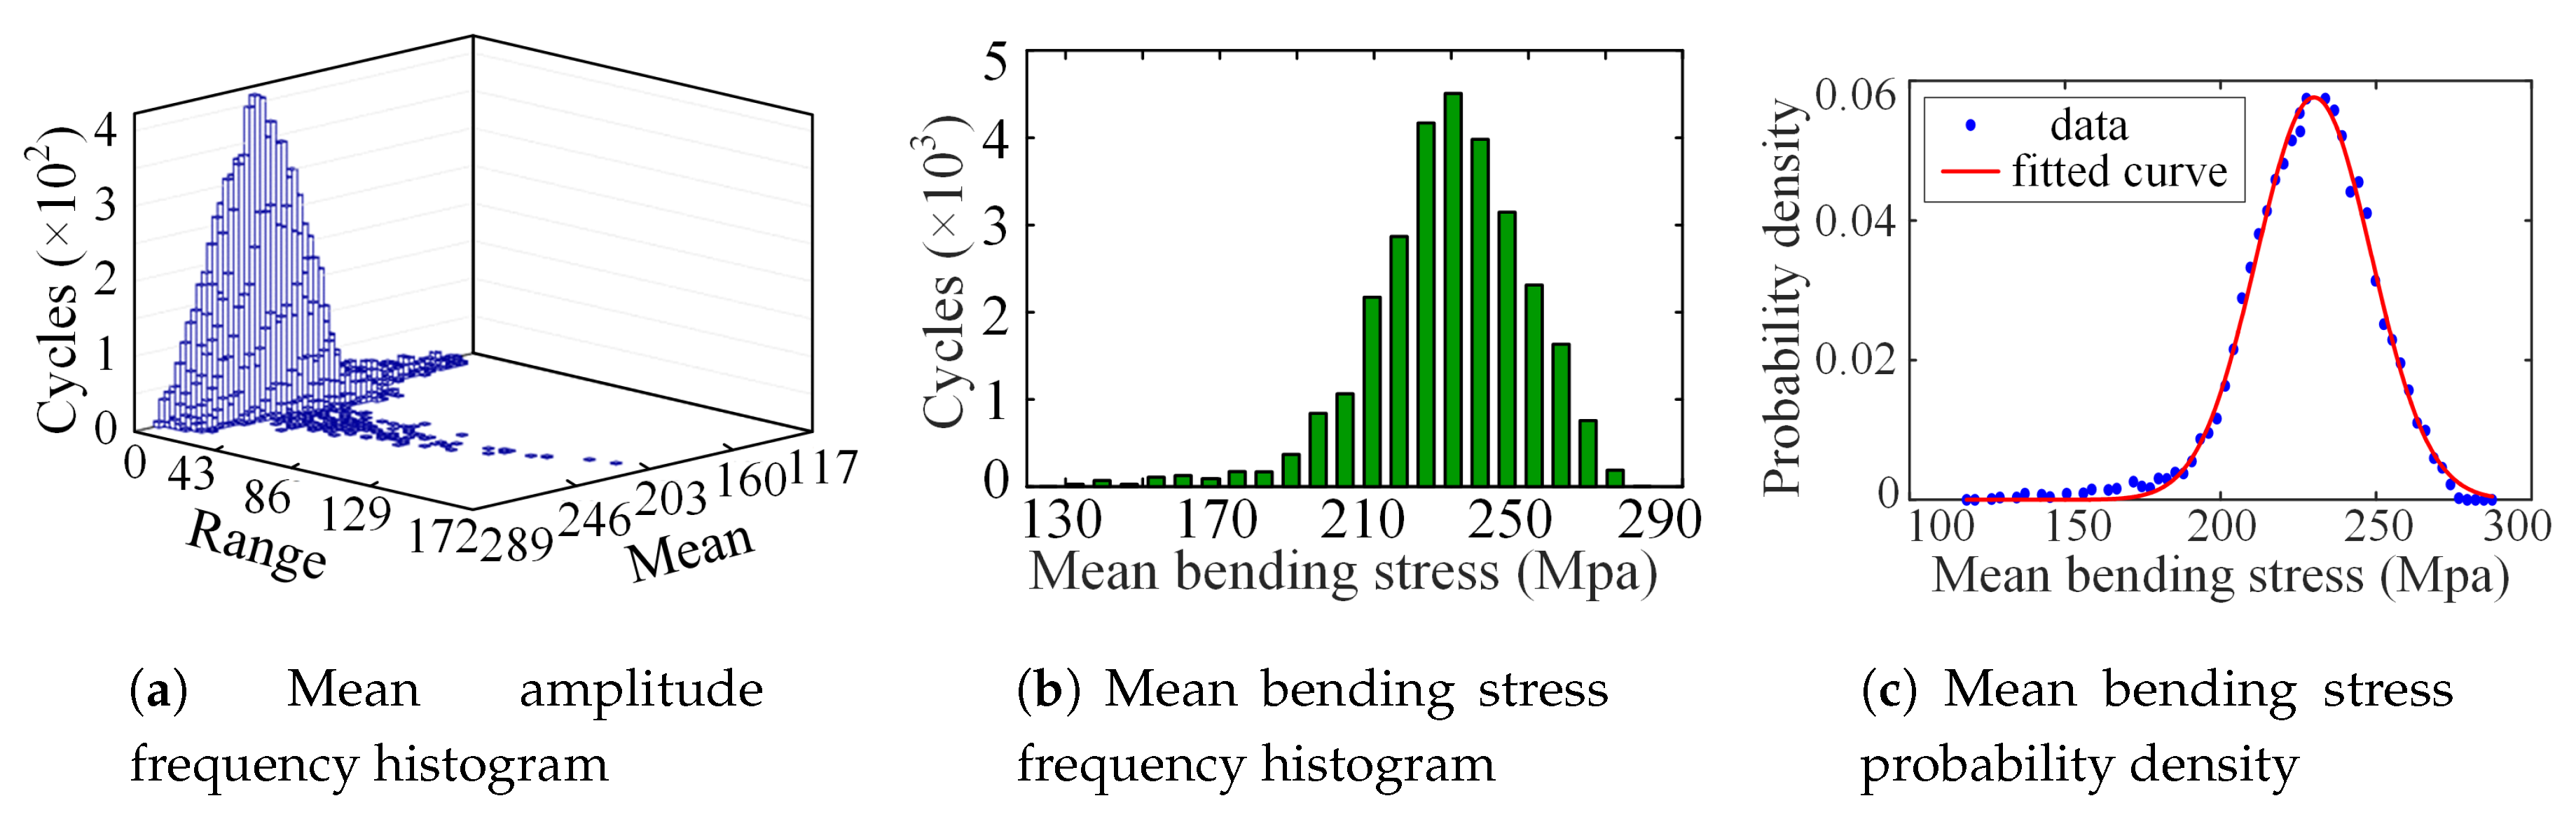
4.3.1. Gear Stresses Calculation

Tooth root bending fatigue and tooth surface contact fatigue are the two main damage modes of gear transmissions. For gears with large modulus under the normal operating condition, the contact fatigue is more likely to cause the failure of the gears than the bending fatigue [35]. The tooth fatigue may lead to significant vibration and noise and accelerate gear failure. In this paper, the contact fatigue is taken as the primary failure mode to evaluate the reliability of the wind turbine drivetrain. According to the Hertz theory, the contact stress can be calculated by
σ ¯ H = F c ¯ L ρ Σ 1 π 1 μ 1 2 E 1 + 1 μ 2 2 E 2
where F c ¯ is the calculation load, F c ¯ = K · F ¯ m . K is the load factor that is equal to K A K V K H β K H α [36], and F ¯ m is the meshing force of the gear pair. K A , K V , K H β , and K H α are the application factor, the dynamic factor, the face load factor, and the transverse load factor for contact stress, respectively. L is the length of the line of action. ρ Σ is compositive curvature radius. E 1 and E 2 are the elastic modulus of the materials of two gears, and μ 1 and μ 2 are their Poisson’s ratio, respectively.
The formula (15) could be rewritten as
σ ¯ H = Z ε 2 sin α 1 π 1 μ 1 2 E 1 + 1 μ 2 2 E 2 K F ¯ m b d 1 μ ± 1 μ
Let Z H = 2 sin α and Z E = 1 π 1 μ 1 2 E 1 + 1 μ 2 2 E 2 , the contact stress takes the form
σ ¯ H = Z H Z E Z ε F ¯ m b d 1 μ ± 1 μ K A K V K H β K H α
where Z H is the contact coefficient, Z E is elasticity coefficient, μ is the ratio of the teeth number, and Z ε is the coincidence coefficient.
According to the international standard (ISO 6336-3:2006) [37], the tooth root bending stress is determined as the product of nominal tooth root bending stress and a stress correction factor. The tooth root bending stress could be calculated by
σ ¯ F = F ¯ t b m n K A K V K F β K F α Y F Y S Y β
where F ¯ t means the nominal tangential load; b is the face width of pinion gears; m n means the normal module; and Y F , Y S , and Y β represent the form factor, the stress correction factor, and the helix angle factor, respectively.

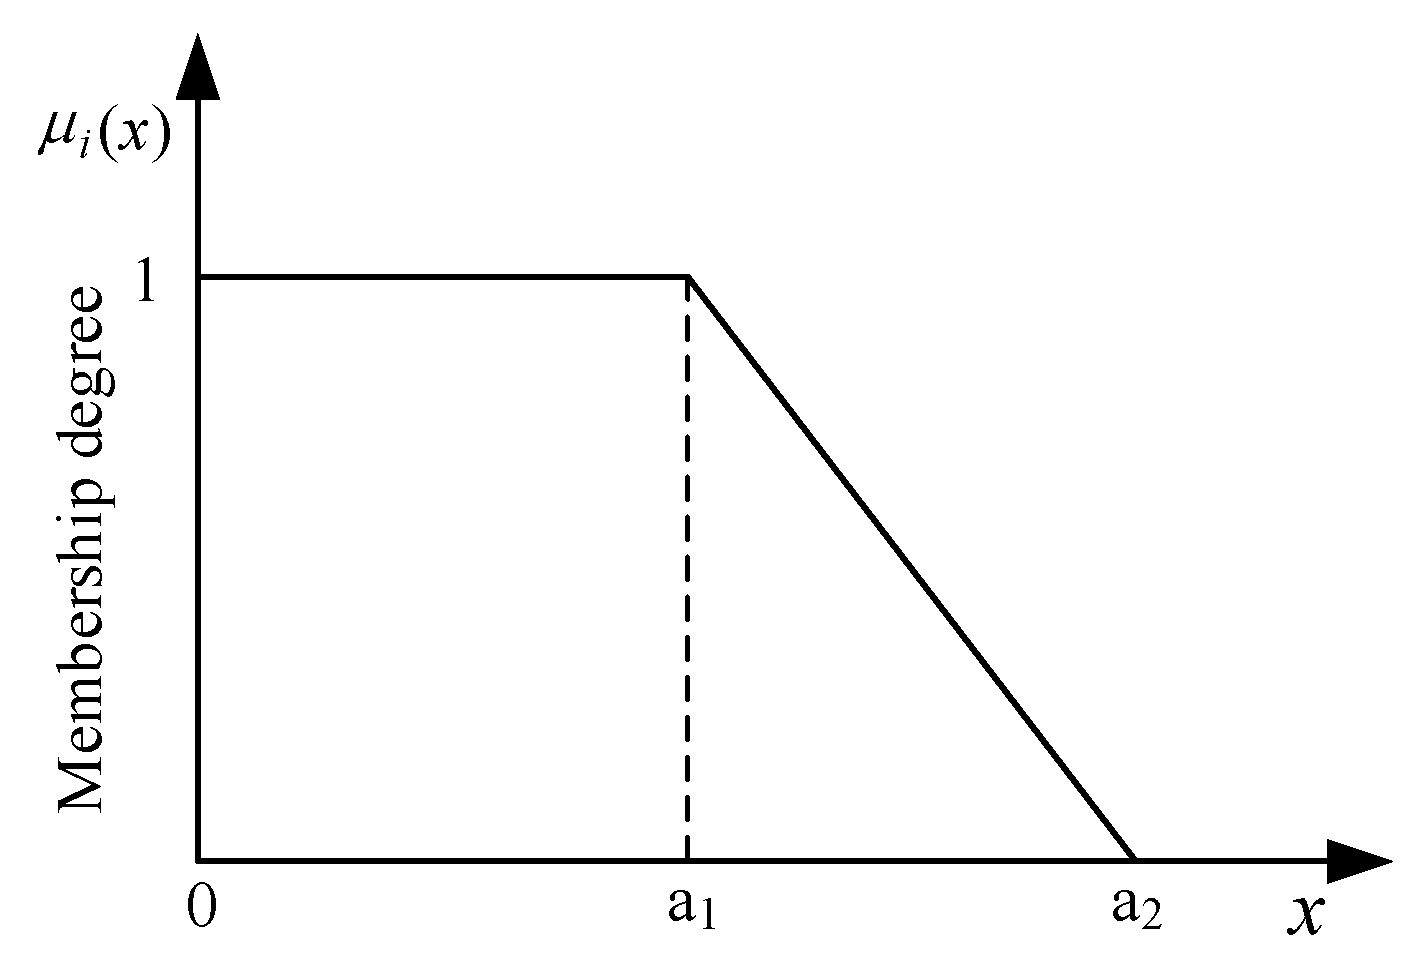
4.3.2. Fuzzy Reliability Model

In reality, loads of each component suffering vary with time and do not follow a specific distribution [38]. It is therefore necessary to use the fuzzy language to depict and assess uncertainties in material properties and operating status [39]. The strength of mechanical components may decrease during the mission. The strength of components at each time t is defined as the residual strength. The attenuation of residual strength is inextricably linked to the micro-damage inside the material. The cumulative fatigue damage variable ( D ) of the materials can be expressed as follows,
D = 1 1 n N f 1 1 T ( σ M , σ ¯ ) , T σ M , σ ¯ = 1 1 a lg | σ M / σ 1 ( σ ¯ ) |
where n is the number of load cycles, N f is the fatigue life, σ M means the stress amplitude, σ ¯ represents the mean stress, a is the material constant, and T ( σ M , σ ¯ ) is related to the load and the material.
The fatigue load-life curve (S–N curve) is employed as
N f = C · σ M m
where C and m are the material constants; when calculating the contact fatigue life, m is equal to 6; when calculating the bending fatigue life, m is equal to 9. The constant C can be obtained using Equation (20).
To calculate the fatigue life, we need to transform the asymmetric cyclic stress (stress ratio r 1 ) to the symmetric cyclic stress (stress ratio r = 1 ) using Equation (21),
σ max σ min σ a ( 1 ) + σ max + σ min σ b = 2
where σ b is the material tensile strength limit, and σ max and σ min represent the peak and valley values of the cyclic stress, respectively.
According to Equations (19)–(21), the residual strength model based on nonlinear fatigue damage criterion can be expressed as follows,
r ( n ) = r ( 0 ) r ( 0 ) σ max 1 1 n N f 1 1 T
where r ( 0 ) is the initial static strength, σ max means the amplitude of the cyclic stress.
Then, the residual strength model concerning time t can be derived by transforming the load cycles to the service time t from Equation (22).
r ( t ) = r ( 0 ) r ( 0 ) σ max 1 1 t L f 1 1 T
where L f is the fatigue life related to the duration of the load.
Based on the SSI theory, the time-dependent reliability of components considering the residual strength degradation can be expressed as R ( t ) = Pr { r ( t ) σ > 0 } .
Using the components’ reliability, we can obtain the failure rates of each component at a given time t. The failure rate of each component can be calculated by
λ ( t ) = R ( t ) R ( t ) = d ln R ( t ) d t
The failure of transmission gears is uncertain. The SSI theory defines the interference region and the reliability region by the limit state. However, this limit state may be fuzzy in most cases. In engineering practice, the failure of components transforming from a safe state into a failed state is a gradual process. We, therefore, choose the fuzzy number to represent it. For the strength of gear transmission, the trapezoidal fuzzy number is adopted in this paper. Its graphic representation is shown in Figure 8. The membership function can be expressed as follows,
μ i ( x ) = 1 , x a 1 a 2 x a 2 a 1 , a 1 < x a 2 0 , x > a 2
where μ i ( x ) means the membership degree of fuzzy number x, and a 1 and a 2 are fuzzy lower and upper bounds, respectively.
Considering the strength degradation of components and letting a 1 = r i ( t ) , a 2 =1.1 r i ( t ) [40], the fuzzy reliability function of components can be expressed as follows,
R ¯ i ( t ) = + μ i ( σ ¯ i , t ) g i ( t ) d σ i = 1 0.1 r i ( t ) 1.1 r i ( t ) σ ¯ i Φ 1.1 r i ( t ) σ ¯ i S i ( r i ( t ) σ ¯ i ) Φ r i ( t ) σ ¯ i S i + S i 2 π exp ( 1.1 r i ( t ) σ ¯ i ) 2 2 S i 2 exp ( r i ( t ) σ ¯ i ) 2 2 S i 2
where S i is the standard deviation of allowable stresses, and S i = σ ¯ i C i , Φ ( · ) means the normal distribution function.

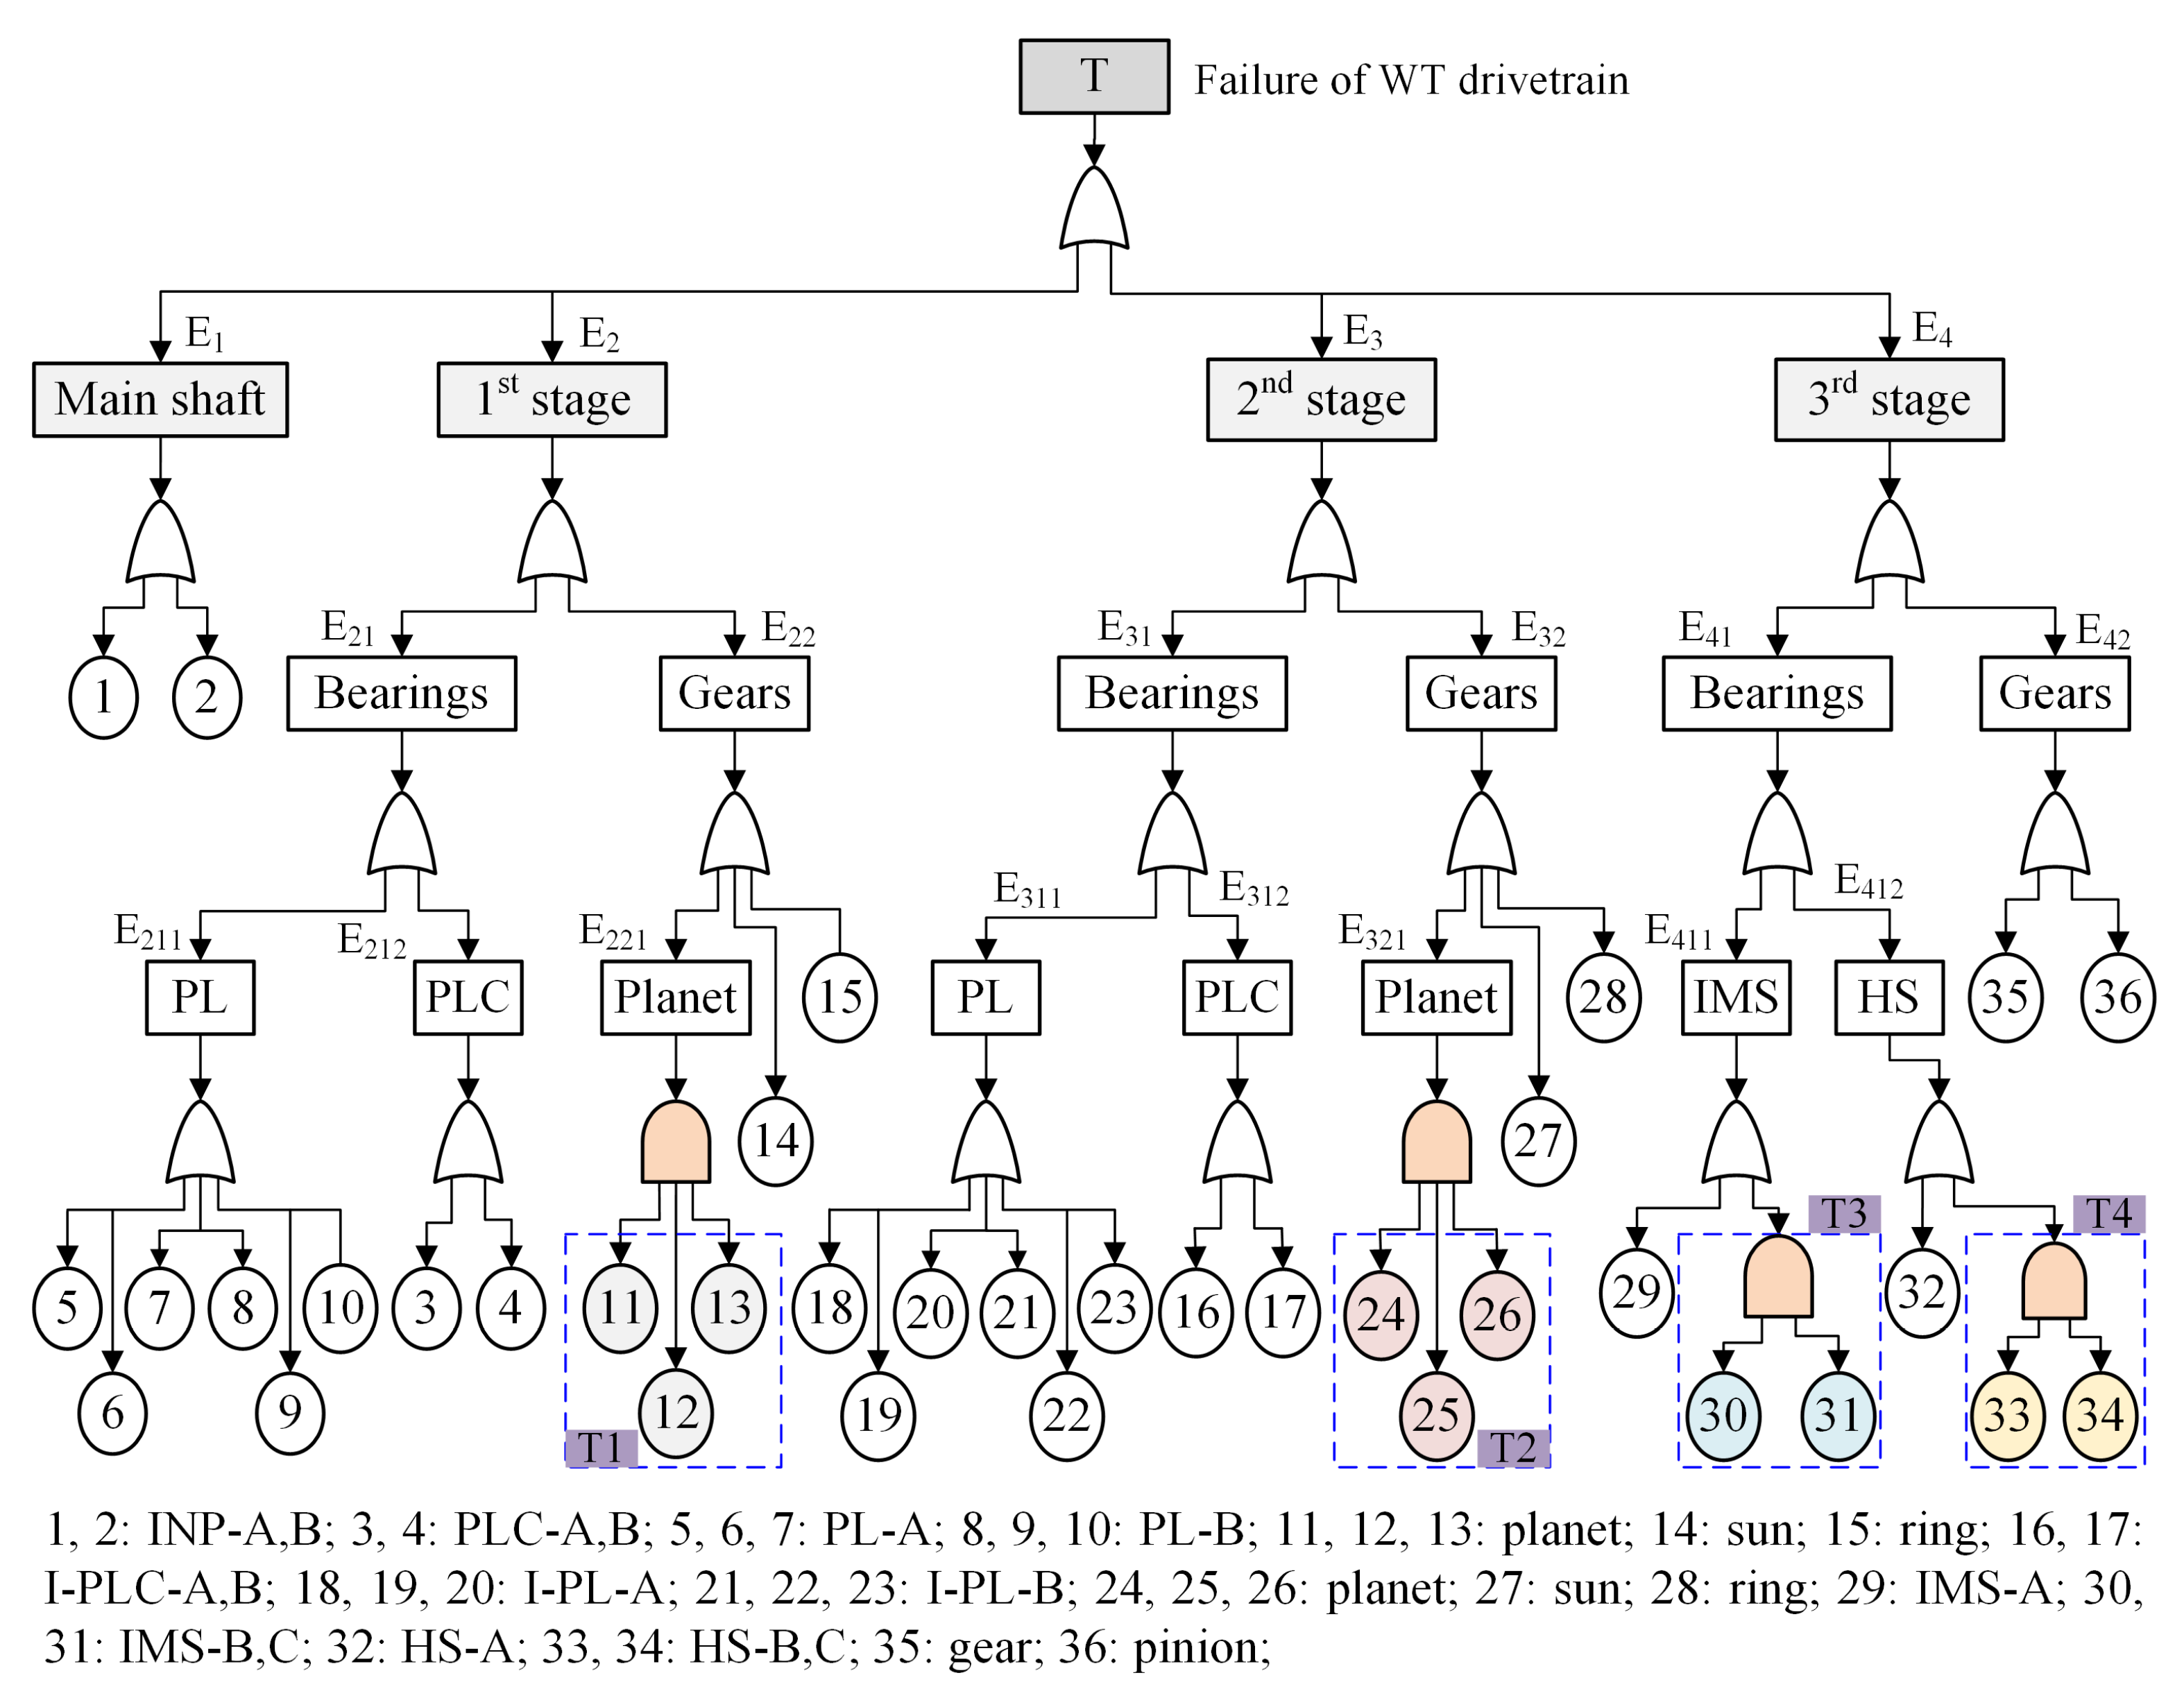
4.4. System Reliability Model

The wind turbine drivetrain can be divided into four parts for a better FTA: main shaft failure, first stage failure, second stage failure, and third stage failure [41], which are transformed into the fault tree shown in Figure 9. There are four load-sharing subsystems, including planets and downwind bearings of the parallel stage. As Figure 9 depicts, the WT drivetrain system consists of four types of load-sharing components, namely, T 1 , T 2 , T 3 , and T 4 .
From the fault tree of wind turbine drivetrain, the minimal cut sets of subsystems can be obtained using the MOCUS algorithm as follows,
T:
{E 1 ,E 2 ,E 3 ,E 4 }, E 1 : { 1 , 2 }
E 2 :
{ 3 , 4 , 5 , 6 , 7 , 8 , 9 , 10 , 11 , 14 , 15 }, { 3 , 4 , 5 , 6 , 7 , 8 , 9 , 10 , 12 , 14 , 15 }, { 3 , 4 , 5 , 6 , 7 , 8 , 9 , 10 , 13 , 14 , 15 }
E 3 :
{16,17,18,19,20,21,22,23,24,27,28}, {16,17,18,19,20,21,22,23,25,27,28},
{16,17,18,19,20,21,22,23,26,27,28}
E 4 :
{29,30,32,33,35,36}, {29,31,32,33,35,36}, {29,30,32,34,35,36}, {29,31,32,34,35,36}
where T and E i ( i = 1 , 2 , 3 , 4 ) are depicted in Figure 9.
The FT-based system reliability of the wind turbine drivetrain with series-parallel connection subsystems can be expressed as follows,
R s y s ( t ) = R E 1 ( t ) · R E 2 ( t ) · R E 3 ( t ) · R E 4 ( t )
where R E 1 ( t ) = R x 1 ( t ) · R x 2 ( t ) .
R E 2 ( t ) = i = 3 11 R x i ( t ) · R x 14 ( t ) R x 15 ( t ) + i = 3 10 R x i ( t ) · R x 12 ( t ) R x 14 ( t ) R x 15 ( t ) + i = 3 10 R x i ( t ) · j = 13 15 R x j ( t )
R E 3 ( t ) = i = 16 24 R x i ( t ) · R x 27 ( t ) R x 28 ( t ) + i = 16 23 R x i ( t ) · R x 25 ( t ) R x 27 ( t ) R x 28 ( t ) + i = 16 23 R x i ( t ) · j = 26 28 R x j ( t )
R E 4 ( t ) = i = 29 30 R x i ( t ) · j = 32 33 R x j ( t ) · k = 35 36 R x k ( t ) + R x 29 ( t ) · i = 31 33 R x i ( t ) · j = 35 36 R x j ( t ) + i = 29 30 R x i ( t ) · R x 32 ( t ) · j = 34 36 R x j ( t ) + R x 29 ( t ) · i = 31 32 R x i ( t ) · j = 34 36 R x j ( t )
Four subsystems take survival signature into consideration in this study, which happens in planet gear subsystems and bearing subsystems of the third stage. According to Equations (10) and (27), the survival signature-based reliability model of wind turbine drivetrain can be calculated by
R s y s s s ( t ) = R E 1 ( t ) · R E 2 ( t ) · R E 3 ( t ) · R E 4 ( t ) · R s s ( t )
where R E 2 ( t ) , R E 3 ( t ) , and R E 4 ( t ) represent the system reliability without consideration of subsystems of type T 1 , T 2 , T 3 , and T 4 ; R s s ( t ) is the subsystem reliability of type T i ( i = 1 , 2 , 3 , 4 ) using survival signature. The formula of R s s ( t ) is derived using Equation (10) as follows.
R s s ( t ) = l 1 = 0 m 1 = 3 l 2 = 0 m 2 = 3 l 3 = 0 m 3 = 2 l 4 = 0 m 4 = 2 Φ ( l 1 , , l 4 ) k = 1 4 m k l k R k ( t ) l k 1 R k ( t ) m k l k

5. Reliability Analysis

5.1. Survival Signature

The reliability analysis of the wind turbine drivetrain is performed based on the survival signature. As it is shown in Figure 2, planet gears of 1 st stage (No. 11, 12, 13), planet gears of 2 nd stage (No. 24, 25, 26), and downwind bearings of intermediate shaft and high-speed shaft (No. 30, 31, 33, 34) can be treated as load-sharing systems. The reliability block diagram of load-sharing systems is presented in Figure 10. The survival signature of the load-sharing system can be obtained using the R package developed by Louis [42], which is summarized in Table 2. Based on the survival signature, the reliability of load-sharing subsystems for each point at time t can be calculated from Equations (10), (14), and (26). To study the effects of wind conditions on the system reliability, in this paper, we choose three different mean wind speeds: 9 m/s, 11 m/s, and 13 m/s.

5.2. Fatigue Damage Accumulation

From Section 3, the time histories of dynamic meshing force of each gear pair and the bearing support are obtained from the dynamic model of the wind turbine. Due to space limitations, the sun gear of the 1 st stage is taken as an example. Figure 11a gives the details of tooth load distribution of the sun gear. The results show that the tooth loads change periodically and the peak loads appear alternately at both ends of gears. The tooth root bending stress in the time domain can be calculated by Equation (18), which is shown in Figure 11b.
In this study, the statistical counting is performed by the commonly used rain-flow counting approach to obtain the amplitude-mean rain-flow matrix of each component. The resultant mean amplitude-frequency histogram of the bending stress of the sun gear is presented in Figure 12a. Researchers proposed some fatigue damage rules, like linear, bilinear, and nonlinear rules [43,44]. Among these, the Miner linear rule [45] is generally accepted in engineering practice.

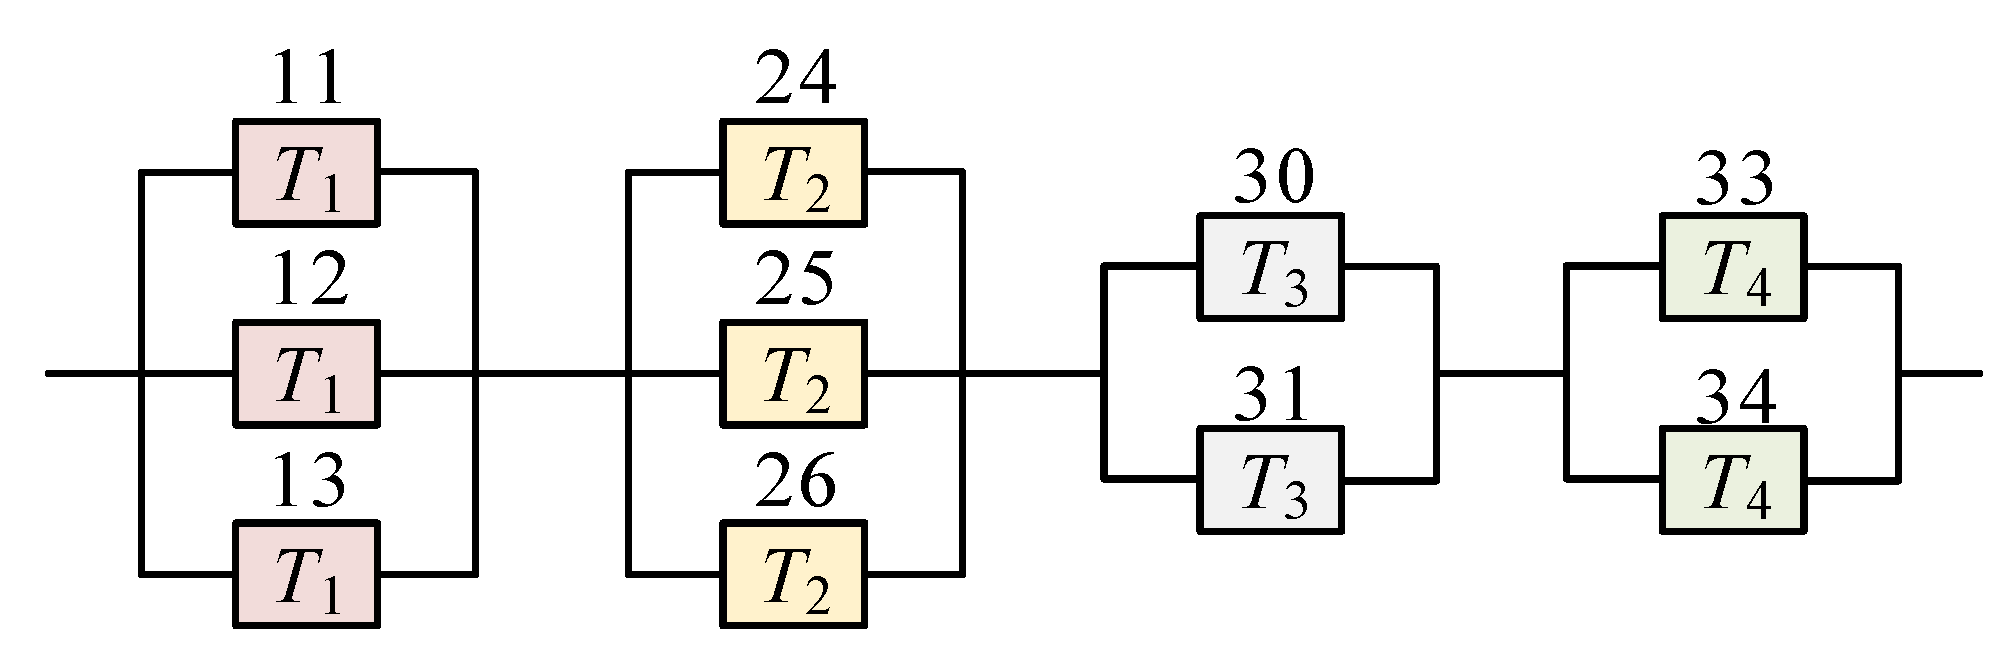
5.3. Load Distribution

In engineering practice, the mean load generally follows the Gaussian distribution or the Normal distribution [46]. The rain-flow counting method can be used to derive the mean bending stress frequency histogram and the mean bending stress probability density of the sun gear of the 1 st stage shown in Figure 12b,c. The results of Figure 12c show that the statistical mean frequency follows the Normal distribution. To verify this point, we conduct the Anderson–Darling Normality Test of the bending stress of the sun gear. The p-value is 0.069, that is, greater than 0.05, which means the normal distribution should be accepted. We can, therefore, obtain the mean and the standard deviation of the bending stress of the sun gear, respectively. The parameters of the Normal distribution of other components could be derived in the same way. For the contact stress of gears, corresponding parameters could be calculated by Equation (17) and the same methods.

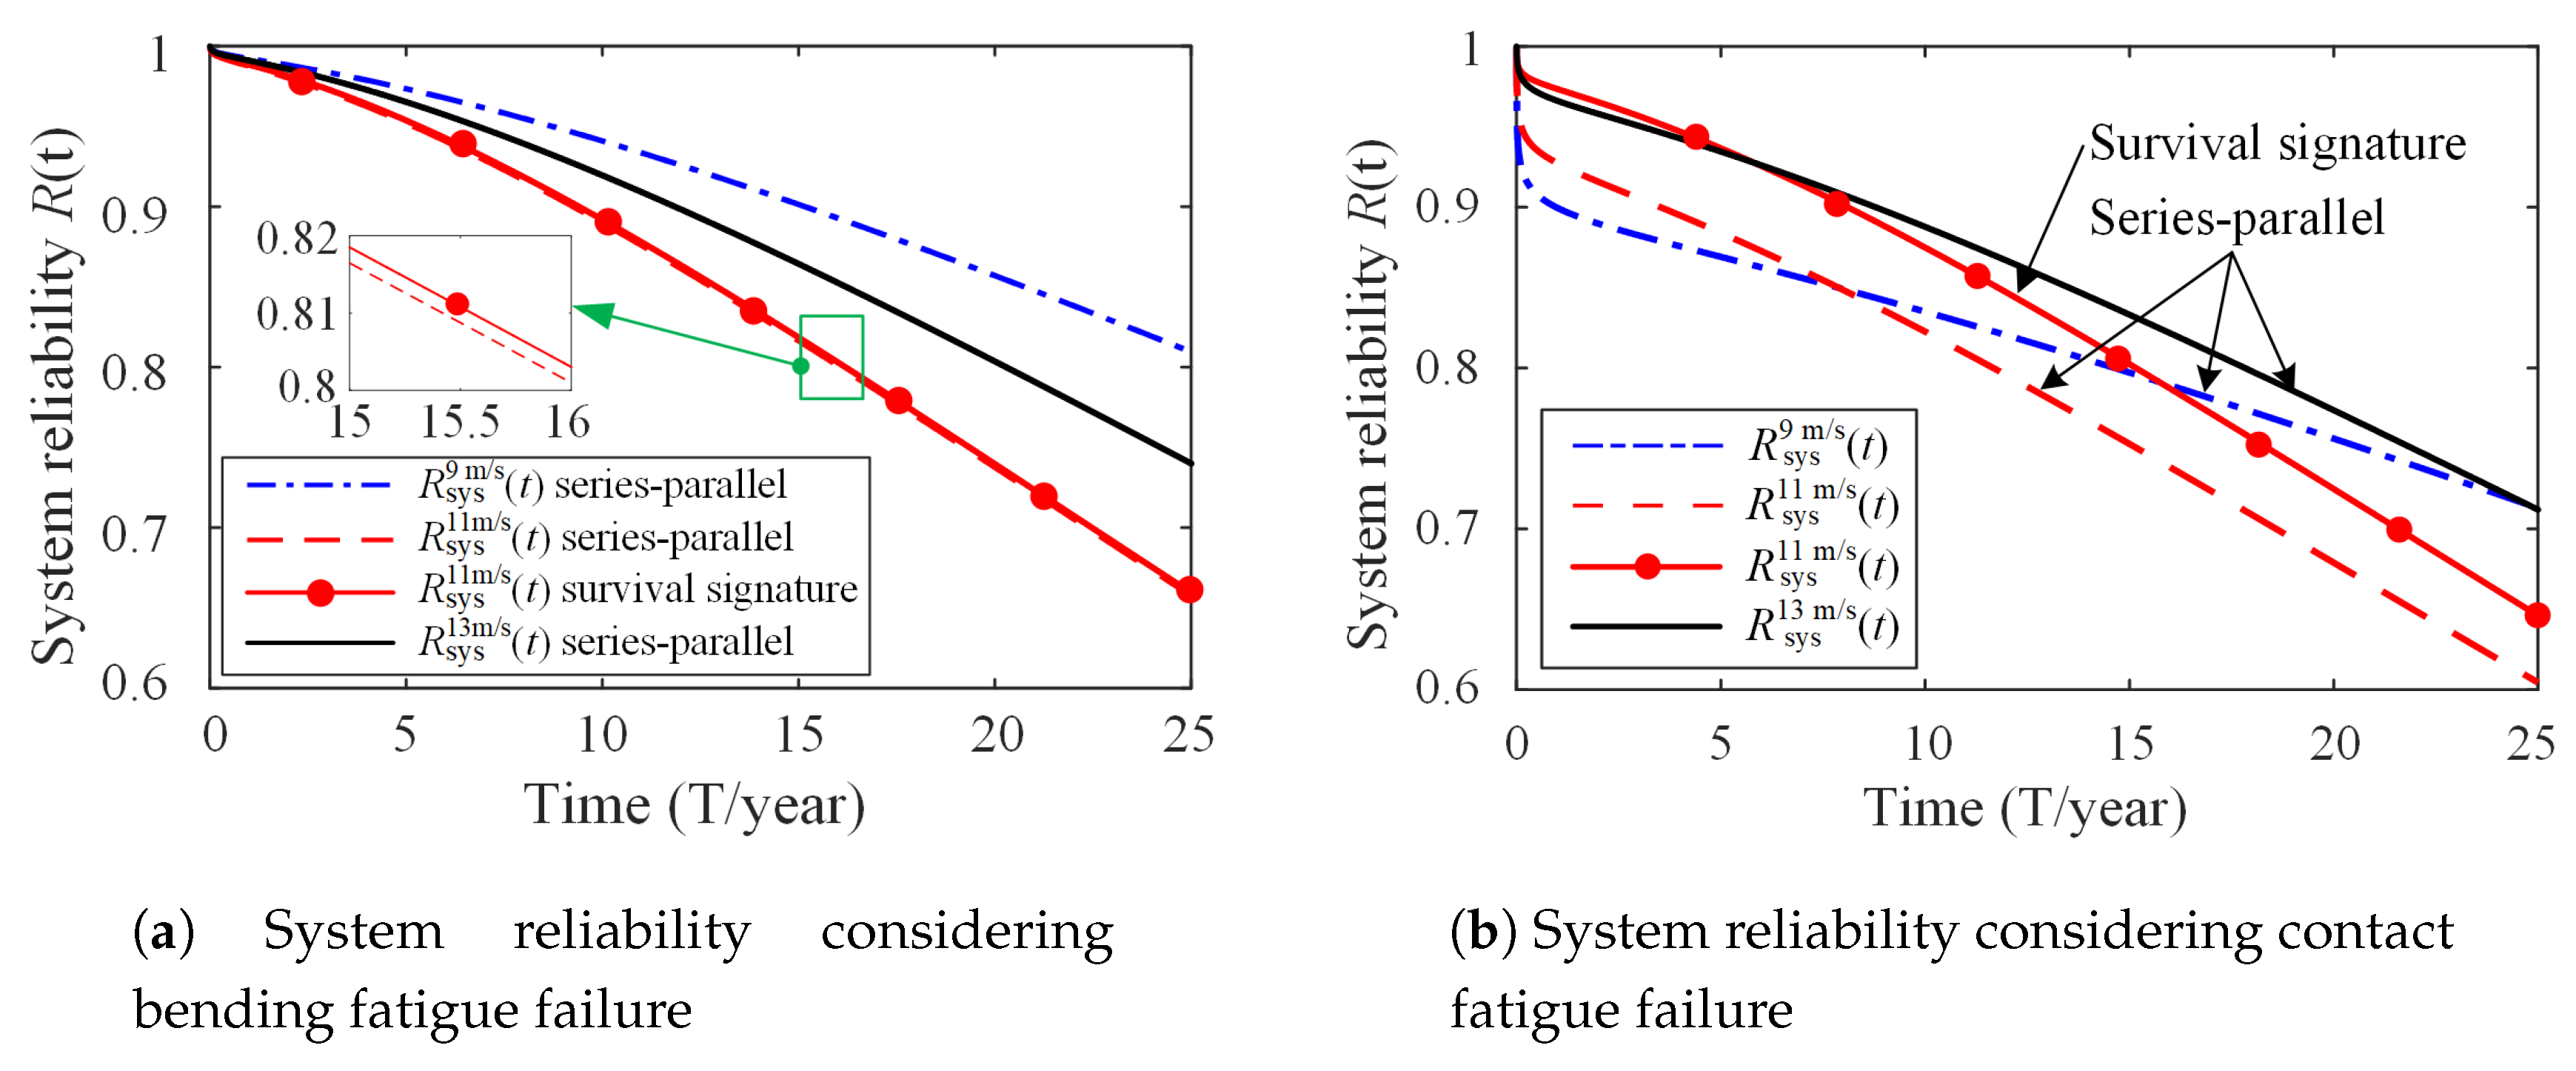
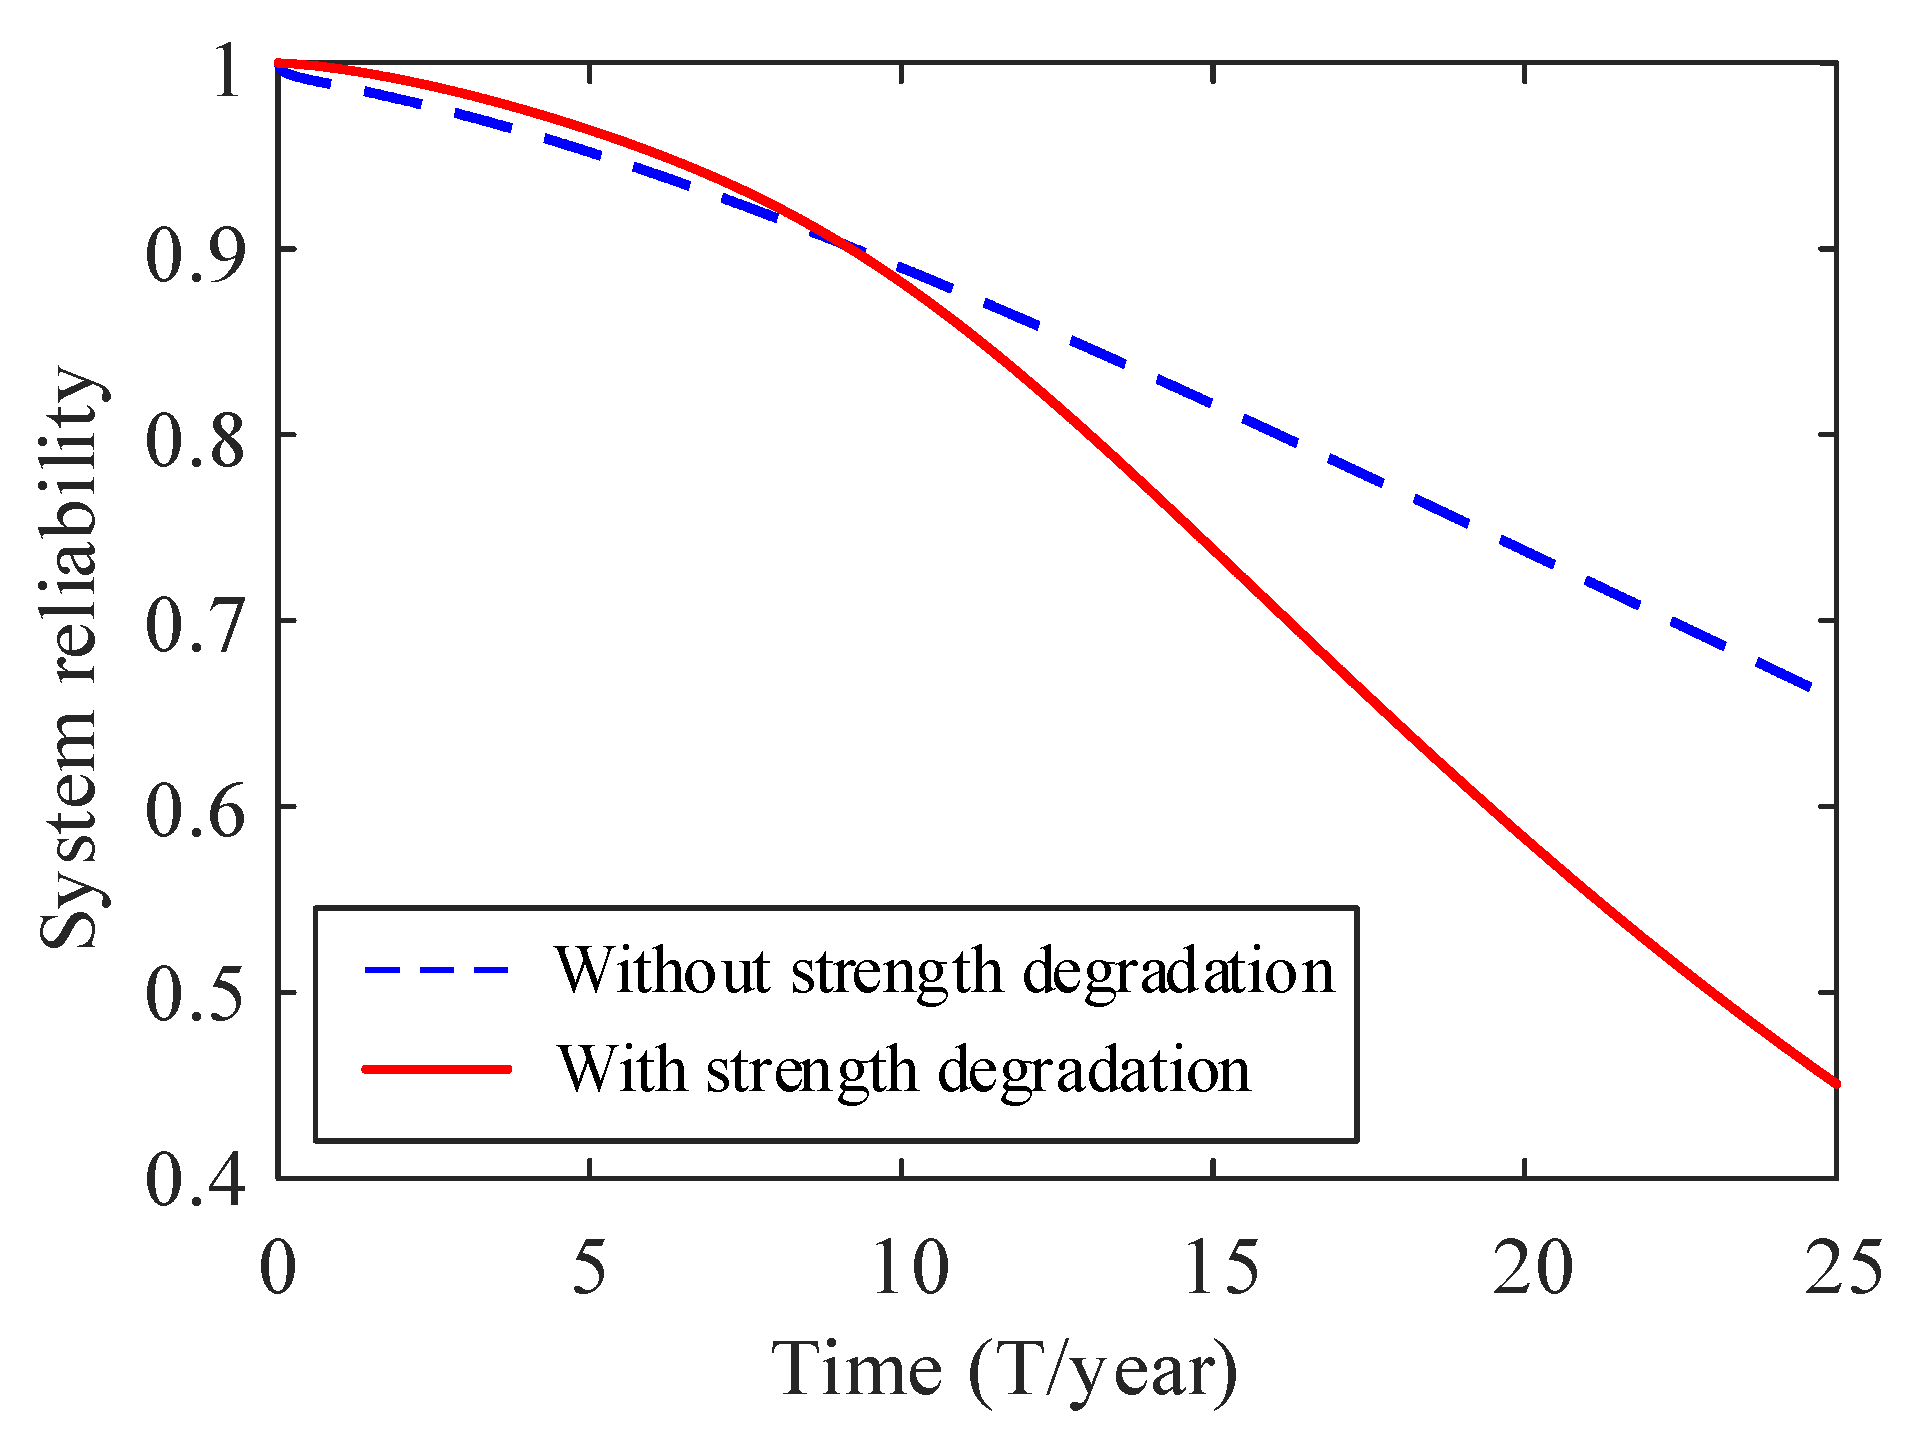
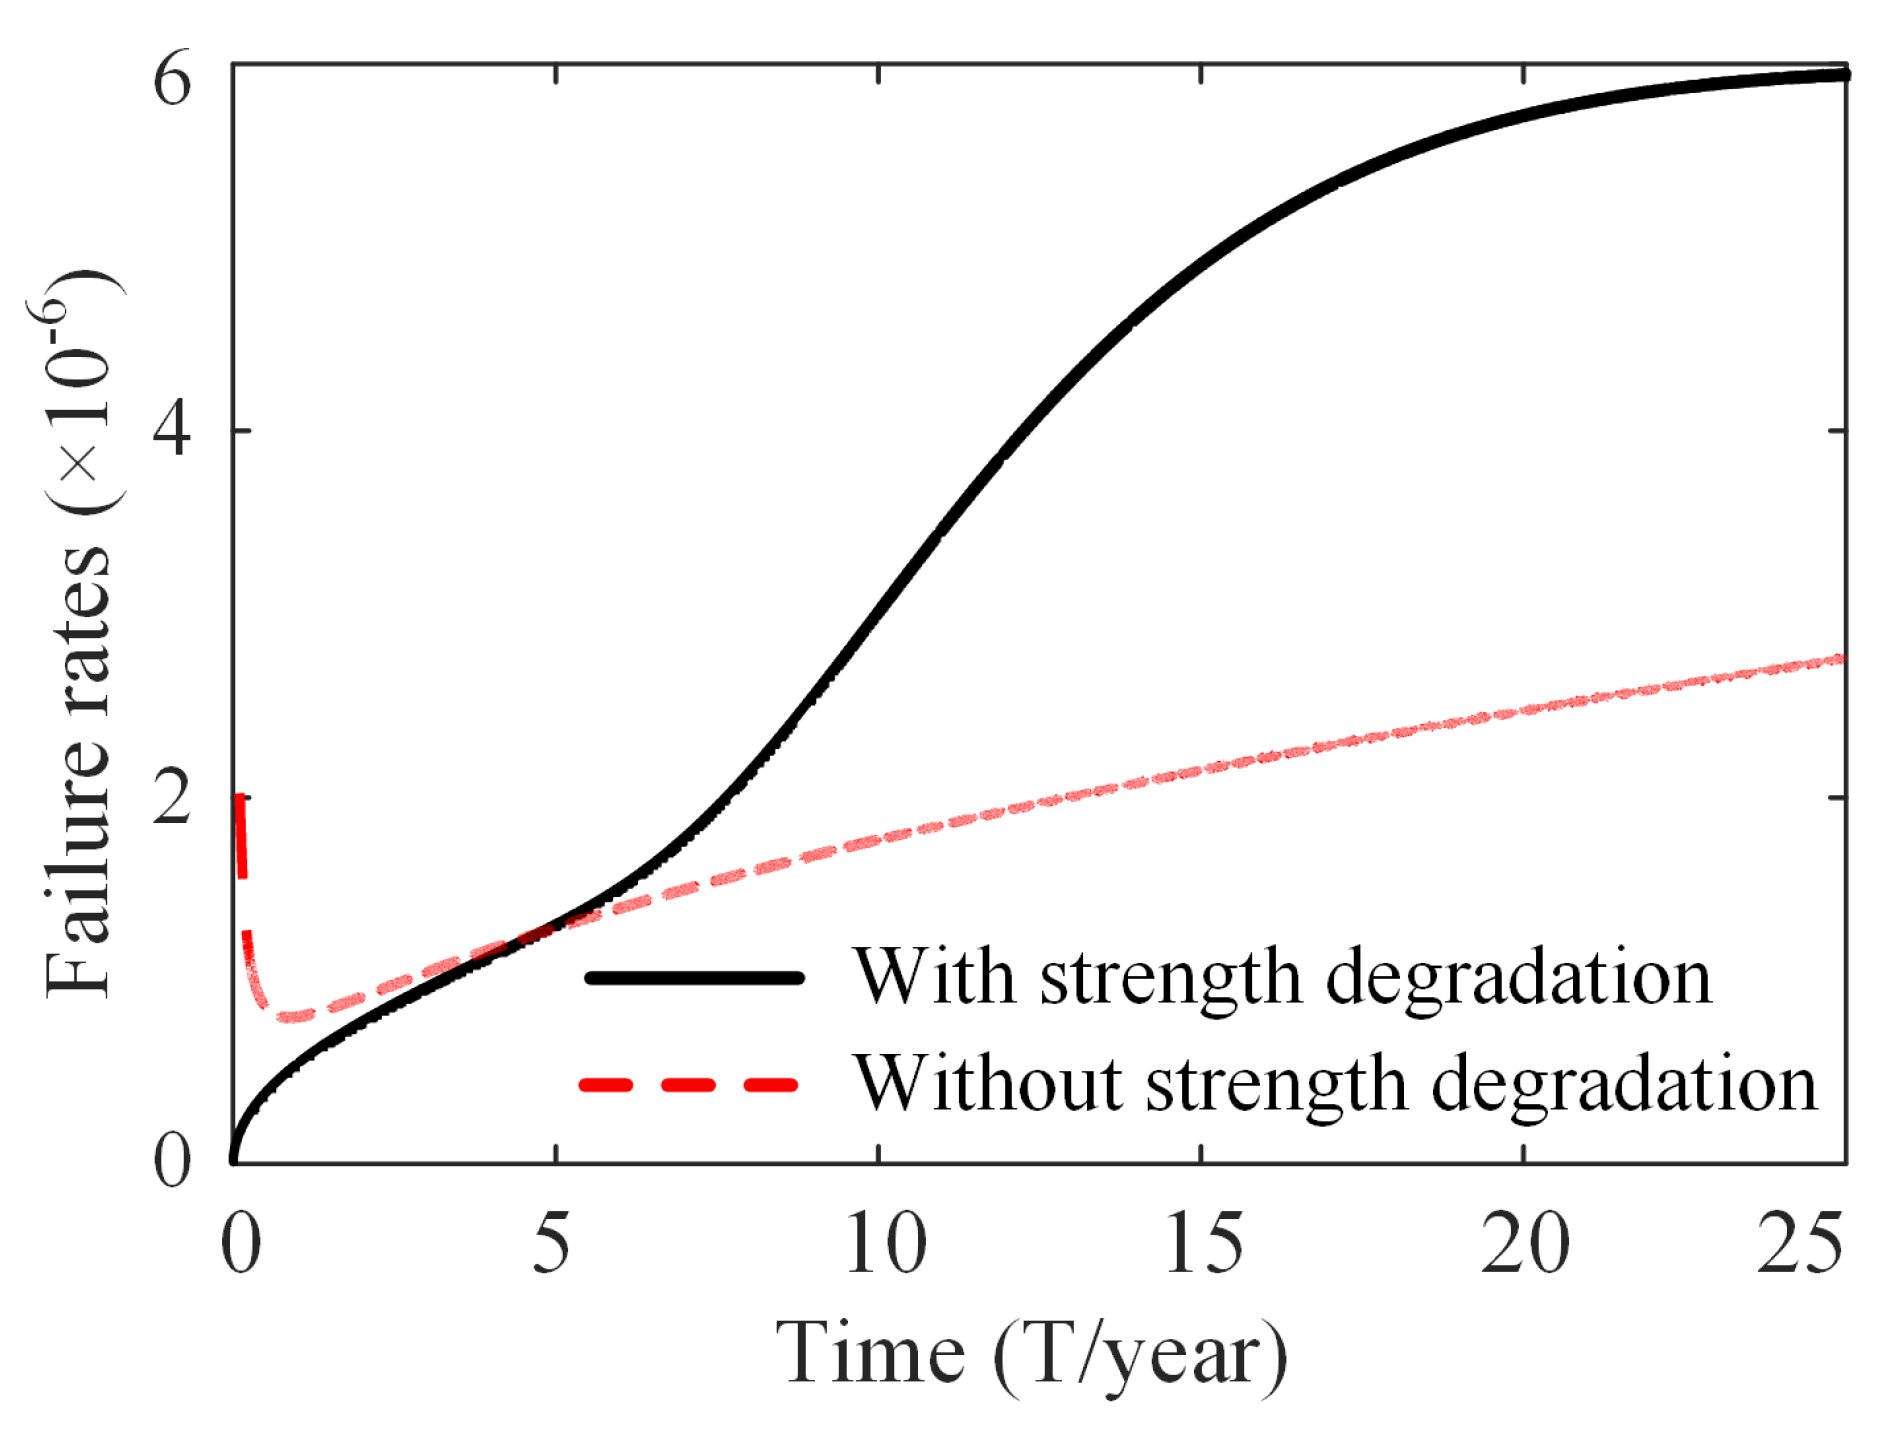
6. Results and Discussion

From Section 3 and Section 4.2, we can obtain the reliability of the bearing system of the wind turbine under different wind conditions, the results of which are shown in Figure 13. According to the results of reliability analysis, the reliability of the bearing system is the highest, while the mean wind speed equals 9 m/s, and the reliability of the bearing system with respect to mean wind speeds of 13 m/s and 11 m/s are second and third, respectively. However, the results are a little different from those calculated without consideration of the control system. The wind turbine drivetrain suffers larger loads under rated wind speed than that of 9 m/s and 13 m/s considering the control strategy.
From Section 3 and Section 4.3, we can obtain the reliability of the gear system considering the bending fatigue failure and contact fatigue failure, which are shown in Figure 14a,b, respectively. The results of the contact fatigue reliability and bending fatigue reliability are very different. The bending fatigue reliability of the gear system is larger than the contact fatigue reliability under the same mean wind speed. As it is shown in Figure 14a, the gear system reliability is the largest when v = 9 m/s. The gear system reliability with respect to the mean wind speed of 13 m/s and 11 m/s are second and third, respectively. In Figure 14b, a comparison of the contact fatigue reliability with respect to mean wind speeds reveals that the influences of changes in the mean wind speeds on the system reliability of wind turbine drivetrain decline in the order R 13 m / s c ( t ) > R 11 m / s c ( t ) > R 9 m / s c ( t ) . The results show that the larger mean wind speed contributes to the higher reliability of the gear system at a given time t.
Based on the FT of the wind turbine drivetrain, the system reliability of wind turbine drivetrain is obtained using Equation (27). The system reliability of wind turbine drivetrain considering bending fatigue failure and contact fatigue failure are shown in Figure 15a,b, respectively. The bending fatigue reliability of wind turbine drivetrain is in line with that of the bending fatigue reliability of the gear system and the bearing system reliability. In Figure 15a, the bending fatigue reliability of the system using the survival signature is a little larger than that of the series-parallel system. Therefore, the survival signature-based reliability model proposed in this paper can contribute to a more realistic estimate of the system reliability. As it is shown in Figure 15b, the results are very different from that of the system reliability considering bending fatigue failure in Figure 15a. The contact fatigue reliability of the system is smaller than the bending fatigue reliability of the system [35]. The reliability of the series-parallel system with respect to the mean wind speed of 13 m/s is the largest among four curves at any given time t. The order of the system reliability is R s y s 13 m / s ( t ) > R s y s , s s 11 m / s ( t ) > R s y s 11 m / s ( t ) > R s y s 9 m / s ( t ) when 0 < t < 7.8 , the order of the system reliability is R s y s 13 m / s ( t ) > R s y s , s s 11 m / s ( t ) > R s y s 9 m / s ( t ) > R s y s 11 m / s ( t ) when 7.8 < t < 15.7 , and the order of the system reliability is R s y s 13 m / s ( t ) > R s y s 9 m / s ( t ) > R s y s , s s 11 m / s ( t ) > R s y s 11 m / s ( t ) when 15.7 < t < 25 .
Figure 16 shows the influences of strength degradation on system reliability. From this figure, we can see that the strength degradation has a significant influence on system reliability while t > 8.9 , because both the strength degradation and the dependent failure are considered. The system failure rate considering the strength degradation is also explored in this paper, the results of which are shown in Figure 17. As it is shown in Figure 17, the failure rate curve of the system with strength degradation is very different from that of the system without considering strength degradation. The system’s failure rate without considering strength degradation declines rapidly at the early stage, and then smoothly increases. The failure rate of the system with strength degradation is significantly greater than that of the system without considering strength degradation while t > 4.2 . Therefore, in the wind power industry, service providers of wind turbines can design different maintenance strategies and allocate sources at distinct stages according to the failure rate curves to improve the reliability and safety of wind turbines to a greater extent.

7. Conclusions

Time-dependent fatigue reliability analysis of the wind turbine drivetrain is essential to secure the high-reliability service of large wind turbines. This paper focuses on the dynamic reliability analysis of a wind turbine drivetrain. Based on the fault tree, we develop the system reliability model of the wind turbine drivetrain using the survival signature. The bending fatigue reliability and contact fatigue reliability of the wind turbine drivetrain concerning different wind conditions are studied. The influences of strength degradation of transmission components on the system reliability and the failure rate are also explored. The critical points of this paper are summarized and represented as follows.
( 1 ) The bending fatigue reliability is a little larger than the contact fatigue reliability at a given wind condition, which is in line with the result of the literature [35]. As it is shown in Figure 13 and Figure 14a,b, the reliability of the bearing system is lower than that of the gear system at a given time t under the same wind condition. For the bearing system, the reliability under the mean wind speed of 11 m/s is the lowest compared with the others because the control strategy functions and maximizes power generation at the rated wind speed. The wind turbine begins to change the pitch angle (or the yaw angle) if the wind speed is higher than the rated wind speed, which can reduce the external loads and ensure the safety and reliable operation of the entire wind turbine. Therefore, the rank of the wind turbine’s reliability under different mean wind speeds is R 11 m / s b e a r i n g ( t ) < R 13 m / s b e a r i n g ( t ) < R 9 m / s b e a r i n g ( t ) . For the gear system, the order of the bending fatigue reliability concerning wind conditions is the same as the reliability of the bearing system, and the larger the mean wind speed, the higher is the contact fatigue reliability of the gear system. As the service life of the wind turbine increases, the system reliability gap between different wind conditions becomes larger.
( 2 ) As it is depicted in Figure 17, the reliability of the wind turbine drivetrain considering strength degradation is much lower than that of the system without consideration of strength degradation. The system reliability values of wind turbine drivetrain considering strength degradation are 0.882, 0.7401, and 0.5831 when the service time is t = 10, 15, and 20, respectively. Compared with the system reliability values without consideration of strength degradation, the system reliability values considering strength degradation drop to 0.83%, 9.33%, and 20.95% at service time t = 10, 15, and 20, respectively. Due to the strength degradation and fatigue damage accumulation, the system failure rate considering strength degradation increases significantly during the mission. With the help of the reliability information of wind turbine drivetrain, wind turbine designers could allocate the reliability values of critical components and develop maintenance strategies within the complete life cycle to optimize the power generation.
The future works are given below.
According to the reliability level and failure rates of wind turbines, we would like to develop maintenance strategies at distinct stages to improve the reliability and availability of wind turbines and optimize power generation.

Author Contributions

Conceptualization, Y.L.; methodology, Y.L. and C.Z.; software, X.C.; validation, J.T. and Y.L.; formal analysis, C.Z.; investigation, Y.L. and J.T.; resources, C.Z.; data curation, X.C.; writing—original draft preparation, Y.L.; writing—review and editing, C.Z. and J.T.; visualization, X.C.; supervision, C.Z.; project administration, C.Z.; funding acquisition, C.Z. All authors have read and agreed to the published version of the manuscript.

Funding

The authors thank the editor and the three reviewers for their supportive comments which have led to improved presentation of this work. This research was funded by the National Key R&D Program of China (Grant No. 2018YFB1501300), and Chongqing Innovation and Application Program (Grant No. cstc2019jscx-mbdxX0003, cstc2018jszx-cyztzxX0039).

Conflicts of Interest

The authors declare no conflicts of interest.

Abbreviations

The following abbreviations are used in this manuscript:
FTAfault tree analysis
SSIstress and strength interference
NRELnational renewable energy laboratory
DLLdynamic link library
MBSmulti-body system
WTwind turbine
DoFsdegrees of freedom
T1, T2, T3, T4four types of load-sharing components

Nomenclature

v, H s , T p mean wind speed, wave height, and spectral peak period
V h u b , V ( z ) , z h u b the wind speed at the hub height, the wind profile, and the hub height
F g e a r i ( t ) , F b e a r i n g j ( t ) the dynamic meshing force of gear i and the supporting force of bearing j at time t
σ ¯ H i , σ ¯ F i contact stress and bending stress of the i th gear
m k , l k the number of components of type k and the survival components’ number of type k
λ ( t ) the failure rate of components or system
Φ ( l 1 , l 2 , , l K ) survival signature of the system with m components of type K
R b L ( t ) the reliability of the rolling bearing
R ¯ i ( t ) the fuzzy reliability of the i th component
R s y s ( t ) , R s y s s s ( t ) the system’s reliability without and with using the survival signature
R s y s i m / s ( t ) the system’s reliability with respect to the mean wind speed of i m / s

References

  1. International Electrotechnical Commission. IEC 61400-1: Wind Turbines Part 1: Design Requirements; International Electrotechnical Commission: Geneva, Switzerland, 2005. [Google Scholar]
  2. Helsen, J.; Heirman, G.; Vandepitte, D.; Desmet, W. The influence of flexibility within multibody modeling of multi-megawatt wind turbine gearboxes. In Proceedings of the International Conference on Noise and Vibration Engineering, Leuven, Belgium, 15–17 September 2008; Volume 4, pp. 2045–2072. [Google Scholar]
  3. Zhang, S.; Zhu, C.; Song, C.; Tan, J.; Chen, X. Natural characteristic analysis of wind turbine drivetrain considering flexible supporting. Proc. Inst. Mech. Eng. Part C J. Mech. Eng. Sci. 2018, 232, 842–856. [Google Scholar]
  4. Zhu, C.; Chen, S.; Liu, H.; Huang, H.; Li, G.; Ma, F. Dynamic analysis of the drive train of a wind turbine based upon the measured load spectrum. J. Mech. Sci. Technol. 2014, 28, 2033–2040. [Google Scholar] [CrossRef]
  5. Guo, Y.; Keller, J.; LaCava, W. Combined Effects of Gravity, Bending Moment, Bearing Clearance, and Input Torque on Wind Turbine Planetary Gear Load Sharing; Technical Report; National Renewable Energy Lab. (NREL): Golden, CO, USA, 2012. [Google Scholar]
  6. Wang, S.; Zhu, C.; Song, C.; Liu, H.; Tan, J.; Bai, H. Effects of gear modifications on the dynamic characteristics of wind turbine gearbox considering elastic support of the gearbox. J. Mech. Sci. Technol. 2017, 31, 1079–1088. [Google Scholar] [CrossRef]
  7. Girsang, I.P.; Dhupia, J.S.; Muljadi, E.; Singh, M.; Pao, L.Y. Gearbox and drivetrain models to study dynamic effects of modern wind turbines. IEEE Trans. Ind. Appl. 2014, 50, 3777–3786. [Google Scholar] [CrossRef]
  8. Li, Y.; Castro, A.M.; Martin, J.E.; Sinokrot, T.; Prescott, W.; Carrica, P.M. Coupled computational fluid dynamics/multibody dynamics method for wind turbine aero-servo-elastic simulation including drivetrain dynamics. Renew. Energy 2017, 101, 1037–1051. [Google Scholar] [CrossRef] [Green Version]
  9. Nejad, A.R.; Jiang, Z.; Gao, Z.; Moan, T. Drivetrain load effects in a 5-mw bottom-fixed wind turbine under blade-pitch fault condition and emergency shutdown. J. Physics: Conf. Ser. 2016, 753, 112011. [Google Scholar] [CrossRef]
  10. Huang, X.; Coolen, F.P.A. Reliability sensitivity analysis of coherent systems based on survival signature. Proc. Inst. Mech. Eng. Part O J. Risk Reliab. 2018, 232, 627–634. [Google Scholar] [CrossRef] [Green Version]
  11. Li, M.; Xie, L.; Ding, L. Load sharing analysis and reliability prediction for planetary gear train of helicopter. Mech. Mach. Theory 2017, 115, 97–113. [Google Scholar] [CrossRef]
  12. Zhu, C.; Xu, X.; Lim, T.C.; Du, X.; Liu, M. Effect of flexible pin on the dynamic behaviors of wind turbine planetary gear drives. Proc. Inst. Mech. Eng. Part C J. Mech. Eng. Sci. 2013, 227, 74–86. [Google Scholar] [CrossRef]
  13. Qin, D.; Zhou, Z.; Yang, J.; Chen, H. Time-dependent reliability analysis of gear transmission system of wind turbine under stochastic wind load. Jixie Gongcheng Xuebao (Chin. J. Mech. Eng.) 2012, 48, 1–8. [Google Scholar] [CrossRef]
  14. Huang, X.; Hu, S.; Zhang, Y.; Xu, Y. A method to determine kinematic accuracy reliability of gear mechanisms with truncated random variables. Mech. Mach. Theory 2015, 92, 200–212. [Google Scholar] [CrossRef]
  15. Xiao, N.; Yuan, K.; Zhou, C. Adaptive kriging-based efficient reliability method for structural systems with multiple failure modes and mixed variables. Comput. Methods Appl. Mech. Eng. 2019, 359, 112649. [Google Scholar] [CrossRef]
  16. Nejad, A.R.; Gao, Z.; Moan, T. On long-term fatigue damage and reliability analysis of gears under wind loads in offshore wind turbine drivetrains. Int. J. Fatigue 2014, 61, 116–128. [Google Scholar] [CrossRef] [Green Version]
  17. Nejad, A.R.; Gao, Z.; Moan, T. Fatigue Reliability-Based Inspection and Maintenance Planning of Gearbox Components in Wind Turbine Drivetrains. Energy Procedia 2014, 53, 248–257. [Google Scholar] [CrossRef] [Green Version]
  18. Jiang, Z.; Xing, Y.; Guo, Y.; Moan, T.; Gao, Z. Long-term contact fatigue analysis of a planetary bearing in a land-based wind turbine drivetrain. Wind Energy 2015, 18, 591–611. [Google Scholar] [CrossRef]
  19. Gallego-Calderon, J.; Natarajan, A.; Cutululis, N.A. Ultimate design load analysis of planetary gearbox bearings under extreme events. Wind Energy 2017, 20, 325–343. [Google Scholar] [CrossRef]
  20. Jonkman, J.; Butterfield, S.; Musial, W.; Scott, G. Definition of a 5-mw Reference Wind Turbine for Offshore System Development; Technical Report; National Renewable Energy Lab. (NREL): Golden, CO, USA, 2009. [Google Scholar]
  21. Nejad, A.R.; Guo, Y.; Gao, Z.; Moan, T. Development of a 5 mw reference gearbox for offshore wind turbines. Wind Energy 2016, 19, 1089–1106. [Google Scholar] [CrossRef] [Green Version]
  22. Rulka, W. Simpack-a computer program for simulation of large-motion multibody systems. In Multibody Systems Handbook; Springer: Berlin/Heidelberg, Germany, 1990; pp. 265–284. [Google Scholar]
  23. Zhu, C.; Chen, S.; Song, C.; Liu, H.; Bai, H.; Ma, F. Dynamic analysis of a megawatt wind turbine drive train. J. Mech. Sci. Technol. 2015, 29, 1913–1919. [Google Scholar] [CrossRef]
  24. Johannessen, K.; Meling, T.S.; Haver, S. Joint Distribution for Wind and Waves in the Northern North Sea. Available online: https://www.onepetro.org/journal-paper/ISOPE-02-12-1-001 (accessed on 20 February 2020).
  25. IEC 61400-1. Wind Turbines, Part 1: Design Requirements; International Electrotechnical Commission: Geneva, Switzerland, 2005.
  26. Shabana, A.A. Dynamics of Multibody Systems; Cambridge University Press: Cambridge, UK, 2013. [Google Scholar]
  27. Jonkman, J.M.; Hayman, G.J.; Jonkman, B.J.; Damiani, R.R.; Murray, R.E. Aerodyn v15 User’s Guide and Theory Manual; National Renewable Energy Laboratory: Golden, CO, USA, 2015. [Google Scholar]
  28. Jonkman, J.M.; Robertson, A.; Hayman, G.J. Hydrodyn User’s Guide and Theory Manual; National Renewable Energy Laboratory: Golden, CO, USA, 2014. [Google Scholar]
  29. Jonkman, J.M.; Buhl, M.L., Jr. Fast User’s Guide; National Renewable Energy Laboratory: Golden, CO, USA, 2005; Volume 365, p. 366. [Google Scholar]
  30. Coolen, F.P.A.; Coolen-Maturi, T. Generalizing the signature to systems with multiple types of components. In Complex Systems and Dependability; Springer: Berlin/Heidelberg, Germany, 2013; pp. 115–130. [Google Scholar]
  31. Xia, X.; Xu, Y.; Jin, Y.; Shang, Y.; Chen, L. Assessment of optimum confidence interval of reliability with three-parameter weibull distribution using bootstrap weighted-norm method. J. Aerosp. Power 2013, 28, 481–488. [Google Scholar]
  32. Chiu, Y.P.; Tallian, T.E.; McCool, J.I.; Martin, J.A. A mathematical model of spalling fatigue failure in rolling contact. ASLE Trans. 1969, 12, 106–116. [Google Scholar] [CrossRef]
  33. Organización Internacional de Normalización. Rolling Bearings: Dynamic Load Ratings and Rating Life; ISO: Geneva, Switzerland, 2007. [Google Scholar]
  34. Zaretsky, E.V.; Poplawski, J.V.; Peters, S.M. Comparison of life theories for rolling-element bearings. Tribol. Trans. 1996, 39, 237–248. [Google Scholar] [CrossRef] [Green Version]
  35. Dong, W.; Xing, Y.; Moan, T.; Gao, Z. Time domain-based gear contact fatigue analysis of a wind turbine drivetrain under dynamic conditions. Int. J. Fatigue 2013, 48, 133–146. [Google Scholar] [CrossRef] [Green Version]
  36. Standard and ISO. 6336-2: 2003, Calculation of Load Capacity of Spur and Helical Gears—Part 2: Calculation of Surface Durability (Pitting); International Organization for Standardization: Geneva, Switzerland, 2006. [Google Scholar]
  37. Standard, British; ISO, BS. Calculation of Load Capacity of Spur and Helical Gears—Part 3: Calculation of Tooth Bending Strength; International Organization for Standardization: Geneva, Switzerland, 2006; Volume 6336, p. 1996. [Google Scholar]
  38. Hosking, J.R.M.; Wallis, J.R.; Wood, E.F. Estimation of the generalized extreme-value distribution by the method of probability-weighted moments. Technometrics 1985, 27, 251–261. [Google Scholar] [CrossRef]
  39. Huang, X.; Li, Y.; Zhang, Y.; Zhang, X. A new direct second-order reliability analysis method. Appl. Math. Model. 2018, 55, 68–80. [Google Scholar] [CrossRef]
  40. Zhu, C.; Xu, X.; Lu, B.; Song, C. Fuzzy reliability optimization for transmission system of high-power marine gearbox. J. Ship Mech. 2010, 14, 915–921. [Google Scholar]
  41. Li, Y.; Coolen, F.P.A. Time-dependent reliability analysis of wind turbines considering load-sharing using fault tree analysis and markov chains. Proc. Inst. Mech. Eng. Part O J. Risk Reliab. 2019, 233, 1074–1085. [Google Scholar] [CrossRef] [Green Version]
  42. Aslett, L.J.M. Reliabilitytheory: Tools for structural reliability analysis. R package 2012. Available online: https://github.com/louisaslett/ReliabilityTheory (accessed on 12 September 2016).
  43. Batsoulas, N.D. Cumulative fatigue damage: Cdm-based engineering rule and life prediction aspect. Steel Res. Int. 2016, 87, 1670–1677. [Google Scholar] [CrossRef]
  44. Rege, K.; Pavlou, D.G. A one-parameter nonlinear fatigue damage accumulation model. Int. J. Fatigue 2017, 98, 234–246. [Google Scholar] [CrossRef]
  45. Miner, M.A. Cumulative fatigue damage. J. Appl. Mech. 1945, 12, 159–164. [Google Scholar]
  46. Zhang, Y.; Wang, G.; Wang, J.; Jia, H.; Zhang, E. Compilation method of power train load spectrum of engineering vehicle. Trans. Chin. Soc. Agric. Eng. 2011, 27, 179–183. [Google Scholar]
Figure 1. Structure and coordinate system of wind turbine.
Energies 13 02108 g001
Figure 2. Schematic layout of 5MW wind turbine drivetrain.
Energies 13 02108 g002
Figure 3. Schematic of blade section.
Energies 13 02108 g003
Figure 4. Flowchart of the control system.
Energies 13 02108 g004
Figure 5. Torque-speed response of the variable-speed controller.
Energies 13 02108 g005
Figure 6. Simulation flow chart of wind turbine system.
Energies 13 02108 g006
Figure 7. The technical flowchart of the proposed method.
Energies 13 02108 g007
Figure 8. Membership function of the trapezoidal fuzzy number.
Energies 13 02108 g008
Figure 9. Fault tree of the wind turbine drivetrain.
Energies 13 02108 g009
Figure 10. Reliability block diagram of load-sharing systems.
Energies 13 02108 g010
Figure 11. Calculation of tooth root bending stress of sun gear of 1 st stage.
Energies 13 02108 g011
Figure 12. Probability densities of the mean bending stress and the amplitude.
Energies 13 02108 g012
Figure 13. Reliability of bearing system with different average wind speed.
Energies 13 02108 g013
Figure 14. Reliability of gear transmission system considering different failure modes.
Energies 13 02108 g014
Figure 15. System reliability of wind turbine drivetrain considering different failure modes.
Energies 13 02108 g015
Figure 16. System reliability considering strength degradation.
Energies 13 02108 g016
Figure 17. System failure rate considering strength degradation.
Energies 13 02108 g017
Table 1. 5 MW wind turbine specification.
ParameterValueParameterValue
Rating (MW)5.0Nacelle mass (kg)240,000
Cut-in wind speed (m/s)3Rotor mass (kg)110,000
Rated wind speed (m/s)11.4Hub height (m)90
Cut-out wind speed (m/s)25Rated rotor speed (r/min)12.1
Rotor diameter (m)126Gearbox ratio97:1
Cut-in rotor speed (r/min)6.9Maximum absolute blade pitch rate (∘/s)8
Tower mass (kg)347,460High-speed shaft brake torque (N·m)28,116.3
Power control systemPitch
Table 2. Survival signature of the wind turbine drivetrain.
l 1 l 2 l 3 l 4 Φ ( l 1 , l 2 , l 3 , l 4 )
1[1,2,3][1,2][1,2]1
2[1,2,3][1,2][1,2]1
3[1,2,3][1,2][1,2]1
0[1,2,3][1,2][1,2]0
[1,2,3]0[1,2][1,2]0
[1,2,3][1,2,3]0[1,2]0
[1,2,3][1,2,3][1,2]00

