Performance Assessment of Axial-Flux Permanent Magnet Motors from a Manual Manufacturing Process


1
Faculty of Electrical Engineering Automatic Control and Informatics, Opole University of Technology, 45-758 Opole, Poland
2
ARRIVAL Ltd., London W14 8TS, UK
*
Author to whom correspondence should be addressed.
Energies 2020, 13(8), 2122; https://0-doi-org.brum.beds.ac.uk/10.3390/en13082122
Submission received: 19 March 2020
/
Revised: 17 April 2020
/
Accepted: 19 April 2020
/
Published: 24 April 2020
(This article belongs to the Section F: Electrical Engineering)
Abstract
:Implementation of a new design for the process of assembling an axial-flux permanent magnet synchronous motor (AF PMSM) may lead to unstable motor parameters during operation at low and high speeds. In this paper, experimental data related to the AFPMSM used in an electric traction motor was monitored. The paper presents tracing of machine performance in order to find quality-related issues and to evaluate the assembly process. To assess the manual manufacturing process (low-volume production) and electrical machine performance, several motors, characterized by the same size and topology, were extensively tested. Useful AF PMSM parameters such as continuous torque and continuous current were measured. The winding temperature of the stators was also monitored and carefully examined. An attempt to assess motor performance, based on measurements and aimed at the identification of the weakest parts of the electric motor design is presented. In this paper it can be seen how the subcomponents of the machine and its detailed assembly process and tolerances play key roles in achievement of the designed continuous performance with symmetrical temperature distribution in the stator winding. Selected conclusions drawn from the obtained measurements were explained by a rotor/stator misalignment study using 3-D finite element analysis.
1. Introduction
The concept of electric vehicles is expanding into the areas of passenger cars, trucks, buses, and special purpose vehicles. This requires engineers to consider the design of electric motors with suitable thermal- management systems, inverters, and motor controls [1,2,3]. The manufacture of these vehicles requires the development and launch of electrical machines with low noise levels, improved motor performance, high efficiency, a high level of reliability, intensive active cooling of the stator (as well as, in many cases, of the rotor), and a long lifespan [4,5,6]. Nowadays, lighter machines with higher efficiencies are also required [7]. In order to avoid unsafe operation and to increase lifespans, it is important to use appropriate cooling approaches in electric traction motors. Moreover, tolerance sensitivity analysis of a new group of electrical machines is also important in order to assess their weaknesses [8,9,10].
When developing a new manual manufacturing process for an electric machine, it is important to test the lifespan of the machines being built and, based on these findings, to define the right test approach [11,12]. The conclusions drawn from these lifespan and performance tests may be very useful in the specification of further modifications or optimization processes aimed at the development of a new electric motor prototype characterized by improved performance [9,12,13,14,15].
The main aim of the present paper is to analyze the monitored performance of an AF PMSM for several identical electric motors from a low-volume production line. This analysis should demonstrate differences in the motor’s useful parameters and identify what should be changed in the testing techniques and in the AFPMSM assembly process in order to reduce the standard deviation of each motor’s parameters, such as torque constant, voltage constant, torque ripple, and efficiency. In the case of various measured parameters, the authors made an effort to point out the weakest areas of AF PMSM observed during the motor assembly process. Moreover, the authors demonstrate the relationship of the test differences to potential problems in AF PMSM batches. Many automotive-industry research units, engineers usually come across several serious issues that must be resolved, one of which is the failure of a portion of produced machines during their lifetime. It is common to initially focus forensic investigations on electromagnetic, mechanical, and thermal aspects. However, this is not sufficient to avoid machine failure over time. Based on the authors experience, electromagnetic, mechanical, and thermal analysis must be extended to include motor a sensitivity study. This is especially true because the structure of a high-power-density AF PMSM designed to operate at medium to high speeds requires special techniques to increase its lifespan and to avoid early failures during operation. One of these techniques is based on studying the influence of the tolerances of motor subcomponents during the assembly process, which plays an important role in understanding the machine’s behavior and in identifying motor elements that must be redesigned [16,17,18,19,20,21,22].
An AF PMSM with double-stator topology was considered in this paper. From the subject literature it can be seen that, depending on AF PMSM topology, the axial offset of the rotor in the air-gap may cause significant unbalanced axial forces, with minor impacts on other machine parameters such as torque constant [23,24]. Conversely, angular offset between the two stators has a small impact on unbalanced rotor forces but a relatively large one on recirculating currents within the machine, which can lead to uneven heating of the two stators [23,25].
A large percentage of the current scientific work on electrical machines focuses on numerical and analytical design. Following extensive characterization and validation testing, a given machine is usually ready for mass production. However, for engineers assessing electrical machine performance based on test data, there is little guidance available to help improve the design in terms of durability. In small and medium research units of AF PMSM hybrid electric vehicle (HEV) and in electric vehicle (EV) traction motors in the global automobile market, engineers have come across a number of difficult challenges as shown in [26]. A small portion of the existing academic literature discusses improvements in the process of the design of an electrical machine based on monitoring of the machine’s performance, with even less attention paid to the tracing the performance of same-batch electric motors in order to find quality-related issues and identify assembly-process defects. To bridge this gap, the authors conducted the necessary research. The presented measurements can be used to point out the weakest parts of the motor, which may constitute a reason for reduced efficiency and lifetime found in AF PMSMs. The study of assembly tolerances explains the influence of rotor/stator sensitivity on motor performance.
2. Experimental Measurement
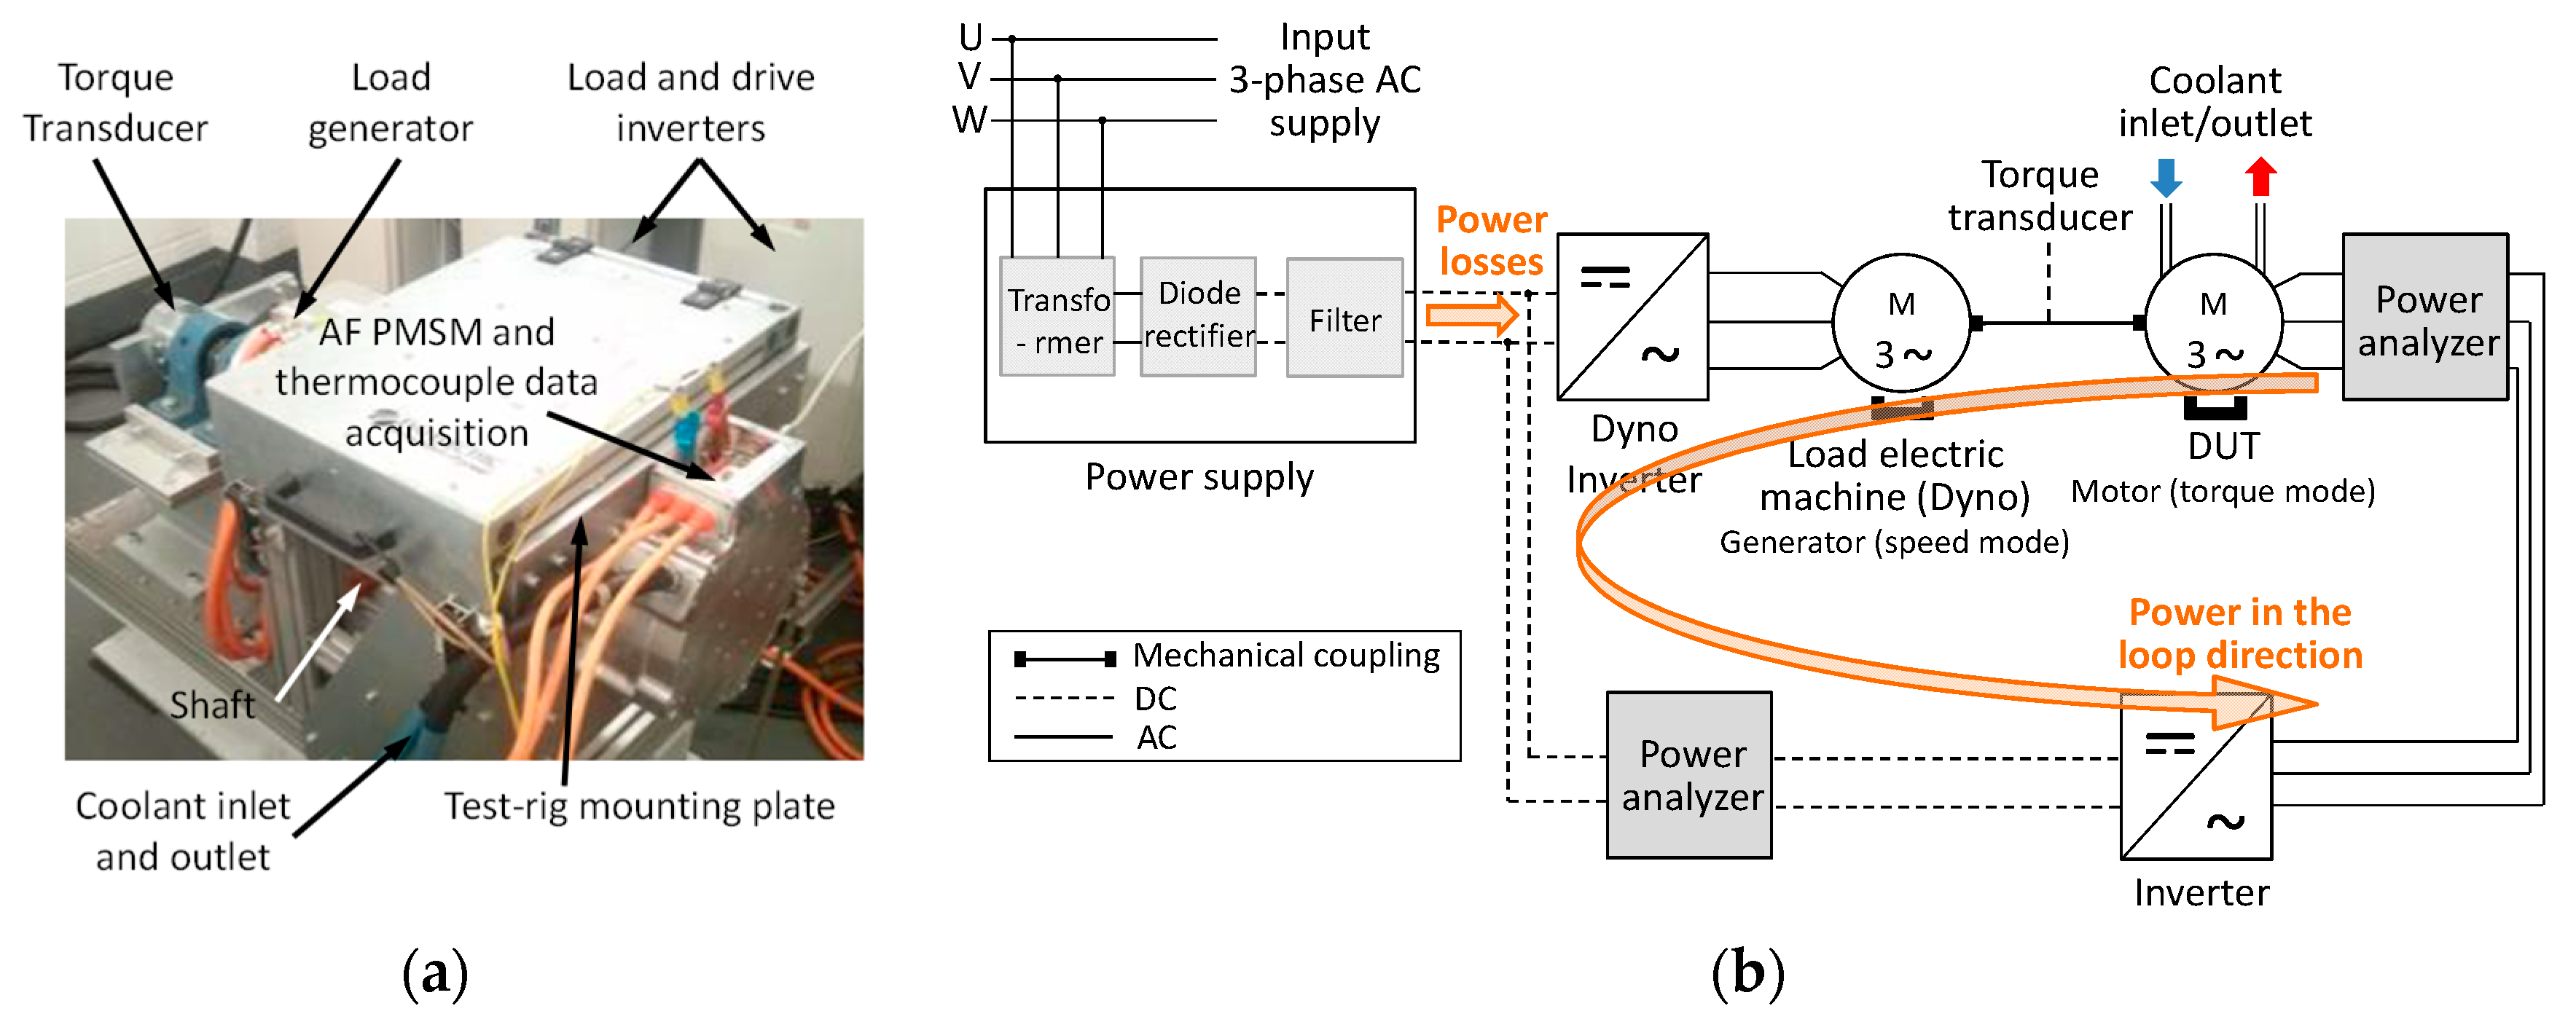
A three-phase PMSM, based on axial flux technology, that can be used in conjunction with custom-built or standard industrial inverters is shown in Figure 1a. Designed AFPMSMs combine high performance with reduced weight and size that are ideal for electric and hybrid electric vehicles [27,28,29]. These machines are characterized by the following key features: high torque and power density, low cogging torque, compact design with flat front and back faces for easy mounting, a through shaft, an integrated resolver for rotor position feedback; liquid cooling for enhanced performance.
The experimental facility, prototype instrumentation and experimental methods used to monitor the machine’s parameters and to provide empirical validation with a numerical model (based on the finite element method (FEM)) are shown in Figure 1b, describing a classic back-to-back arrangement. The DC inputs of the inverters was connected to the same DC bus with 75 kW and 400 VDC, configured to provide constant voltage to the inverter’s input. On the motor side, an IGBT based industrial sine-wave drive using field-oriented control was configured in torque control mode which took power from the DC bus and converted it into 3-phase AC power, thus driving the device under test (DUT). The mechanical power in the shaft was used to move the test cell dyno working in speed mode as a generator, thereby converting the power, minus the losses of all the elements, back to the DC link through another sine-wave IGBT based inverter. The main advantage of the back-to-back array was that the DUT could be submitted to rated performance values by taking only a fraction of the power from the grid to feed the losses of the inverters, electrical machines and power supply. More details about the measurement methods are described in the references [30].
The tested machines were capable by design of delivering nominal power of 64 kW when driven by an inverter with sinusoidal voltage with controllable frequency and amplitude. The active electrical power consumed in each phase of the tested motor was measured by a precision power analyzer connected through external shunts to measure phase currents, while voltage was sensed internally. General specifications for the test motors are listed in Table 1.
Measurements of continuous torque, continuous current, and even winding temperature in each stator disk were investigated in depth. The test consisted of a series of measurements at varying speeds and loads. The machines were driven mainly at two points of interest, one at 500 rpm (constant torque) and the other, well inside the field of weakening region, at 6000 rpm (constant power), with a line-to-neutral RMS (root mean square) input current between 166 and 190 A. The device speed was dependent on the excitation frequency and machine number of poles, while the torque was proportional to Iq (proportional to the current below base speed). In order to filter out electrical noise, mechanical vibration and torque ripple, the reading was time-averaged with FPGA-based hardware. This involved the acquisition of different electrical, thermal, and mechanical variables in real time and, prior to all of them being saved together in vector data, performance of a check of the data stability to avoid retention of an inaccurate value for one of the parameters. At each speed value (and for a given input voltage, coolant inlet temperature, and flow) the continuous performance test consisted of finding the mechanical torque-and thus power, that would plateau the winding temperature at the maximum allowable value of 170 °C. The plateau was defined by temperature changes of less than 1.0 K within a window of 5 min. Typical input parameters were 400 VDC and 55 °C coolant inlet, 8.0 LPM water-ethylene glycol (50/50). As per the voltage input of the motor, this can be studied separately for the fundamental component and the total signal including all the harmonics. For the first one it is useful to employ a phasor diagram as in classic synchronous machine theory, while for the later and being a PWM signal, the total RMS component is the relevant parameter employed. The coolant jacket was characterized by two serpentine channels fed in parallel, with a corrugated cross section in order to increase the surface area of the coolant jacket hence improving heat transfer. The coolant medium was a mix of water and glycol.
The winding temperature was measured using one class B PT100 platinum resistance thermometer (accuracy rating ±0.5 °C) placed in each stator end winding.
3. Overview of Motor Topology, Assembly, and Design Methodology
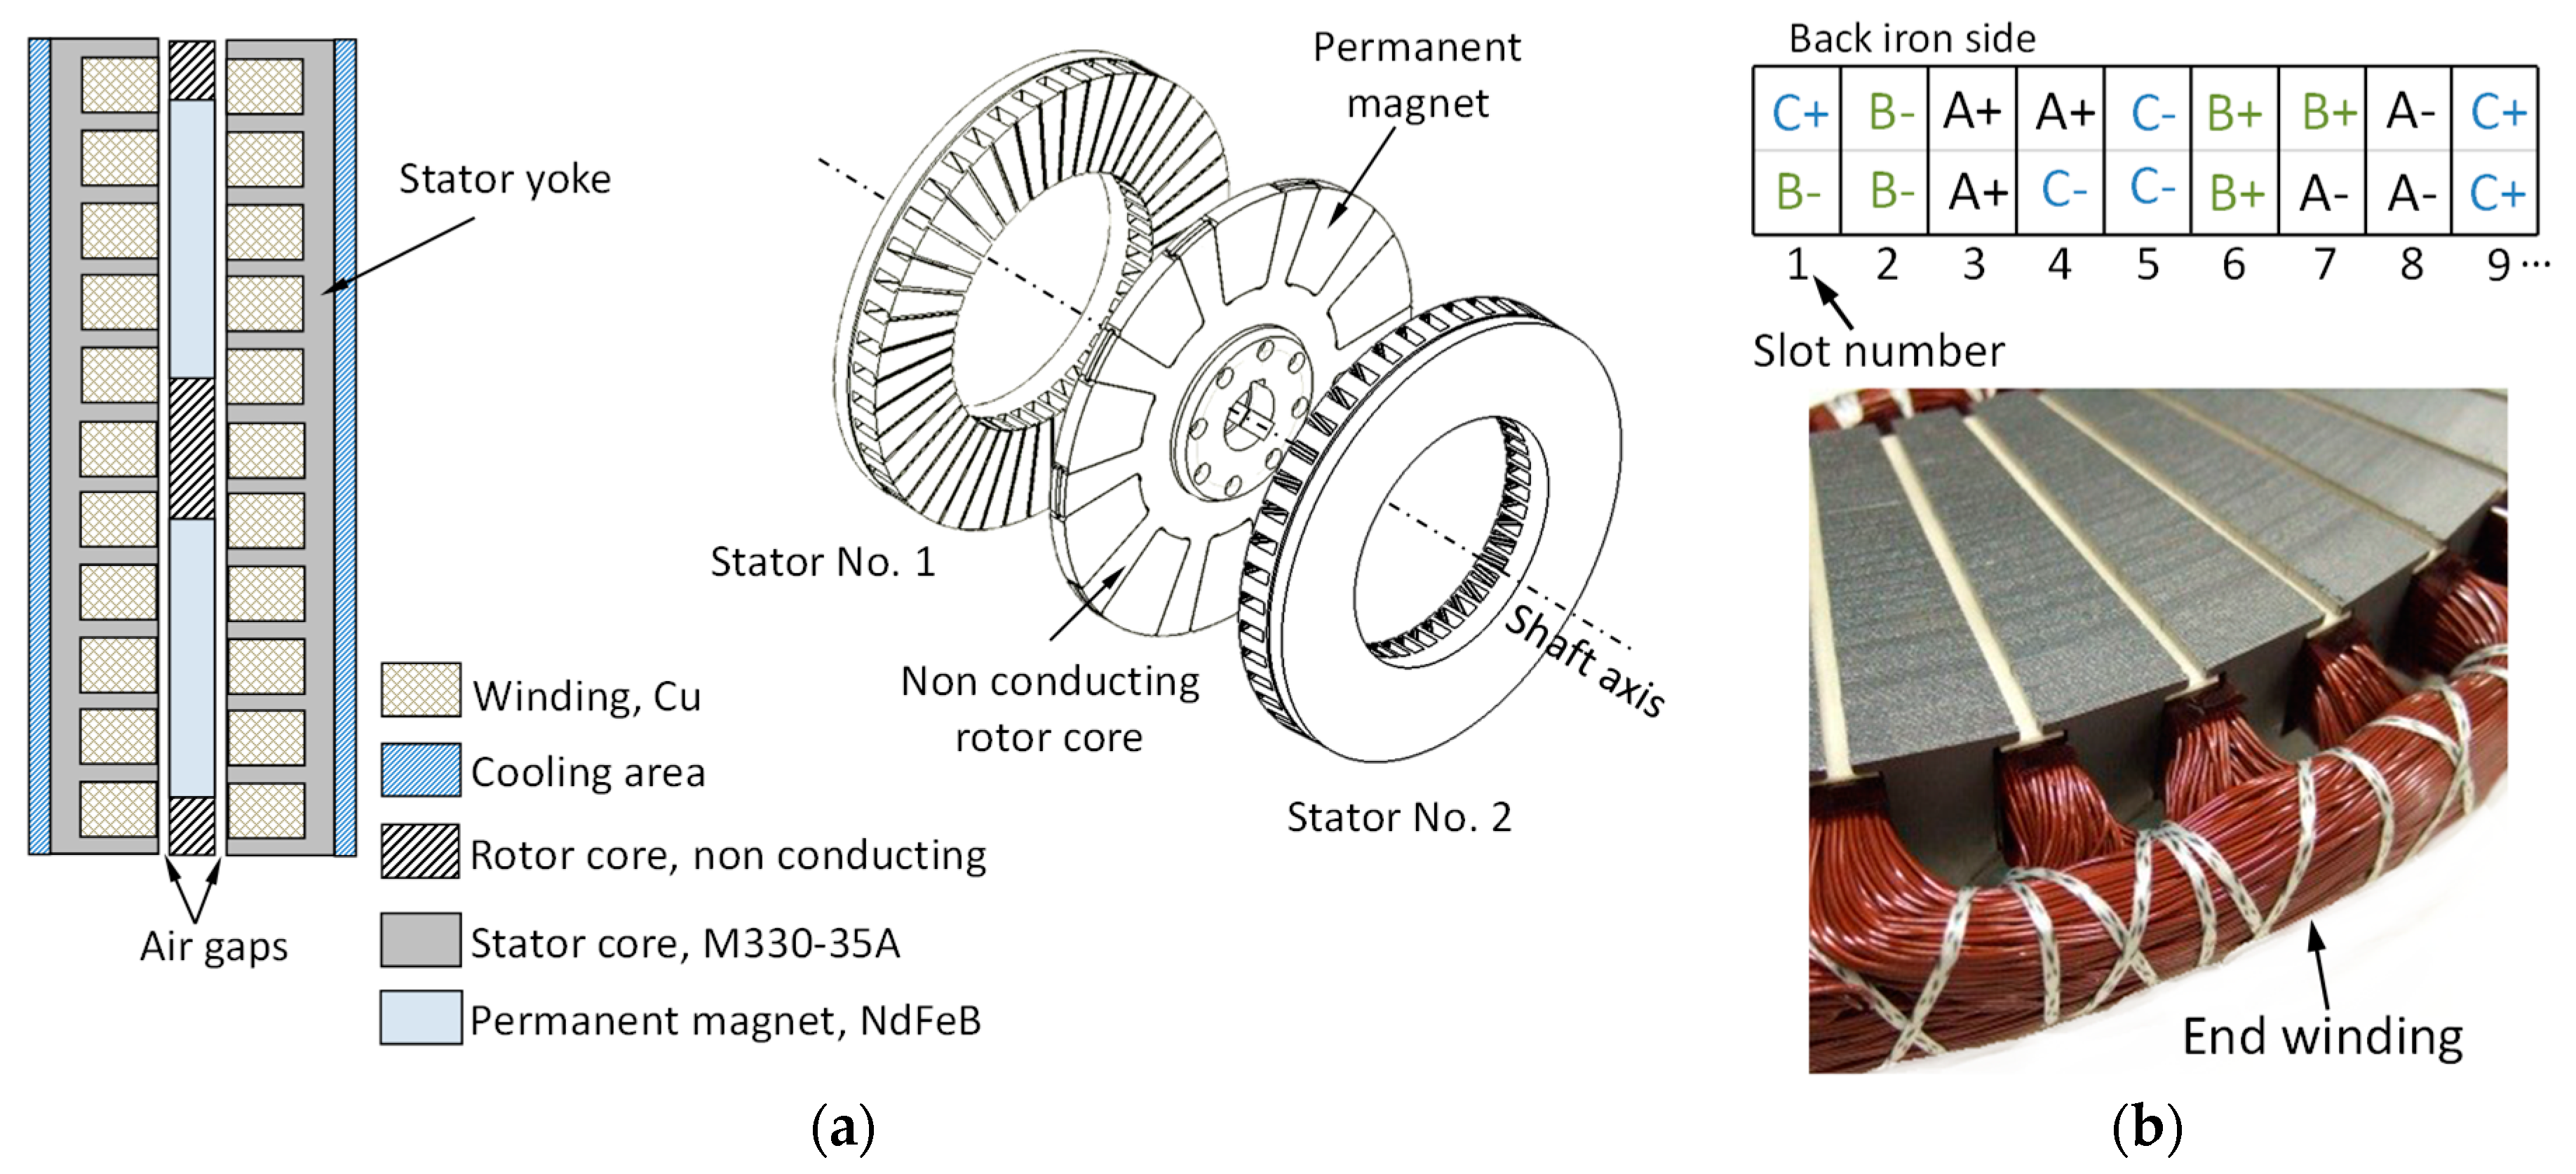
The AF PMSM topology was described in detail in [27]. Figure 2a represents the shape of the motor disk, consisting of a single rotor sandwiched between two stators, where two sets of three phase windings are connected in parallel. The winding is constructed of a resin-impregnated bundle of copper wires inserted into each slot and subsequently cured. A diagram of the winding of the AF PMSM is presented in Figure 2b. The stators were manufactured from a continuous strip of stamped electrical steel and wound on a mandrel (this creates a laminated stack in order to reduce eddy current losses). Once the stator cores, winding, magnets, and rotor core were built, all of these components were assembled manually. It should be noted that the iron losses in each actual electric motor cannot be the same because in each motor the stator core material was stamped, formed, and welded prior to being fixed to a casing using screws, these processes introduce stress and strain into the material, potentially influencing iron loss, which in turn can affect motor performance. The frilling and tapping of the stator core for fixing can also create local hotspots due to lamination short-circuiting.
The magnets employed were set manually and glued into the non-conducting rotor core. The magnetization vectors of each pole were set in opposite axial directions.
Customers often require distinct capabilities in the production of electrical machines as a result of specific requirements regarding electric motor design. Investments in the development of innovative electric motor technologies encompass differences in equipment, complexity, and operation quality. Nevertheless, two issues still need to be discussed. From the economic point of view, the motor manufacturing process cannot always be automated at the first stage of prototyping or even of the stage of testing motors for a low-volume automobile market. Second, a manual manufacturing process is required. Thus, in the event of changes made to manufactured electric motors, the risk of AF PMSM failure may be high. All tested AF PMSMs are characterized by the same design and each electric motor batch was built in a different months. Thus the magnet and stator batches and impregnation processes may affect electric motor performance. In the next section, each electric motor batch is discussed in an attempt to interpret the test results. Some of the conclusions were interpreted by means of finite element analysis of rotor/stator misalignment in AF PMSMs.
4. Results and Discussion of the Performance Investigation
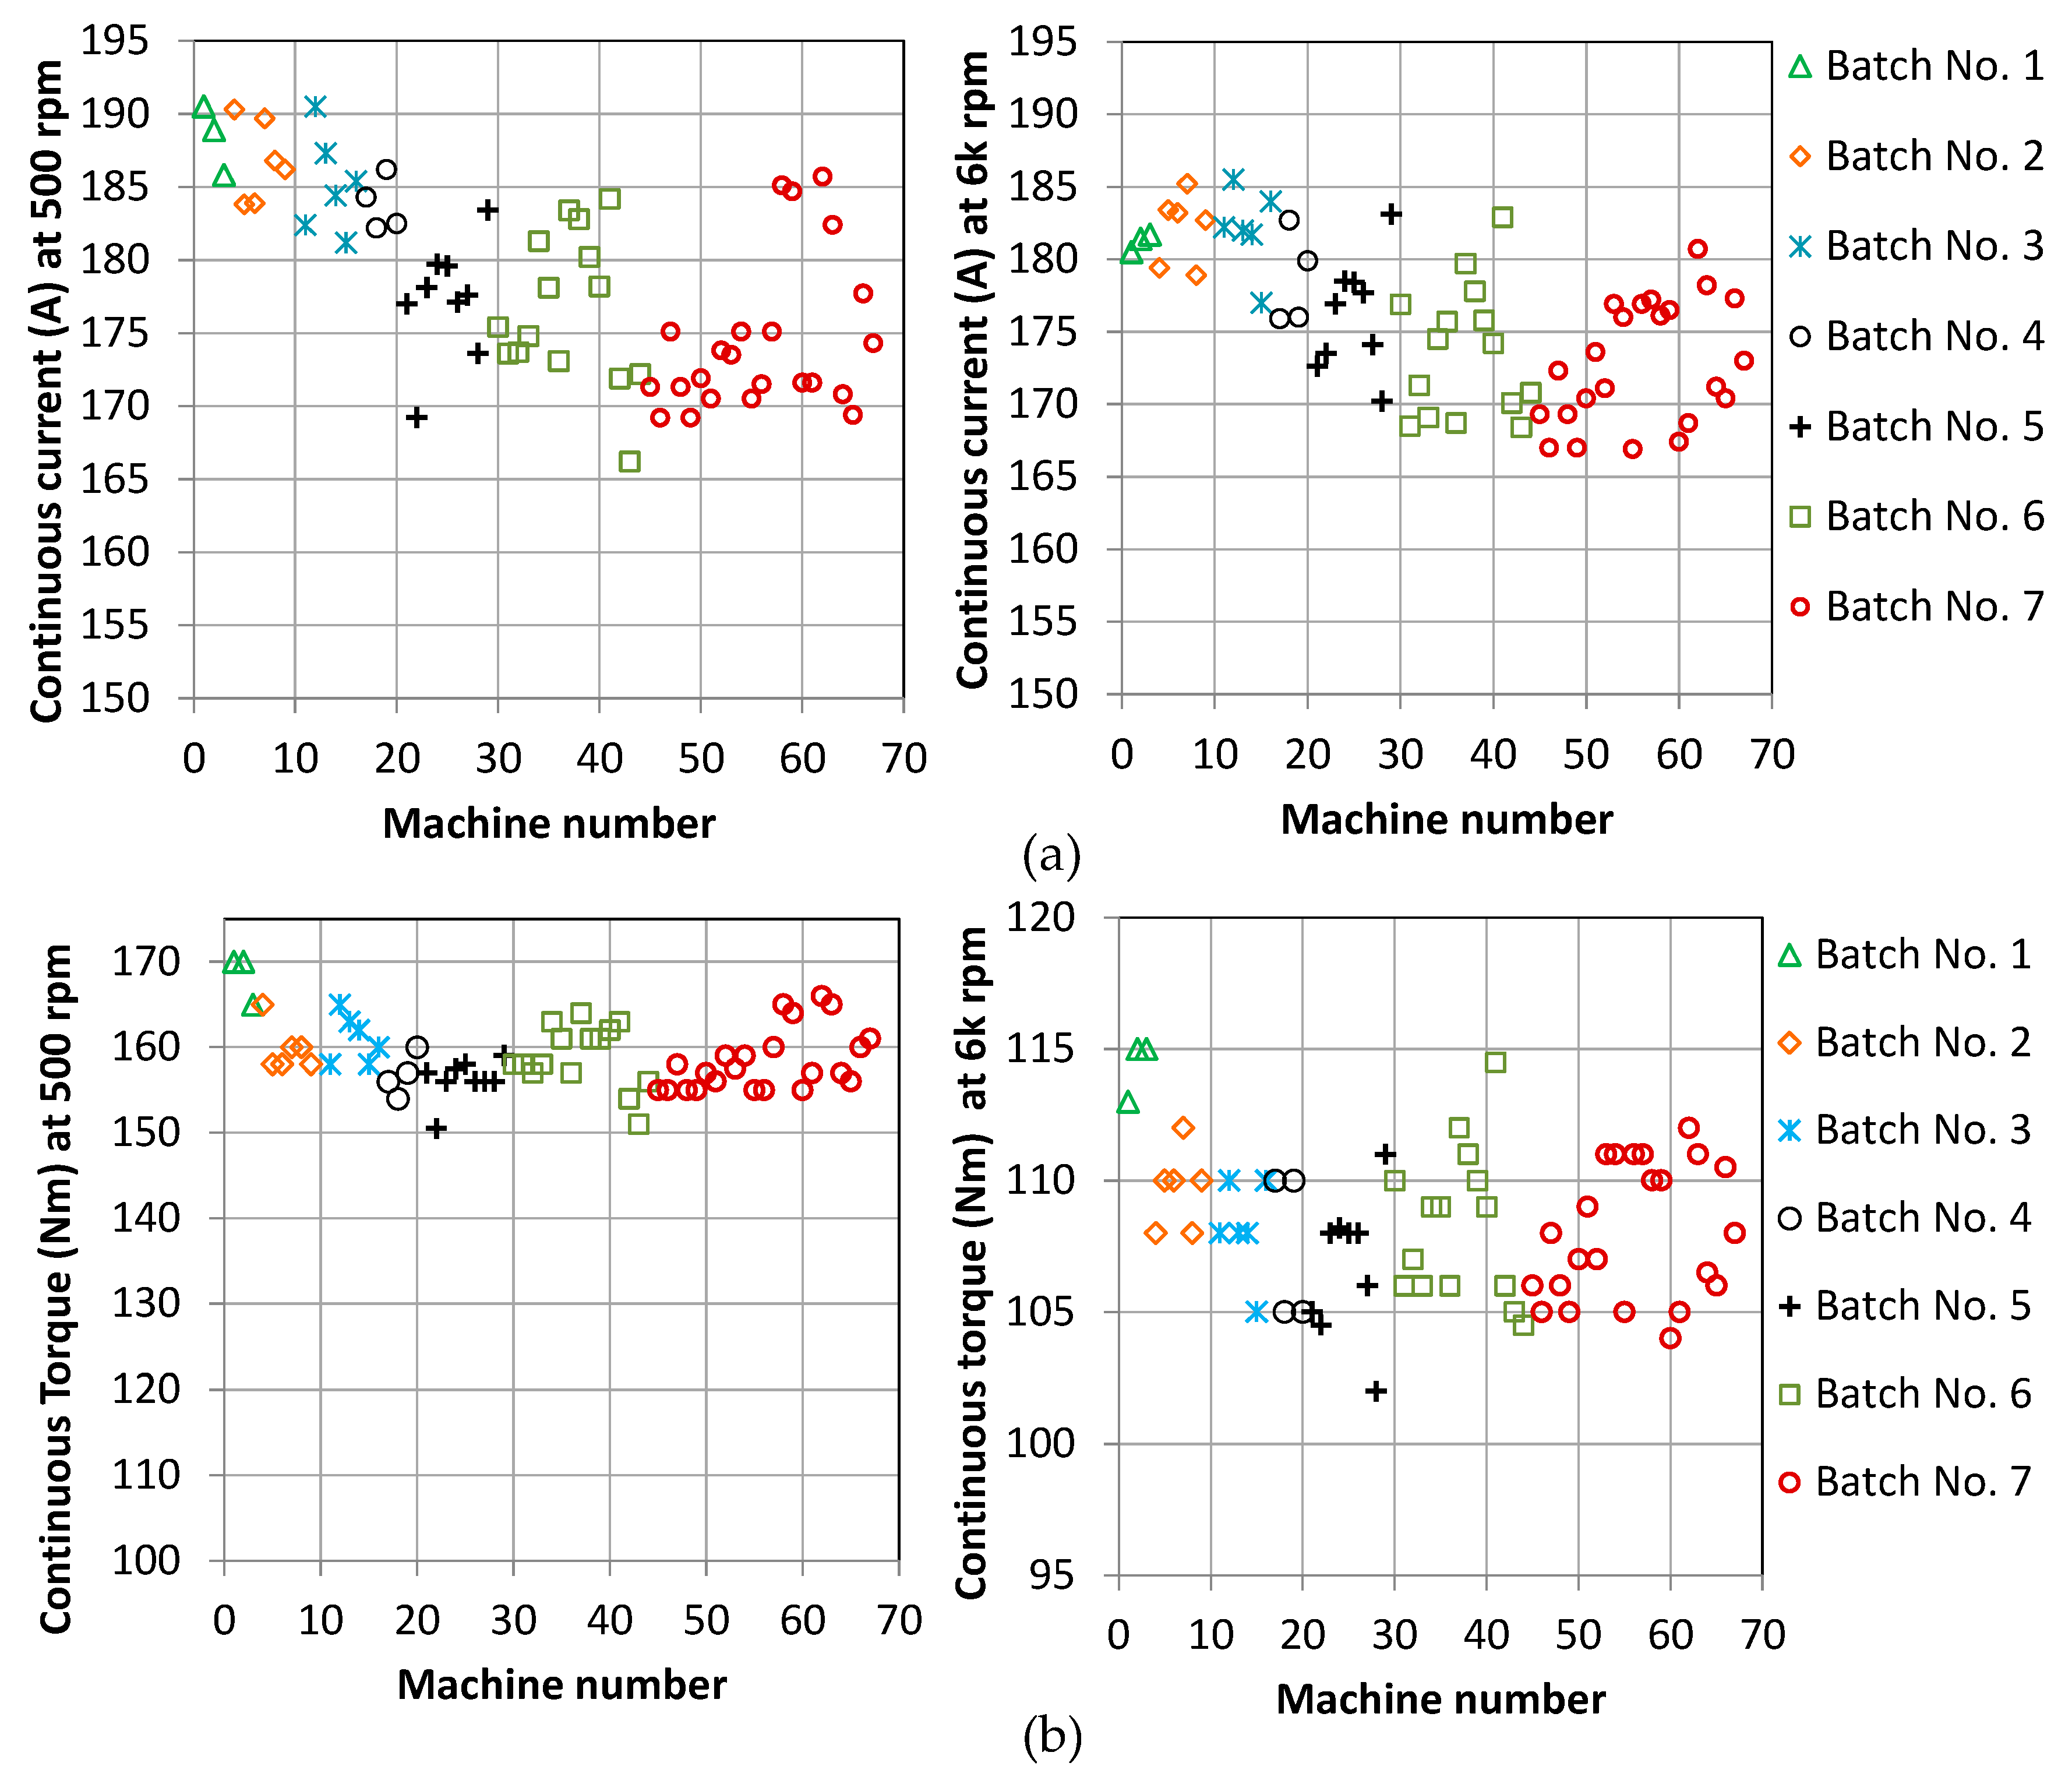
The parameters of all motors were measured via experiment. An example of typical operation illustrated by speed and torque is presented in [31]. The continuous current needed to maintain the measured continuous torque at constant low and high speeds is shown in Figure 3. Electric motors, numbered 1 to 67, were selected for testing. Moreover, each batch number of AF PMSMs was marked with a different colors (each month a new batch of AFPMSMs was tested; each batch may have been affected by a slightly different procedure of production and manual device assembly).
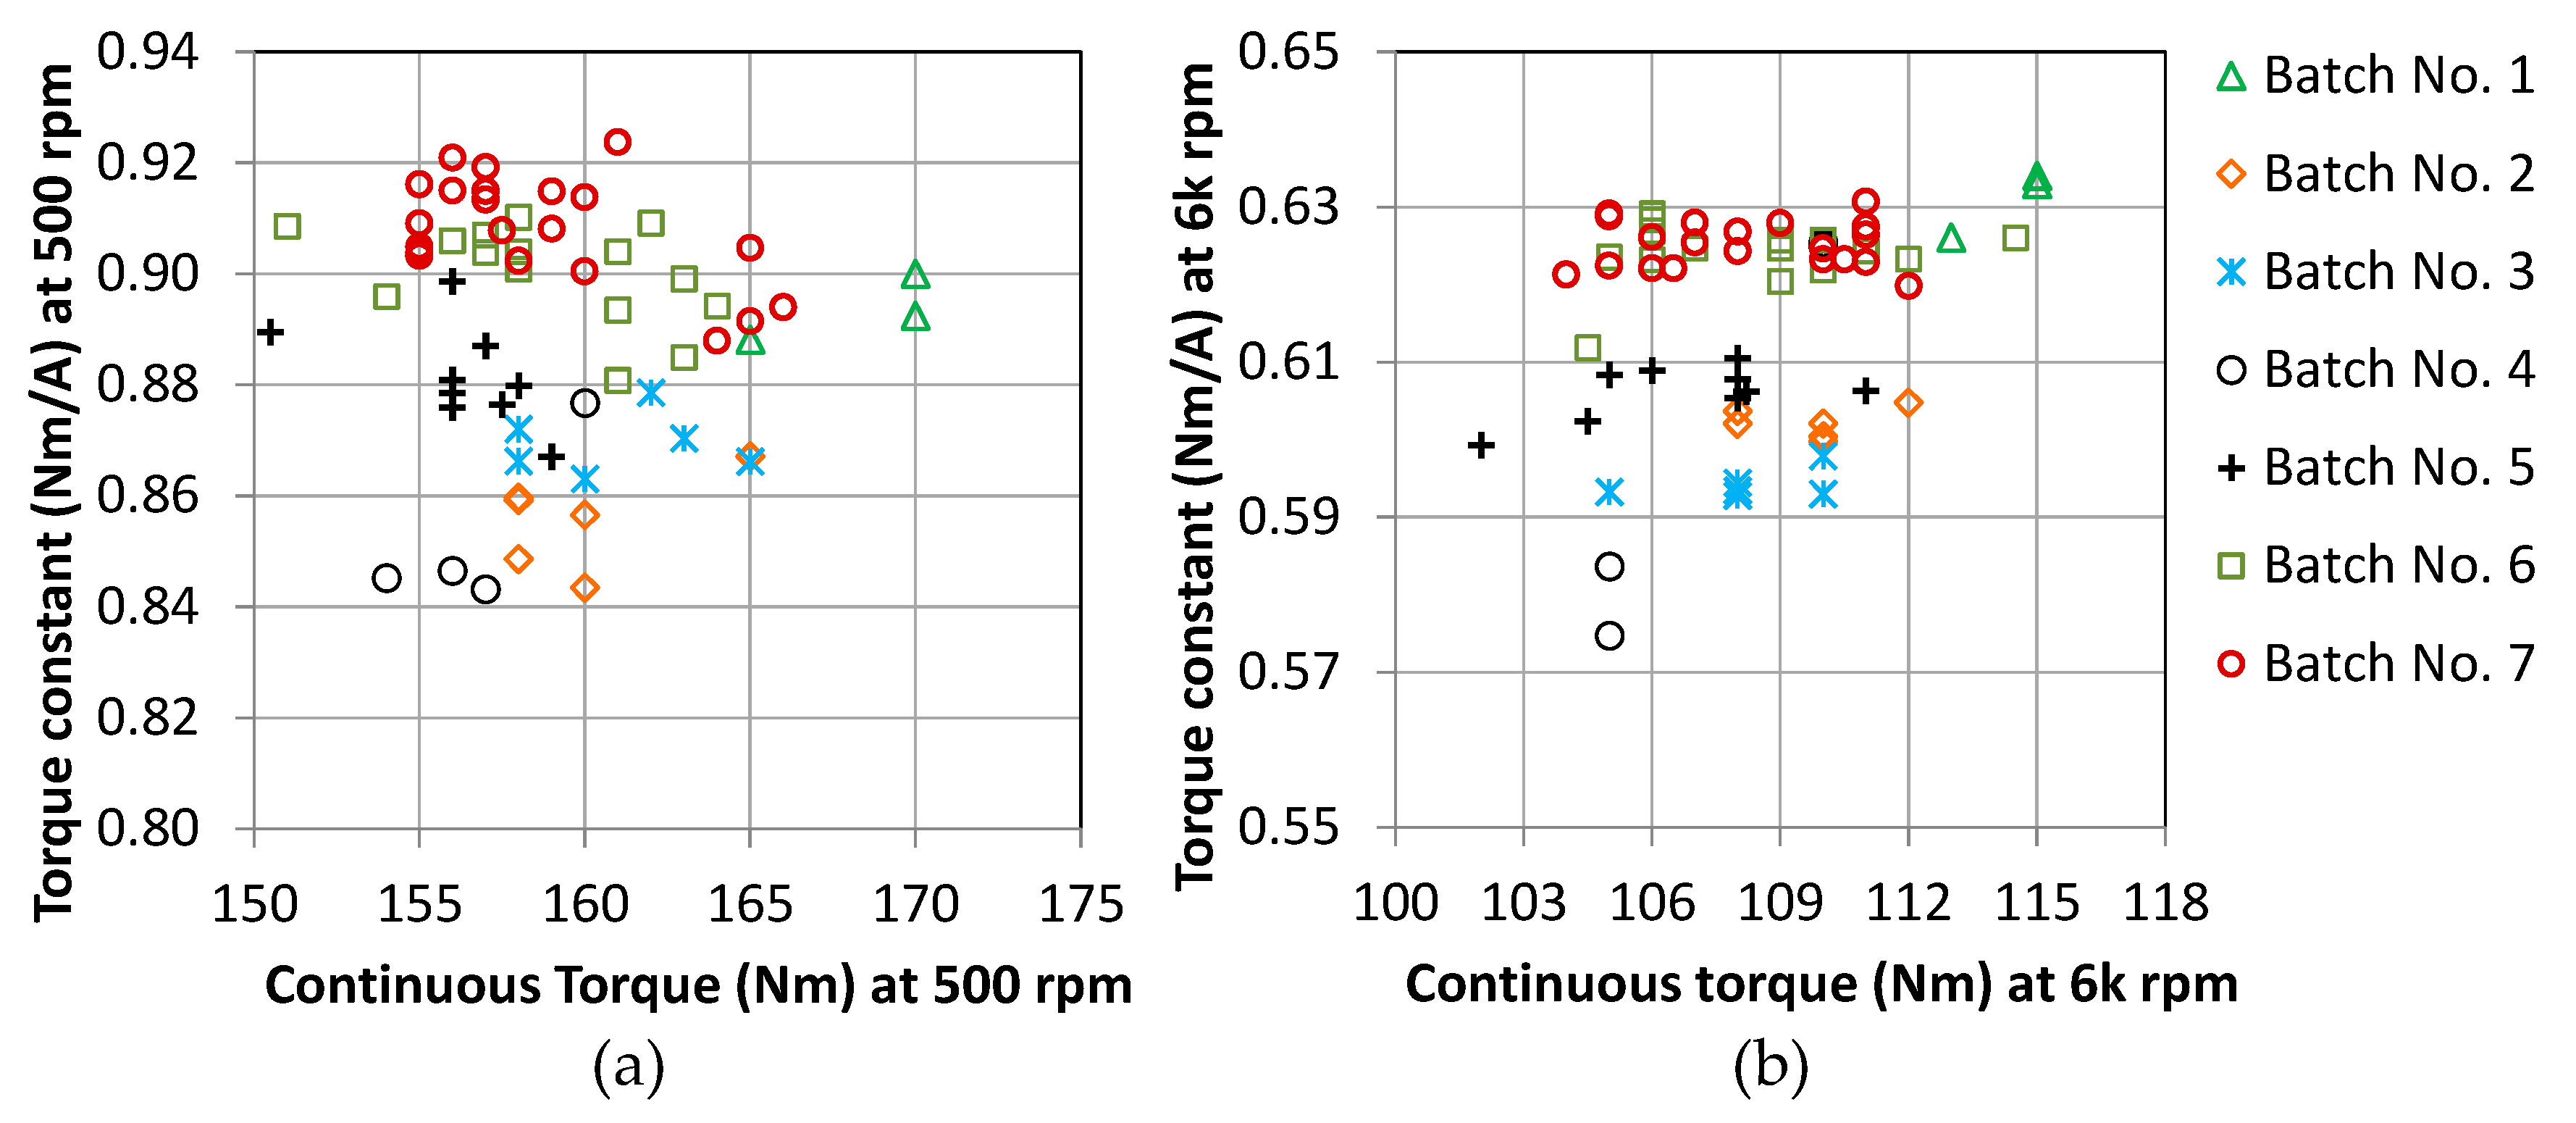
Figure 4 shows the torque constant kT for each tested electric motor, kT defined as [23]
where kT is the torque constant in N·m/A, I is the RMS current in A, and Tav is the electromagnetic average torque in N·m obtained for each AFPMSM.
The standard deviation of the population of measured shaft torque for tested electrical machines at low- and high-speed operation was 4.56 and 3.21, respectively. The average torque of 67 AF PMSMs operating at low and high speeds was 157 and 106.7 Nm, respectively. The population’s standard deviation was computed as
where N is the number of tested AFPMSMs.
The phase-to-neutral voltage input of the motors at 500 rpm is 23 VRMS for the fundamental component and 149 VRMS including the harmonics. For the high speed point at 6000 rpm, those values are 138 VRMS and 169 VRSM, respectively. This is included in Table 2.
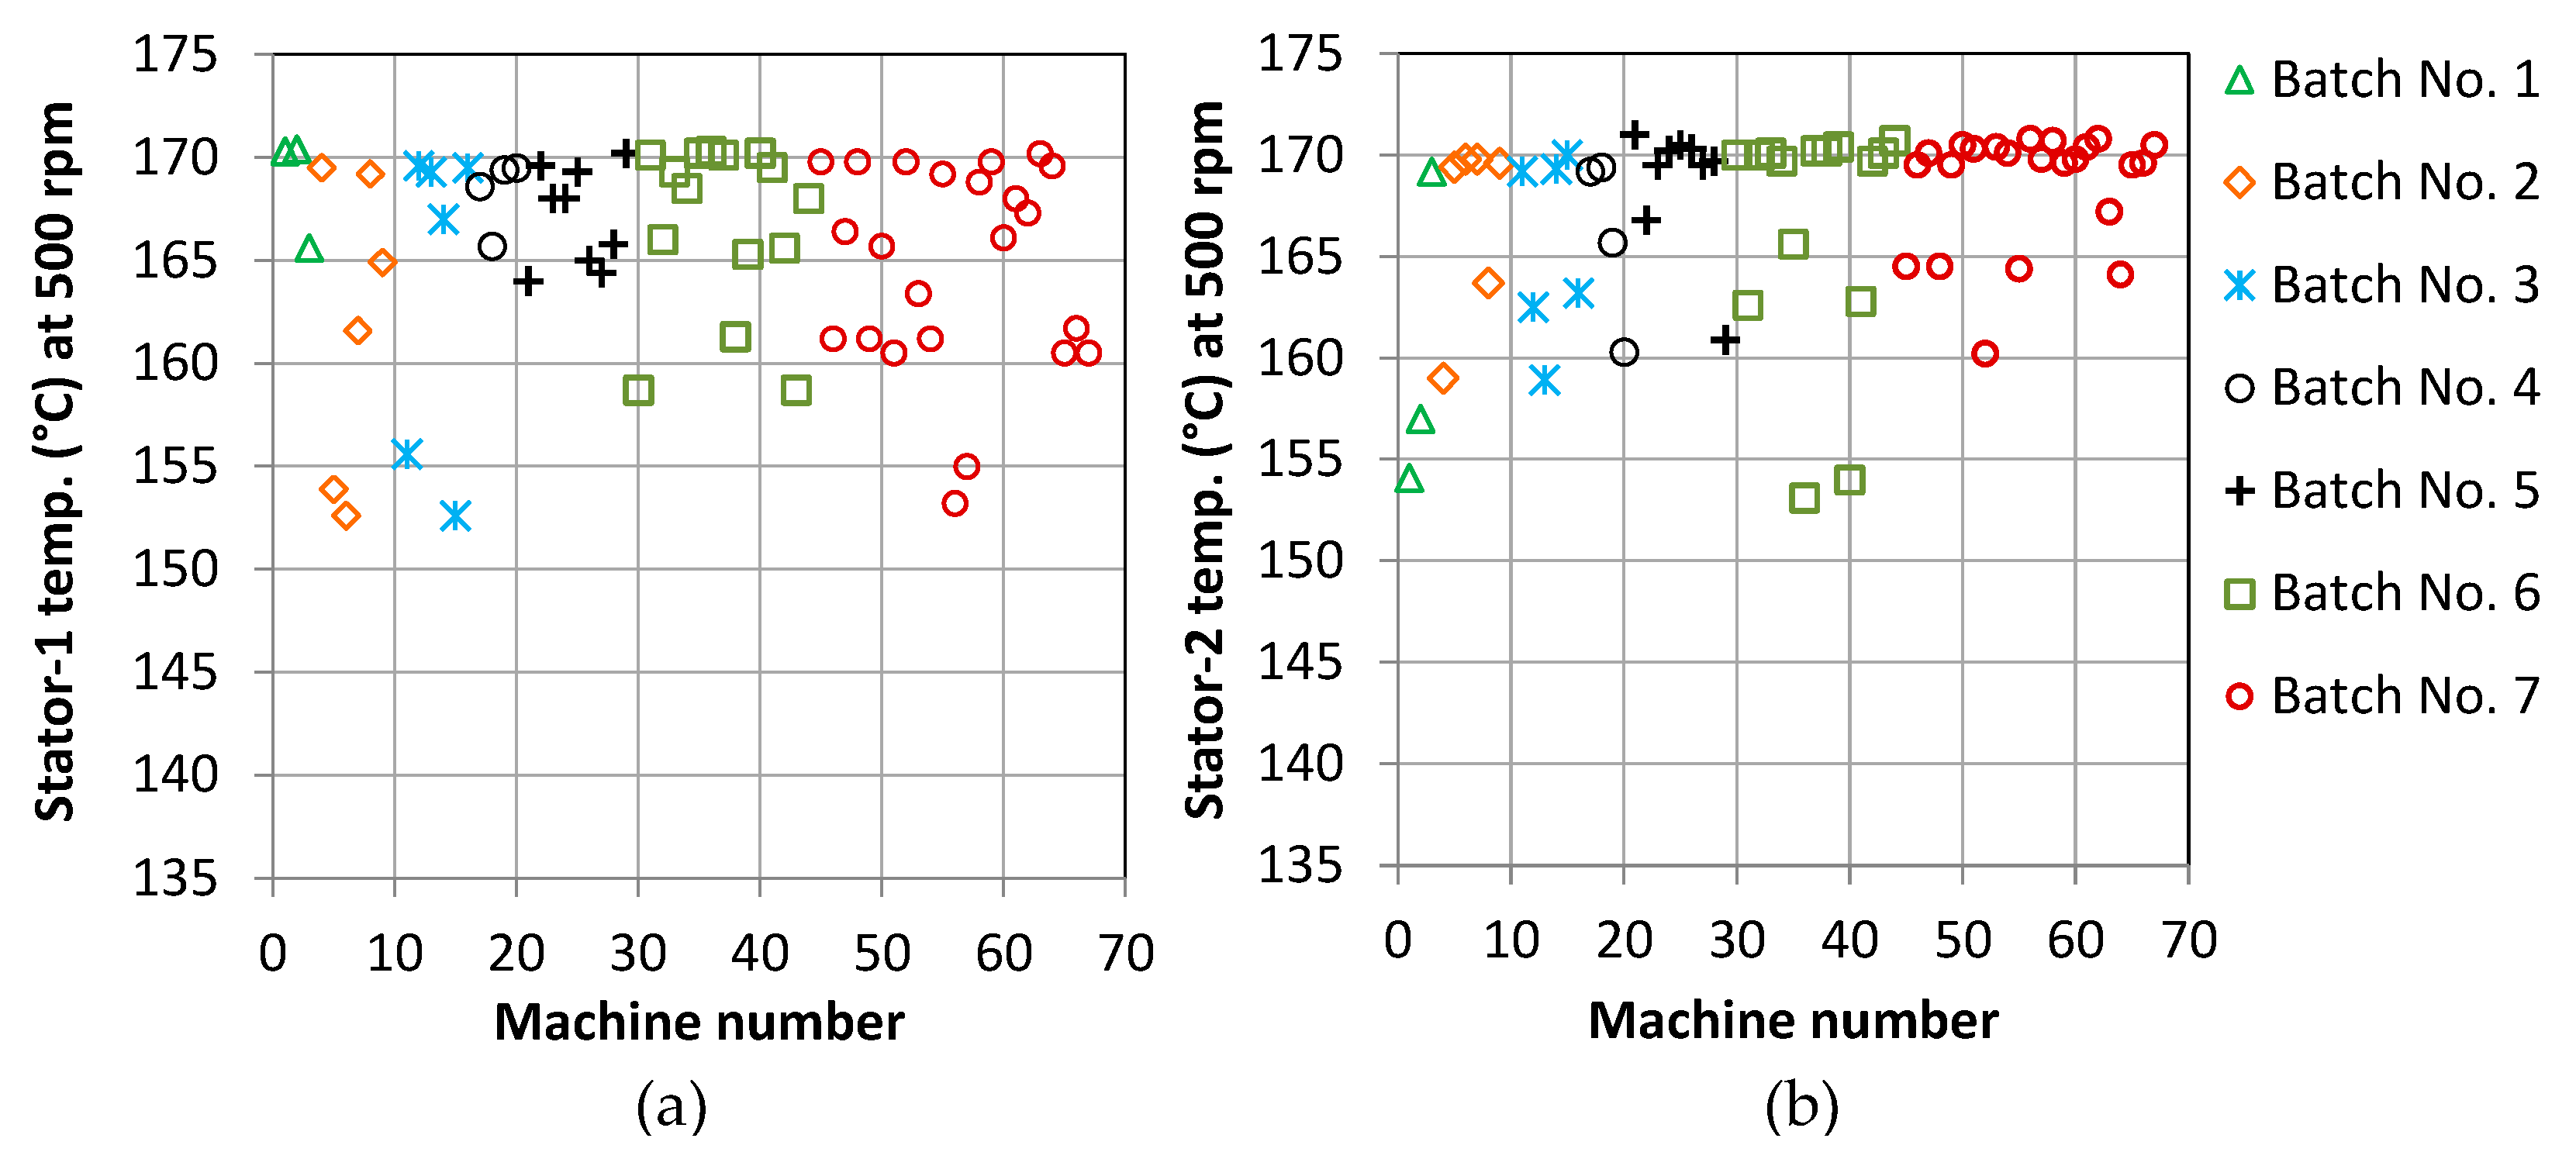
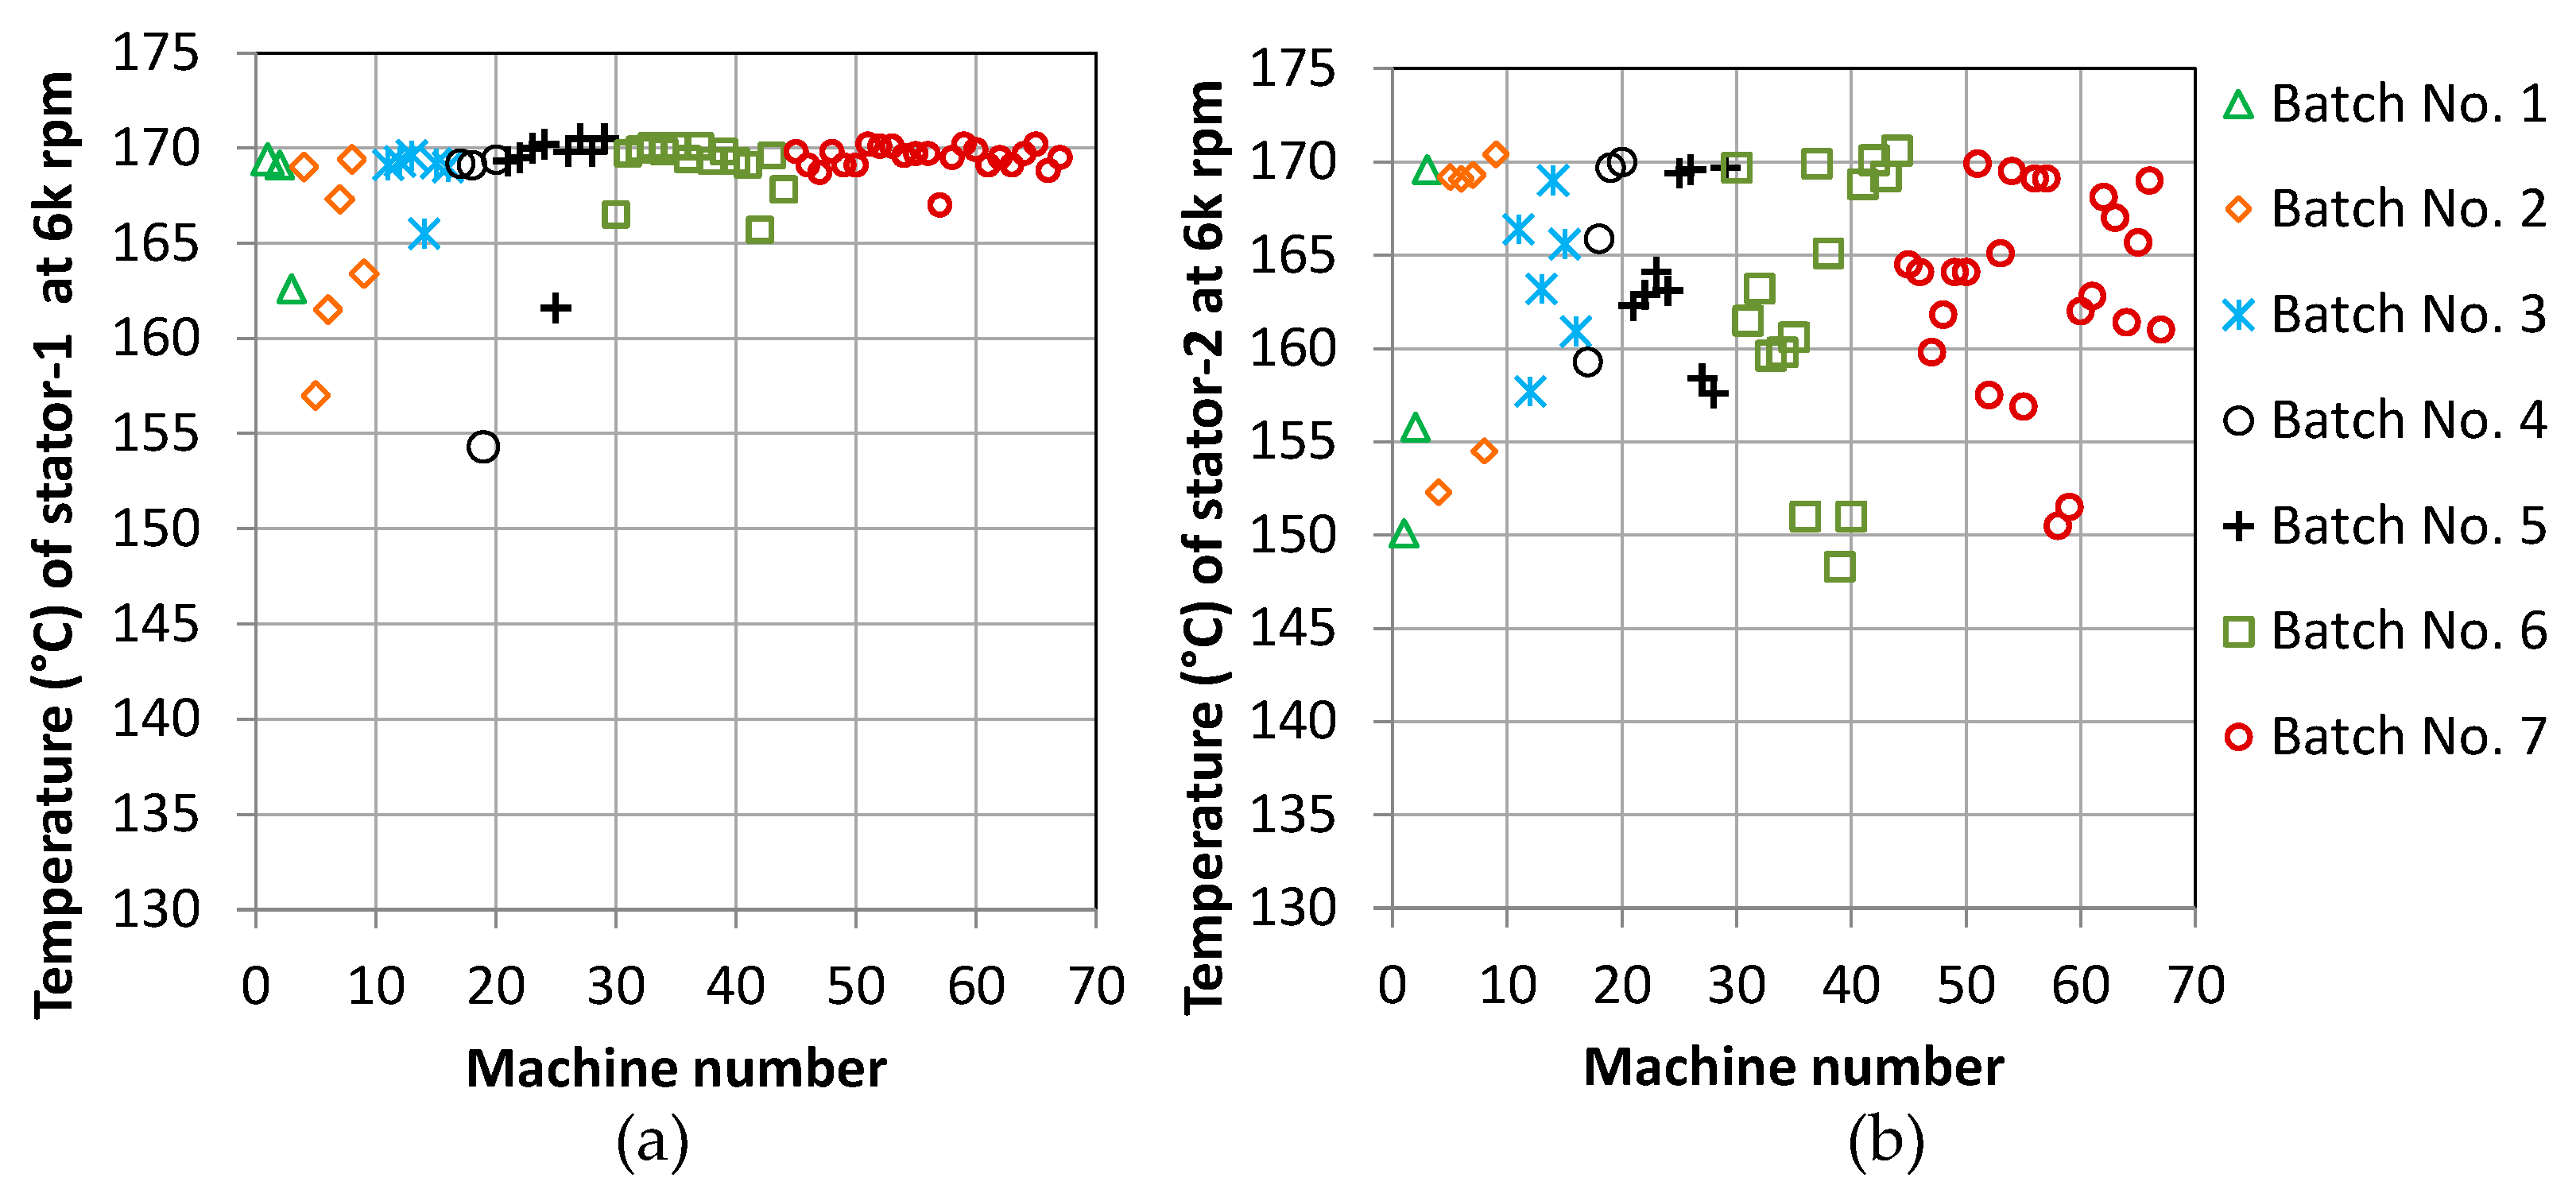
The temperature of each stator winding of an AF PMSM operating at 500 and 6000 rpm was measured using a PTSE temperature sensor (type PT100) placed in the center of the slot during manufacturing. In addition to monitoring the temperature in the winding, the sensors were also used to activate protection against overheating of the winding. For this purpose, once a temperature higher than 170 °C, with an acceptable deviation of ±1 K, was reached, the test was stopped. Thus it can be observed that the temperatures of the monitored stators for the vast majority of AF PMSMs fell within the temperature acceptability range as shown in Figure 5 and Figure 6. The difference between the stator’s windings (here designated stator-1 and stator-2) appears alarming; however, most of the AF PMSMs operated at a stable temperature. At low speeds the temperature distribution phenomena in both stators were similar in all tested batches. When one stator reached a temperature of 170 °C the temperature in another in most of the AF motors was above 160 °C. Different phenomena of temperature distribution could be seen at high speeds, where almost all AFMs reached 170 °C in stator-1, whereas the temperature of stator-2 ranged between 150–165 °C in most of AFMs.
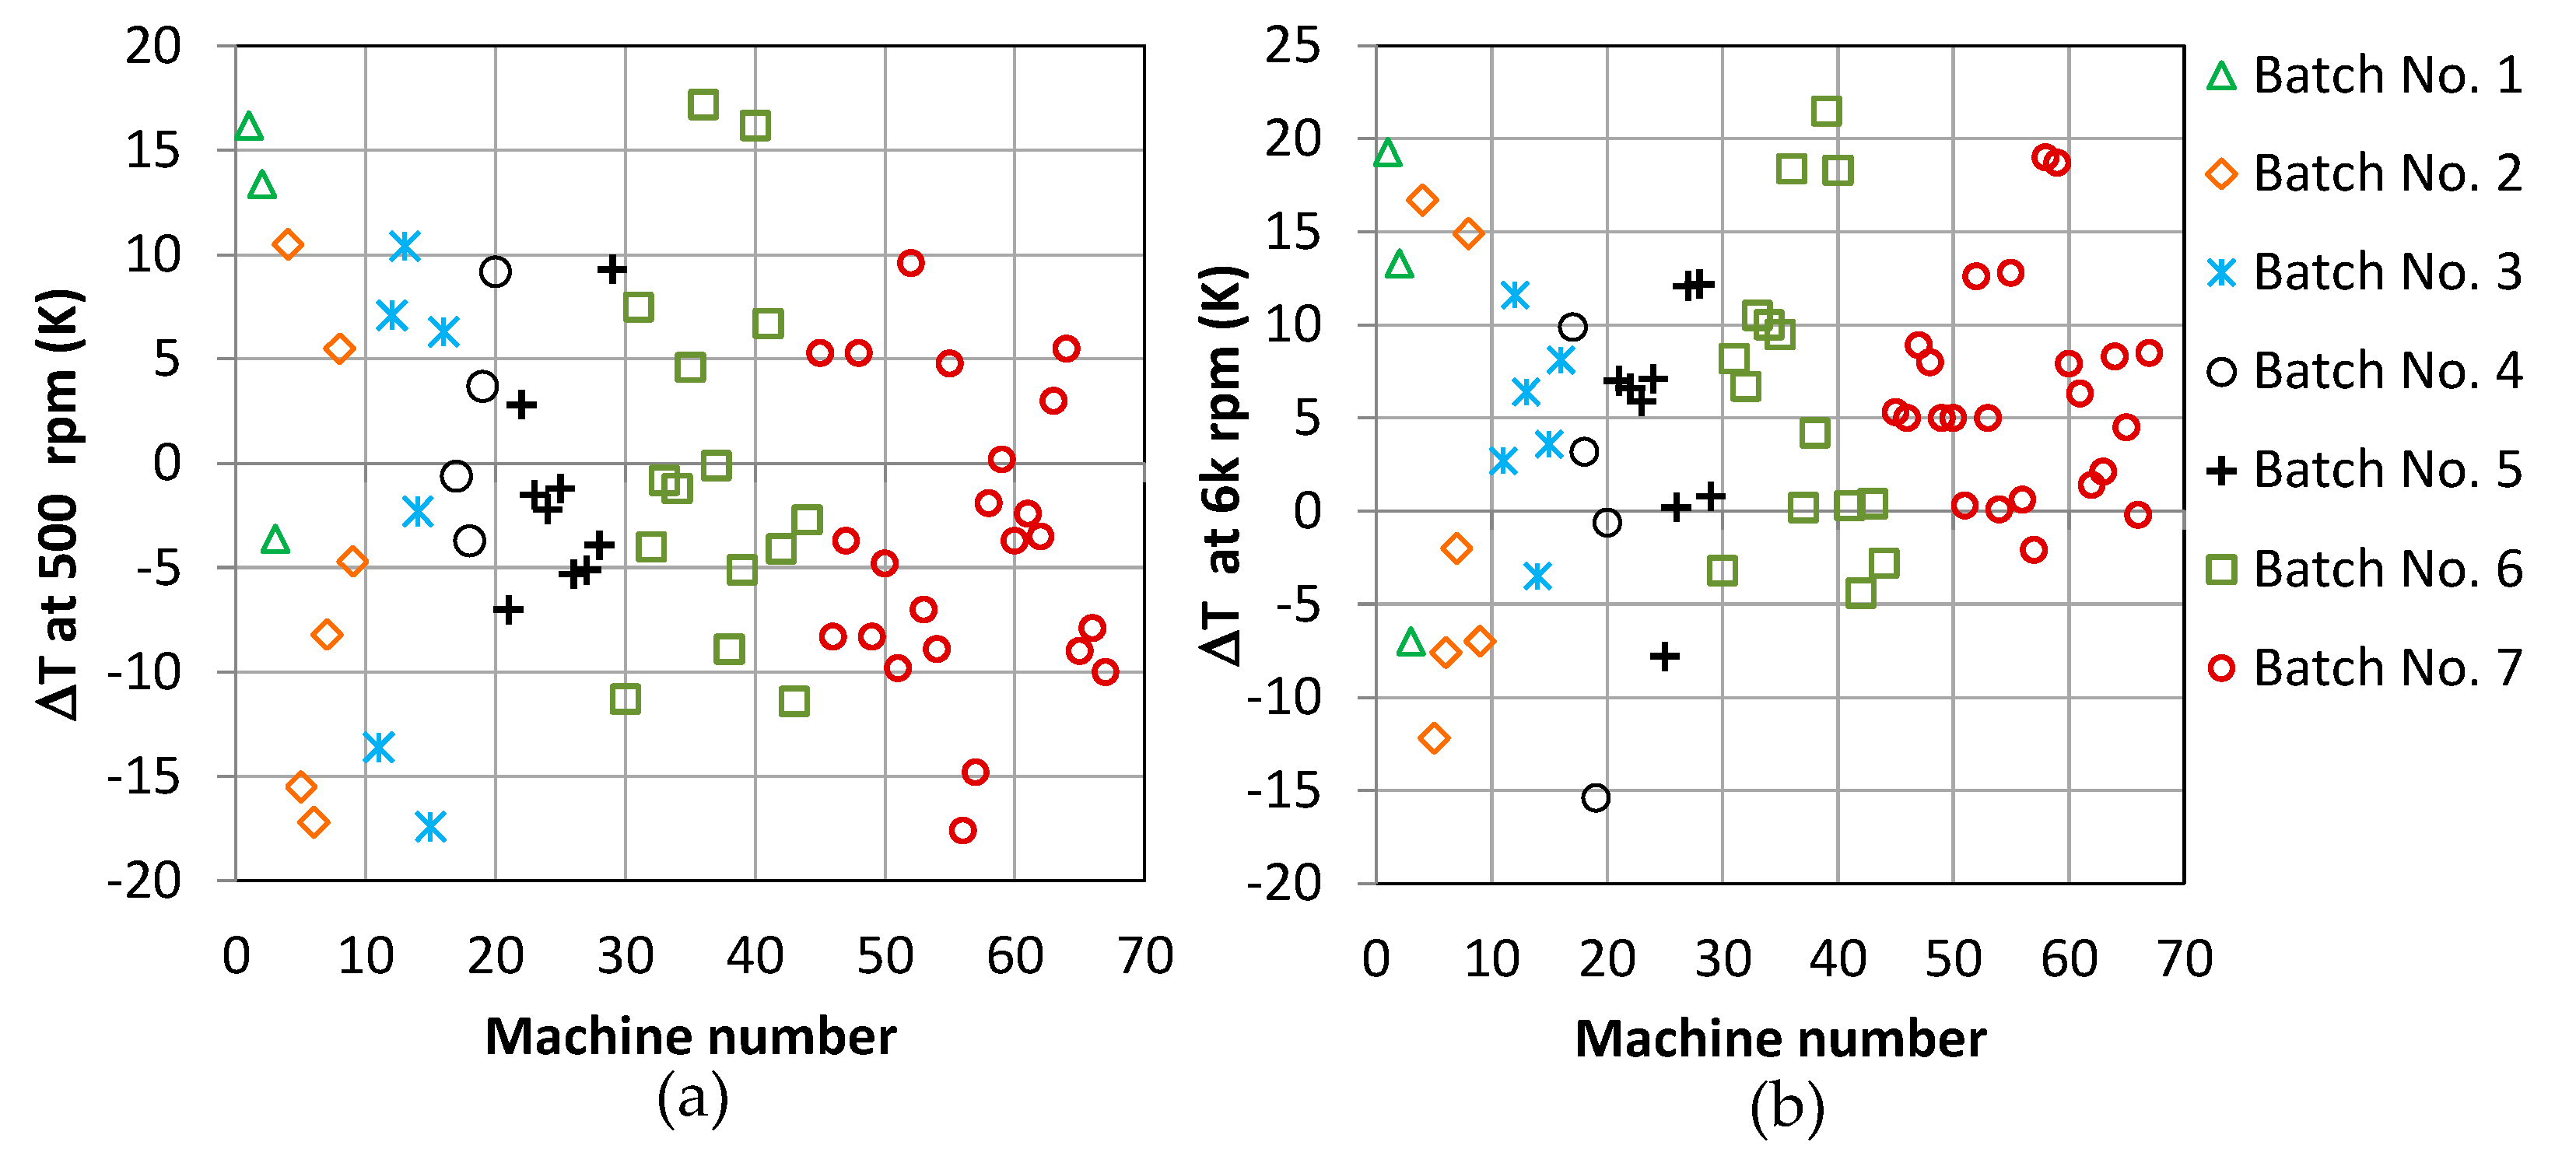
Temperature differences between stator windings are shown in Figure 7 at low and high speeds. The temperature differences related to stator-2 show which stator was hotter or colder (negative values mean that stator-2 was hotter than stator-1). The absolute temperature difference for most electric motors ranges between 0.2 K and 21 K, depending on the motor being tested. The temperature difference may be caused by an imbalanced in current (which is explained by the FEA of stator and rotor misalignment, see below). Heat may significantly increase the winding temperature, dangerously affecting the insulation of the conductors in the armature-and reducing the life expectancy of the winding. It was also observed that the front and back casing temperatures (not shown in this study) were different in almost every tested AF PMSM. Slight offsets between front and back temperatures could have been caused by the test rig itself acting as a heat sink. Other reasons for these temperature differences may include small differences in resistance between the front and back stators causing asymmetrical loss distribution within conducting regions of the AF PMSM, small differences between flow rates in the front and back casings and differences in thermal contact resistances. Additionally, marginal airflows differences in the end-winding area—close to where the sensors are placed, created a greater “cooling down” effect in one sensor than in the other. This effect explains why the differences in ΔT at high and low speeds is sometimes considerable.
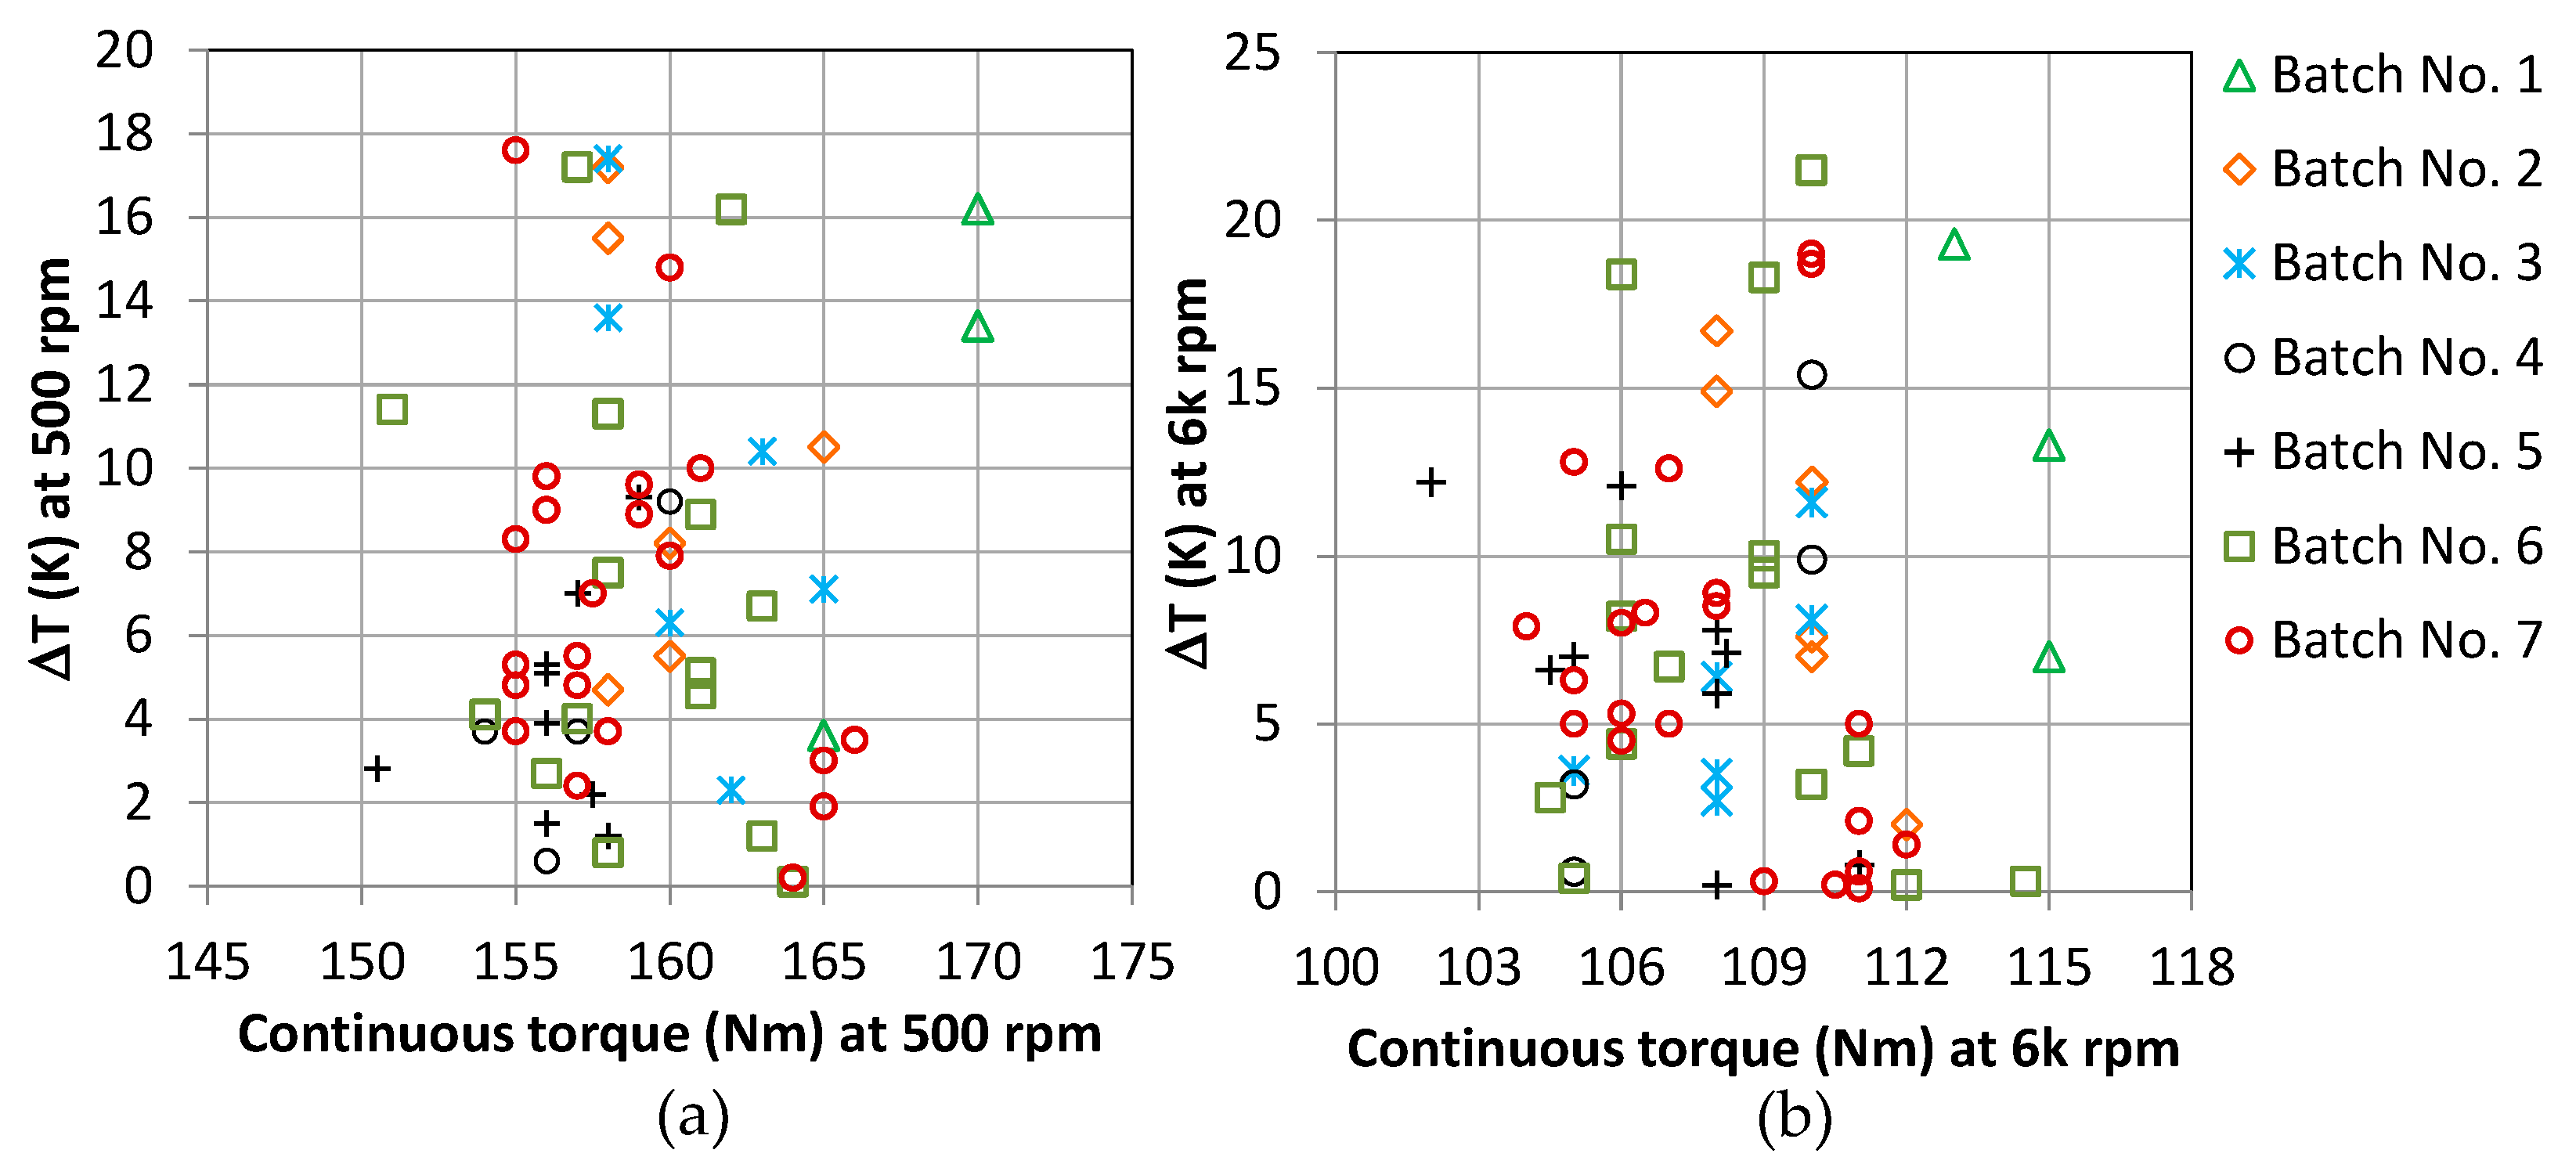
Figure 8 shows the produced continuous torque of each AF PMSM and the temperature difference between its stators. A large temperature difference can be seen at both high and low continuous torques.
From Figure 8 it can be observed that most AF motors tested have lower than 10 K temperature differences between stators. Moreover, the continuous torque range for these machines is quite narrow ranging between 155–165 Nm at low-speed, and between 105–111 Nm at high-speed. Because the manufacturing of all these AF PMSMs were the same, the level of stator /rotor misalignment was expected to be similar, making it difficult to get a particular trend in the results for this effect. The stator and rotor misalignment effects on the machine performance are shown in the next section.
Other factors affecting the AF motor performance quality aside from the assembly process are: accurate insertion of the magnets into the rotor core; manufacturing of stator cores with the same repeatability of performance; the same repeatability of cooling system operation during the tests of each AF motor batch; repeatability of the magnetizing processes and air-gap eccentricity.
5. Electromagnetic Finite Element Analysis of Misalignment Effects on Stators and Rotors
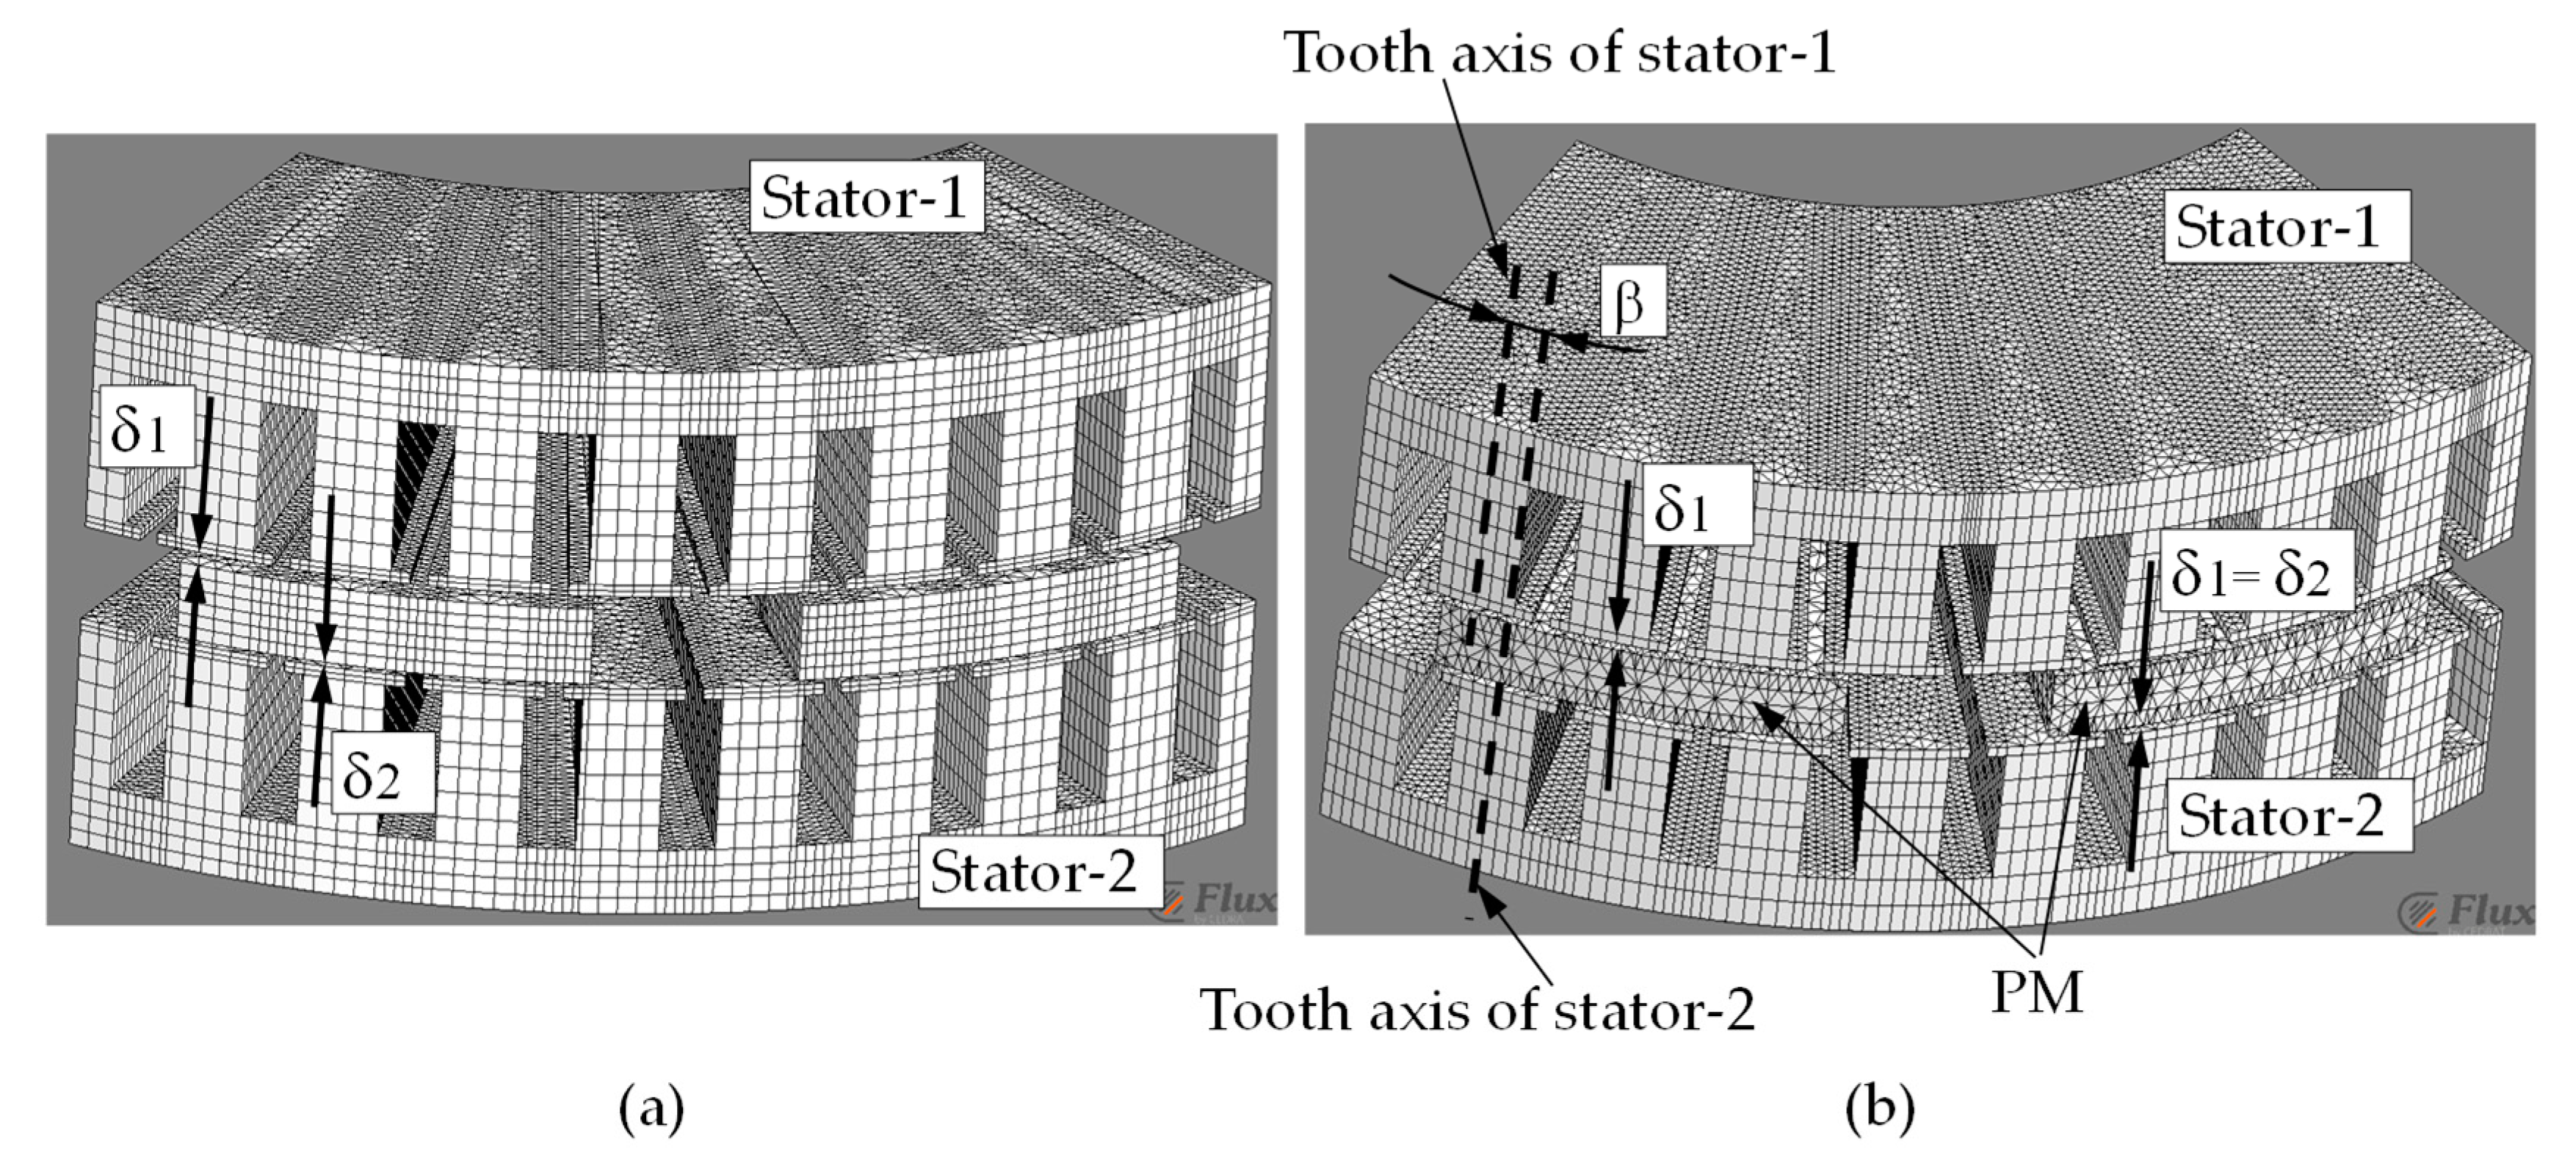
Information concerning machine behavior derived from the measurements will help to improve the procedure of assembling the motor’s elements. In order to explain the difference in the parameters of the monitored electric motor, a motor sensitivity study was conducted (using numerical models based on a 3-D finite element model (FEM)) the results of which helped to define the elements of the tested motor that had to be redesigned in order to improve the AF PMSM performance characteristics and increase the motor’s lifespan. Two potential machine faults, rotor misalignment and stator misalignment, are depicted in Figure 9.
A non-linear 3-D finite element analysis (FEA) was conducted in order to investigate the machine’s parameters [32]. Due to periodic symmetry, only 1/5 of the complete motor cross- sections was modeled circumferentially. Due to the phenomenon of misalignment effects, it was not possible to apply symmetry in the axis direction of the AFM. In the transient analysis, the three-phase stator winding was fed by sinusoidal waveforms. Moreover, a three-dimensional FEM was undertaken in order to account for the end-effects as well as for radial segmentation of the permanent magnet. For eddy-current loss reduction within permanent magnets the AFM was designed with five segments of permanent magnets in the radial direction.
Rotor misalignment was characterized by unequal mechanical air-gap lengths and , with uniform eccentricity as shown in Figure 9a. This defect was due to manufacturing tolerances and compliances in the bearing system that supported the rotor between the two stators, whereas stator misalignment was characterized by an angular offset (β) between the two stators, as illustrated in Figure 9b. In this investigation of misalignment effects, the air-gap offset ranged between 0.05–0.6 mm, stator angular offset ranged between 0.25°–2° mechanical degrees. The air-gap offset was normalized (δN) using the following equation:
where δ is the designed air-gap. Moreover, the stator offset was related to electrical degrees. In a case when the AFM showed no stator and rotor misalignment effects, the air-gap lengths were equal () and the angular offset of the stators was β = 0°.
Analysis of motor characteristics was carried out using magneto-static and transient FE methods with 3-D formulations based on Maxwell’s equations. In order to clearly explain and present the impact of misalignment effects on motor performance, the thermal condition in the FEM models was set as a constant, and the operating temperature of magnets, iron, and winding was set to 25 °C.
Table 3 presents a comparison between the predicted and measured torque constants of the selected AFM prototype motor. The selection concerned the machine with the least differences between the temperature of both stators and which generated the required torque. The differences seen between measurements and FE analysis can be caused due to different temperature distributions in prototype and FE model, and also the higher flux density distribution is suspected in the prototype motor due to misalignment effect caused by air-gap offset. Moreover, the torque measurements were performed on the shaft, and this is valid as an approximation of the electromagnetic torque if rotor losses are neglected. The latter is a fair assumption as this rotor design has no iron core and the agreement is good, thus validating the FE models used for performance prediction. Based on this agreement, it can be concluded that the selected machine was free of any misalignment effects. The computed and measured values of line-to-line voltage constant and synchronous inductance were 0.616 and 0.62 V·s/rad, and 210 and 231 μH, respectively.
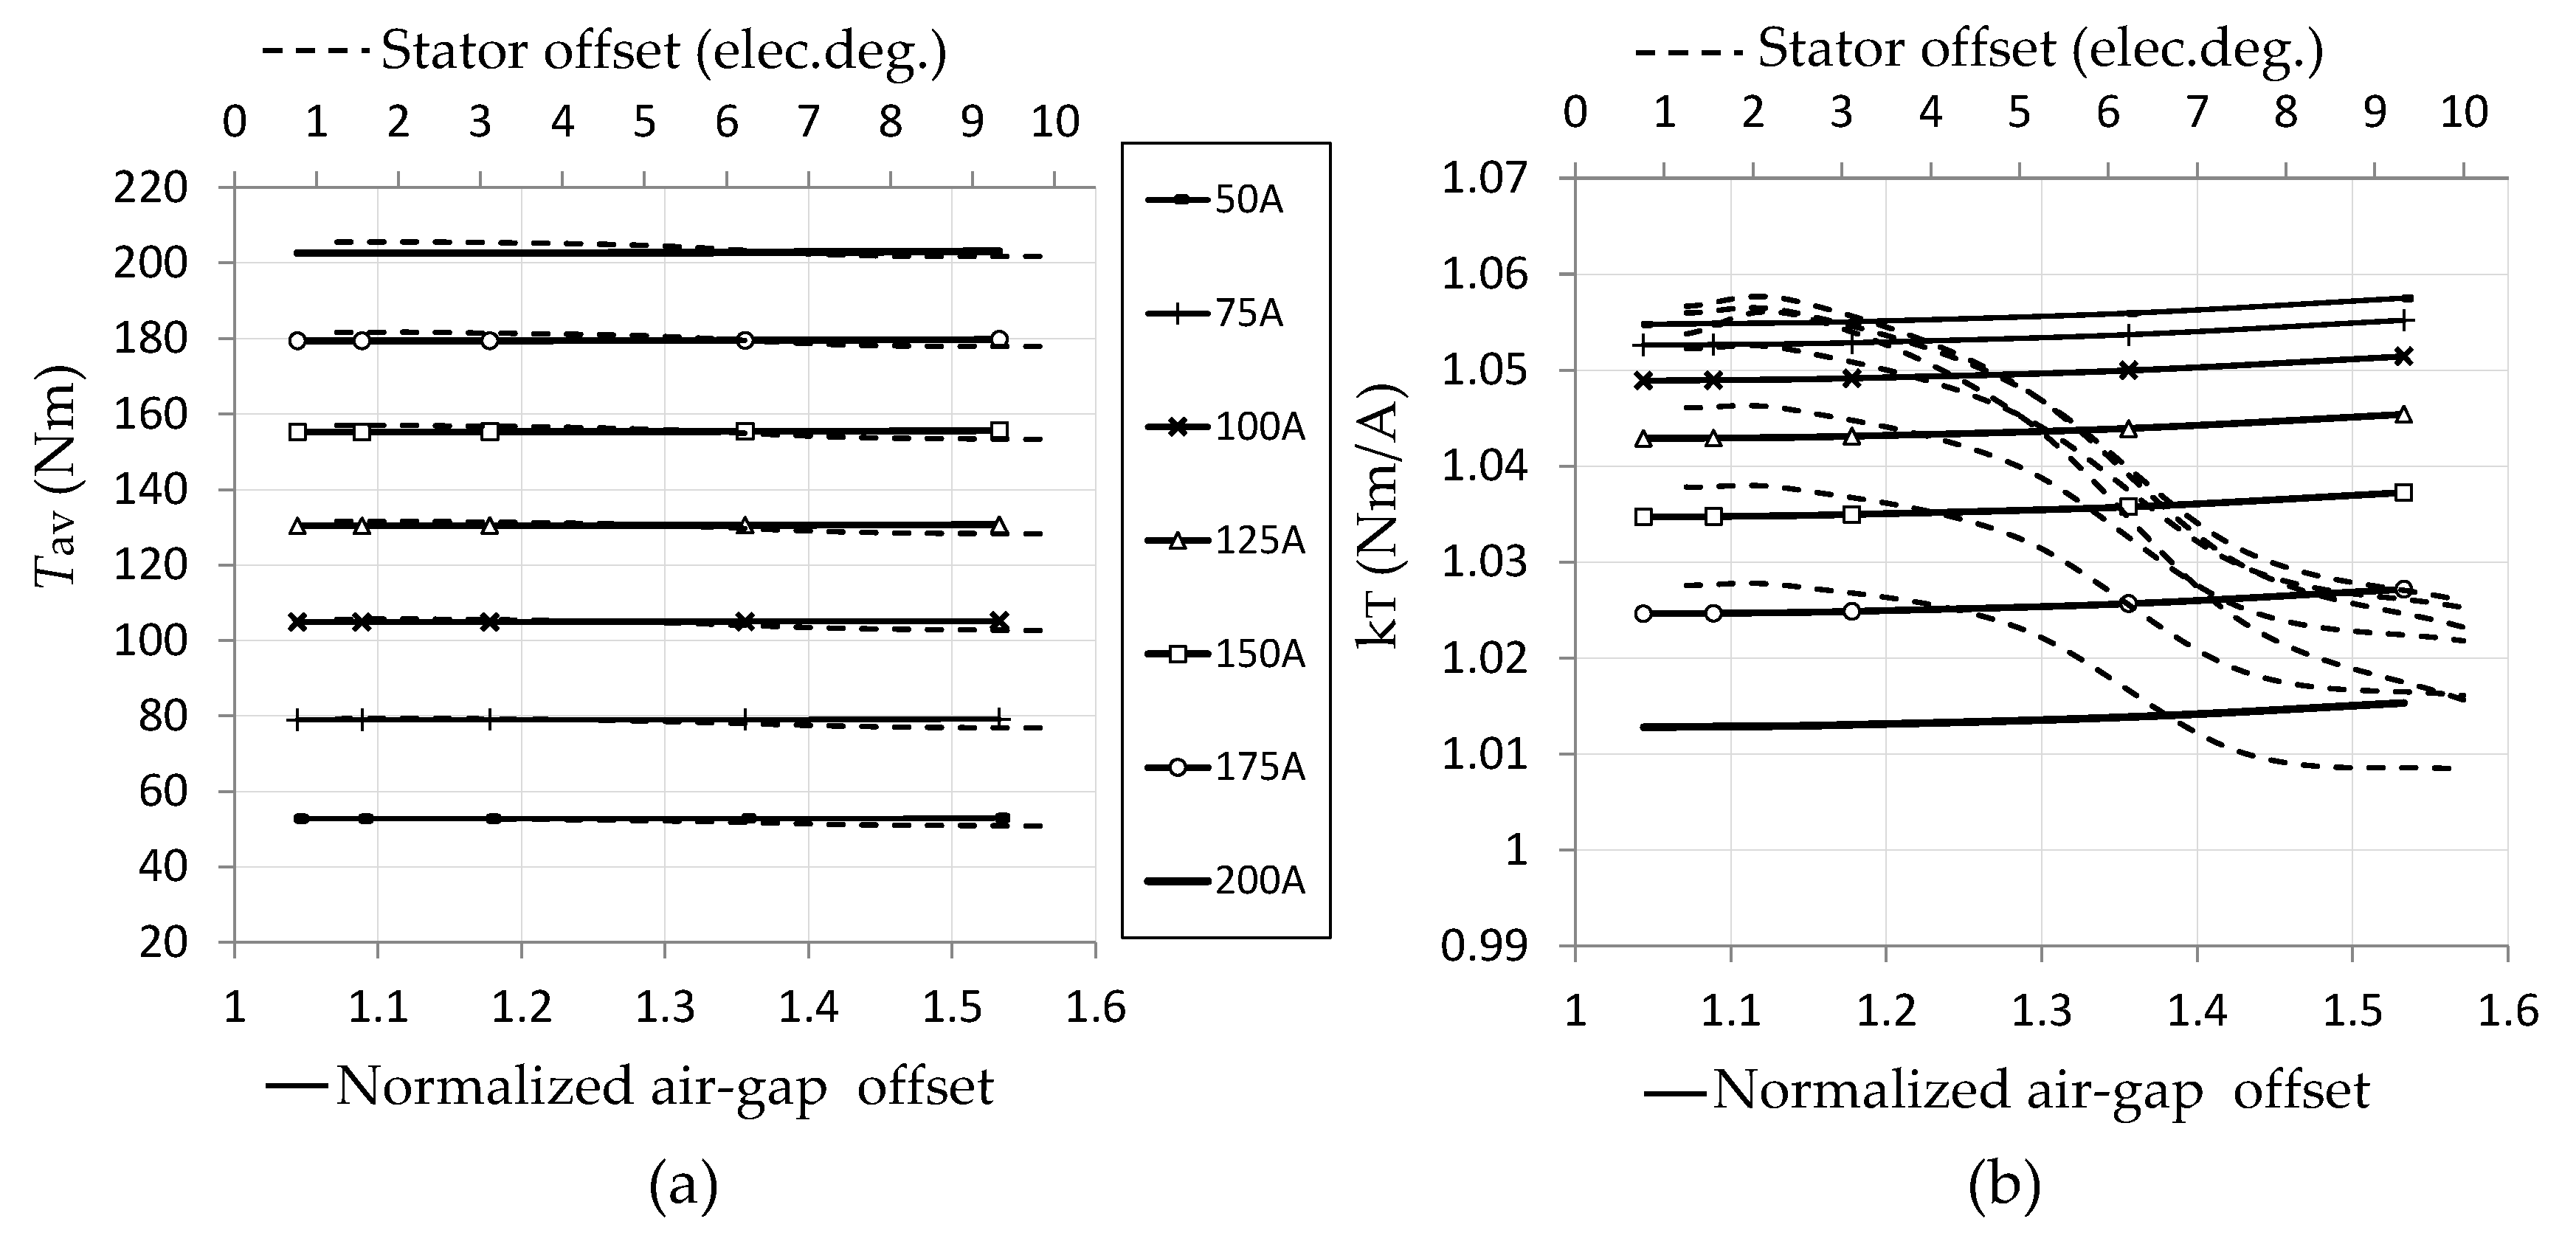
In the numerical calculation (presented below) of rotor/stator misalignment, the resistivity of electric motor materials was assumed as a constant value at 25 °C. If rotor losses are neglected and therefore shaft torque approximated with the electromagnetic one, Figure 10 represents the average values of the electromagnetic torque and torque constant calculated for each geometry asymmetry in the AF PMSM. is calculated using the virtual work method, which is based on stored magnetic co-energy change with a small displacement θ. equals the derivative of the magnetic co-energy with respect to angular position at constant current, expressed as follows
Figure 10b shows the variation of kT with both AF PMSM defects, leading to the changes in torque constant. The effects of rotor and stator misalignment increases and reduce kT, respectively. Based on the calculations, the slope of the motor’s torque-current curve, which can be determined from the torque constant, was changed to 1.57% and 5.6%, respectively, due to the rotor and stator offsets.
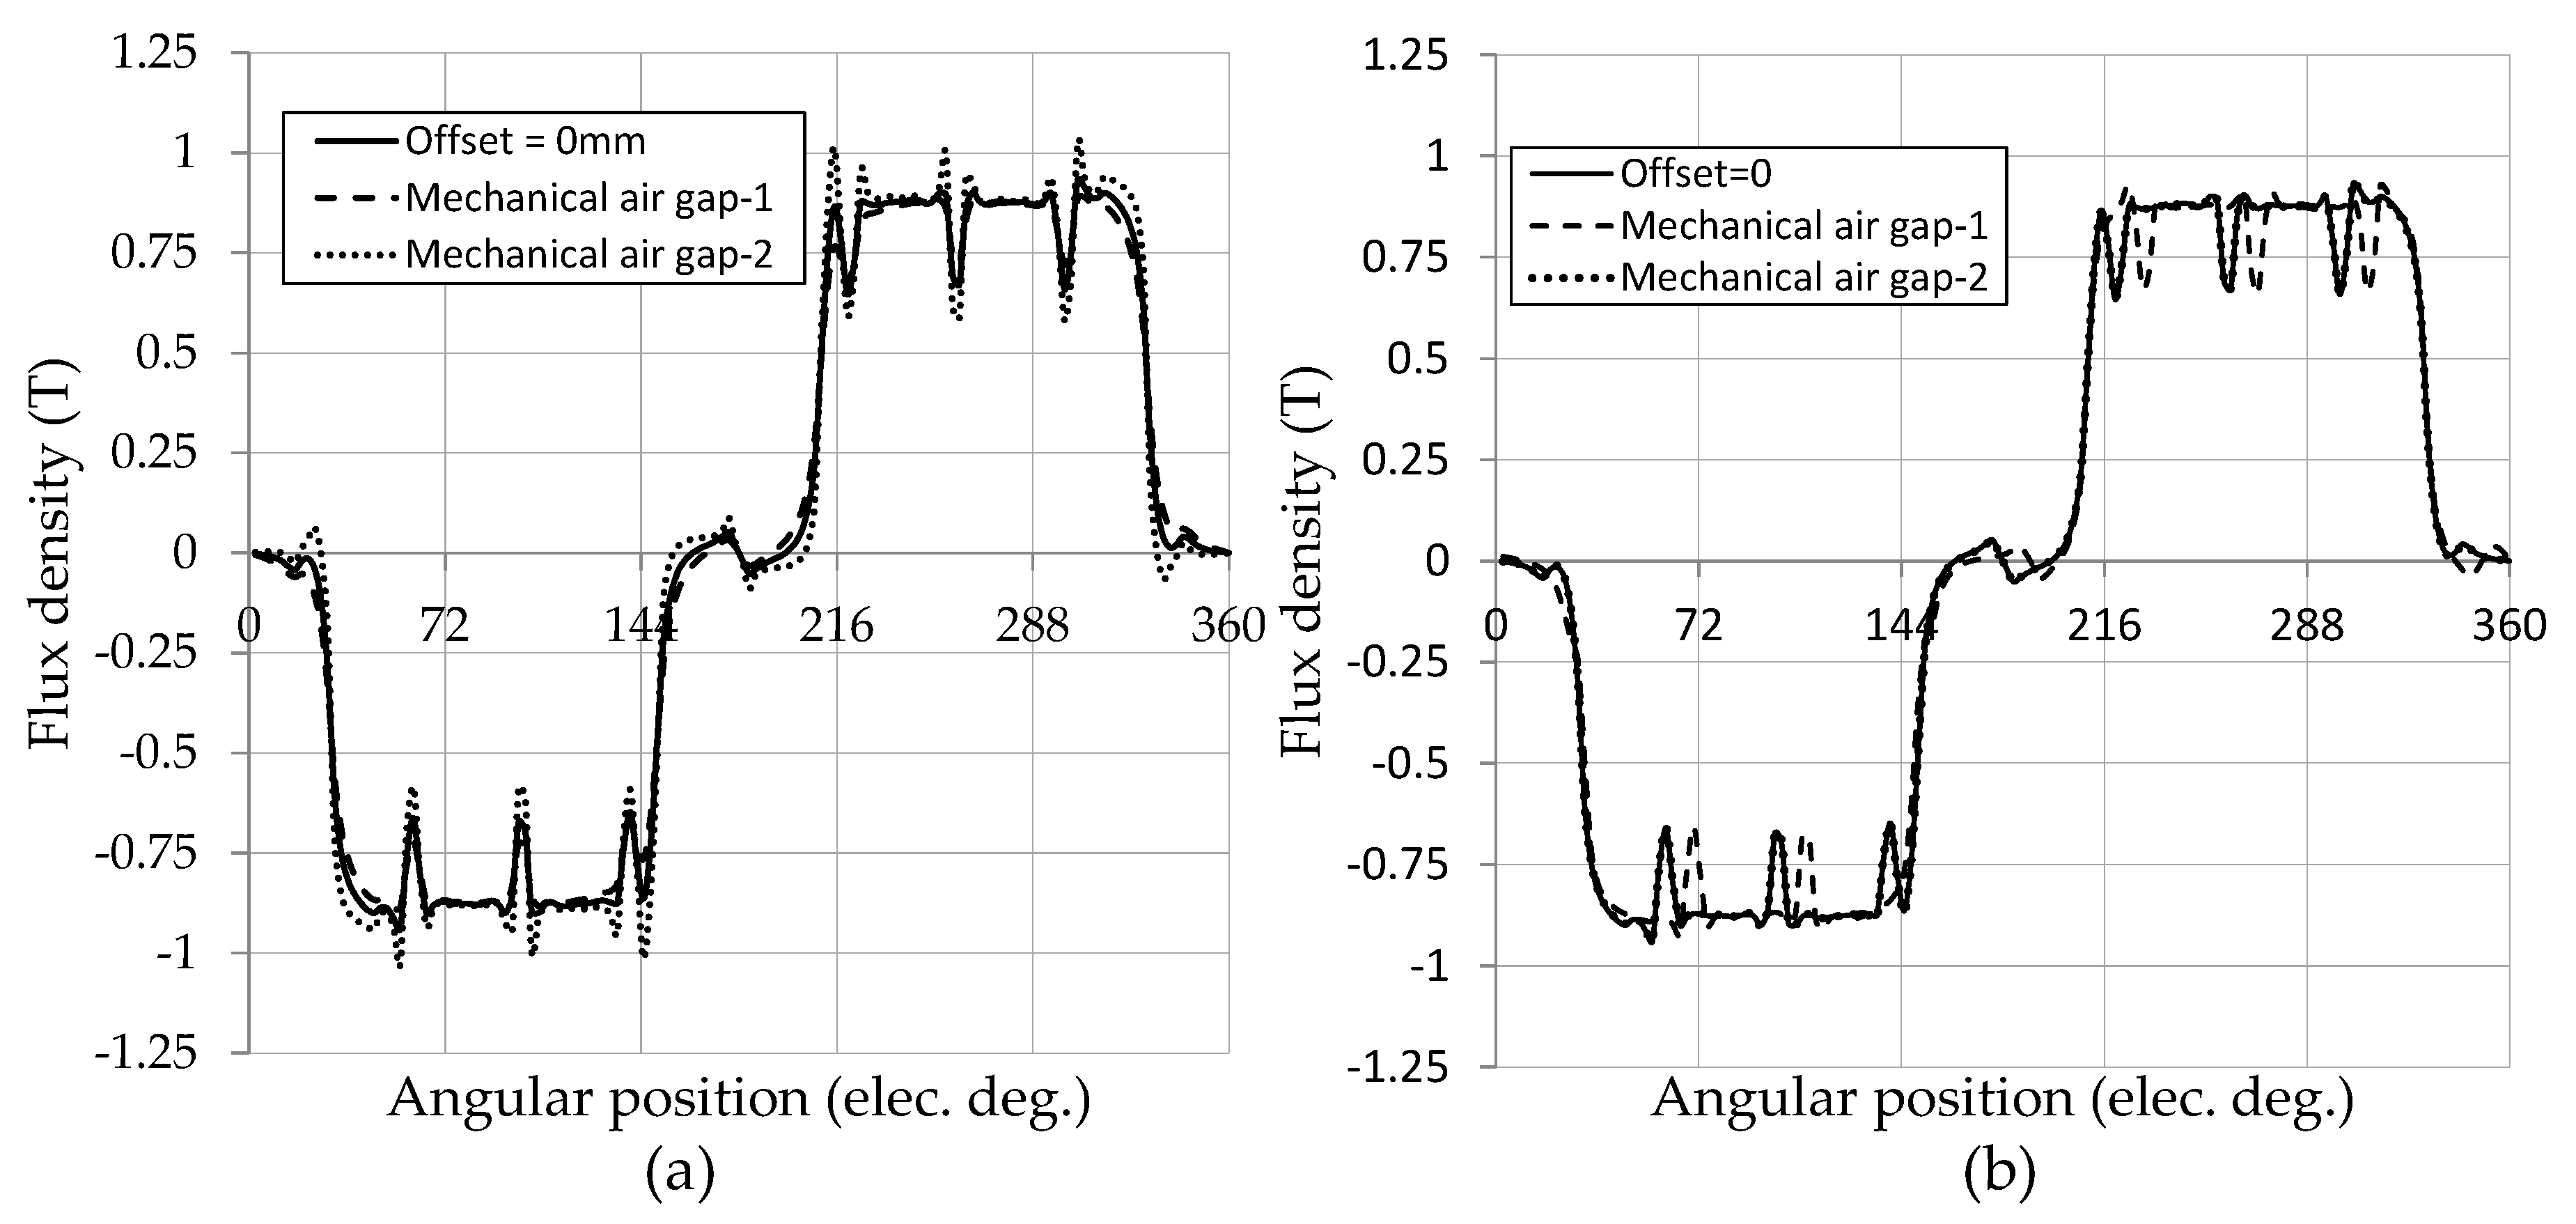
Changes in torque computed in Figure 10 may have been much larger due to unequal temperature distribution in the stator winding caused by rotor misalignment. The temperature changes may have been caused by unequal leakage flux, resulting in unequal amounts of flux in the air-gaps on either side of the rotor, Figure 11. This is an important characterization, as this unequal flux magnetic distribution in the stators must be accounted for in the AF PMSM design in order to reduce the magnet demagnetization risk caused by increases in temperature and to reduce eddy-current losses.
In Figure 11a, the length of the mechanical air-gap between the stator and magnet has a significant effect on the distribution of the magnetic field in the middle of the mechanical air-gaps. It can be concluded that the AFPMSM with the air-gap offset is characterized by a more pronounced peak than the machine with an equal air-gap. The smallest air-gap significantly increased local minimums and maximums.
In the case of stator misalignment with 10 electrical degrees of stator offset, the z-component of the flux density field through the mechanical air-gap leads to marginal changes in local minimums and maximums caused by slotting effects by the stator offset, which are shifted when the stator offset is increased, Figure 11b.
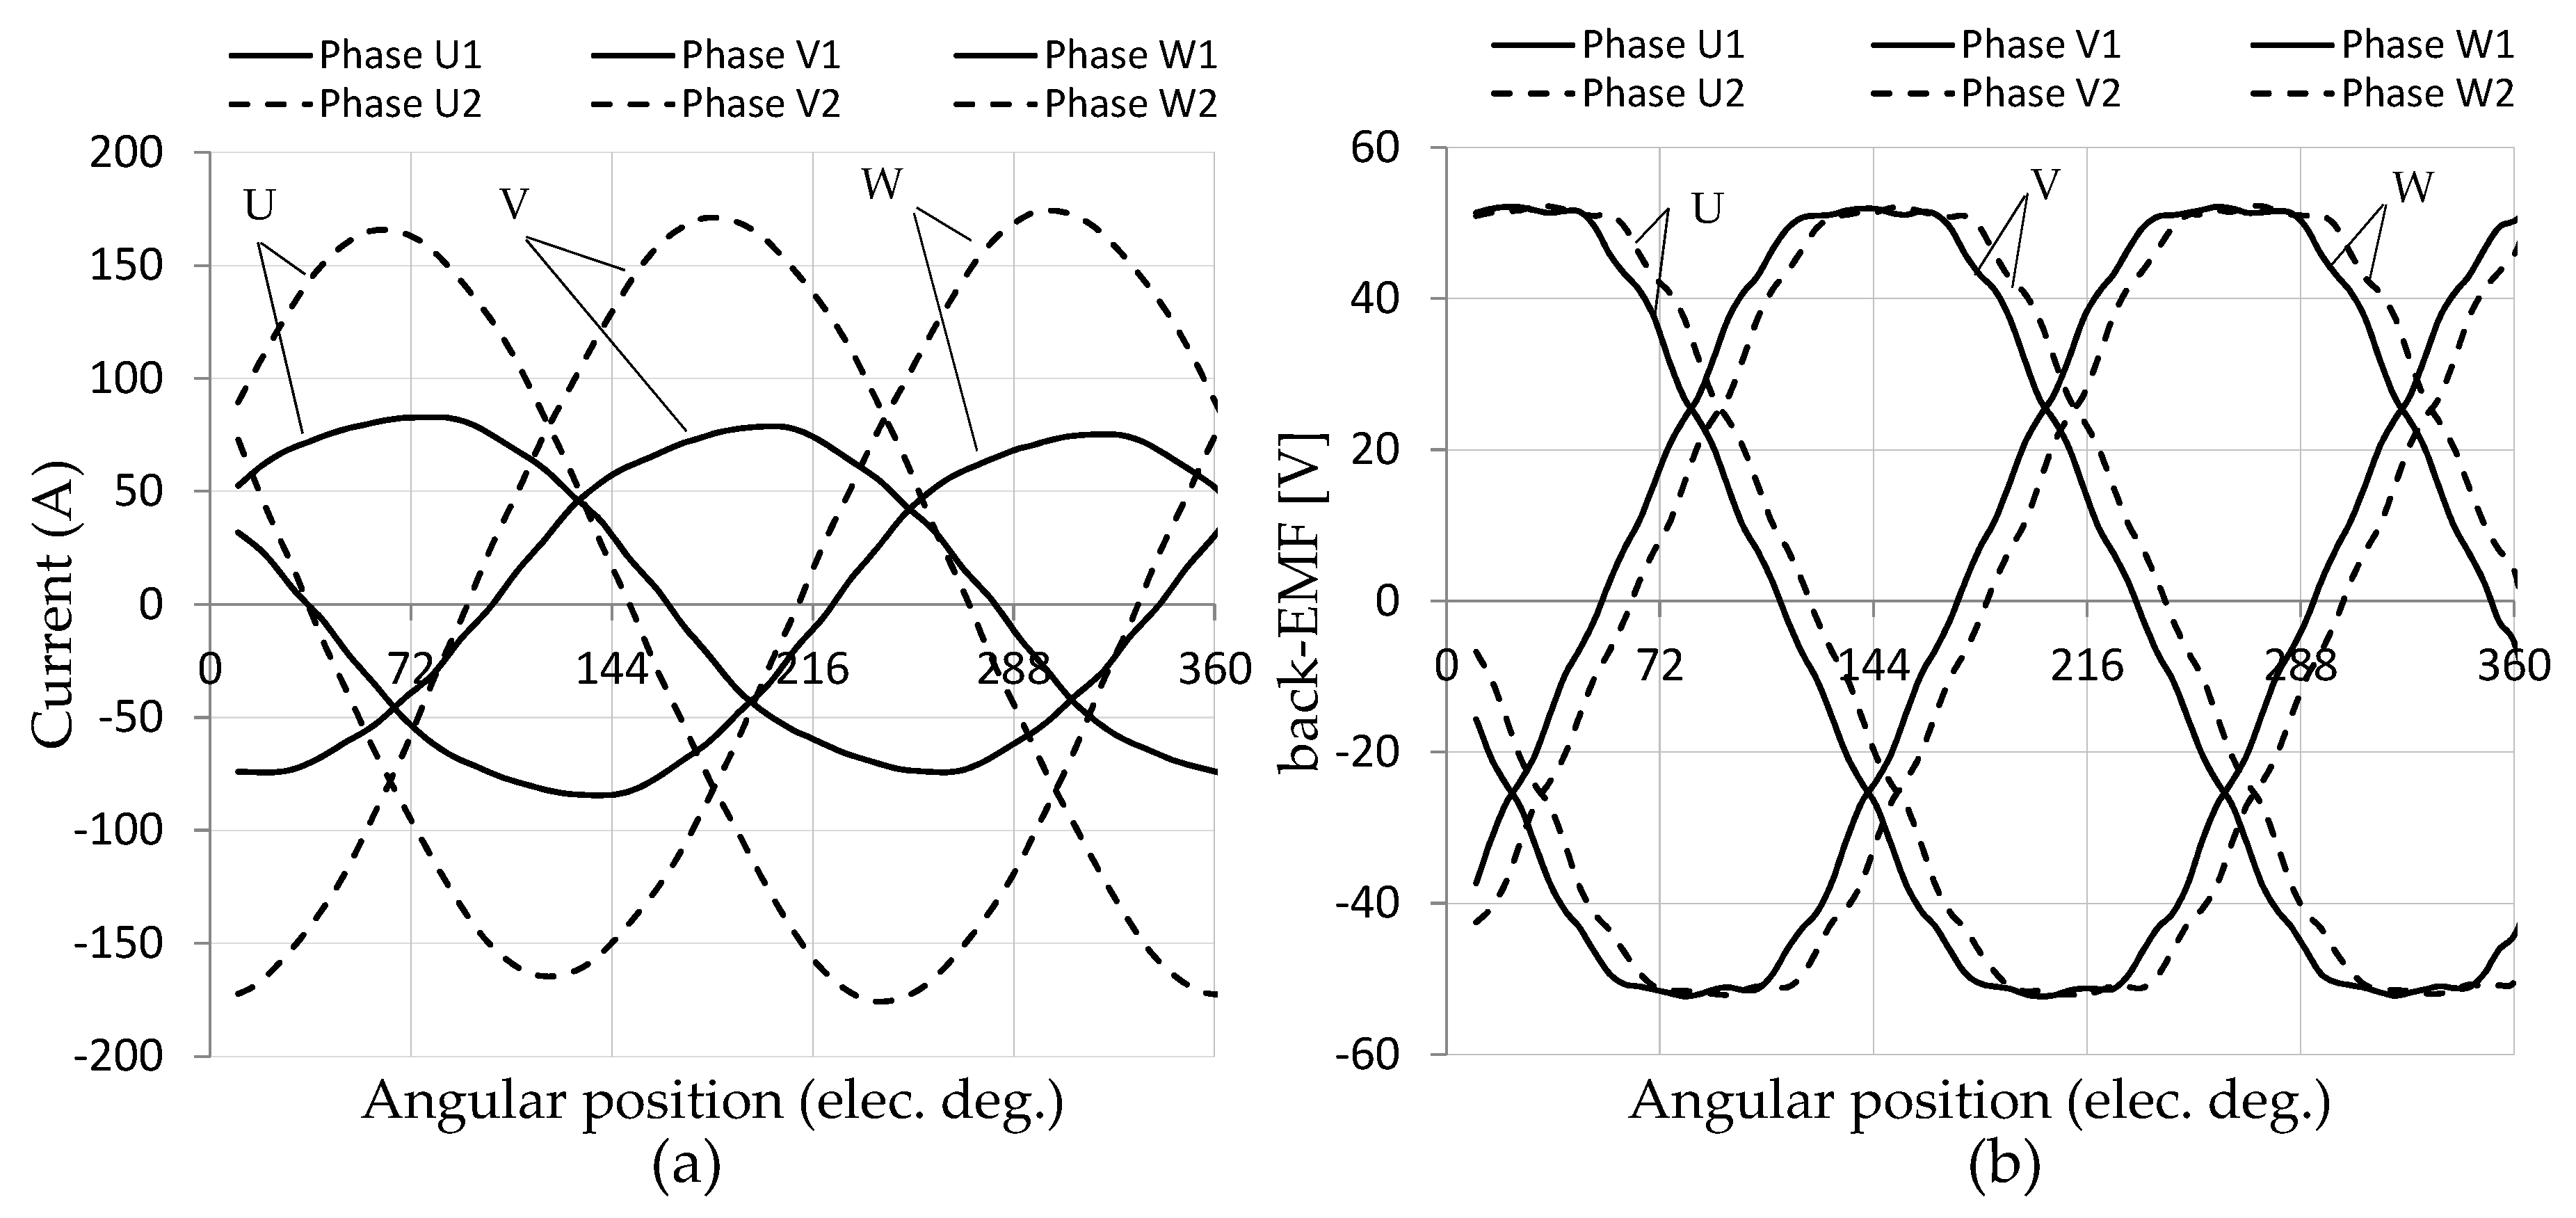
Moreover, in one stator misalignment, a large phase current imbalance was found, Figure 12a. This was caused by the phase offset in the back-EMF, which in turn was a direct result of the stator misalignment fault, Figure 12b.
It can be observed that any small difference between voltages will result in circulating current. This is an important characterization, as imbalanced currents may cause unequal heating of the stator windings, causing one stator to reach its thermal limit before the other. This happens when recirculating current adds to the current in one stator and subtracts from the current in the other. Note that the voltage imbalance is not a power quality issue in the sense of the harmonic components of the electrical supply (or a transient related topic).
From Figure 12 and Figure 13, it can be concluded that the performance difference measured in the many AF PMSMs may have been caused by stator offset. It can also be concluded that the accumulation of assembly errors or tolerance stack may also cause voltage imbalance.
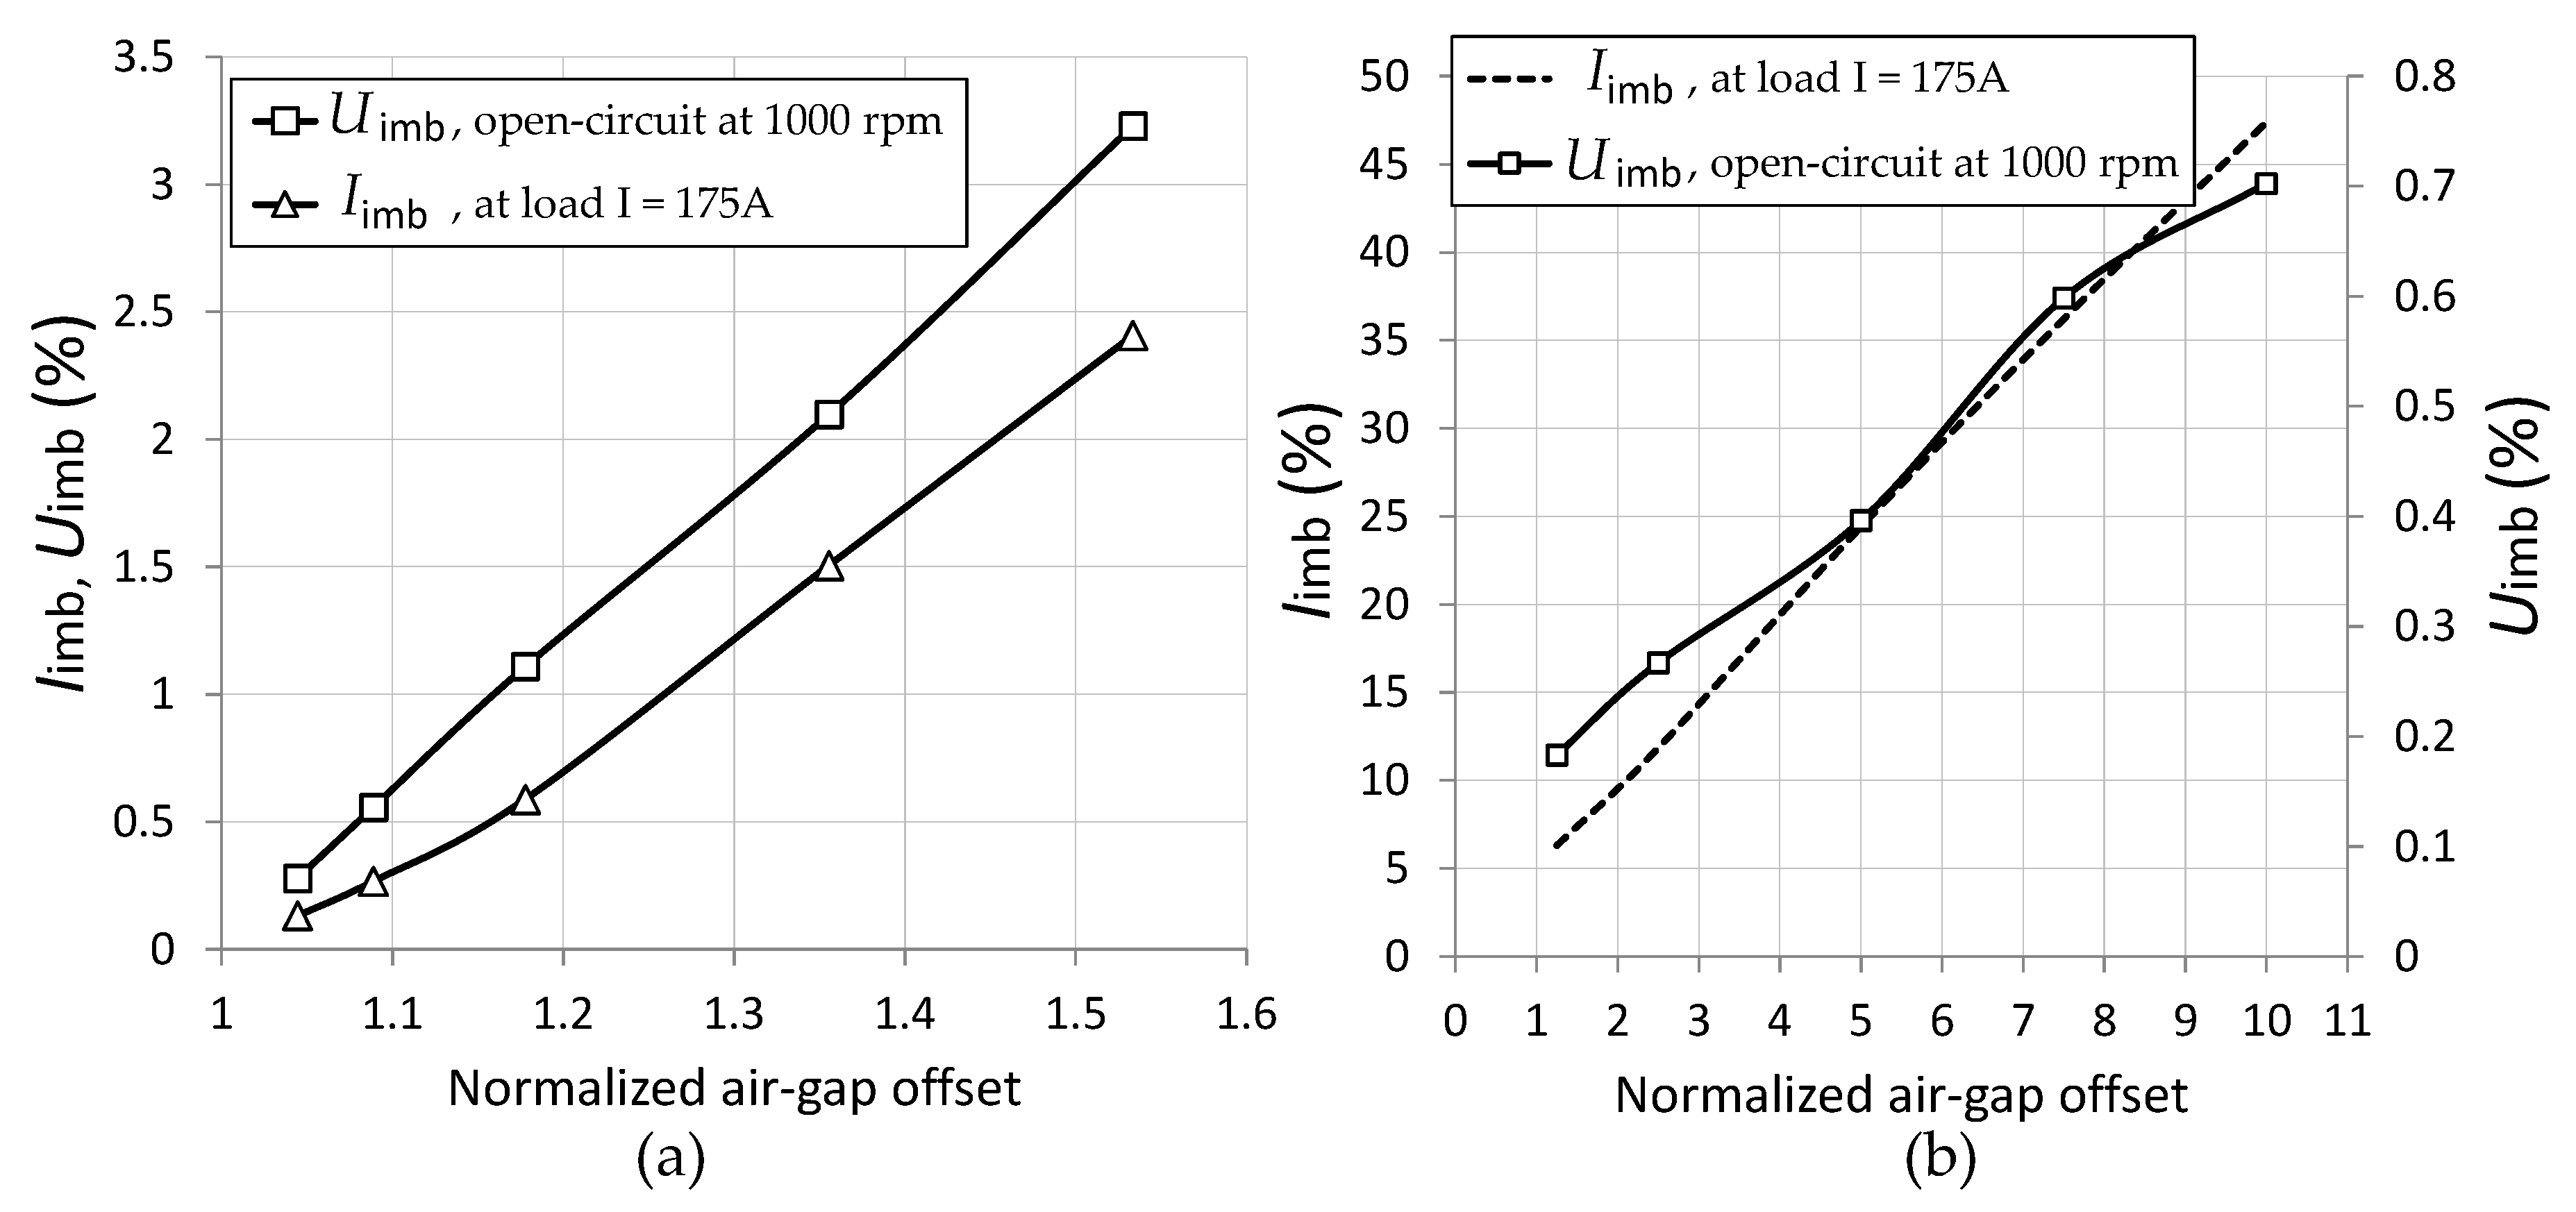
In Figure 13 it can be observed how much the imbalance current and voltage can increase with stator and rotor offsets. To reduce the risk of voltage imbalance occurrence, the assembly procedure of the AF PMSMs must be executed with high accuracy in order to eliminate stator misalignment effects.
The magnitude of current imbalance is much higher than the voltage imbalance, Figure 13b. For analyzed AF PMSMs, the phase current was imbalanced up to 47% at 175 A, and increased with the load current up to 140% at 350 A [23]. In the case of rotor offset, the imbalance voltage was no higher than 3.5%. The current and voltage imbalance is computed as [23]
where Iw1, Iw2, Uw1, and Uw2 are amplitudes of current at load condition and line-to-neutral voltage at open circuit, respectively, in the W phase of stator-1 and stator-2, and Iref and Uref are the phase current and back-EMF voltage, respectively, for a machine free of any stator/rotor misalignment.
6. Conclusions
The application of AF technology to hybrid vehicles can offer significant increases in torque and power over conventional technologies. From the results of measurements and numerical calculations, it can be concluded that the development of new electric motors requires analysis of the impact of assembly tolerances on motor performance. According to measurements, several axial flux motors can be identified in each batch of electrical machines, in which the highest temperature difference between winding stators was found to be generated in those motors at both the highest and lowest continuous torque (compare Figure 3, Figure 6 and Figure 8, at both low and high speeds). The rest of the motors operated within a narrow range of continuous torque variability. From FEA, it was found that the misalignment effect that occur in AFMs lead to imbalanced current and voltage. These unwanted effects can lead in turn to unequal temperature distribution, degradation of winding connections, and degradation of iron sheets in AFMs. If an AF PMSM is sensitive to manufacturing tolerances caused by stator/rotor misalignment effects, imbalanced temperatures in both the stator and rotor may be encountered more frequently, along with unexpected changes in motor performance.
The observed differences in temperature could also be caused by the level of precision in the equipment used, in inverter hardware changes, inverter set up, changes in machine load or torque measurement equipment, or production quality of a batch of AFMs. Moreover, the measurement method may also influence measurements, leading to, e.g., calibration errors, uncertainty in historical measurements, and uncertainty in the flow rate of cooling.
Author Contributions
All the authors have contributed significantly. Conceptualization, A.M.; methodology, A.M.; validation, J.G.; formal analysis, A.M.; investigation, A.M. and J.G.; writing—original draft preparation, A.M.; writing—review and editing, A.M. and J.G.; visualization, A.M.; supervision, A.M. All authors have read and agreed to the published version of the manuscript.
Funding
This research received no external funding.
Conflicts of Interest
The authors declare no conflict of interest.
References
- Gao, P.; Gu, Y.; Wang, X. The design of a permanent magnet in-wheel motor with dual-stator and dual-field-excitation used in electric vehicles. Energies 2018, 11, 424. [Google Scholar] [CrossRef] [Green Version]
- Yee, P.Y.; Guan, Y.S. Optimal design of an axial-flux permanent-magnet motor for an electric vehicle based on driving scenarios. Energies 2016, 9, 285. [Google Scholar]
- Ghorbabian, V.; Lowther, D.A. Magnetic and electrical design challenges of inverter-fed permanent magnet synchronous motors. IEEE Trans. Magn. 2017, 53, 1–4. [Google Scholar] [CrossRef]
- Hong, D.K.; Woo, B.C.; Lee, J.Y.; Koo, D.H. Ultra high-speed motor supported by air foil bearings for air blower cooling fuel cells. IEEE Trans. Magn. 2012, 48, 871–874. [Google Scholar] [CrossRef]
- Hong, D.K.; Lee, T.W.; Jeong, Y.H. Design and experimental validation of a high-speed electric turbocharger motor considering variation of the L/D ratio. IEEE Trans. Magn. 2018, 54, 1–4. [Google Scholar]
- Lu, C.; Ferrari, S.; Pellegrino, G. Two design procedures for PM synchronous machines for electric powertrains. IEEE Trans. Transp. Electrif. 2016, 3, 98–107. [Google Scholar] [CrossRef] [Green Version]
- Chaker, N.; Salah, B.B.; Tounsi, S.; Neji, R. Design of axial-flux motor for traction application. Electromagn. Anal. Appl. 2009, 2, 73–78. [Google Scholar] [CrossRef] [Green Version]
- Gasparin, L.; Fiser, R. Cogging torque sensitivity to permanent magnet tolerance combinations. Arch. Electr. Eng. 2013, 62, 449–461. [Google Scholar] [CrossRef]
- Wu, Z.; Guo, H.; Qian, H.; Wang, D. Sensitive analysis of geometrical parameters on robust design for surface mounted permanent magnet synchronous motor. In Proceedings of the International Conference on Electrical machines and Systems, Busan, Korea, 26–29 October 2013. [Google Scholar]
- Lee, S.; Kim, K.; Cho, S.; Jang, J.; Lee, T.; Hong, J. Optimal design of interior permanent magnet synchronous motor considering the manufacturing tolerances using Taguchi robust design. IET Electr. Power Appl. 2013, 8, 23–28. [Google Scholar] [CrossRef]
- Orlova, S.; Rassolkin, A.; Kallaste, A.; Vaimann, T.; Belahcen, A. Lifecycle analysis of different motors form the standpoint of environmental impact. Latv. J. Phys. Tech. Sci. 2016, 6, 37–46. [Google Scholar]
- Mayer, A.; Lindenfels, J.; Franke, J. Manufacturing imperfections in electric motor production with focus on halbach array permanent magnet motor assembly. In Proceedings of the International Electric Drives Production Conference, Schweinfurt, Germany, 4–5 December 2019. [Google Scholar]
- Zhong, Y.; Huang, S.; Luo, D. Stabilization and speed control of a permanent magnet synchronous motor with dual-rotating rotors. Energies 2018, 11, 2786. [Google Scholar] [CrossRef] [Green Version]
- Coenen, I.; Gracia, M.H.; Hameyer, K. Influence and evaluation of non-ideal manufacturing process on the cogging torque of a permanent magnet excited synchronous machine. COMPEL Int. J. Comput. Math. Electr. Electron. Eng. 2011, 30, 876–884. [Google Scholar] [CrossRef]
- Gasparin, L.; Cernigoj, A.; Markic, S.; Fiser, R. Additional cogging torque components in permanent-magnet motors due to manufacturing imperfection. IEEE Trans. Magn. 2009, 45, 1210–1213. [Google Scholar] [CrossRef]
- Coenen, I.; Giet, M.; Hameyer, K. Manufacturing tolerances: Estimation and prediction of cogging torque influenced by magnetization faults. IEEE Trans. Magn. 2012, 48, 1932–1936. [Google Scholar] [CrossRef]
- Lv, W.W.; Jin, X.X. Influence of assembly tolerance on dynamic characteristics of motor rotation assembly. Adv. Mater. Res. 2013, 655–657, 608–611. [Google Scholar] [CrossRef]
- Kim, Y.K.; Hong, J.P.; Hur, J. Torque characteristic analysis considering the manufacturing tolerance for electric machine by stochastic response surface method. IEEE Trans. Ind. Appl. 2003, 39, 713–719. [Google Scholar]
- Gasprin, L.; Cernigoj, A.; Markic, S.; Fiser, R. Prediction of cogging torque level in PM motors due to assembly tolerances in mass-production. COMPEL Int. J. Comput. Math. Electr. Electron. Eng. 2008, 27, 911–918. [Google Scholar] [CrossRef]
- Li, Y.; Chai, F.; Song, Z.; Li, Z. Analysis of vibrations in interior permanent magnet synchronous motors considering air-gap deformation. Energies 2017, 10, 1259. [Google Scholar] [CrossRef]
- Liu, X.; Lin, Q.; Fu, W. Optimal design of permanent magnet arrangement in synchronous motors. Energies 2017, 10, 1700. [Google Scholar] [CrossRef] [Green Version]
- Gasparin, L.; Fiser, R. Sensitivity of cogging torque to permanent magnet imperfections in mass-produced PM synchronous motors. Przegląd Elektrotechniczny 2013, 89, 80–83. [Google Scholar]
- Mlot, A.; Malloy, A.C.; Korkosz, M.; Lamperth, M. Electromagnetic review of rotor/stator misalignment in permanent magnet axial flux motor. Anal. Simul. Electr. Comput. Syst. Lect. Notes Electr. Eng. 2018, 89, 53–69. [Google Scholar]
- Gerlando, A.D.; Foglia, G.M.; Iacchetti, M.C.; Perini, R. Evaluation of manufacturing dissymmetry effects in axial flux permanent-magnet machines: Analysis method based on field functions. IEEE Trans. Magn. 2012, 48, 1995–2008. [Google Scholar] [CrossRef]
- Mlot, A.; Malloy, A.C.; Lamperth, M.U. Effect of rotor/stator misalignment on the performance of a permanent magnet axial-flux motor. In Proceedings of the 8th IET International Conference on Power Electronics, Machines and Drives, Glasgow, UK, 19–21 April 2016. [Google Scholar]
- Mlot, A.; Lukaniszyn, M. Analysis of axial flux motor performance for traction motor applications. COMPEL Int. J. Comput. Math. Electr. Electron. Eng. 2019, 4, 1306–1322. [Google Scholar] [CrossRef]
- Lamperth, M.U.; Malloy, A.C.; Mlot, A.; Cordner, M. Assessment of axial flux motor technology for hybrid powertrain integration. In Proceedings of the EVS28 International Electric Vehicle Symposium and Exhibition, Kintex, Korea, 3–6 May 2015. [Google Scholar]
- Malloy, A.C.; Mlot, A.; Cordner, M.; Lamperth, M. Axial flux machines for hybrid module applications. In Proceedings of the IEEE International Electric Vehicle Conference, Florence, Italy, 17–19 December 2014. [Google Scholar]
- Hey, J.; Malloy, A.C.; Martinez-Botas, R.F. Conjugate heat transfer analysis of an energy conversion device with an update numerical model obtained through inverse identification. Energy Convers. Manag. 2015, 94, 198–209. [Google Scholar] [CrossRef]
- Collective Work. IEEE Trial-Use Guide for Testing Permanent Magnet Machines; Approved 1812-201, February 24, 2015; IEEE: New York, NY, USA, 2014; pp. 1–56. [Google Scholar]
- Hey, J.; Malloy, A.C.; Martinez-Botas, R.F.; Lamperth, M. On-line monitoring of electromagnetic losses in an electric motor indirectly through temperature measurement. IEEE Trans. Energy Convers. 2016, 31, 1347–1355. [Google Scholar] [CrossRef]
- Tianyuantech. Available online: http://www.tianyuantech.com/download/flux112.pdf (accessed on 23 April 2020).
Figure 1.
Test of the PMSM motor based on axial flux technology: (a) the AF PMSM prototype under test; (b) Schematic of the experimental set-up facility.
Figure 1.
Test of the PMSM motor based on axial flux technology: (a) the AF PMSM prototype under test; (b) Schematic of the experimental set-up facility.

Figure 2.
The motor topology of the AF PMSM: (a) Major components; (b) winding sequence; due to rotational symmetry, only 1/5 of a section is shown with the wound stator core.
Figure 2.
The motor topology of the AF PMSM: (a) Major components; (b) winding sequence; due to rotational symmetry, only 1/5 of a section is shown with the wound stator core.

Figure 3.
Measurements at 500 and 6000 rpm for several AFPMSMs: (a) Continuous current; (b) continuous torque.
Figure 3.
Measurements at 500 and 6000 rpm for several AFPMSMs: (a) Continuous current; (b) continuous torque.

Figure 4.
Torque constant vs. continuous torque measured at two different speeds for each AF PMSM tested: (a) 500 rpm; (b) 6000 rpm.
Figure 4.
Torque constant vs. continuous torque measured at two different speeds for each AF PMSM tested: (a) 500 rpm; (b) 6000 rpm.

Figure 5.
Winding temperature measured for each stator at 500 rpm for each AFPMSM: (a) Stator-1; (b) stator-2.
Figure 5.
Winding temperature measured for each stator at 500 rpm for each AFPMSM: (a) Stator-1; (b) stator-2.

Figure 6.
Winding temperature measured for each stator at 6000 rpm for each AFPMSM: (a) Stator-1 (b) Stator-2.
Figure 6.
Winding temperature measured for each stator at 6000 rpm for each AFPMSM: (a) Stator-1 (b) Stator-2.

Figure 7.
Temperature difference (ΔT) between stators of the same motor. The difference is included at two different speeds: (a) 500 rpm; (b) 6000 rpm, both in thermally plateaued conditions.
Figure 7.
Temperature difference (ΔT) between stators of the same motor. The difference is included at two different speeds: (a) 500 rpm; (b) 6000 rpm, both in thermally plateaued conditions.

Figure 8.
Temperature differences between winding stators vs. continuous torque at two different speeds: (a) 500 rpm; (b) 6000 rpm.
Figure 8.
Temperature differences between winding stators vs. continuous torque at two different speeds: (a) 500 rpm; (b) 6000 rpm.

Figure 9.
Representation of 3-D FE models (air regions, non conducting area and winding set are invisible) with a selected mesh size. Two different misalignment effects were investigated: (a) Rotor misalignment; (b) stator misalignment.
Figure 9.
Representation of 3-D FE models (air regions, non conducting area and winding set are invisible) with a selected mesh size. Two different misalignment effects were investigated: (a) Rotor misalignment; (b) stator misalignment.

Figure 10.
Normalized air-gap offset (solid line), and stator offset (dotted line) vs.: (a) Electromagnetic torque Tav; (b) torque constant kT.
Figure 10.
Normalized air-gap offset (solid line), and stator offset (dotted line) vs.: (a) Electromagnetic torque Tav; (b) torque constant kT.

Figure 11.
No-load air-gap flux density distribution, z-component. Both machines with misalignment effects are compared with a “healthy” machine: (a) AF PMSM with 1533 normalized air-gap offset; (b) machine with 10 electrical degrees stator offset.
Figure 11.
No-load air-gap flux density distribution, z-component. Both machines with misalignment effects are compared with a “healthy” machine: (a) AF PMSM with 1533 normalized air-gap offset; (b) machine with 10 electrical degrees stator offset.

Figure 12.
Current and back-EMF waveforms in different operating conditions with 10 electrical degrees of stator offset: (a) Full load; (b) open-circuit at 1000 rpm. Results related to stator-1 indicated by a solid line; to stator-2, by a dotted line.
Figure 12.
Current and back-EMF waveforms in different operating conditions with 10 electrical degrees of stator offset: (a) Full load; (b) open-circuit at 1000 rpm. Results related to stator-1 indicated by a solid line; to stator-2, by a dotted line.

Figure 13.
Imbalance amplitude of phase current and voltage at open-circuit for two different misalignment effects: (a) Normalized air-gap offset; (b) stator offset.
Figure 13.
Imbalance amplitude of phase current and voltage at open-circuit for two different misalignment effects: (a) Normalized air-gap offset; (b) stator offset.


Table 1.
Details of the prototype AFPMSM.
| Parameter | Value | Unit |
|---|---|---|
| Maximum speed | 8000 | rpm |
| Nominal torque | 145 | Nm |
| Nominal output power | 64 | kW |
| Maximum phase current | 300 | ARMS |
| Nominal phase current | 180 | ARMS |
| Slot/poles | 45/10 | - |
| Electrical steel grade | M330-35A | - |
| Magnet pole pitch | 120 | Elec.deg. |
| Magnet thickness | 10 | mm |
| Magnet grade | N33EH | - |
| Air-gap | 1.125 | mm |
| Active outer diameter | 245 | mm |
| Active inner diameter | 140 | mm |
| Slot height/width | 20/7 | mm |
| Yoke height | 8.5 | mm |
Table 2.
Motor input voltages at each testing speed.
| Parameter | Value | Unit |
|---|---|---|
| Phase-to-neutral fundamental voltage at 500 rpm | 23 | VRMS |
| Phase-to-neutral RMS voltage at 500 rpm (up to 100th harmonic) | 149 | VRMS |
| Phase-to-neutral fundamental voltage at 6000 rpm | 138 | VRMS |
| Phase-to-neutral RMS voltage at 6000 rpm (up to 100th harmonic) | 169 | VRMS |
Table 3.
Comparison between predicted and measured kT at different RMS currents at 500 rpm. The results obtained at winding temperature of 55 °C.
Table 3.
Comparison between predicted and measured kT at different RMS currents at 500 rpm. The results obtained at winding temperature of 55 °C.
| Parameter | Values | ||||||
|---|---|---|---|---|---|---|---|
| At load RMS current (A) | 24 | 49 | 74 | 100 | 124 | 150 | 175 |
| kT (Nm/A), measured | 0.926 | 0.964 | 0.977 | 0.975 | 0.969 | 0.96 | 0.947 |
| kT (Nm/A), predicted, 3-D FEA | 1.053 | 1.044 | 1.037 | 0.977 | 0.951 | 0.932 | 0.905 |
© 2020 by the authors. Licensee MDPI, Basel, Switzerland. This article is an open access article distributed under the terms and conditions of the Creative Commons Attribution (CC BY) license (http://creativecommons.org/licenses/by/4.0/).
Share and Cite
MDPI and ACS Style
Mlot, A.; González, J. Performance Assessment of Axial-Flux Permanent Magnet Motors from a Manual Manufacturing Process. Energies 2020, 13, 2122. https://0-doi-org.brum.beds.ac.uk/10.3390/en13082122
AMA Style
Mlot A, González J. Performance Assessment of Axial-Flux Permanent Magnet Motors from a Manual Manufacturing Process. Energies. 2020; 13(8):2122. https://0-doi-org.brum.beds.ac.uk/10.3390/en13082122
Chicago/Turabian StyleMlot, Adrian, and Juan González. 2020. "Performance Assessment of Axial-Flux Permanent Magnet Motors from a Manual Manufacturing Process" Energies 13, no. 8: 2122. https://0-doi-org.brum.beds.ac.uk/10.3390/en13082122
Note that from the first issue of 2016, this journal uses article numbers instead of page numbers. See further details here.