1. Introduction
The building sector is responsible for 40% of the final energy consumption in the European Union [
1]. For this reason, the EU promotes the renovation of existing buildings, the improvement of energy efficiency and the integration of renewable energies in buildings in order to get by 2050 a decarbonized building stock by means of getting nearly zero-energy buildings (nZEB) [
2].
The increasing global temperature due to the climate change will decrease the heating energy demand and increase the cooling energy demand. In fact, simulated future weather climates for 2050 and 2080 on an existing nZEB provokes an increase on cooling energy demand around 9% for 2050 and 21% for 2080 regarding to 2020 results [
3]. These results show that, in order to achieve an adequate indoor air quality (IAQ) in buildings, the focus should be on strategies for cooling demand reduction. According to Article 2(2) of the Energy Performance of Buildings Directive (EPBD) [
4] a nZEB means a building that has a very high energy performance; it means that the amount of energy needed to meet the energy demand associated with a typical use of the building which includes, inter alia, energy used for heating, cooling, ventilation, hot water and lighting, is very low. However, although nZEB reduces considerably the cooling energy demand from the envelope, lighting and equipment, occupancy and ventilation are always non-modifiable thermal loads, as they are associated to the activity of the building and the requirements of air change in order to secure air quality for those occupants.
In order to cover the cooling energy demand of a building, air conditioning systems, which use compression refrigeration cycle, are used. The efficiency of these systems varies according to the working temperatures (evaporation and condensation temperatures).
The evaporation temperature in air-conditioned occupied spaces falls in a narrow temperature range because, due to comfort guidelines, air cannot be supplied at a temperature far below the body temperature. However, condensation temperature presents several options depending on the resource with which the heat is exchanged—water, earth or air. In this study, only air condensation is considered. The water heat exchange requires an aquifer and earth heat exchange implies an important investment.
Condensation temperature (T
c), when the air is used as a heat sink, directly depends on the local climate conditions of the placement of the building. There are two options, using the dry bulb temperature (T
DB) or the adiabatic saturation temperature of the moist air (T
sat) as the heat sink for the condenser [
5], enabling in the latter case a lower thermal level of the heat dissipation media.
Refrigeration systems permit condensation closer to T
sat if we make use of the phenomenon of evaporative cooling. The difference between T
DB and T
sat increases, hence the potential of evaporative cooling, as the Relative Humidity (RH) of outside air decreases [
6]. Condensers that apply this phenomenon may have higher levels of maintenance in order to avoid possible contamination by legionella [
7], although they also allow to reduce the condensation temperature and improve the Coefficient of Performance (COP) of the equipment.
Condensers that apply the phenomenon of evaporative cooling can be classified in different typologies according to: (i) the contact of the saturated airflow and the condenser; (ii) the moment when water is added and (iii) the source of the water that will be evaporated. If the same airflow in which water is evaporated passes through the condenser, it is called direct; otherwise is indirect. If water is evaporated within the air before the condenser, it is called “dry”; but if water is supplied on the condenser, it is called wet evaporative condenser. If the water source comes from a loop, it is a recirculation water system; otherwise is referred as “lost water” system. Direct-dry systems are commonly called “adiabatic condenser.”
Table 1 gathers these possible configurations of evaporative condensers (EC).
Condensation temperature is function of the minimum temperature of the environment, which is usually the T
sat in the direct-dry recirculated water configuration and the water temperature (T
w) in the direct-dry lost water case. The processes of mass and heat transfer at the condenser determines the condensation temperature of the refrigerant.
Table 1 also indicates the condensation temperature according to the minimum temperature of the process.
Many studies have been carried out on this type of condenser in order to improve the efficiency of refrigeration systems. Wei et al. [
8] study a direct wet EC using recirculated water. They propose a numerical model validated with experimental data, obtaining a 30% increase in the COP on an equipment that condenses at T
DB. Chien et al. [
9] study the water spraying on a direct wet EC using recirculated water in order to avoid the dragging of water drops and improve the air saturation process. They propose the optimal type and separation of nozzles in each case. This study is of interest as it is focused on one of the disadvantages of EC—the deterioration of the condenser by dragging drops and salts.
Fiorentino and Starace [
10,
11] studied a direct dry EC using recirculated water. They present an experimental study where the evaporation process is evaluated, concluding that an increase of 6% in relative humidity implies a reduction of 30% in the dry temperature. They also highlight the importance of the air speed when it crosses the saturator. Harby et al. [
12] carried out a study on different systems and collected research on vapor compression cooling systems using EC, presenting a lot of experimental data on different technologies.
Martínez et al. [
13] studied the improvement of a direct dry EC using recirculated water, due to the integration of an evaporative cellulose pad to the condenser of an Split Unit, obtaining an increase of 10.6% in the COP. In addition, they present a table with a compilation of previous researches on EC, organized by the type of analysis carried out, the equipment used and the results obtained.
This paper shows the results obtained by installing cellulose evaporative pads, with lost water humidification, before the airflow goes into the condensers, so a direct-dry lost water configuration, also known as adiabatic condenser. The air-conditioning system of the building under study has an installed cooling capacity of 8.70 MW and the strategy applied on the use of the evaporative pads consisted of an ON/OFF mode of the water supply pump to the cellulose pad, depending on the time, being ON from 3pm to 10pm and the remaining hours on standby.
2. Case Study
The case study is a chiller plant installed in a hospital building. The building has 115,354 m
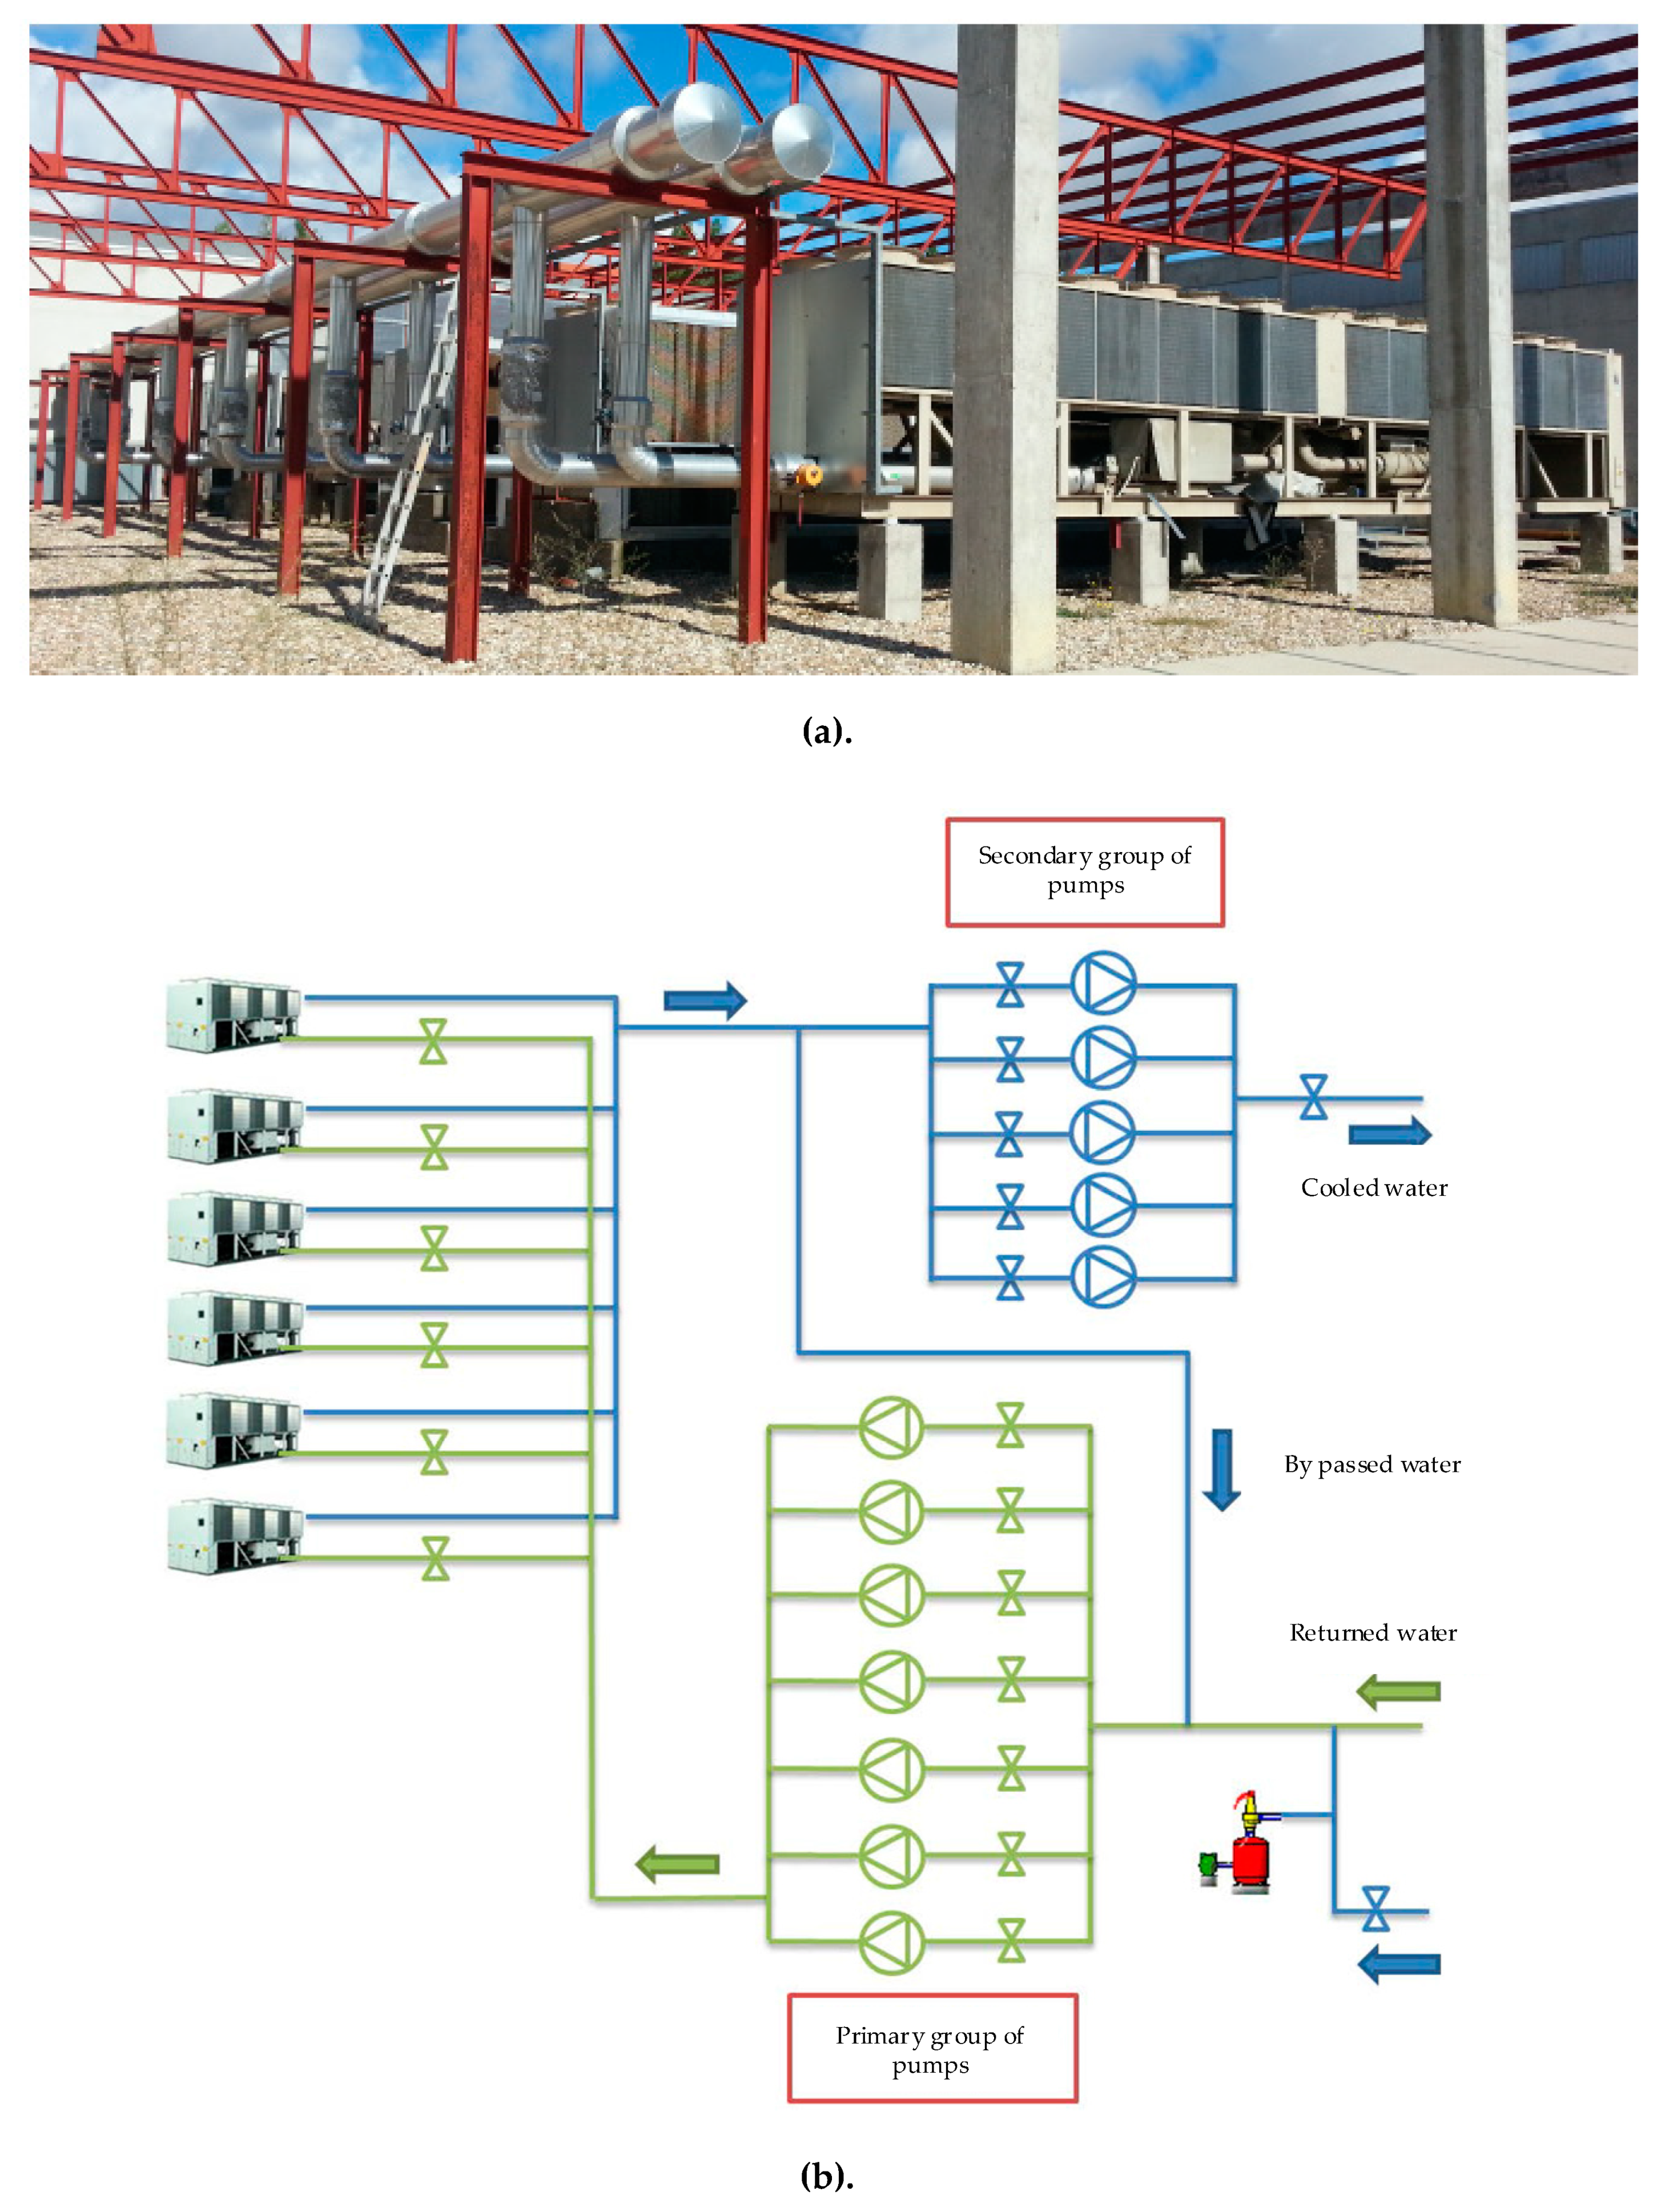
2 built area, around 3000 employees and 600 beds. The chiller plant has a cooling capacity of 8.70 MW and is composed by 6 TRANE chillers, R series, model RTAC 400, with a cooling capacity of 1442 kW/each and a COP of 2.89. Each chiller has four screw compressors, enabling partial cooling capacity of the chiller.
Figure 1 shows the chiller plant at the roof of the hospital.
The produced cooled water by the chiller plant is distributed by a double ring system with inverted return that covers the whole building and enables the water supply to the installed 200 Air Handling Units and 1500 inductors (the inductors are installed at offices and meeting rooms). The temperature of the supply water is 7 °C and 12 °C for the returned water.
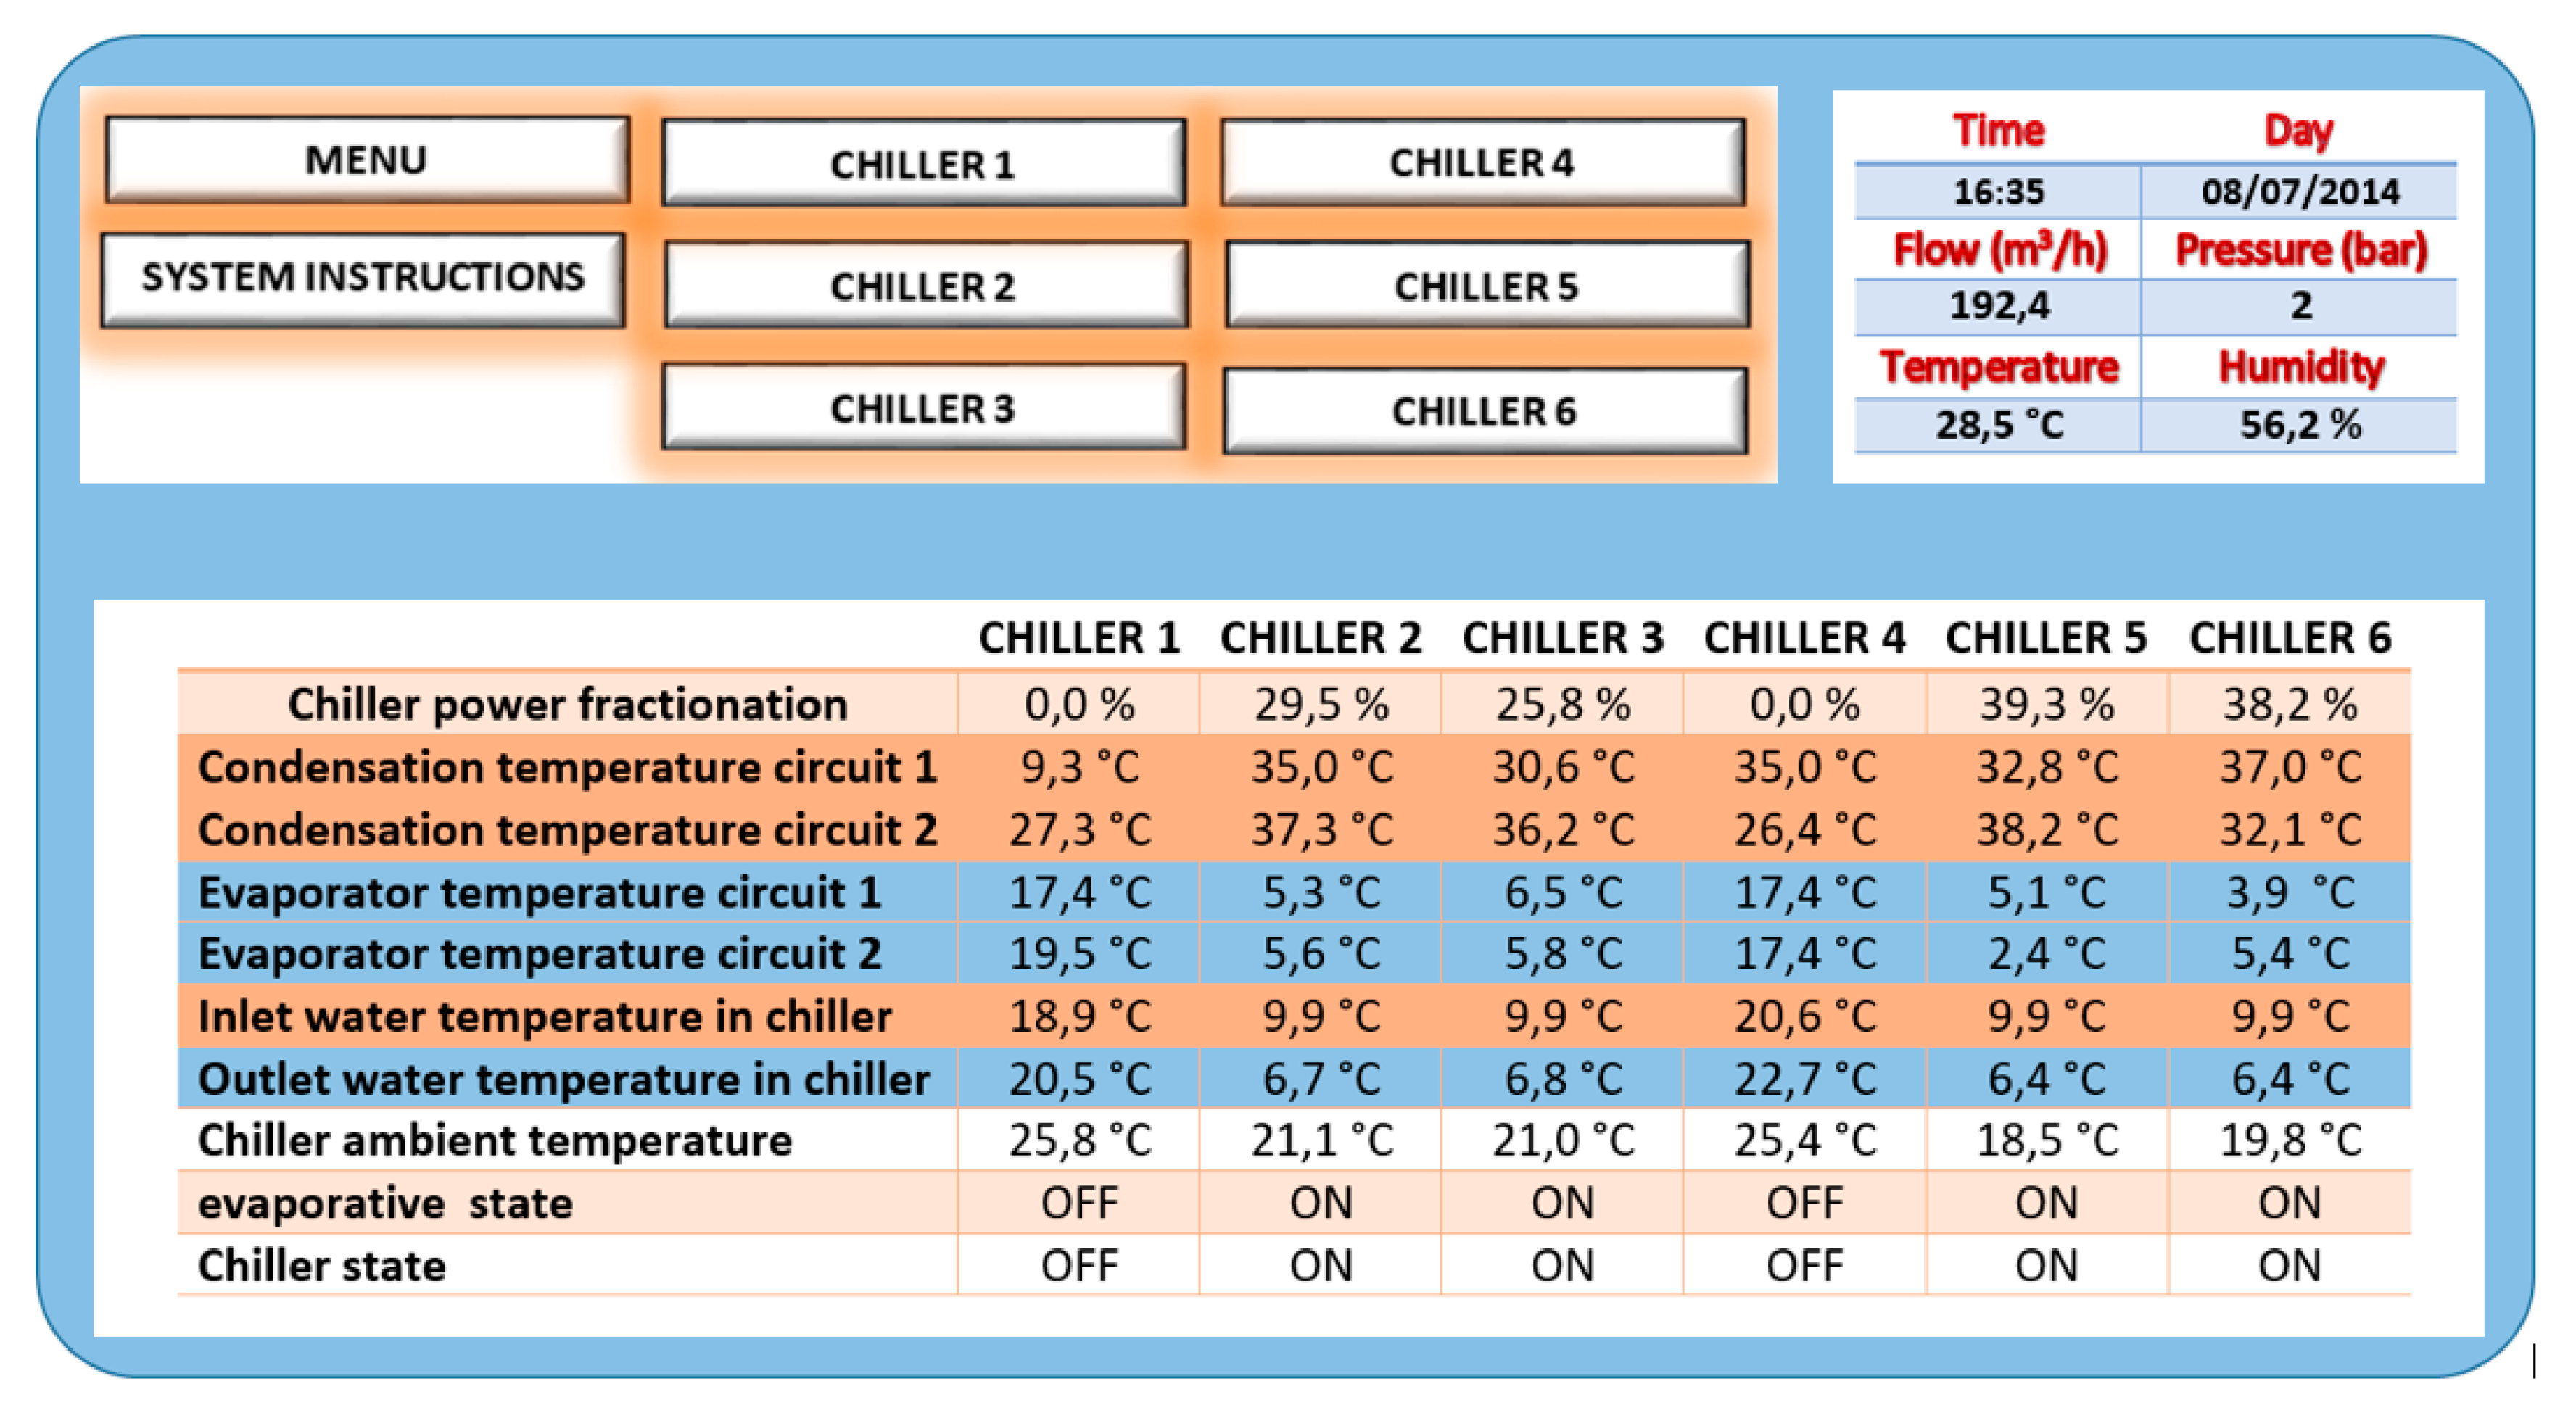
The SCADA system of the chiller plant, provided by siemens, measures and allows to display several operating parameters, due to the SITRANS sensors installed.
Figure 2 shows a screenshot with all the data provided by the control system for each chiller.
Partial load ratio, based on the electric energy consumption (Row 1),
Temperature of the refrigerant at the condenser and the evaporator, in both circuits of each chiller (Rows 2–5),
Inlet and outlet water temperature to the chiller (Row 6–7),
Outdoor temperature in each chiller (Row 8),
Data about the performance state of each chiller (Row 9–10)—presence of evaporative pad and operation of the chiller (On/Off).
All measurements of the sensors were checked with calibrated equipment, verifying the accuracy of the results.
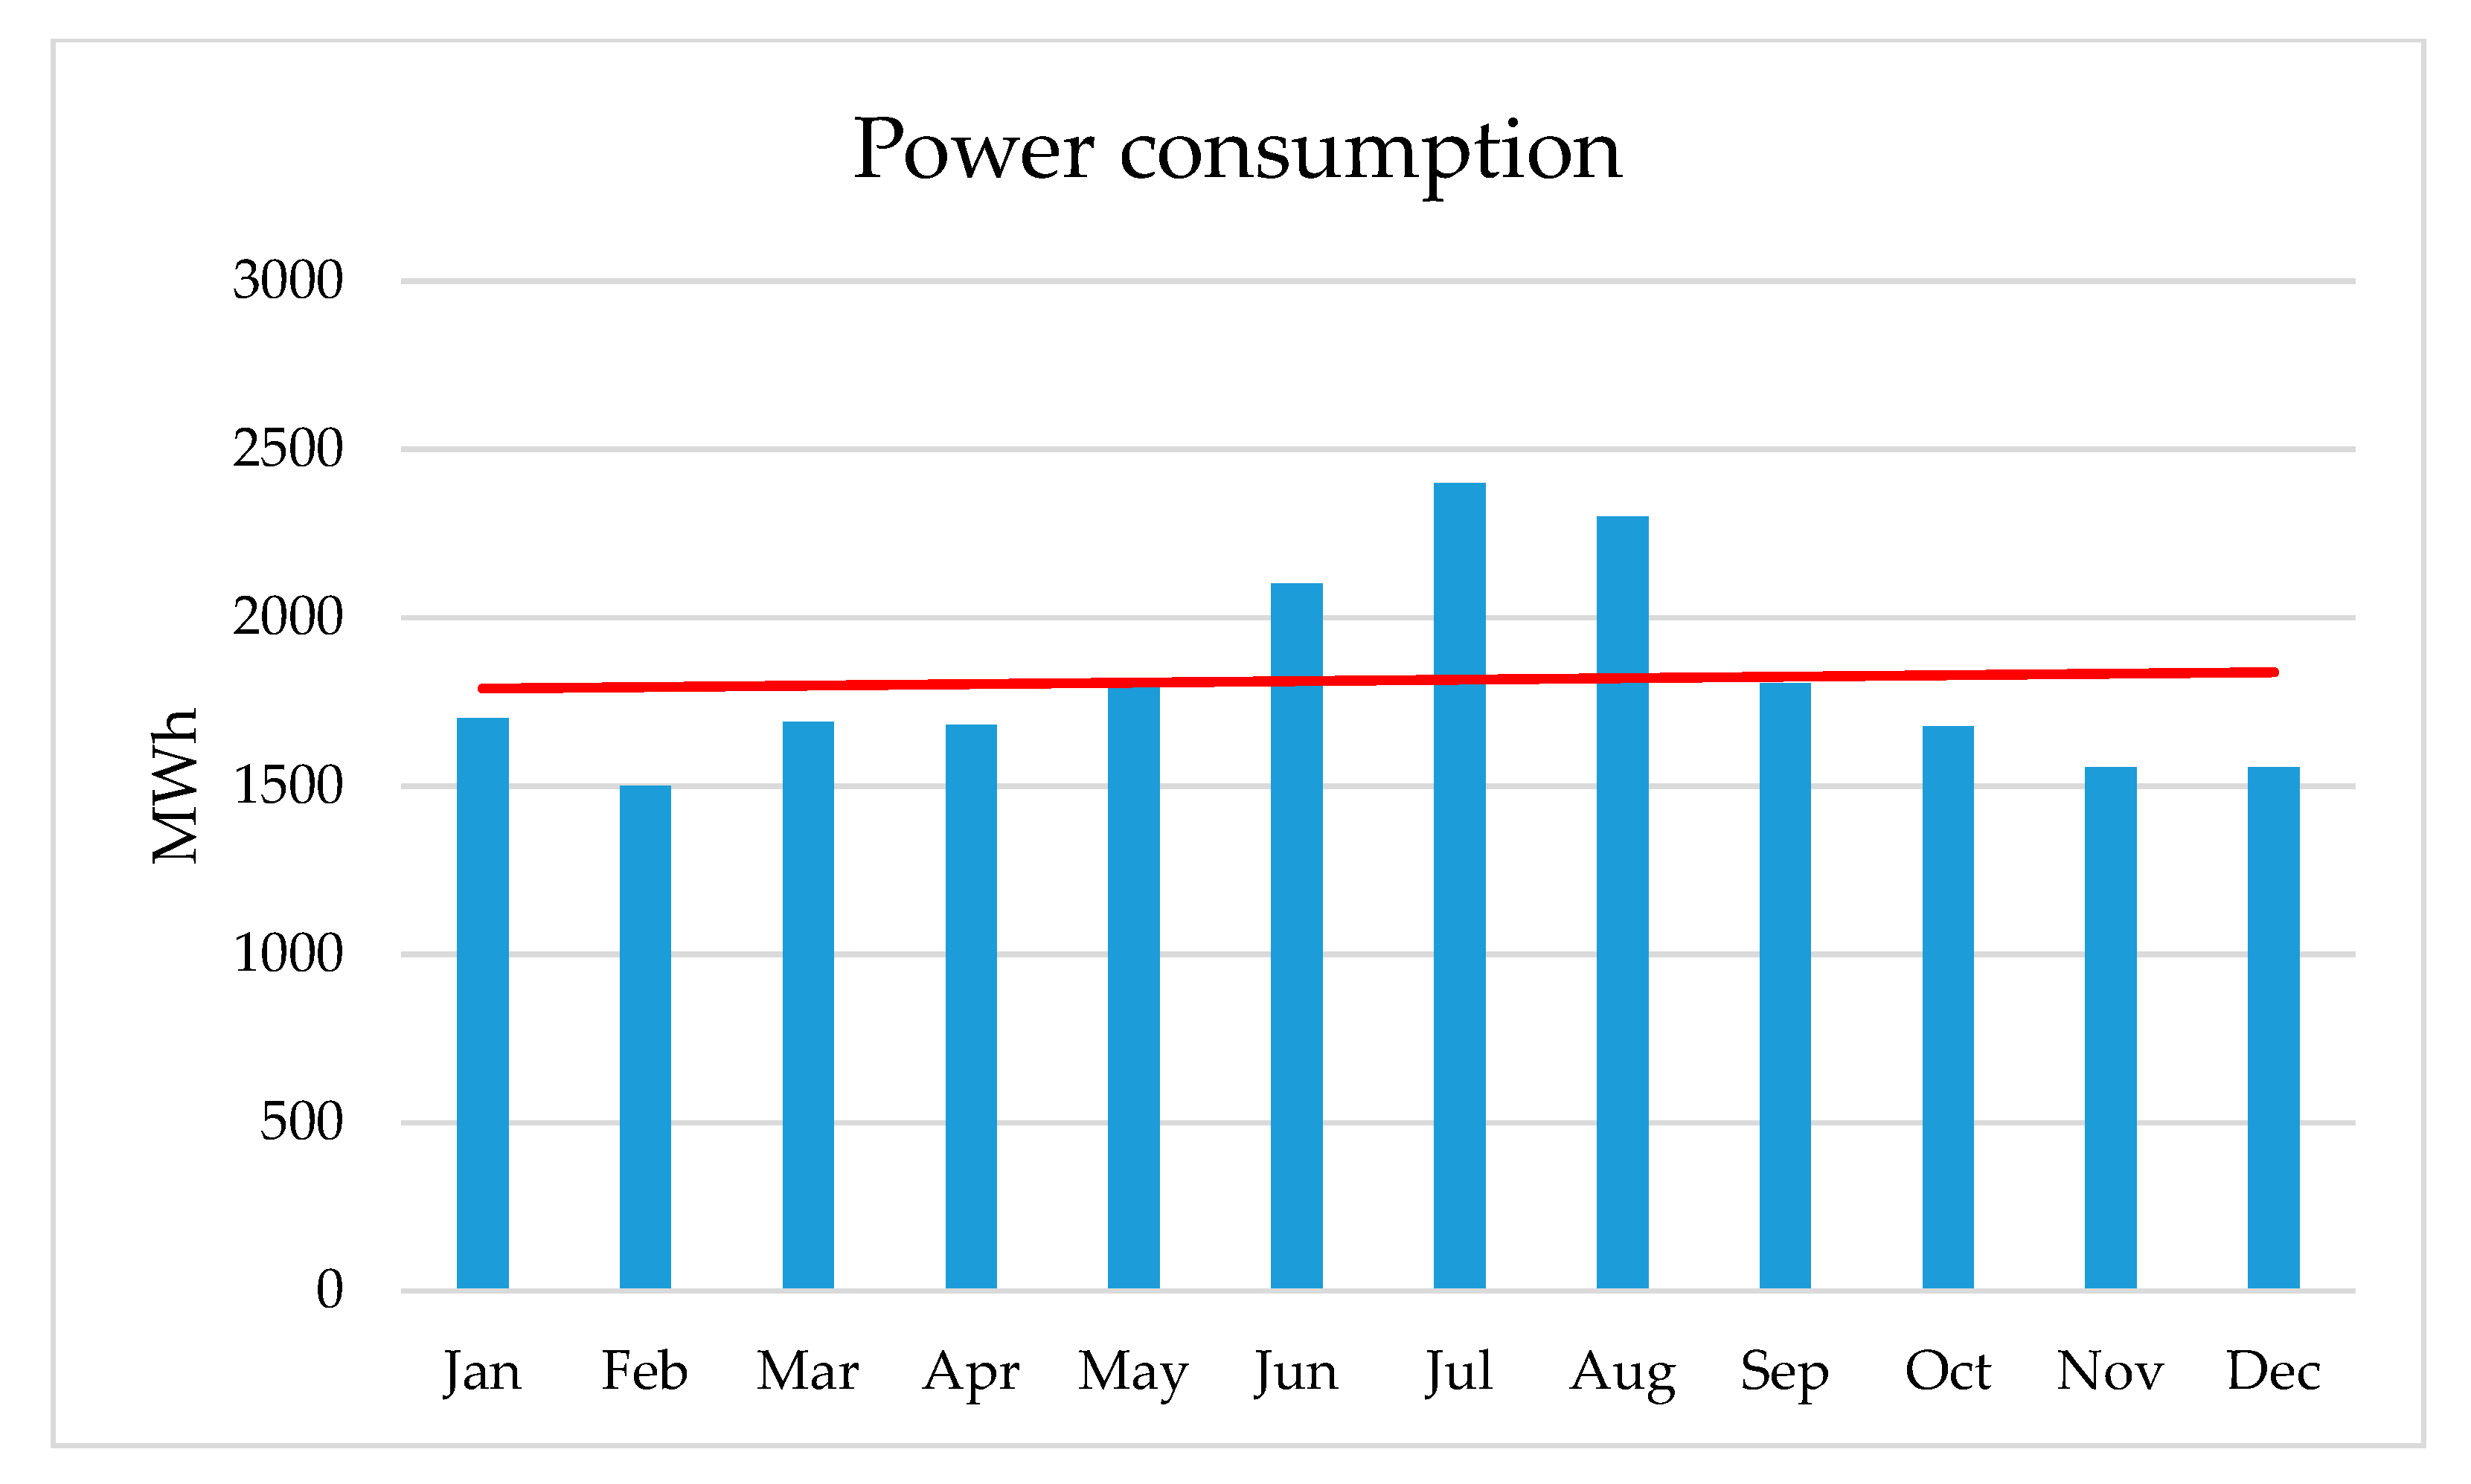
Before the research, the chiller plant produced peaks of power consumption, which exceed the maximum contracted electrical power during the peak hours of cooling demand in summer. This situation caused additional costs and overheating in the transformers of the electrical system.
Figure 3 shows the electricity consumption curve in one year and the average trend line for the year from data taken from the SCADA system.
After observing the high power consumption, the proposed strategy was reducing the condensation temperature by installing evaporative pads before the condensation batteries. The decrease in the condensation temperature would mean an improvement in the COP and in the ESEER [
14] of the system, taking into account that the chillers are located in a location where the dry bulb (T
DB) and wet bulb (T
WB) temperatures of the moist air are 33.2/19.1 °C respectively, at a percentile level of 1% [
15]. The introduction of evaporative pads before the condensers allows to reduce 14 °C the condensation temperature, which would mean an increase in the EEC and in the ESEER.
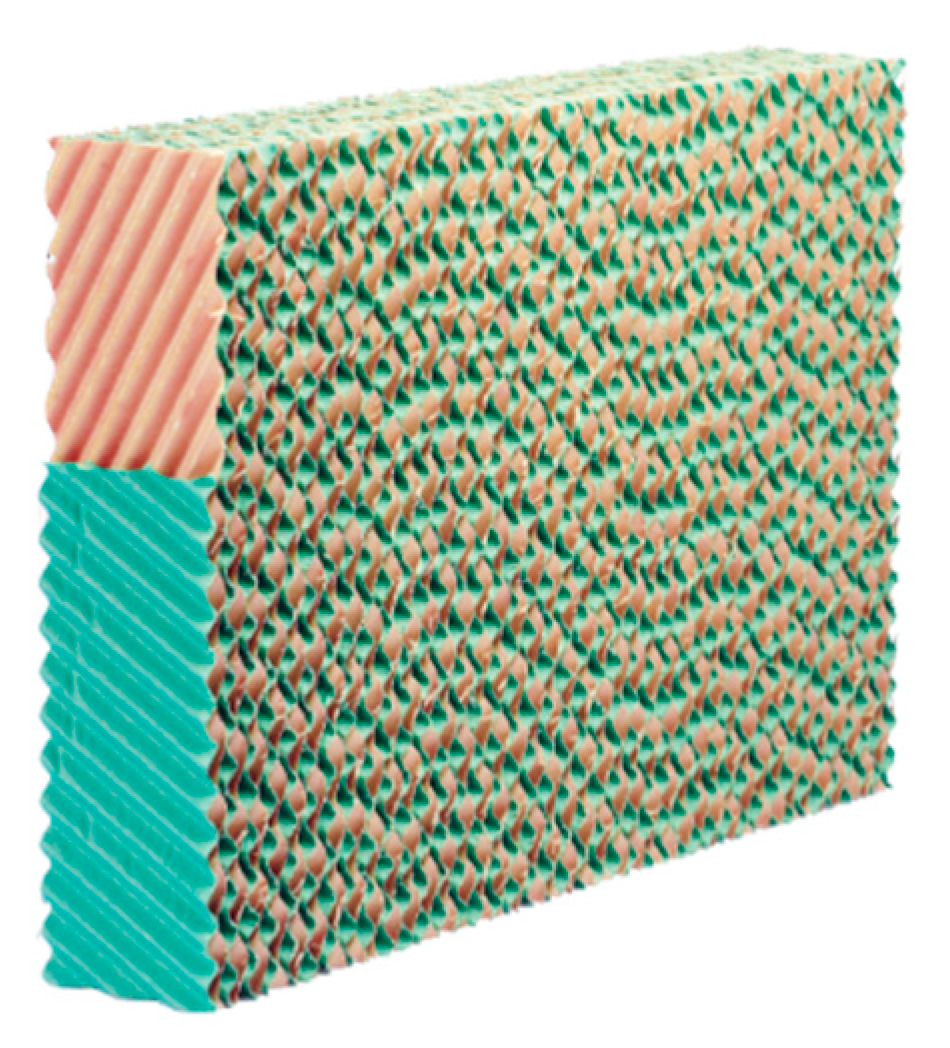
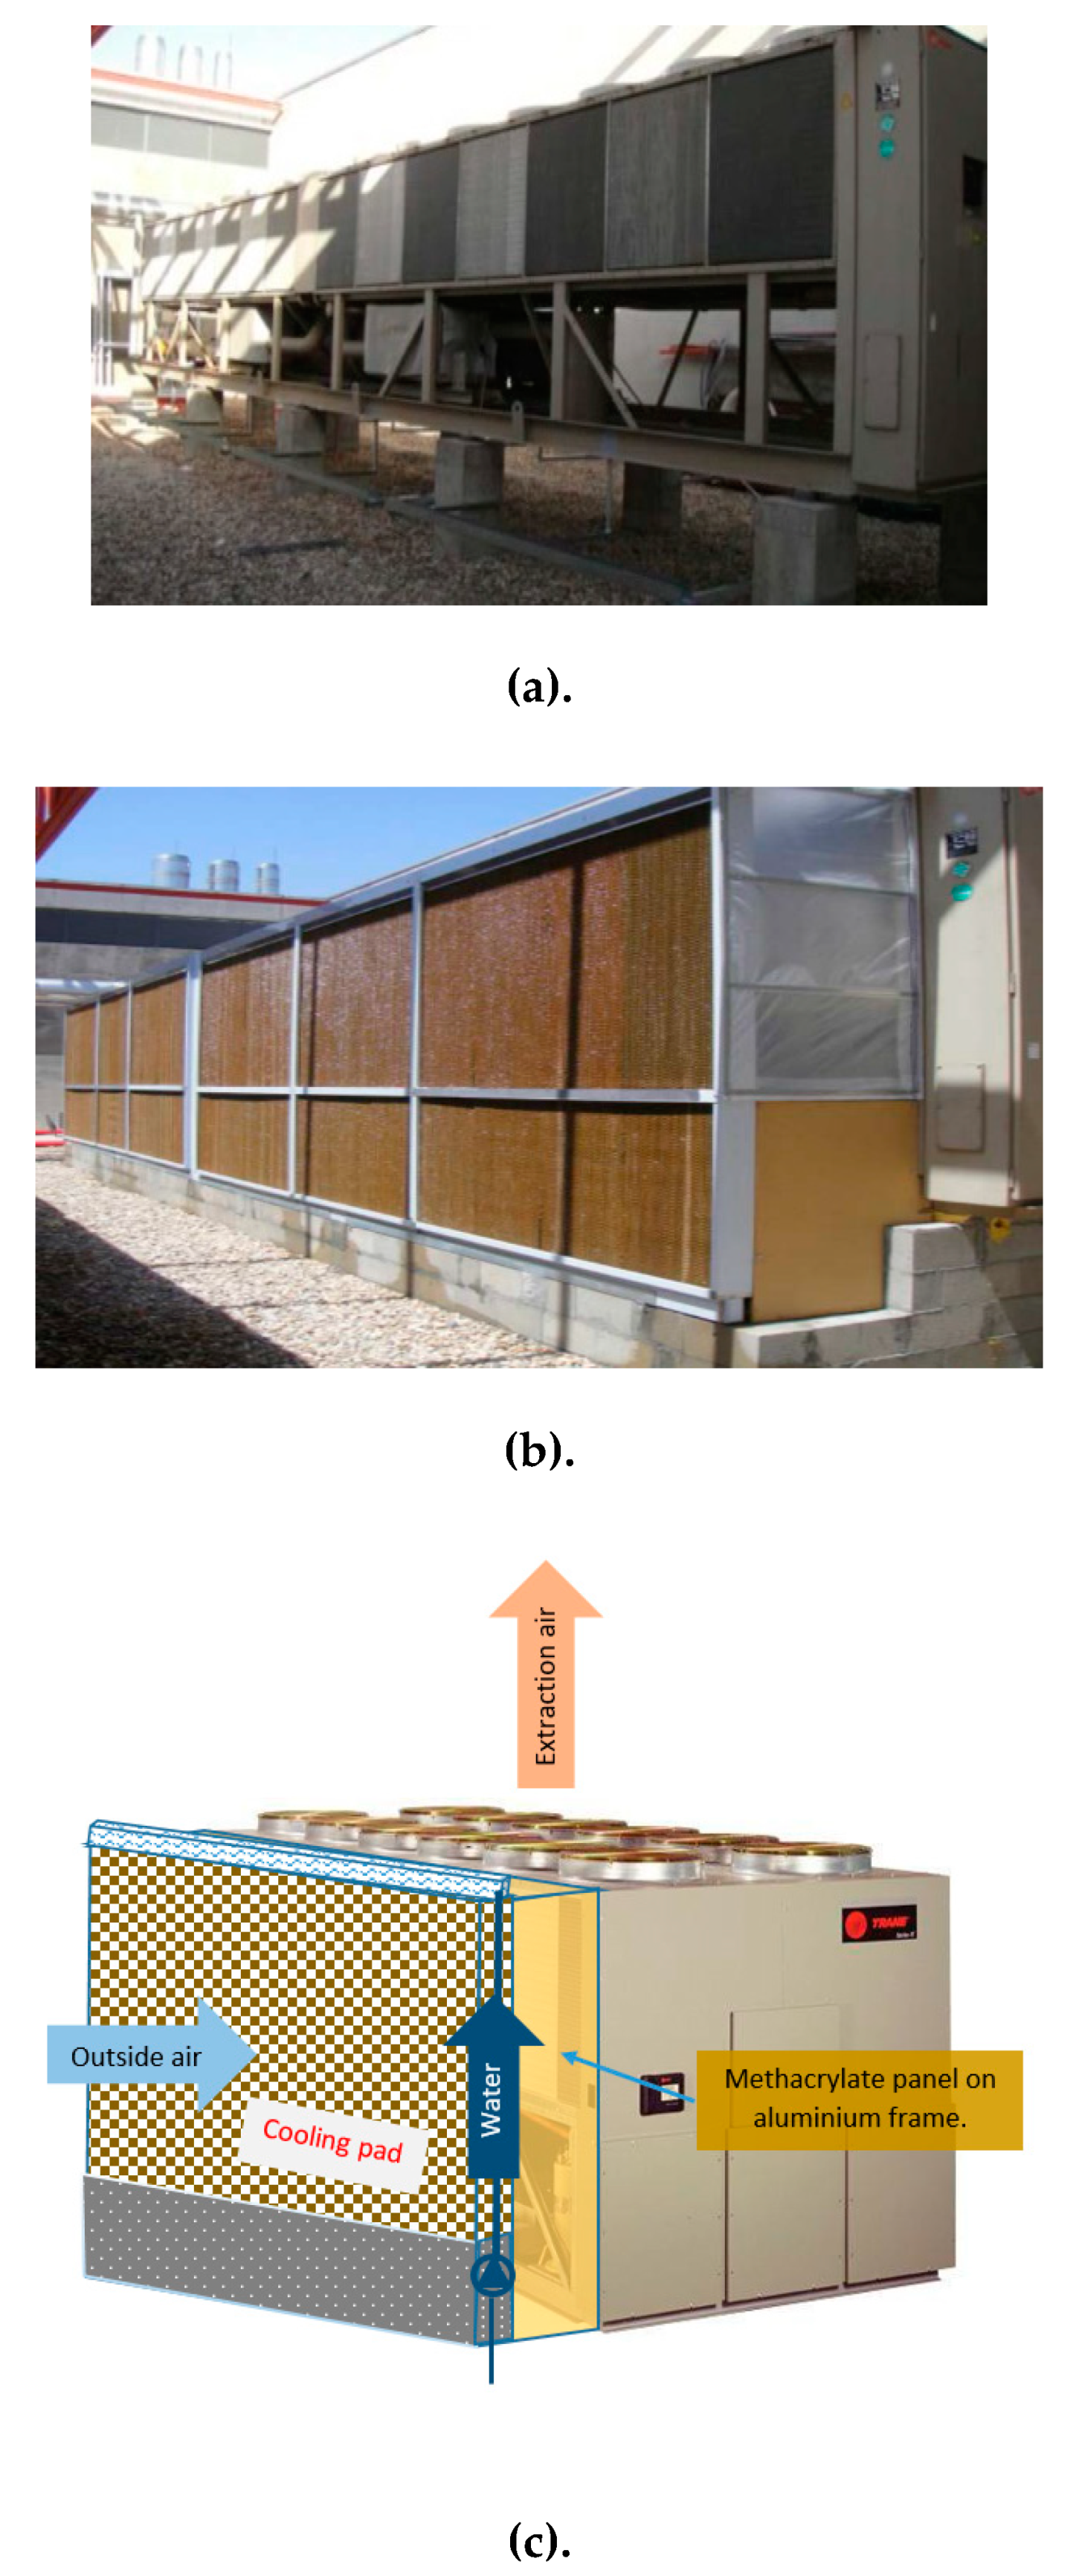
An evaporative pad was selected from the MUNTERS company, model CELdek 7060-15, which is made of corrugated cellulose with different striation angles, with a 60-degree inclination (colored in pink at
Figure 4) and another pad below with a 30-degree inclination (colored in blue at
Figure 4), glued together to achieve a high evaporation efficiency and a very low pressure drop.
Figure 4 and
Table 2 show the characteristics of the evaporative pad.
Using the technical characteristics presented in
Table 2, a 100 mm thick pad was installed in order to introduce the least pressure loss at the condenser and ensure that no water drops reaches the condenser, as the low saturation percentage of the pad does not allow the air to leave saturated, so the water drops released from the pad are evaporated in the airgap. The increase in the pressure loss due to the evaporative cooling pad was bearable by the fans without increasing the energy consumption; otherwise the frequency variator would be adjusted. The distance between each chiller, in order to avoid air bypassing, allows the introduction of the evaporative cooling pads between them.
The panels were placed before the condensing coils and were humidified by lost water.
Figure 5 shows the before (a) and after (b) of the installation of the evaporative panels before the condensers of the chillers of the Hospital.
3. Analysis and Results
The operating parameters of each chiller, shown in
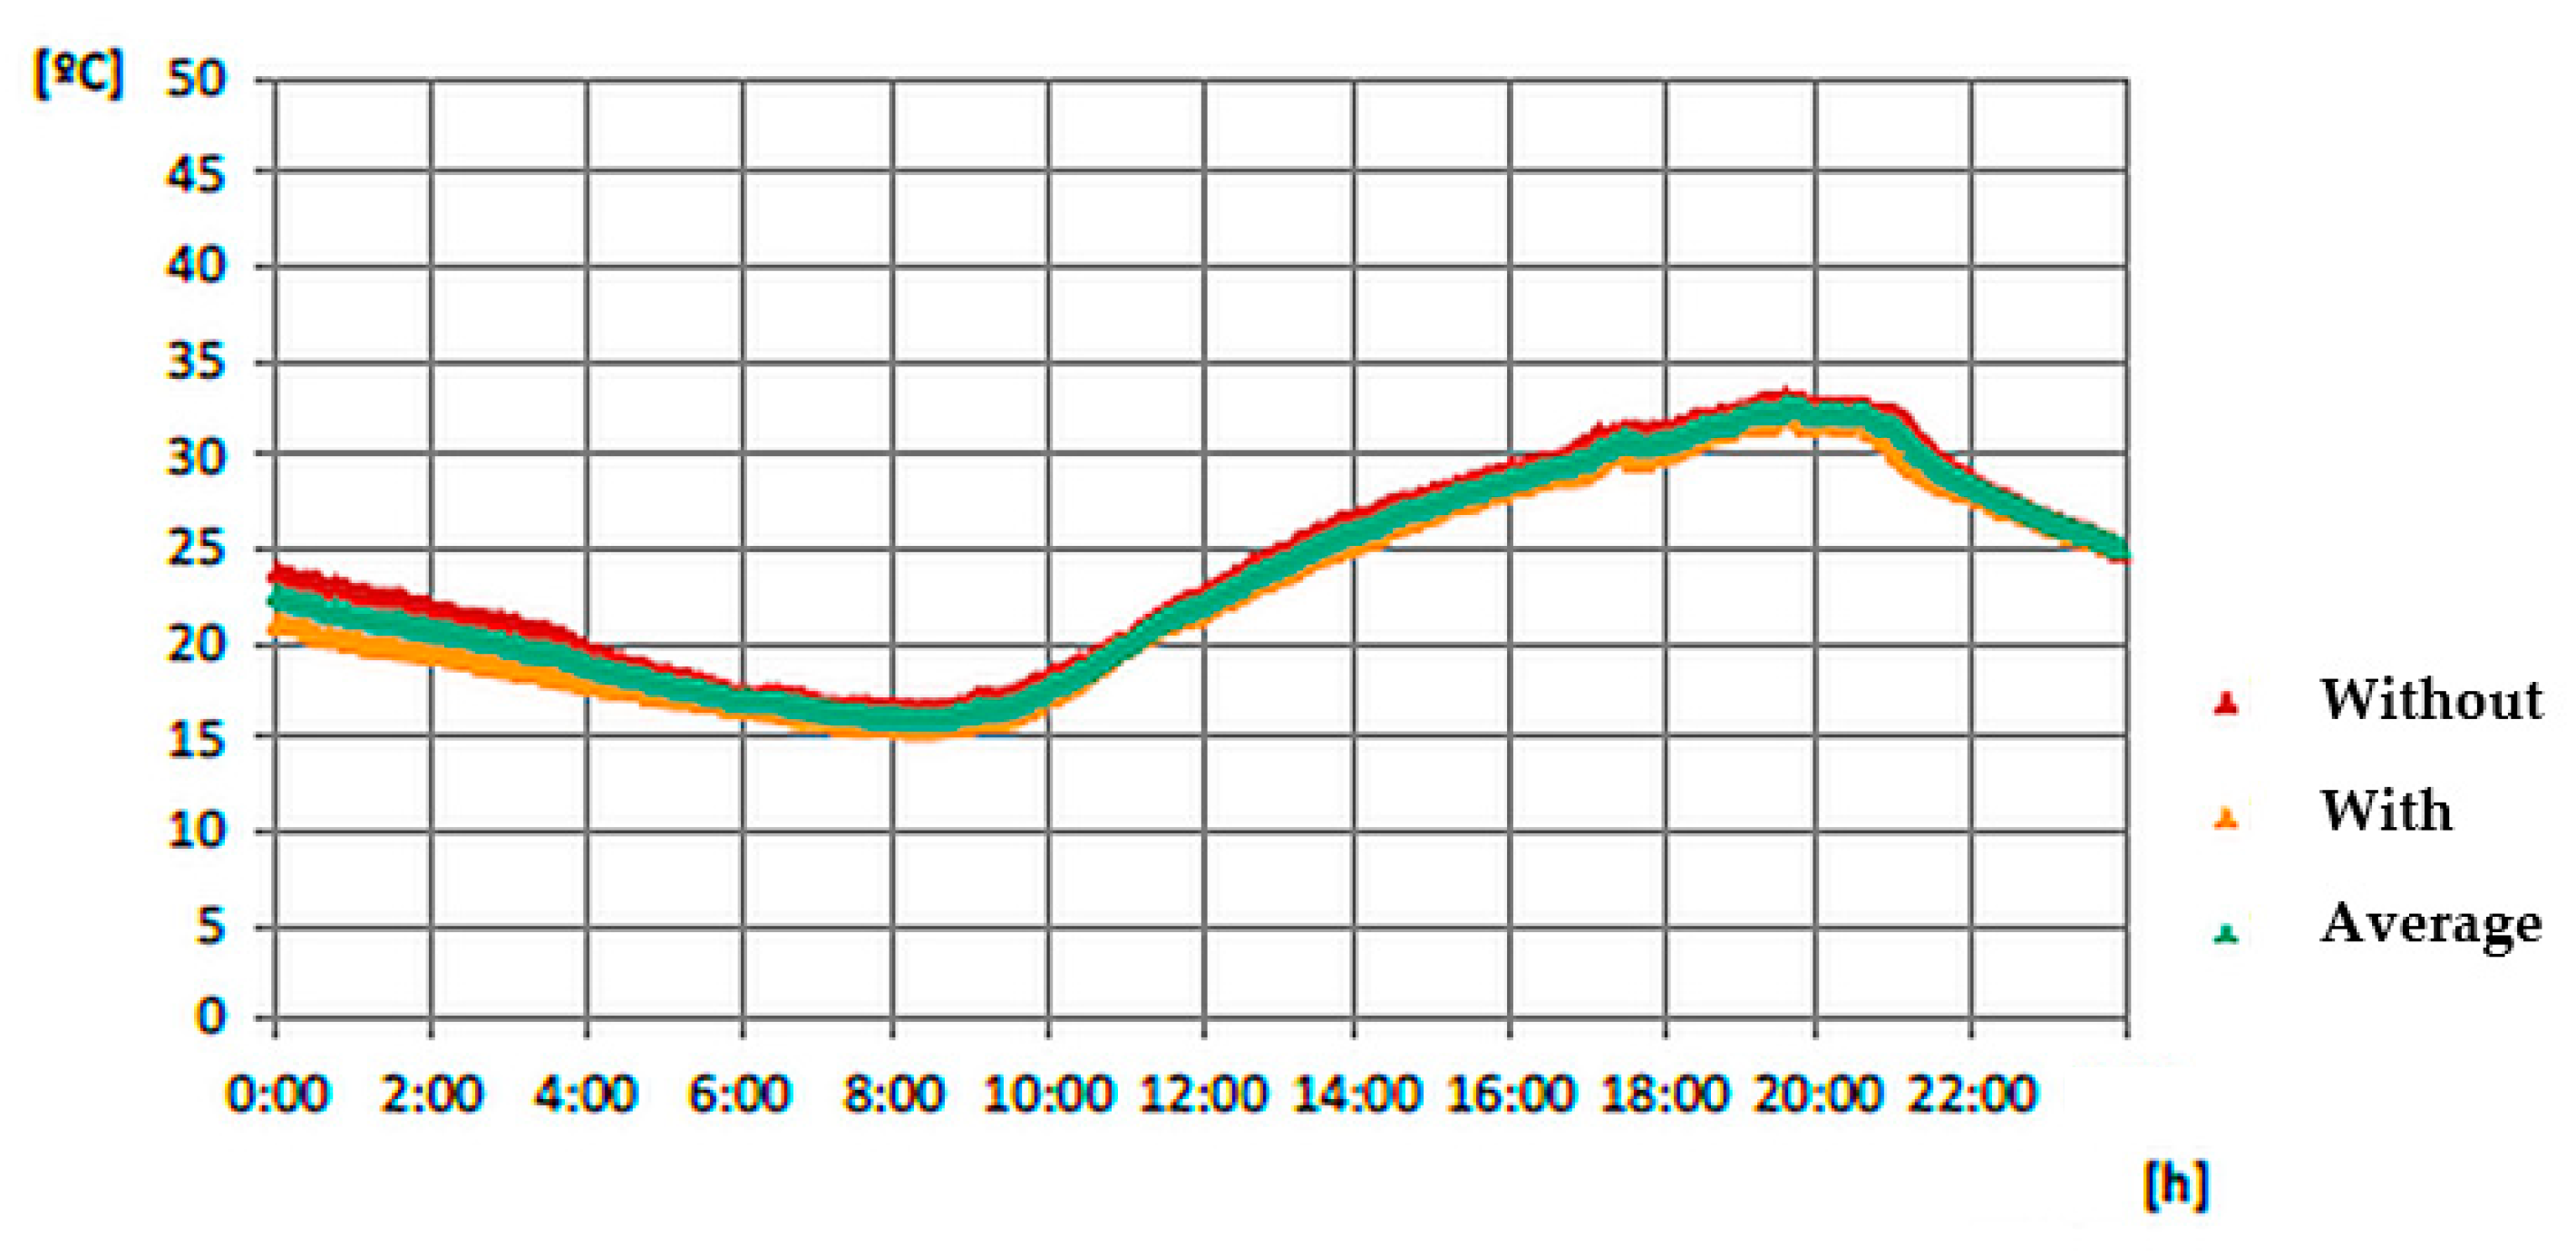
Figure 2, were recorded every five minutes from July to August, “without” and “with” the evaporative cooling pads, getting a total of 544,320 data. In order to compare the chiller plant “without” and “with” the evaporative cooling pad, two days were selected, one when the system was operating “without” and other when it was operating “with” the evaporative cooling pad, fulfilling: (i) similar weather conditions, same external temperature and relative humidity; (ii) same evaporation temperature and (iii) similar equipment load ratio. The selected days were August 10th for operation without the evaporative cooling pads and August 17th for operation with them.
Figure 6 shows the outside temperature on both days and an average of both.
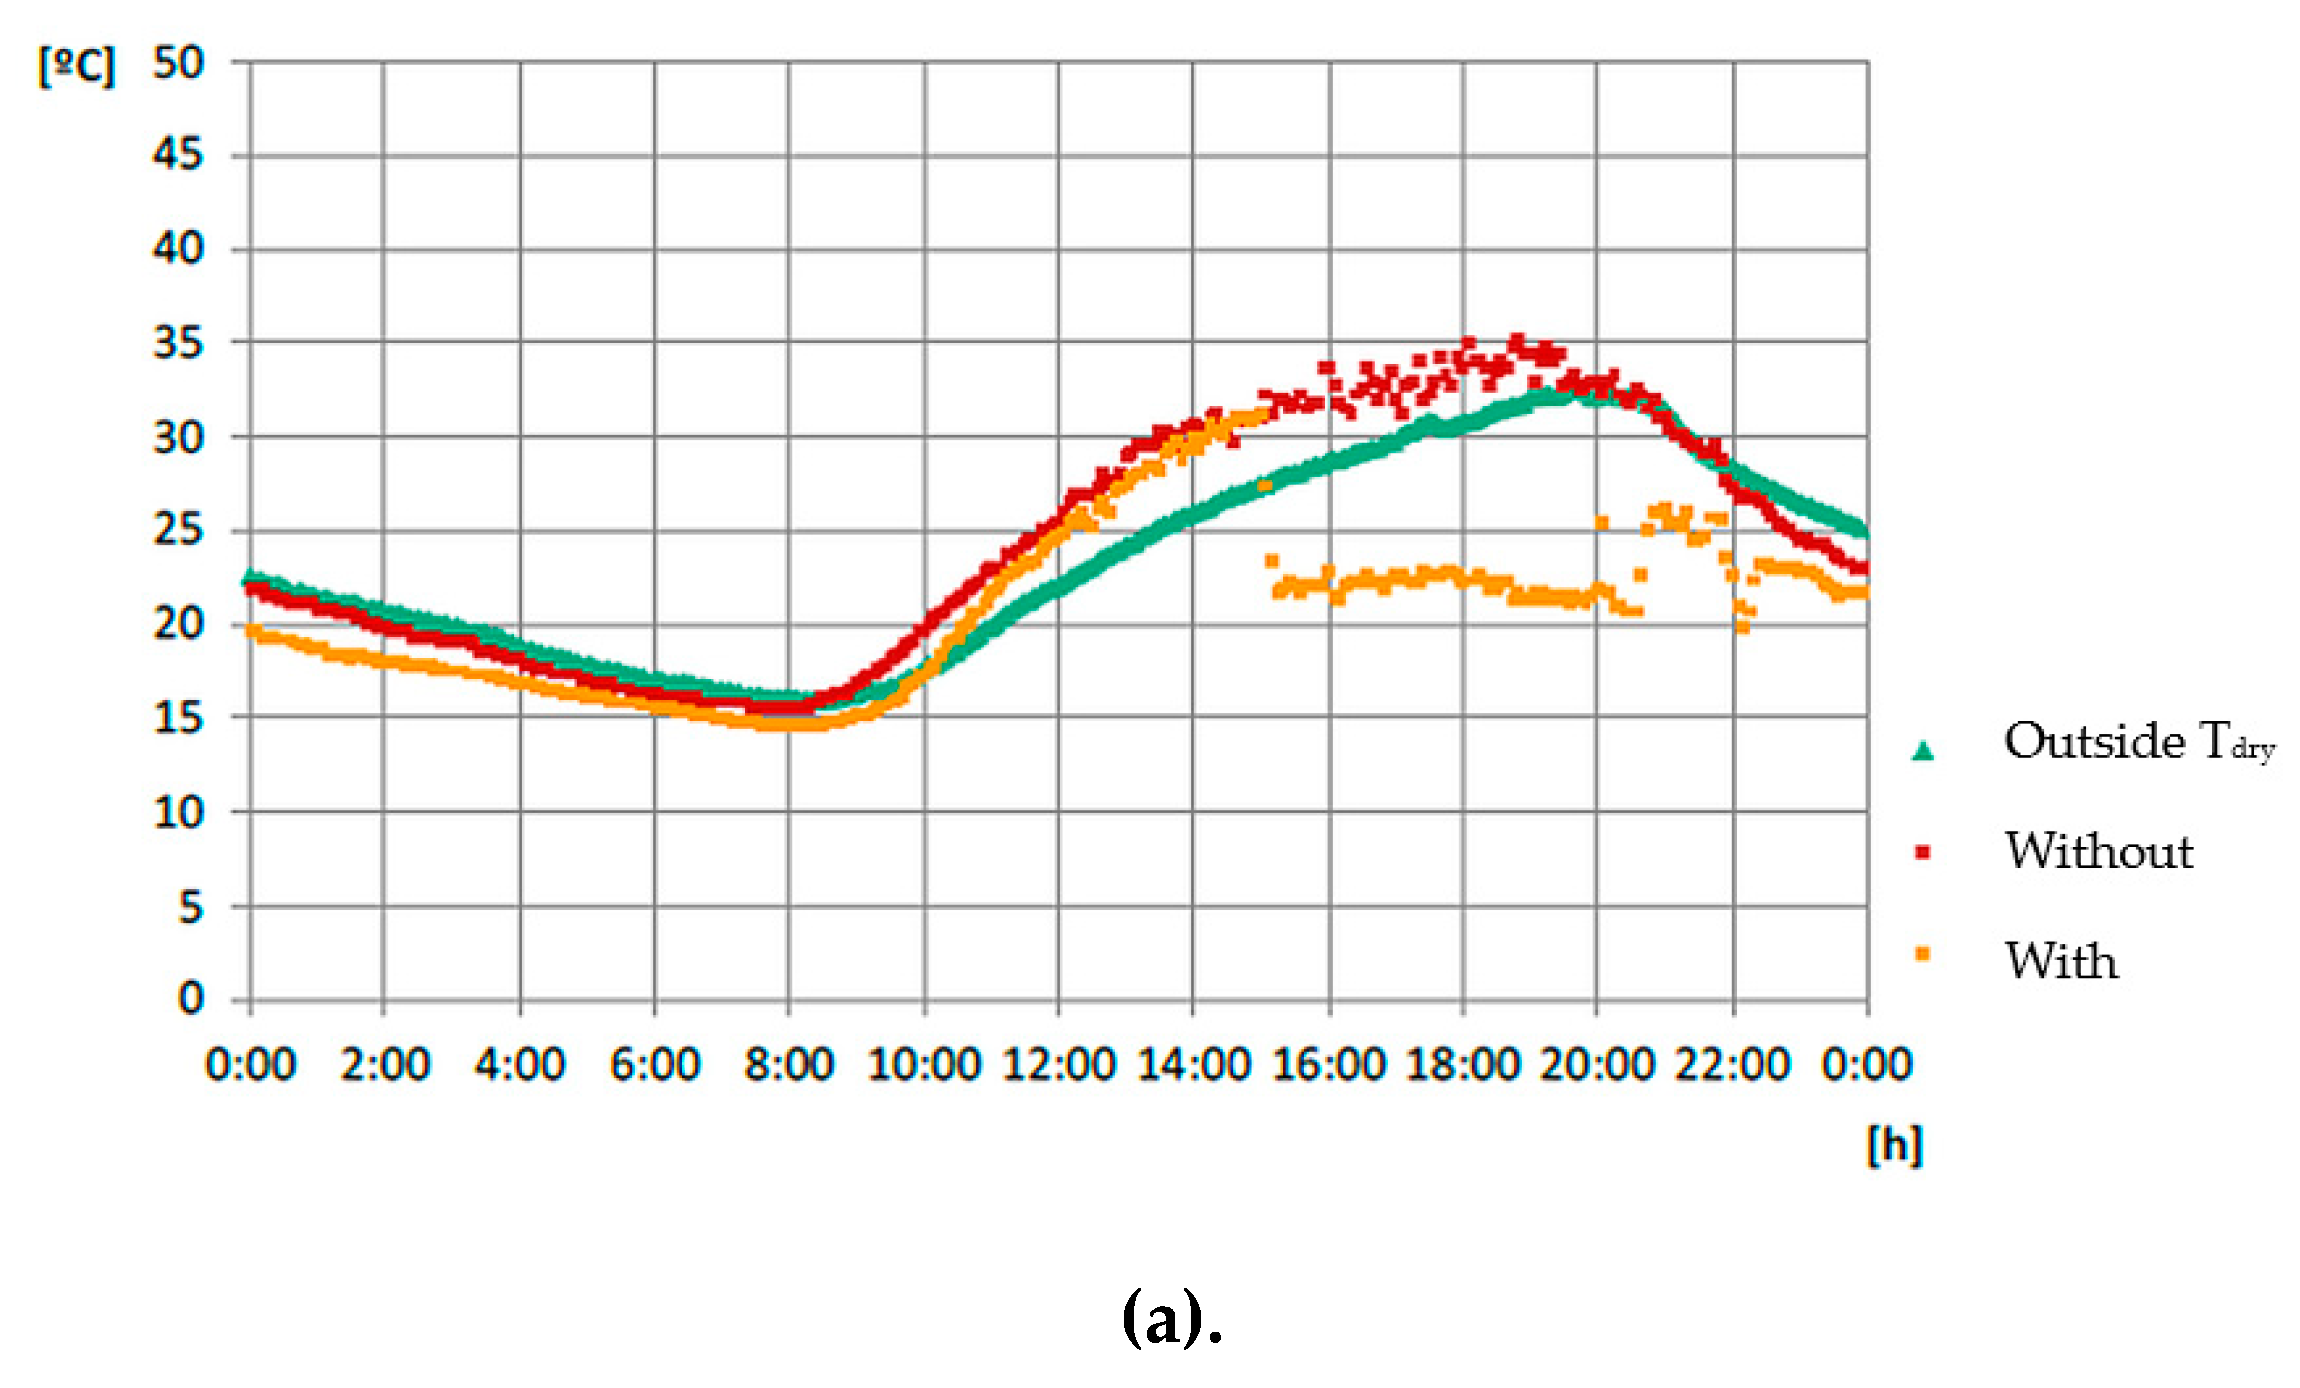
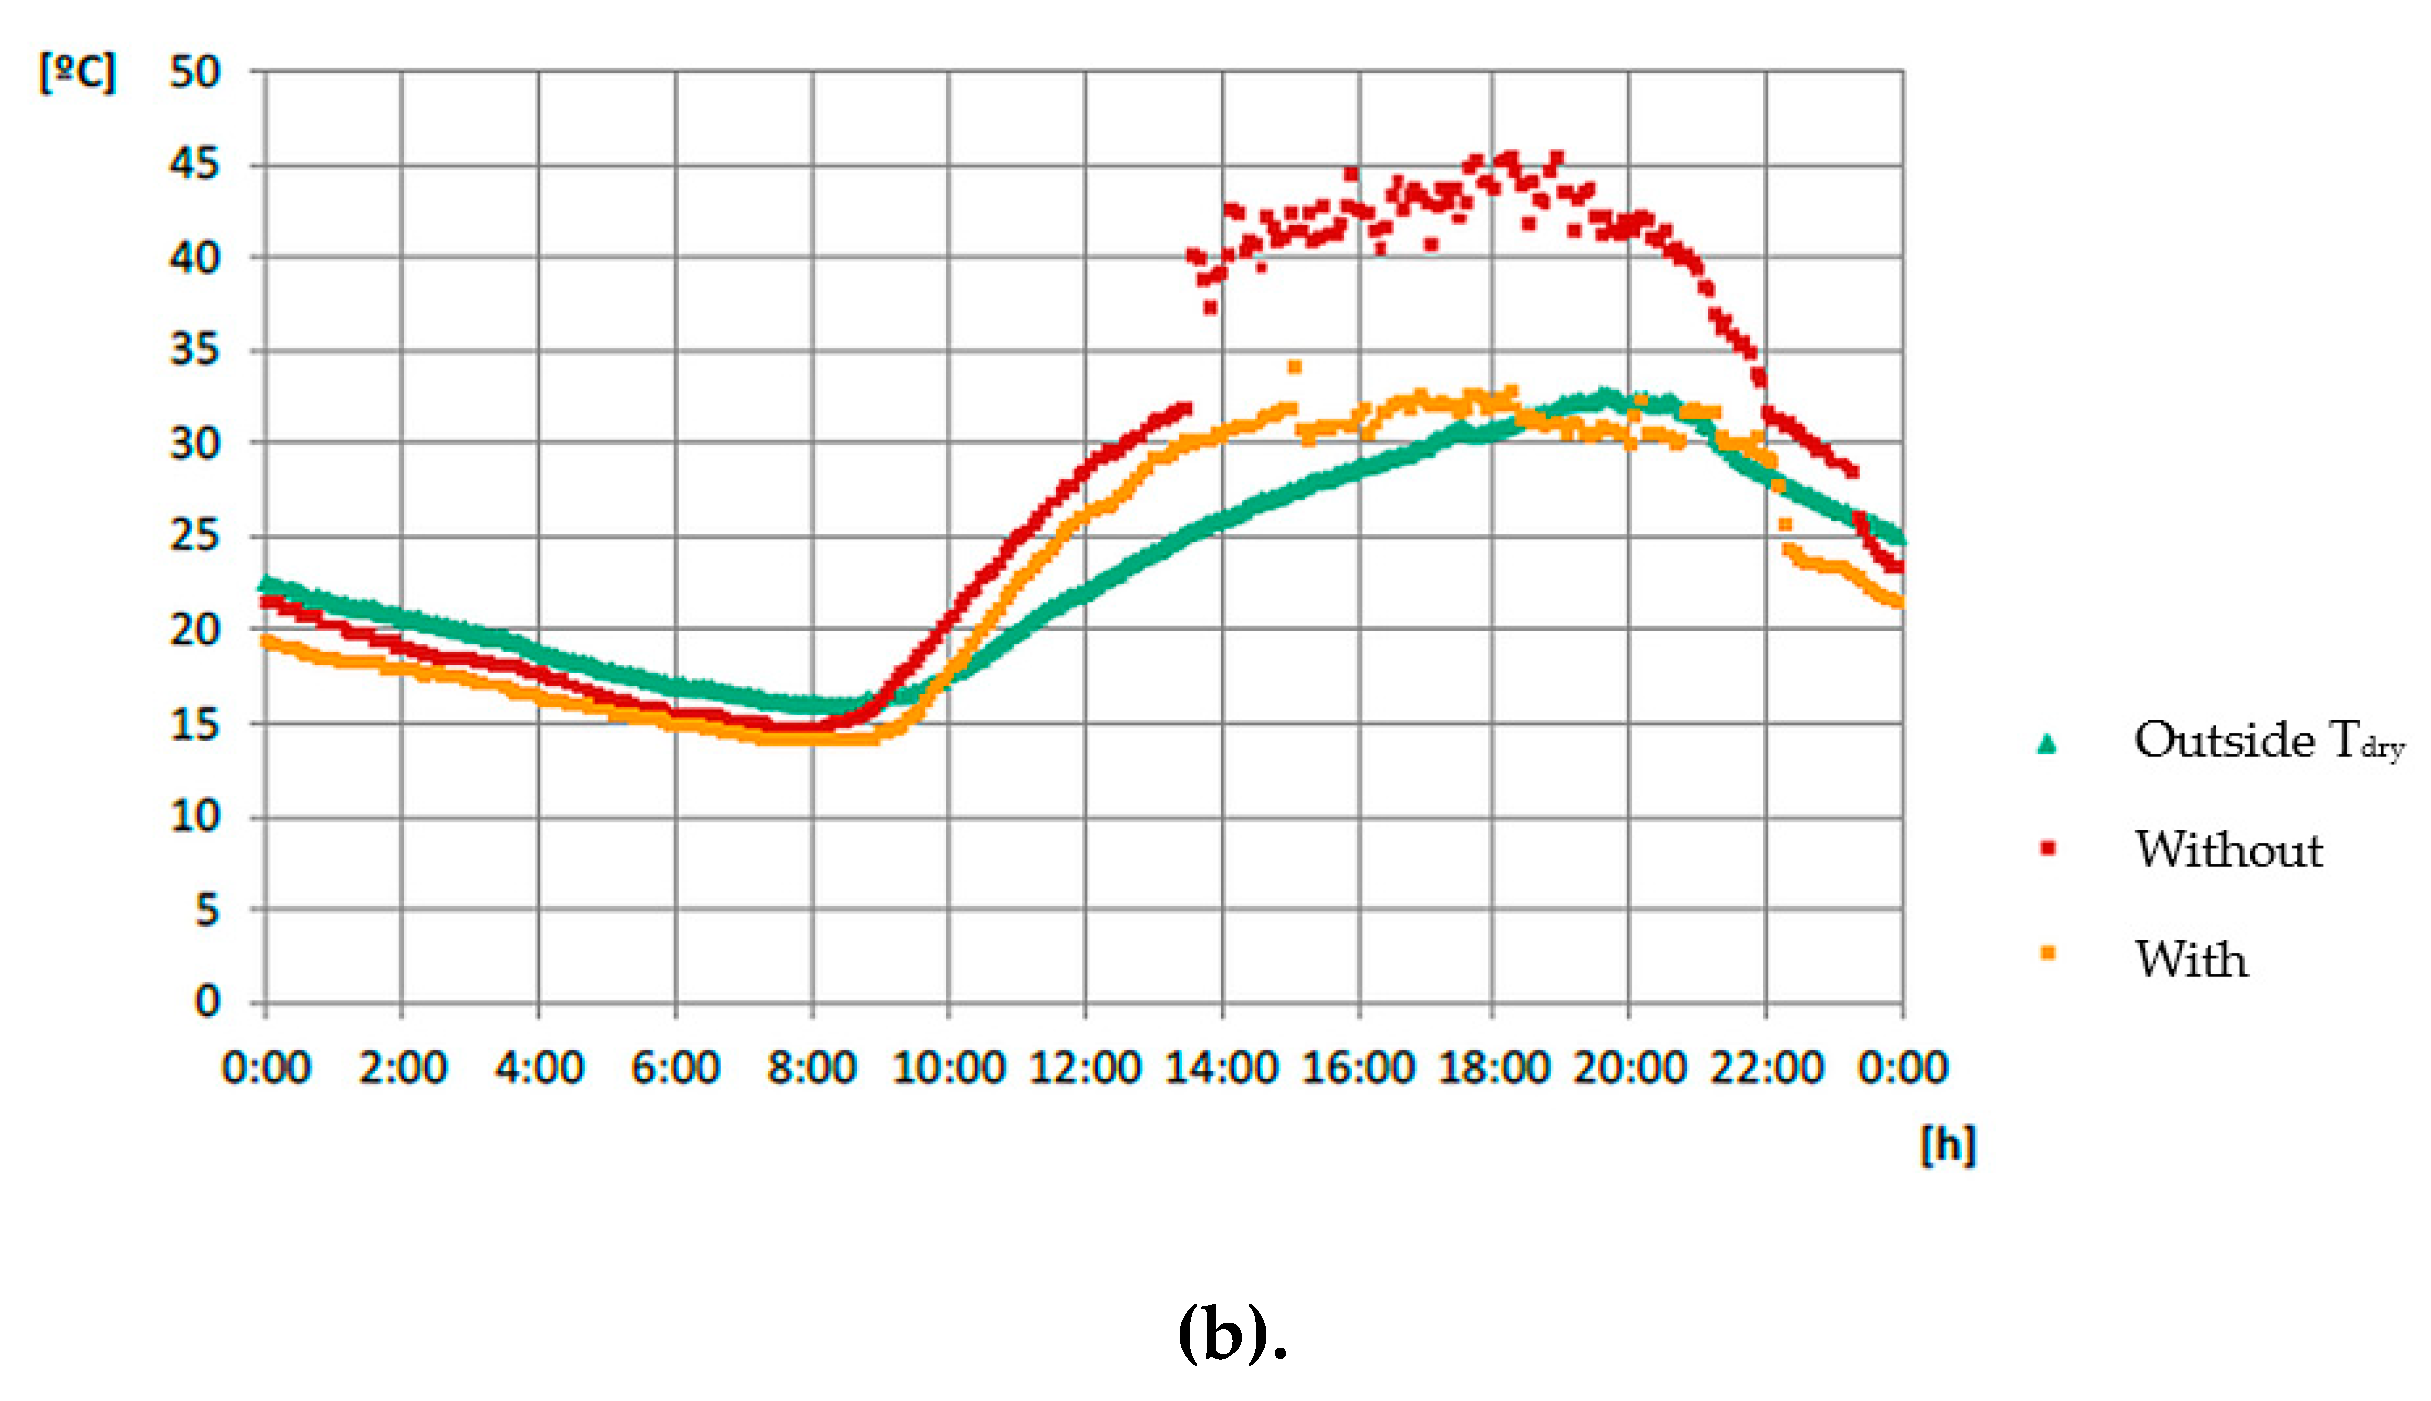
The operation of the evaporative cooling pad was programmed to run from 3:00 p.m. to 10:00 p.m., which corresponds to the consumption peaks of the building.
Figure 7 shows the evolution of the inlet air temperature at the condenser with and without the evaporative cooling pad and the condensation temperature with and without the evaporative cooling pad. In the case “without” the refrigerant condenses at 45 °C and “With” the refrigerant condenses at 30 °C.
The comparison of the performance of the chiller plant was made on the basis of: (i) the COP at partial loads and the ESEER in the summer period, (ii) the TEWI [
16] carbon emission reduction and (iii) the economic analysis.
3.1. COP and ESEER analysis
In order to calculate the average COP of the chiller plant the operating values are collected from the SCADA system every five minutes, operating “with” and “without” the evaporative cooling pad and are introduced in the following Equation (1):
where ṁ
w is the cooling water flow of the equipment (kg/s); cp
w is the specific heat of water (4.18 kJ/kg°C); ΔT
w is the difference between the outlet and inlet water temperature of the equipment (°C); φ is the chiller load factor; Ẇ
max is the power consumption when the chillers work at full load (kW).
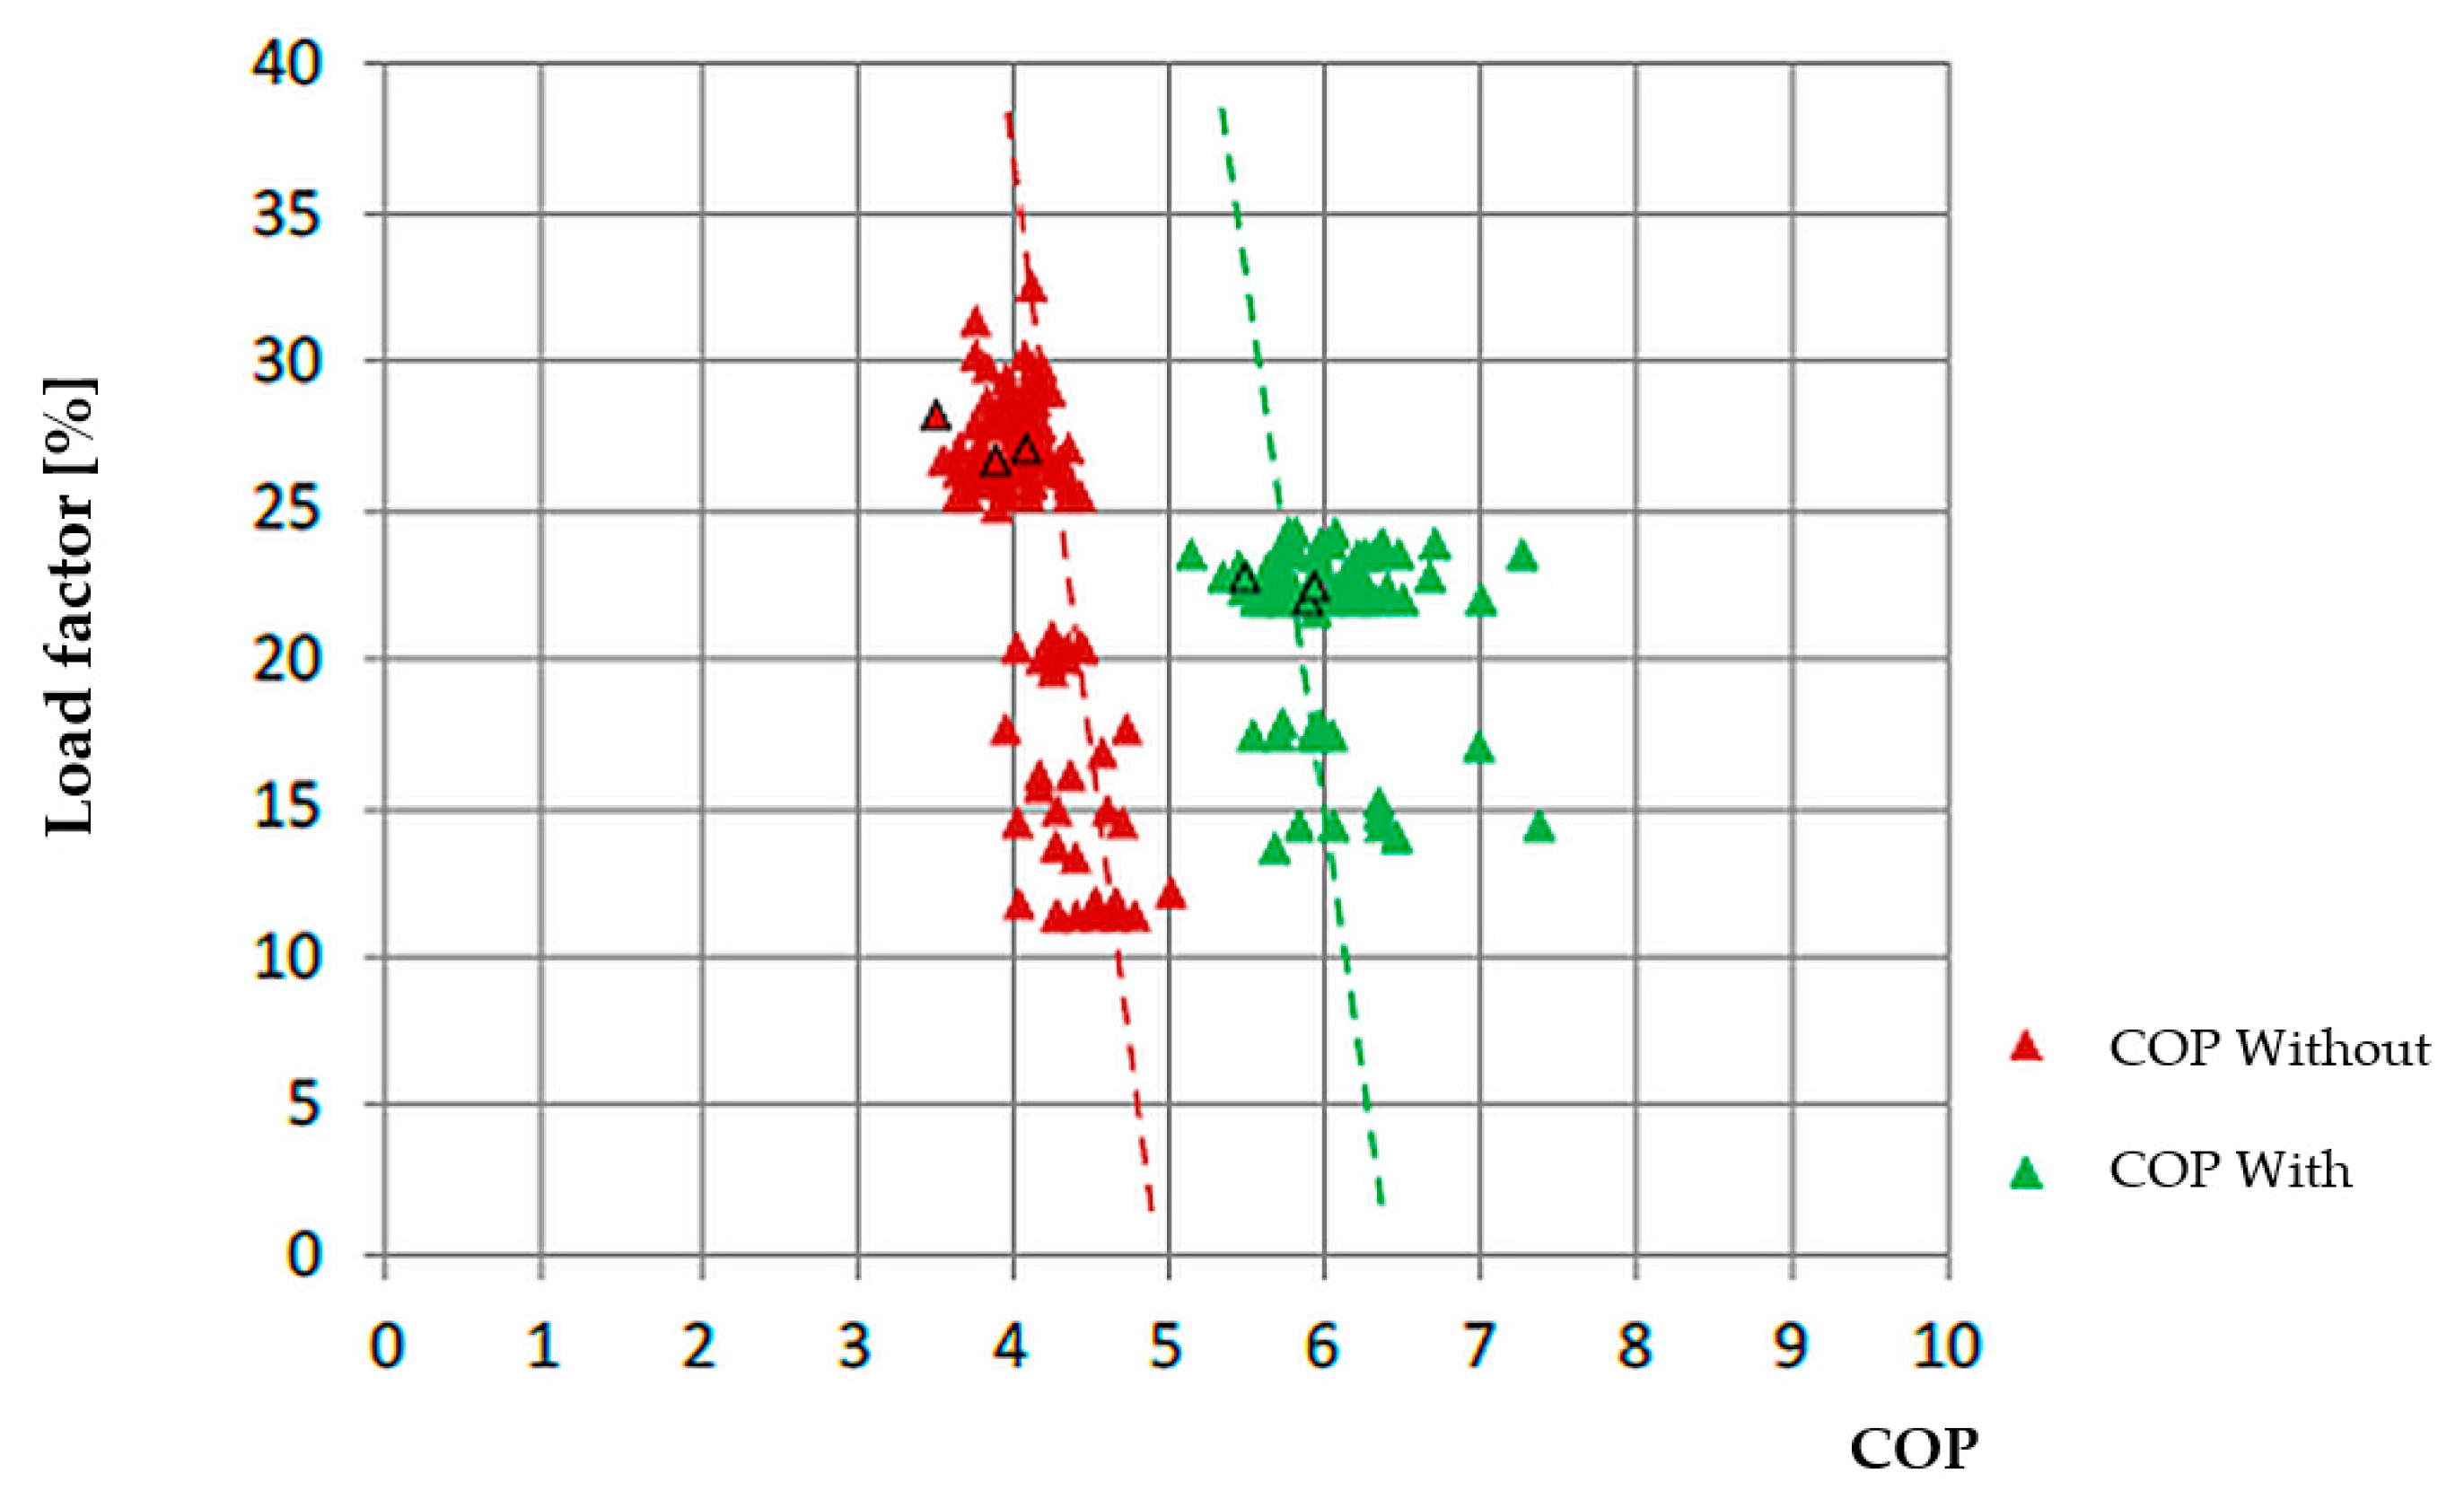
Figure 8 shows the calculated COP values for each load factor when the chiller plant operates “with” and “without” the evaporative cooling pads and the linear regression of each group of values.
Table 3 shows the average values for each load factor in order to get later the European Seasonal Energy Efficiency Ratio (ESEER).
Applying the definition of ESEER, the result is that “without” the evaporative cooling pads, the ESEER is 3.69 and “with” them, the ESEER is 4.83. The improvement in the ESEER is 30.89%.
3.2. TEWI Analysis
Total Equivalent Warming Impact (TEWI) is a measure of the greenhouse gas emissions (i.e., the global warming impact) associated with the use and disposal of a particular piece of refrigeration equipment. It considers two warming impacts: (i) the direct contribution of the refrigerant emissions to the atmosphere (from leaks, servicing losses and end-of-life disposal); and (ii) the indirect contribution due to the CO
2 emissions from burning of fossil fuels to generate the electricity needed to run the equipment. TEWI factor can be calculated as (2):
where GWP is the Global Warming Potential of the refrigerant; X is annual leakage of refrigerant, in kg; α
CO2 is the conversion factor to change energy use from CO
2; L is the operating lifetime of the system, in years; and E is the annual energy consumption (kWh/year).
The refrigerant of the system is R134a having a GWP of 1300 kg CO2/kg R134a. It is assumed that the system loses 5% of the refrigerant charge (390 kg) per year and that at the end of its lifetime, 90% of the machine’s refrigerant is recovered. The addition of the evaporative cooling pads does not affect the refrigerant charge, so the direct refrigerant emissions are equal operating “without” and “with” the evaporative cooling pads.
The lifetime of the chillers is 15 years and the CO2 energy conversion factor is 0.331 kg CO2/kWh. The improvement of the energy efficiency of the system implies reducing the electricity energy needed to run the equipment, so the indirect CO2 emissions from electricity generation are reduced when the system operates with the evaporative cooling pad.
TEWI of the system without an evaporative cooling pad is 4632.0 tCO2 and under the operation of the evaporative cooling pads before the condensers, there is a reduction of about 1000.0 tCO2 during the lifetime of the system.
3.3. Economic Analysis
Each chiller has a cooling capacity of 1442.3 kW, with an average operation of 12 hours/day during an average of 92 days, so the operating hours sum up 1104 h during the summer period.
The energy consumption of the chiller plant, according to the load factor of the ESEER for the summer season, without the evaporative cooling pad using the calculated COP values of
Table 3, is 247.78 MWh. By other side, considering the operation of the evaporative cooling pads when the load factor exceeds 7%, the electricity consumption is 215.18 MWh. Power consumption of the fans has not been increased due to the presence of the evaporative cooling pads and power consumption of the pump (500 W) has not been considered. Thus, the energy savings in the summer period are 32.6 MWh, using evaporative pads according to the strategy of using them in the hours with higher ambient temperature.
The economic study is based on the Pay-Back, the Net Present Value (NPV) and the Internal Rate of Return (IRR) considering the following initial conditions:
The price of the electricity in August was 0.114 €/kWh.
The installation of the evaporative cooling pads in a chiller involves an initial investment of 6000 € and increases the maintenance cost of the chiller.
The performance of the evaporative cooling pads decreases with water quality. Hard water produces calcareous deposits increased by lack of cleaning, depending on maintenance conditions. The building maintenance services disassemble and clean the pads during the winter season. Maintaining this routine, it is expected that the performance of the panels will be decreased by 25% per year, thus the lifetime of the pads is 4 years, when they will have to be replaced. The price of the evaporative cooling pads is 3500 €.
A timeframe of 15 years is established for the economic study, considering the expected life of the chiller.
Cost of capital (k) is updated according to the Consumer Price Index (CPI).
Considering these data, capital flow and, thus, the Net Present Value can be calculated according to the following expression (3):
where A is the initial investment; n is the timeframe; Q is the capital flow (savings-investment); and k is the cost of capital.
Table 4 shows the economic savings due to decrease in energy consumption per year, the investment and operating costs and the NPV per year.
It can be seen that the incorporation of evaporative cooling pads pays off in the second year, although the fact that new panels have to be installed each four years. The improvement in the ESEER for the summer season gives an annual economic savings due to the reduction in the energy consumption of 3716.40 euros. The NPV at the 15th year is 23,119.64 euros without considering that, as with the incorporation of the evaporative cooling pads the electricity consumption is lower than the maximum contracted power, penalties for power exceedance are removed.
4. Conclusions
The incorporation of 100 mm thick evaporative cooling pads before the condenser of air-condenser chiller reduces the condensation temperature by 11 °C, increasing the relative humidity by 50%. Under these conditions, the refrigerant condenses at 30 °C instead of 45 °C.
Based on the measured data of the performance of the chiller plant without and with the evaporative cooling pads, COP values were calculated for each load factor at both conditions, obtaining the average COP values per load factor. With these data, the ESEER has been calculated resulting in an increase from 3.69 without the evaporative cooling pads to 4.83. It represents an improvement of 30.89%.
Taking into account that the incorporation of the evaporative cooling pads does not affect the refrigerant charge but it affects the electricity power consumed due to the improvement of the ESEER, direct refrigerant emissions remain equal for both cases but indirect CO2 emissions associated to power consumption are reduced when the system operates with the evaporative cooling pads. TEWI of the chiller plant has been reduced by 1000.0 tCO2, considering that evaporative cooling pads operates 12.60% of annual hours.
A complete economic analysis of a 15-year project with an estimated capital cost of 4.34% has been carried out. Savings due to the decrease in compressor power consumption caused by the installation of evaporative cooling pads technology are 32.6 MWh, thus an economic saving of 3716.40 € per year. A forecast of annual and accumulated savings has been made using the NPV, obtaining a value of 23,119.64 euros at the 15th year, although having to substitute the evaporative cooling pads each four years and not considering the removal of the pay penalties due to power exceedance.
The payback of the investment is less than two years, so the project is viable, profitable and has a fast return.

 ,
, 


