Energy Modelling as a Trigger for Energy Communities: A Joint Socio-Technical Perspective
by
 ,
,
Viktor Bukovszki
1, 
Ábel Magyari
1,
Marina Kristina Braun
1,
Kitti Párdi
1 and
András Reith
1,2,* 1
Advanced Building and Urban Design Ltd., 1139 Budapest, Hungary
2
Research Group ‘Well Being Research Incubator’, University of Pécs, 7624 Pécs, Hungary
*
Author to whom correspondence should be addressed.
Energies 2020, 13(9), 2274; https://0-doi-org.brum.beds.ac.uk/10.3390/en13092274
Submission received: 16 March 2020
/
Revised: 19 April 2020
/
Accepted: 26 April 2020
/
Published: 5 May 2020
(This article belongs to the Special Issue Energy Efficient Cities of Today and Tomorrow)
Abstract
:Mainstreaming energy communities has been one of the main challenges in the low-carbon transition of cities. In this sense, urban building energy modelling (UBEM) has an untapped role in enabling energy communities, as simulations on urban models provide evidence-based decision support to reduce risks, engage, motivate and guide actors, assert wider policy goals and regulatory requirements. This accelerating role and the potential of UBEM is not sufficiently understood, as research into energy community focuses on its barriers and impacts, while the research of UBEM is mainly technologically oriented. This review takes a sociotechnical approach to explore whether UBEM is a technological trigger for energy communities, furthering the conceptual framework of transition management. factors influencing energy community progression in different use-cases and stages of their lifecycle are compiled to assess the affordances of distinct capabilities of prevalent UBEM tools. The study provides a guide for energy community planners to UBEM. It matches different tool capabilities to the various stages of the project lifecycle for the different use-cases, equipping them with the means to accelerate the low-carbon transition of cities from the bottom-up. Finally, the study defines a development trajectory oriented towards application in urban sustainability to a rather new UBEM field.

1. Introduction
1.1. The Need for Energy Communities in Low Carbon Cities
Energy communities (EC) have been steadily gathering attention, as social innovations potentially driving the decarbonisation of energy systems through its democratization. Although they are widely researched from sociotechnical, socioeconomic, governance, psychosocial perspectives [1], the definition of energy communities is contested due to the term community being itself debated [2]. Energy communities, however, can be recognized as a collective of actors voluntarily mobilized around a shared objective relating to energy—either shared management of energy systems or collective purchasing of energy [3].
The significance of ECs is their potential role in driving the decarbonisation of cities, promoting investment in and access to clean, affordable energy, responding directly to at least goals 7 and 11 of the UN sustainable development goals [4]. By investing in decentralized renewable energy production assets in energy efficiency, they contribute directly to the energy system decarbonisation [2,5]. Even more profound value is seen in giving control to the ones who benefit from the outcomes, in the process of producing them [6]. Community energy projects aim to mobilize and empower consumers, previously on the fringe of a vertically integrated energy market. This decentralization is seen as a tool to democratize energy systems [7], granting voice, power and ownership to individuals, community groups and municipalities [2,8,9]. This arrangement has multiple benefits. First, it recruits grassroots human resource to drive decarbonisation, to identify and solve local problems through public innovations and to translate sectoral cooperation to multiplicative community benefits [10,11]. Second, behaviour change to more sustainable lifestyles is more likely to occur when also driven by intra-group solidarity and peer effects than global environmental problems [12]. Finally, energy communities may act as policy labs, niches for governments to pilot new regulatory frameworks [8].
In western countries, ECs are trending while legislation is catching up. There are currently around 3500 recognized renewable energy cooperatives in Europe, mostly in Germany and Denmark [13]. The European Commission released the ‘Clean Energy for All Europeans’ Package in December of 2018, which provides a legal ‘enabling’ framework for the participants of energy communities [14]. The Member States are due to adapt the regulations into their national legal system by 2021 [14]. This legal framework enables the members of energy communities to be the beneficiaries of activities, such as “generation, distribution, supply, aggregation, consumption, sharing, storage of energy and provision of energy-related services” [13]. Since there are differences between the aforementioned two types of energy communities, the Clean Energy Package includes the Internal Electricity Market Directive (EU) 2019/944, which states the definition of citizen energy communities (CEC), while the revised Renewable Energy Directive (EU) 2018/2001 defines the renewable energy communities (REC) [13]. Both directives emphasize the shift in the role of citizens from passive consumers to energy prosumers in the energy system, and both EC types as legal entities have common characteristics, like the goal of achieve social, economic and environmental benefits, and must be open and voluntary for all citizens without discrimination [15]. CEC however is a more general and REC is a more restrictive concept, with differences such as locality not being required for CECs [13], energy can be generated from fossil-fuels, as well as from renewable resources in CECs [15] and RECs exclude the participation of large enterprises [13].
In the US, regulatory barriers are more pronounced. The Federal Energy Regulatory Commission (FERC) has the authority at national level over interstate transmission and wholesale price [16]. However, FERC does not have the authority over power transactions for distributed generation (DG). There are entities therefore which fall under FERC jurisdiction, some fall under state jurisdiction and some under both [17]. Moreover, the crucial security regulations by the Security Exchange Commission does not disambiguate whether community energy counts as security [18].
Regarding policies, on the federal level, renewable investment is incentivized via tax credits, but without special provisions for community projects, while states have a variety policies towards community energy (e.g., Virtual Net Metering (VNM), Statewide shared energy programs, incentives) [19].
1.2. The Significance of Urban Building Energy Modelling
Energy modelling on the building scale is a mature and complete field, providing reliable decision-support for building energy design [20]. Urban building energy modelling (UBEM) seeks to upscale this field to better understand of new and existing neighbourhoods and assess urban energy systems described by Keirstead et al. [21] as “formal systems that represents the combined processes of acquiring and using energy to satisfy the energy service demands of a given urban area”. While research in UBEM has surged [21], it is still yet considered “half-baked” [20] and has tremendous potential.
Sola et al. [22] describes Urban-scale Building Energy Modelling (UBEM) as part of Urban Scale Energy Modelling (USEM). According to them and Allegrini et al. [23] USEM is capable of modelling not just building related, but multisectoral energy flows including grid, mobility, microclimate, therefore accurately model district urban energy systems. Part of this is UBEM which can simulate energy demand of the building stock by combining energy models of standalone buildings into a summarized district-scale model. According to another definition form Reinhart and Davila [24] UBEM is a tool able to simulate energy demand on a city block, district, entire city or even on a bigger scale. Goy and Finn [25] differentiate small- and large-scale energy modelling at five buildings/households in their review [25]. On small scale building energy modelling is where the aim is to obtain data for internal thermal control, or thermal loads, however at large scale energy modelling aim is to predict performance indicators like building energy consumption, CO2 emission and new policy impacts [25]. It is a necessity when considering place-based ECs to have information about the building energy demand, since according to [3] these type of ECs gather on spatial basis and are based on shared ownership, typically in blocks, flats, building blocks or districts. While USEM, as described above vaguely refers to multisectoral energy flows in urban context and examples mentioned in [22,23] also incorporate tools which do not take building energy demand into consideration, for the purpose of this study we considered USEM as tools which can model building energy demand, and other energy flows as well.
UBEM’s significance is multifaceted. Simulations promote market competitiveness, which in a liberalized market is strongly tied to the success of a new energy paradigm [26]. Urban scale simulations can provide a better understanding of the optimum combination of building and area specific measures and interchange of energy options [27]. Through benchmarking they can provide transparency [28] in energy efficiency markets, therefore growing trust and increasing investment appetite [29]. Analysing different scenarios can contribute in the development of consumption awareness and therefore raise consciousness for the sustainable environment [27], also capable of helping energy policy formulation since it frequently leans on the evaluation of overall building performance [30].
1.3. Gap in the Research Fields
The potential of energy communities remains theoretical, and communities themselves exist in niches of a few industrialized, developed nations [1]. Studies setting up the research agenda for energy communities point out an empirical gap in understanding “who the project is for [...] and how do they benefit” [6]. This is a common theme for energy communities, both their design and their research seem ill-equipped to fully map the distributional aspects of the multiple impacts of projects [6]. This is partly due to the convention to take buildings as isolated units of investigation for planning energy [31]. The influence of urban surroundings on their energy performance has not been properly incorporated as well as the interdependencies that may occur amongst them [31].
This means both community energy research and practice lack the tools to incorporate emergent properties on the urban scale such as microclimate, renewable potential or load-curve differences [32]. Regarding practice, this results in major barriers to progress community energy projects, because it means uncertainties are high, participant and supporting networks cannot be established on a performance-basis, regulations, policymakers and financers are more difficult to be convinced [2]. Regarding research, this is evident in calls for more empirical knowledge on the changes community energy delivers [6]. This means that the gap in research—lack of evidence in the distributional multiple impacts of energy communities—can be traced to missing means to produce such evidence, which would also be a trigger for the practice of energy communities. Hypothetically, urban-scale energy modelling could be such a tool, but the two research fields have not yet met, there are no reviews on the potential of UBEM in advancing ECs (see Section 2). Studies of UBEM are technically focused, lacking application-oriented classifications to assess potential in energy communities, while studies on EC do not explore technological triggers to overcome barriers (see Section 2).
1.4. Theoretical Background
The following two subsections justify the research gap by summarizing recent reviews in both EC and UBEM, showcasing a lack of intersections in previous studies. Subsequently, a new conceptual framework rooted in transition theory is defined in which the research gap will be filled.
Previous reviews concerning EC can be grouped according to their subject of focus: one group studies community energy in general, while others specialize in a specific type of energy community—characterised by their core activity. Schoor et al. [1] made a review of community energy research identifying that most studies come from developed countries and that there are different networks building up the discourse—however, these networks rarely interact. Brummer [2] collects definitions of community energy, its benefits provided for society and the barriers of EC projects. Berka et al. [12] and Roby et al. [33] investigate community energy impacts with different approaches. Nolden et al. [34] move on to business models, particularly in the UK, and how they evolved over time. Ceglia et al. [35] propose a standard for smart energy communities. Drivers and barriers feature in most previous studies, Lehtonen et al. [36] explore the role of trust more deeply. Moroni et al. [3] use a transition theory approach to classify energy communities, introducing the distinction between place-based and non-place-based communities.
Most of the specialized studies focus on renewable energy communities. Creamer et al. [6] have developed a conceptual framework and sets the focus of research on impacts, while others studied impacts [37,38] and monitored adoption [39]. Hess et al. [40] and Joshi et al. [41] made comparative reviews of multiple case studies, with the former focusing on country-level differences, and the latter exploring how justice is addressed. Bauwens [42] collects factors determining investment. Regarding institutional drivers, Heldeweg et al. [43] outlines and argues for a distinct legal form for renewable energy communities in a separate institutional context, while Petersen [44] analyses municipal energy plans as instruments.
Out of the remaining specialised studies, Gorroño-Albizu et al. compares community ownership models for renewable energy production and microgrid ownership [45]. Others [46,47,48] focus on community energy storage, its potential role, challenges, social, environmental, economic impacts, with an extended description of applied technologies. Warneryd et al. [49] explores institutional frameworks that drive microgrids, while two reviews [50,51] collects general microgrid drivers and challenges. Van Cutsem et al. [52] is a study on demand-response communities and the process of decentralization. Peer-to-peer electricity markets are the focus for Sousa et al. [53], classifying market designs, motivations and challenges. One review conceptualizes energy cooperation in industrial parks [54]. Finally, three reviews focus on broader “green neighbourhoods”, community projects with more complex sustainability profiles, where energy is one component [32,55,56].
Review articles are considerably scarcer with technological factors of EC progression. While there is extensive literature on drivers, barriers and challenges of multiple EC types, and they are linked to institutional, social or economic interventions, this review will continue by investigating how technologies relate to these drivers, barriers and challenges.
In case of UBEM, numerous reviews have been done, however only outside the field of energy communities. In most cases the reviews differentiate the UBEM tools regarding their approaches. Swan and Ugursal [57] and many others [58,59] differentiated 2 mainly different building energy modelling methods: Top-down and Bottom up. Some of the reviews like [60,61] are focusing on classifying UBEM tools by this methodology. Li et al. [60] in their review classified the UBEM models in the aforementioned way, and emphasized the advances and still existing discrepancies in geospatial techniques. Abbasabadi et al. [61] described strengths and limitations by each method and extended their research further on urban scale energy simulation.
Sola et al. [22] expressed the need for a new hybrid tool for properly model energy use at urban scale incorporating other urban scale energy uses. [22] with the same approach reviewed not only UBEM tools, but holistic USEM tools They used a decomposition framework, where tools are decomposed into sub-models and their sub-models are reviewed as well. In addition, further explored how integrated and co-simulation platforms can work individually and together.
Allegrini et al. [23] reviewed 20 tools which can model neighbourhood level energy systems. In their review they created a comprehensive matrix where the capabilities of the twenty reviewed tools can be compared and screened easily. Reinhart et al. [24] reviewed models which are based on a bottom-up methodology. They provided a comprehensive review about the existing workflows and challenges in modelling in such a way due to the lack of data.
Ferrari et al. [62] reviewed 17 tools where these tools were classified based on their most useful features [62]. Their goal was to identify user friendly tools with hourly or sub-hourly outputs. Six of them were identified in the paper. Manfren et al. [26] assessed tools for distributed generation projects. They decomposed the distributed generation adoption into work phases and paired them with tools according to their inherent features. It is clearly visible that most reviews are presenting UBEM as a technological niche itself, hence this review will reposition UBEM and USEM tools as part of a socio-technological framework.
Given the divergence of previous studies, a discourse to conceptualize the research gap must be defined. While multiple research fields engage in the investigation of energy communities [1], this study is positioned in the field of transition management due to its core tenet being built upon the entanglement of social and technical practices [63]. At the heart of its conceptual framework is the socio-technical system, in which the multi-level perspective (MLP), helps to visualize how the energy communities as the social niche with the contribution of a technological novelty (as UBEM) can make a shift in the prevailing regime of the energy sector Figure 1.
The regime is the meso-level comprising of the dominant socio-technical system [65]. The regime defining the energy sector is influenced by the relation between social interests, like policies and regulations (from municipal, national, supranational levels), user preferences, which is characterized by a lack of choice awareness, energy dependency and the passive demand side in the energy system in a centralized, vertically integrated energy market [66]. MLP states that transitioning this regime towards decarbonisation is dependent on the novel technologies entangled with social change [63,67]. On the one hand, this is pushed from the micro-level, in niches, where technological innovations are sheltered from the selection of mainstream market [65] (Figure 2). On the other hand, the external factors are also essential in order to transform the regime, which in the context of MLP is the landscape (macro-level). The landscape can include extreme events, such as climate change, but it can also be less conspicuous events, like urbanization, or energy security concerns [65].
In this context, ECs are social innovations existing on niche level that need to progress from the protected environment into small market niche and eventually larger market niche. The strategic niche management (SNM) discourse explores the factors and process of niche progression [63,67]. A bottom-up initiative, like the energy communities as social niche can affect the regime, in this process the ECs become nodes in the decentralized energy sector, which can include the energy production, consumption as well as management. The members of community turn into prosumers from consumers [2]. This transition decreases their dependency on the vertically integrated energy market. Moreover, the change in regime can also occur as the involvement of users into the energy system, which raises awareness on the energy related issues, as well as on sustainability, thus increases their choice awareness. This, in combination with landscape pressures that provide a window of opportunity is the precursor for regime transition.
While the SNM emphasizes the dominant role of the niches in the replacement of regime, the transition does not depend on a single factor, rather different dynamics must reinforce each other on multiple dimensions. In that regard SNM usually focuses on the technological novelties as the dominant forces to make a shift in the current regime arguing for complementary social, institutional, behavioural change [63,67]. In other words, it focuses on technological niches, and how they can be enriched by a social perspective, but not the other way around. However, in case of ECs, it is the social novelty—with enabling technologies—that would eventually replace both the prevailing technology and social, political as well as cultural practices (the regime), ultimately feeding back to the landscape level [64,65].
By shifting the focus to a social innovation at the niche force driving change, and the technical innovation as the support, the conceptual framework of transition theory must be expanded to characterise this support. The theory of affordances is applied as an approach to link technological characteristics to the psychosocial, socioeconomic and governance factors describing EC drivers and barriers. Originally a concept describing complementarity between animals and their environment [68], affordance refers to the range of interactions possible between an environment and an agent operating within it [69]. In the field of design, the notion is used to sort the behaviour not only made possible, but also suggested by specific design features, in other words, the perceived affordances [70]. In this case, affordances are inherent in the object, technology, artefact, and more importantly, are influenced by design choices [71]. However, affordances are differentiated from capabilities or functionalities, as the same capability can have different affordances in different goal-oriented actions [72,73]. In the context of UBEM for example, the capability to predict energy demand affords evidence-basis for planning for consumers, but also affords risk elimination for a potential investor. Affordances that are intended by a product or technology, affordances that are suggested by its design features and actual observed behaviour are expected to deviate—the size of the gap is usually an indicator of good user-experience design. It is also important to note that by affording a set of interactions over others, features of technologies or environments do not only influence individual behaviour, but indirectly afford organizational models, routines, social practices in general, [74,75]. Thus, the notion of affordances fits the discourse of sociotechnical transitions well and is a useful method to articulate what exactly is in technology that breaks down a non-technical barrier, and how. This review offers a methodological contribution to transition theory by expanding its conceptual framework with affordances, which will allow investigations in the role of technology in accelerating social innovations, social niches.
1.5. Research Aim
The primary, practical objective is to explore whether a social niche—energy communities—can be cross-fertilized by a technological one—urban building energy modelling. The main research question is built around the phrase “technological trigger”, which in this context describes multiple ways a technology enables or supports the penetration of an innovative social concept. This, in the context of energy communities means three things: it can either trigger the creation of new energy communities, it can accelerate the growth or diversification of energy communities and it can push the social niche of energy communities towards becoming absorbed by the regime. On that premise, the main research question and its decomposition is as follows:
Main research question (MRQ): Is urban building energy modelling a technological trigger for energy communities?
RQ1: Which factors trigger energy community progression in different use-cases?
RQ2: Which factors trigger energy community progression at their different lifecycle phases?
RQ3: Is it possible to identify different utilities of UBEM tool-types during the lifecycle of energy communities?
The main research question refers to matching UBEM against specific factors that influence the progression of ECs from social niches. Therefore, the answer will provide a set of these factors and argue how UBEM interacts with them. Subsequent research questions disaggregate this answer in three ways: by use-cases of ECs (RQ1), by EC lifecycle phases (RQ2), by UBEM tool types (RQ3). Investigating them are justified by three hypotheses that express such disaggregation will be meaningful (see H1, H2, H3 below).
RQ1 is required as the common classification of ECs differentiate them by their functional diversity (single-purpose, and multi-purpose) or by location specificity (place-based, non-place-based) [3]. On the one-hand UBEM tools themselves are place-based, narrowing the scope of the study. On the other hand, it is expected that the core activity of the energy community, for example whether it is providing flexibility services, invest in renewable energy production, will have different challenges, development processes and different potential entry points for UBEM or other technological innovations. This expectation is expressed in hypothesis H1, where EC use-case is defined as the core energy management activity, which is being shared:
Hypothesis (H1).
Different use-cases of energy communities have different factors to progress from niches to which UBEM tools respond differently.
Second, it is reasonable to expect that different challenges burden ECs during different phases of their lifecycle. It is also a possibility that similar challenges in different stages respond to UBEM features differently. RQ2 thus disaggregates the MRQ to lifecycle, and the expectation is expressed as hypothesis H2:
Hypothesis (H2).
Energy communities in different lifecycle phases have different factors to progress from niches to which UBEM tools respond differently.
Finally, it is reasonable to expect that UBEM itself has the variety to offer different strengths either per use-case or per lifecycle phase. This means, again, a disaggregation of the main research question to an UBEM tool classification (RQ3), to which a third hypothesis is formulated:
Hypothesis (H3).
Different types of UBEM tools accelerate energy community progression from niches differently.
In the light of previous reviews and the theories, answering the main research question also carries over to practical objectives in providing a manual for EC planners to the world of UBEM and in raising awareness for future R&D trajectories for UBEM. Literacy in UBEM is hypothesised to give means to justify EC potential in low-carbon transition of cities and communities. On the other hand, application-oriented analyses of UBEM tools, such as this study, will provide criteria for UBEM development as it seeks its appropriate market. Finally, with the introduction of affordances to the conceptual framework of the multi-level perspective, a third practical objective of the study is to expand the scope of the SNM literature to technologically enabled social (sociotechnical) niche management. This is done so through demonstrating the conceptual framework based on affordances on the case of UBEM enabling ECs.
The remainder of the article is structured as follows: Section 2 presents the methodology of a two-tiered systematic literature review and builds an analytic framework by expanding a strategic niche management approach with the concept of affordances. In Section 3, results are presented as follows: Section 3.1, Section 3.2 and Section 3.3 contain the results of the EC meta-review, and Section 3.4 is an analysis of UBEM tools in the EC context. In Section 4, the known limitations of this paper are discussed followed by the reflections on the original research questions and pointing out possible trajectories for future work. Finally, the last section completes the paper with the conclusion in Section 5.
2. Materials and Methods
2.1. Research Design
To answer the research question, a new analytic framework was first designed that decomposes both energy communities and UBEM tools to information entities relatable to each other, namely: EC progression factors and capabilities of UBEM tools. Then, a two-tiered systematic literature was conducted into the research of EC and UBEM, respectively, to collect these information entities. EC use-cases and lifecycle phases were identified to answer research sub-questions. Finally, the results were matched to see the potential interactions between UBEM and EC as the EC-specific affordances of UBEM (Figure 3).
To meet the research objective of providing a manual for EC practitioners, the EC analytic framework must consist of features corresponding to disaggregation requirements of the main research question, namely: different use-cases, a breakdown of typical life-cycles, and a collection of progression factors. In the framework, the features for the analysis of UBEM are the progression factors, while use-cases and lifecycle phases are structural metadata assigned to the factors. The working definition for progression factor in this study is any condition that is indicative for the progression of energy communities through their lifecycle. Progression factors were extracted from the reviewed articles and labelled by which lifecycle phase and which use-case they are relevant for. This labelling was essential to answer research questions 2 and 3. Apart from essential structural metadata, supplementary labelling schemes describing the importance of each factor and the discipline with highest authority in them were added. The supplementary metadata were chosen to support the practical objective of providing a manual for EC planners, and were selected due to availability of information, based on a preliminary review of the literature. All categories in essential and supplementary metadata were defined from the literature, and not top-down—meaning alternative categorizations are valid. With four distinct categorizations, the factors were analysed on their relationships to each other by inspecting pairwise correlations among categories and by agglomerative hierarchical clustering using the UPGMA algorithm [76] (Supplementary Materials). The reason for inspecting this relationship is to validate whether the categories are redundant, and to see how factors can be bundled together for communication to EC practitioners.
The UBEM analytic framework was an amalgamation of the frameworks of four most prevalent UBEM tool reviews [22,61,62,77]. The features used to describe and classify UBEM tools in these four articles were taken as UBEM capabilities for coupling against EC progression factors. However, not all UBEM approaches were considered relevant for the research question. Generally, UBEM can be classified into two distinct approaches: top-down and bottom-up [57,58,59], complemented by hybrid approaches which combine the two [59,60,78]. Top-down modelling was excluded from this study, as they are incapable of modelling complex scenarios in energy transitions due to their reliance on aggregated historical statistical data and they are not able to consider different energy saving measures in different spatiotemporal situations, or occupancy types. [78,79].
Categorisation of UBEM tools evolved naturally as they became more mature and acquired more functions. Analysis of frameworks from four [22,61,62,77] of the collected review articles were used to define a comprehensive analytic framework.
For the analytic framework of this study, all features of bottom-up and hybrid modelling tools that were present in more than one article were automatically retained; the rest went under a systematic preselection process (see Table 1 for list of selected and filtered features). Features were excluded if: (1) they were duplicates, or included in the other features (e.g., exo- or endogenous demand modelling, Impact of user behaviour, Time horizon); (2) does not correspond to the working UBEM definition (e.g., building stock location, building characterization); (3) there is not sufficient information in the reviews and the original articles of the tools (e.g., non-residential type of building, input type).
However, not all analysed tools were present in all four reviews. The original articles of the included tools were used to fill in missing features to avoid information gaps. All, but 12 feature-tool couplings were filled this way. As in the case of EC progression factors, a typology of tools based on these features was produced via agglomerative hierarchical clustering, using the UPGMA algorithm [76], and a pairwise correlation matrix was produced. Again, this exercise was used to see whether there is a useful categorisation of tools, and to test whether the UBEM capabilities (the final list of features) are all necessary.
Finally, the relationship between EC and UBEM was justified through the concept of affordances, using EC progression factors as key performance indicators for the UBEM capabilities. Constructing an affordance is not defining a single feature but is discussing the way a certain user appropriate features for goal-oriented actions [80]. At its core, an affordance is the dynamic between features and actions, that is: the feature, a set of actions made possible by that feature, and the way the feature facilitates those actions [81]. This also means that an affordance is situational, as facilitation would occur for certain users, in certain contexts, which must be specified to justify an affordance [82]. Finally, the actions afforded must relate to the goal of the user [73,74].
Therefore, these six components, features, actions, facilitation, user, context and goal must be present to define an affordance (Figure 4).
In this study, the EC progression factors, and their metadata define the context and goals, while UBEM capabilities refer to features. Taking the EC planner as the user, an affordance can be specified by describing facilitation, and actions that are linked to user goals. Thus, an affordance exists if (1) in the context defined by EC use-case and lifecycle, (2) for an EC planner or project manager as a user, there is a (3) set of UBEM capabilities that (4) facilitate (5) a set of actions to (6) reach the goal of the user defined by meeting one or more progression factors. If the six components are justifiably present, the affordance exists. As progression factors were already classified by use-case and lifecycle phase, affordances could also be examined against both. This provides the necessary disaggregation for the research sub-questions, while a collection of justified affordances is the answer to the main research question.
2.2. Data Extraction
To extract information for analysis, two secondary data sources are investigated: review articles and case studies of energy communities. Thus, the feature extraction phase consists of an overview of reviews with the scope of review articles and meta-analyses and a systematic review with a scope of case studies. This distinction is chosen as recent reviews will not cover recent case studies, and because case studies are expected to yield more information on project lifecycle, while reviews are expected to give a better overview of EC use-cases. Both data sources are expected to return progression factors. The review of UBEM tools will rely on the secondary data source of UBEM proof of concept studies. The second phase of the research is also a systematic review, with the scope of UBEM tools.
The Scopus database was chosen for publication selection for its larger share of unique citations in both social science and engineering citations [83]. For the overview of reviews, the search term (“energy community” OR “community energy” OR “energy cooperative” OR “citizen energy”) AND “review” was used for review. The time period for search was set to 2018-2020 at first, with annual extensions planned if insufficient information would have been generated—however, database was saturated with the first batch, see paragraphs below. For the review of case studies, (“energy community” OR “community energy”) AND “case study” was used for the same years. For the review of UBEM tools, “urban” AND “energy” AND “model” was used for years between 2015 and 2020.
In all cases, the articles went through a preselection process (Figure 5). Titles were checked for overall domain relevance, while the abstracts were read for a relevance of the narrower topic. For example, an article on nutrition [84] was filtered out in the first step, while another [85] was filtered out in the second step, as it was a study on energy, however not on community energy as per definition. In addition to relevance check, articles had to be reviews, case studies and original articles introducing new UBEM tools, respectively. Finally, the following exclusion criteria were defined: the geographical scope is limited to the EU/US and cases where EC is the only viable alternative for energy distribution due to various constraints such as remote communities. These criteria were applied to meet the practical objectives of the study.
The final articles, after confirmation in the text, that they contribute to study results, were selected in a bottom-up manner, by defining a threshold for data saturation. The data saturation threshold is a way of determining after how much articles does the research become redundant [86]. In studies, where the task of the observations is to provide new labels or classes, there is a characteristic saturation curve, plotted as the number of observations against the quantity of new labels accumulated with each observation. This curve is steep for the first “n” observations and flattens out afterwards. A flat curve means that repeated observations will likely not yield new labels, the database is saturated. Data saturation curves were used for the overview of reviews and the review of UBEM tools (Figure 6). The observations were the articles read, and the labels were the progression factors and the UBEM tools respectively. The threshold conditions for saturation were set as the difference quotient for observations On − On−3; On − On−5; and On − On−10. The three ranges were chosen to decrease sensitivity to small-scale disturbances, and to set a minimum number of articles to be read.
The actionable set of articles included 25 EC reviews, 18 EC use-cases and 12 UBEM articles. Saturation for UBEM tools was reached at 12 articles and 43 tools. A total of 34 out of 2115 search hits were assessed before saturation, out of which 12 was preselected. Due to lack of information or failure to meet UBEM/USEM definitions, 21 tools were excluded. The 22 remaining tools were further analysed. For the progression factors, saturation was reached at 20 articles, with 49 progression factors. Including preselection, this meant that 108 of the 126 articles were processed, out of which 41 was preselected by domain relevance and 33 by topical relevance. A total of 8 unique use-cases were identified, supplemented by hybrid use-cases as one category. However, 5 use-cases were considered for use-case-specific progression factors, due to lack of data, or conflict with the definition (see Section 3.1). Three use-cases, community choice aggregation, microgrids and green neighbourhoods were not considered for unique progression factor extraction.
3. Results
The results are presented following the logic of affordances: Section 3.1 introduces the different identified use-cases for ECs (corresponding to affordance context), Section 3.2 describes phases of a generalized EC project lifecycle (affordance context), Section 3.3 collects EC progression factors (affordance goal) and examines according to the selected structural metadata, Section 3.4 constructs affordances from UBEM features (affordance capabilities), and disaggregates them as per the research questions.
3.1. Energy Community Use-Cases
The following use-cases were identified during the study: renewable energy production, peer-to-peer energy market, demand-response providing community, bulk investment in energy conservation measures, community choice aggregation, collective grid ownership and community energy storage. Additionally, the green neighbourhood is a special case not strictly an EC, and three hybrid use-cases were also identified.
Three use-cases, community choice aggregation, microgrids and green neighbourhoods were not considered for unique progression factor extraction. Community choice aggregation (CGO) allows cities or other local government units to aggregate customers within their jurisdictions and to procure energy for them, either through contracts or through ownership of generation [40]. Although the subject of the article was a comparison between community choice model and renewable energy community, the former is not in fact an energy community, but a pooling of consumers under a single trusted intermediary to bargain on their behalf. Collective grid ownership is a valid EC, however it never appeared on its own in the literature but integrated to one of the other use-cases [45,49]. Finally, green neighbourhoods are unique models targeting complex sustainability goals on the neighbourhood scale [32,55,56]. These ambitious projects are often government-funded flagship projects or experimental niches, or unique market niches of bottom-up initiatives. They operate partially or fully on a combined waste-water-energy nexus, seeking to leverage all three circulations to close loop, essentially leaving behind no waste, wastewater and taking in no energy from external sources [55,87]. Green neighbourhoods can be models for energy communities on the long-term, but the multiplicative impacts of such projects scale at the cost of scaling their complexity, operational and investment costs. Given that green neighbourhoods fit the definition of multi-purpose energy communities, any universal EC progression factor will also be valid for them as well.
From the core investigated use-cases, the energy conservation investment community (ECC) pools resources to bulk invest in interventions reducing their energy consumption, such as purchasing energy-efficient appliances, retrofitting the building envelope, replacing windows or multiple of the above in deep retrofit projects (Figure 7). The reduction of operational costs makes energy conservation communities relevant for ESCO financing, and the contribution to decarbonisation by demand reduction are measurable contributions to government sustainability policy [33].
Peer-to-peer energy markets (P2PM) rely on community microgrids to sell and buy electricity produced locally in distributed plants, and externally if the microgrid is connected (Figure 8). Regarding market structure, the model can either be a full market, a decentralized market or a hybrid solution in between. The main difference between full and decentralized markets is the lack/presence of a community representative, who acts as intermediary for both internal market governance and as a medium between the decentralized community and the energy market. In hybrid models, members may join individually, or through the representative [53].
Renewable energy communities (REC) are the most well-researched use-cases. Historically, decentralized renewable energy communities kicked of the social innovation niche, buy pooling resources to invest in energy production (Figure 9). In a decentralized model, there is a single or several power plants for the entire community, which can both be utilized to meet the demands of the community itself, but also to sell excess energy if they have access to wholesale markets. In a distributed model, the community functions more akin to energy conservation communities, to bulk invest in renewable production on household level [42]. Distributed production, alongside with microgrid ownership, are constituent use-cases for peer-to-peer energy markets.
Demand-response energy communities (DRC) are one of the more novel, experimental use-cases that stem from the mainstreaming of renewable production and distributed energy production. Since both trends have threats to maintaining grid balance, a community offering to harmonize load curves en masse is a viable service for grid operators (Figure 10). This involves consumers in the management of stable grids, therefore such interventions are labelled demand-side responses. The key strategies for managing load curves is through changing consumption habit, with load shaving meaning changing consumption amounts at certain times of a days, while load shifting is offsetting supply to other uses.
Community energy storage (CSE) is a modular, scalable, virtual energy storage built up from a grid of distributed storage units owned by community members (Figure 11). On their own, virtual storage communities can offer flexibility services like demand-response communities, while in combination with local production, they may serve as buffers to locally produced surplus. Community storage, if place-based is its own category in terms of scale (tens to hundreds of kWh) and is not a substitution for large storage with capacity levels in the MWh-GWh scale. Most common technologies include lithium-ion batteries, lead-acid batteries, flow batteries and more recently hydrogen for electricity, and water tanks and phase-change materials for thermic energy.
Hybrid use-cases are trending due to the associative nature of the use-cases and the potential of stacking services [88]. We have seen before that renewable energy communities can evolve into peer-to-peer markets, but it is also possible for prosumers to build a diverse grid stabilisation portfolio, by having both demand and supply side options (Figure 12). Renewable production can mitigate or eliminate undersupply, while community energy storage can act as a buffer in case of oversupply. Energy conservation measures are supplementary to all other use-cases, expanding external markets of any local production use-case by decreasing internal demand [46]. It is also an option for renewable energy communities to distribute some production and assets, and keep others at community level, while also acquiring energy storage to provide full stack energy services internally [14,89,90].
3.2. The Energy Community Lifecycle
Based on the case studies and reviews, the EC lifecycle can be broadly split into five phases: initiation, design and implementation, operation and further development meaning either social, or technological scaling (Figure 13) [14,35,49,52,87,89,90,91,92,93,94,95,96,97,98,99,100].
EC initiation involves defining the overall strategy for the EC, namely an analysis of the characteristics of the area, the local energy sources, the users and of the community itself [35]. As for the energy context, the strategy of the EC is mostly defined by the varying energy load curves for prosumer types as well as the production and conversion system technology are based on the available energy resources. During initiation, the regulatory context, the compliance to regulatory requirements, synergies or counter-synergies with policy targets are also investigated. The initiation phase ends with the social approach, where the social impacts, the project’s positive and negative implications, and potential integrations with other community-driven projects such as car-sharing, co-housing are assessed. The depth of transition delivered by ECs depend on who is involved and who leads the process during initiation. Most can be classified as government-driven or bottom-up, grassroots initiatives [101], however, there are existing ECs that were initiated by organised institutional entrepreneurs as intermediaries, like banks, public bodies, consultants [100].
The complexity of the design phase of each EC is heavily influenced by the use-case. For RECs, the community is on its own by using the right set of tools and expert help [87,96,97]. Whereas, the number of actors involved in P2PM necessitate a trading platform to handle all interactions between the different stakeholders and the network operator [98]. In case of demand response (DRC), the DSO and an aggregator need to have access to the EC’s devices [99]. CGO use-cases involve local utilities, state and federal actors and research institutes [49].
In the operation phase ECs is split up into two parts: the incubated operation of ECs, meaning the operation with a supportive agency e.g., government, and the self-sufficient operating ECs. Most case studies reported of self-sufficient operation of RECs [95,100], whereas CGO and P2PM cases run almost exclusively through facilitators [49,102].
Beyond operation, there are multiple pathways for further development of ECs: they can scale technically or socially. Technical upscaling can mean the improvement of current use-cases, such as introducing distributed ledger technologies [52], or by better network performance and reliability [98]. It can also mean diversifying the use-case, involving new services, leading to EC hybrids. Similarly, social upscaling can mean both increasing memberships, or diversifying membership, such as by involving industrial or mobility sector actors [93].
3.3. Progression Factors
Based on the EC reviews progression factors are grouped into seven new categories: “interactions with regulation and governance”, “information and knowledge”, “economic influencers”, “technological infrastructure”, “requirements for justice”, “actor-bound drivers and criteria” and “network drivers and criteria” groups. This section begins with the description of progression factors by group, followed by their analysis via the metadata designated in Section 3.3. See Appendix A for all progression factors.
3.3.1. Interactions with Governance and Regulation
Most reviews discussed relationships with public authorities either as regulatory conditions and challenges or the difficulty of securing long-term, reliable political support (Table 2). At the heart of this is the requirement for the normative alignment of energy communities, meaning their format must be recognizable in terms of legal definitions [43]. In countries, where legislation does not yet recognize energy communities, tend to categorize them as a cooperative or a company. Such labels lead to unfair comparisons, as the same regulatory standards could apply to an EC as to a conventional energy provider [87,90]. Normative alignment is shown to erect insurmountable entry barriers to community initiatives that fail to navigate through convoluted legal requirements [2]. Moreover, even municipalities that initiate energy communities, face challenges when ensuring compliance to national strategies and laws [44]. This is due to change in the EU for RECs, as nation states committed to their normative alignment [103]. While this challenge is most prevalent during initiation phase, regulatory barriers influence the whole lifecycle, for example by cutting off community microgrids from energy markets, due to unsatisfactory interoperability standards [50]. Changing regulations would require political commitment, but for many countries, community energy is simply not on the agenda [35] or is subjected to inconsistent policies [2].
3.3.2. Information and Knowledge
It is crucial for the fitness of energy communities, that the relevant actors acquire the necessary knowledge to make decisions [46]. Many of the more practical barriers or failure scenarios can be traced back to lack of knowledge, and given the horizontal nature of energy communities, this knowledge is highly heterogeneous (Table 3). Proposals often overshoot natural or physical possibilities, factors such as sun, biomass, wind availability or proximity to sea, impacts of climate change, building conditions, settlement layout may contradict expectations if not thoroughly understood [44]. It is generally an obstacle that the multiple impacts and broader societal implications of energy communities are only conceptualized, but not sufficiently specified, quantified, measured [33], hindering not only recruitment, but also normative alignment (ref former [2]). Support from policymakers is an essential enabler, but only if communities can convince how their projects fit to relevant targets [40]. Research on the impacts of CRE projects are based on interviews, surveys in costly and highly specific case studies, model-based assessments are limited to regional-scale econometric analyses [12]. Apart from the public sector, prospective members themselves are rarely aware of how local energy systems work, what are the potentials for community energy, or the necessity of sustainable transition [3]. Community energy is simply not in the general discourse well enough to support the assimilation of project proposals [48], and even existing communities miss out on involving support by not understanding and communicating the distributional aspects of their projects, and how a certain stakeholder is specifically affected by it [46]. It is also important to plan for how EC initiatives interact with other projects, when calculating impacts, as certain synergistic co-benefits might greenlight some otherwise unfeasible projects [55], and if other pre-existing societal problems force EC off the agenda [12,35]. Finally, information provision is linked to data scarcity, the fragmentation of data ownership, its fitness-for-purpose is often questionable, imposing significant work for data acquisition and pre-processing [44,87].
3.3.3. Economic Influencers
Financing community energy projects is a recurring challenge in the literature (Table 4). Energy communities usually require both a heavy upfront investment for infrastructural interventions, and significant costs for operation [3,45,49]. Much of this is traceable back to high transaction costs, comprising of searching for stakeholders and supporters, bargaining and negotiation with actors, acquiring and disseminating relevant information, dispute settlement, monitoring and opportunity costs [34]. Meeting the legal entry barriers, connecting to the grid and entering wholesale market, and knowledge production in general are factors discussed earlier, but they are with financial implications [33]. On the other hand, financial benefits stem from the local production and trade of energy at a lower price, the pooled investment on energy conservation and efficiency measures, and selling flexibility services [42]. Many projects do not scale to the point to produce enough economic surplus to cover operational expenditures, and there is always a danger of growing “too big”, losing the social cohesion that came from the direct relationships of the community [2]. There is much reliance on external incentives, the availability of favourable taxation, feed-in-tariff rates, subsidies, commercial investments and loans support projects directly [3,33,49], while providing a level playing field for market actors, and easing access to information and crucial indirect tools to make community energy economically more viable [46,49].
3.3.4. Technological Infrastructure
Known technological progression factors are conditions for either the energy or the information infrastructure (Table 5). There is a disparity among use-cases: while renewable EC factors are mostly regulatory, economic or social, peer-to-peer markets and demand-response communities pose unique technical criteria. It is crucial for markets, to operate on a low-voltage distribution grid—microgrid—that can function both in island mode and connected to the wider grid [49,53]. When infrastructure exists, distributing production in an energy market introduces three technical challenges: (1) upscaling multi-directional energy flows, (2) the diversification of energy supply and (3) upscaling of market actors [53]. The latter is also true for demand-response communities, as it essentially creates a market for flexibility services [35]. Scaling energy flows is a concern for grid operation, necessitating some mechanism to predict and to handle grid congestion, maintain grid balance and assure the supply of adequate quality energy.
Apart from the grid itself, EC use-cases such as P2P energy markets have unique challenges regarding ICT infrastructure to enable intra- and inter-EC transactions [106]. Scaling market size in terms of actors is on the one hand a—currently unresolved—computational challenge of handling negotiations and consensus mechanisms, but on the other hand it is also an optimization problem of multiple peer preferences and the market as a whole [35,53]. Most importantly, this includes minimization of the total transaction costs by regulating energy flows based on the dynamism of demand and supply, and integrating system-level optimum with the optimum of individual behaviour, expectations, preferences. Peer level input, including the assertion of their rights must also be extracted and processed, and in a way that it does not compromise their privacy.
3.3.5. Requirements for Justice
Justice, especially procedural justice is heavily featured in the discourse of transition management (Table 6). Sound institutional design, providing democratic legitimacy within energy communities is still a challenge [49]. As a result of the phrase “community”, it is easy to believe the model is inherently positive, and more involvement is socially empowering, but there must be safeguards to assess and enforce legitimacy. Input legitimacy is measured on who is included in decision-making—or the community itself—which is where governance network models can be misleading: they might report high participation, but might exclude certain actors simply because they were out of reach from the social networks used for recruitment [12]. Failures in input legitimacy might lead to already powerful actors driving community energy, deepening existing conflicts and demotivating people not just from participating in community energy, but other governance network-based initiatives [35]. Throughput legitimacy, on the other hand, refers to the role each actor has in decision-making, and governance network negotiations do tend to give asymmetrical powers to those with more resources [42]. In case of peer-to-peer markets, this could lead to exacerbating energy poverty among the economically disadvantaged [53]. However it is the strength of networked governance that it provides an arena for discussions on issues of relevance, a core value incentivising membership, which must supplemented by instruments to monitor and supress exploitative conduct both within the communities, and on the markets [40]. Finally, output legitimacy in energy communities is expected to be sound, due to broad decision-ownership, however the way decisions are reached can be opaque under layers of negotiations, and any measure of transparency improves the community output legitimacy [42].
3.3.6. Actor-Bound Drivers and Criteria
Actor-bound drivers and criteria are factors describing the people who support, oppose or disengage from EC projects (Table 7). All three groups can influence the success of projects. Opponents are those who actively resists community energy, whether because of legitimate concerns, such as unwillingness to pay the opportunity cost, or through bounded rationality, which may surface as resistance towards either environmentalism, community ownership, or collective actions [35,105]. It is a matter of providing input legitimacy to give voice to concerns, provide mutually agreeable evidence to negate unwarranted opposition, and a just consensus and compensation mechanism for legitimate opposition. Other actors, who are passive, but should be supportive, might also be driven by bounded rationality, by inertia—disengagement despite the known benefits due to perceived discomfort of change [2,53], by lack of interest in energy-related issues [43], or by a wait-and-see attitude [2]. While opponents and bystanders influence mainly the initiation of projects, rebound effects are threats post interventions. Physical interventions without behaviour change results in net increase of energy consumption, hindering wider societal impacts of the EC [12]. In all cases, having community energy up on the agenda in both the political and in social discourse and placing it in the specific reality and value models are key conditions in overcoming passive, rebound and resistant behaviour.
The self-identity of actors, attitudes and individual motivations, such as concern for environment, or grassroots enthusiasm may promote membership [42]. In multiple cases support for renewables and for divesting from coal, nuclear produces more engaged change-agents than individual economic benefits [105]. These change-agents, single or multiple committed evangelists for the cause, have been critical for most energy communities, as they usually mobilize their social networks, seek out professional expertise and lobby for political and financial support voluntarily in their free times [2,12]. This however bars potential energy communities that do not have change-agents, or they do not have the time or social capital to succeed. There is also great potential in intermediaries who may trigger knowledge diffusion, improve the accessibility of the community to supportive networks and resources, but is an additional cost in an already strained business model [12]. However, community-led projects, with more opportunities to distribute responsibilities, and assign roles to individuals fare better in terms of multiple benefits capturing than outsourced, or commercial-led projects [12,45,105].
3.3.7. Network Drivers and Criteria
Networks shape knowledge diffusion, resource, procedural flows among EC actors, and may provide platforms for social cohesion and grassroots empowerment [42,49,105] (Table 8). In terms of the internal network of the community itself, there must be a clarity of the objectives and purposes of the community: whether it serves a public task or brings profit or provides community service, all needs to be specified [43] and be consistent among members [3]. It is a common barrier to adequately communicate the project scope, conditions and benefits to prospective members [2]. This hinges on the bridging, or linking capital in EC actor networks—the efficiency of interactions cascading through them [12]. Mirroring self-identity, it is also beneficial to develop a group-identity, or to base the EC on an existing social group, with which members associate with [42]. However, it is necessary for EC mobilization to go beyond social networks to exploit multiple benefits [2]. Broad coalition of stakeholders are required to make many projects feasible, and it is difficult to identify and engage all of them [44]. Connecting to external, established interests may also prompt cross-fertilization and support, such as relationships to social movements or similar projects [43], and favourable network conditions improve access to relevant competences, resources, implementers, change-agents [44]. This does not undervalue social networks. Frequency and emergent saturation of community energy in social network clusters accelerates total saturation in said cluster due to peer effects [42]. However, there are certain actors who cannot be neglected in the decentralization of the energy market: providers of technical infrastructure. The partnership, or lack of partnership from local utilities provider can make or break community microgrid projects [49], while ICT providers of services, platforms and infrastructure are crucial for the operation of energy markets [106].
3.3.8. Classification of Progression Factors
There is no consistent classification of progression factors in the literature, although many take an attempt to classify by relevant discipline [2,42,55,105]. The identified factors display an interdisciplinary scope of energy communities, with a slight skew towards social sciences and humanities (Figure 14). However, a sizeable proportion of factors (18 out of 49) had implications from multiple perspectives—one notable example is the optimal size of energy communities, which influences social acceptance and cohesion [42], economies of scale [2] and the complexity of computations [53].
Factors were also classified by relative importance: conditions, which are necessary requirements for EC progression, barriers/challenges, which are definitive for successful progression, and enablers, which accelerate/hinder project progression. For example, the existence of a microgrid for peer-to-peer markets [53], or the compliance of the grid operator in case of renewable energy communities [49], are preconditions, with no possibilities of initiating the project without them in place. Internal incentives are challenges, as financially unsustainable ECs might still exist through subsidization [42]. Finally, access to other, community-based networks is an enabler for recruitment of support and diffusion of knowledge, for example [43]. The distribution of factors in the three categories is even, with slight skew towards barriers (Figure 15).
Based on relevant use-case, the distribution of factors reflects the distribution of literature (Figure 16). As the largest, single-use-case group of articles focus on renewable energy communities, most of the progression factors describe them. This does not mean that these factors are not applicable to other use-cases, however, there is insufficient evidence to confirm that they do or do not (see discussion).
Finally, the classification by lifecycle phase heavily skews towards the earlier stages of energy communities. However, this does not mean that most barriers are overcome by the time operational phase kicks in, due to overlaps among the categories. A total of 19 factors are relevant in more than one phase, and 7 factors are relevant for all phases. The largest overlap (12) is between initiation and both technical and social upscaling phases, while the overlap between operation and initiation is only 1 (Figure 17). This displays a polarization of progression factors between operating the community and setting up the community—whether this “setting up” is the one that launches the project, or one that develops it further either technically or socially.
If all classification rationales are taken into consideration, with equal weight, hierarchical clustering returns the dendrogram shown on Figure 18. It is notable that none of the clusters are tight: even the most distant clusters can be reached with less than 3 steps, and over two-thirds of the factors would not be paired with any other, when setting cut-off for clustering to the average distance.
The clusters themselves are heterogeneous both in terms of discipline and in terms of lifecycle, meaning it would be difficult to bundle interventions and responses even if the use-case is known. This is because there are very few classes that share the same factors, as shown on the correlation matrix of features (Figure 19). The top five positive correlates are shown on Table 9.
3.4. The Analysis of UBEM Tools
In this section, the results are presented as follows: first the choice of UBEM capabilities from the features listed in the four reviews are justified, then the individual affordances are constructed in the context of EC lifecycle phases, for goals of meeting progression factors, for EC planners as users and from UBEM capabilities as the affording agents. Due to inconclusive matching of progression factors to use-cases, the use-case as a context was not used (see Section 3.3). The section concludes with the disaggregation of results to EC phases.
The choice of UBEM capabilities is justified by the sparseness of agglomerative hierarchical clustering and the correlation matrix of capabilities. Clustering shows that the tools are generally distinct, as clusters only start to form at around 2.0 average distance, while all tools can be covered at 4.0 average distance (Figure 20). If four groups were to be generated—as shown in the figure—the threshold average distance would have to be set for 3.5, and this would still yield 6 unique tools (UrbanOPT [107], COFFEE [108], UrbanFootprint [109], CoBAM [110], SEMANCO [111] and OpenIDEAS [112]). The most similar tools at 2.0 average distance are UMEM [113] to MESCOS [114] and Georgia University [115] to Simstadt [79].
This result is also supported by the pairwise correlation of capabilities that show how often two capabilities share the same tool (Figure 21). It is notable that the correlation matrix is sparse and the only strongly correlated (coefficient higher than 0.7) pair is target groups: urban planner, and target groups: policymaker. They appear together in 81.67% of the tools.
In this framework, the capabilities for the 22 tools which remained after the data extraction were filled in (Appendix B), and affordances were constructed accordingly. A total of 5 affordances were generated, responding to 45 of the 49 progression factors (Table 10). The individual affordances are described below.
3.4.1. Accessible Transparent and Relevant Early-Stage Spatiotemporal Predictions
An UBEM tool with web-based interface can afford to provide more accessibility, to its users than its standalone desktop-based counterparts and therefore helps in achieving awareness, trust, transparency, avoiding opposition, scepticism, helps in bridging capital and solving the information barrier, inertia and passivity and the reliance on volunteers. UBEM tools with hybrid or reduced order bottom up approaches are the most capable to calculate and iterate quickly and to work in data scarce environments. Calculating outputs in over-hourly resolution fosters the time- and computational efficiency further. With these capabilities UBEM tools can afford to provide transparency, existing knowledge and skills, specificity to the market, self-identity, active involvement, embeddedness and robust network, helps with finding synergies, natural and physical pre-conditions, data quality and provide quick granular data against opposition and scepticism.
Co-simulation platform architecture provides modularity and scalability for the platform. This modularity and the modelling of different energy services, on both supply and demand side with visualization capabilities can solve energy poverty threat, find synergies, define social scalability and input legitimacy and foster active involvement, embeddedness and robust resilient network by representing relevant spatiotemporal data. Since modelling of different energy services on supply side and other energy fluxes is an inherent capability, and modular software architecture is also more characteristic by USEM tools, therefore an USEM tool can satisfy the needs described at this affordance.
3.4.2. Coupling Impacts to Heterogeneous Needs
When it comes to modelling behavioural and technological changes in an energy community bottom-up approaches are far superior than top-down approaches. Bottom-up approaches with sub-hourly outputs on neighbourhood level can model multiple energy services both demand and supply side and generate wide range of output types. With this a wide range of granular data can be generated which provides specificity and allows actors to understand the causes of rebound effect, helps in the technological side of social scalability, market transaction and cost optimization, defining physical and natural preconditions, articulate share missions, mapping broader social impacts/benefits, costs, identifying and engaging the appropriate networks and helps with input legitimacy. An econometric model coupled with UBEM can immediately valorise the generated data, and analyse the results in line with the economic macro-environment or community problem field, and this way affords to give help with financial incentives, external financial incentives/lack of funding, analysing the inconsistencies, engagement and support in the political landscape, costs, provide quality assurance for prices, optimize market transaction costs, identify broader social impacts/benefits. Co-simulational tool architecture can afford modularity and scalability, which suggests that tools built this way could afford the transition into a real-time decision support system during operational phase with a higher probability. Since modelling of different energy services on supply side and other energy fluxes is an inherent capability, and modular software architecture is also more characteristic by USEM tools, therefore an USEM tool can satisfy the needs described at this affordance.
3.4.3. Quick Feedback from Coarse Data
As bottom-up models are better at generating detailed data, top-down models usually create outputs quicker and can work with coarse statistical data. With over-hourly outputs on a city scale this method can afford to inform land use and building code regulations, provide data to help with the present reliance of volunteers, and can analyse cost efficiencies. Desktop based tools are able to provide data offline, and therefore they can offer a highest level of privacy than web-based ones. An UBEM tool can satisfy the defined progression factors at this affordance.
3.4.4. Multi-Scale Detailed Analysis
Bottom-up approaches are generally better at scenario analysis. With sub-hourly or hourly output resolution bottom-up models which are capable of taking occupant behaviour into consideration can afford with the help of econometric model to provide an analysis of the network ambiguity and fundamental boundary conditions for multi-bilateral contracting also able to help removing legal and regulatory obstacles with price analysis of different energy vectors, and therefore helping economic standardization. An UBEM tool can satisfy the defined progression factors at this affordance.
3.4.5. Grid Simulation
Co-simulational scalable, and modular software architecture allows higher flexibility, while sub-hourly output resolution, heterogeneous energy generation and energy services modelling means detailed energy supply and demand results. With these capabilities, tools can afford microgrid simulations, grid congestion analysis and therefore attracting DSOs and end market concentration. Grid-simulation can be part of an USEM tool, therefore here an USEM tool is able to satisfy the needs defined at this affordance.
3.4.6. The Analysis of UBEM Tools by EC Lifecycle
Pairing UBEM capabilities with EC life-cycle stages results in the following table (Table 11). In every column, the highest amount of progression factors is highlighted with bold and in every row the highest amount of progression factors is highlighted with shading. The results show that accessible transparent and relevant early-stage spatiotemporal predictions respond to the highest amount of progression factors. This is followed by coupling impacts to heterogeneous needs. Other combinations respond to between 1–3 factor each lifecycle phase. It also shows that initiation phase is most well responded to by UBEM capabilities, followed by design and social upscaling, while operation and technical upscaling are least represented.
4. Discussion
4.1. Limitations
Known limitations must be considered when reading the results. First, new knowledge given in this study is based on secondary information (reviews). While the progression factors, EC lifecycle, and main use-cases were empirically grounded, the corresponding affordances of UBEM capabilities—and thus the answer to the research question—still needs to be proven through case studies. Second, the development of UBEM tools compared to their original papers are not always comprehensively documented, therefore some information may be outdated and actual UBEM platforms may have more capabilities than described here. In addition, the utility of clustering progression factors by use-case is limited, due to lack of literature on the more unconventional use-cases beyond renewable energy communities. Additionally, limiting the research to western countries introduce a bias for both the progression factors themselves, and their metadata. Further studies, investigating Asian, Latin American and African initiatives could uncover different challenges and enablers, identifying context-specific progression factors for EC development. It must also be noted that the regulatory conditions for the normative alignment of RECs is about to change in the EU, as Member States commitments stated in their National Energy and Climate Plans [103]. This translates to both regulatory/policy factors and economic factors, as there is a recent, clear political statement in support of RECs, which will likely carry over to incentives. However, it is unclear whether and how this translates to other and hybrid use-cases of ECs. While there is a more general CEC and a more restrictive REC definition in EU legislation, if policy goals do not mention for instance community storage, then government subsidies will not be designed for them, their legal entry barriers will still exist, which hinders CES initiation. Therefore, the results (progression factors) must be read per use-case, as not all apply with equal weight. This amplifies the significance of not being able to group progression factors by use-case properly. It is advised for further case studies of novel EC use-cases to document their unique progression factors. Regarding policy, it is recommended that EC definition, and thus related policy instruments are differentiated by use-case. Additionally, the concept of CECs could be appropriated to support experimental, proto-ECs with a legislative pathway to evolve them into more specialized EC categories as their use-cases mature.
4.2. Reflection on Research Questions
The first research question referred to the common use-cases of energy communities, which are described in Section 3.1. While a majority of ECs are renewable energy communities, there is an abundance of ways actors can cooperate on energy-related matters. There are also obvious synergies among use-cases for hybrid, or multi-purpose energy communities to be developed. Some ECs already diversify their services, such as acquiring storage after saving up from energy sales revenues [14,89,90]. On the one hand, this trend points to a potential for existing ECs to pilot new unique or hybrid use-cases, leapfrogging some of the initiation-exclusive progression factors and accelerating EC uptake. On the other hand, more research into the development, drivers and barriers of novel use-cases are needed. Especially when it comes to hybrid use-cases and multi-purpose ECs, both the progression factors influencing the projects and the impacts will be a result of multiple interacting core activities. It has been noted in previous reviews that such assessment is a research gap [2,6], and this study has found only one article discussing co-impacts [55].
The second research question referred to the various progression factors of ECs, collected and compiled in Section 3.3. A full classification of progression factors is presented in Appendix A. Due to limitations mentioned above, only one essential classification can be considered conclusive: by lifecycle phase. While the case studies and reviews identified four distinct phases (see Section 3.2), the analysis of progression factors revealed a clear distinction between operation and all other phases. This is reasonable, considering operation refers to the continuity of some form of status-quo, while initiation, design, early implementation, and various further developments are changes in the status quo. Most progression factors refer to initiation either exclusively or together with other phases. In reflection to the practical objective of supporting EC planners and policymakers, the EC progression factors by lifecycle phase are summarized on a project lifecycle wheel, reflecting the weight of each phase (Figure 22).
The third research question referred to the utility of UBEM tools in the various lifecycle phases of ECs, which is described in Section 3.4. It was shown that free, web-based hybrid or reduced order bottom-up models with over-hourly output resolution and heterogeneous output types and energy service modelling are most suitable for social upscaling; while bottom-up co-simulation model with an econometric model, sub-hourly output and diverse range of energy services modelling on district scale and the aforementioned tool are equally the best suited for initiation. There is only one existing tool for the former CityBES [116], and several for the latter HUES [117], UMEM [113], MESCOS [114]. In general, most UBEM capabilities deliver affordances for initiation and design stages, where most progression factors are. This also feeds into the main research question, whether UBEM is a technological trigger. The potential of UBEM, and UBEM-based simulation pipelines lie in the fact that they offer flexible decision-support in the earlier stages of projects, and whenever they are further developed. While decision-support for the operation of energy communities would require short term dynamic predictions on high resolutions to optimize the operation of energy communities, UBEM is a far more cost-efficient, early-stage alternative, requiring less input data and returning easy-to-understand outputs. To provide a quick tool for EC planners, the UBEM capabilities to look for based on progression factors, is summarized on a bipartite graph (Figure 23).
Reflecting on the second practical objective, recommending a development direction for UBEM, the trends in EC use-cases (see discussion above, based on section) make a good argument to invest in UBEM tool agility. The most impactful modelling capabilities were output resolution, output diversity, modularity and web deployment. Resolution on sub-hourly levels is necessary to forecast interactions on P2P energy markets, as trading usually occurs with 15-min frequency [27]. Output diversity and modularity becomes important with the diversification of energy community use-cases, and the growing prevalence of multi-purpose communities, such as green neighbourhoods. The value of UBEM tools is likely going to be determined by how many intertwined inputs and impacts do they handle, whom can be convinced with the evidence simulations provide. In other words, UBEM needs to respond well to in- and output diversification. This is why all affordances are met by USEM tools, whereas only two out of five are met by UBEM-only tools. Tools that either integrate UBEM with other models, such as City Energy Analyst [118], LakeSIM [119], CitySIM [120] and UrbanFootprint [109] with in-built transportation models, or tools that are modular and technically scalable, such as SEMANCO [111], UMEM [113], will be better suited to deliver diverse outputs reflecting EC use-case diversification. However, scalability to diverse, often uncertain and low-quality input data, which necessitates robust modules for data ingestion and pre-processing, is still something UBEM pipelines struggle with [121]. Finally, apart from architecture and functionalities, accessibility to users is also crucial, as seen by the performance of web-based tools versus desktop tools. While this was not explored as modelling tools are designed for engineers, user friendliness could be a pivotal improvement in the EC context. Given that laypeople gain formal powers and responsibilities in the EC model, tools in the future could support simple functionalities for users outside a niche of experts.
Finally, reflecting on the research of energy communities, affordances have been a seamless addition to the conceptual frameworks of transition theory, multi-level perspective (MLP) and strategic niche management, as a missing link between the capabilities of enabling technologies, and the challenges posed by socio-technical transitions. We argue that technological affordances deserve an equal footing with institutional design and behaviour change, among factors that enrich any niche concept, be it a fundamentally technical, or a fundamentally social niche. Furthermore, the concept of MLP substantiates the influence of energy communities and UBEM tools on the user behaviour and preferences, which can gradually change the extraneous forces of the landscape, such as climate change. More articles need to be written on the role of technological affordances in fostering sustainable socio-technical transitions, with a special attention to disruptive technologies.
5. Conclusions
The study explored the potential role of urban building energy modelling in enabling the research and planning of energy communities. The conceptual framework of strategic niche management in the transition theory discourse was amended by the notion of affordances, to provide the missing link for studying technology as a trigger for social innovations. The literature on energy community was probed to reveal the diverse use-cases, general lifecycle and progression factors encompassing enablers, conditions and barriers of energy communities. The literature on urban building energy modelling was investigated to identify tool capabilities that afford specific progression factors. The study revealed that as an early-stage decision- and design-support tool, UBEM is a potential technological trigger to support kickstarting energy communities.
Energy communities are promising social instruments to invest in accessible, clean energy sources, system-level energy efficiency and offer a bottom-up path to low-carbon urban energy systems. This study unveiled UBEM as technological instruments for energy communities. As a step in the convergence of engineering and socio-technical discourses, it contributes to the task of transition studies of bridging social and technological innovations for a low-carbon future.
Supplementary Materials
Python-based in-house data science module “padron” was used for agglomerative hierarchical clustering and visualizations. The specific code used is available online at https://github.com/bvabud/Project_Ence, Agglomerative clustering notebook for progression factors: ec_progression_factor_classification_CODE, Agglomerative clustering notebook for UBEM tools: ubem_tool_classification_CODE.
Author Contributions
Conceptualization, V.B., Á.M. and A.R.; methodology, V.B.; formal analysis, V.B., Á.M. and M.K.B.; investigation, V.B., Á.M., M.K.B. and K.P.; data curation, V.B., Á.M. and M.K.B.; writing—original draft preparation, V.B., Á.M., M.K.B. and K.P.; writing—review and editing, V.B., Á.M. and A.R.; visualization, V.B.; supervision, A.R.; All authors have read and agreed to the published version of the manuscript.
Funding
This research received no external funding.
Acknowledgments
The authors would like to acknowledge the support to facilitate the research provided by the University of Pécs, Faculty of Engineering and Information Technology within the framework of the Biomedical Engineering Project of the Thematic Excellence Programme 2019 (TUDFO/51757-1/2019-ITM and the Advanced Building and Urban Design.
Conflicts of Interest
The authors declare no conflict of interest.
Appendix A

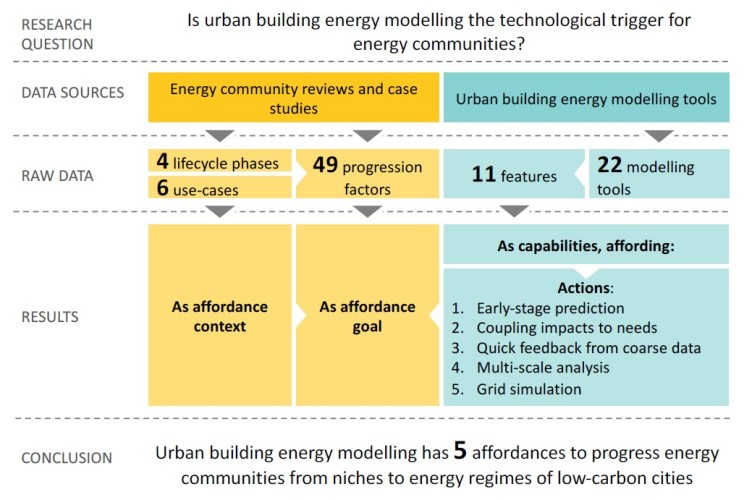
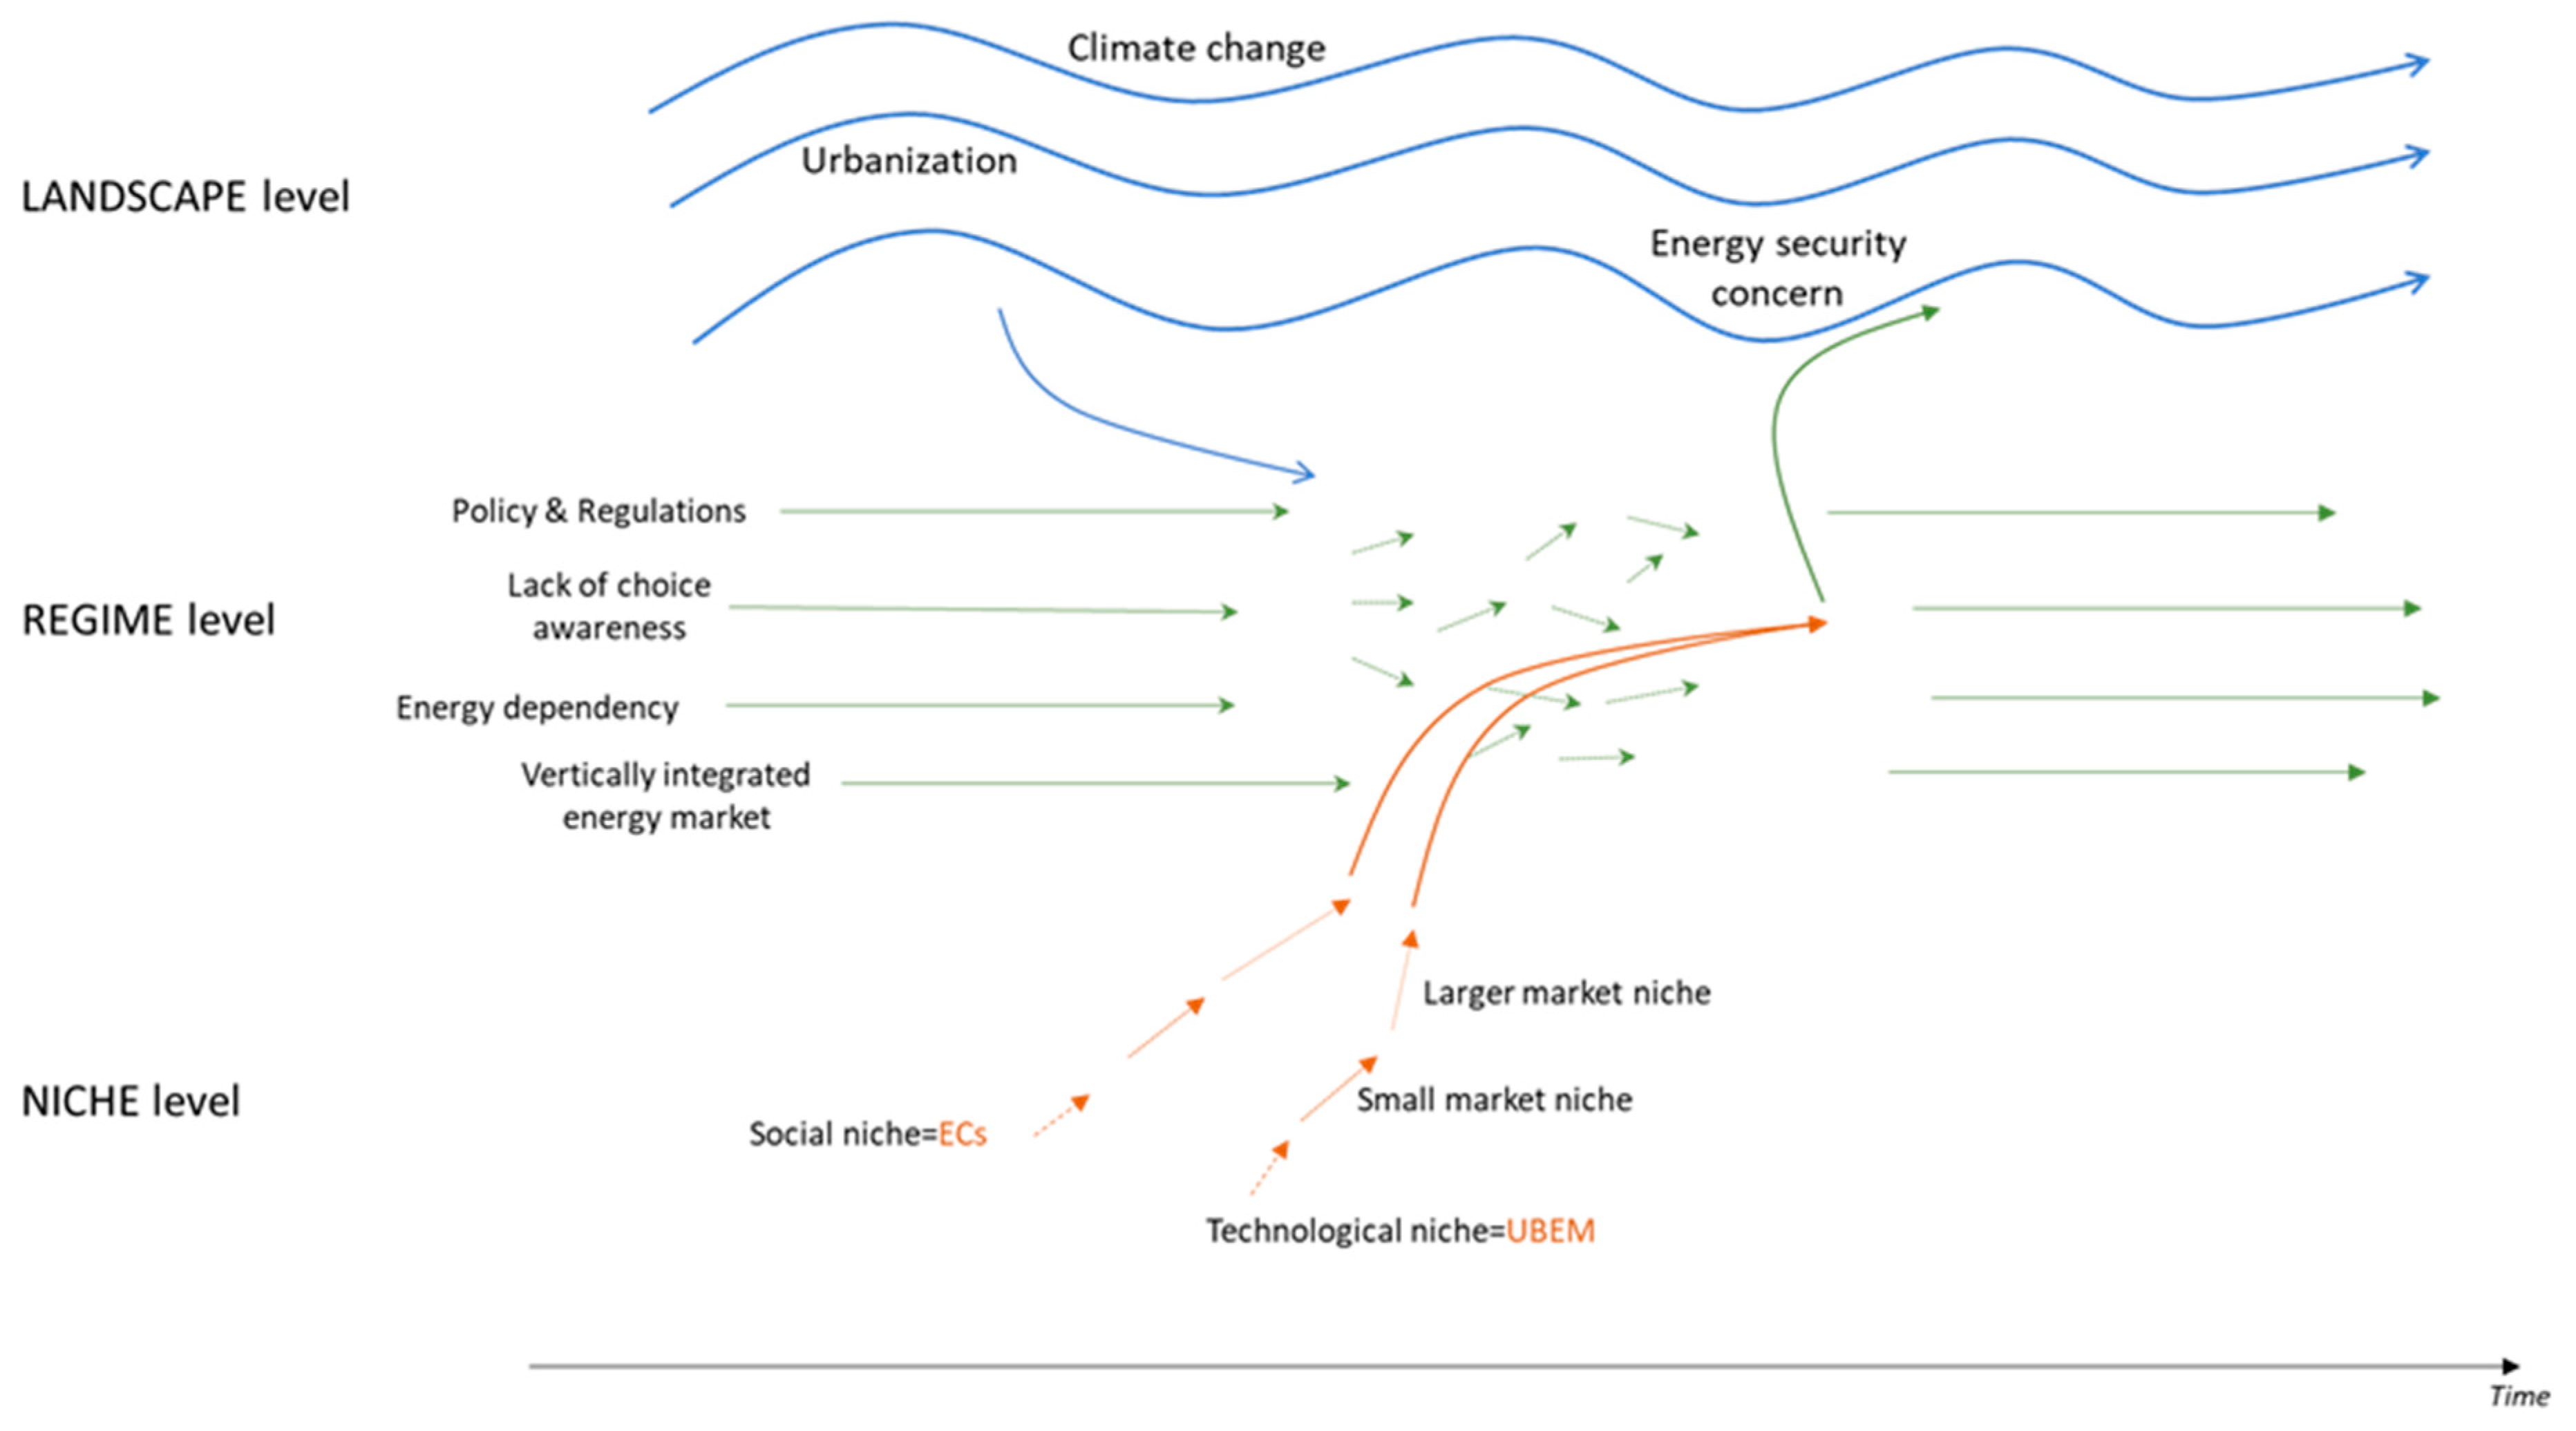
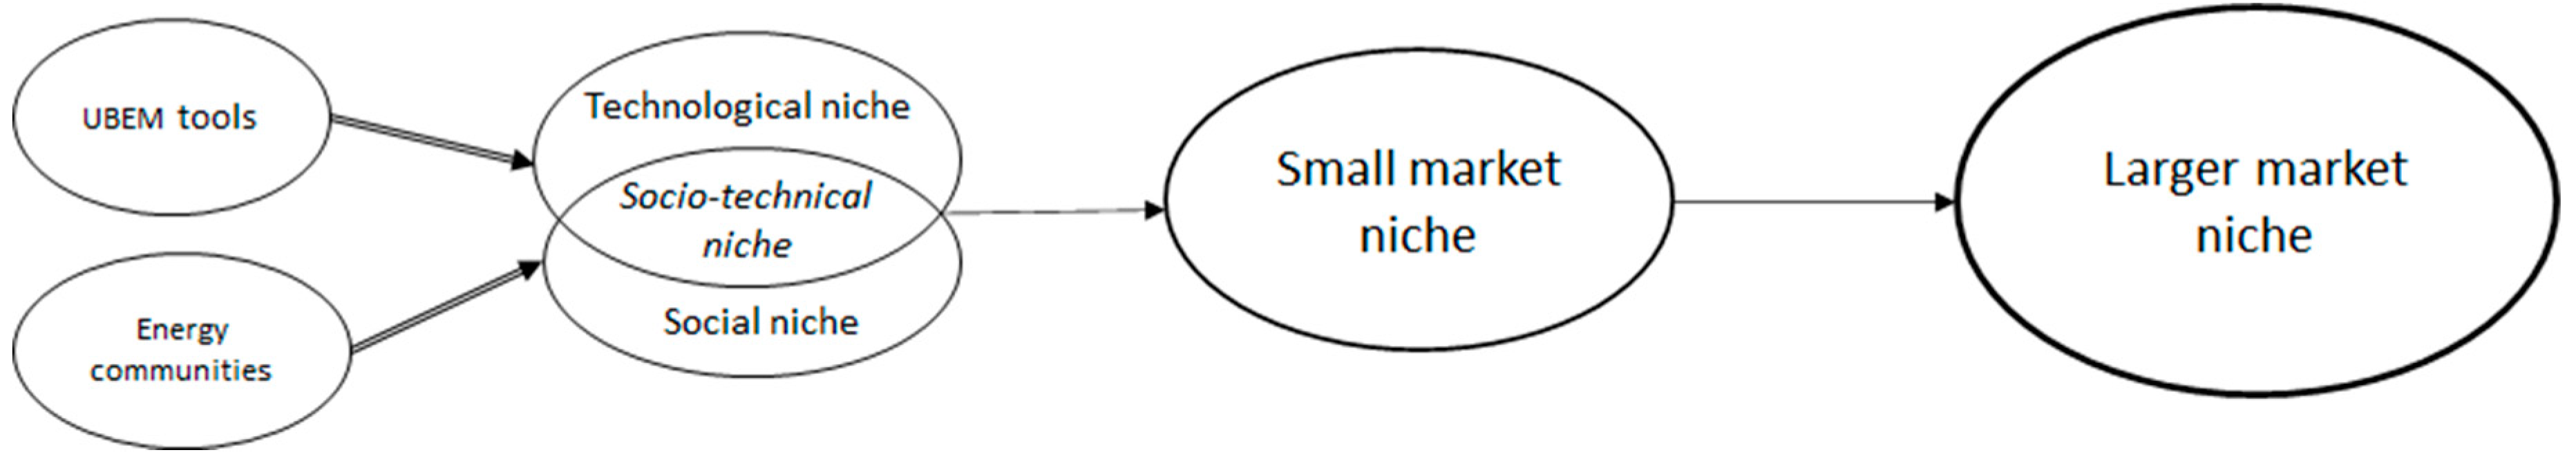
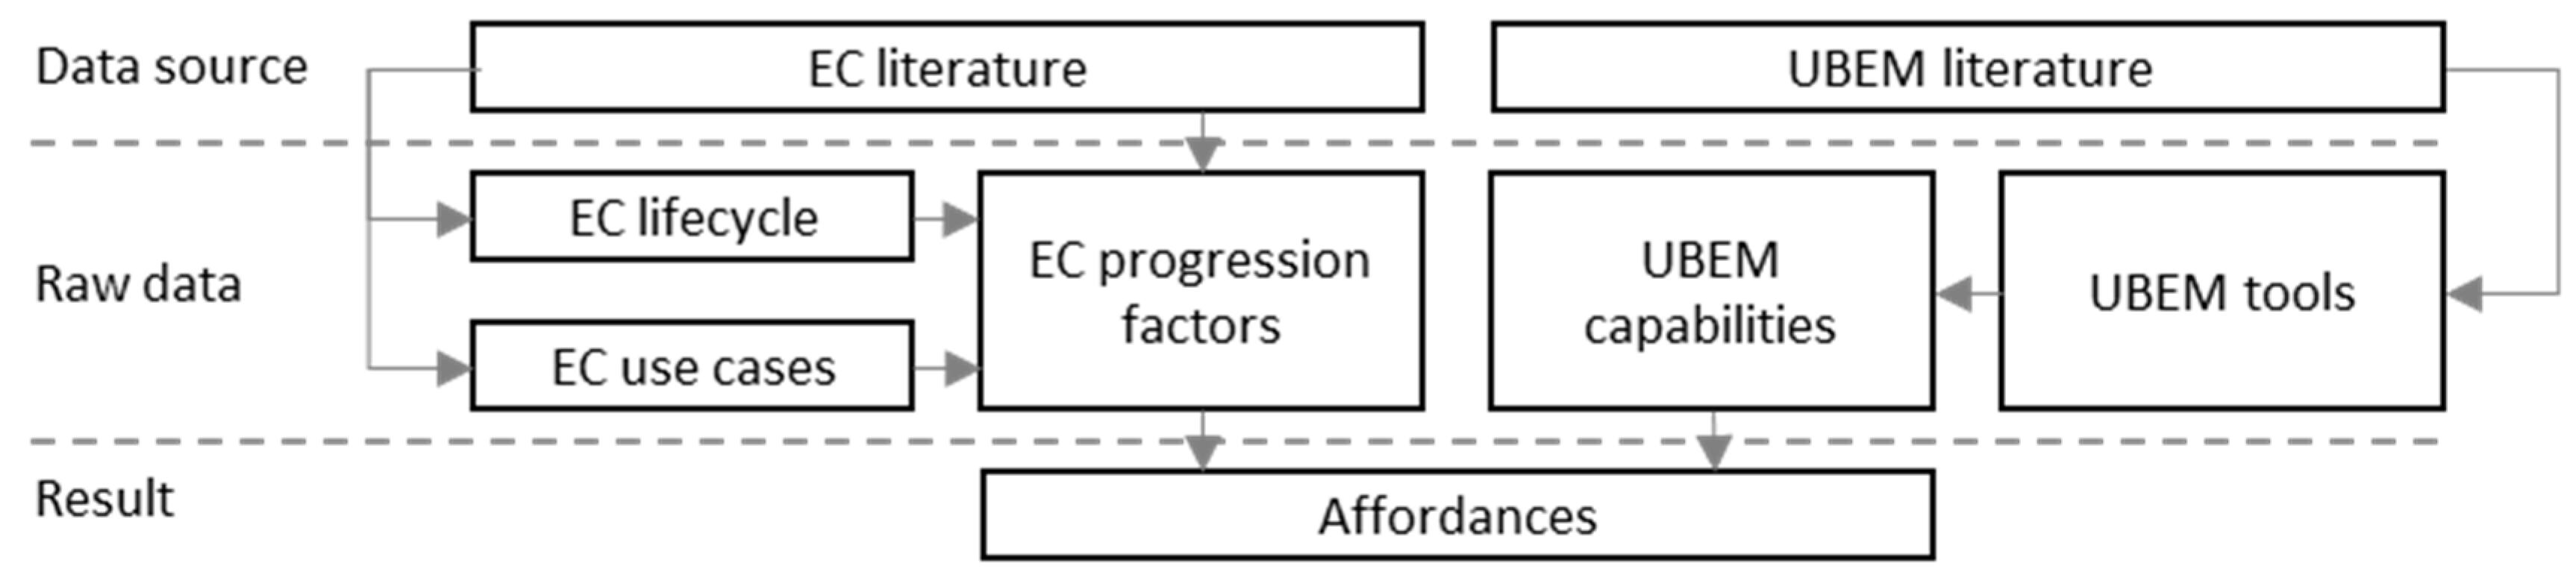
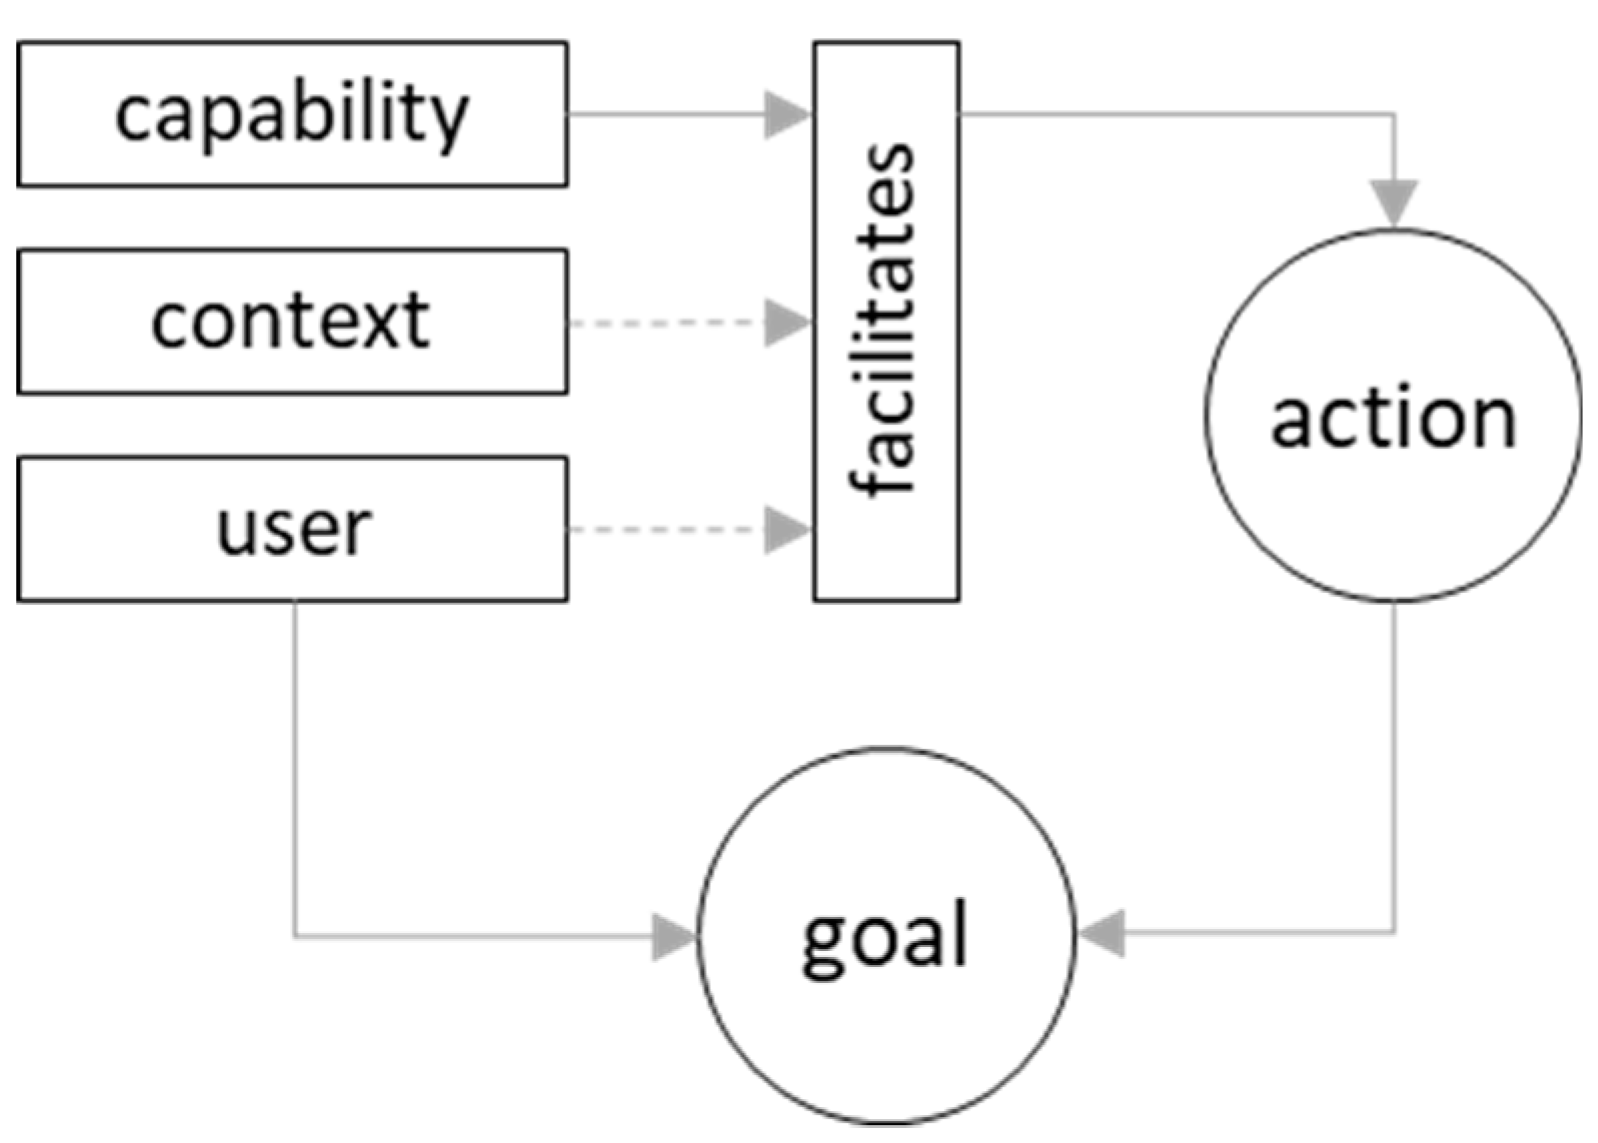
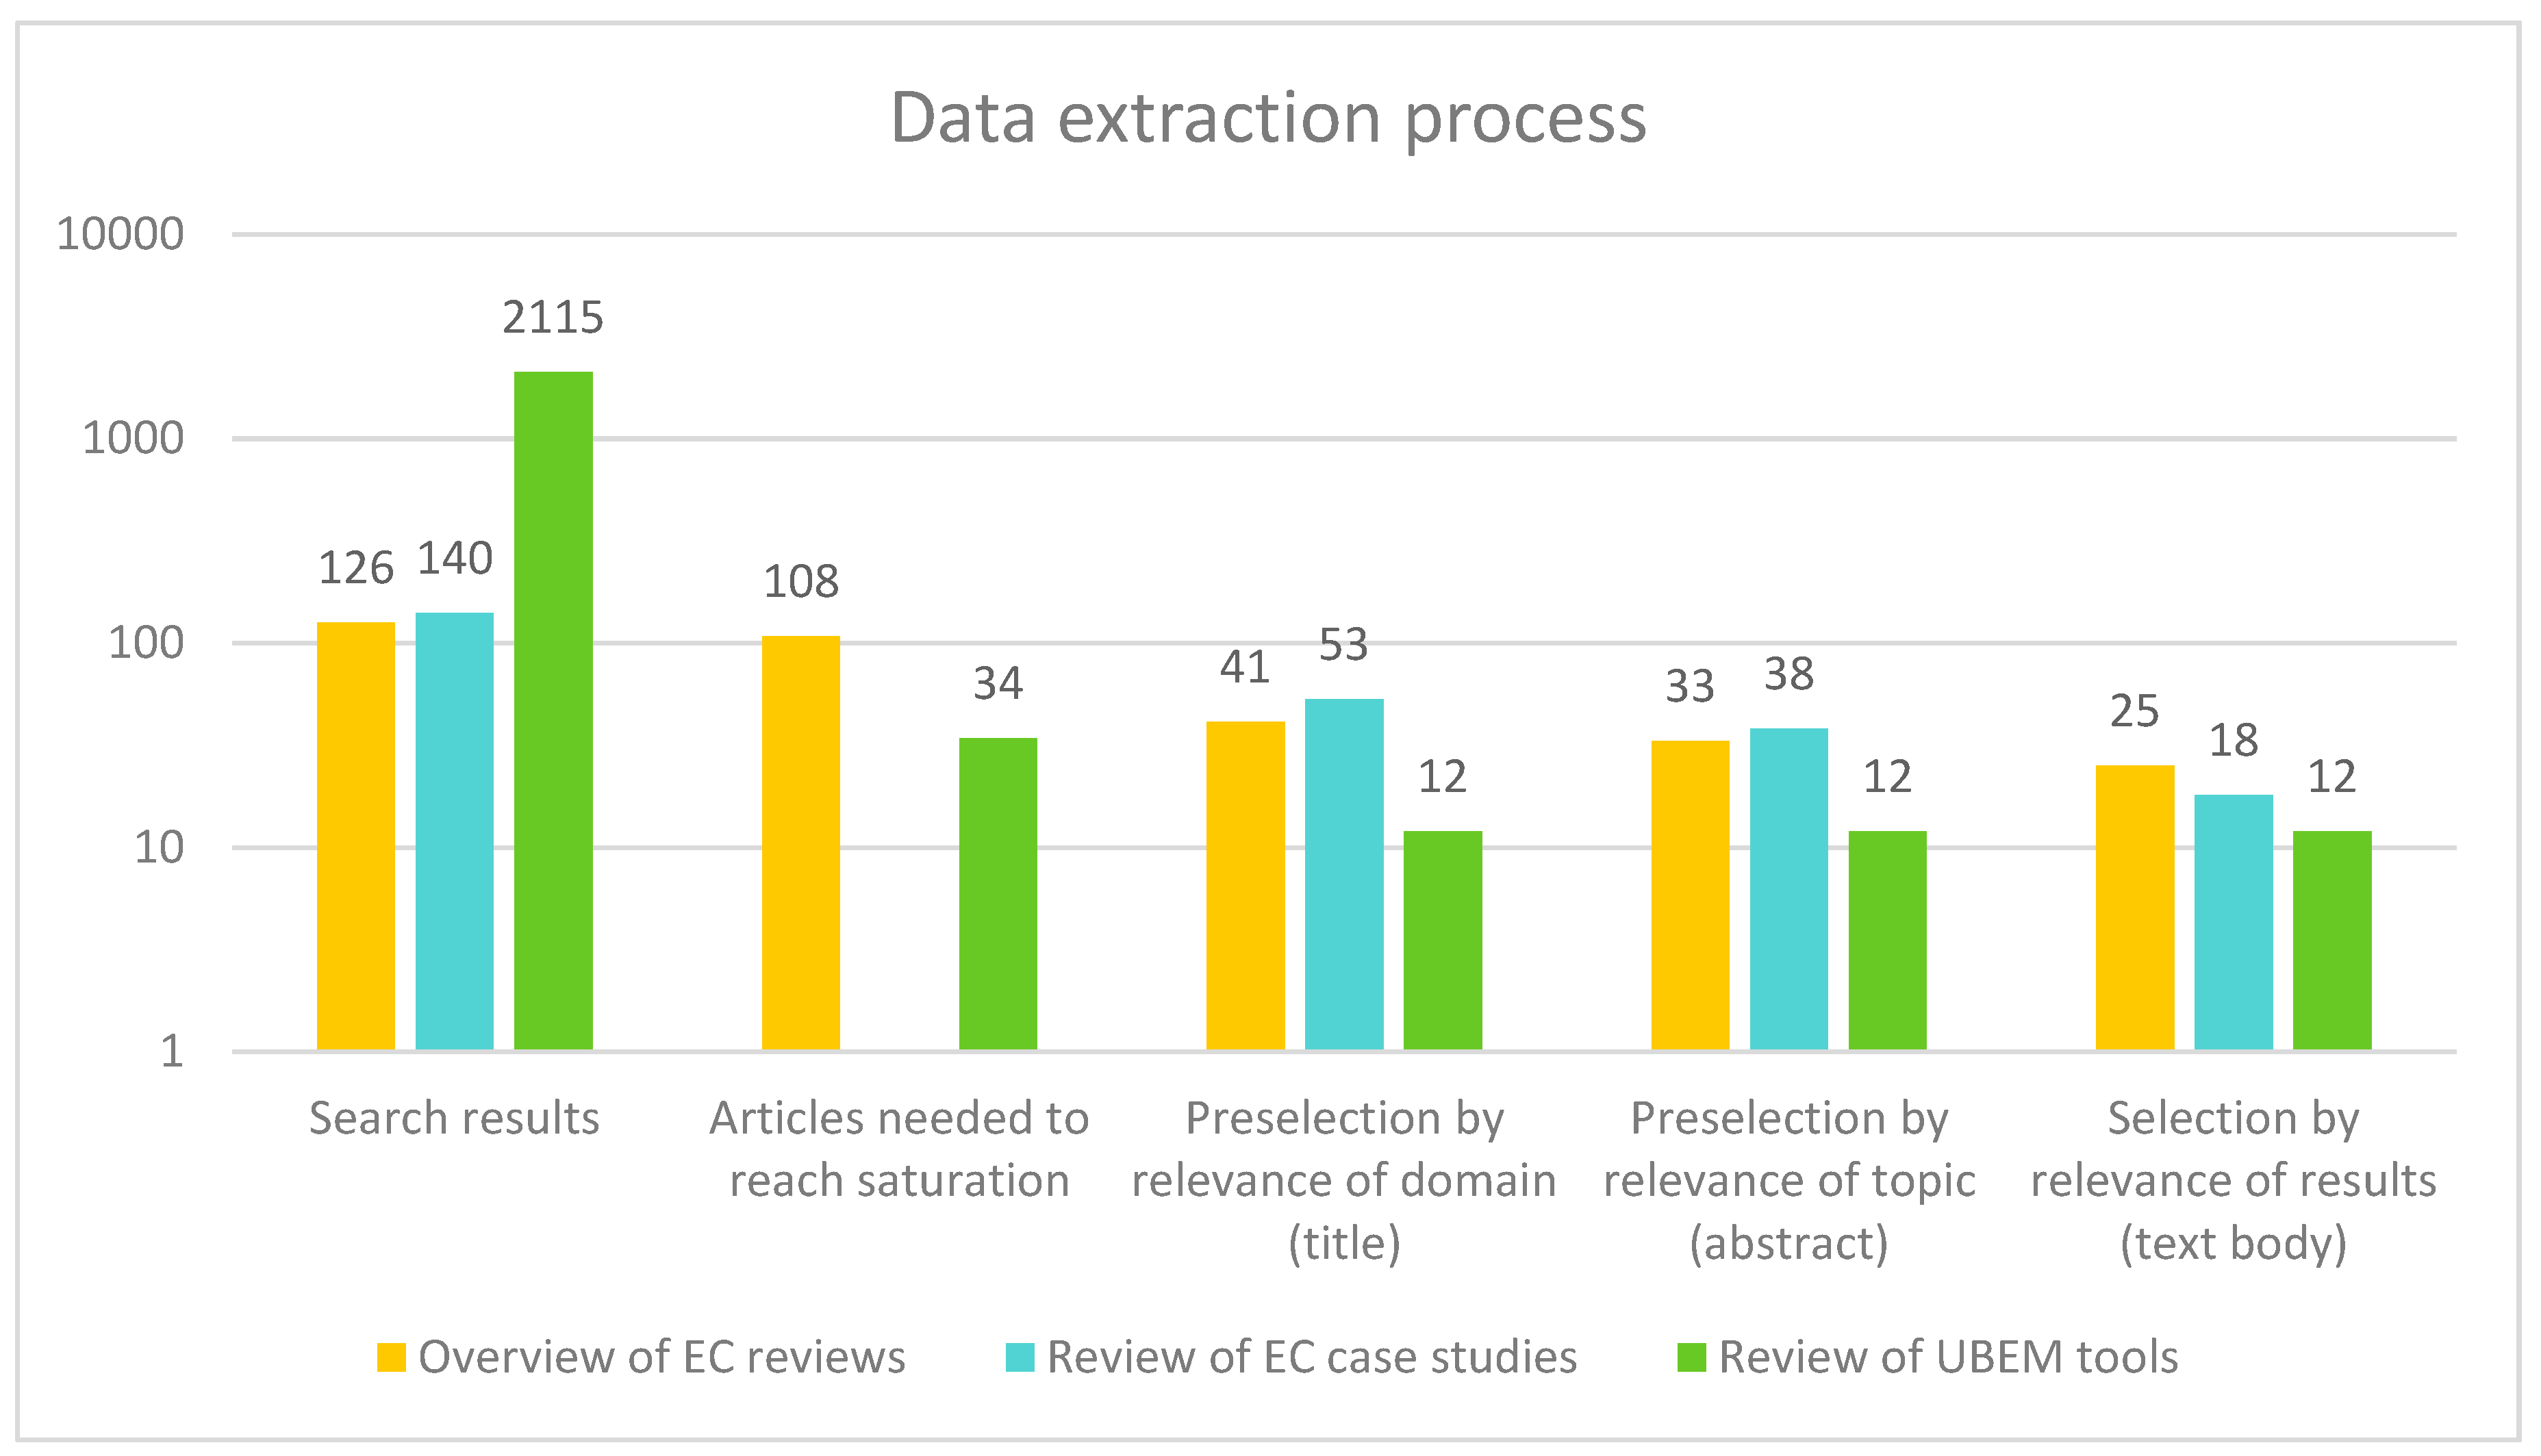
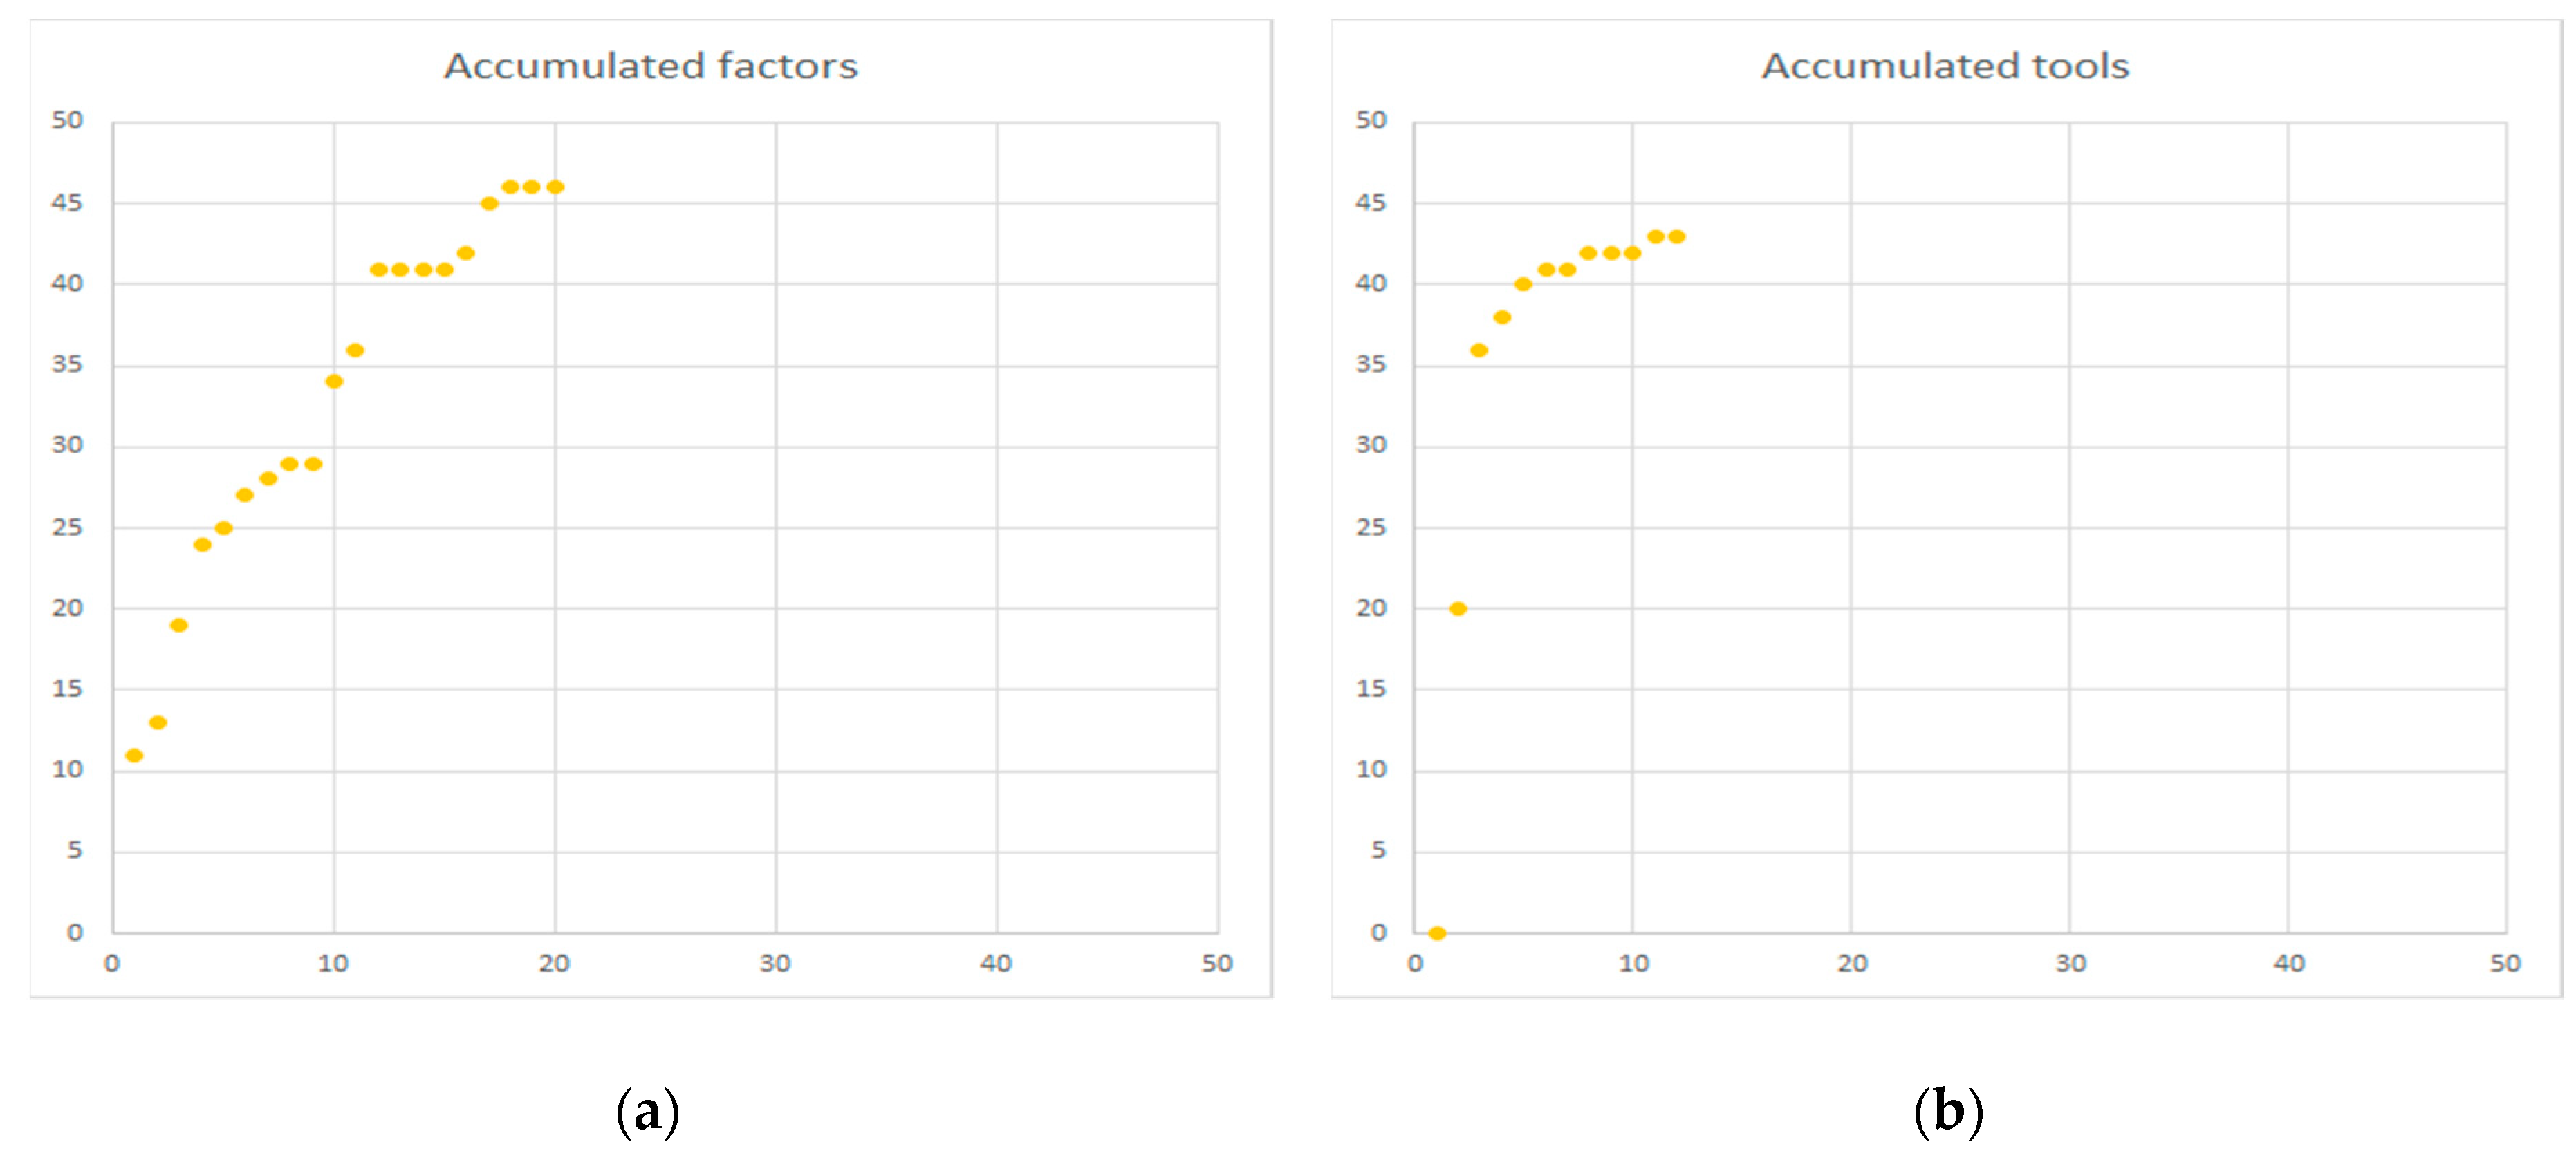
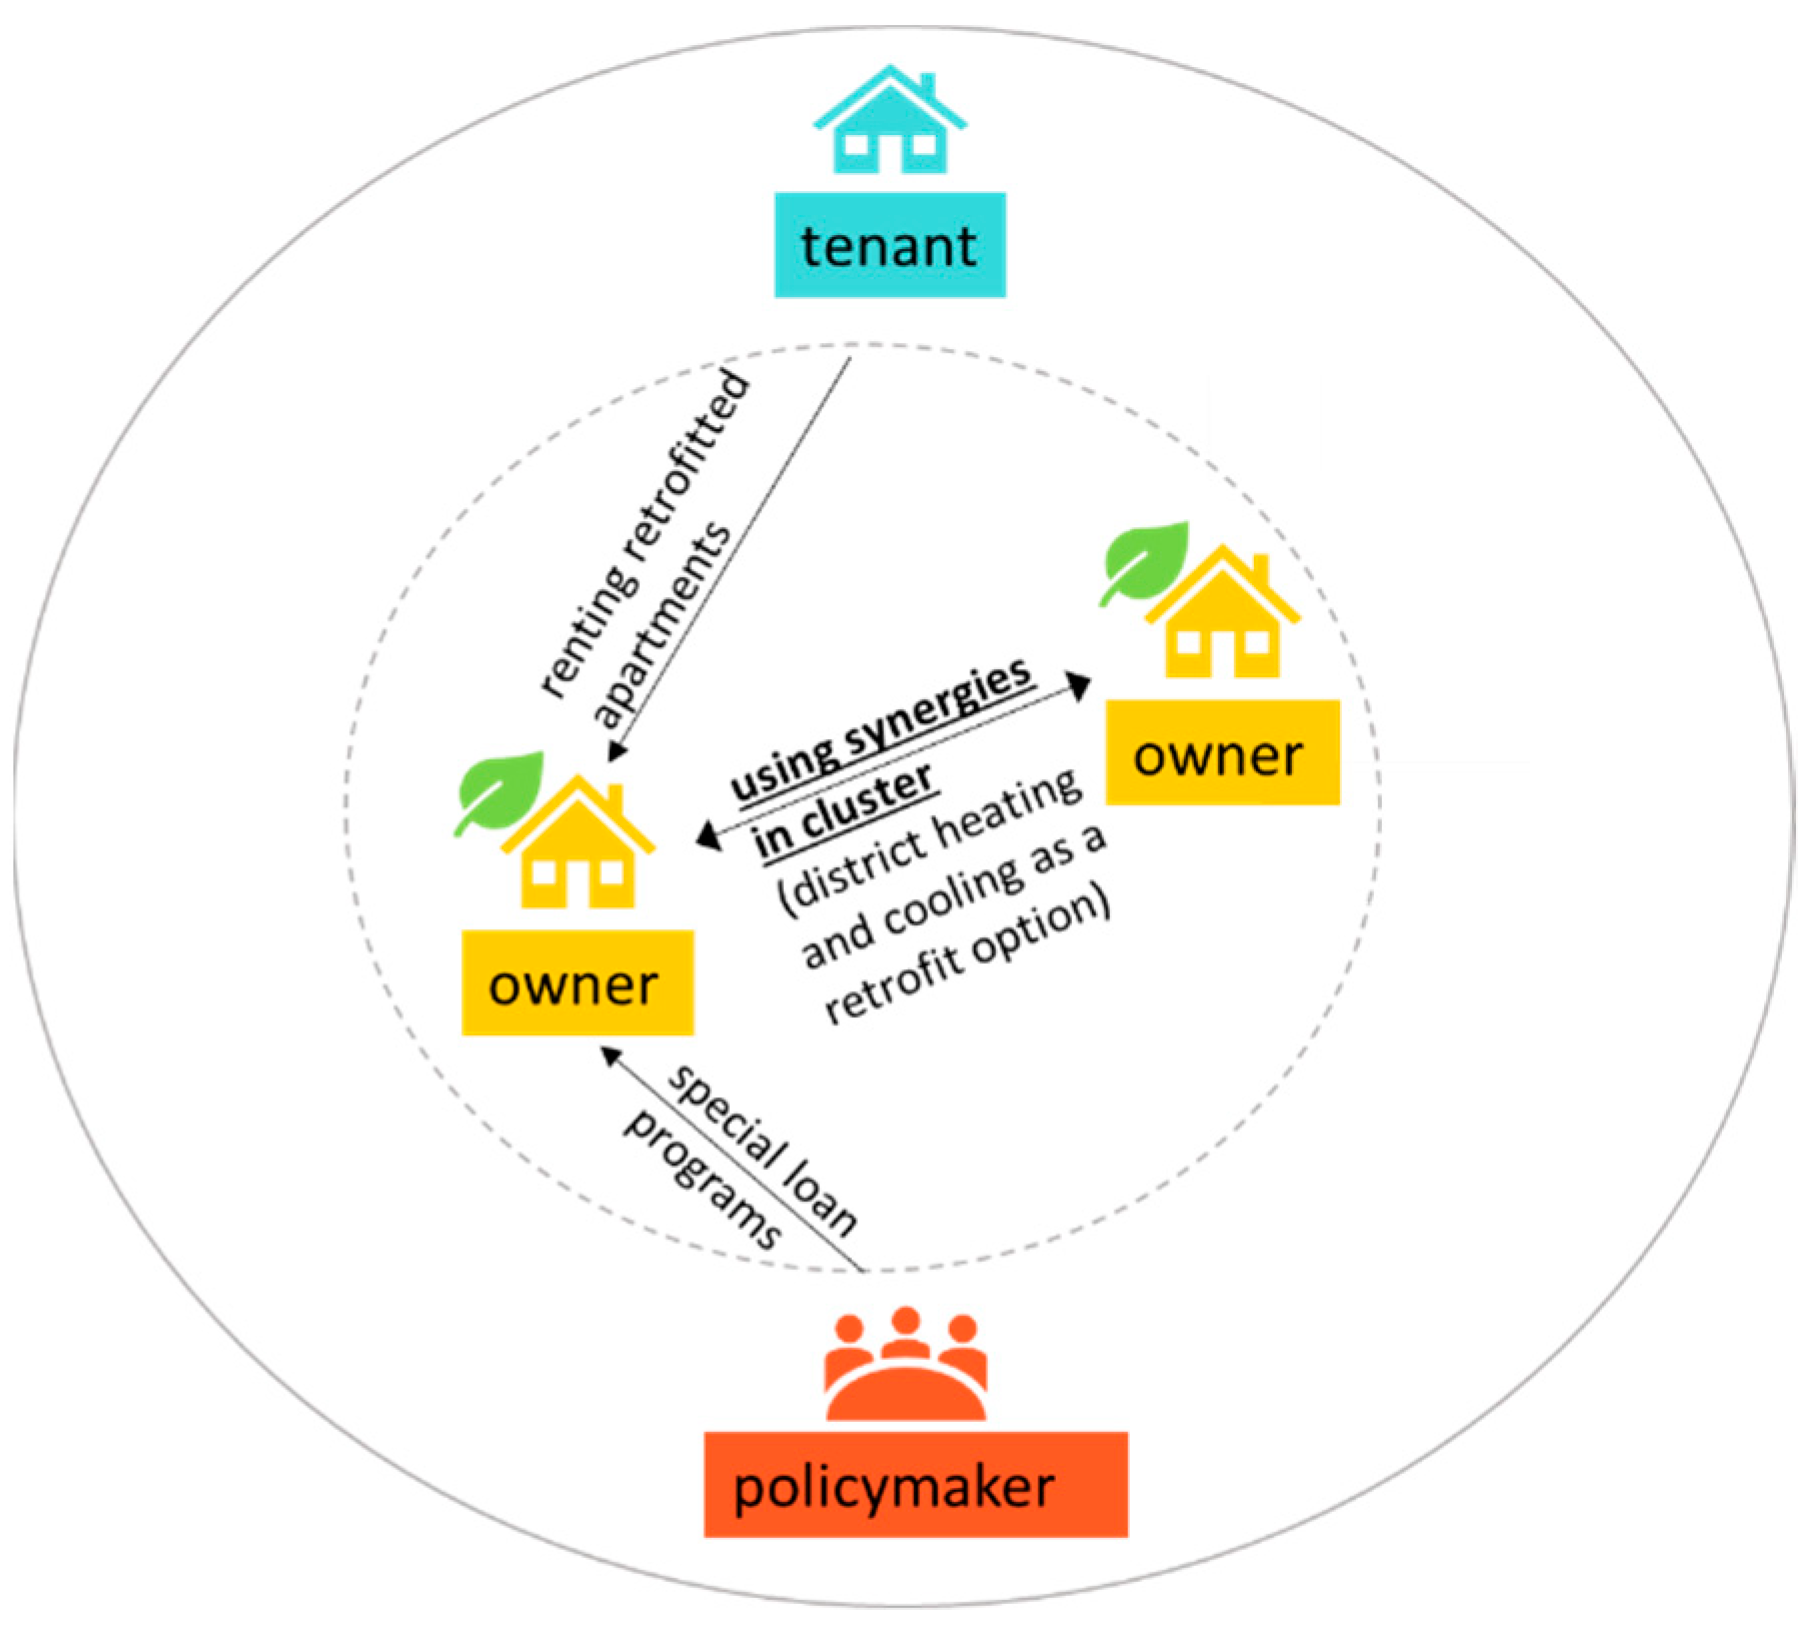
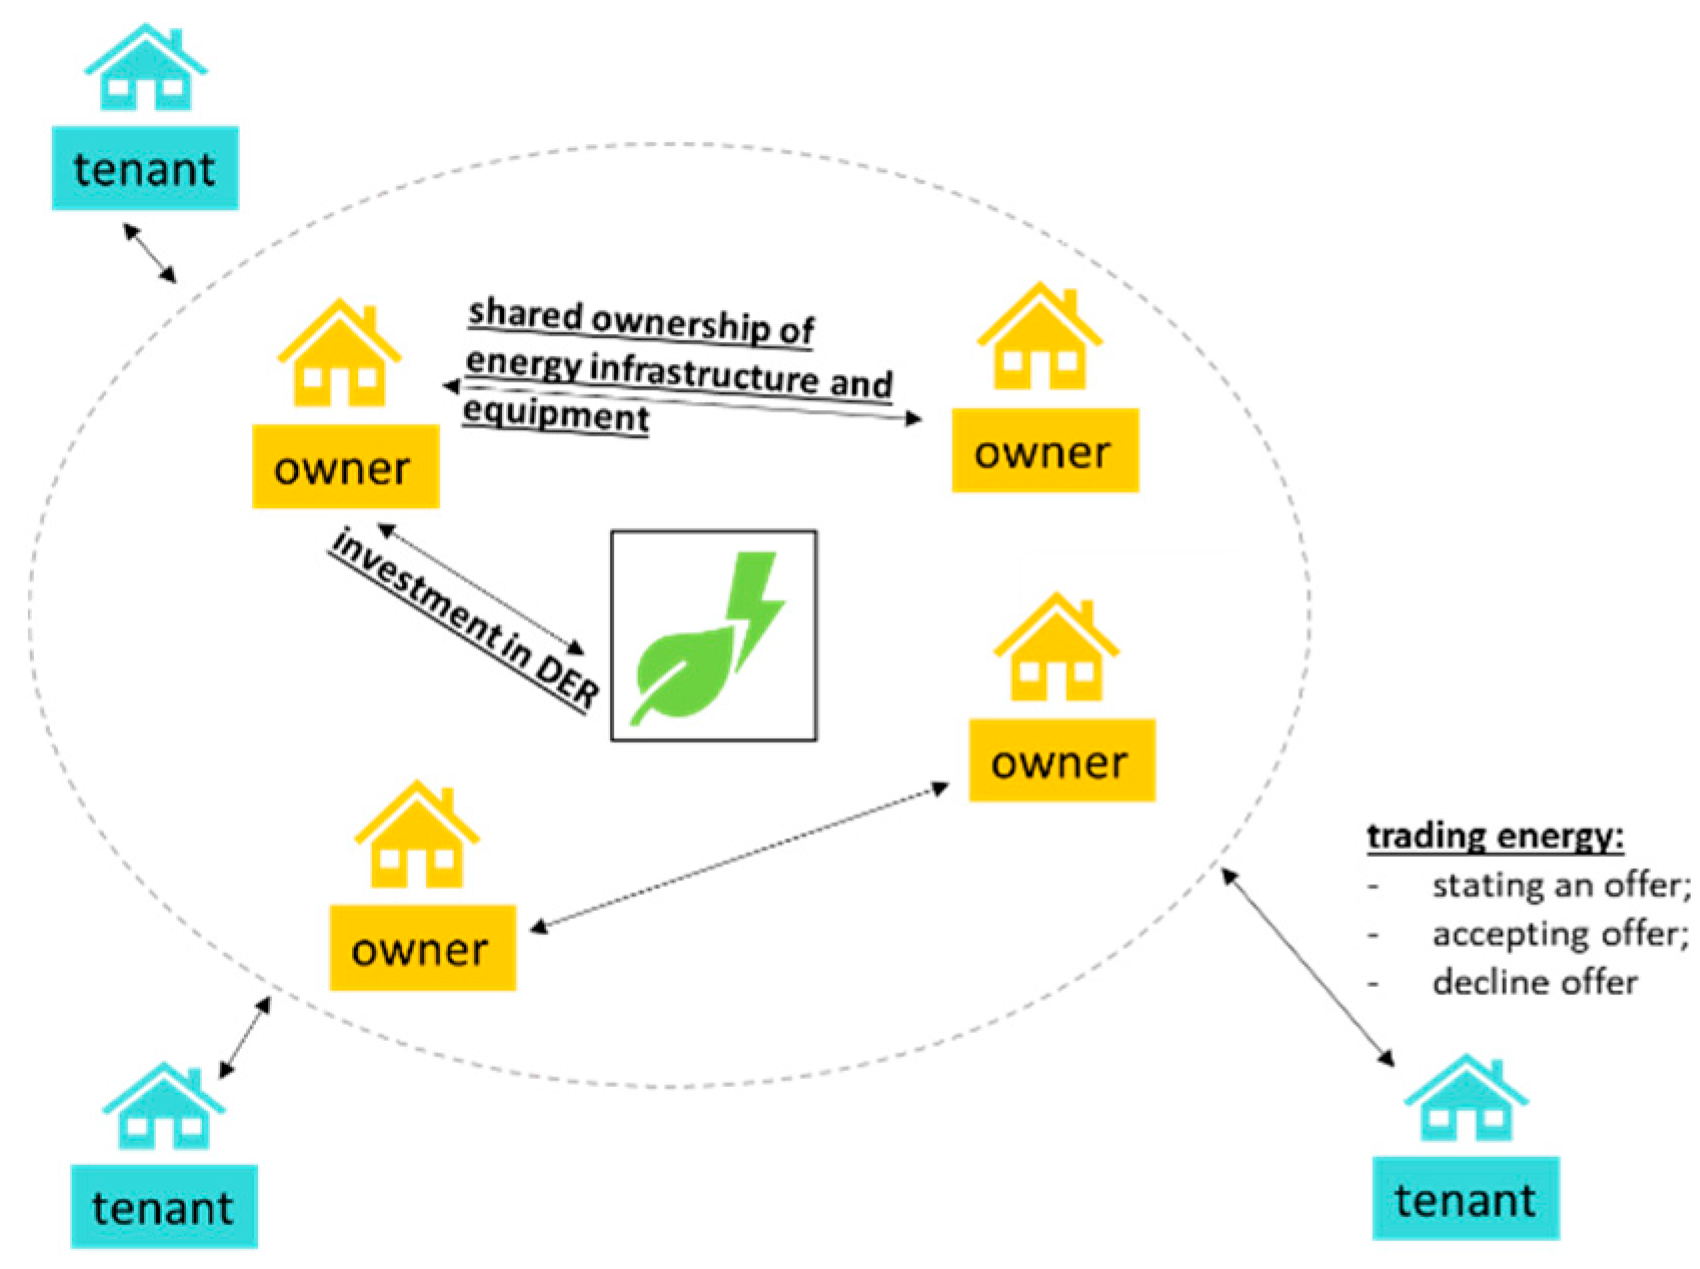
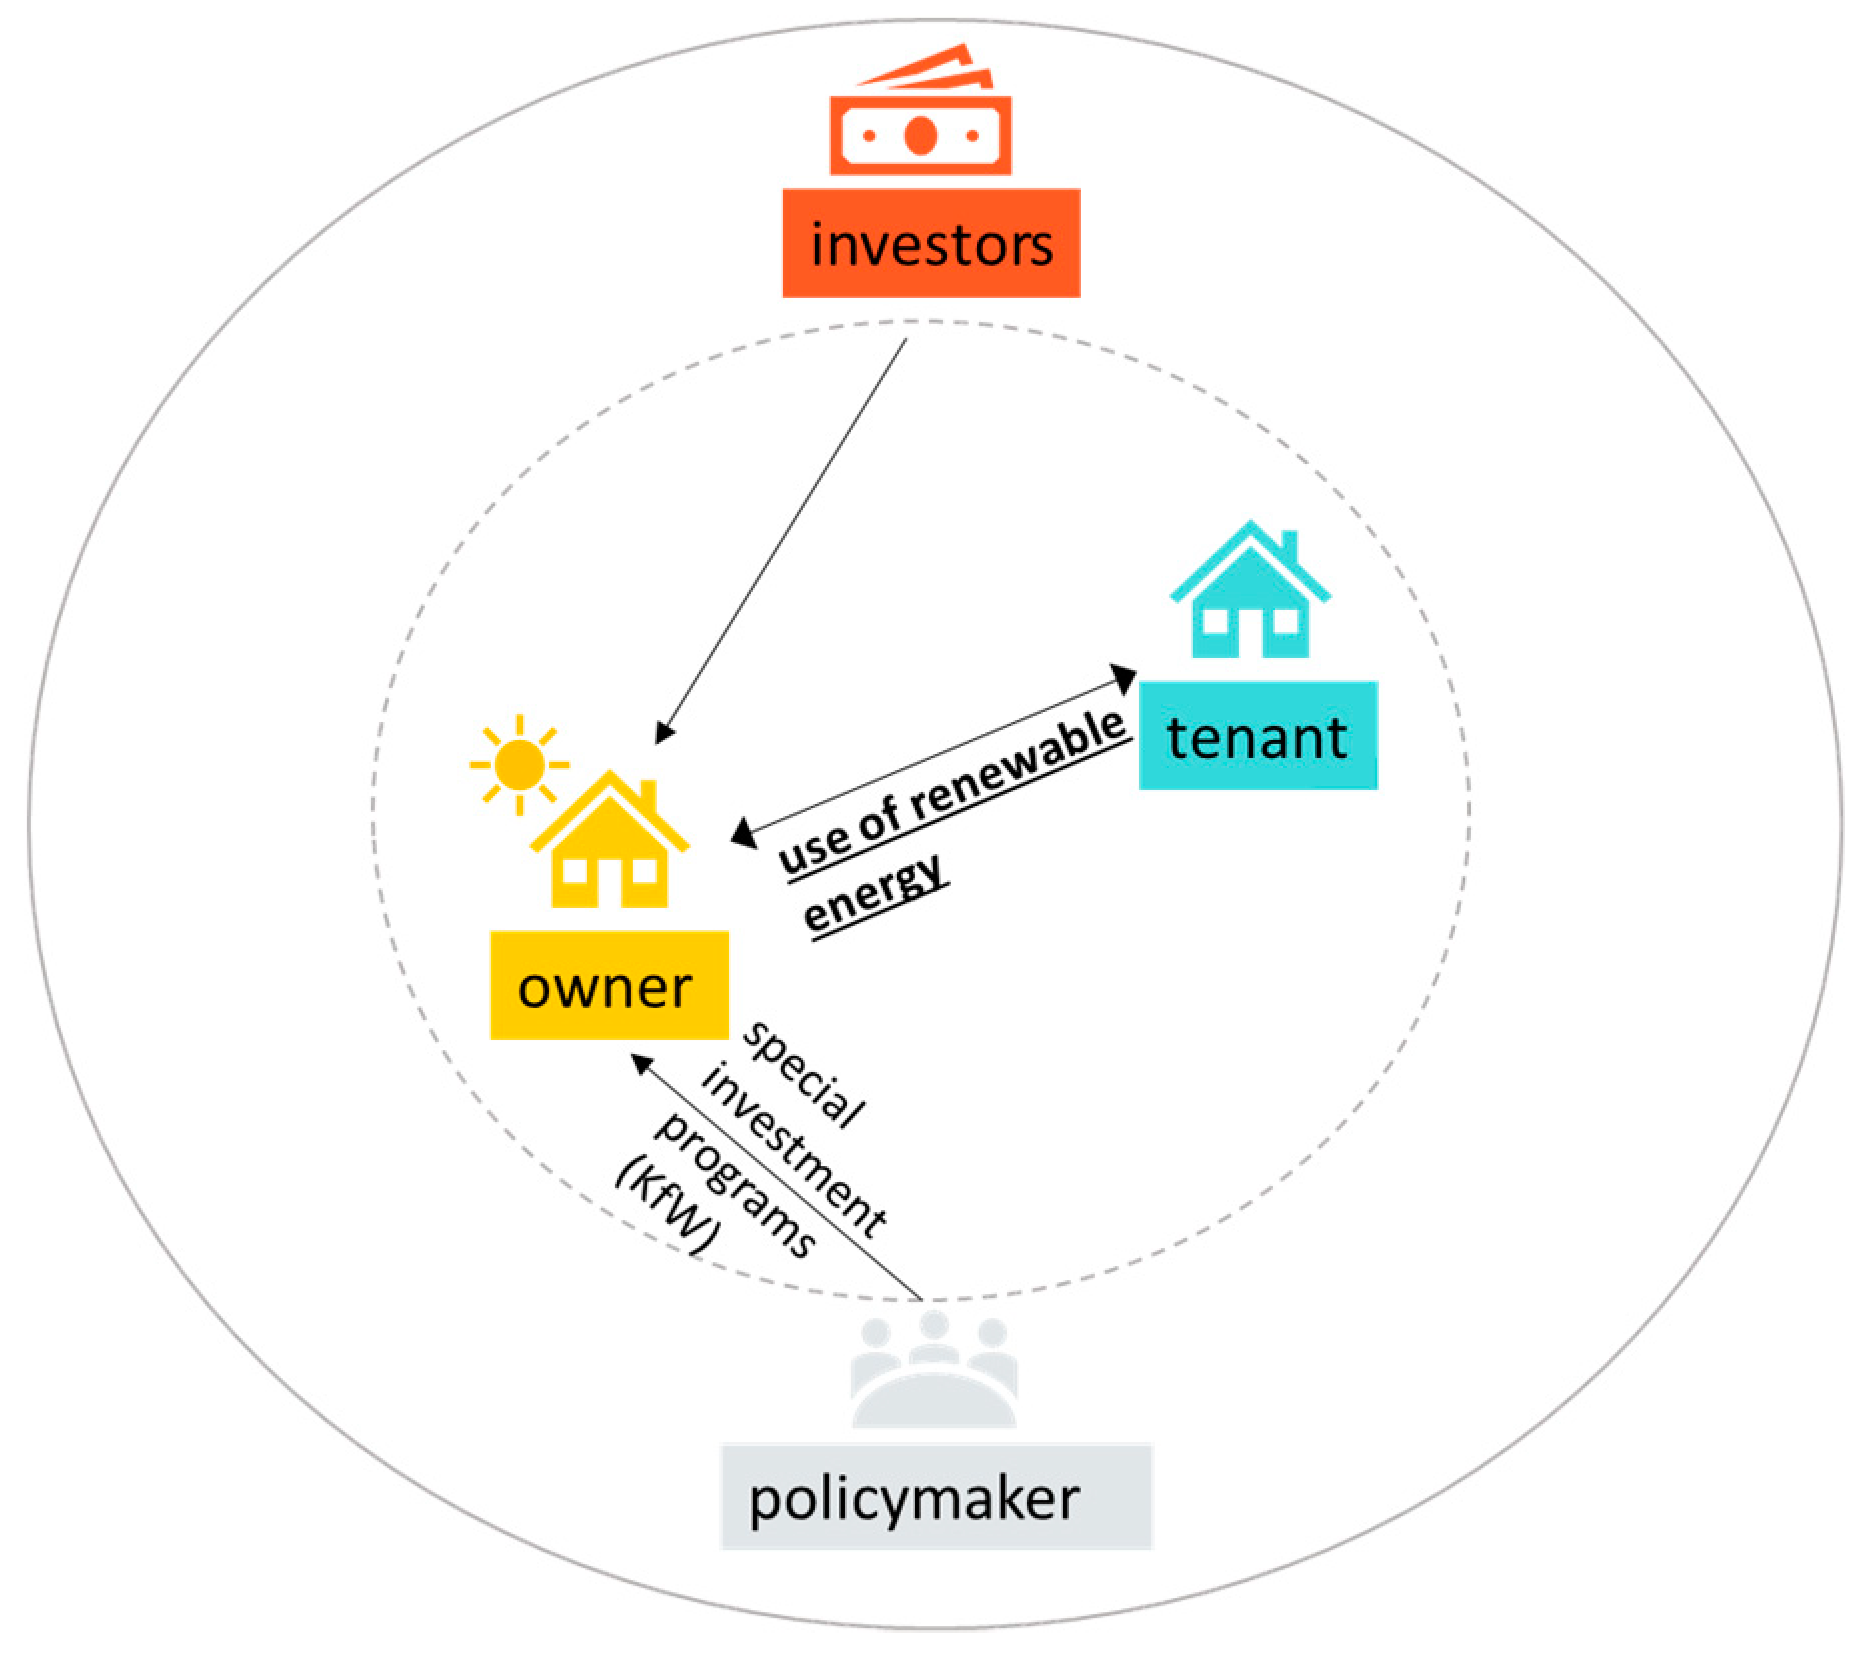
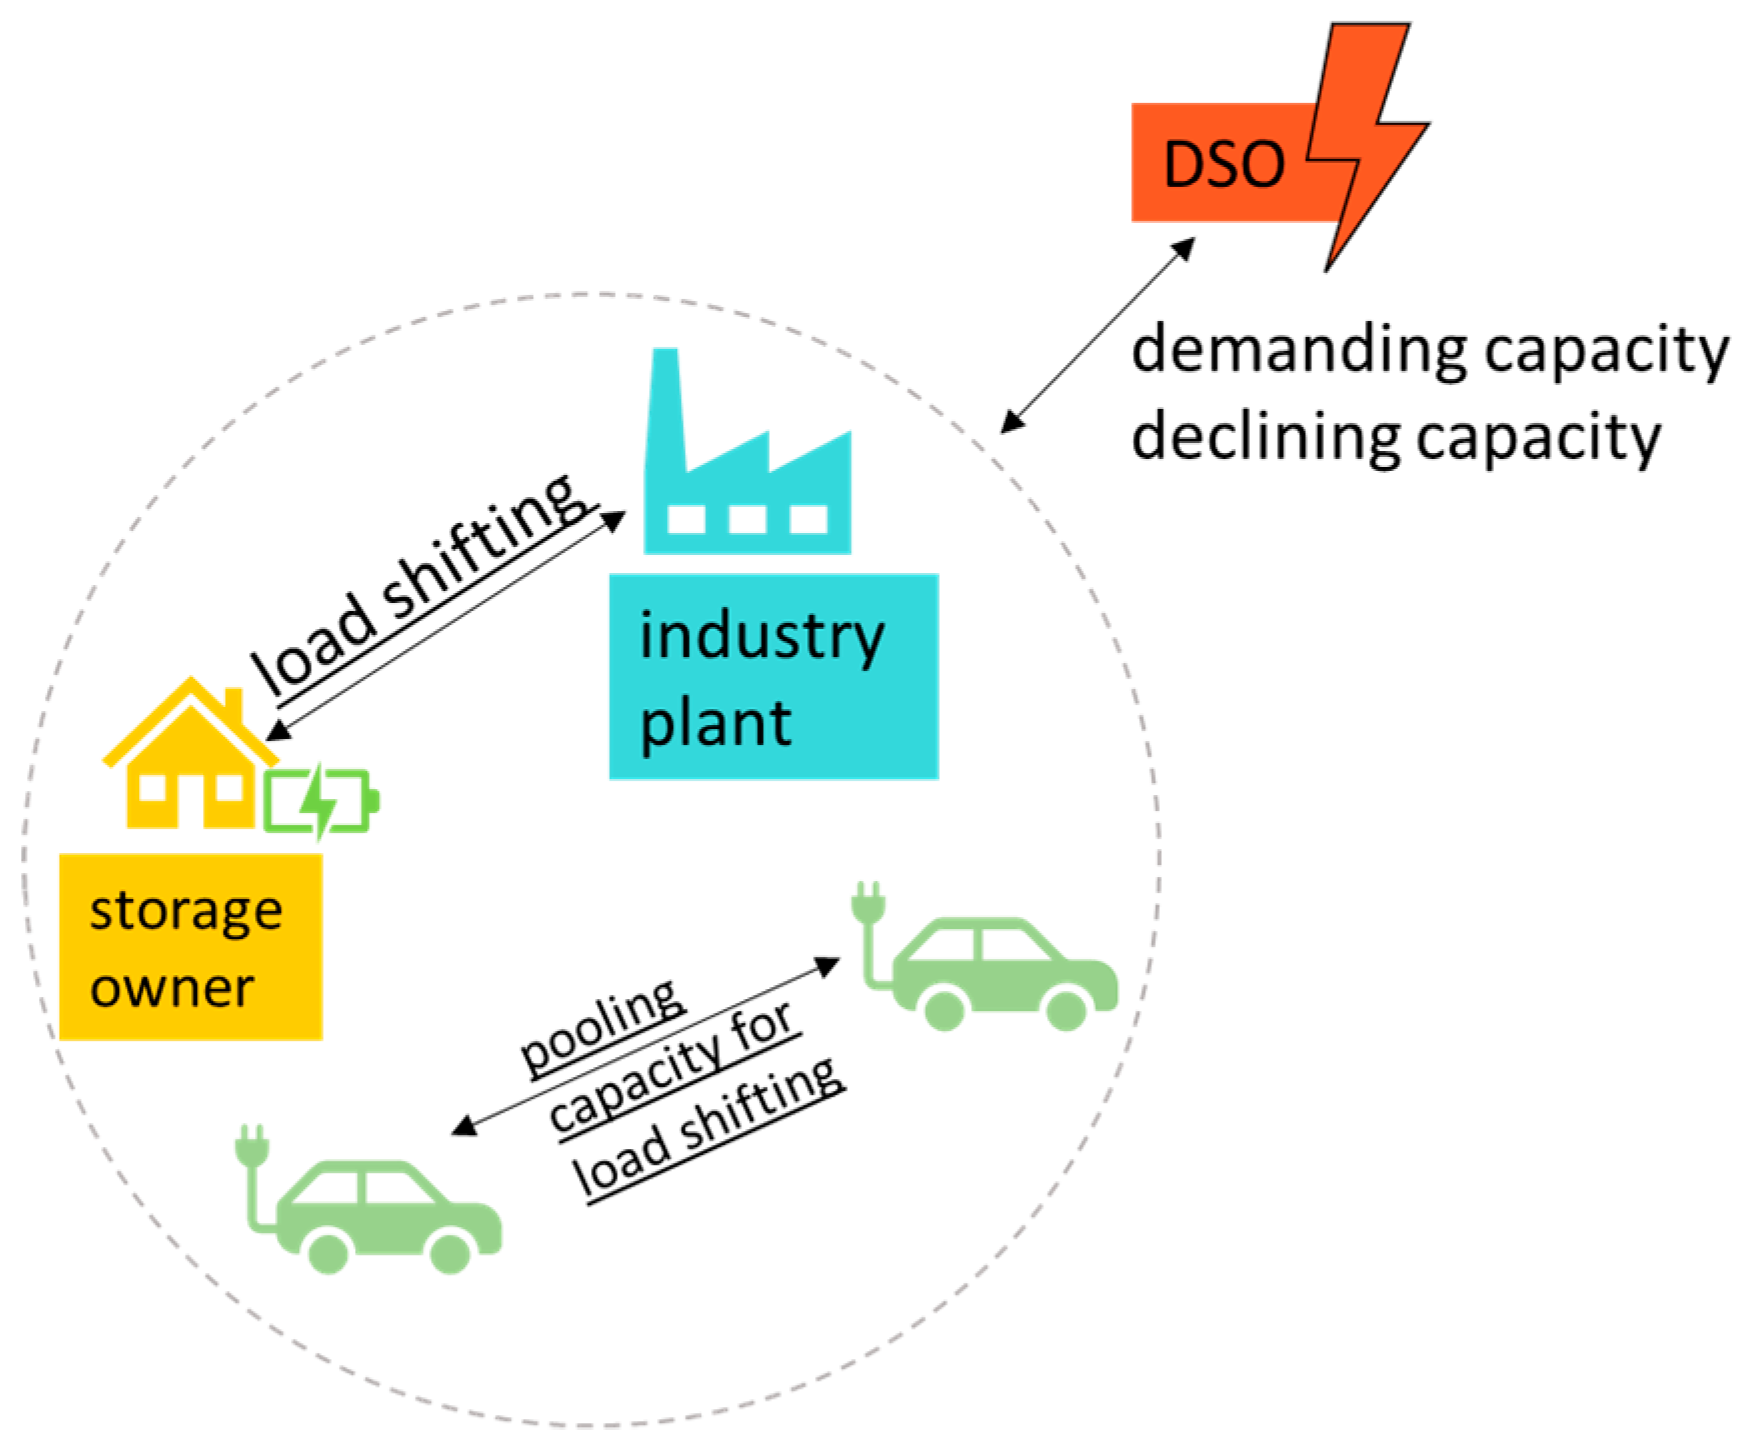
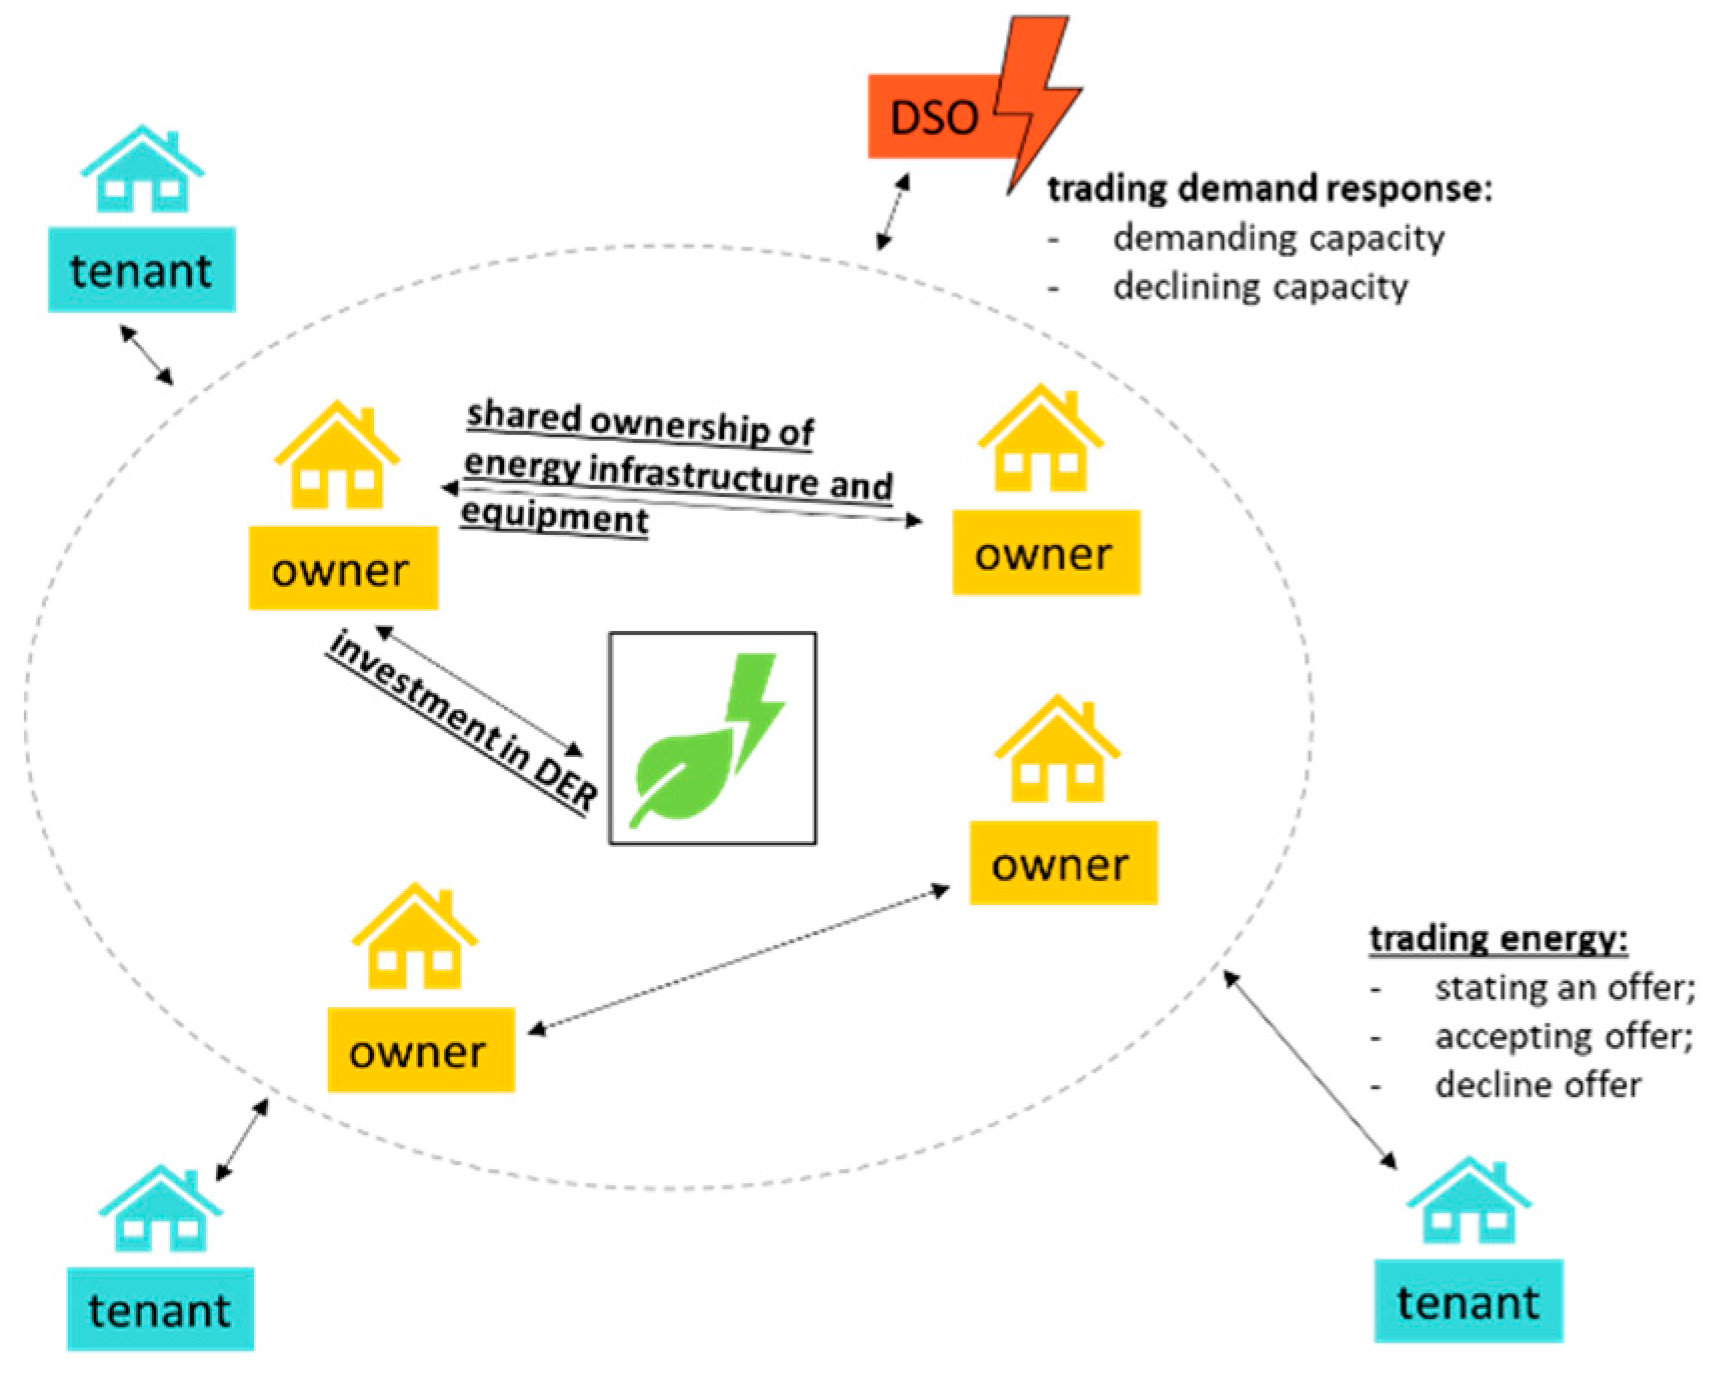
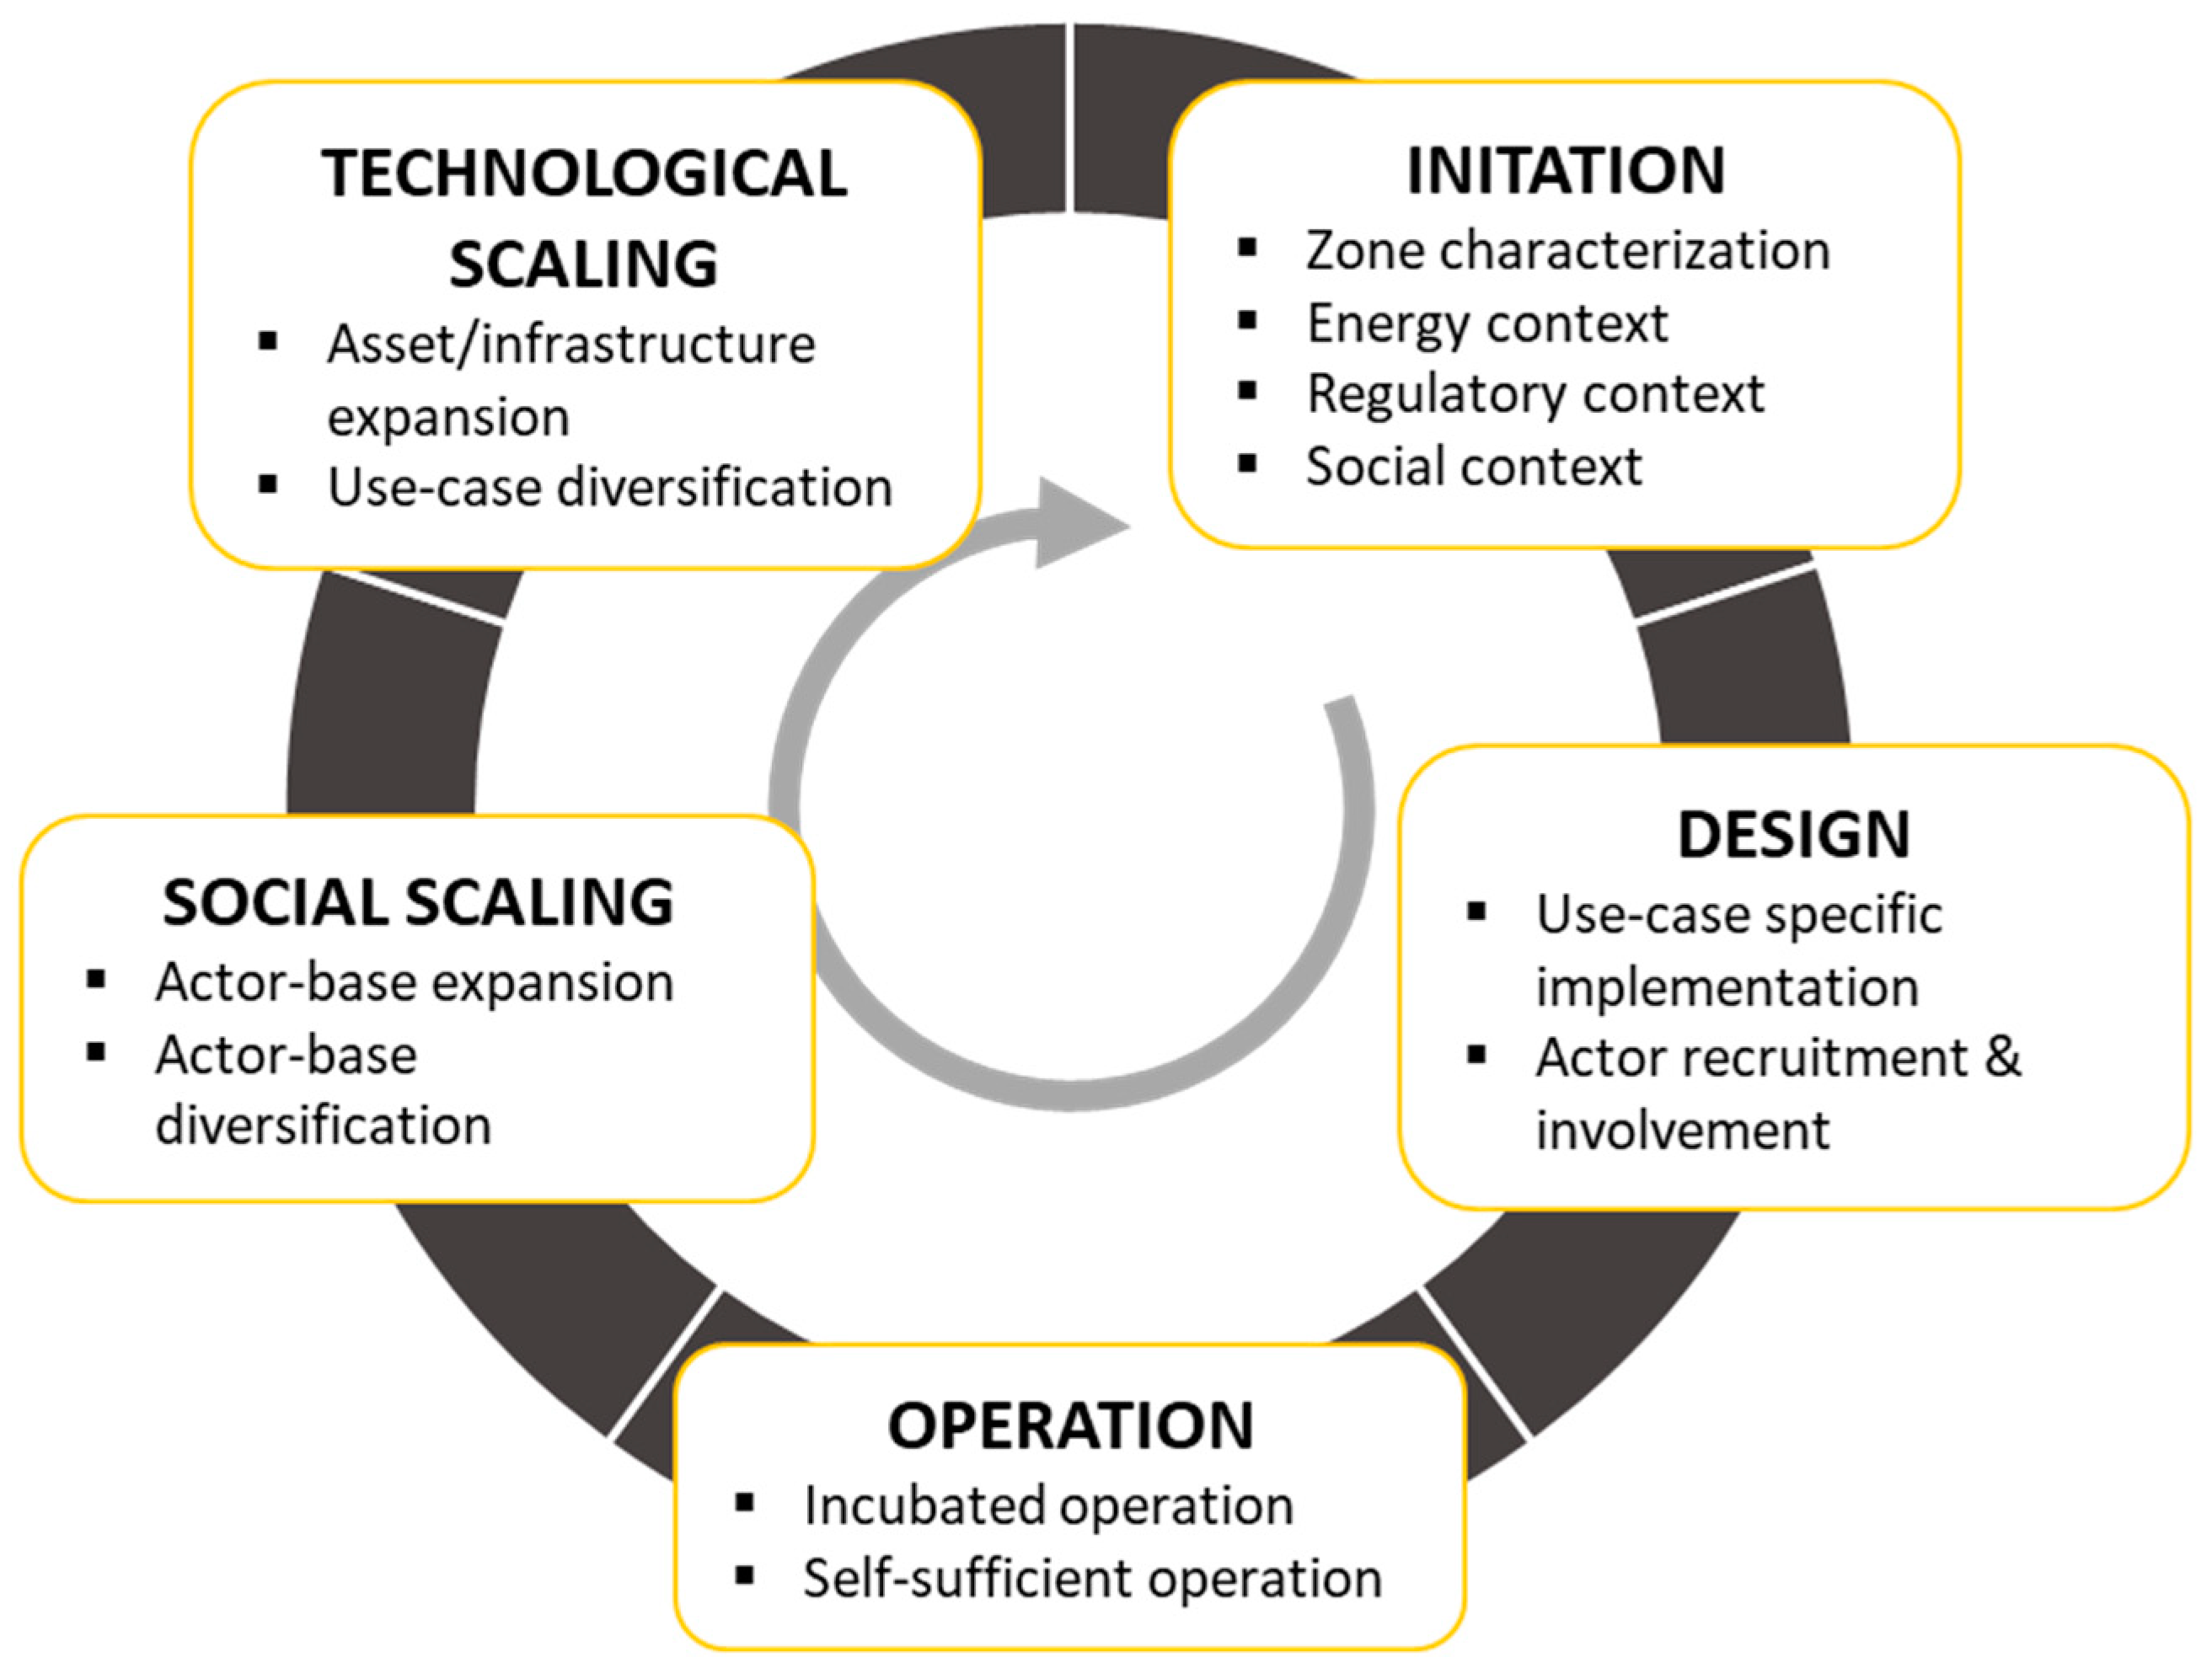
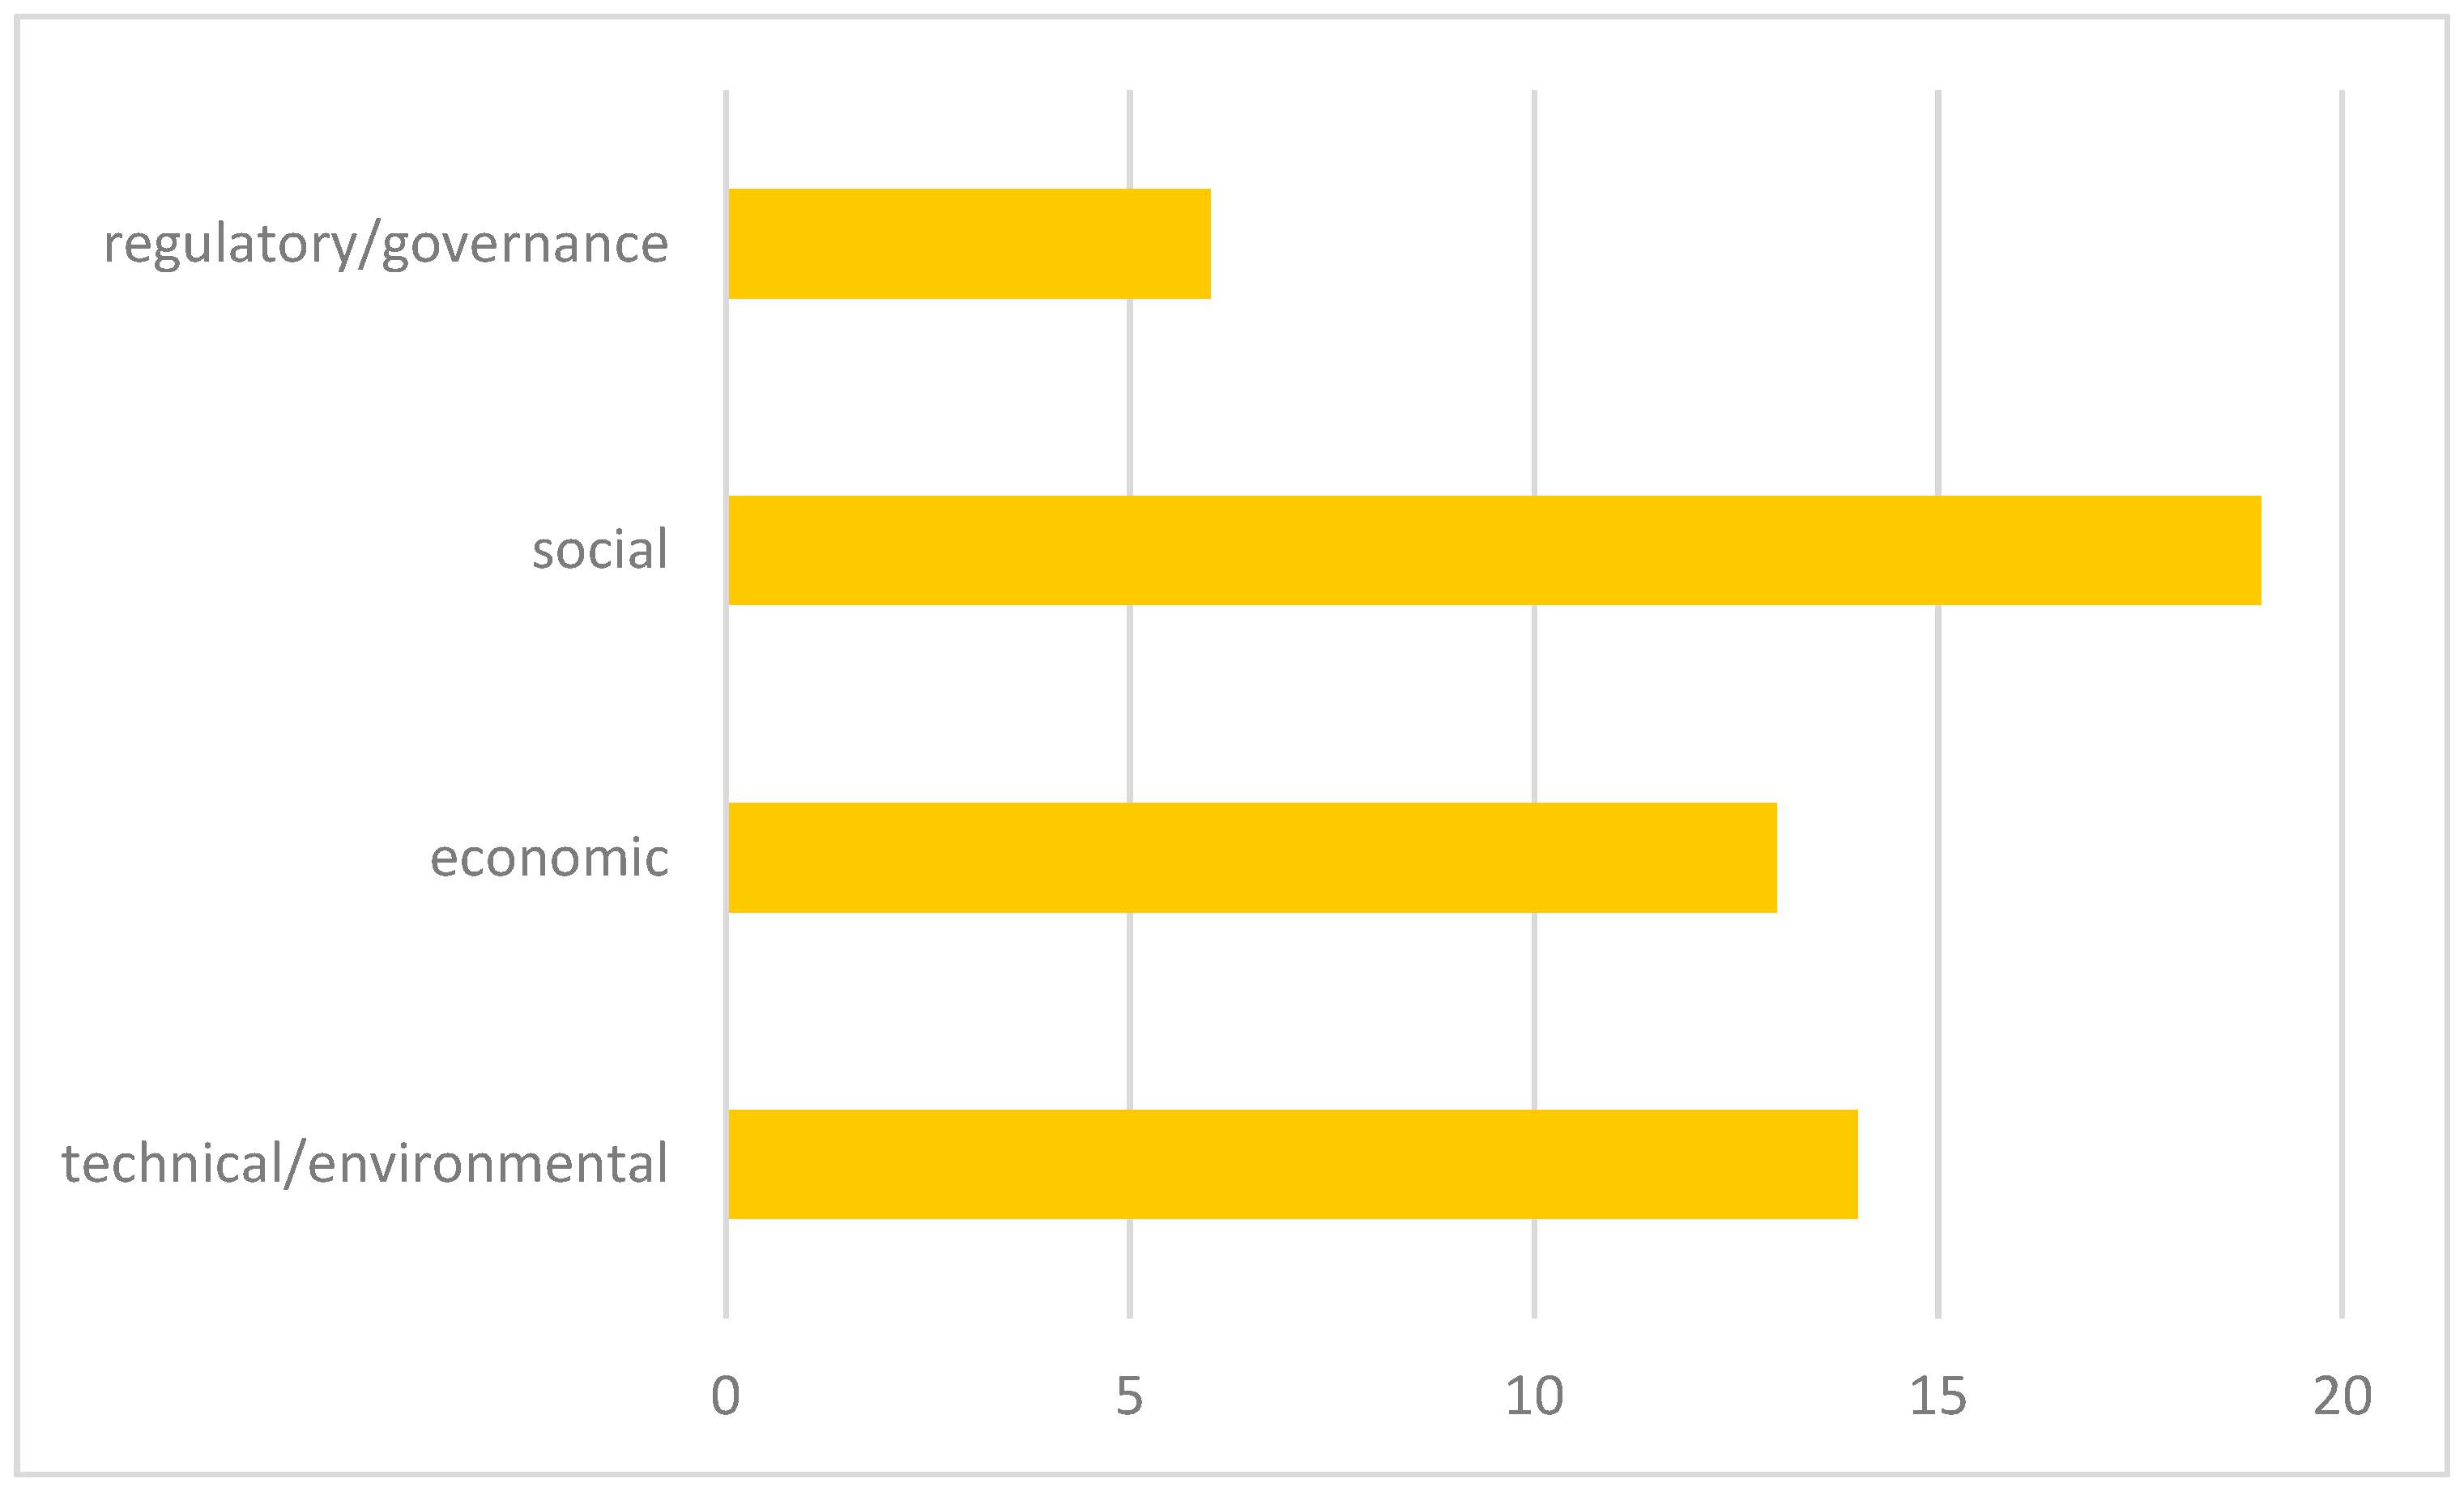
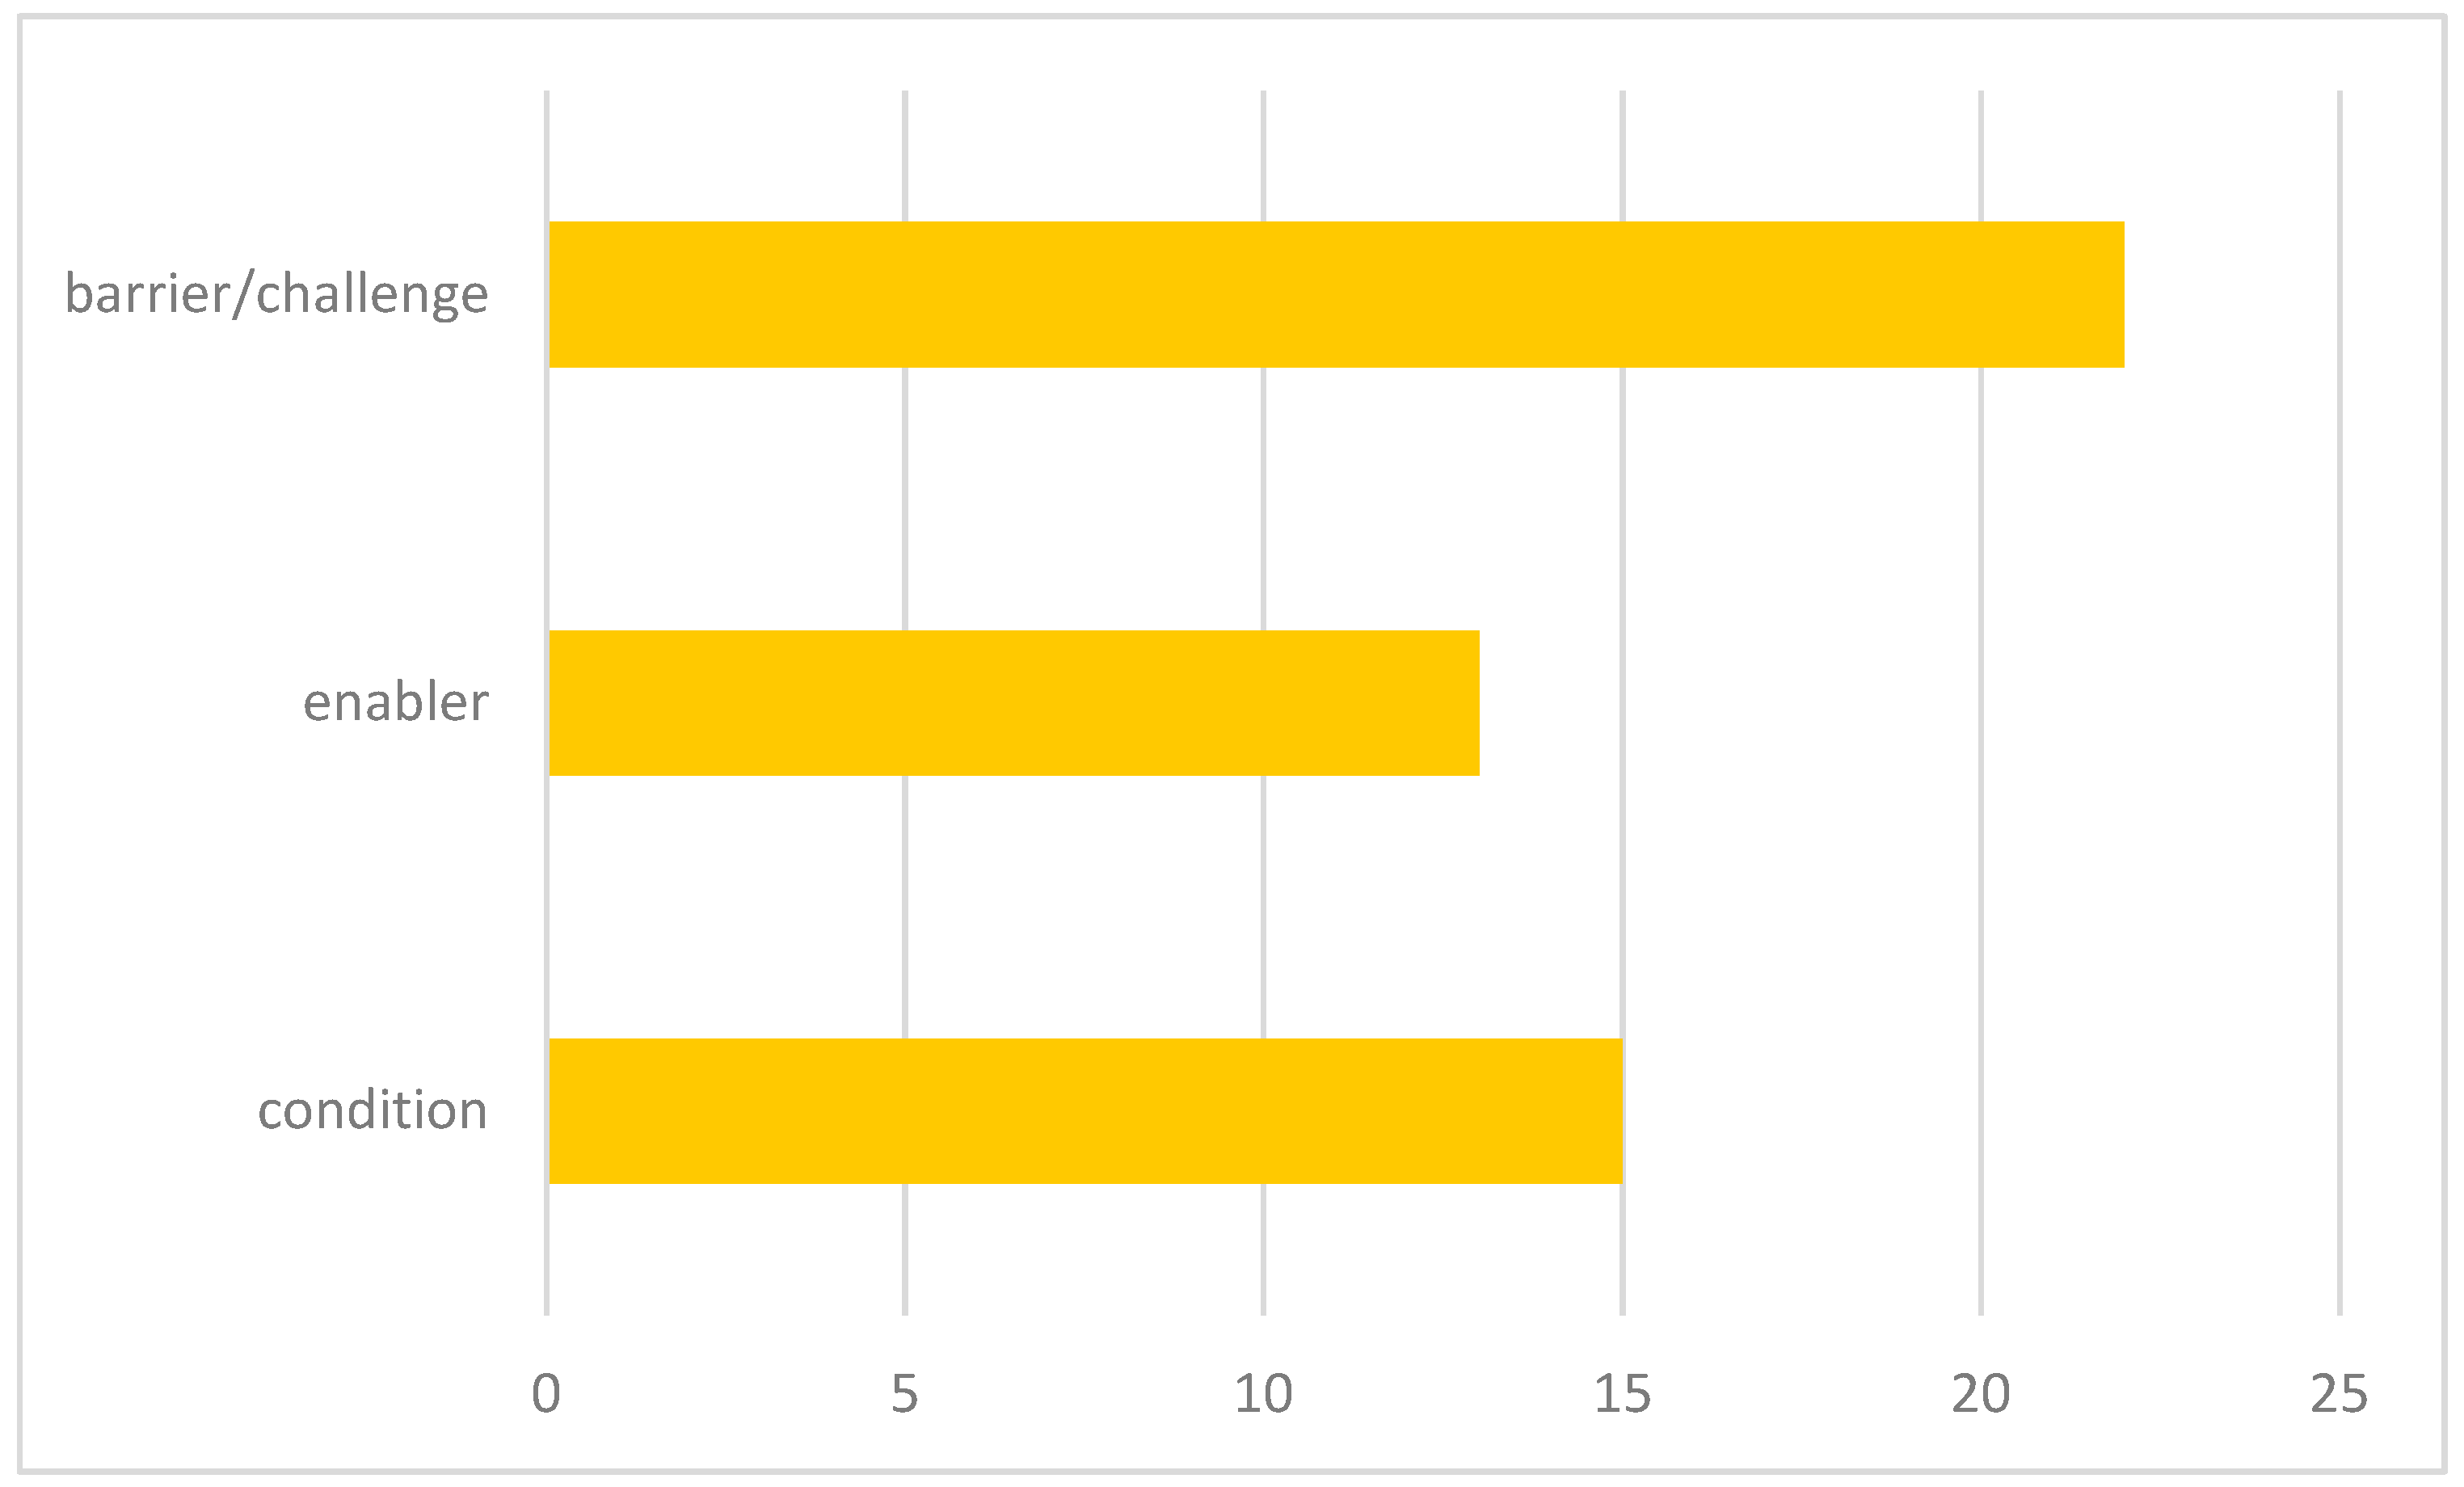
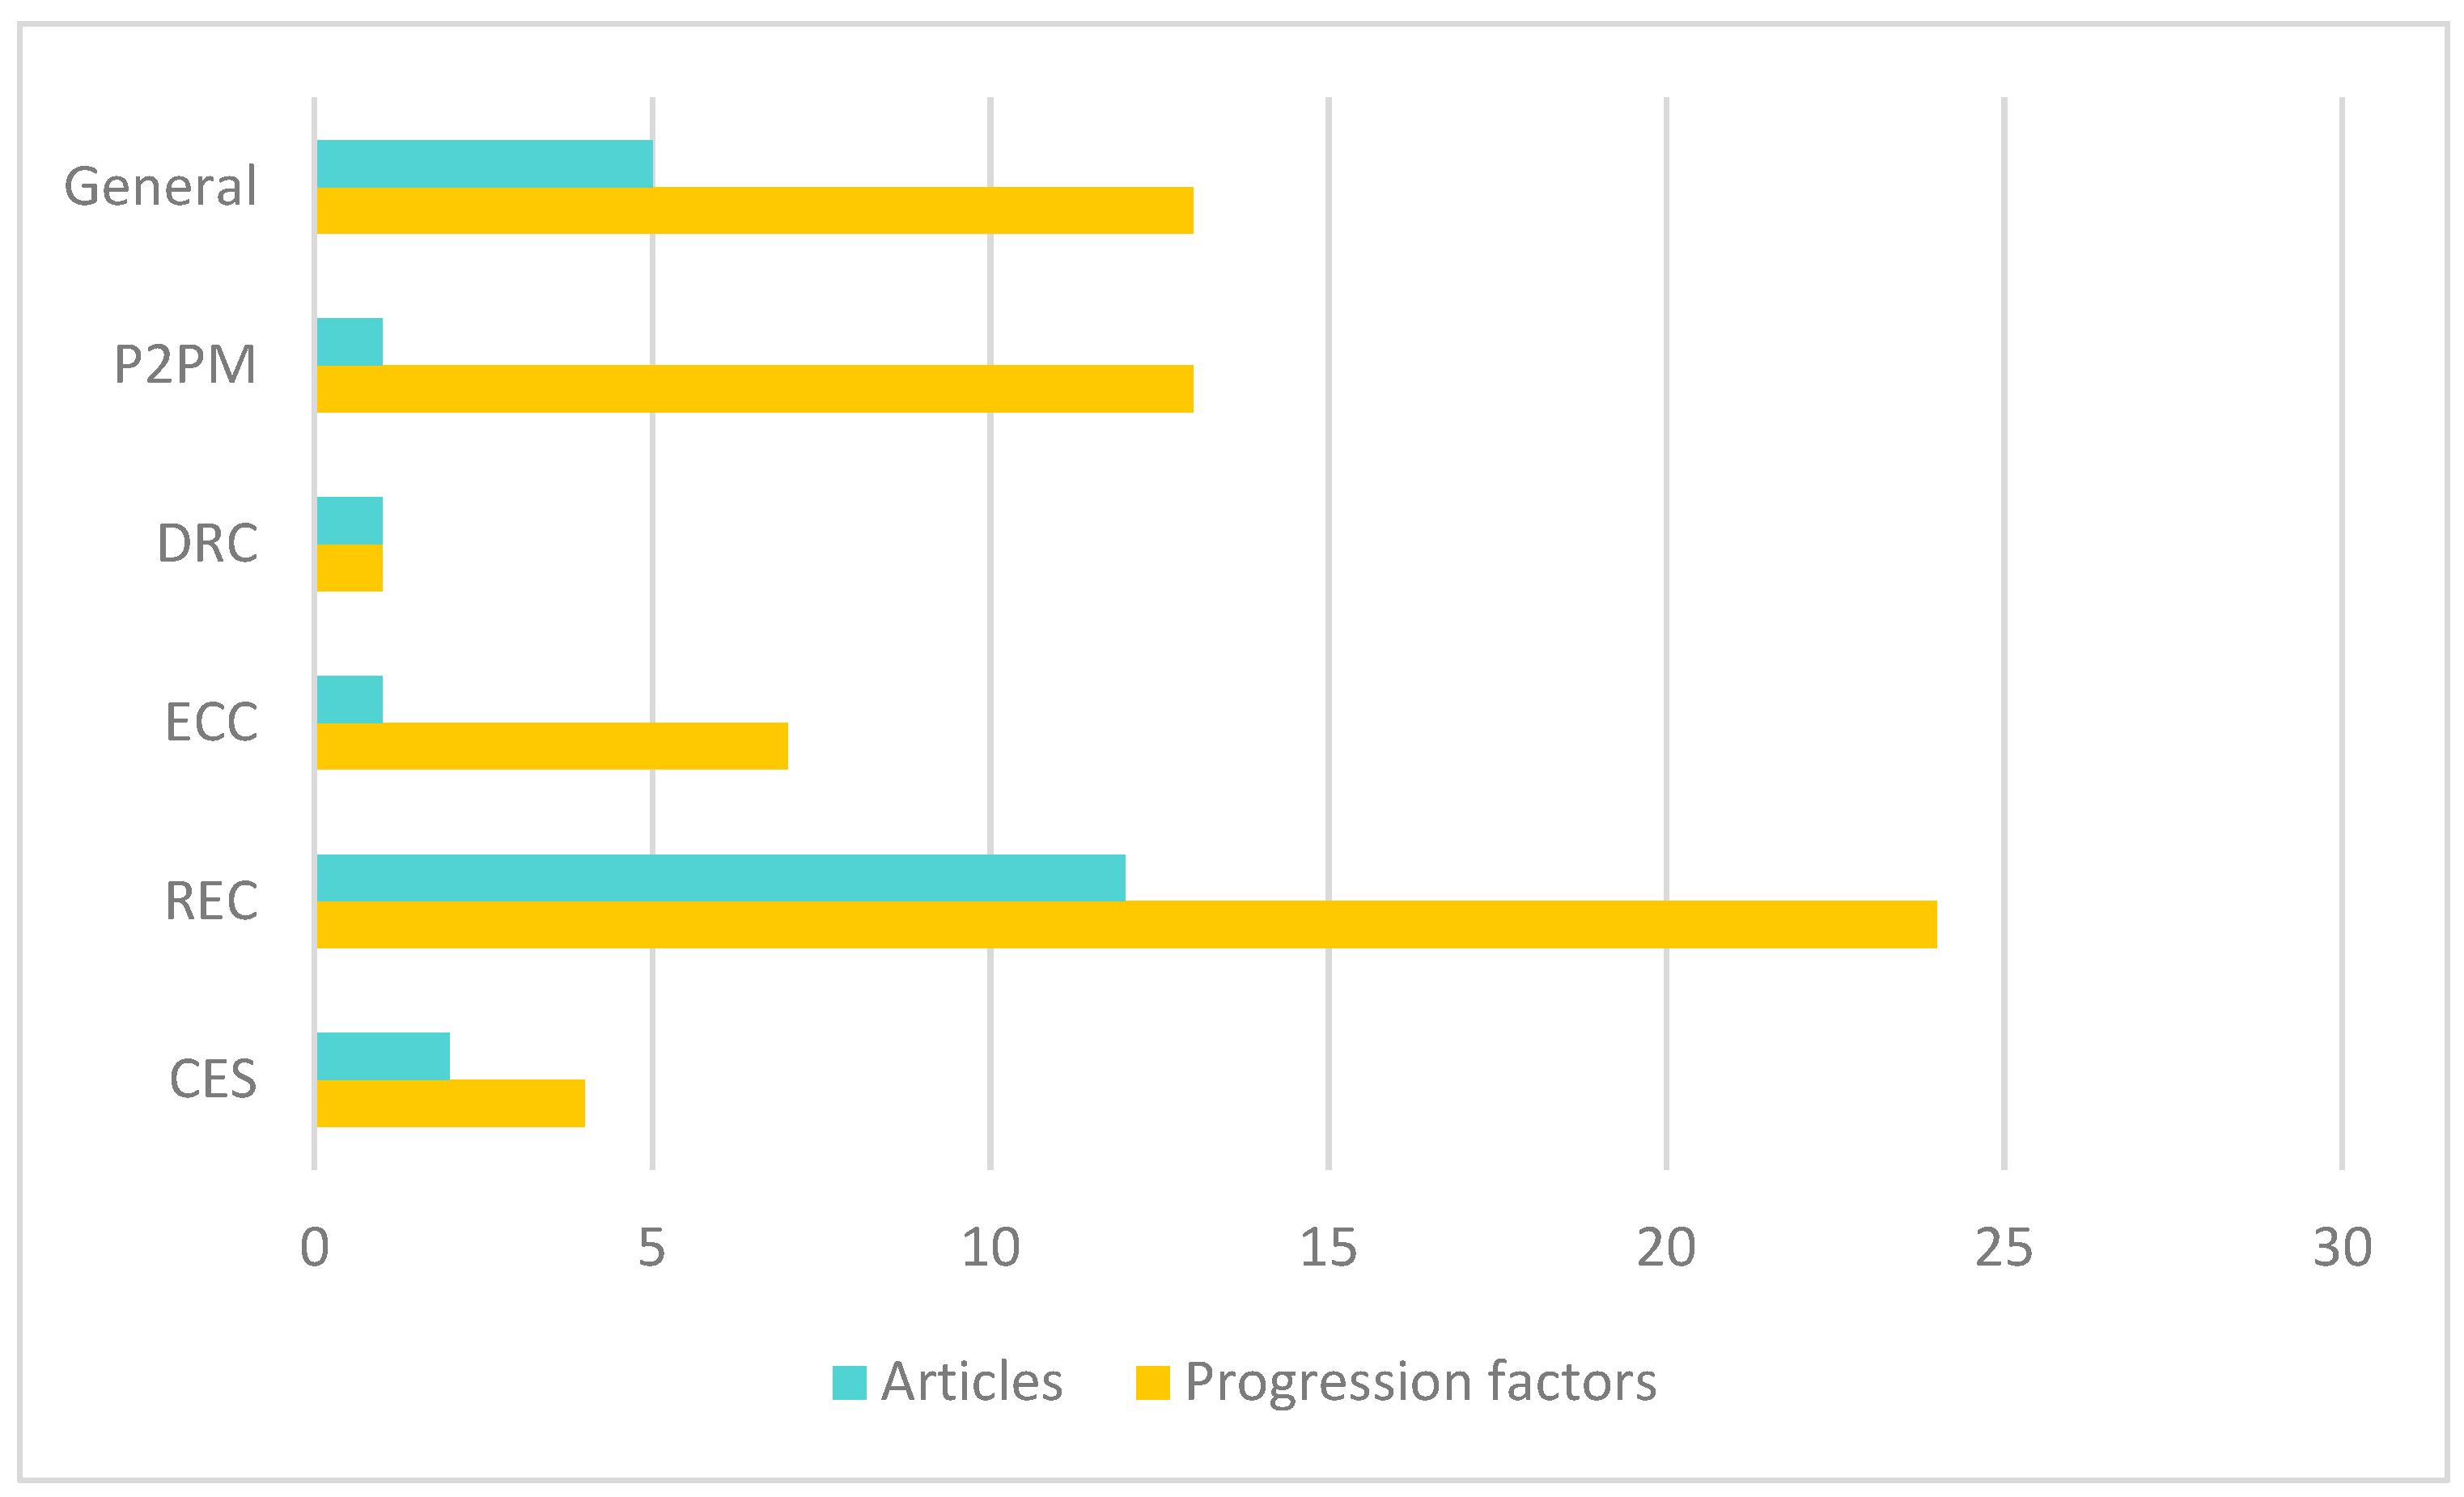
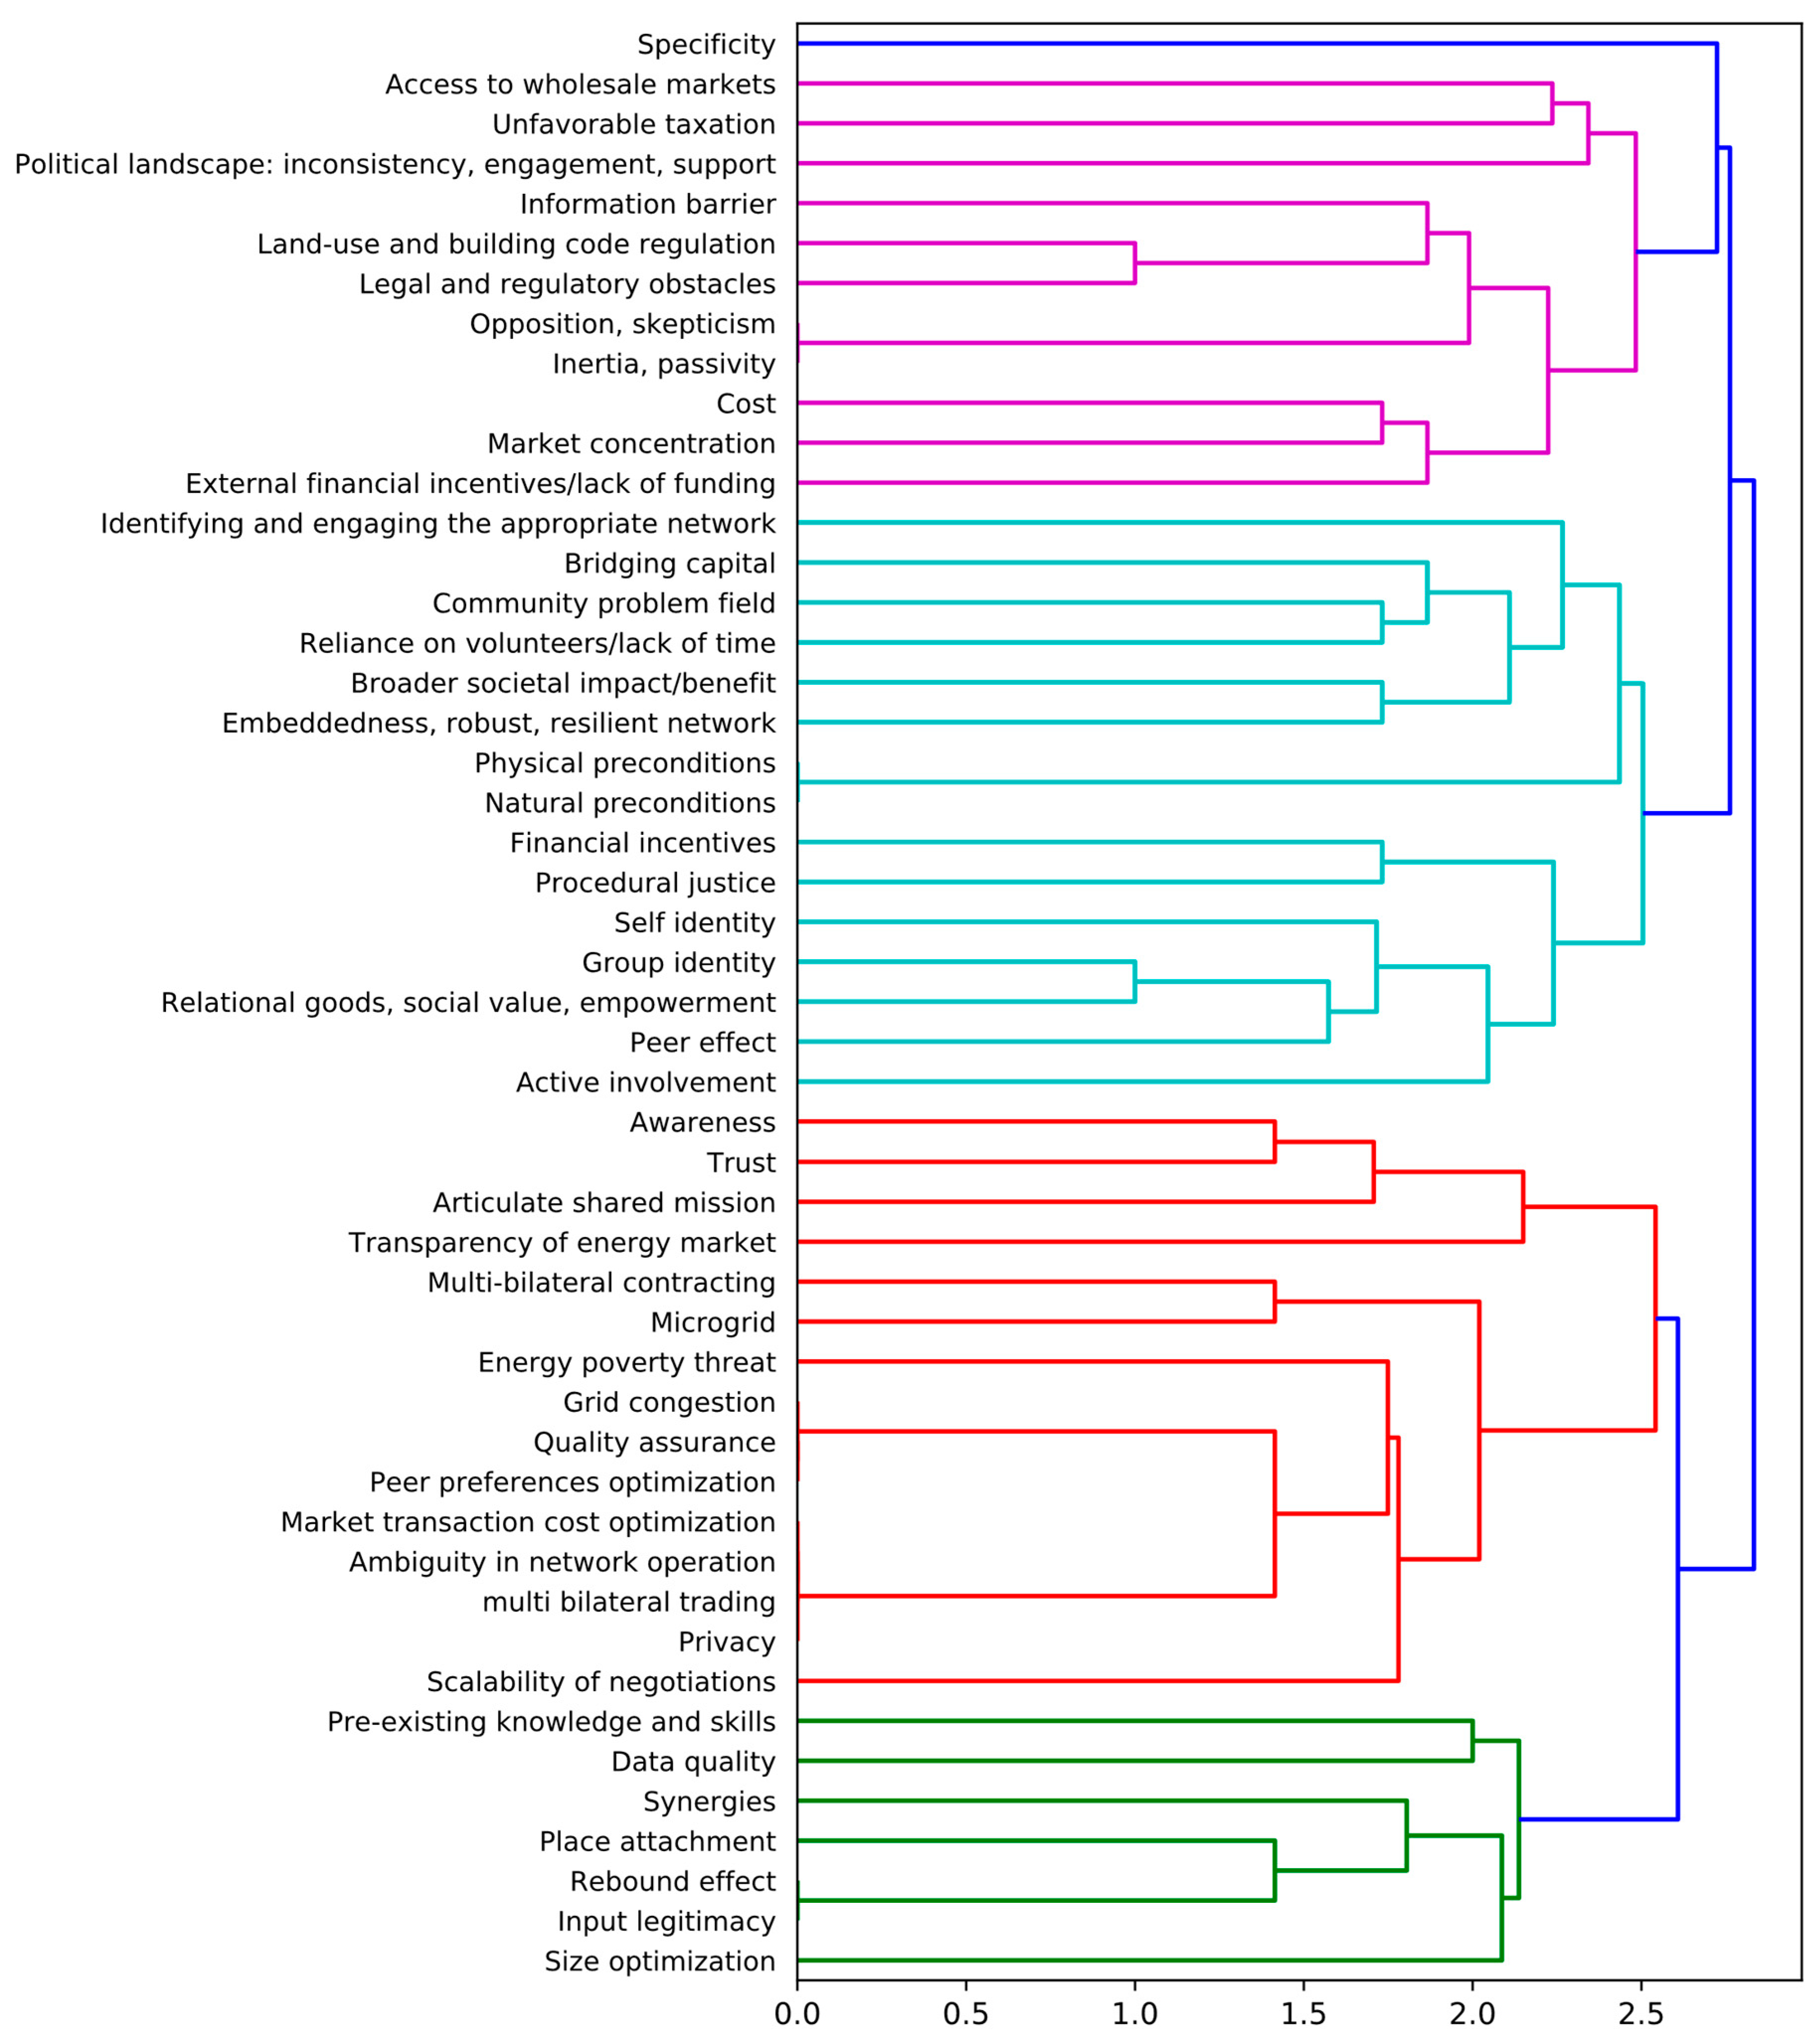
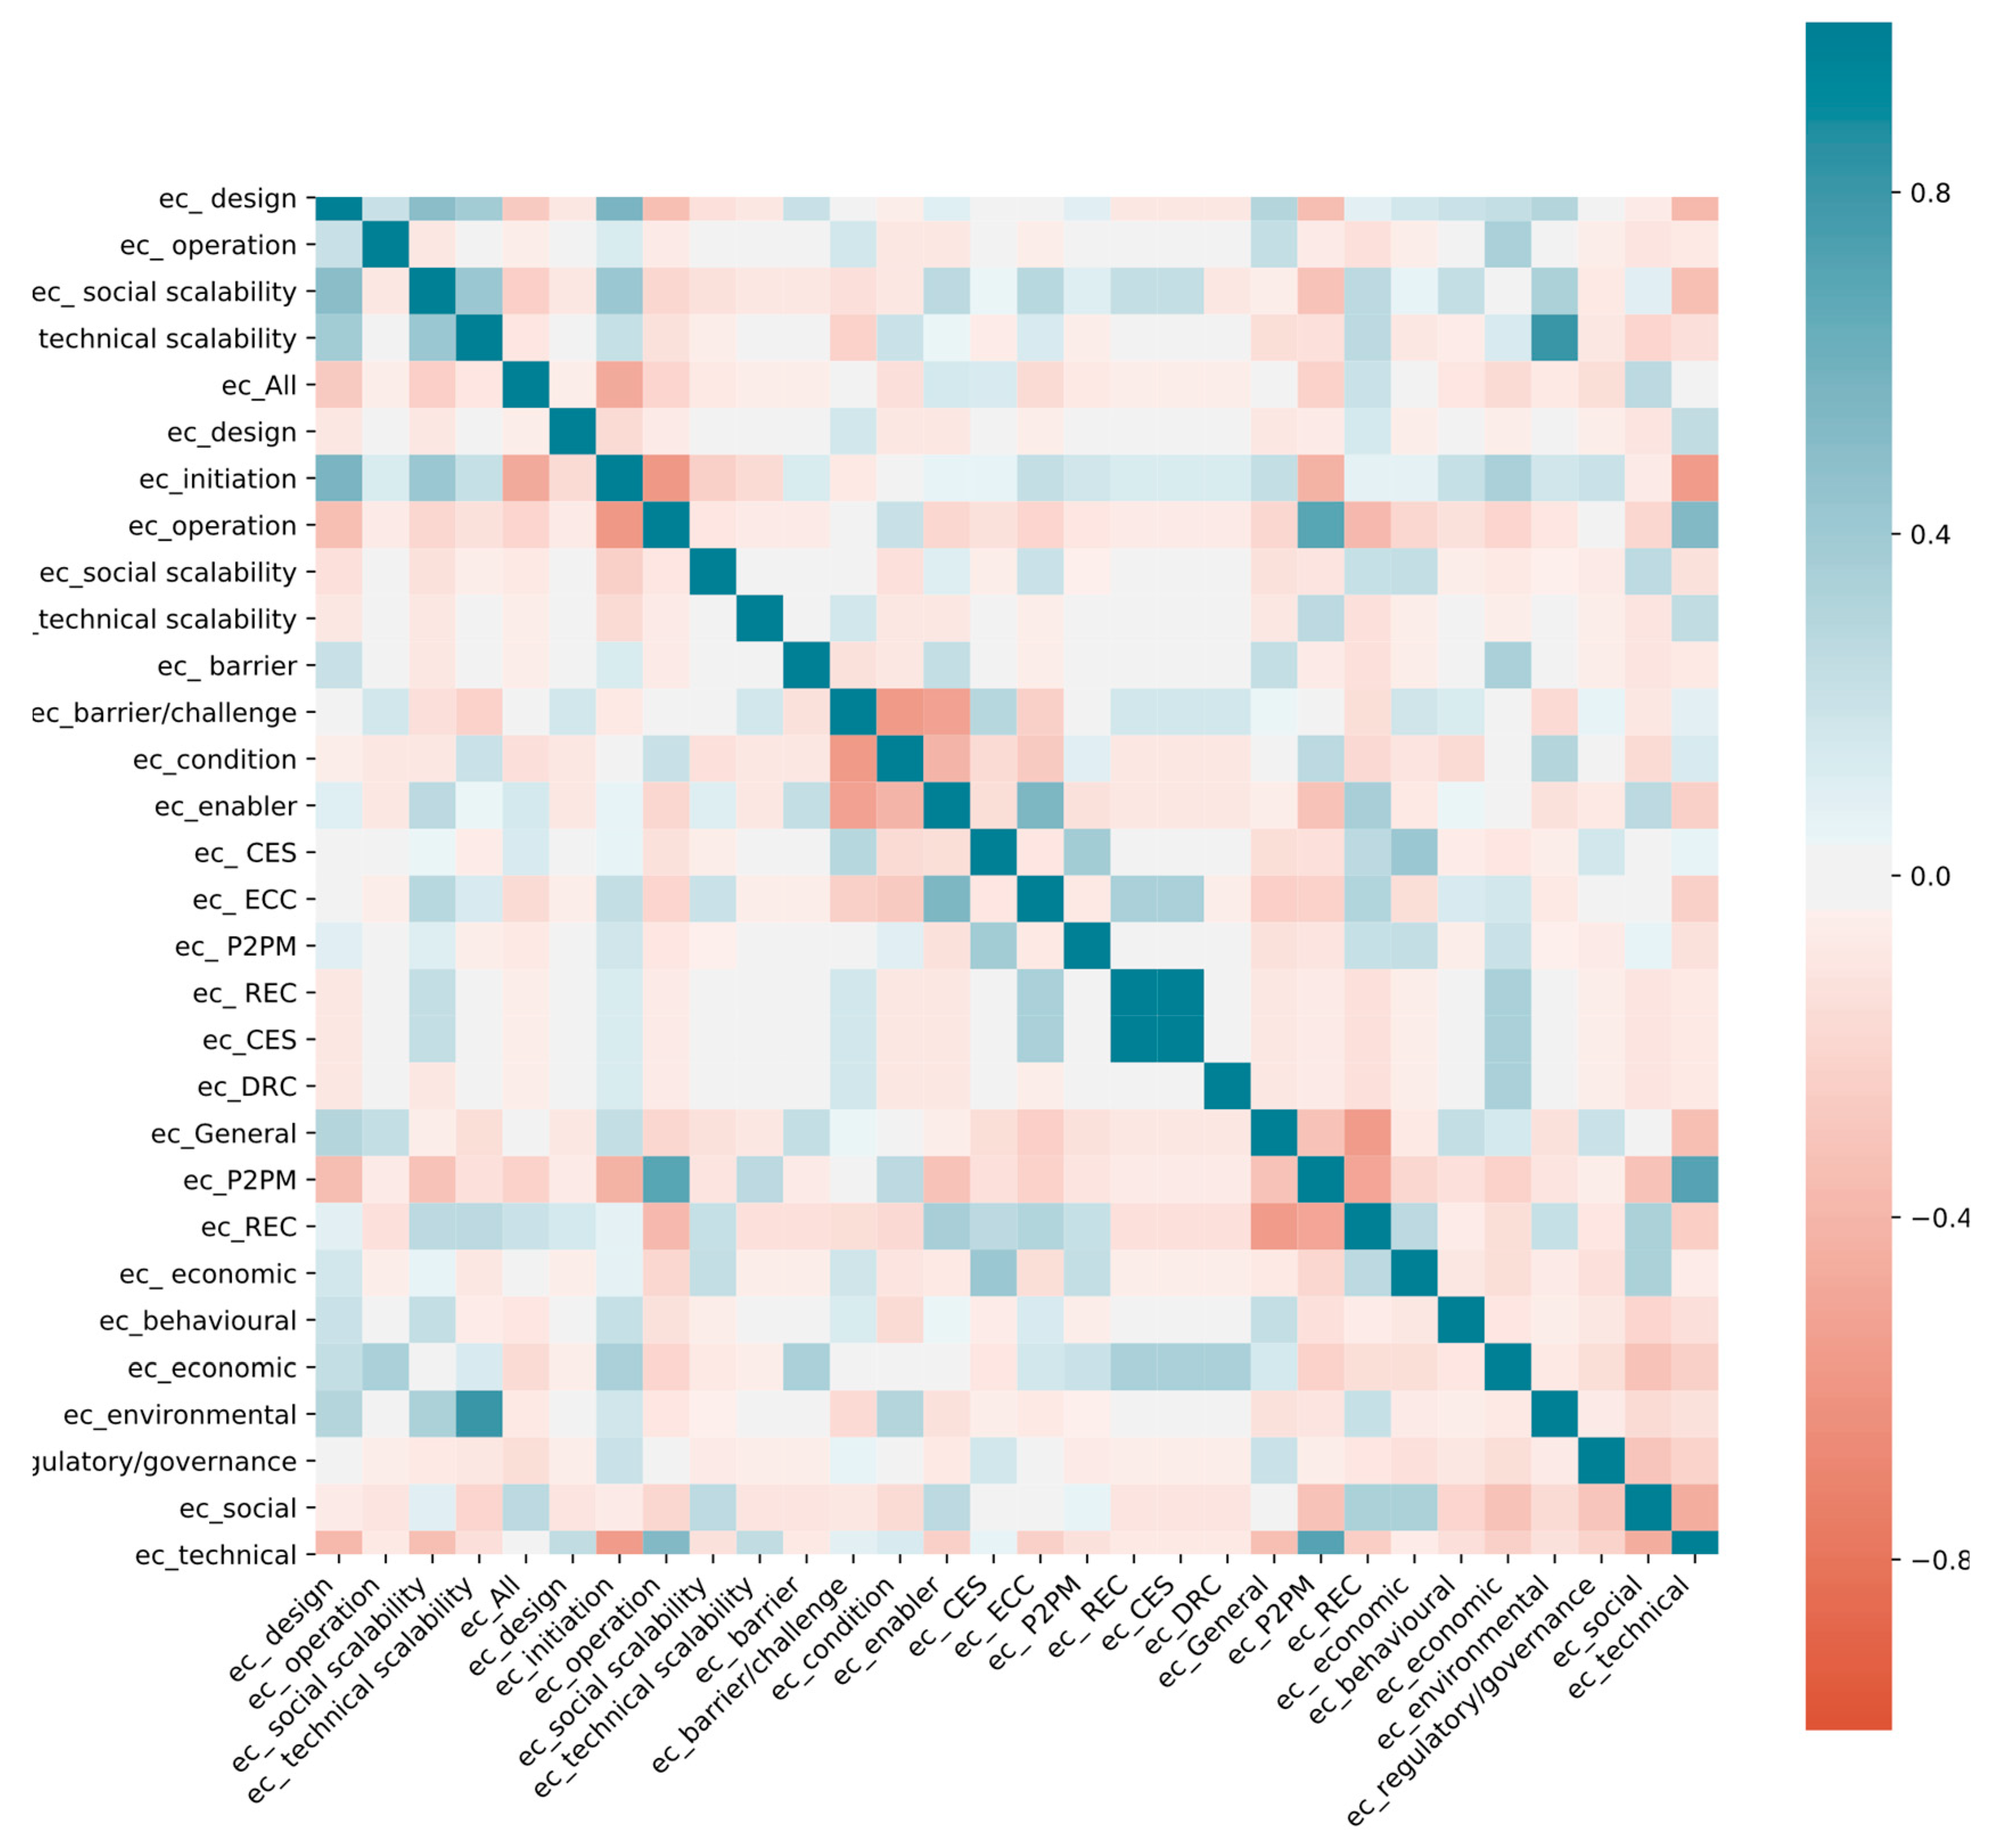
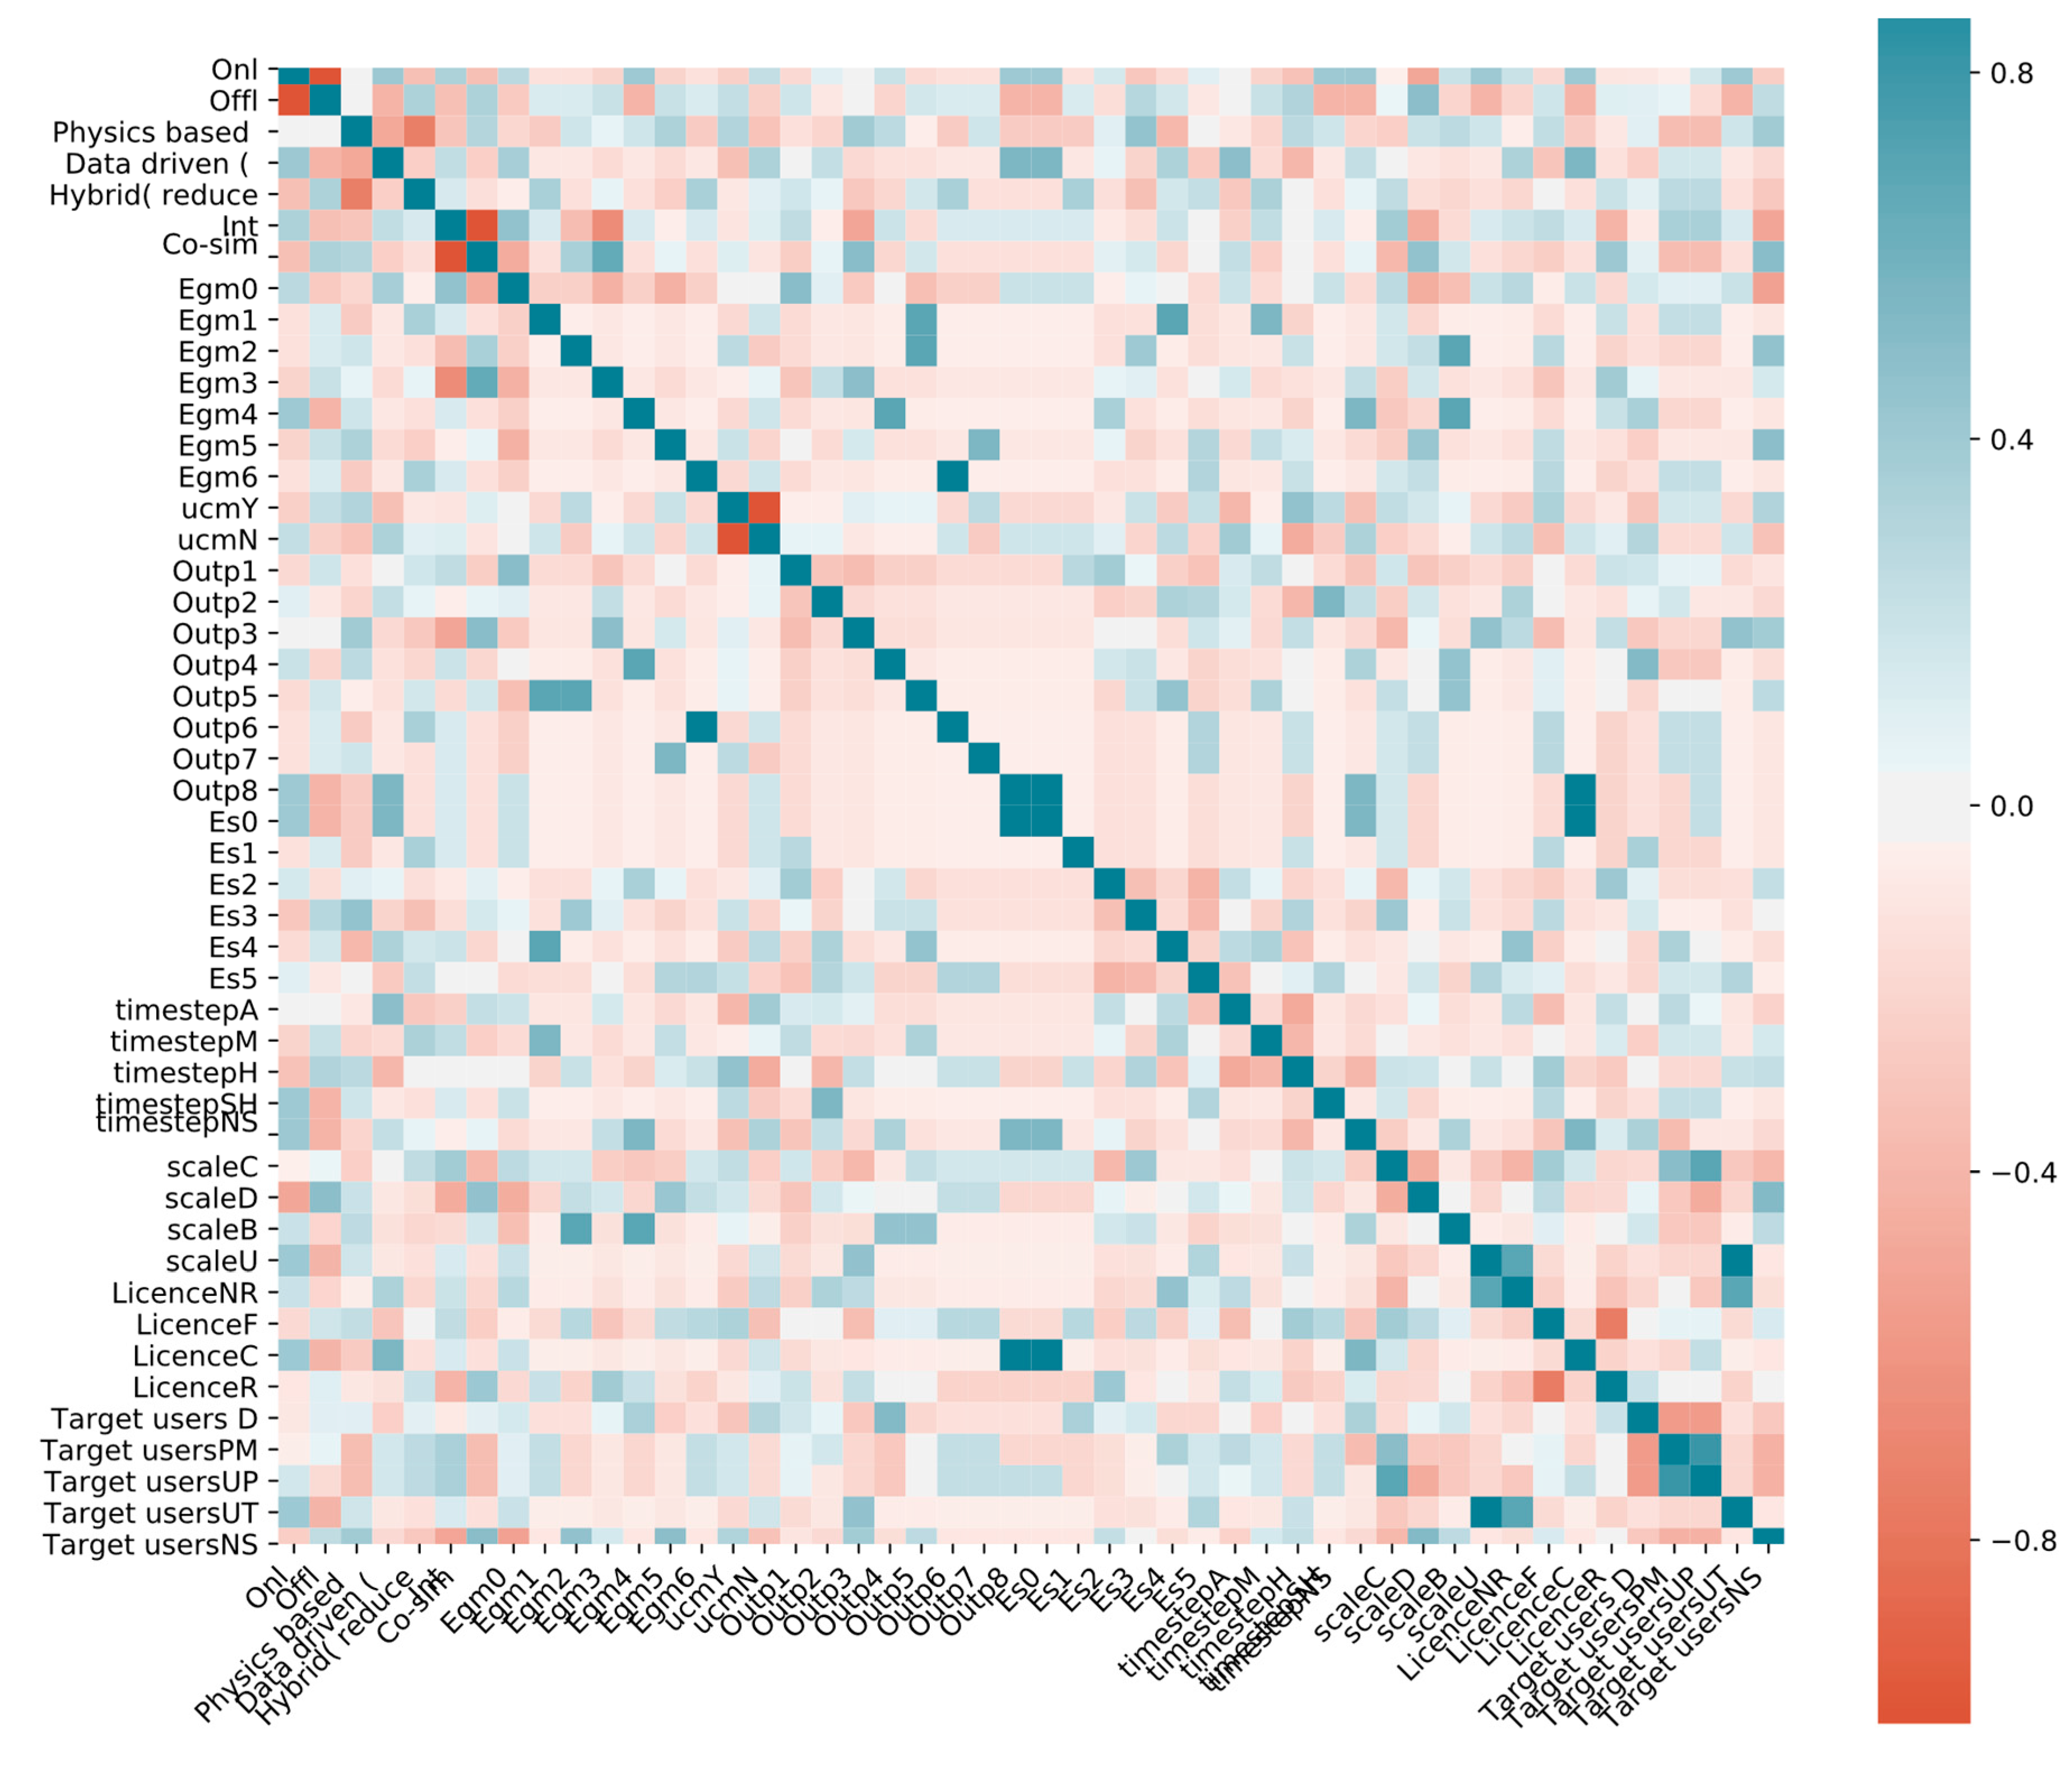
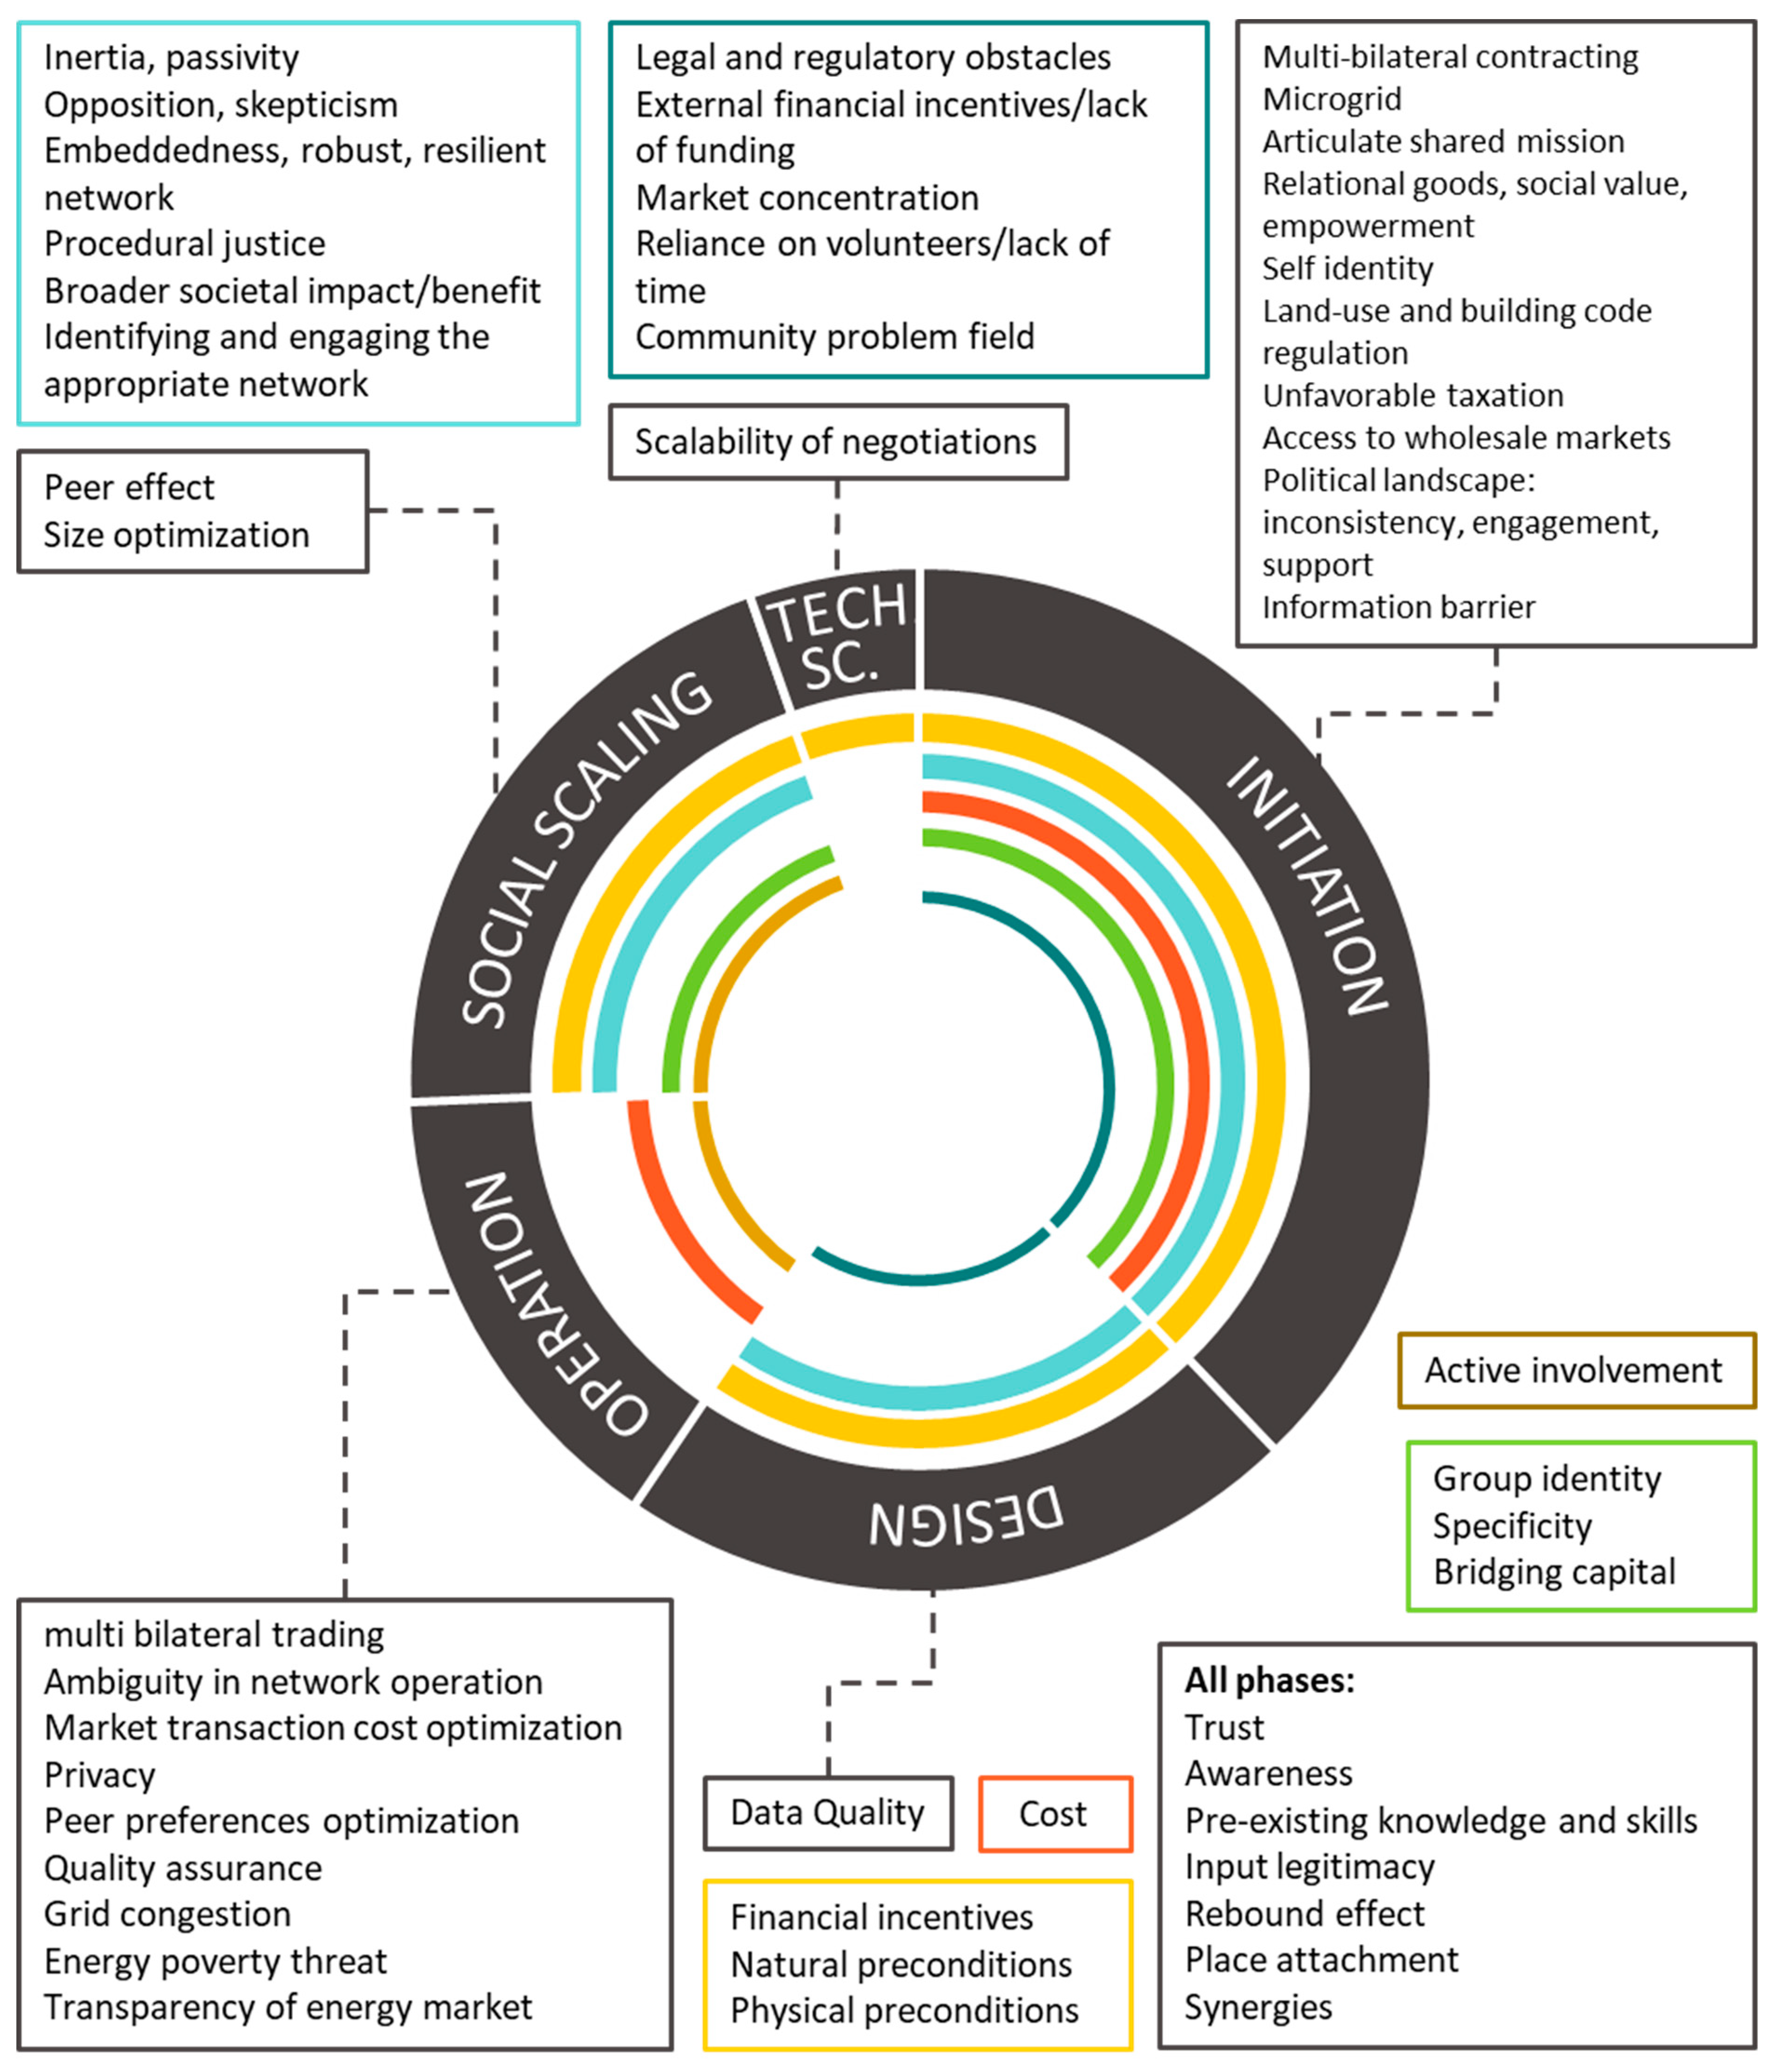
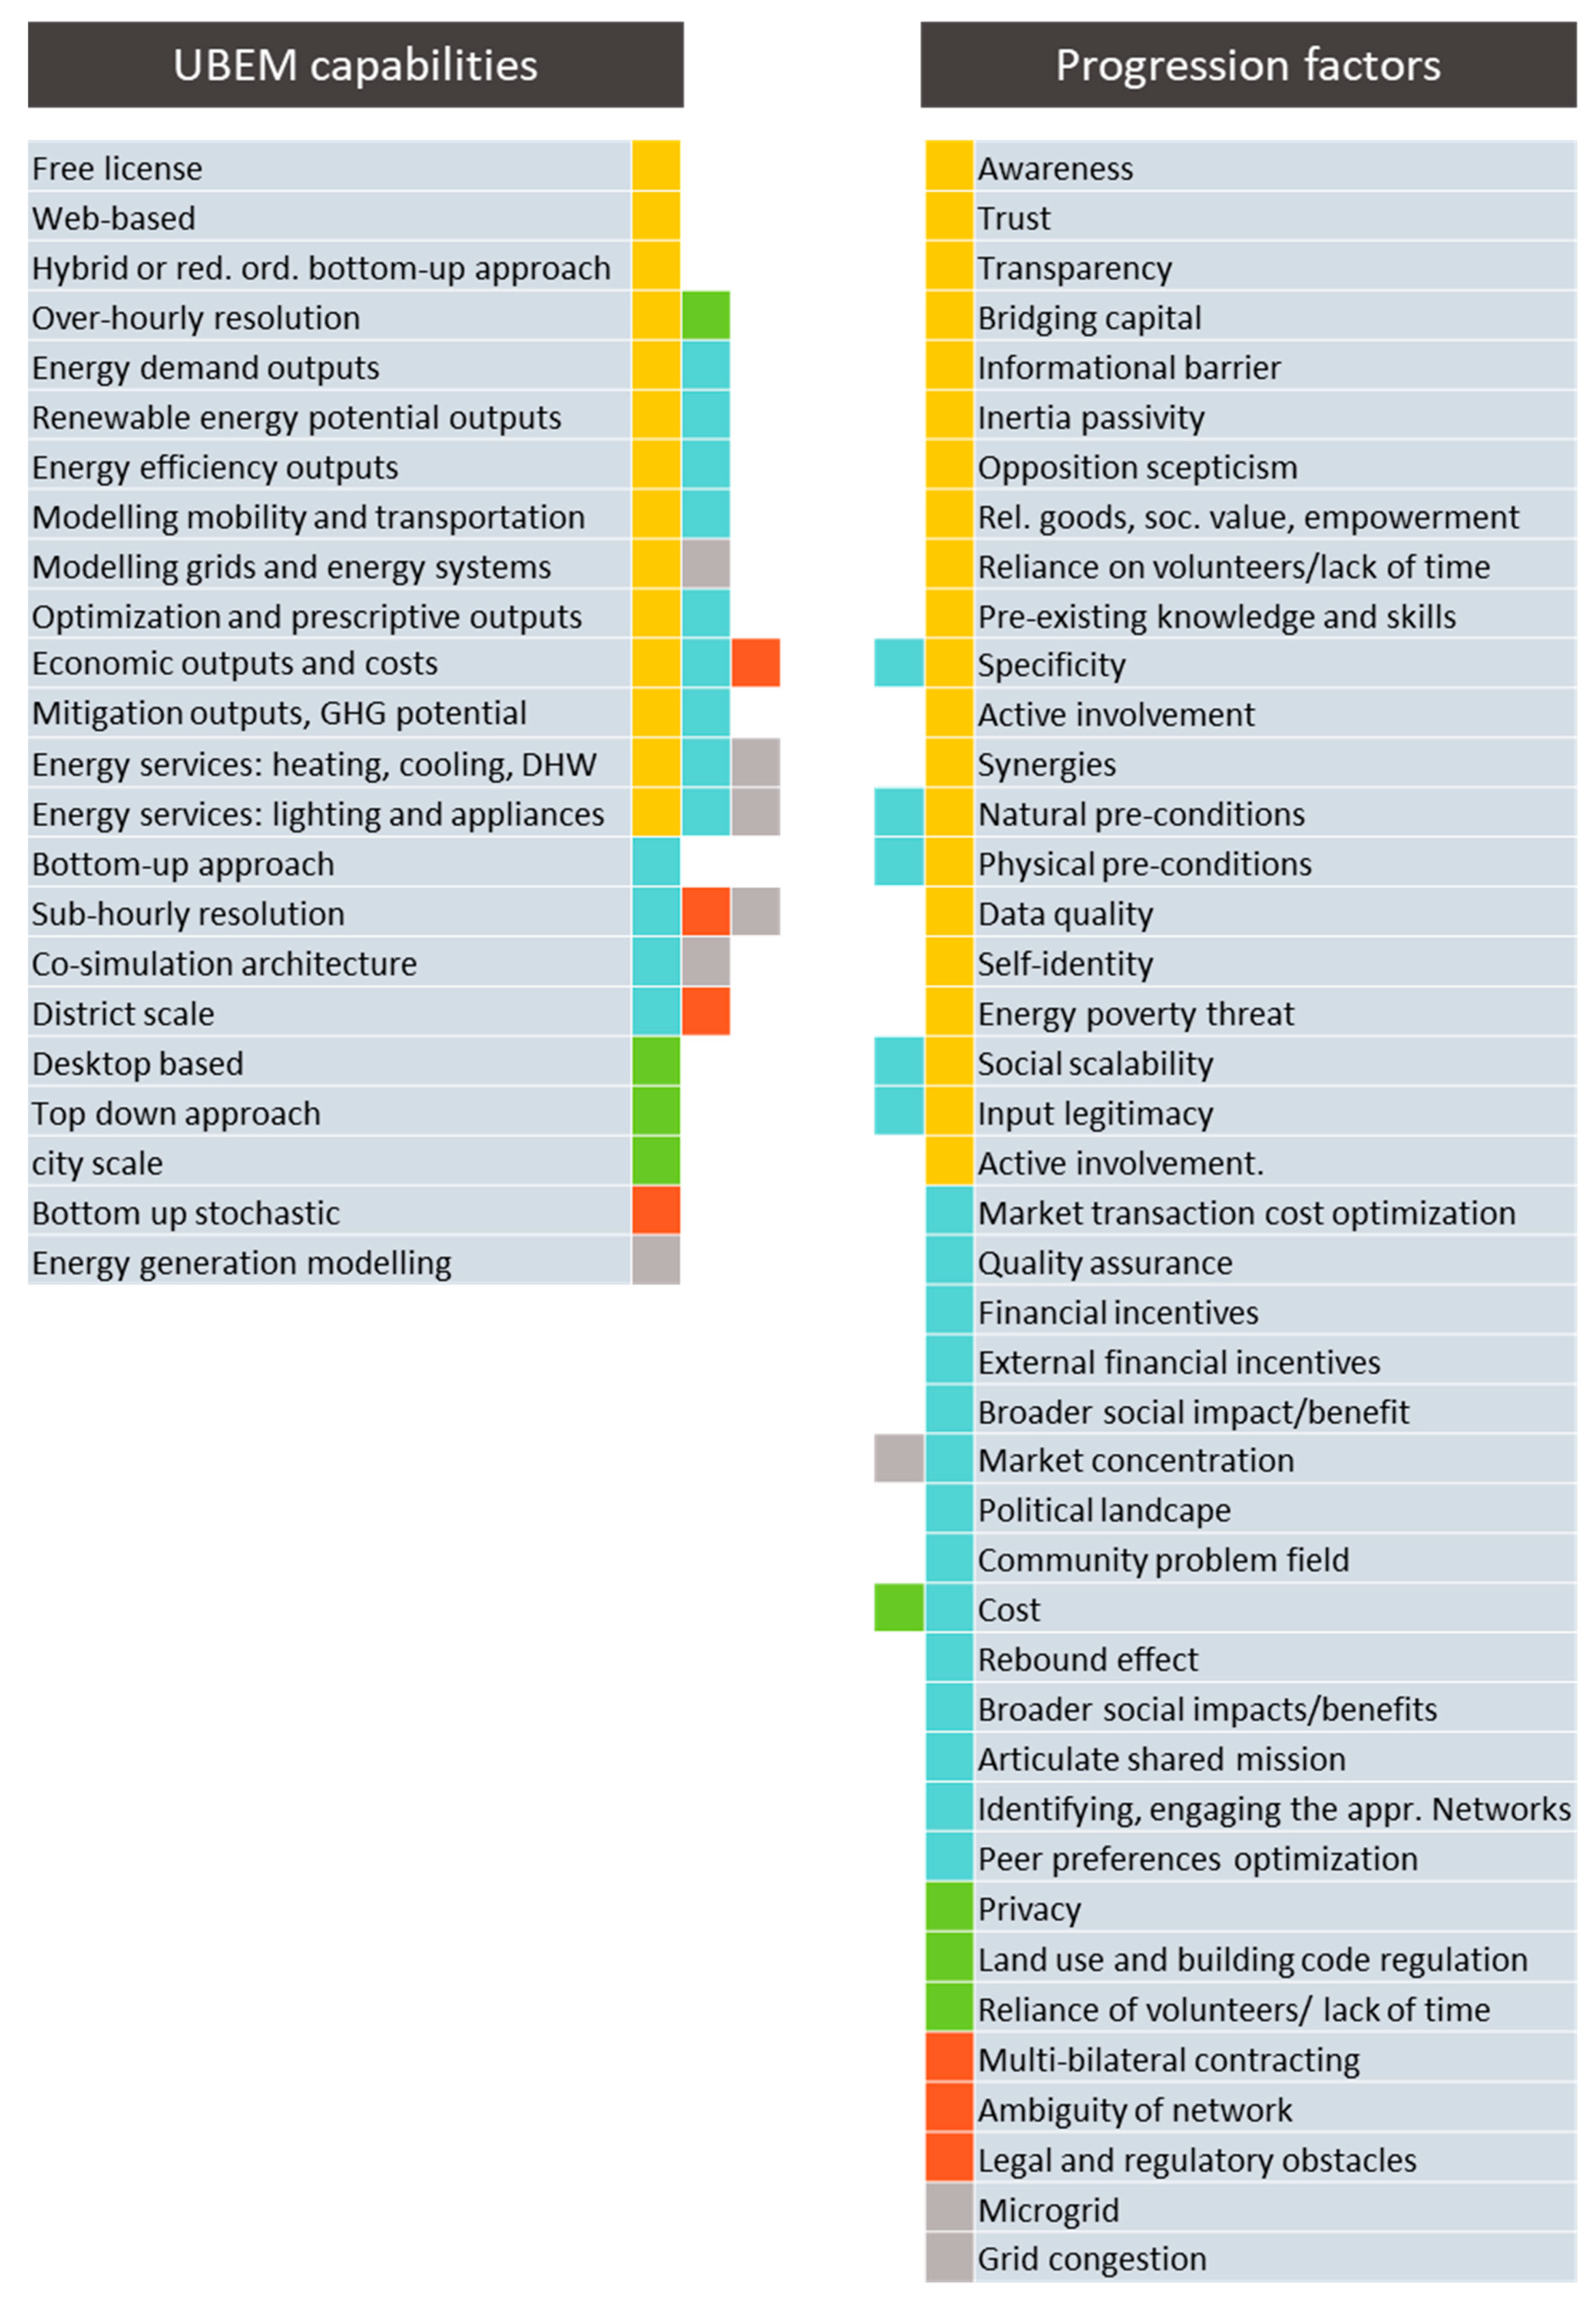
Table A1.
Energy community progression factors.
| Progression Factors | Use-Case | Lifecycle | Type | Classification | Reference |
|---|---|---|---|---|---|
| Access to wholesale markets | REC, P2PM | initiation | condition | economic | [2,3,58,89] |
| Active involvement | REC | operation, social scalability | enabler | social | [2,48,107] |
| Ambiguity in network operation | P2PM | operation | condition | technical | [12,53,54,60,108] |
| Articulate shared mission | General | initiation | condition | social | [89] |
| Awareness | General | All | enabler | social | [3,54,66] |
| Bridging capital | REC | initiation, social scalability | condition | social | [12,53] |
| Broader societal impact/benefit | REC | initiation, design, social scalability | enabler | social, economic | [6,12,50,54,55] |
| Community problem field | REC | initiation, design | condition | social, economic | [12,50] |
| Cost | General | initiation, design, operation | barrier/challenge | economic | [2,3,12,49,54,59,60,62,64,89,108] |
| Data quality | REC | design | barrier/challenge | technical | [59,62,89] |
| Embeddedness, robust, resilient network | General | initiation, design, social scalability | enabler | social | [3,53,55,58,59] |
| Energy poverty threat | P2PM | operation | barrier/challenge | social | [68] |
| External financial incentives/lack of funding | General | initiation, design | enabler, barrier | economic | [2,3,60,61,64,66,108] |
| Financial incentives | REC, ECC | initiation, design, technical scalability, social scalability | enabler | economic | [62] |
| Granularity | P2PM, DRC | initiation, social scalability | barrier/challenge | economic | [68] |
| Grid congestion | P2PM | operation | barrier/challenge | technical | [12,57,64] |
| Group identity | REC, ECC | initiation, social scalability | enabler | social | [2,54,59,61,93,96,109] |
| Identifying and engaging the appropriate network | REC, CES, P2PM | initiation, design, social scalability | barrier/challenge | social, economic | [2,50,58,108] |
| Inertia, passivity | General | initiation, design, social scalability | barrier/challenge | behavioural | [53,59,60,61,93] |
| Information barrier | General | initiation | barrier/challenge | social, economic | [12] |
| Input legitimacy | REC | All | barrier/challenge | social | [57] |
| Land-use and building code regulation | General | initiation | barrier/challenge | regulatory/governance | [3,54] |
| Legal and regulatory obstacles | General | initiation, design | barrier/challenge | regulatory/governance | [2,50,58,59,60,65,66,68,89,93,107] |
| Market concentration | General | initiation, design | condition | economic | [2,54,55,62,64,65] |
| Market transaction cost optimization | P2PM | operation | condition | technical | [68] |
| Microgrid | P2PM | initiation | condition | technical | [54,62,64,68] |
| multi bilateral trading | P2PM | operation | condition | technical | [3,68] |
| Multi-bilateral contracting | P2PM | initiation | condition | regulatory/governance | [89] |
| Natural preconditions | REC | initiation, design, technical scalability, social scalability | condition | environmental | [59] |
| Opposition, scepticism | General | initiation, design, social scalability | barrier/challenge | behavioural | [2,50,58,108] |
| Optimal size | REC | social scalability | barrier/challenge | social, economic | [2] |
| Peer effect | REC, ECC | social scalability | enabler | social | [57] |
| Peer preferences optimization | P2PM | operation | barrier/challenge | technical | [50,68] |
| Physical preconditions | REC | initiation, design, technical scalability, social scalability | condition | environmental | [59] |
| Place attachment | REC | All | enabler | social | [108] |
| Political landscape: inconsistency, engagement, support | REC, CES | initiation | barrier/challenge | regulatory/governance | [2,50,53,59,61] |
| Pre-existing knowledge and skills | REC, CES | All | barrier/challenge | technical, economic | [2,12,49,59,61,93] |
| Privacy | P2PM | operation | condition | technical | [68] |
| Procedural justice | REC, ECC | initiation, design, social scalability | enabler | regulatory/governance | [6,12,57,64] |
| Quality assurance | P2PM | operation | barrier/challenge | technical | [68] |
| Rebound effect | REC | All | barrier/challenge | social | [12] |
| Relational goods, social value, empowerment | REC, ECC | initiation | enabler | social | [53,57,64,108] |
| Reliance on volunteers/lack of time | REC | initiation, design | barrier/challenge | social | [2,12] |
| Scalability of negotiations | P2PM | technical scalability | barrier/challenge | technical | [68] |
| Self identity | REC, ECC | initiation | enabler | behavioural | [53,57,59,108] |
| Specificity | CES, REC, ECC | initiation, social scalability | barrier/challenge | economic | [54,61] |
| Synergies | REC | All | enabler | technical | [62,70] |
| Transparency of energy market | General | operation | condition | regulatory/governance | [55] |
| Trust | General | All | condition | social | [3,12,48,53] |
| Unfavourable taxation | DRC | initiation | barrier/challenge | economic | [48] |
Appendix B
Table A2.
Summary of UBEM and USEM tools.
| Tools/Features | Online vs. Offline | Approach | Int or Cosim | Time Step | Energy Service | Output Types | Urban Climatology Model | Energy Generation Modelling | Optimal Spatial Scale | Licence | Target Users |
|---|---|---|---|---|---|---|---|---|---|---|---|
| MIT UBEM [78] | Standalone desk based | Physics based dynamic | Integrated | Hourly | Heating, Cooling, Lighting | Building operational energy demand | Yes | None | City scale | Free | Urban planners, policy makers |
| City BES [116] | Web-based | Physics based dynamic | Integrated | Sub-hourly | Heating, Cooling, Electricity, Lighting, Domestic Hot Water | Operational energy use; retrofit strategies | Yes | None | City scale | Free | Urban planners, policy makers |
| UMI [122] | Standalone desk based | Physics based dynamic | Integrated | Hourly | Heating, Cooling, Lighting | Building operational and embodied energy use; walkability sore; daylighting | Yes | None | City scale City/District | Free | District energy managers |
| Tool by Columbia [123] | Standalone desk based | Physics based dynamic | Integrated | Hourly | Electricity, Space heating, DHW | Building operational energy demand | No | None | City scale | Research | District energy managers |
| Tool by Cambridge [124] | Standalone desk based | Physics based dynamic | Co-simulational | Yearly | Electricity, Gas | Building operational energy demand | No | None | District Scale | Research | District energy managers |
| UrbanOPT [107] | Web-based | Physics based dynamic | Integrated | Not sufficient inf. | Heating, Cooling, | Building operational energy demand, Strategies, District heating and cooling, and electricity network | Not sufficient inf. | PV, CHP, heat pumps, community energy storage | Building level | Research | District energy managers |
| COFFEE [108] | Web-based | Physics based dynamic | Integrated | Hourly | Heating, Lighting Appliances, Cooling, Ventilation | Building operational energy demand, Optimization, Strategies. | Not sufficient inf. | Not sufficient info | Utility scale | Not sufficient information | Utility program |
| CitySIM [120] | Standalone desk based | Physics based dynamic | Integrated | Hourly | Heating, Cooling, Ventilation, Appliances, Lighting | Operational energy use; r generation, transport choice, and other energy efficiency standards, District heating, Electricity Network, Optimization analysis, Mobility characterization | Yes | Storage, CHP, r thermal, PV, wind | District scale | Free | Urban planners, policy makers |
| SEMANCO [111] | Standalone desk based | Physics based dynamic | Co-simulational | Yearly | Heating, Cooling, Appliances, | Building operational energy demand, Economic model, Maintenance costs | Not sufficient inf. | Heat pumps, PV system, district heating | City scale | Research | Urban planners, policy makers |
| Simstadt [79] | Standalone desk based | Reduced order method | Integrated | Monthly | Heating, Cooling, Domestic Hot Water, Electricity | Thermal energy demand | Yes | None | City scale | Research | Urban planners, policy makers |
| LakeSIM [119] | Standalone desk based | Reduced order method | Integrated | Monthly | Heating, Cooling, Appliances, Lighting | Mobility characterization, Transport energy demand modelling, Electricity network modelling, Optimization analysis. | No | Yes | City scale | Research | Urban planners, policy makers |
| Tool by Georgia [115] | Standalone desk based | Reduced order method | Integrated | Hourly | Space heating, Cooling, | Building operational energy demand | Yes | None | City scale | Research | Urban planners, policy makers |
| OpenIDEAS [112] | Standalone desk based | Reduced order method | Co-simulational | Not sufficient info | Space heating, Cooling, DHW, Lighting, appliances | Electricity Network, Optimization analysis | No | Storage BIPV, heat pumps | District scale | Research | District energy managers |
| CEA [118] | Standalone desk based | Engineering & StatisticalReduced order method | Integrated | Hourly | Electricity, Space heating Space cooling Heating, Cooling, Lighting appliances, DHW, | Energy system simulation, Mobility characterization, Transport energy demand modelling, District heating, District cooling, Optimization | No | Storage, HP, CHP, PV, r thermal, Chiller | City/District District scale | FreeFree | Urban planners, policy makers |
| TEASER [125] | Standalone desk based | Reduced order method | Integrated | Hourly | Heating | Operational energy demand | No | None | City scale | Free | District energy managers |
| Tool by NYU [126] | Web-based | Data driven | Integrated | Annual | Gas, electricity | Building operational energy demand | No | None | City scale | Research | Urban planners, policy makers |
| UrbanFootprint [109] | Web-based | Data driven | Integrated | Not sufficient inf. | Not sufficient info | Emission, Land consumption, Conservation, Water use, Energy Use, Walk accessibility, Transit accessibility, Transportation, Costs, | No | None | City scale | Commercial | Urban planners, policy makers |
| CoBAM [110] | Standalone desk based | Data driven | Integrated | Annual | Heating, Cooling, Lighting, DHW | Building energy consumption, Emission | Yes | None | District | Not sufficient information | Policy makers |
| DistrictECA [127] | Standalone desk based | Bottom-up deterministic | Integrated | Monthly | Electricity, Space heating | Energy system simulation | Not sufficient inf. | Heating, cooling, Local and external storage CHP, Heat pumps | District | Free | Not sufficient information |
| HUES [117] | Standalone desk based | Simulation/Engineering | Co-simulational | Hourly | Electricity, Space heating, Space cooling, Heating, Electricity | Operational energy demand, District heating, Electricity network, Optimization analysis, Energy system optimisation | Yes | Storage, thermal | District/Building | Free | Not sufficient information |
| UMEM [113] | Standalone desk based | Engineering | Co-simulational | Hourly | Heating, Cooling, Ventilation, Appliances, Lighting | District heating, Electricity network, Optimization analysis | Yes | Storage, CHP, thermal, PV, wind | District | Research | Not sufficient information |
| MESCOS [114] | Standalone desk based | Engineering | Co-simulational | Hourly | Heating, Electricity | District heating, Electricity network, Optimization analysis | Yes | Electrical storage, PV | District | Research | Not sufficient information |
References
- Van Der Schoor, T.; Scholtens, B. The power of friends and neighbors: A review of community energy research. Curr. Opin. Environ. Sustain. 2019, 39, 71–80. [Google Scholar] [CrossRef]
- Brummer, V. Community energy—Benefits and barriers: A comparative literature review of Community ENERGY in the UK, Germany and the USA, the benefits it provides for society and the barriers it faces. Renew. Sustain. Energy Rev. 2018, 94, 187–196. [Google Scholar] [CrossRef]
- Moroni, S.; Alberti, V.; Antoniucci, V.; Bisello, A. Energy communities in the transition to a low-carbon future: A taxonomical approach and some policy dilemmas. J. Environ. Manag. 2019, 236, 45–53. [Google Scholar] [CrossRef] [PubMed]
- Ferri, N. United Nations general assembly. Int. J. Mar. Coast. Law 2010, 25, 271–287. [Google Scholar] [CrossRef]
- Oteman, M.; Wiering, M.; Helderman, J.K. The institutional space of community initiatives for renewable energy: A comparative case study of the Netherlands, Germany and Denmark. Energy. Sustain. Soc. 2014, 4, 1–17. [Google Scholar] [CrossRef] [Green Version]
- Creamer, E.; Taylor Aiken, G.; Van Veelen, B.; Walker, G.; Devine-Wright, P. Community renewable energy: What does it do? Walker and Devine-Wright (2008) ten years on. Energy Res. Soc. Sci. 2019, 57, 101223. [Google Scholar] [CrossRef]
- Alanne, K.; Saari, A. Distributed energy generation and sustainable development. Renew. Sustain. Energy Rev. 2006, 10, 539–558. [Google Scholar] [CrossRef]
- Tomain, J.P. The Democratization of Energy. Vand. J. Transnatl. Law 2015, 48, 1125–1145. [Google Scholar]
- Walker, G.; Devine-Wright, P. Community renewable energy: What should it mean? Energy Policy 2008, 36, 497–500. [Google Scholar] [CrossRef]
- Romero-Rubio, C.; De Andrés Díaz, J.R. Sustainable energy communities: A study contrasting Spain and Germany. Energy Policy 2015, 85, 397–409. [Google Scholar] [CrossRef]
- Hoppe, T.; Graf, A.; Warbroek, B.; Lammers, I.; Lepping, I. Local governments supporting local energy initiatives: Lessons from the best practices of Saerbeck (Germany) and Lochem (The Netherlands). Sustainability 2015, 7, 1900–1931. [Google Scholar] [CrossRef] [Green Version]
- Berka, A.L.; Creamer, E. Taking stock of the local impacts of community owned renewable energy: A review and research agenda. Renew. Sustain. Energy Rev. 2018, 82, 3400–3419. [Google Scholar] [CrossRef] [Green Version]
- Caramizaru, A.; Uihlein, A. Energy Communities: An Overview of Energy and Social Innovation; Publications Office of the European Union: Luxembourg, 2020.
- Lowitzsch, J.; Hoicka, C.E.; Van Tulder, F.J. Renewable energy communities under the 2019 European Clean Energy Package—Governance model for the energy clusters of the future? Renew. Sustain. Energy Rev. 2020, 122, 109489. [Google Scholar] [CrossRef]
- RES-Scoop. What Are ‘Citizen’ and ‘Renewable’ Energy Communities? Available online: https://uploads.strikinglycdn.com/files/b8d598e0-52c2-480c-b0bc-1953228c3bce/Q%26A%20Briefing%20-%20what%20are%20citizens%20energy%20communities%20%26%20renewable%20energy%20communities%20in%20the%20CEP%20-%20final.pdf (accessed on 15 February 2020).
- Fink, S.; Porter, K.; Rogers, J. The Relevance of Generation Interconnection Procedures to Feed-in Tariffs in the United States; National Renewable Energy Laboratory: Golden, CO, USA, 2010.
- Chernyakhovskiy, I.; Tian, T.; Mclaren, J.; Miller, M.; Geller, N.; Chernyakhovskiy, I.; Tian, T.; Mclaren, J.; Miller, M.; Geller, N. U.S. Laws and Regulations for Renewable Energy Grid Interconnections; National Renewable Energy Laboratory: Golden, CO, USA, 2016; pp. 1–29.
- Klein, S.J.W.; Coffey, S. Building a sustainable energy future, one community at a time. Renew. Sustain. Energy Rev. 2016, 60, 867–880. [Google Scholar] [CrossRef] [Green Version]
- Feldman, D.; Brockway, A.M.; Ulrich, E.; Margolis, R. Shared Solar: Current Landscape, Market Potential, and the Impact of Federal Securities Regulation; National Renewable Energy Laboratory: Golden, CO, USA, 2015; p. 70.
- Thomas, D.; Miller, C.; Kämpf, J.; Schlueter, A. Multiscale Co-simulation of EnergyPlus and CitySim models derived from a Building Information Model. In Bausim 2014: Fifth German-Austrian IBPSA Conference; RWTH Aachen University: Aachen, Germany, 2014; pp. 469–476. [Google Scholar]
- Keirstead, J.; Jennings, M.; Sivakumar, A. A review of urban energy system models: Approaches, challenges and opportunities. Renew. Sustain. Energy Rev. 2012, 16, 3847–3866. [Google Scholar] [CrossRef] [Green Version]
- Sola, A.; Corchero, C.; Salom, J.; Sanmarti, M. Multi-domain urban-scale energy modelling tools: A review. Sustain. Cities Soc. 2019, 54, 101872. [Google Scholar] [CrossRef]
- Allegrini, J.; Orehounig, K.; Mavromatidis, G.; Ruesch, F.; Dorer, V.; Evins, R. A review of modelling approaches and tools for the simulation of district-scale energy systems. Renew. Sustain. Energy Rev. 2015, 52, 1391–1404. [Google Scholar] [CrossRef]
- Reinhart, C.F.; Cerezo Davila, C. Urban building energy modeling—A review of a nascent field. Build. Environ. 2016, 97. [Google Scholar] [CrossRef] [Green Version]
- Goy, S.; Finn, D. Estimating demand response potential in building clusters. Energy Procedia 2015, 78, 3391–3396. [Google Scholar] [CrossRef] [Green Version]
- Manfren, M.; Caputo, P.; Costa, G. Paradigm shift in urban energy systems through distributed generation: Methods and models. Appl. Energy 2011, 88, 1032–1048. [Google Scholar] [CrossRef]
- Monti, A. Energy Positive Neighborhoods and Smart Energy Districts Methods, Tools, and Experiences from the Field; Academic Press: Cambridge, MA, USA, 2016; ISBN 9780128099513. [Google Scholar]
- Perez-Lombard, L.; Ortiz, J.; González, R.; Maestre, I.R. A review of benchmarking, rating and labelling concepts within the framework of building energy certification schemes. Energy Build. 2009, 41, 272–278. [Google Scholar] [CrossRef]
- Kanagaretnam, K.; Mestelman, S.; Nainar, S.M.K.; Shehata, M. Transparency and empowerment in an investment environment. J. Bus. Res. 2014, 67, 2030–2038. [Google Scholar] [CrossRef]
- Tardioli, G.; Kerrigan, R.; Oates, M.; O’Donnell, J.; Finn, D.P. Identification of representative buildings and building groups in urban datasets using a novel pre-processing, classification, clustering and predictive modelling approach. Build. Environ. 2018, 140, 90–106. [Google Scholar] [CrossRef]
- Ratti, C.; Baker, N.; Steemers, K. Energy consumption and urban texture. Energy Build. 2005, 37, 762–776. [Google Scholar] [CrossRef]
- Amaral, A.R.; Rodrigues, E.; Rodrigues Gaspar, A.; Gomes, Á. Review on performance aspects of nearly zero-energy districts. Sustain. Cities Soc. 2018, 43, 406–420. [Google Scholar] [CrossRef]
- Roby, H.; Dibb, S. Future pathways to mainstreaming community energy. Energy Policy 2019, 135, 111020. [Google Scholar] [CrossRef]
- Nolden, C.; Barnes, J.; Nicholls, J. Community energy business model evolution: A review of solar photovoltaic developments in England. Renew. Sustain. Energy Rev. 2020, 122, 109722. [Google Scholar] [CrossRef]
- Ceglia, F.; Esposito, P.; Marrasso, E.; Sasso, M. From smart energy community to smart energy municipalities: Literature review, agendas and pathways. J. Clean. Prod. 2020, 254, 120118. [Google Scholar] [CrossRef]
- Lehtonen, M.; De Carlo, L. Community energy and the virtues of mistrust and distrust: Lessons from Brighton and Hove energy cooperatives. Ecol. Econ. 2019, 164, 106367. [Google Scholar] [CrossRef]
- Van der Waal, E.C. Local impact of community renewable energy: A case study of an Orcadian community-led wind scheme. Energy Policy 2019, 138, 111193. [Google Scholar] [CrossRef]
- Pellicer-Sifres, V.; Belda-Miquel, S.; Cuesta-Fernandez, I.; Boni, A. Learning, transformative action, and grassroots innovation: Insights from the Spanish energy cooperative Som Energia. Energy Res. Soc. Sci. 2018, 42, 100–111. [Google Scholar] [CrossRef]
- Von Wirth, T.; Gislason, L.; Seidl, R. Distributed energy systems on a neighborhood scale: Reviewing drivers of and barriers to social acceptance. Renew. Sustain. Energy Rev. 2018, 82, 2618–2628. [Google Scholar] [CrossRef]
- Hess, D.J.; Lee, D. Energy decentralization in California and New York: Conflicts in the politics of shared solar and community choice. Renew. Sustain. Energy Rev. 2020, 121, 109716. [Google Scholar] [CrossRef]
- Joshi, G.; Yenneti, K. Community solar energy initiatives in India: A pathway for addressing energy poverty and sustainability? Energy Build. 2020, 210, 109736. [Google Scholar] [CrossRef]
- Bauwens, T. Analyzing the determinants of the size of investments by community renewable energy members: Findings and policy implications from Flanders. Energy Policy 2019, 129, 841–852. [Google Scholar] [CrossRef]
- Heldeweg, M.A.; Saintier, S. Renewable energy communities as ‘socio-legal institutions’: A normative frame for energy decentralization? Renew. Sustain. Energy Rev. 2020, 119, 109518. [Google Scholar] [CrossRef]
- Petersen, J.P. The application of municipal renewable energy policies at community level in Denmark: A taxonomy of implementation challenges. Sustain. Cities Soc. 2018, 38, 205–218. [Google Scholar] [CrossRef] [Green Version]
- Gorroño-Albizu, L.; Sperling, K.; Djørup, S. The past, present and uncertain future of community energy in Denmark: Critically reviewing and conceptualising citizen ownership. Energy Res. Soc. Sci. 2019, 57, 101231. [Google Scholar] [CrossRef]
- Parra, D.; Swierczynski, M.; Stroe, D.I.; Norman, S.A.; Abdon, A.; Worlitschek, J.; O’Doherty, T.; Rodrigues, L.; Gillott, M.; Zhang, X.; et al. An interdisciplinary review of energy storage for communities: Challenges and perspectives. Renew. Sustain. Energy Rev. 2017, 79, 730–749. [Google Scholar] [CrossRef]
- Freitas Gomes, I.S.; Perez, Y.; Suomalainen, E. Coupling small batteries and PV generation: A review. Renew. Sustain. Energy Rev. 2020, 126, 109835. [Google Scholar] [CrossRef]
- Van Summeren, L.F.M.; Wieczorek, A.J.; Bombaerts, G.J.T.; Verbong, G.P.J. Community energy meets smart grids: Reviewing goals, structure, and roles in Virtual Power Plants in Ireland, Belgium and the Netherlands. Energy Res. Soc. Sci. 2020, 63, 101415. [Google Scholar] [CrossRef]
- Warneryd, M.; Håkansson, M.; Karltorp, K. Unpacking the complexity of community microgrids: A review of institutions’ roles for development of microgrids. Renew. Sustain. Energy Rev. 2020, 121, 109690. [Google Scholar] [CrossRef]
- Hirsch, A.; Parag, Y.; Guerrero, J. Microgrids: A review of technologies, key drivers, and outstanding issues. Renew. Sustain. Energy Rev. 2018, 90, 402–411. [Google Scholar] [CrossRef]
- Biresselioglu, M.E.; Nilsen, M.; Demir, M.H.; Røyrvik, J.; Koksvik, G. Examining the barriers and motivators affecting European decision-makers in the development of smart and green energy technologies. J. Clean. Prod. 2018, 198, 417–429. [Google Scholar] [CrossRef]
- Van Cutsem, O.; Ho Dac, D.; Boudou, P.; Kayal, M. Cooperative energy management of a community of smart-buildings: A Blockchain approach. Int. J. Electr. Power Energy Syst. 2020, 117, 105643. [Google Scholar] [CrossRef]
- Sousa, T.; Soares, T.; Pinson, P.; Moret, F.; Baroche, T.; Sorin, E. Peer-to-peer and community-based markets: A comprehensive review. Renew. Sustain. Energy Rev. 2019, 104, 367–378. [Google Scholar] [CrossRef] [Green Version]
- Butturi, M.A.; Lolli, F.; Sellitto, M.A.; Balugani, E.; Gamberini, R.; Rimini, B. Renewable energy in eco-industrial parks and urban-industrial symbiosis: A literature review and a conceptual synthesis. Appl. Energy 2019, 255, 113825. [Google Scholar] [CrossRef]
- Saheb, Y.; Shnapp, S.; Johnson, C. The Zero Energy concept: Making the whole greater than the sum of the parts to meet the Paris Climate Agreement’s objectives. Curr. Opin. Environ. Sustain. 2018, 30, 138–150. [Google Scholar] [CrossRef]
- Tam, V.W.Y.; Karimipour, H.; Le, K.N.; Wang, J. Green neighbourhood: Review on the international assessment systems. Renew. Sustain. Energy Rev. 2018, 82, 689–699. [Google Scholar] [CrossRef]
- Swan, L.G.; Ugursal, V.I. Modeling of end-use energy consumption in the residential sector: A review of modeling techniques. Renew. Sustain. Energy Rev. 2009, 13, 1819–1835. [Google Scholar] [CrossRef]
- Johnston, D. A Physically-Based Energy and Carbon Dioxide Emissions Model of the UK Housing Stock. Ph.D. Thesis, Leeds Metropolitan University, Leeds, UK, 2003; p. 280. [Google Scholar]
- Kavgic, M.; Mavrogianni, A.; Mumovic, D.; Summerfield, A.; Stevanovic, Z.; Djurovic-Petrovic, M. A review of bottom-up building stock models for energy consumption in the residential sector. Build. Environ. 2010, 45, 1683–1697. [Google Scholar] [CrossRef]
- Li, W.; Zhou, Y.; Cetin, K.; Eom, J.; Wang, Y.; Chen, G. Modeling urban building energy use: A review of modeling approaches and procedures. Energy 2017, 141, 2445–2457. [Google Scholar] [CrossRef]
- Abbasabadi, N.; Ashayeri, J.K.M. Urban energy use modeling methods and tools: A review and an outlook. Build. Environ. 2019, 161, 106270. [Google Scholar] [CrossRef]
- Ferrari, S.; Zagarella, F.; Caputo, P.; Bonomolo, M. Assessment of tools for urban energy planning. Energy 2019, 176, 544–551. [Google Scholar] [CrossRef]
- Hegger, D.L.T.; Van Vliet, J.; Van Vliet, B.J.M. Niche management and its contribution to regime change: The case of innovation in sanitation. Technol. Anal. Strateg. Manag. 2007, 19, 729–746. [Google Scholar] [CrossRef]
- Geels, F.W. Analysing the breakthrough of rock “n” roll (1930–1970) Multi-regime interaction and reconfiguration in the multi-level perspective. Technol. Forecast. Soc. Change 2007, 74, 1411–1431. [Google Scholar] [CrossRef]
- Geels, F.W. Technology Analysis & Strategic Management The dynamics of transitions in socio-technical systems: A multi-level analysis of the transition pathway from horse-drawn carriages to The Dynamics of Transitions in Socio-technical Systems: A Multi-level Analy. Technol. Anal. Strateg. Manag. 2005, 17, 445–476. [Google Scholar]
- Hodson, M.; Marvin, S. Can cities shape socio-technical transitions and how would we know if they were? Res. Policy 2010, 39, 477–485. [Google Scholar] [CrossRef]
- Schot, J.; Geels, F.W. Strategic niche management and sustainable innovation journeys: Theory, findings, research agenda, and policy. Technol. Anal. Strateg. Manag. 2008, 20, 537–554. [Google Scholar] [CrossRef]
- Gibson, J.J. The Theory of Affordances. In Perceiving, Acting, Knowing. Toward an Ecological Psychology; Lawrence Erlbaum Associates: Mahwah, NJ, USA, 1977; pp. 67–82. [Google Scholar]
- Norman, D.A. Affordance, conventions, and design. Interactions 1999, 6, 38–43. [Google Scholar] [CrossRef]
- Markus, M.L.; Silver, M. A Foundation for the Study of IT Effects: A New Look at DeSanctis and Poole’s Concepts of Structural Features and Spirit. J. Assoc. Inf. Syst. 2008, 9, 609–632. [Google Scholar] [CrossRef]
- Sadler, E.; Given, L.M. Affordance theory: A framework for graduate students’ information behavior. J. Doc. 2007, 63, 115–141. [Google Scholar] [CrossRef]
- Carlo, J.L.; Lyytinen, K.; Boland, R.J. Dialectics of collective minding: Contradictory appropriations of information technology in a high-risk project. MIS Q. Manag. Inf. Syst. 2012, 36. [Google Scholar] [CrossRef] [Green Version]
- Chatterjee, S.; Moody, G.; Lowry, P.B.; Chakraborty, S.; Hardin, A. Information Technology and organizational innovation: Harmonious information technology affordance and courage-based actualization. J. Strateg. Inf. Syst. 2020, 101596. [Google Scholar] [CrossRef]
- Durugbo, C.M. Affordance-based problem structuring for workplace innovation. Eur. J. Oper. Res. 2020. [Google Scholar] [CrossRef]
- Volkoff, O.; Strong, D.M. Critical Realism and Affordances: Theorizing It-Associated Organizational Change Processes. MIS Q. 2013, 37, 819–834. [Google Scholar] [CrossRef]
- Sokal, R.R. A Statistical Method for Evaluating Systematic Relationships; University of Kansas: Lawrence, KS, USA, 1958; Volume 38, ISBN 0001948000237. [Google Scholar]
- Hong, T.; Chen, Y.; Luo, X.; Luo, N.; Lee, S.H. Ten questions on urban building energy modeling. Build. Environ. 2020, 168, 106508. [Google Scholar] [CrossRef] [Green Version]
- Davila, C.C.; Reinhart, C.F.; Bemis, J.L. Modeling Boston: A work flow for the efficient generation and maintenance of urban building energy models from existing geospatial datasets. Energy 2016, 117, 237–250. [Google Scholar] [CrossRef]
- Nouvel, R.; Duminil, E.; Coors, V.; Eicker, U. Simstadt, A New Workflow-Driven Urban Energy Simulation Platform for Citygml City Models; CISBAT: Lausanne, Switzerland, 2015. [Google Scholar]
- Chatterjee, S.; Moody, G.; Lowry, P.B.; Chakraborty, S.; Hardin, A. Strategic Relevance of Organizational Virtues Enabled by Information Technology in Organizational Innovation. J. Manag. Inf. Syst. 2015, 32, 158–196. [Google Scholar] [CrossRef]
- Zammuto, R.F.; Griffith, T.L.; Majchrzak, A.; Dougherty, D.J.; Faraj, S. Information Technology and the Changing Fabric of Organization. Organ. Sci. 2007, 18, 749–762. [Google Scholar] [CrossRef]
- Gal, U.; Jensen, T.B.; Lyytinen, K. Identity orientation, social exchange, and information technology use in interorganizational collaborations. Organ. Sci. 2014, 25, 1372–1390. [Google Scholar] [CrossRef]
- Martín-Martín, A.; Orduña-Malea, E.; Thelwall, M.; Delgado-López-Cózar, E.; Orduna-Malea, E.; Thelwall, M.; Delgado-López-Cózar, E.; Delgado López-Cózar, E. Scopus: A systematic comparison of citations in 252 subject categories. J. Informetr. 2018, 12, 1160–1177. [Google Scholar] [CrossRef] [Green Version]
- Marshall, S.; Craven, D.; Kelly, J.; Isenring, E. A systematic review and meta-analysis of the criterion validity of nutrition assessment tools for diagnosing protein-energy malnutrition in the older community setting (the MACRo study). Clin. Nutr. 2018, 37, 1902–1912. [Google Scholar] [CrossRef] [PubMed] [Green Version]
- Francisco, A.; Taylor, J.E. Designing community-scale energy feedback. Energy Procedia 2019, 158, 4178–4183. [Google Scholar] [CrossRef]
- Tran, V.T.; Porcher, R.; Tran, V.C.; Ravaud, P. Predicting data saturation in qualitative surveys with mathematical models from ecological research. J. Clin. Epidemiol. 2017, 82, 71–78.e2. [Google Scholar] [CrossRef]
- Karunathilake, H.; Hewage, K.; Prabatha, T.; Ruparathna, R.; Sadiq, R. Project deployment strategies for community renewable energy: A dynamic multi-period planning approach. Renew. Energy 2020, 152, 237–258. [Google Scholar] [CrossRef]
- Renaissance-h2020.eu. Available online: https://www.renaissance-h2020.eu/ (accessed on 15 February 2020).
- Kim, M.H.; Kim, D.; Heo, J.; Lee, D.W. Energy performance investigation of net plus energy town: Energy balance of the Jincheon Eco-Friendly energy town. Renew. Energy 2020, 147, 1784–1800. [Google Scholar] [CrossRef]
- Hansen, P.; Morrison, G.M.; Zaman, A.; Liu, X. Smart technology needs smarter management: Disentangling the dynamics of digitalism in the governance of shared solar energy in Australia. Energy Res. Soc. Sci. 2020, 60, 101322. [Google Scholar] [CrossRef]
- Hasanov, M.; Zuidema, C. The transformative power of self-organization: Towards a conceptual framework for understanding local energy initiatives in The Netherlands. Energy Res. Soc. Sci. 2018, 37, 85–93. [Google Scholar] [CrossRef]
- Ruggiero, S.; Martiskainen, M.; Onkila, T. Understanding the scaling-up of community energy niches through strategic niche management theory: Insights from Finland. J. Clean. Prod. 2018, 170, 581–590. [Google Scholar] [CrossRef]
- Capellán-Pérez, I.; Campos-Celador, Á.; Terés-Zubiaga, J. Renewable Energy Cooperatives as an instrument towards the energy transition in Spain. Energy Policy 2018, 123, 215–229. [Google Scholar] [CrossRef]
- Freitas, S.; Reinhart, C.; Brito, M.C. Minimizing storage needs for large scale photovoltaics in the urban environment. Sol. Energy 2018, 159, 375–389. [Google Scholar] [CrossRef]
- Mundaca, L.; Busch, H.; Schwer, S. ‘Successful’ low-carbon energy transitions at the community level? An energy justice perspective. Appl. Energy 2018, 218, 292–303. [Google Scholar] [CrossRef]
- Heaslip, E.; Fahy, F. Developing transdisciplinary approaches to community energy transitions: An island case study. Energy Res. Soc. Sci. 2018, 45, 153–163. [Google Scholar] [CrossRef]
- Rafique, M.M.; Rehman, S.; Alhems, L.M. Developing zero energy and sustainable villages—A case study for communities of the future. Renew. Energy 2018, 127, 565–574. [Google Scholar] [CrossRef]
- Hayes, B.P.; Thakur, S.; Breslin, J.G. Co-simulation of electricity distribution networks and peer to peer energy trading platforms. Int. J. Electr. Power Energy Syst. 2020, 115, 105419. [Google Scholar] [CrossRef]
- Lezama, F.; Soares, J.; Canizes, B.; Vale, Z. Flexibility management model of home appliances to support DSO requests in smart grids. Sustain. Cities Soc. 2020, 55, 102048. [Google Scholar] [CrossRef]
- Mahzouni, A. The role of institutional entrepreneurship in emerging energy communities: The town of St. Peter in Germany. Renew. Sustain. Energy Rev. 2019, 107, 297–308. [Google Scholar] [CrossRef]
- Mah, D.N. yin Community solar energy initiatives in urban energy transitions: A comparative study of Foshan, China and Seoul, South Korea. Energy Res. Soc. Sci. 2019, 50, 129–142. [Google Scholar] [CrossRef]
- Buth, M.A.; Wieczorek, A.A.; Verbong, G.G. The promise of peer-to-peer trading? The potential impact of blockchain on the actor configuration in the Dutch electricity system. Energy Res. Soc. Sci. 2019, 53, 194–205. [Google Scholar] [CrossRef]
- Commission, E.-E. National energy and climate plans (NECPs)-Energy European Commission. Available online: https://ec.europa.eu/energy/topics/energy-strategy/national-energy-climate-plans_en (accessed on 8 February 2020).
- Heras-Saizarbitoria, I.; Sáez, L.; Allur, E.; Morandeira, J. The emergence of renewable energy cooperatives in Spain: A review. Renew. Sustain. Energy Rev. 2018, 94, 1036–1043. [Google Scholar] [CrossRef]
- Koch, J.; Christ, O. Household participation in an urban photovoltaic project in Switzerland: Exploration of triggers and barriers. Sustain. Cities Soc. 2018, 37, 420–426. [Google Scholar] [CrossRef]
- Ilieva, I.; Bremdal, B.; Ottesen, S.; Rajasekharan, J.; Olivella-Rosell, P. Design Characteristics of a Smart Grid Dominated Local Market; CIRED Workshop: Helsinki, Finland, 2016. [Google Scholar]
- Polly, B.; Kutscher, C.; Macumber, D.; Schott, M.; Pless, S.; Livingood, B.; Geet, O. From Zero Energy Buildings to Zero Energy Districts; Publications Office of the European Union: Luxembourg, 2016.
- Brackney, L.J. NREL Portfolio-Scale Optimization of Customer Energy Efficiency Incentive and Marketing Cooperative Research and Development Final Report; National Renewable Energy Laboratory: Golden, CO, USA, 2016.
- UrbanFootprint. The Ultimate Technical Guide: Guide to UrbanFootprint; Calthorpe Analytics: Berkley, CA, USA, 2017; p. 62. [Google Scholar]
- Lee, S.H.; Berkeley, L.; Zhao, F.; Augenbroe, G. The use of normative energy calculation beyond building performance rating. J. Build. Perform. Simul. 2013, 6, 282–290. [Google Scholar] [CrossRef]
- FUNITEC. SEMANCO: Prototype of the Integrated Platform; FUNITEC: Barcelona, Spain, 2013. [Google Scholar]
- Baetens, R.; De Coninck, R.; Van Roy, J.; Verbruggen, B.; Driesen, J.; Helsen, L.; Saelens, D. Assessing electrical bottlenecks at feeder level for residential net zero-energy buildings by integrated system simulation. Appl. Energy 2020, 96, 74–83. [Google Scholar] [CrossRef]
- CCEM. Urban Multiscale Energy Modelling. Sustainable Cities and Urban Energy Systems of the Future. In Heat & Buildings; CCEM: Zurich, Switzerland, 2014; pp. 66–68. [Google Scholar]
- Molitor, C.; Member, G.S.; Groß, S.; Zeitz, J.; Member, S.; Monti, A.; Member, S. MESCOS—A Multienergy System Cosimulator for City District Energy Systems. IEEE Trans. Ind. 2014, 10, 2247–2256. [Google Scholar] [CrossRef] [Green Version]
- Li, Q.; Quan, S.J.; Augenbroe, G.; Yang, P.P.; Brown, J. Building energy modelling at urban scale: Integration of reduced order energy model with geographical information. In Proceedings of the 14th Conference of International Building Performance Simulation Association, Hyderabad, India, 7–9 December 2015; pp. 190–199. [Google Scholar]
- Hong, T.; Chen, Y.; Lee, S.H.; Piette, M.P.; Chen, Y.; Piette, M.P. CityBES: A web-based platform to support city-scale building energy efficiency. Urban Comput. Work. San Fr. 2016. [Google Scholar] [CrossRef]
- Bollinger, L.A.; Evins, R. Hues: A Holistic Urban Energy Simulation Platform for Effective Model Integration; CISBAT: Lausanne, Switzerland, 2015; pp. 841–846. [Google Scholar]
- Fonseca, J.A.; Nguyen, T.A.; Schlueter, A.; Marechal, F. City Energy Analyst (CEA): Integrated framework for analysis and optimization of building energy systems in neighborhoods and city districts. Energy Build. 2016, 113, 202–226. [Google Scholar] [CrossRef]
- Bergerson, J.; Muehleisen, R.T.; Rodda, B.O.; Auld, J.A.; Guzowski, L.B.; Ozik, J.; Collier, N. Designing Future Cities: LakeSIM Integrated Design Tool for Assessing Short- And Long-Term Impacts of Urban Scale Conceptual Designs. ISOCARP Rev. 2015, 11, 48–63. [Google Scholar]
- Robinson, D.; Haldi, F.; Kämpf, J.; Leroux, P.; Perez, D.; Rasheed, A.; Wilke, U. CITYSIM: Comprehensive Micro-Simulation of Resource Flows for Sustainable Urban Planning Citysim: Comprehensive Micro-Simulation of Resource Flows for Sustainable Urban Planning Solar Energy and Building Physics Laboratory (LESO-PB). In Proceedings of the Eleventh International IBPSA Conference, Glasgow, Scotland, 27–30 July 2009. [Google Scholar]
- Schiefelbein, J.; Rudnick, J.; Scholl, A.; Remmen, P.; Fuchs, M.; Müller, D. Automated urban energy system modeling and thermal building simulation based on OpenStreetMap data sets. Build. Environ. 2019, 149, 630–639. [Google Scholar] [CrossRef]
- Reinhart, C.F.; Dogan, T.; Jakubiec, J.A.; Rakha, T.; Sang, A. Umi-an Urban Simulation Environment for Building Energy Use, Daylighting and Walkability. In Proceedings of the BS2013: 13th Conference of International Building Performance Simulation Association, Chambéry, France, 26–28 August 2013. [Google Scholar]
- Waite, M.; Modi, V. Calibrated Building Energy Models for Community-Scale Sustainability Analyses; ASME: Boston, MA, USA, 2014. [Google Scholar]
- Tian, W.; Rysanek, A.; Choudhary, R.; Heo, Y. High Resolution Energy Simulations at City Scale. In Proceedings of the 14th Conference of International Building Performance Simulation Association, Hyderabad, India, 7–9 December 2015. [Google Scholar]
- Remmen, P.; Lauster, M.; Mans, M.; Fuchs, M.; Müller, D.; Remmen, P.; Lauster, M.; Mans, M.; Fuchs, M. TEASER: An open tool for urban energy modelling of building stocks. J. Build. Perform. Simul. 2018, 11, 84–98. [Google Scholar] [CrossRef]
- Kontokosta, C.; Marulli, D.; Tull, C.; Pingerra, R. Web-Based Visualization and Prediction of Urban Energy Use from Building Web-Based Visualization and Prediction of Urban Energy Use from Building Benchmarking Data; Bloomberg Data for Good Exchange: New York, NY, USA, 2015. [Google Scholar]
- Erhorn-kluttig, H.; Erhorn, H.; Weber, J.; Wössner, S.; Budde, E. The District Energy Concept Adviser: A software tool to support urban decision makers in planning district energy supply schemes. In Proceedings of the Sustainable Building Conference sb13 Munich, Munich, Germany, 10–12 April 2013; pp. 721–727. [Google Scholar]
Figure 1.
Positioning research subject in the multi-level perspective—adapted figure of Geels [64].
Figure 1.
Positioning research subject in the multi-level perspective—adapted figure of Geels [64].

Figure 2.
Positioning of research subject in niche development—adapted figure of Geels [65].
Figure 2.
Positioning of research subject in niche development—adapted figure of Geels [65].

Figure 3.
Overview of research process.

Figure 4.
Components defining technological affordances.

Figure 5.
Selection process of references disaggregated to data sources.

Figure 6.
Log of data saturation: (a) Number of accumulated progression factors plotted against number of energy community (EC) reviews on the left; (b) number of accumulated UBEM tools plotted against number of UBEM reviews on the right.
Figure 6.
Log of data saturation: (a) Number of accumulated progression factors plotted against number of energy community (EC) reviews on the left; (b) number of accumulated UBEM tools plotted against number of UBEM reviews on the right.

Figure 7.
Energy conservation investment community use-case. Dashed line denotes the community.

Figure 8.
Peer-to-peer energy market use-case. Dashed line denotes the community.

Figure 9.
Renewable energy community use-case. Dashed line denotes the community.

Figure 10.
Demand-response community use-case. Dashed line denotes the community.

Figure 11.
Community energy storage use-case. Dashed line denotes the community.

Figure 12.
Hybrid renewable-demand response community use-case. Dashed line denotes the community.

Figure 13.
Overview of the generalized energy community project lifecycle.

Figure 14.
Progression factor distribution by discipline.

Figure 15.
Progression factor distribution by role.

Figure 16.
Progression factor distribution by use-case.

Figure 17.
Progression factor distribution by lifecycle phase.

Figure 18.
Agglomerative hierarchical clustering of progression factors by discipline, role, use-case, lifecycle phase.
Figure 18.
Agglomerative hierarchical clustering of progression factors by discipline, role, use-case, lifecycle phase.

Figure 19.
Pairwise correlation of metadata. Colder colour indicates a category consistently appearing together for progression factors.
Figure 19.
Pairwise correlation of metadata. Colder colour indicates a category consistently appearing together for progression factors.

Figure 20.
Agglomerative hierarchical clustering of UBEM tools by capabilities.

Figure 21.
Pairwise correlation of UBEM capabilities. Colder colour indicates a capability consistently appearing together for tools.
Figure 21.
Pairwise correlation of UBEM capabilities. Colder colour indicates a capability consistently appearing together for tools.

Figure 22.
Energy community lifecycle wheel: distribution of progression factors by lifecycle phase.
Figure 22.
Energy community lifecycle wheel: distribution of progression factors by lifecycle phase.

Figure 23.
UBEM-EC matchmaker: bipartite graph pairing UBEM capabilities to progression factors by colour.
Figure 23.
UBEM-EC matchmaker: bipartite graph pairing UBEM capabilities to progression factors by colour.

Table 1.
List of selected and filtered urban building energy modelling (UBEM) tool features.
| Features | Hong et al. [77] | Ferrari et al. [62] | Abbasabadi et al. [61] | Sola et al. [22] | Filtered |
|---|---|---|---|---|---|
| Output types (as described in Abbasabadi et al. [61]) | × | × | × | ||
| Optimal Spatial scale (as described in Ferrari et al. [62]) | × | × | × | ||
| Approach (As described in Hong et al. [77]) | × | × | × | ||
| Time step (As described in Ferrari et al. [62]) | × | × | |||
| Energy service (As described in Ferrari et al. [62]) | × | × | |||
| Licence (As described in Ferrari et al. [62]) | × | × | |||
| Energy generation modelling (As described in Sola et al. [22]) | × | × | |||
| Urban climatology model | × | ||||
| Time Horizon | × | 1 | |||
| Target users | × | ||||
| Input type | × | 3 | |||
| Web-based vs. Standalone desktop | × | ||||
| Building stock location | × | 2 | |||
| Building Characterization | × | 2 | |||
| Exo-or Endogenous demand modelling | × | 1 | |||
| Impact of user behaviour on Building energy demand | × | 1 | |||
| Non-residential type of building | × | 3 | |||
| Integrated vs. Co-sim tool | × |
1 duplicates, or included in the other features, 2 not correspond to the working UBEM definition, 3 insufficient information in the reviews and the original articles of the tools.
Table 2.
Progression factors tied to interactions with governance and regulation.
| Interactions with Governance and Regulation | ||
|---|---|---|
| Multi-bilateral contracting | The existence of standardised, yet flexible peer-to-peer templates for rapid application. | [3,53] |
| Multi-bilateral trading | A trading model harmonizing concurrent bilateral transactions on a shared infrastructure. | [87] |
| Legal and regulatory compliance | The ease of alignment between the energy community (or the facilitation thereof) and the regulatory regime. | [2,35,43,44,45,50,51,53,87,90,104] |
| Land-use and building code regulation | Land-use and building codification responsive to community-energy potentials. | [3,39] |
| Unfavourable taxation | Taxation policy fit-for a more decentralised energy market, level playing field for large and small actors. | [33] |
| Political landscape: inconsistency, engagement, support | The policies affecting community energy are volatile, hindering the planning of projects. | [2,35,38,44,46] |
Table 3.
Information and knowledge related progression factors.
| Information and Knowledge | ||
|---|---|---|
| Ambiguity in network operation | Methodology for co-simulation of distribution networks and P2P energy trading. | [87] |
| Information barrier | Discourse among the relevant actors supporting the diffusion and assimilation of community-energy. | [38,44,45,46,90] |
| Community problem field | Knowledge of pre-existing complex, socioeconomic, structural challenges in the focus of the community. | [12,35] |
| Natural preconditions | Knowledge of potential natural resources and limitations due to environmental factors and scenarios (such as solar availability). | [44] |
| Physical preconditions | Knowledge of physical possibilities and constraints (such as building conditions). | [44] |
| Data quality | Feasible availability of timely, accurate, reasonable, relevant, actionable data on the appropriate scale. | [44,47,87] |
| Awareness | The general understanding of the local energy transmission systems, production opportunities and sustainability challenges. | [3,39,51] |
| Broader societal impact/benefit | Knowledge of the multiple impacts of projects. | [6,12,35,39,40] |
| Specificity | Knowledge of the distributional impacts of projects. | [39,46] |
| Synergies | Knowledge of co-impacts of the project aggregate of the energy community. | [47,55] |
| Granularity | Data generated of marketable performance on the scale of viable products and services | [47] |
Table 4.
Economic influencer progression factors.
| Economic Influencers | ||
|---|---|---|
| Internal financial incentives | Monetizable benefits from the actions of the energy community. | [42] |
| External financial incentives | Policies, instruments, subsidies supporting funding investment and operation. | [2,3,45,46,49,51,105] |
| Cost | Handling of high transaction costs and upfront investment costs. | [2,3,12,34,39,44,45,47,49,87,105] |
| Access to wholesale markets | Opportunity to sell community-based services on the larger energy market. | [2,33,104] |
| Optimal size | Appropriate community size balancing (dis)economies of scale and social cohesion. | [2] |
Table 5.
Progression factors stemming from technological infrastructure.
| Technological Infrastructure | ||
|---|---|---|
| Microgrid | Low-voltage distribution grid that can be operated as island as well as connected to the wider grid. | [39,47,49,53] |
| Market transaction cost optimization | Optimal markets need to minimize the total transaction costs by regulating energy flows based on the dynamism of demand and supply. | [53] |
| Privacy | Secure, anonymized individual inputs, including needs signalling, and assertion of rights. | [53] |
| Peer preferences optimization | Management of peer preferences, expectations and behaviour. | [35,53] |
| Scalability of negotiations | Computational capacity to handle negotiation and consensus as the community scales. | [53] |
| Quality assurance | Guarantees for meeting reliability, quality, security standards of energy sources. | [53] |
| Grid congestion | Stable, secure grid operation as the community, and thus energy flows scale. | [53] |
Table 6.
Justice-related progression factors.
| Justice | ||
|---|---|---|
| Energy poverty threat | P2P markets may result in the energy poverty of economically disadvantaged groups. | [53] |
| Procedural justice | Institutional design and practices ensuring fair processes of decision-making, resource allocation, arbitration. | [6,12,42,49] |
| Transparency of energy market | Monitoring restructuring energy markets to recognize and supress exploitative conduct. | [40] |
| Input legitimacy | Measures against the uneven access to the community, exclusion of vulnerable groups, (e.g., women). | [12] |
Table 7.
Actor-bound progression factors.
| Actors | ||
|---|---|---|
| Inertia, passivity | Inhibition of transition without active opposition, due to disengagement. | [2,35,43,105] |
| Opposition, scepticism | Unhandled active opposition and concerns to transition. | [2,35,43,105] |
| Self-identity | Supportive attitude, motivations, identity congruent with the mission of the project. | [38,42,44,105] |
| Reliance on volunteers/lack of time | Single or multiple committed change-agents driving the process voluntarily. | [2,12] |
| Pre-existing knowledge and skills | Actor-level understanding of regulation, technologies, markets through existing knowledge or intermediaries. | [2,12,34,44,46,90] |
| Active involvement | High degree of ownership, community leadership and meaningful individual roles. | [12,38,39,45,105] |
| Rebound effect | Adverse behavioural adjustment to technological improvements. | [12] |
| Place attachment | Acceptance and support of locally bound or originated products and services. | [105] |
Table 8.
Network-bound progression factors.
| Networks | ||
|---|---|---|
| Articulate shared mission | Expected impacts and mission specified, and communicated in a measurable, achievable, specific, time-based, realistic manner. | [2,3,43,87] |
| Embeddedness, robust, resilient network | Connectedness to relevant actors, established networks with cross-fertilization potential. | [3,38,40,43,44] |
| Group identity | Shared sense of belonging to the social group constituting the energy community. | [12,42,49] |
| Relational goods, social value, empowerment | Perceived social value of networked cooperation through interactions and participation. | [38,42,49,105] |
| Peer effect | Frequency and emergent saturation in social network clusters accelerates total saturation in said cluster. | [42] |
| Market concentration | Engagement or resistance of actors and gatekeepers involved in centralized energy markets. | [2,39,40,47,49,50] |
| Identifying and engaging the appropriate network | Recruitment beyond social networks, on an outcomes/performance basis. | [2,39,44,46,90,93,106] |
| Bridging capital | Efficiency of knowledge transfer and negotiations through upscaling networks. | [12,38] |
| Trust | Trust eases transaction costs associated with negotiations in networked organizations. | [3,12,33,38] |
Table 9.
Top 5 pairwise correlates of metadata.
| Feature_1 | Feature_2 | Correlation |
|---|---|---|
| enabler | ECC | 0.547 |
| initiation | design | 0.575 |
| P2PM | operation | 0.698 |
| P2PM | technical | 0.717 |
| environmental | technical scalability | 0.808 |
Table 10.
Identified affordances in relation to constituent capabilities and related goals (progression factors).
Table 10.
Identified affordances in relation to constituent capabilities and related goals (progression factors).
| Affordances | UBEM Capability | Progression Factor |
|---|---|---|
| Accessible transparent and relevant early-stage spatiotemporal predictions. | Free, Web-based | Awareness |
| Trust | ||
| Transparency | ||
| Bridging capital | ||
| Informational barrier | ||
| Inertia, passivity | ||
| Opposition, scepticism | ||
| Relational goods social value, empowerment | ||
| Reliance on volunteers/lack of time | ||
| Hybrid or reduced order bottom-up, Over-hourly resolution. | Transparency | |
| Pre-existing knowledge and skills, | ||
| Specificity, | ||
| Active involvement, | ||
| Helps with finding synergies | ||
| Natural pre-conditions | ||
| Physical pre-conditions | ||
| Opposition, scepticism | ||
| Relational goods social value, empowerment | ||
| Data quality | ||
| Self-identity | ||
| Diverse range of energy services | Energy poverty threat | |
| Social scalability | ||
| Input legitimacy | ||
| Active involvement. | ||
| Coupling impacts to heterogenous needs | Economic outputs | Market transaction cost optimization |
| Quality assurance | ||
| Financial incentives | ||
| External financial incentives/lack of funding | ||
| Broader social impact/benefit | ||
| Market concentration | ||
| Political landscape: inconsistency, engagement, support | ||
| Community problem field | ||
| Cost | ||
| Bottom-up approach, Co-simulation, Sub-hourly output, District scale, Diverse range of energy services | Rebound effect | |
| Social scalability | ||
| Broader social impacts/benefits | ||
| Market transaction cost optimization | ||
| Physical preconditions | ||
| Natural preconditions | ||
| Articulate shared mission | ||
| Market concentration | ||
| Input legitimacy | ||
| Cost | ||
| Specificity | ||
| Identifying and engaging the appropriate networks | ||
| Peer preferences optimization | ||
| Quick feedback from coarse data | Desktop based | Privacy |
| Top down, over hourly, City scale | Land use and building code regulation | |
| Reliance of volunteers/lack of time | ||
| Cost | ||
| Multi-scale detailed analysis | Bottom up stochastic, Sub-hourly output resolution, District scale | Multi-bilateral contracting |
| Ambiguity of network | ||
| Economic outputs | Legal and regulatory obstacles | |
| Grid simulation | Co-simulation, Sub-hourly output, Diverse range of energy services, Energy generation modelling, | Microgrid |
| Grid congestion | ||
| Market concentration |
Table 11.
Impact of affordances by energy community lifecycle phase. Shaded cells indicate highest value in row, italic text indicates highest value in column.
Table 11.
Impact of affordances by energy community lifecycle phase. Shaded cells indicate highest value in row, italic text indicates highest value in column.
| Affordances | Initiation | Design | Social Upscaling | Technical Upscaling | Operation |
|---|---|---|---|---|---|
| Accessible transparent and relevant early-stage spatiotemporal predictions. | 14 factors | 11 factors | 10 factors | 7 factors | 7 factors |
| Coupling impacts to heterogeneous needs | 14 factors | 11 factors | 8 factors | 6 factors | 6 factors |
| Quick feedback from coarse data | 3 factors | 2 factors | - | - | 2 factors |
| Multi-scale detailed analysis | 2 factors | 1 factor | - | - | 1 factor |
| Grid simulation | 2 factors | 1 factor | - | - | 1 factor |
© 2020 by the authors. Licensee MDPI, Basel, Switzerland. This article is an open access article distributed under the terms and conditions of the Creative Commons Attribution (CC BY) license (http://creativecommons.org/licenses/by/4.0/).
Share and Cite
MDPI and ACS Style
Bukovszki, V.; Magyari, Á.; Braun, M.K.; Párdi, K.; Reith, A. Energy Modelling as a Trigger for Energy Communities: A Joint Socio-Technical Perspective. Energies 2020, 13, 2274. https://0-doi-org.brum.beds.ac.uk/10.3390/en13092274
AMA Style
Bukovszki V, Magyari Á, Braun MK, Párdi K, Reith A. Energy Modelling as a Trigger for Energy Communities: A Joint Socio-Technical Perspective. Energies. 2020; 13(9):2274. https://0-doi-org.brum.beds.ac.uk/10.3390/en13092274
Chicago/Turabian StyleBukovszki, Viktor, Ábel Magyari, Marina Kristina Braun, Kitti Párdi, and András Reith. 2020. "Energy Modelling as a Trigger for Energy Communities: A Joint Socio-Technical Perspective" Energies 13, no. 9: 2274. https://0-doi-org.brum.beds.ac.uk/10.3390/en13092274
Note that from the first issue of 2016, this journal uses article numbers instead of page numbers. See further details here.