A State-Of-The-Art Review of Car Suspension-Based Piezoelectric Energy Harvesting Systems


1
Department of Mechanical Engineering, College of Engineering, United Arab Emirates University, Al-Ain P.O. Box. 15551, UAE
2
On leave from Mechanical Design Department, Faculty of Engineering-El Mataria, Helwan University, Cairo P.O. Box. 11718, Egypt
*
Author to whom correspondence should be addressed.
†
On leave from Aeronautical Engineering Department, Jordan University of Science and Technology, Irbid, Jordan.
Energies 2020, 13(9), 2336; https://0-doi-org.brum.beds.ac.uk/10.3390/en13092336
Submission received: 20 March 2020
/
Revised: 17 April 2020
/
Accepted: 24 April 2020
/
Published: 7 May 2020
Abstract
:One of the most important techniques for energy harvesting is the clean energy collection from the ambient vibration. Piezoelectric energy harvesting systems became a hot topic in the literature and attracted most researchers. The reason behind this attraction is that piezoelectric materials are a simple structure and provide a higher power density among other mechanisms (electromagnetic and electrostatic). The aim of this manuscript is to succinctly review and present the state of the art of different existing vibrational applications utilizing piezoelectric energy harvesting technique. Meanwhile, the main concentration is harvesting energy from a vehicle suspension system. There is a significant amount of dissipated energy from the suspension dampers that is worthy of being harvested. Different mathematical car models with their experimental setup are presented, discussed, and compared. The piezoelectric material can be mounted in different locations such as suspension springs, dampers, and tires. The technique of implementing the harvester and the amount of power harvested from each location are analyzed. The evaluation of the electrical harvesting circuits and different storage devices for the harvested power are also discussed. The paper will also shed light on the variety of potential applications of the harvested energy.
1. Overview
Over the last decade, green manufacturing has attracted a great deal of attention worldwide. Different types of renewable energy could replace the use of traditional fossil fuel, which harms both the environment and public health [1,2]. For instance, the use of petroleum as a fuel for transportation causes global warming from the emissions of carbon dioxide. Achieving clean energy could be attained through scavenging the waste energy from the ambient environment and converting it into useful energy. This technology is also used in the field of powering wireless sensors to avoid the use of conventional batteries which need to be periodically replaced or recharged. The electrical energy for running these types of devices could be obtained from various potential energy sources available in the ambient environment, such as, for example, solar energy [3,4,5], thermal energy [6,7,8], mechanical vibration energy [9,10,11] like wind energy [12,13], acoustic energy [14,15,16], and ocean waves [17,18,19]. Harvesting these energies will help in providing an infinite lifetime energy of power generation. Many research works were conducted in reviewing several energy harvesting technologies [20,21,22,23,24,25,26,27]. The results, summarized in Table 1, show that solar power provides the most significant power density in direct sunlight. However, this energy is an unsuitable source of energy for indoor environments. Mechanical vibrations through the piezoelectric element are the most appropriate alternative source of energy harvesting due to their availability in many different environments.
One of the most effective methods of implementing a power harvesting system is to utilize the strain energy from various mechanical vibrations. There are different types of mechanical vibrations existing in the environment, like vibrating structures, moving objects, or vibration induced by fluid flow. A significant amount of energy is dissipated in the ambient vibrations in several forms like heat and friction. Harvesting these dissipated energies into useful electrical energy could be achieved through different methods, including the use of piezoelectric material, electromagnetic, and electrostatic transducers. All the proposed methods could provide a significant amount of useful energy, while piezoelectric materials received the most attention from many researchers in the last decade. The reason behind this attention is that the piezoelectric materials have the ability to directly transfer the applied stress into electrical energy with easy implementation into the system. Furthermore, they can be easily fabricated with multiple structures due to their simple and flexible configuration without requiring any additional tools.
The piezoelectric transducer is the most effective and preferable method, and it produces the highest power density and operates in the full frequency ranges [23,28,29,30]. Priya [28] stated that the generated power density of the piezoelectric transduction is more than three times greater than the other two transductions. Different researchers reported the value of the maximum power density. Jeon et al. [31] found that the highest power density from piezoelectric material subjected to the external vibrational source was 37 µW/mm3. For the electromagnetic effect, Saha et al. [32] showed that a value of 4.375 µW/mm3 could be generated from the electromagnetic-based generator subjected to the vibrating beam. Despesse et al. [33] built a system to convert the surrounding mechanical vibrations into electrical energy using the electrostatic transducer. The experimental results showed that the maximum power density from the electrostatic material was about 0.584 µW/mm3, which is the lowest value among the other two convertors. Therefore, it is clearly shown that the piezoelectric material has the highest power density.
Additionally, Gonsalez et al. [34] observed that the piezoelectric transducer has a more significant bandwidth than the electromagnetic transducer. These results were confirmed when studying the power density concerning the voltage among different transducers, as shown in Figure 1. It can be noted that the piezoelectric material has the widest power density versus the voltage compared to the electromagnetic transducer. Moreover, most of the energy harvesting mechanisms have a low voltage output that often requires multistage post-processing to produce a usable voltage. In contrast, piezoelectric energy harvesters produce enough voltage that can be used directly.
In addition, piezoelectric materials do not require any additional voltage input, unlike the electrostatic harvesters, which need an initial pre-charge of the variable capacitors by having an external polarization source for the initiation of the conversion process. Another further advantage of the piezoelectric materials is that they are compatible with macro- and microstructures due to the thick and thin film fabrication techniques. However, the limitation of the electromagnetic harvesters to be fabricated on the microscale is due to the permanent magnets’ poor characteristics and to the limited number of planar coil turns [35]. Table 2 summarizes the advantages and disadvantages of the three different transducers. Accordingly, the piezoelectric material is the best harvester method to focus on in this article.
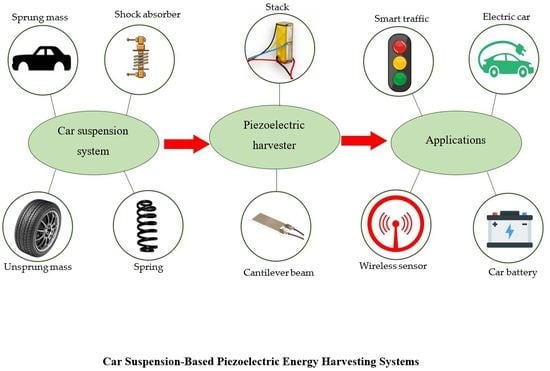
Thus, after harvesting the energy via piezoelectric material, the harvested energy can be used in powering various applications, mainly in the wireless remote sensors. As reported by Tayahi et al. [37], the use of ten piezoelectric stacks was able to power a temperature sensor that operated in a current of less than 3 mA. The wireless sensors can be distributed and utilized in different applications such as the industrial [38,39], medical [40,41], civil and military [42,43,44], agricultural, and food industry [45]. For instance, in smart homes and health applications, the monitoring sensors can be used for home lighting or sleep and heart beating monitoring, respectively. Figure 2 describes the idea of energy scavenging from mechanical energy and its applications.
In light of the above literature, which reflects the significant demand of harvesting the energy from car suspension systems using piezoelectric-based energy harvesters, this paper aims to present a comprehensive overview of different implementations of piezoelectric energy harvesting systems and discuss the most recent progress in this area. The fundamentals of the piezoelectric material, with its different configurations, is discussed in Section 2. Section 3 provides a variety of existing piezoelectric harvesting mechanical applications including human activities, buildings, and road traffic. The most prominent application is analyzed in Section 4 by illustrating different mathematical models and different implementations of the piezoelectric material in the car suspension system. The harvested power needs to be stored and utilized to get benefits from it, and this is clearly described in Section 5 and Section 6. Overall, the paper summarizes the current state of knowledge on the topic and creates an understanding of the topic for interested researchers by discussing the results reported in recent research work.
2. Piezoelectric Material
The piezoelectric material is being selected as a harvesting method since it is the best option among the other mechanisms. It could be implemented in a large variety of mechanical applications such as roads, vehicles, and human motions. Piezoelectric material has different types and configurations that will be discussed in the next paragraphs.
2.1. Piezoelectric Effects and Materials
The word piezoelectric comes from the Greek word piezo, which means press or squeeze. It was first discovered in 1880 by French physicists Pierre and Jacques Curie [46]. The piezoelectric material has a crystalline structure held together by an ionic bond. Another characteristic of the piezoelectric material is its anisotropic characteristic, which means that the material properties depend on the force’s direction and polarization electrodes orientation. The unique characteristic of the piezoelectric materials is reversibility, exhibiting the direct piezoelectric effect (sensing) and reverse piezoelectric effect (actuation). When the material is unstressed, the piezoelectric crystal will be neutrally charged, yielding dipole moments, which are a charge balance with positive and negative polarization. However, applying stress on the material will distort the dipoles or polarization, creating an electrical charge. This process is labeled as the direct piezoelectric effect. Conversely, subjecting the piezoelectric material to an external electric field will create an unbalance in the neutral charge state that generates mechanical stress or strain, and it is called the reverse piezoelectric effect. The mechanical and electrical behavior of the piezoelectric materials can be defined as the following constitutive equations [47]:
where D is the electric charge density in (C/m2), d is a piezoelectric charge constant in (m/V or C/N), σ is the applied mechanical stress in (N/m2), ε is a permittivity of the piezoelectric element in (F/m), and E is the electric field. For the second equation, δ is the mechanical strain, and s is the elastic compliance coefficient of the piezoelectric element in (m2/N). The superscripts in the equation represent the mechanical or electrical boundary conditions (constant stress or constant electric field), whereas the subscripts represent the direction of the mechanical and electrical parameters. From the properties of the piezoelectric material, it is possible to study and calculate the harvested energy from different piezoelectric configurations. The constitutive Equations (1) and (2) lead one to derive the relationship between the electrical and mechanical variables of the piezoelectric element as follows:
where the featuring quantities are the short circuit stiffness of the piezoelectric stack material Kp, the displacement Yp, and the force factor α. The mathematical expression of these quantities are illustrated in Equations (5)–(7), which are defined as a function of the piezoelectric parameters:
where Ap and tp are the surface area and thickness of the piezoelectric element.
As mentioned earlier, piezoelectric materials are anisotropic materials, so their physical parameters (e.g., charge constant dp, permittivity ε33, and modulus of elasticity Ep) depend on the direction of the applied mechanical force and electric charge collected. Figure 3 illustrates the direction indexes of the constant parameters in a rectangular crystallographic system with positive polarization along the z-axis. The first index represents the electric field direction, and the second one represents the direction of the mechanical stress or strain. The notations 1, 2, and 3 identify the directions in the piezoelectric material along the three axes X, Y, and Z, whereas the shear constants are described using 4, 5, and 6 notations.
There are two common coupling modes of operation for piezoelectric materials. The transverse mode 31, which is depicted in Figure 4a, and the longitudinal mode 33, which is shown in Figure 4b. In the 31 mode, the mechanical lateral force is applied perpendicular to the polarization axis. However, in the 33 mode the applied force is applied in the direction of the polarization axis as a compression force. Choosing the appropriate mode for maximizing the power output is dependent on the force applied to the piezoelectric material. The 31 mode is commonly used for the energy harvester, especially for the piezoelectric cantilever beam structures where the lateral stress on the beam can be easily coupled to the piezoelectric material [48,49]. On the other hand, Caliò et al. [50] noted that the 33 mode is suited to automobiles and machinery for producing a higher output power. The most common piezoelectric configurations applied in energy harvesting are the 31 mode (bimorph) and 33 mode (stack).
Piezoelectric materials are widely available in various forms as natural or human-made. The most common natural piezoelectric material is quartz, while the most active and used one is ceramic, which is a human-made material. Piezoelectric materials are mainly categorized into four main groups, depending on their structural characteristics, and those are ceramics, polymers, mono-crystals, and composites. Nevertheless, the two primary materials used in harvesting energy are piezo-ceramics like Lead Zirconate Titanate (PZT) or Barium Titanate (BaTiO3), and piezo-polymers like Polyvinylidene Fluoride (PVDF) [51]. PZT is the most common type of ceramics, and when they are deformed by 0.1% from the original dimensions, they will have the ability to generate enough piezoelectricity. Conversely, subjecting PZT material to an external electric charge will cause a change of 0.1% from the static material’s dimension [52]. PZT material has a higher power output per unit area compared to PVDF. As reported by Makki and Iliev [53], PZT has a harvested power output per unit area of 9.37 × 10⁻³ mW/mm2, while PVDF has harvested a lower value of 5.31 × 10⁻⁴ mW/mm2. Moreover, the PZT films’ coefficients are at least two times greater than PVDF and BaTiO3 materials and therefore generate a higher power output [51].
2.2. Piezoelectric Different Configurations
2.2.1. Bimorph and Unimorph Cantilever
The piezoelectric design is being selected based on the direction of the applied force on the material as the compression, bending, and shear mode. The most used design in vibration energy harvesting is the bending mode with a cantilever structure. The cantilever beam is a simple structure and has two different configurations based on the location of the piezoelectric material. A piezoelectric layer can be on one or both sides of the elastic layer, which is known as unimorph and bimorph configurations, respectively. A detailed comparison between these different types was illustrated by Ng and Liao [54].
In the case of a bimorph configuration, two piezoelectric materials are bonded together with a metal layer in between, as shown in Figure 5. The bonded piezoelectric layers can be connected in series or in parallel depending on the accumulated voltage and current, respectively [50]. The most common bimorph operating mode is the 31 bending mode, so that the top and bottom layers undergo opposite directions: in compression and tension.
Another cantilever configuration is the unimorph design, where one piezoelectric material is attached to the metal layer. This design is mostly used for microstructure applications, and it can be operated in both 31 and 33 modes [55]. As mentioned in the literature, the d33 piezoelectric coefficient is two times larger than the d31, and consequently the generated voltage will be higher when assuming the same structure parameters [55,56,57]. The direct relationship between the piezoelectric coefficient and the output open circuit voltage is illustrated by the following Equation (8):
where the open circuit voltage Voc is proportional to the piezoelectric coefficient dij, applied stress σij, and the gap distance between the electrodes ge. εr and ε0 are the relative dielectric constant and vacuum permittivity, respectively. Another factor affecting the output voltage is the gap distance between the electrodes. The electrodes for the 31 mode are on the top and bottom layer of the piezoelectric material, whereas in the 33 mode the electrode is on the top of the piezoelectric layer. As the thickness of the piezoelectric layer in the unimorph design is very thin, the electrode distance in the 31 mode is shorter than the electrode distance in the 33 mode. The experimental results of Kim et al. [58] showed that a dielectric constant of the d33 mode was two times higher than for the d31 mode, consequently resulting in higher output voltage. Moreover, they concluded that with the smaller area of the 33 mode compared to the 31 mode, the 33 mode can generate a higher output power of ≈2.23 µW by enhancing an interdigitate electrode IDE configuration through reducing the finger width to 2 µm. Table 3 shows the complete comparison between the 31 and 33 modes as discussed by Kim et al. [58].
2.2.2. Piezoelectric Stack
A piezoelectric stack is multilayer piezoelectric sheets stacked on top of one another. These layers (represented by n) are connected mechanically in series and electrically in parallel. The piezoelectric stack is operated in the 33 mode, where the mechanical force is applied along the polarization axis while the electric charge is collected on the surface perpendicular to the polarization axis, as shown in Figure 4b. It is more preferable to utilize the stacks in low-frequency ranges and high force excitation [59]. The stack geometry helps in amplifying the charge production compared to a single layer. Equation (9) shows the relationship between the number of piezoelectric layers n, force F, and voltage V with the stack output current Q [60]:
Piezoelectric stacks can withstand large mechanical forces that enable them to achieve higher output power than piezoelectric cantilevers [61]. Liu et al. [55] also stated that the output power from the piezoelectric stack is higher than the cantilever design. However, it needs a large applied force because of the high stiffness coefficient Kp, which depends on the modulus of elasticity, surface area, and thickness of the piezoelectric stack.
3. Vibration Energy Harvesting
By utilizing the property of piezoelectric materials of generating electricity, several scientific researchers have been investigated the piezoelectric energy harvester types in a wide variety of applications. In general, harvesting energy from mechanical sources provides an output power of 4 W to 800 W [21]. The vibrations could be observed from human activities such as walking [62,63,64,65], heart beating [66], and breathing, where the energy will be detected from the expansion of the chest [67]. Different ways to bond the piezoelectric material with the shoe are available in order to harvest the dissipated energy. For instance, piezoelectric material could harvest the dissipated energy from the ball of the foot using PVDF material under the shoe or from a foot strike using PZT to flatten the layer under the heel. These two approaches were discussed by [62] and are shown in Figure 6. Choi et al. [63] summarized the possibilities of locating piezoelectric material in different human joints in order to harvest the dissipated energy from human motions. Table 4 shows the harvested power from each joint location considering human walks at a speed of 1.3–7.8 km/h.
Mitcheson et al. [68] also reported that the power harnessed by human breathing was around 78 mW. Another way of harvesting energy is by installing the piezoelectric material underneath the floor material so that it will capture the vibrations resulting from the passenger’s movement. East Japan Railway Company applied this mechanism by conducting a real experiment in Tokyo station from the period of 19 January to 7 March 2008. The piezoelectric material was installed in the ticket gate area, as shown in Figure 7, considered as having very high traffic. The daily harvested power was about 10,000 W s, which is sufficient to run the automatic ticket gates and electronic displays [69]. However, after a period of three weeks, with more than 800,000 people passing, the total output power decreased due to degradation of the piezoelectric material durability.
Another application for harnessing energy is from footsteps in dance clubs. In 2008, the first sustainable dance club in the world was opened in Rotterdam and named Club Watt [70]. The dance floor was embedded with piezoelectric materials to absorb the vibrations from the dancer’s steps and generate energy. Additionally, London established an eco-nightclub at Bar Surya, where the dancing floor was made of a series of springs and piezoelectric blocks [71]. As the dancers moved up and down on the bouncing dance floor, the piezoelectric blocks squeezed and generated current to power some parts at the club.
Besides this, vibrations absorbed from buildings are another type of ambient energy source. Aminzahed et al. [72] designed a piezoelectric energy harvester placed on the ceiling of each top floor of a five-story wooden building. The outcomes from their model showed that increasing the input frequency on the first floor from 15–40 Hz led to increasing the harvested power from 0.25–0.7 mW in the building floors. These results were also confirmed by Kan et al. [73] by developing a piezoelectric energy harvesting system to harvest energy from wood floor vibration induced by human activities. The piezoelectric harvester should be placed in a proper way to maximize the harvested power. This was addressed by Elhalwagy et al. [74] by studying how to get the maximum benefits from the harvested energy in buildings’ interior spaces. The study was conducted according to the different types of applications and other different factors such as the needed power, number of steps, and the cost of electricity kilowatts. Piezoelectric sensors were connected in series and in parallel and placed in the tile where pressure was applied in the floors of the building. The high generated power tiles could power an LED lighting system, and the low generated power tiles could help in controlling the self-powered sensors. The power could also be harvested from the building’s ducting system, as mentioned by Yatim et al. [75]. Their piezoelectric model converter was able to harvest the power of approximately 2 W, which could be adequate for mini home devices.
Moreover, the energy could be harvested from road traffic as well. Jiang et al. [76] conducted a theoretical and experimental investigation of energy harvesting from the roadway. In each harvesting unit, three piezoelectric multilayer stacks, shown in Figure 8a, were insulated between the road pavement, and they deformed once the vehicle tires passed through it. The experimental results verified the theoretical analysis, and they indicated that each single harvesting unit could generate a power of up to 1 W with a vehicle speed of 100 km/h. This power output can power a wireless sensor system.
Rui et al. [77] introduced a single piezoelectric vibrator mounted between the upper and middle layers of the asphalt roadbed structure. According to their theoretical results, each piezoelectric energy harvester was able to generate a power of 0.67 mW. Abramovich et al. [78] invented a device that was made of a piezoelectric generator for harvesting energy from roads, highways, and airport runways. The deformation of the piezoelectric material was due to the weight of passing vehicles. This product was produced in an energy harvesting company called Innowattech [79]. In 2009, the company applied a test by embedding the piezoelectric harvester device 5 cm below the road surface. The results claimed that the energy production was around 200 kWh for 1 km per road lane. The Environmental Transport Association (ETA) has published that if an appropriate harvester is installed in every stretch of the British motorway, the generated energy will be able to run about 34,500 small cars [80]. Among these different applications, the focus in this article is on harvesting energy from the vehicle suspension system, as there is an enormous amount of power that is dissipated from its dampers. Section 4 will describe this in more detail.
4. Vehicle Suspension System
The most mechanical vibrations that have been extensively explored are the vehicle suspension system. It can suppress uncomfortable situations from different road profiles for the passengers and provide excellent road handling. The suspension system is an important part of the vehicle as it maximizes the friction between the vehicle tires and the road surface to provide stability and comfort. When the vehicle passes over a bump, the generated vertical acceleration causes the tires to move perpendicular to the road surface. Without the suspension system, the tires will lose road contact completely. Modeling the vehicle suspension system theoretically and experimentally will be presented in the following sections.
4.1. Mathematical Car Models
Several mathematical models have been utilized for analyzing vehicle dynamics. These models can also be called lumped parameter models, and they can study the behavior and the performance of the car suspension system. A mathematical car model is derived from the fundamental law of physics, such as Newton’s Laws or the conservation principle. The vehicle suspension system can be modeled as a quarter car model, half car model, and full car model.
The quarter car model is frequently used in the vehicle suspension analysis due to its simplicity and can provide the main essential characteristics of the full model. It examines only the vertical vibrations of the car body (bouncing), which can be useful for a preliminary design. The two degrees of freedom system in a quarter car model (shown in Figure 9) represents one-fourth of the car, and it consists of two solid masses known as sprung and unsprung masses. The sprung mass Ms represents a quarter of the vehicle body, and the unsprung mass Mus represents one vehicle tire assembly. The primary suspension, which is made of the spring Ks and shock absorber Cs, is supporting the sprung mass, whereas the unsprung mass is in direct contact with the road surface through the spring and damper that represent the tire stiffness Kt and tire absorptivity Ct, respectively. The vehicle is excited by the road excitation YR, which will cause the vertical displacement of the car body Ys as well as the tire Yus. The quarter car model can be easily modeled by applying Newton’s second law. The two equations of motion of 2 DOF are illustrated as follows:
where: and are the velocity of the sprung, unsprung, and road, respectively. , and are the acceleration of the sprung, unsprung, and road, respectively.
Many researchers were focused on the analysis of the quarter car model. Vaishnav et al. [81] derived a mathematical model of the quarter car model by using transfer function and Cramer’s rule. Sharma et al. [82] designed 2 DOF of a quarter car model with state-space representation by using MATLAB. The vehicle was excited with a step input of 0.1 m that resulted in a high overshoot of the sprung mass (80%) and unsprung mass (30%). These values were not satisfied with the ride comfort and quality. To overcome this problem, the authors proposed using a controller to keep the vehicle moving within the ride comfort ranges. Moreover, Jamali et al. [83] developed a quarter car model for an electric vehicle in order to evaluate the vehicle’s isolations to road disturbance. The study was focused on comparing the displacement and acceleration amplitudes of the sprung and unsprung masses with the road amplitude at different damping coefficients. Throughout the Simulink MATLAB program, the minimum frequency response occurred when the damping constant was equal to the optimal damping constant calculated by the following equation:
Florin et al. [84] simulated a quarter car model by MATLAB Simulink and compared it to the state space model and transfer function. The results obtained from the three different methods were identical with the same values of the suspension parameters. Hassaan [85] examined a quarter car model passing a circular hump while sustaining a comfortable ride. The mathematical model was derived by using a state model and analyzed by MATLAB Software. In order to achieve a comfortable ride, the study showed that the car speed should not exceed 7 km/h when passing a circular hump. Prabhakar and Arunachalam [86] conducted a comparison between the conventional passive suspension and passive suspension with different parameters of the damping and stiffness coefficients of a quarter car model. In order to provide the best ride comfort as well as vehicle handling, optimum values for the sprung damping and stiffness coefficients were found to be 1500 N s/m and 13 kN/m, respectively. Gao et al. [87] investigated the effect of the randomness of a quarter car model’s parameter on the dynamic analysis. The results from the study illustrated that the randomness of the mode shapes is highly independent of the tire stiffness while it is dependent on the sprung and unsprung masses. Moreover, the first natural frequency is influenced by the uncertainty sprung mass, and the second natural frequency is affected by the uncertainty unsprung mass system.
A quarter car model can be easily modeled for the experimental work. The most common model has two moving plates representing the sprung and unsprung masses connected to the springs and dampers. The differences among the models occur in modeling the unsprung mass as a real car tire or plate and the excitation input force. For the models with one real tire, Salah [88] modeled the quarter car model as a real tire connected to the moving plate, with the shock absorber in between (See Figure 10a). The moving plate represented the quarter of the sprung mass, and the shock absorber was made of the spring and damper. The model also included four stainless steel rods to guide the movement of the plates to be vertical with no torsion. Having a real car tire gave a realistic data analysis, and the model could handle a maximum weight of 300 kg and run up to 162 km/h. Figure 10b shows Mitra et al.’s [89] model, which consists of a real tire connected to the spring and damper with the sprung plate. The cam mechanism was utilized to convert the motor rotary motion into translation motion. Shing et al. [90] designed and modeled a quarter model with a real tire that was connected to the four springs and two shock absorbers. This model is presented in Figure 10c. The weight of 3 kg was placed at the top of the sprung plate to represent the mass of the quarter sprung mass.
On the other hand, most of the researchers modeled the unsprung mass as a moving plate. According to work done by Jugulkar et al. [91], they modeled two moving plates with four springs and adjustable dampers. As shown in Figure 11a, the springs were connected in parallel, and each had a stiffness coefficient of 3.33 N/mm. One more spring of stiffness 32.77 N/mm was connected to the damper in series at the center of the plate. The system was guided by a central bar with roller bearings to minimize the friction. The excitation input was modeled as an electric motor with a Scotch Yoke mechanism to convert the motor rotational motion into the linear motion of the system. Likewise, Patil and Joshi [92] modeled two moving plates with a suspension shock absorber and tire spring, as illustrated in Figure 11b. The corresponding values of the suspension stiffness, tire stiffness, and viscous damping were 13,900 N/m, 85,000 N/m, and 518 N s/m, respectively. The system was excited by a DC motor with a cam and follower mechanism to attain harmonic excitation at a specific frequency and amplitude. Additionally, Quanser [93] built three moving plates as the sprung mass, unsprung mass, and the road, as shown in Figure 11c. Two adjustable springs of 900 N/m and dampers of 7.5 N s/m were connected between the sprung and unsprung plates. Another two springs of 2500 N/m and dampers of 5 N s/m were connected between the unsprung and road plates. The system was driven by the DC motor with a lead screw and cable transmission to provide the vertical motion.
Unlike a quarter car model which consists of one tire, a half car model is made of two tires: one for the front and one for the rear axles. The four degrees of freedom in a half car model represent the bounce Ys and pitch motion θs of the vehicle body and the vertical translations of the front Yuf and rear axles Yur. The four equations of motion are derived as follows:
The equation of the vertical motion (bounce) of the front unsprung mass (front tire):
The equation of the vertical motion (bounce) of the rear unsprung mass (rear tire):
The equation of the vertical motion (bounce) of the sprung mass (half body):
The equation of the angular motion (pitch) of the sprung mass (half body):
where Is is the moment of inertia of the half car body, Lf is the distance from C.G. to the front axle, and Lr is the distance from C.G to the rear axle.
The half car model, as presented in Figure 12, assumes the symmetry of the car about the longitudinal axis. The different characteristics of the springs and dampers at the front and rear tires take into consideration which also exist in the actual vehicles. Moreover, the effect of the center of gravity and body motions was simulated using half car models. Gao et al. [94] investigated the effect of the uncertainty of random parameters of a half car model. The vehicle suspension was subjected to a random input excitation, which was modeled by employing the power spectral density (PSD). It was concluded that the uncertainty of the natural frequency of the vehicles was dependent on the uncertainty of the car parameters. The distance of the front and rear suspensions had a significant influence on the first two vehicles’ frequencies, whereas the third and fourth vehicles’ frequencies were affected by the front and rear tires’ mass. Patel et al. [95] studied a half car model to measure the road profile at different speeds by developing a unique algorithm using MATLAB Simulink Software. The half car model was excited by the input road profile and compared with the measured road profile at various speeds. The simulation of the half car model showed a good agreement between the input and measured road profiles in terms of time, distance, and frequency domain.
Some researchers have analyzed and compared both quarter and half car models in their research. Mehmood et al. [96] conducted a full dynamic analysis for a quarter and half car model using Laplace transformation and state space representation in the MATLAB program. Their analysis was focused on finding the optimum values for the damping coefficient to achieve the optimum driving comfort level. For 2 DOF, the appropriate damping range was found to be between 3000 and 4000 N s/m. However, a range of 1500 N s/m to 2000 N s/m was found to be the optimum for 4 DOF. Additionally, Faheem et al. [97] analyzed both a quarter and a half car model in terms of displacement and frequency responses to find the suitable damping coefficient values. The results of the two models showed that the damping coefficient should not exceed a value of 3000 N s/m in order to provide the desired performance.
A few investigations are available in the literature on modeling the half car model experimentally. Sapiński and Martynowicz [98] modeled a half car model as two identical suspension sets made of springs and magnetorheological shock absorbers (MRA), as shown in Figure 13a. The two suspensions were connected by a steel frame with a weight representing the half-sprung mass. One of the suspension sets was excited by a shaker of an electro-hydraulic cylinder type, while the other suspension was excited by the motor connected to a cam crank mechanism. An additional central roller was placed to guide and stabilize the system. The experimental work was focused on studying the vibration control while considering the bounce and pitch motions. An appropriate magnetorheological shock absorber (MRA) was able to minimize the vibrations by reducing the displacement and acceleration amplitudes. Likewise, Chavan et al. [99] built two suspension systems that were connected by a beam, as presented in Figure 13b. Each suspension was made of a spring and shock absorber and excited by the eccentric cam. For different excitation frequencies, the experimental results matched the simulation results while considering the non-linearity of the suspension system.
The rolling motion is considered in a full car model, which will increase the number of degrees of freedom to seven. A full car model, as shown in Figure 14, is made of four identical quarter car models that are coupled by rods. 7 DOF, consisting of the bounce, pitch, and roll motions of the vehicle body, and the other four vertical motions for each of the unsprung masses, are shown in the following equations.
The equation of the vertical motion (bounce) of the front left unsprung mass:
The equation of the vertical motion (bounce) of the front right unsprung mass:
The equation of the vertical motion (bounce) of the rear left unsprung mass:
The equation of the vertical motion (bounce) of the rear right unsprung mass:
The equation of the vertical motion of the full sprung mass at COF (reference to Z axis):
The equation of the pitching motion of the full sprung mass at COF (reference to Y axis):
The equation of the rolling motion of the full sprung mass at COF (reference to X axis):
A full car model can ultimately be used to study and analyze vehicle performance and ride comfort. Several parameters must be taken into consideration when studying the passenger ride comfort, such as RMS vertical acceleration, speed over a bump, suspension travel distance, and road handling. For the weighted RMS vertical acceleration, the British standard institute listed different levels of acceptability of the ride quality, as presented in Table 5 [100].
Furthermore, Mitra et al [101] reported some values of different characteristics for achieving a ride comfort. The vehicle speed must be less than 10 km/h when passing over a bump, with a minimum of 0.127 m for the suspension travel distance, and the road handling of the relative distance between the road and the tires must be in the range of 0.0508 m. Their results from studying the full car model satisfied the ride quality characteristics. Raju and Venkatachalam [102] derived the equations of motion of the full car model and studied the suspension system when subjected to different disturbances. Pulse and impulse disturbances were given to the right front wheel. For the case of the pulse input, the maximum oscillations affected the front axle with little effect on the rear axle. However, for the impulse disturbance, the maximum oscillations undergone by the front axle were much higher than the pulse disturbance. Rajale et al. [103] evaluated the vehicle comfort characteristics of the full car model with eight degrees of freedom, including a suspension system and car seat. Different signal inputs were studied in the displacement of the four main full car parameters, heave, pitch, roll, and seat. For the step input, the displacements of the four parameters increased at the beginning and then decreased with time. For the triangular signal, only the heave and pitch displacements were affected. However, the sinusoidal input affected the whole displacements, expect the seat displacement at a certain vehicle speed. Iyer et al. [104] studied the full car model with an independent suspension for the front tires and conventional suspension for the rear tires. The optimum values for the spring and damper of the suspension system were discussed in order to provide maximum comfort to the riders. The values of the stiffness and damping coefficients were found to be 8300 N/m and 700 N s/m, respectively. Mahala et al. [105] evaluated the vehicle responses of the quarter, half, and full car models. The study concluded that increasing the number of degrees of freedom would raise the accuracy of the analysis while it would increase the simulation time. There is no experimental investigation involving the modeling and studying of the full car in laboratories. Therefore, the work on half and full car models is minimal, and there are few studies to examine when compared with those on quarter car models, especially in the field of energy harvesting from a suspension system.
4.2. Power Dissipation in the Suspension System
In 2018, the Energy Information Administration (EIA) stated that there is about 92% of petroleum products consumed for the transportation sector, while only 10–20% is utilized to drive vehicles [106,107]. The car suspension system is an essential component in automobiles, yet it is the primary source of energy dissipation due to the dampening of vibrations. Velinsky and White [108] reported that this dissipated power is affected by different factors, such as the road profile, vehicle speed, and vehicle parameters such as the vehicle mass, spring stiffness, and damper coefficients. Wei and Taghavifar [109] showed that the power dissipated by the front car suspension was approximately 35% higher than the rear suspension due to greater values of the mass, spring, and damper of the front suspension than of the rear one. Additionally, Jacota [110] stated that increasing the mass of the vehicle as well as the damping coefficient corroborated by decreasing the stiffness coefficient will provide a higher dissipation energy of the dampers.
Furthermore, the road profile affects the amount of energy dissipated in the suspension system, as shown in ref. [109,110]. According to Abdelkareem et al. [111], the traditional shock absorber at a speed of 20–50 km/h with no bumps in the road can dissipate power in a range of 10–90 W, while having at least one bump will increase the power dissipation to 40–140 W at the same speed. On a weak road profile, Segel and Lu [112] indicated that about 200 W is dissipated from the four dampers of a passenger car at a speed of 13 m/s. Wei and Taghavifar [109] studied the energy harvesting from the car suspension system through different road profiles. For instance, in the harmonic excitation, the greatest average power of 57.84 W was recorded at vehicle speeds of 13 km/h and 39 km/h, while in the random excitation different road surfaces were categorized based on the power spectral density function. The various road surfaces were categorized as a smooth runway, rough runway, smooth highway, and highway with gravel. They showed that the predicted power dissipation from a highway with gravel was 2000 W, while in the smooth highway the dissipated power was around 200 W. This huge difference was due to the high relative velocity of the suspension system (2 m/s) for the highway with gravel compared to the smooth road (0.75 m/s). According to Jacota [110], the road profile was divided into two categories, macrostructure and microstructure. The macrostructure is the longitudinal profile of the road, which is categorized when the vehicle has a speed in the range of 25–120 km/h, while the microstructure represents the uneven humps of the tread, which are felt by the vehicle passengers. He concluded that the microstructure road profile had the most significant impact on the suspension excitation, dissipating more energy. These previously mentioned results indicate that this amount of dissipated power should not be ignored.
4.3. Energy Harvesting from Suspension System
The dissipated energy from the suspension system can be converted into another useful form using different types of harvesters. In their work, Zuo and Zhang [113] reported that the potential of harvestable power was in the range of 46 to 7500 W. However, the work on implementing the piezoelectric harvester in the car suspension system is limited. The piezoelectric material can be added as an additional energy harvesting element to the various locations in the car suspension system such as springs, tires, and dampers.
Moreover, Xiao et al. [114] studied the harvested energy from the piezoelectric material theoretically and experimentally. The proposed system in Figure 15 showed a quarter car model (2 DOF) with a piezoelectric harvester placed in parallel to the suspension springs. For the theoretical study, the quarter car model was excited by a sinusoidal input with a 1 g (9.8 m/s2) amplitude. The peak output voltage and power from the piezoelectric element were recorded as 274.62 V and 2.84 W, respectively. The harvested voltage and power were affected by the suspension parameters like tire stiffness, suspension stiffness, and damping coefficients. The proposed theoretical analysis was validated experimentally by modeling the sprung and unsprung masses as aluminum blocks with four springs and one piezoelectric element in between. The setup was subjected to a sine wave with an amplitude of 1.5 m/s2. The maximum output voltage was 0.33 V at a frequency of 38.58 Hz. However, the experimental harvested power was not mentioned in the paper. Additionally, the characteristics of the piezoelectric material, such as its type (cantilever or stack), dimensions (area Ap and thickness tp), piezoelectric stiffness coefficient Kp, charge constant d33, dielectric permittivity ε33, and the modulus of elasticity Ep, were not clearly mentioned.
On the other hand, Al-Yafeai et al. [115] coupled piezoelectric materials with the front and rear suspension system of the half car model shown in Figure 16. The results from the MATLAB/Simulink of the proposed model were compared with the Xiao et al. [114] model. The results illustrated that the harvested voltage and power from the half car model were higher than those of the quarter car model by 77% and 57%, respectively. For both systems, the calculated voltage and power from the piezoelectric material were done without considering the stiffness of the piezoelectric material Kp.
Taking into account the piezoelectric stiffness will dramatically affect the harvested voltage and power. To validate this, a value of 6250 kN/m as an equivalent stiffness coefficient was considered when attaching the piezoelectric material in parallel to the suspension springs (as shown previously in Figure 15 and Figure 16). For the quarter car model, the overall stiffness coefficient of the system was calculated from the following relation:
where Keq, Ks, and Kp are the stiffness coefficients of the equivalent connection, suspension, and the piezoelectric material, respectively. The relation shows that the overall stiffness coefficient increases when considering the piezoelectric material stiffness. The high value of the stiffness coefficient resulted in a huge reduction of the harvested voltage and power to 9 V and 2.9 mW, respectively. The reason for this is that the higher the system stiffness, the lower its deformation, and consequently the lower its harvested voltage and power, while in a series connection (Figure 17) the harvested voltage and power remain the same as when one does not consider the stiffness coefficient of the piezoelectric material. This is because the overall stiffness coefficient of the system is almost equal to the suspension spring coefficient, as can be illustrated by the following relation:
Some studies were focused on harvesting energy from the deformation of the automobile’s tires. As the tire flattens against the road surface, the piezoelectric material will be stretched and consequently generates electricity. Xie and Wang [30] proposed a dual-mass piezoelectric harvester connected to the quarter car model and presented in Figure 18. The PZT 4 harvester bar, with dimensions of 10 cm height and 1.5 cm width, was mounted on the suspension wheel. The mathematical model was subjected to the random rough road excitation with the different road profiles B, C, and D. According to ISO/TC108/SC2N67, the road roughness was classified starting from a very smooth road to a very rough road. The calculations through the iteration method showed that a power of 738 W could be harvested from the road profile of type D by implementing more than four piezoelectric bars in the system. Each bar had a height and width of 10 cm and 1.5 cm, respectively, with a vehicle speed of 35 m/s. This harvested power was also affected by the suspension and piezoelectric harvester parameters. For instance, increasing the car speed and decreasing the width bar would significantly increase the electric power generated from the cars.
Likewise, Lafarge et al. [116] embedded a piezoelectric cantilever beam of type PZT27 to the suspension wheels, as shown in Figure 19. From the Bond Graph language, the quarter car model was operated at the cantilever’s first natural frequency with different load resistances. For 22 k and 222 k, the power amplitude was recorded as 1 mW and 1.4 mW, respectively, where it could be powering several sensors to monitor applications. The system was also investigated in a real case by installing the piezoelectric beam into the unsprung mass. At a car speed of 10 km/h, the harvested power varied between 0.001 mw and 0.021 mW. However, a harvested power in the range of 0.01 mW and 0.07 mW occurred at 30 km/h. Furthermore, Behera [117] also connected 32 piezoelectric modules of type PZT-5A that were arranged in three strips connected in series along the inner tires’ circumference. The three series of piezoelectric elements in the tire are illustrated in Figure 20. From his rough calculations, the model at a speed of 40 km/h was able to harvest a power of approximately 14 mW.
Another utilization of the piezoelectric harvesters is to locate them at the center of the tires. This provides a rotational motion of the harvester as the tires rotate. Matching the natural frequency of the piezoelectric harvester with the rotating frequency of the tires will help in maximizing the output of harvested power. As stated by Gu and Livermore [118], the impact frequency of the harvester is twice the rotational frequency that depends on the centrifugal force and rotational speed. Hu et al. [119] placed a nanogenerator of size 1.5 cm × 0.5 cm in the inner surface of the car tire, as illustrated in Figure 21. The nanogenerator was designed to convert the mechanical energy of the tire’s motion into electrical energy using a piezoelectric film bender. The work was conducted experimentally by utilizing a bicycle tire instead of a real tire for the sake of simplicity. The electric pulse was generated in proportion to the nanogenerator bending due to the tire’s deformation. The experimental results show that an output voltage of 1.5 V was generated with a travel distance of 12 mm and acceleration of 30 m/s2. The generated voltage could be stored in the battery or capacitor to power different electronic appliances. The study also concluded that the generated output voltage was directly proportional to the car speed and to the travel distance.
According to Zhang et al. [120], the ceramic piezoelectric harvester was simplified as a uni-morph cantilever beam and mounted in the center of the rotating vehicle tire wheels, as shown in Figure 22a. They conducted an experimental study in which a piezoelectric layer with dimensions of 7 cm 1.5 cm 1.5 cm was located at a shaker table with a frequency of 0–2000 Hz representing the tire rotation frequency. Figure 22b represents the experimental setup that consists of an energy harvester, shaker, accelerometer, and sensors. With a resistor of 252 k, the system was able to capture a power of about 0.032 mW. In the actual test, the harvester was placed at the center of the front wheel tire of an electric car of type Coms, Toyota Auto Body. The piezoelectric harvester was connected to the wireless accelerometer and data acquisition system to measure the real output voltage per time. The test was conducted with different speeds of 10 km/h, 20 km/h, 30 km/h, and 40 km/h. The results showed that increasing the car speed resulted in increasing the collected power from the harvester until it reached approximately 0.017 mW. However, the highest average power among the four speeds occurred at a speed of 20 km/h in the case of stochastic resonance.
The energy harvester proposed by Consortium [121] was enough to generate a power of 0.9 mW by inserting a piezoelectric PVDF film inside the inner tire surface at a speed of 80 km/h. A film of size 8 cm 8 cm was connected to the voltage converter circuit to convert the AC voltage to DC, as shown in Figure 23. The project concluded that the power output was linearly dependent on the piezoelectric film area, vehicle wheel load, and its speed. Makki and Pop-Iliev [53] addressed three different piezoelectric energy harvesters, illustrated in Figure 24. These are a PZT unimorph bender mounted in the inner tire, PVDF thin sheet bonded to the tire, and PVDF ribbon attached to the tire bead. Among these three types, the PZT directly attached to the inner tire surface had the greatest power output, at about 4.6 mW, at a speed of 8 km/h. Moreover, PZT can withstand the high temperature of the tires without failure, and it is a relatively cheap material (2$ per 25 mm diameter sheet).
Lee et al. [122] modeled a regenerative shock absorber called PESHA that is made of two piezoelectric layers stacked in the shock absorber. The system was able to produce a power of 1.2 mW when exposed to vibrations that effected a change in the fluid pressure induced by the piston displacement, whereas Lafarge et al. [123] focused on studying the effectiveness of the location of the piezoelectric material mounted on the shock absorber. The two proposed different locations are shown in Figure 25. They found that locating PZT-5H between the two surfaces in the absorber (d33) harvested more energy than locating it on the damper’s surface (d31).
Furthermore, Ali and Adhhikari [124] modeled a piezoelectric shock absorber as a single degree of freedom coupled to an electric circuit made of electrical capacitance and resistance. The proposed system was excited by a sinusoidal wave input with constant frequency, while Madhav and Ali [125] subjected their model to a random input excitation. The aims of the two models (presented in Figure 26) were to find the optimal mechanical and electrical parameters in order to get the maximum power output and minimum system vibrations.
Some investigators used a multilayer piezoelectric stack as an alternative approach to increase the harvested energy. Arizti [126] modified the suspension shock absorber tube by installing the piezoelectric stack in the top of the piston, as clearly shown in Figure 27. As the car passed over the bump, the energy from the piezoelectric stack of type PSt 1000/25/40 could be produced from the movement of the piston. The harvested voltage from one bump in the road was recorded as 17.69 mV. However, the harvested power from the proposed system was not calculated in this study. The study also proposed the factors that were affecting the effectiveness of the piezoelectric stack such as, for example, increasing the number of layers and/or the layer’s thickness.
Moreover, Hendrowati et al. [127] impeded a multilayer piezoelectric stack with the suspension system. A piezoelectric stack made of 15 layers was connected in series with the suspension spring in a quarter car model. The multilayer piezoelectric vibration energy harvesting (ML PZT VEH) used was based on transferring the vertical displacement of the suspension system into horizontal displacement to magnify the spring force applied on the piezoelectric stack. The proposed principle (ML PZT VEH), which is presented in Figure 28, helped increase the harvested power by a value of 7.17 times higher than the direct installing onto the suspension system. Unlike the Xiao et al. [114] and Al-Yafeai et al. [115] models, Hendrowati et al. [127] considered the stiffness coefficient of the piezoelectric stack in the calculations. However, the values of the stiffness coefficient, the piezoelectric dielectric permittivity , and the resistance R were not clearly specified.
It is important to compare the different piezo element-based harvesters available in the literature that are up to date, regardless of their specifications. Table 6, followed by Figure 29, summarizes the harvested energy obtained from the different car suspension systems considered in the literature. The harvested systems are different in terms of the configurations (cantilever and stack), locations of the piezoelectric element in the suspension system (springs, shock absorbers, and wheels), the suspension system models (quarter or half car model), and the road input excitation (harmonic or random). It can be noted that the harvested power ranges from 0.001 mW to 3.9 W, which is limited when compared with the available/dissipated energy. The main focus of some researchers was only the evaluation of the dissipated energy from car suspension systems, not the harvested energy [128]. Furthermore, some researchers have evaluated the harvested energy using other techniques rather than piezoelectric-based techniques [128,129,130,131,132,133]. Different mechanisms were discussed in the literature, such as linear electromagnetic shock absorber, hydraulic, rack-pinion, ball-screw, cable/pullies, and MR electromagnetic regenerative damper. Their focus was on the active suspension system, while our focus is on the passive suspension system. Having a regenerative suspension damper requires that one replace the original car shock absorber with the regenerative one.
5. Electronic Circuit of Piezoelectric Harvesting System
The harvested energy from the piezoelectric material must be accumulated and stored. Without this stage, the resultant harvested power will be dissipated with no utilization. Having a piezoelectric energy harvester requires a rectifier circuit in order to convert the AC wave from the harvester to the DC voltage, which is suitable for energy storage. The most simple and common rectifier circuit used in the literature is the full-wave rectifier with a diode bridge [122,134,135,136]. The integrated circuit of the harvesting system is composed of the piezoelectric material that is modeled as a piezoelectric capacitance Cp and resistance Rp with the output AC voltage Vp connected to the external rectifier circuit. The rectifier circuit consists of the bridge rectifier made of four ideal silicon diodes to obtain the output DC voltage V, connected to the smoothing capacitor Ce, which is connected in parallel to either the external electronic load or battery. The smoothing capacitor is utilized in order to reduce the ripple of the output AC–DC signal. The schematic diagram of the piezoelectric harvesting circuit is shown in Figure 30.
Some researchers were focused on developing the harvesting energy circuits or the external electronic load by having voltage regulators in order to optimize the output power. The voltage regulators could be a step-up or step-down converter. For instance, Ottman et al. [137] developed a harvesting circuit made from the AC–DC rectifier, capacitor, and electrochemical battery. An additional switch mode DC–DC step-down converter was added to the circuit to control the energy flow to the battery. The control technique of the converter helps in varying the switching frequency to increase the current flow to the battery and adjust the duty cycle. The corresponding harvesting circuit was implemented in a bimorph piezoelectric bender and showed that the power was increased by 400% when compared to the circuit with no DC–DC step-down converter. However, the corresponding control circuit required more power than the power generated by the piezoelectric element. Consequently, Ottman et al. [138] used the same circuit as Ottman et al. [137] but with a fixed duty cycle to maximize the harvested power. The tested optimal duty cycle experimentally agreed with the analytical value of 2.81%. The results also showed that the harvested power from the proposed circuit was increased up to 30.66 mW, which is over three times the direct charging of the battery. Dawari and Parsa [139] suggested an efficient AC–DC converter to directly convert the low AC voltage from the harvester to high DC voltage. The circuit was made of a boost and converter that connected in parallel with a buck-boost converter. The efficiency of the proposed circuit reached up to 61%. Another circuit approach was presented by Peters et al. [140] by having a circuit with a two-stage concept compromising in the passive stage, followed by one active diode. The efficiency of the suggested circuit, shown in Figure 31, reached up to 90%. However, Ramadass and Chandrakasan [141] suggested a bias flip rectifier with an inductor circuit that had a power four times higher than the conventional full-bridge rectifier circuit. Lefeuvre et al. [142] proposed a buck-boost converter in order to reach the optimal power output. The experimental convertor had an efficiency of 84% for the case of an input voltage varying between 1.6 V and 5.5 V and an output power of 200 µW and 1.5 mW. The operating frequency of the energy harvesting system may not match the resonance frequency, so it is better to have an impedance to match the frequency of the harvester in different ranges. This method was utilized by Kong et al. [143] by having a circuit made of the AC–DC converter with a DC–DC converter. At resonance, the experimental findings illustrated that the system was able to harvest power at the range of 58% to 72% from the surrounding.
One of the best alternatives proposed by multiple researchers to maximize the energy conversion is to connect the electrical circuit with an inductor, since the piezoelectric material is capacitive in most cases. However, in low frequencies, the inductor is very high, and this is not suitable for energy harvesting systems. To solve this issue, a circuit called Synchronize Switch Harvesting (SSH) was proposed. Guyomar et al. [144] developed two types of SSHI circuits (SSH Inductor), where the inductor and the bi-directional switch are in parallel or series connections with the piezoelectric material (see Figure 32). The purpose of this non-linear circuit is to remove the phase shift between the voltage and the current of the piezoelectric material and to accordingly increase the output power. Lefeuvre et al. [145] proposed another type of circuit called Synchronous Electric Charge Extraction (SECE) that uses an inductor as a storage device. As a first stage, the inductor stores the energy from the piezoelectric material. After that, the energy is transmitted to the external load or battery through the DC–DC converter.
The harvested energy from the piezoelectric material is not sufficient to directly power the electronic appliances. It needs a storing device mode before utilizing it. This could be done by having a capacitor or a rechargeable battery. The rectified voltage could be monitored by having a switching converter to transmit the current from the piezoelectric material to the inductor. Then, the inductor will move the current to the storage device when it is appropriate.
Having capacitors as energy storage devices was studied by many researchers [146,147,148,149]. Due to their high-power density, they charge and discharge very rapidly, making them more applicable for only rapid energy transfer systems. However, most of the literature work concludes that using capacitors as storage devices is not an efficient method when compared to rechargeable batteries. This was also confirmed by Sodano et al. [150], who tested the piezoelectric plates with two different storage devices; capacitor and battery. It was found that using a rechargeable battery resulted in better power efficiency and storage. Using a battery as a storage source will allow a large variety of electronic devices to be powered when compared to the capacitor due to its quick discharge rate. However, batteries have a limited number of charging cycles. Chen et al. [151] mentioned the following batteries with their lifetime cycles: Lead Acid (500–1000 cycles), Nickel Cadmium (2000–2500 cycles), Sodium Sulphur (2500 cycles), and Lithium–Ion (up to 10,000 cycles). After the corresponding life cycles, the battery’s capacity falls significantly under 80% of its original capacity.
Another new approach for a storage medium, rather than using a conventional capacitor or battery, is using supercapacitors [152,153,154]. Supercapacitors, also called ultracapacitors, have a capacitance and stored energy that is much higher than the conventional one. Additionally, their cycle life, compared to electrochemical batteries, could reach up to 106 cycles [155]. Guan and Liao [156] conducted a comparison study of supercapacitors with rechargeable batteries. The experimental setup with different storage devices is shown in Figure 33. They reported that the charge/discharge efficiencies of the supercapacitors compared to the Lithium–Ion and Nickel Metal batteries were 95%, 92%, and 65%, respectively. However, the self-discharge rate of the ultracapacitors was high compared to the electrochemical batteries, resulting in losing most of their stored energy within a few days [49,151,157,158]. One of the solutions proposed by Tolentino and Talampas [159] was to combine the rechargeable battery with the supercapacitor as an energy storage unit. They used the Lithium–Ion battery as a primary storage unit, while the supercapacitor was used as a secondary unit for achieving a higher power output than was obtained when having only one of them.
6. Utilization of the Harvested Energy
Nowadays, micro-electro-mechanical systems (MEMS) and wireless technology have been identified as one of the most promising technologies for the 21st century. Different types of wireless sensors could be placed everywhere. Thus, it is necessary for them to have their own power supply rather than the traditional electrochemical batteries. Powering remote sensors through piezoelectric material provides endless energy for the sensor’s lifespan. Various sensors could be utilized in different applications, such as industrial, medical, and commercial applications, for instance using wireless remote sensors to provide a smart lighting system, monitor sleep and heart beating, and monitor public infrastructures like roads and bridges. Some of the world’s countries, such as the USA (California) and Italy, have proposed piezoelectric energy-generating roads by placing the piezoelectric materials underneath the roads in order to utilize harvested electrical energy when powering road signs and lights [160,161]. Additionally, Japan has established the idea of harvesting energy via piezoelectric material. In a Japan station, piezoelectric materials were placed under the ticket gates. The harvested energy from walking passengers was utilized in order to run the automatic ticket gates and electronic displays [69].
Furthermore, the vibrations generated from a vehicle’s travel can be converted into electricity in order to be either utilized or stored in a battery [53,162,163,164]. The utilization of the harvested energy would be more beneficial to electric vehicles as they use a battery to cause their movement. However, the problem with these batteries is that they have a limited lifetime, which allows the vehicles to move on short trips. Accordingly, it is better to implement multiple numbers of piezoelectric materials in different locations in electric cars (e.g., springs, shock absorbers, tires) to increase the output energy. This harvested energy could be used as additional energy to prolong the batteries’ life. Furthermore, these batteries will be self-charged as the vehicle moves due to the continuation of the generated energy from the piezoelectric materials, which will allow for an only-one-time external charging of the battery. Besides this, the battery that stored the harvested energy could be a back-up battery, acting temporarily in emergency cases. For example, in the case of shutting off the car, the spare battery will help jump-start the car. Moreover, the harvested energy from the piezoelectric materials could power various wireless sensor networks and other auxiliary systems in electric cars like air conditioning compressors, lamps, and combined meters. Accordingly, this will save the batteries’ power so that it only runs the electric vehicles. All the previously suggested utilizations of harvested energy in cars still need to be studied. Numerous challenges are associated with this technology, including an efficient design for how the piezoelectric harvester will be equipped with the vehicles and its corresponding cost, sensor location, the energy transfer method, and the use of storage devices in the vehicles [165,166].
7. Conclusions
The current manuscript introduces a state-of-the-art review of harvesting energy via piezoelectric material. Among the different harvesting techniques, the piezoelectric material is the best choice due to its simplicity, wide frequency range, high power density, and good scalability. A wide variety of existing harvested applications are discussed in the current review, such as human motions, buildings, roads, and vehicles. The study of harvesting energy from a vehicle suspension system was the focal objective of the review paper, as it demands the most attention. For passenger cars traveling at a speed of 13 m/s, a dissipated power of around 200 W was recorded from the suspension dampers. Thus, this amount of power is worth being harvested and cannot be ignored. Numerous studies have discussed the harvested energy from the quarter car model. However, the work on the half car model is very scanty. However, none of the work available in the literature has addressed harvesting energy from a full car model.
In the literature, most of the experimental suspension system models were built for the quarter car model by using two parallel plates connected with springs and dampers. However, modeling the quarter car model for energy harvesting purposes was only addressed by Xiao et al. [114]. Regarding modeling a half car model experimentally, the only work available in the literature is for the Sapiński and Martynowicz [98] and Chavan et al. [99] models. They have used two quarter car models connected by a beam to represent the half-sprung mass. It is worth mentioning here that experimental piezoelectric energy harvesting models for half and full car models have not been addressed yet.
This review illustrates that, regardless of the technique used in energy harvesting from a car suspension system, the outcome is, however, still limited (from 0.001 mW to 3.9 W) when compared with the available dissipated energy. Different methods could be suggested here in order to maximize the harvested power. Producing tailored piezoelectric elements with improved material characteristics for converting most of the mechanical vibrations from cars into electrical power (i.e., efficiency) is one of the possible ways. It has also been noted in our ongoing experimental research that harvested power was diminishing due to degradation in the durability and sustainability of the commercially available piezoelectric material. This was also confirmed from the study from the East Japan railway company in the Japan station [69]. After three weeks of studying the implementation of piezoelectric material underneath the ticket gate area, the harvested power decreased, though the number of people having passed increased. It is not only the material of the harvester that affects the output power; the direction of the applied mechanical force, as well as the energy harvester configuration, also play an essential role in increasing the output power. For instance, having the piezoelectric stack geometry helps in amplifying the charge production when compared to the piezoelectric cantilever benders. Developing electric circuits with storage devices like a battery also assists in maximizing the generated power by minimizing the current discharge rate. Most of the work mentioned in this review makes use of a battery as a storage device. Moreover, automobile manufacturers are encouraged to produce vehicles that are equipped with multiple energy harvesters to make the dissipated energy available for utilization. This will definitely have a direct effect on the fuel used and, on the economy, as well.
Author Contributions
Conceptualization, A.-H.I.M., T.D.; Data curation, D.A.-Y.; Formal analysis, D.A.-Y., A.-H.I.M., T.D.; Investigation, D.A.-Y., T.D., A.-H.I.M.; Methodology, T.D., A.-H.I.M., D.A.-Y.; Resources, A.-H.I.M., T.D.; Supervision, A.-H.I.M., T.D.; Visualization, A.-H.I.M., T.D.; Writing—original draft, D.A.-Y.; Writing—review & editing, A.-H.I.M., T.D. All authors have read and agreed to the published version of the manuscript.
Funding
This research was funded by UNITED ARAB EMIRATES UNIVERSITY, grant number 31R096-Research Center- ECEER -8-2015.
Conflicts of Interest
The authors declare no conflict of interest.
References
- Jacobson, M.Z.; Delucchi, M.A.; Bauer, Z.A.; Goodman, S.C.; Chapman, W.E.; Cameron, M.A.; Bozonnat, C.; Chobadi, L.; Clonts, H.A.; Enevoldsen, P.; et al. 100% clean and renewable wind, water, and sunlight all-sector energy roadmaps for 139 countries of the world. Joule 2017, 1, 108–121. [Google Scholar] [CrossRef] [Green Version]
- Heard, B.P.; Brook, B.W.; Wigley, T.M.; Bradshaw, C.J. Burden of proof: A comprehensive review of the feasibility of 100% renewable-electricity systems. Renew. Sustain. Energy Rev. 2017, 76, 1122–1133. [Google Scholar] [CrossRef]
- Krüger, D.; Fischer, S.; Buschmann, C. Solar power harvesting—Modeling and experiences. GIITG KuVS Fachgespr. Drahtlose Sensornetze 2009, 8, 51–54. [Google Scholar]
- Raghunathan, V.; Kansal, A.; Hsu, J.; Friedman, J.; Srivastava, M. Design Considerations for Solar Energy Harvesting Wireless Embedded Systems. In Proceedings of the 4th International Symposium on Information Processing in Sensor Networks, Boise, ID, USA, 15 April 2005; p. 64. [Google Scholar]
- Dondi, D.; Bertacchini, A.; Larcher, L.; Pavan, P.; Brunelli, D.; Benini, L. A Solar Energy Harvesting Circuit for Low Power Applications. In Proceedings of the 2008 IEEE International Conference on Sustainable Energy Technologies, Singapore, 24–27 November 2008; pp. 945–949. [Google Scholar]
- Tan, Y.K.; Panda, S.K. Energy harvesting from hybrid indoor ambient light and thermal energy sources for enhanced performance of wireless sensor nodes. IEEE Trans. Ind. Electron. 2011, 58, 4424–4435. [Google Scholar] [CrossRef]
- Cuadras, A.; Gasulla, M.; Ferrari, V. Thermal energy harvesting through pyroelectricity. Sens. Actuators Phys. 2010, 158, 132–139. [Google Scholar] [CrossRef]
- Lu, X.; Yang, S.-H. Thermal Energy Harvesting for WSNs. In Proceedings of the 2010 IEEE International Conference on Systems, Man and Cybernetics, Istanbul, Turkey, 10–13 October 2010; pp. 3045–3052. [Google Scholar]
- Sun, C.; Shi, J.; Wang, X. Fundamental study of mechanical energy harvesting using piezoelectric nanostructures. J. Appl. Phys. 2010, 108, 034309. [Google Scholar] [CrossRef] [Green Version]
- Elvin, N.; Erturk, A. Introduction and Methods of Mechanical Energy Harvesting. In Advances in Energy Harvesting Methods; Springer: Berlin/Heidelberg, Germany, 2013; pp. 3–14. [Google Scholar]
- Chen, Y.; Zhang, H.; Zhang, Y.; Li, C.; Yang, Q.; Zheng, H.; Lü, C. Mechanical energy harvesting from road pavements under vehicular load using embedded piezoelectric elements. J. Appl. Mech. 2016, 83, 081001. [Google Scholar] [CrossRef]
- Wu, N.; Wang, Q.; Xie, X. Wind energy harvesting with a piezoelectric harvester. Smart Mater. Struct. 2013, 22, 095023. [Google Scholar] [CrossRef]
- Sirohi, J.; Mahadik, R. Harvesting wind energy using a galloping piezoelectric beam. J. Vib. Acoust. 2012, 134, 011009. [Google Scholar] [CrossRef]
- Li, B.; You, J.H.; Kim, Y.-J. Low frequency acoustic energy harvesting using PZT piezoelectric plates in a straight tube resonator. Smart Mater. Struct. 2013, 22, 055013. [Google Scholar] [CrossRef]
- Li, B.; Laviage, A.J.; You, J.H.; Kim, Y.-J. Acoustic Energy Harvesting Using Quarter-Wavelength Straight-Tube Resonator. In Proceedings of the ASME 2012 International Mechanical Engineering Congress and Exposition, Houston, TX, USA, 9–15 November 2012; pp. 467–473. [Google Scholar]
- Horowitz, S.B.; Sheplak, M.; Cattafesta, L.N., III; Nishida, T. A MEMS acoustic energy harvester. J. Micromech. Microeng. 2006, 16, S174. [Google Scholar] [CrossRef]
- Wu, N.; Wang, Q.; Xie, X. Ocean wave energy harvesting with a piezoelectric coupled buoy structure. Appl. Ocean Res. 2015, 50, 110–118. [Google Scholar] [CrossRef]
- Viet, N.V.; Wu, N.; Wang, Q. A review on energy harvesting from ocean waves by piezoelectric technology. J. Model. Mech. Mater. 2017, 1. [Google Scholar] [CrossRef]
- Kim, K.-H.; Cho, S.-B.; Kim, H.-D.; Shim, K.-T. Wave Power Generation by Piezoelectric Sensor Attached to a Coastal Structure. J. Sens. 2018, 2018, 7986438. [Google Scholar] [CrossRef] [Green Version]
- Cao, S.; Li, J. A survey on ambient energy sources and harvesting methods for structural health monitoring applications. Adv. Mech. Eng. 2017, 9, 1687814017696210. [Google Scholar] [CrossRef]
- Yildiz, F. Potential Ambient Energy-Harvesting Sources and Techniques. J. Technol. Stud. 2009, 35, 40–48. [Google Scholar] [CrossRef]
- Devi, P.K. Survey on Energy Harvesting Techniques. Int. J. Sci. Eng. Comput. Technol. 2014, 4, 256. [Google Scholar]
- Knight, C.; Davidson, J.; Behrens, S. Energy options for wireless sensor nodes. Sensors 2008, 8, 8037–8066. [Google Scholar] [CrossRef]
- Radousky, H.B.; Liang, H. Energy harvesting: An integrated view of materials, devices and applications. Nanotechnology 2012, 23, 502001. [Google Scholar] [CrossRef]
- Roundy, S.; Wright, P.K.; Rabaey, J. A study of low level vibrations as a power source for wireless sensor nodes. Comput. Commun. 2003, 26, 1131–1144. [Google Scholar] [CrossRef]
- Chalasani, S.; Conrad, J.M. A survey of energy harvesting sources for embedded systems. In Proceedings of the 2008 IEEE Southeastcon, Huntsville, AL, USA, 3–6 April 2008; pp. 442–447. [Google Scholar]
- Twiefel, J.; Westermann, H. Survey on broadband techniques for vibration energy harvesting. J. Intell. Mater. Syst. Struct. 2013, 24, 1291–1302. [Google Scholar] [CrossRef]
- Priya, S.; Inman, D.J. Energy Harvesting Technologies; Springer: Berlin/Heidelberg, Germany, 2009; Volume 21. [Google Scholar]
- El-Sayed, A.-R.; Tai, K.; Biglarbegian, M.; Mahmud, S. A survey on recent energy harvesting mechanisms. In Proceedings of the 2016 IEEE Canadian Conference on Electrical and Computer Engineering (CCECE), Vancouver, BC, Canada, 15–18 May 2016; pp. 1–5. [Google Scholar]
- Xie, X.D.; Wang, Q. Energy harvesting from a vehicle suspension system. Energy 2015, 86, 385–392. [Google Scholar] [CrossRef]
- Jeon, Y.B.; Sood, R.; Jeong, J.-H.; Kim, S.-G. MEMS power generator with transverse mode thin film PZT. Sens. Actuators Phys. 2005, 122, 16–22. [Google Scholar] [CrossRef]
- Saha, C.R.; O’Donnell, T.; Loder, H.; Beeby, S.; Tudor, J. Optimization of an electromagnetic energy harvesting device. IEEE Trans. Magn. 2006, 42, 3509–3511. [Google Scholar] [CrossRef]
- Despesse, G.; Jager, T.; Jean-Jacques, C.; Léger, J.M.; Vassilev, A.; Basrour, S.; Charlot, B. Fabrication and Characterization of High Damping Electrostatic Micro Devices for Vibration Energy Scavenging. 2005. Available online: https://hal.archives-ouvertes.fr/hal-00748983/ (accessed on 6 April 2020).
- Gonsalez, C.G.; Franco, V.R.; Brennan, M.J.; da Silva, S.; Junior, V.L. Energy Harvesting Using Piezoelectric and Electromagnetic Transducers. In Proceedings of the 9th Brazilian Conference on Dynamics, Control and Their Applications, Serra Negra, Brazil, 7–11 June 2010; pp. 1166–1171. [Google Scholar]
- Erturk, A.; Inman, D.J. Piezoelectric Energy Harvesting; John Wiley & Sons: Hoboken, NJ, USA, 2011. [Google Scholar]
- Aljadiri, R.T.; Taha, L.Y.; Ivey, P. Wind Energy Harvesting Systems: A Better understanding of their Sustainability. In Proceedings of the 2017 3rd International Conference on Control, Automation and Robotics (ICCAR), Nagoya, Japan, 24–26 April 2017; pp. 582–587. [Google Scholar]
- Tayahi, M.B.; Johnson, B.; Hotzman, M.; Cadet, G. Piezoelectric Materials for Powering Wireless Remote Sensors. In Proceedings of the Performance, Computing, and Communications Conference, Phoenix, AZ, USA, 7–9 April 2005. [Google Scholar]
- Christin, D.; Mogre, P.S.; Hollick, M. Survey on wireless sensor network technologies for industrial automation: The security and quality of service perspectives. Future Internet 2010, 2, 96–125. [Google Scholar] [CrossRef] [Green Version]
- Chen, J.; Cao, X.; Cheng, P.; Xiao, Y.; Sun, Y. Distributed collaborative control for industrial automation with wireless sensor and actuator networks. IEEE Trans. Ind. Electron. 2010, 57, 4219–4230. [Google Scholar] [CrossRef]
- Park, G.; Rosing, T.; Todd, M.D.; Farrar, C.R.; Hodgkiss, W. Energy harvesting for structural health monitoring sensor networks. J. Infrastruct. Syst. 2008, 14, 64–79. [Google Scholar] [CrossRef] [Green Version]
- Ko, J.; Lu, C.; Srivastava, M.B.; Stankovic, J.A.; Terzis, A.; Welsh, M. Wireless sensor networks for healthcare. Proc. IEEE 2010, 98, 1947–1960. [Google Scholar] [CrossRef] [Green Version]
- Liao, W.H.; Wang, D.H.; Huang, S.L. Wireless monitoring of cable tension of cable-stayed bridges using PVDF piezoelectric films. J. Intell. Mater. Syst. Struct. 2001, 12, 331–339. [Google Scholar] [CrossRef]
- García-Hernández, C.F.; Ibarguengoytia-Gonzalez, P.H.; García-Hernández, J.; Pérez-Díaz, J.A. Wireless sensor networks and applications: A survey. IJCSNS Int. J. Comput. Sci. Netw. Secur. 2007, 7, 264–273. [Google Scholar]
- Chalard, L.; Helal, D.; Verbaere, L.; Wellig, A. Wireless Sensor Networks Devices: Overview, Issues, State-of the Art and Promising Technologies. In ST Journal of Research; Citeseerx: Princeton, NJ, USA, 2007. [Google Scholar]
- Ruiz-Garcia, L.; Lunadei, L.; Barreiro, P.; Robla, I. A review of wireless sensor technologies and applications in agriculture and food industry: State of the art and current trends. Sensors 2009, 9, 4728–4750. [Google Scholar] [CrossRef] [PubMed] [Green Version]
- Uchino, K. Advanced Piezoelectric Materials: Science and Technology; Woodhead Publishing: Amsterdam, The Netherlands, 2017. [Google Scholar]
- Meeker, T.R. Publication and proposed revision of ANSI/IEEE standard 176-1987. IEEE Trans. Ultrason. Ferroelectr. Freq. Control 1996, 43, 717–772. [Google Scholar]
- Hassan, H.F.; Hassan, S.I.S.; Rahim, R.A. Acoustic energy harvesting using piezoelectric generator for low frequency sound waves energy conversion. Int. J. Eng. Technol. IJET 2014, 5, 4702–4707. [Google Scholar]
- Anton, S.R.; Sodano, H.A. A review of power harvesting using piezoelectric materials (2003–2006). Smart Mater. Struct. 2007, 16, R1. [Google Scholar] [CrossRef]
- Caliò, R.; Rongala, U.B.; Camboni, D.; Milazzo, M.; Stefanini, C.; De Petris, G.; Oddo, C.M. Piezoelectric energy harvesting solutions. Sensors 2014, 14, 4755–4790. [Google Scholar]
- Ambrosio, R.; Jimenez, A.; Mireles, J.; Moreno, M.; Monfil, K.; Heredia, H. Study of piezoelectric energy harvesting system based on PZT. Integr. Ferroelectr. 2011, 126, 77–86. [Google Scholar] [CrossRef]
- Kumar, P. Piezo-smart roads. Int. J. Enhanc. Res. Sci. Technol. 2013, 2, 60–65. [Google Scholar]
- Makki, N.; Pop-Iliev, R. Piezoelectric Power Generation in Automotive tires. In Proceedings of the Mart Materials, Structures & NDT in Aerospace Conference NDT in Canada 2011, Montreal, QC, Canada, 2–4 November 2011. [Google Scholar]
- Ng, T.H.; Liao, W.H. Sensitivity analysis and energy harvesting for a self-powered piezoelectric sensor. J. Intell. Mater. Syst. Struct. 2005, 16, 785–797. [Google Scholar] [CrossRef]
- Liu, H.; Zhong, J.; Lee, C.; Lee, S.-W.; Lin, L. A comprehensive review on piezoelectric energy harvesting technology: Materials, mechanisms, and applications. Appl. Phys. Rev. 2018, 5, 041306. [Google Scholar] [CrossRef]
- Kim, S.-G.; Priya, S.; Kanno, I. Piezoelectric MEMS for energy harvesting. MRS Bull. 2012, 37, 1039–1050. [Google Scholar] [CrossRef] [Green Version]
- Huang, H.; Scott, J.F. Ferroelectric Materials for Energy Applications; John Wiley & Sons: Hoboken, NJ, USA, 2018. [Google Scholar]
- Kim, S.-B.; Park, H.; Kim, S.-H.; Wikle, H.C.; Park, J.-H.; Kim, D.-J. Comparison of MEMS PZT cantilevers based on d31 and d33 modes for vibration energy harvesting. J. Microelectromech. Syst. 2012, 22, 26–33. [Google Scholar] [CrossRef]
- Goldfarb, M.; Jones, L.D. On the efficiency of electric power generation with piezoelectric ceramic. J. Dyn. Syst. Meas. Control 1999, 121, 566–571. [Google Scholar] [CrossRef]
- Leo, D.J. Engineering Analysis of Smart Material Systems; John Wiley & Sons: Hoboken, NJ, USA, 2007. [Google Scholar]
- APC International, Ltd. Piezoelectric Ceramics: Principles and Applications; APC International: Mackeyville, PA, USA, 2002. [Google Scholar]
- Shenck, N s.; Paradiso, J.A. Energy scavenging with shoe-mounted piezoelectrics. IEEE Micro 2001, 21, 30–42. [Google Scholar] [CrossRef]
- Choi, Y.-M.; Lee, M.G.; Jeon, Y. Wearable Biomechanical Energy Harvesting Technologies. Energies 2017, 10, 1483. [Google Scholar] [CrossRef] [Green Version]
- Leinonen, M.; Palosaari, J.; Sobocinski, M.; Juuti, J.; Jantunen, H. Energy Harvesting from Vibration and Walking with Piezoelectric Materials; MATINE: Philadelphia, PA, USA, 2018; pp. 1–28. [Google Scholar]
- Kymissis, J.; Kendall, C.; Paradiso, J.; Gershenfeld, N. Parasitic Power Harvesting in Shoes. In Proceedings of the Digest of Papers. Second International Symposium on Wearable Computers (Cat. No. 98EX215), Pittsburgh, PA, USA, 19–20 Octorber 1998; pp. 132–139. [Google Scholar]
- Ko, W.H. Piezoelectric Energy Converter for Electronic Implants; Patent and Trademark Office: Washington, DC, USA, 1969. [Google Scholar]
- Selvarathinam, J.; Anpalagan, A. Energy harvesting from the human body for biomedical applications. IEEE Potentials 2016, 35, 6–12. [Google Scholar] [CrossRef]
- Mitcheson, P.D.; Yeatman, E.M.; Rao, G.K.; Holmes, A.S.; Green, T.C. Energy harvesting from human and machine motion for wireless electronic devices. Proc. IEEE 2008, 96, 1457–1486. [Google Scholar] [CrossRef] [Green Version]
- East Japan Railway Company. Demonstration Experiment of the ‘Power-Generating Floor’ at Tokyo Station. 2008. Available online: https://www.jreast.co.jp/e/development/press/20080111.pdf (accessed on 25 May 2018).
- Rosenthal, E.; Watt, A. Partying helps power a dutch nightclub. The New York Times. 2008. Available online: https://www.nytimes.com/2008/10/24/world/europe/24rotterdam.html (accessed on 20 September 2018).
- Britain’s First Eco-nightclub Powered by Pounding Feet Opens its Doors|Daily Mail Onlin. Available online: https://www.dailymail.co.uk/sciencetech/article-1027362/Britains-eco-nightclub-powered-pounding-feet-opens-doors.html (accessed on 17 September 2018).
- Aminzahed, I.; Zhang, Y.; Jabbari, M. Energy harvesting from a five-story building and investigation of frequency effect on output power. Int. J. Interact. Des. Manuf. IJIDeM 2016, 10, 301–308. [Google Scholar] [CrossRef]
- Kan, J.; Ross, R.J.; Wang, X.; Li, W. Energy harvesting from wood floor vibration using a piezoelectric generator. Res. Note FPL–RN–0347 Madison WI US Dep. Agric. For. Serv. For. Prod. Lab. 9 P 2017, 347, 1–7. [Google Scholar]
- Elhalwagy, A.M.; Ghoneem, M.Y.M.; Elhadidi, M. Feasibility Study for Using Piezoelectric Energy Harvesting Floor in Buildings’ Interior Spaces. Energy Procedia 2017, 115, 114–126. [Google Scholar] [CrossRef]
- Yatim, H.M.; Ismail, F.M.; Kosnan, S.E.; Mohammad, Z.; Januddi, F.S.; Bakri, A. A Development of Piezoelectric Model as an Energy Harvester from Mechanical Vibration. Chem. Eng. 2018, 63, 775–780. [Google Scholar]
- Jiang, X.; Li, Y.; Li, J.; Wang, J.; Yao, J. Piezoelectric energy harvesting from traffic-induced pavement vibrations. J. Renew. Sustain. Energy 2014, 6, 043110. [Google Scholar] [CrossRef]
- Rui, L.; Xiao, Y.C.; Pei, J.Z.; Zhao, X.K. The Theoretical Research about the Piezoelectric Materials Generating Capacity on Road. In Applied Mechanics and Materials; Trans Tech Publications Ltd.: Stafa-Zurich, Switzerland, 2014; Volume 470, pp. 807–813. [Google Scholar]
- Abramovich, H.; Harash, E.; Milgrom, C.; Amit, U. Energy Harvesting from Airport Runway. U.S. Patent Application No. 12/353,764, 6 August 2009. [Google Scholar]
- Edery, L.A. Innowattech: Harvesting Energy and Data; A Standalone Technology. In First International Symposium. The Highway to Innovation; Israel National Roads Company, Ltd.: Tel Aviv, Israel, 2010; pp. 64–81. [Google Scholar]
- Sharma, P.; Rajput, S. Sustainable Smart Cities in India: Challenges and Future Perspectives; Springer: Berlin/Heidelberg, Germany, 2017. [Google Scholar]
- Vaishnav, A.; Sarvaiya, M.; Dhabaliya, P. Mathematical Modelling and Comparison of Two Degree of Freedom Suspension System of Quarter Car. Imp. J. Interdiscip. Res. 2016, 2, 128–137. [Google Scholar]
- Sharma, P.; Saluja, N.; Saini, D.; Saini, P. Analysis of automotive passive suspension system with Matlab program generation. Int. J. Adv. Technol. 2013, 4, 115–119. [Google Scholar]
- Jamali, M.S.; Ismail, K.A.; Taha, Z.; Aiman, M.F. Development of Matlab Simulink Model for Dynamics Analysis of Passive Suspension System for Lightweight Vehicle. In Journal of Physics: Conference Series; IOP Publishing: London, UK, 2017; Volume 908, p. 012066. [Google Scholar]
- Florin, A.; Ioan-Cozmin, M.-R.; Liliana, P. Passive suspension modeling using MATLAB, quarter-car model, input signal step type. New Technol. Prod. Mach. Manuf. Technol. 2013, 258–263. [Google Scholar]
- Hassaan, G.A. Car dynamics using quarter model and passive suspension, part i: Effect of suspension damping and car speed. Int. J. Comput. Tech. 2014, 1, 1–9. [Google Scholar]
- Prabhakar, S.; Arunachalam, K. Simulation and analysis of passive suspension system for different road profiles with variable damping and stiffness parameters. J. Chem. Pharm. Sci. 2015, 974, 2115. [Google Scholar]
- Gao, W.; Zhang, N.; Dai, J. A stochastic quarter-car model for dynamic analysis of vehicles with uncertain parameters. Veh. Syst. Dyn. 2008, 46, 1159–1169. [Google Scholar] [CrossRef]
- Salah, M. A Laboratory Automotive Suspension Test Rig: Design, Implementation and Integration. Jordan J. Mech. Ind. Eng. 2017, 11, 67–71. [Google Scholar]
- Mitra, A.C.; Kiranchand, G.R.; Soni, T.; Banerjee, N. Design of experiments for optimization of automotive suspension system using quarter car test rig. Procedia Eng. 2016, 144, 1102–1109. [Google Scholar] [CrossRef] [Green Version]
- Shing, C.; Cheung, K.; Tanveer, O.; Mingzhou, Y. Design, Modelling, and Control of a Quarter-Car Suspension System; University of Hong Kong: Hong Kong, China, 2016. [Google Scholar]
- Jugulkar, L.M.; Singh, S.; Sawant, S.M. Analysis of suspension with variable stiffness and variable damping force for automotive applications. Adv. Mech. Eng. 2016, 8, 1687814016648638. [Google Scholar] [CrossRef] [Green Version]
- Patil, S.A.; Joshi, S.G. Experimental analysis of 2 DOF quarter-car passive and hydraulic active suspension systems for ride comfort. Syst. Sci. Control Eng. Open Access J. 2014, 2, 621–631. [Google Scholar] [CrossRef] [Green Version]
- Quanser Innovate and Educate. Active Suspension System—User Manual; Quanser Innovate and Educate: Markham, ON, Canada, 2013. [Google Scholar]
- Gao, W.; Zhang, N.; Du, H.P. A Half-Car Model for Dynamic Analysis of Vehicles with Random Parameters. In Proceedings of the 5th Australasian Congress on Applied Mechanics (ACAM 2007), Brisbane, Australia, 10–12 December 2007; Volume 1, pp. 595–600. [Google Scholar]
- Patel, C.B.; Gohil, P.P.; Borhade, B. Modelling and vibration analysis of a road profile measuring system. Int. J. Automot. Mech. Eng. 2010, 1, 13–28. [Google Scholar] [CrossRef]
- Mehmood, A.; Khan, A.A.; Khan, A.A. Vibration analysis of damping suspension using car models. Int. J. Innov. Sci. Res. 2014, 9, 202–211. [Google Scholar]
- Faheem, A.; Alam, F.; Thomas, V. The Suspension Dynamic Analysis for a Quarter Car Model and Half Car Model. In Proceedings of the 3rd BSME-ASME International Conference on Thermal Engineering, Dhaka, Bangladesh, 20–22 December 2006; pp. 20–22. [Google Scholar]
- Sapiński, B.; Martynowicz, P. Vibration control in a pitch-plane suspension model with MR shock absorbers. J. Theor. Appl. Mech. 2005, 43, 655–674. [Google Scholar]
- Chavan, S.P.; Sawant, S.H.; Tamboli, J.A. Experimental Verification of Passive Quarter Car Vehicle Dynamic System Subjected to Harmonic Road Excitation with Nonlinear Parameters. IOSR J. Mech. Civ. Eng. IOSR-JMCE 2013, 39–45. Available online: https://pdfs.semanticscholar.org/89dc/82329e3c6b175e16f1be992271bbec1e1bcb.pdf (accessed on 17 November 2018).
- Institution, B.S. Guide to Measurement and Evaluation of Human Exposure to Whole-body Mechanical Vibration and Repeated Shock; British Standards Institution: London, UK, 1999. [Google Scholar]
- Mitra, A.; Benerjee, N.; Khalane, H.A.; Sonawane, M.A.; Joshi, D.R.; Bagul, G.R. Simulation and Analysis of Full Car Model for various Road profile on a analytically validated MATLAB/SIMULINK model. IOSR J. Mech. Civ. Eng. IOSR-JMCE 2013, 22–33. Available online: https://pdfs.semanticscholar.org/3276/000fb6203692f697cd326148a0e52450fcc3.pdf (accessed on 11 November 2018).
- Raju, A.B.; Venkatachalam, R. Analysis of Vibrations of Automobile Suspension System Using Full-car Model. Int. J. Sci. Eng. Res. 2013, 4, 2105–2111. [Google Scholar]
- Rajale, R.; Jagtap, K.K.; Ahmednagar, S.C.; Nagarkar, M.P. Mathematical Modelling and Simulation of Full Car Suspension System. Available online: https://www.ijiert.org/admin/papers/1452796794_ICITDCEME-15.pdf (accessed on 13 November 2018).
- Iyer, A.R.; Venkatachalam, R.; Balaraju, A. Analysis of Optimum Suspension Parameters of a Semi-Independently Suspended Automobile. Int. J. Innov. Res. Sci. Eng. Technol. 2014, 3, 12047–12053. [Google Scholar]
- Mahala, K.M.; Gadkari, P.; Deb, A. Mathematical Models for Designing Vehicles for Ride Comfort. In Proceedings of the ICORD 09 2nd International Conference on Research into Design, Bangalore, India, 7–9 January 2009. [Google Scholar]
- EIA. Use of Energy in the United States Explained, Energy Used for Transportation; Independent Statistics and Analysis: Washington, DC, USA, 2019. Available online: https://www.eia.gov/energyexplained/?page=us_energy_transportation#tab1 (accessed on 15 September 2018).
- Zhang, P.S. Design of Electromagnetic Shock Absorbers for Energy Harvesting from Vehicle Suspensions. Master’s Thesis, The Graduate School in Mechanical Engineering Department, Stony Brook University, Stony Brook, NY, USA, 2010. [Google Scholar]
- Velinsky, S.A.; White, R.A. Vehicle energy dissipation due to road roughness. Veh. Syst. Dyn. 1980, 9, 359–384. [Google Scholar] [CrossRef]
- Wei, C.; Taghavifar, H. A novel approach to energy harvesting from vehicle suspension system: Half-vehicle model. Energy 2017, 134, 279–288. [Google Scholar] [CrossRef]
- Jacota, V.-G. Evaluation the Dissipated Energy by the Automobile Dampers. In Proceedings of the International Conference and Exhibition on Automobile Engineering, Valencia, Spain, 1–2 September 2015. [Google Scholar]
- Abdelkareem, M.A.; Xu, L.; Ali, M.K.A.; Hassan, M.A.; Elagouz, A.; Zou, J. On-field Measurements of the Dissipated Vibrational Power of an SUV car Traditional Viscous Shock Absorber. In Proceedings of the ASME 2018 International Design Engineering Technical Conferences and Computers and Information in Engineering Conference, Quebec City, QC, Canada, 26–29 August 2018; p. V003T01A010. [Google Scholar]
- Segel, L.; Lu, X. Vehicular resistance to motion as influenced by road roughness and highway alignment. Aust. Road Res. 1982, 12, 211–222. [Google Scholar]
- Zuo, L.; Zhang, P.-S. Energy harvesting, ride comfort, and road handling of regenerative vehicle suspensions. J. Vib. Acoust. 2013, 135, 011002. [Google Scholar] [CrossRef]
- Xiao, H.; Wang, X.; John, S. A dimensionless analysis of a 2DOF piezoelectric vibration energy harvester. Mech. Syst. Signal Process. 2015, 58, 355–375. [Google Scholar] [CrossRef]
- Al-Yafeai, D.; Darabseh, T.; Mourad, A.-H.I. Quarter vs. Half Car Model Energy Harvesting Systems. In Proceedings of the 2019 Advances in Science and Engineering Technology International Conferences (ASET), Dubai, UAE, 26 March–10 April 2019; pp. 1–5. [Google Scholar]
- Lafarge, B.; Grondel, S.; Delebarre, C.; Cattan, E. A validated simulation of energy harvesting with piezoelectric cantilever beams on a vehicle suspension using Bond Graph approach. Mechatronics 2018, 53, 202–214. [Google Scholar] [CrossRef]
- Behera, M.M. Piezoelectric Energy Harvesting from Vehicle Wheels. Int. J. Eng. Res. Technol. 2015, 4, 1–4. [Google Scholar]
- Gu, L.; Livermore, C. Passive self-tuning energy harvester for extracting energy from rotational motion. Appl. Phys. Lett. 2010, 97, 081904. [Google Scholar] [CrossRef]
- Hu, Y.; Xu, C.; Zhang, Y.; Lin, L.; Snyder, R.L.; Wang, Z.L. A Nanogenerator for Energy Harvesting from a Rotating Tire and its Application as a Self-Powered Pressure/Speed Sensor. Adv. Mater. 2011, 23, 4068–4071. [Google Scholar] [CrossRef]
- Zhang, Y.; Zheng, R.; Shimono, K.; Kaizuka, T.; Nakano, K. Effectiveness testing of a piezoelectric energy harvester for an automobile wheel using stochastic resonance. Sensors 2016, 16, 1727. [Google Scholar] [CrossRef] [Green Version]
- Consortium, A. Intelligent Tyre for Accident-Free Traffic; Technical Research Centre of Finland VTT: Espoo, Finland, 2003. [Google Scholar]
- Lee, H.; Jang, H.; Park, J.; Jeong, S.; Park, T.; Choi, S. Design of a piezoelectric energy-harvesting shock absorber system for a vehicle. Integr. Ferroelectr. 2013, 141, 32–44. [Google Scholar] [CrossRef]
- Lafarge, B.; Delebarre, C.; Grondel, S.; Curea, O.; Hacala, A. Analysis and optimization of a piezoelectric harvester on a car damper. Phys. Procedia 2015, 70, 970–973. [Google Scholar] [CrossRef]
- Ali, S.F.; Adhikari, S. Energy harvesting dynamic vibration absorbers. J. Appl. Mech. 2013, 80, 041004. [Google Scholar] [CrossRef]
- Madhav, C.; Ali, S.F. Harvesting energy from vibration absorber under random excitations. IFAC-PapersOnLine 2016, 49, 807–812. [Google Scholar] [CrossRef]
- Arizti, M. Harvesting Energy from Vehicle Suspension. Master’s Thesis, Mechanical Engineering, Tampereen University, Tampereen, Finland, 2010. [Google Scholar]
- Hendrowati, W.; Guntur, H.L.; Sutantra, I.N. Design, modeling and analysis of implementing a multilayer piezoelectric vibration energy harvesting mechanism in the vehicle suspension. Engineering 2012, 4, 728. [Google Scholar] [CrossRef] [Green Version]
- Múčka, P. Energy-harvesting potential of automobile suspension. Veh. Syst. Dyn. 2016, 54, 1651–1670. [Google Scholar] [CrossRef]
- Abdelkareem, M.A.; Xu, L.; Ali, M.K.; Elagouz, A.; Mi, J.; Guo, S.; Liu, Y.; Zuo, L. Vibration energy harvesting in automotive suspension system: A detailed review. Appl. Energy 2018, 229, 672–699. [Google Scholar] [CrossRef]
- Zhang, R.; Wang, X.; John, S. A comprehensive review of the techniques on regenerative shock absorber systems. Energies 2018, 11, 1167. [Google Scholar] [CrossRef] [Green Version]
- Eriksson, J.; Piroti, S. Review of Methods for Energy Harvesting from a Vehicle Suspension System. Available online: http://www.diva-portal.org/smash/record.jsf?pid=diva2%3A1182890&dswid=6114 (accessed on 24 December 2016).
- Jin-qiu, Z.; Zhi-zhao, P.; Lei, Z.; Yu, Z. A review on Energy-Regenerative Suspension Systems for Vehicles. In Proceedings of the World Congress on Engineering, London, UK, 3–5 July 2013; Volume 3, pp. 3–5. [Google Scholar]
- Amer, N.H.; Ramli, R.; Isa, H.M.; Mahadi, W.N.L.; Abidin, M.A.Z. A review of energy regeneration capabilities in controllable suspension for passengers’ car. Energy Educ. Sci. Technol. Energy Sci. Res. 2012, 30, 143–158. [Google Scholar]
- Sodano, H.A.; Inman, D.J.; Park, G. Comparison of piezoelectric energy harvesting devices for recharging batteries. J. Intell. Mater. Syst. Struct. 2005, 16, 799–807. [Google Scholar] [CrossRef]
- Priya, S. Advances in energy harvesting using low profile piezoelectric transducers. J. Electroceram. 2007, 19, 167–184. [Google Scholar] [CrossRef]
- Guan, M.J.; Liao, W.H. On the efficiencies of piezoelectric energy harvesting circuits towards storage device voltages. Smart Mater. Struct. 2007, 16, 498. [Google Scholar] [CrossRef]
- Ottman, G.; Bhatt, A.; Hofmann, H.; Lesieutre, G. Adaptive Piezoelectric Energy Harvesting Circuit for Wireless, Remote Power Supply. In Proceedings of the 2002 19th AIAA Applied Aerodynamics Conference, Anaheim, CA, USA, 11–14 June 2001; p. 1505. [Google Scholar]
- Ottman, G.K.; Hofmann, H.F.; Lesieutre, G.A. Optimized piezoelectric energy harvesting circuit using step-down converter in discontinuous conduction mode. IEEE Trans. Power Electron. 2003, 18, 696–703. [Google Scholar] [CrossRef]
- Dwari, S.; Parsa, L. An efficient AC–DC step-up converter for low-voltage energy harvesting. IEEE Trans. Power Electron. 2010, 25, 2188–2199. [Google Scholar] [CrossRef]
- Peters, C.; Handwerker, J.; Maurath, D.; Manoli, Y. A sub-500 mV highly efficient active rectifier for energy harvesting applications. IEEE Trans. Circuits Syst. Regul. Pap. 2011, 58, 1542–1550. [Google Scholar] [CrossRef]
- Ramadass, Y.K.; Chandrakasan, A.P. An efficient piezoelectric energy harvesting interface circuit using a bias-flip rectifier and shared inductor. IEEE J. Solid-State Circuits 2010, 45, 189–204. [Google Scholar] [CrossRef] [Green Version]
- Lefeuvre, E.; Audigier, D.; Richard, C.; Guyomar, D. Buck-boost converter for sensorless power optimization of piezoelectric energy harvester. IEEE Trans. Power Electron. 2007, 22, 2018–2025. [Google Scholar] [CrossRef]
- Kong, N.A.; Ha, D.S.; Erturk, A.; Inman, D.J. Resistive impedance matching circuit for piezoelectric energy harvesting. J. Intell. Mater. Syst. Struct. 2010, 21, 1293–1302. [Google Scholar] [CrossRef]
- Guyomar, D.; Sebald, G.; Pruvost, S.; Lallart, M.; Khodayari, A.; Richard, C. Energy harvesting from ambient vibrations and heat. J. Intell. Mater. Syst. Struct. 2009, 20, 609–624. [Google Scholar] [CrossRef]
- Lefeuvre, E.; Badel, A.; Richard, C.; Guyomar, D. Piezoelectric energy harvesting device optimization by synchronous electric charge extraction. J. Intell. Mater. Syst. Struct. 2005, 16, 865–876. [Google Scholar] [CrossRef]
- Umeda, M.; Nakamura, K.; Ueha, S. Energy storage characteristics of a piezo-generator using impact induced vibration. Jpn. J. Appl. Phys. 1997, 36, 3146. [Google Scholar] [CrossRef]
- Kasyap, A.V.S.; Lim, J.; Johnson, D.; Horowitz, S.; Nishida, T.; Ngo, K.; Cattafesta, L. Energy Reclamation from a Vibrating Piezoceramic Composite Beam. In Proceedings of the 9th International Congress on Sound and Vibration, Orlando, FL, USA, 8–11 July 2002; Volume 9, pp. 36–43. [Google Scholar]
- Starner, T. Human-powered wearable computing. IBM Syst. J. 1996, 35, 618–629. [Google Scholar] [CrossRef]
- Elvin, N.G.; Elvin, A.A.; Spector, M. A self-powered mechanical strain energy sensor. Smart Mater. Struct. 2001, 10, 293. [Google Scholar] [CrossRef]
- Sodano, H.A.; Magliula, E.A.; Park, G.; Inman, D.J. Electric Power Generation from Piezoelectric Materials. In 13th International Conference on Adaptive Structures and Technologies; CRC Press: Boca Raton, FL, USA, 2002; pp. 7–9. [Google Scholar]
- Chen, H.; Cong, T.N.; Yang, W.; Tan, C.; Li, Y.; Ding, Y. Progress in electrical energy storage system: A critical review. Prog. Nat. Sci. 2009, 19, 291–312. [Google Scholar] [CrossRef]
- Casciati, F.; Faravelli, L.; Rossi, R. Architecture Optimization for Wireless Sensor Networks. In Smart Structures and Materials 2005: Sensors and Smart Structures Technologies for Civil, Mechanical, and Aerospace Systems; International Society for Optics and Photonics: Bellingham, WA, USA, 2005; Volume 5765, pp. 253–258. [Google Scholar]
- Jiang, X.; Polastre, J.; Culler, D. Perpetual Environmentally Powered Sensor Networks. In Proceedings of the 4th International Symposium on Information Processing in Sensor Networks, Boise, ID, USA, 15 April 2005; p. 65. [Google Scholar]
- Zhao, Z.; Wang, S.; You, C. Piezoelectric micro-power generation to charge supercapacitor with optimized duty cycle. J. Intell. Mater. Syst. Struct. 2010, 21, 1131–1140. [Google Scholar] [CrossRef]
- Li, H.; Tian, C.; Deng, Z.D. Energy harvesting from low frequency applications using piezoelectric materials. Appl. Phys. Rev. 2014, 1, 041301. [Google Scholar] [CrossRef] [Green Version]
- Guan, M.J.; Liao, W.-H. Characteristics of energy storage devices in piezoelectric energy harvesting systems. J. Intell. Mater. Syst. Struct. 2008, 19, 671–680. [Google Scholar] [CrossRef]
- Kötz, R.; Carlen, M. Principles and applications of electrochemical capacitors. Electrochim. Acta 2000, 45, 2483–2498. [Google Scholar] [CrossRef]
- Halper, M.S.; Ellenbogen, J.C. Supercapacitors: A Brief Overview; MITRE Nanosystems Group: Bedford, MA, USA, 2006; pp. 1–34. [Google Scholar]
- Tolentino, I.M.; Talampas, M.R. Design, Development, and Evaluation of a Self-Powered GPS Tracking System for Vehicle Security. In Proceedings of the 2012 IEEE SENSORS, Taipei, Taiwan, 28–31 October 2012; pp. 1–4. [Google Scholar]
- Singh, I. Piezoelectric Energy Generating Roads Proposed for California. Available online: https://inhabitat.com/piezoelectric-energy-generating-roads-proposed-for-california/ (accessed on 14 February 2011).
- Inhabitate. Researchers Roll out Energy Generating Roads. Available online: https://inhabitat.com/energy-generating-roads-by-innowattech/ (accessed on 16 December 2008).
- Zhao, Z.; Wang, T.; Shi, J.; Zhang, B.; Zhang, R.; Li, M.; Wen, Y. Analysis and application of the piezoelectric energy harvester on light electric logistics vehicle suspension systems. Energy Sci. Eng. 2019. [Google Scholar] [CrossRef] [Green Version]
- Ksrmce, K. Piezoelectric Power Generation in Tires. In Proceedings of the Smart Materials & Structures/NDT in Aerospace/NDT in Canada, Montreal, QC, Canada, 2–4 November 2011. [Google Scholar]
- Piyush, P.; Pandey, A. Use of Vibration Energy for Charging Electric Car. Int. J. Mech. Eng. Technol. 2016, 7, 59–65. [Google Scholar]
- Walubita, L.F.; Djebou, S.; Clement, D.; Faruk, A.N.; Lee, S.I.; Dessouky, S.; Hu, X. Prospective of societal and environmental benefits of piezoelectric technology in road energy harvesting. Sustainability 2018, 10, 383. [Google Scholar] [CrossRef] [Green Version]
- Elgandor, E.; Kolkailah, F.A.; Mourad, A.-I. Sensors Location Effect on the Dynamic Behavior of the Composite Structure with Flaw Detection. In Proceedings of the 44th International SAMPE (Society for the Advancement of Material and Process Engineering) Symposium and Exhibition, Long Beach, CA, USA, 23–27 May 1999; pp. 358–439. [Google Scholar]
Figure 1.
Power density vs. voltage of different energy harvesting mechanisms [35].
Figure 1.
Power density vs. voltage of different energy harvesting mechanisms [35].

Figure 2.
Energy harvesting from different mechanical energy sources and its applications.

Figure 3.
Direction of polarization for a piezoelectric material.

Figure 4.
Modes of a piezoelectric material. (a) 31 mode. (b) 33 mode.

Figure 5.
Different configurations of bimorph and unimorph. (a) Bimorph configuration in a series connection. (b) Bimorph configuration in a parallel connection. (c) Unimorph configuration.
Figure 5.
Different configurations of bimorph and unimorph. (a) Bimorph configuration in a series connection. (b) Bimorph configuration in a parallel connection. (c) Unimorph configuration.

Figure 6.
Two methods of harvesting energy from the shoe PVDF under the ball of the foot and from PZT materials under the heel [62].
Figure 6.
Two methods of harvesting energy from the shoe PVDF under the ball of the foot and from PZT materials under the heel [62].

Figure 7.
Power-generating floor at Tokyo Station’s Marunouchi North Exit [69].
Figure 7.
Power-generating floor at Tokyo Station’s Marunouchi North Exit [69].

Figure 8.
Energy harvester from road traffic. (a) Piezoelectric stack. (b) Experimental setup [76].
Figure 8.
Energy harvester from road traffic. (a) Piezoelectric stack. (b) Experimental setup [76].

Figure 9.
Quarter car model.

Figure 10.
Different experimental setups of the quarter car model as real tires. (a) Salah model [88]. (b) Mitra et al. model [89]. (c) Shing et al. model [90].

Figure 11.
Different experimental setups of the quarter car model as moving plates. (a) Jugulkar et al. model [91]. (b) Patil and Joshi model [92]. (c) Quanser model [93].

Figure 12.
Half car model. (1) Sprung mass. (2) Front unsprung mass. (3) Rear unsprung mass. (4) Front suspension stiffness. (5) Rear suspension stiffness. (6) Front tire stiffness. (7) Rear tire stiffness. (8) Front suspension damping. (9) Rear suspension damping. (10) Front tire damping. (11) Rear tire damping.

Figure 13.
Different experimental setups of the half car model. (a) Sapiński and Martynowicz model [98]. (b) Chavan et al. model [99].

Figure 14.
Full car model.

Figure 15.
Quarter car model with built-in piezoelectric material in a parallel connection [114].
Figure 15.
Quarter car model with built-in piezoelectric material in a parallel connection [114].

Figure 16.
Half car model with built-in piezoelectric material in a parallel connection [115].
Figure 16.
Half car model with built-in piezoelectric material in a parallel connection [115].

Figure 17.
Quarter car model with built-in piezoelectric material in a series connection.

Figure 18.
Dual-mass piezoelectric bar harvester of a quarter car model. (a) Piezoelectric bar harvester. (b) Quarter car model. (c) Dual-mass piezoelectric energy [30].
Figure 18.
Dual-mass piezoelectric bar harvester of a quarter car model. (a) Piezoelectric bar harvester. (b) Quarter car model. (c) Dual-mass piezoelectric energy [30].

Figure 19.
Car suspension with a piezoelectric cantilever beam [116].
Figure 19.
Car suspension with a piezoelectric cantilever beam [116].

Figure 20.
Three piezoelectric materials located on the tire [117].
Figure 20.
Three piezoelectric materials located on the tire [117].

Figure 21.
A nanogenerator NG in the inner surface of the tire [119].
Figure 21.
A nanogenerator NG in the inner surface of the tire [119].

Figure 22.
Energy harvester at the center of the tire. (a) The actual tire experiment. (b) The experimental setup [120].
Figure 22.
Energy harvester at the center of the tire. (a) The actual tire experiment. (b) The experimental setup [120].

Figure 23.
A piezoelectric material inside the tire surface at the right-hand side and its voltage converter circuit at the left-hand side [121].
Figure 23.
A piezoelectric material inside the tire surface at the right-hand side and its voltage converter circuit at the left-hand side [121].

Figure 24.
Three different piezoelectric energy harvesters. (a) Circular PZT bonded to the top circular tire. (b) PVDF element with a rectifier circuit bonded to the tire. (c) Plastic ribbon with three PVDF bonded to the tire [53].
Figure 24.
Three different piezoelectric energy harvesters. (a) Circular PZT bonded to the top circular tire. (b) PVDF element with a rectifier circuit bonded to the tire. (c) Plastic ribbon with three PVDF bonded to the tire [53].

Figure 25.
Piezoelectric material on the shock absorber. (a) Piezoelectric material between two surfaces. (b) Piezoelectric material on the damper surface [123].
Figure 25.
Piezoelectric material on the shock absorber. (a) Piezoelectric material between two surfaces. (b) Piezoelectric material on the damper surface [123].


Figure 27.
Piezoelectric stack inside the shock absorber tube [126].
Figure 27.
Piezoelectric stack inside the shock absorber tube [126].

Figure 28.
Quarter car model with an ML PZT VEH mechanism [127].
Figure 28.
Quarter car model with an ML PZT VEH mechanism [127].

Figure 29.
Harvested voltage and power of different energy harvesters.

Figure 30.
Piezoelectric energy harvesting circuit.

Figure 31.
Two-stage active rectifier [140].
Figure 31.
Two-stage active rectifier [140].

Figure 32.
Piezoelectric energy harvesting techniques. (a) Parallel SSHI. (b) Series SSHI [144].
Figure 32.
Piezoelectric energy harvesting techniques. (a) Parallel SSHI. (b) Series SSHI [144].

Figure 33.
Piezoelectric energy harvesting system. (a) Experimental set up, and (b) different storage devices [156].
Figure 33.
Piezoelectric energy harvesting system. (a) Experimental set up, and (b) different storage devices [156].


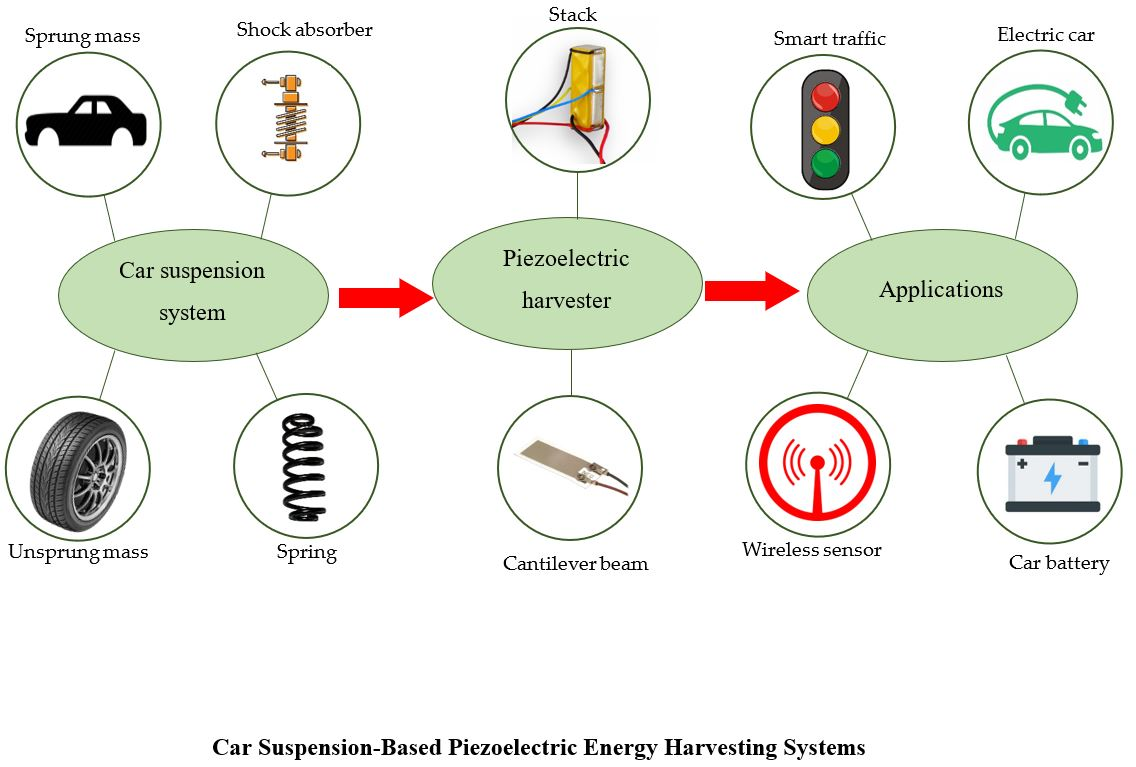
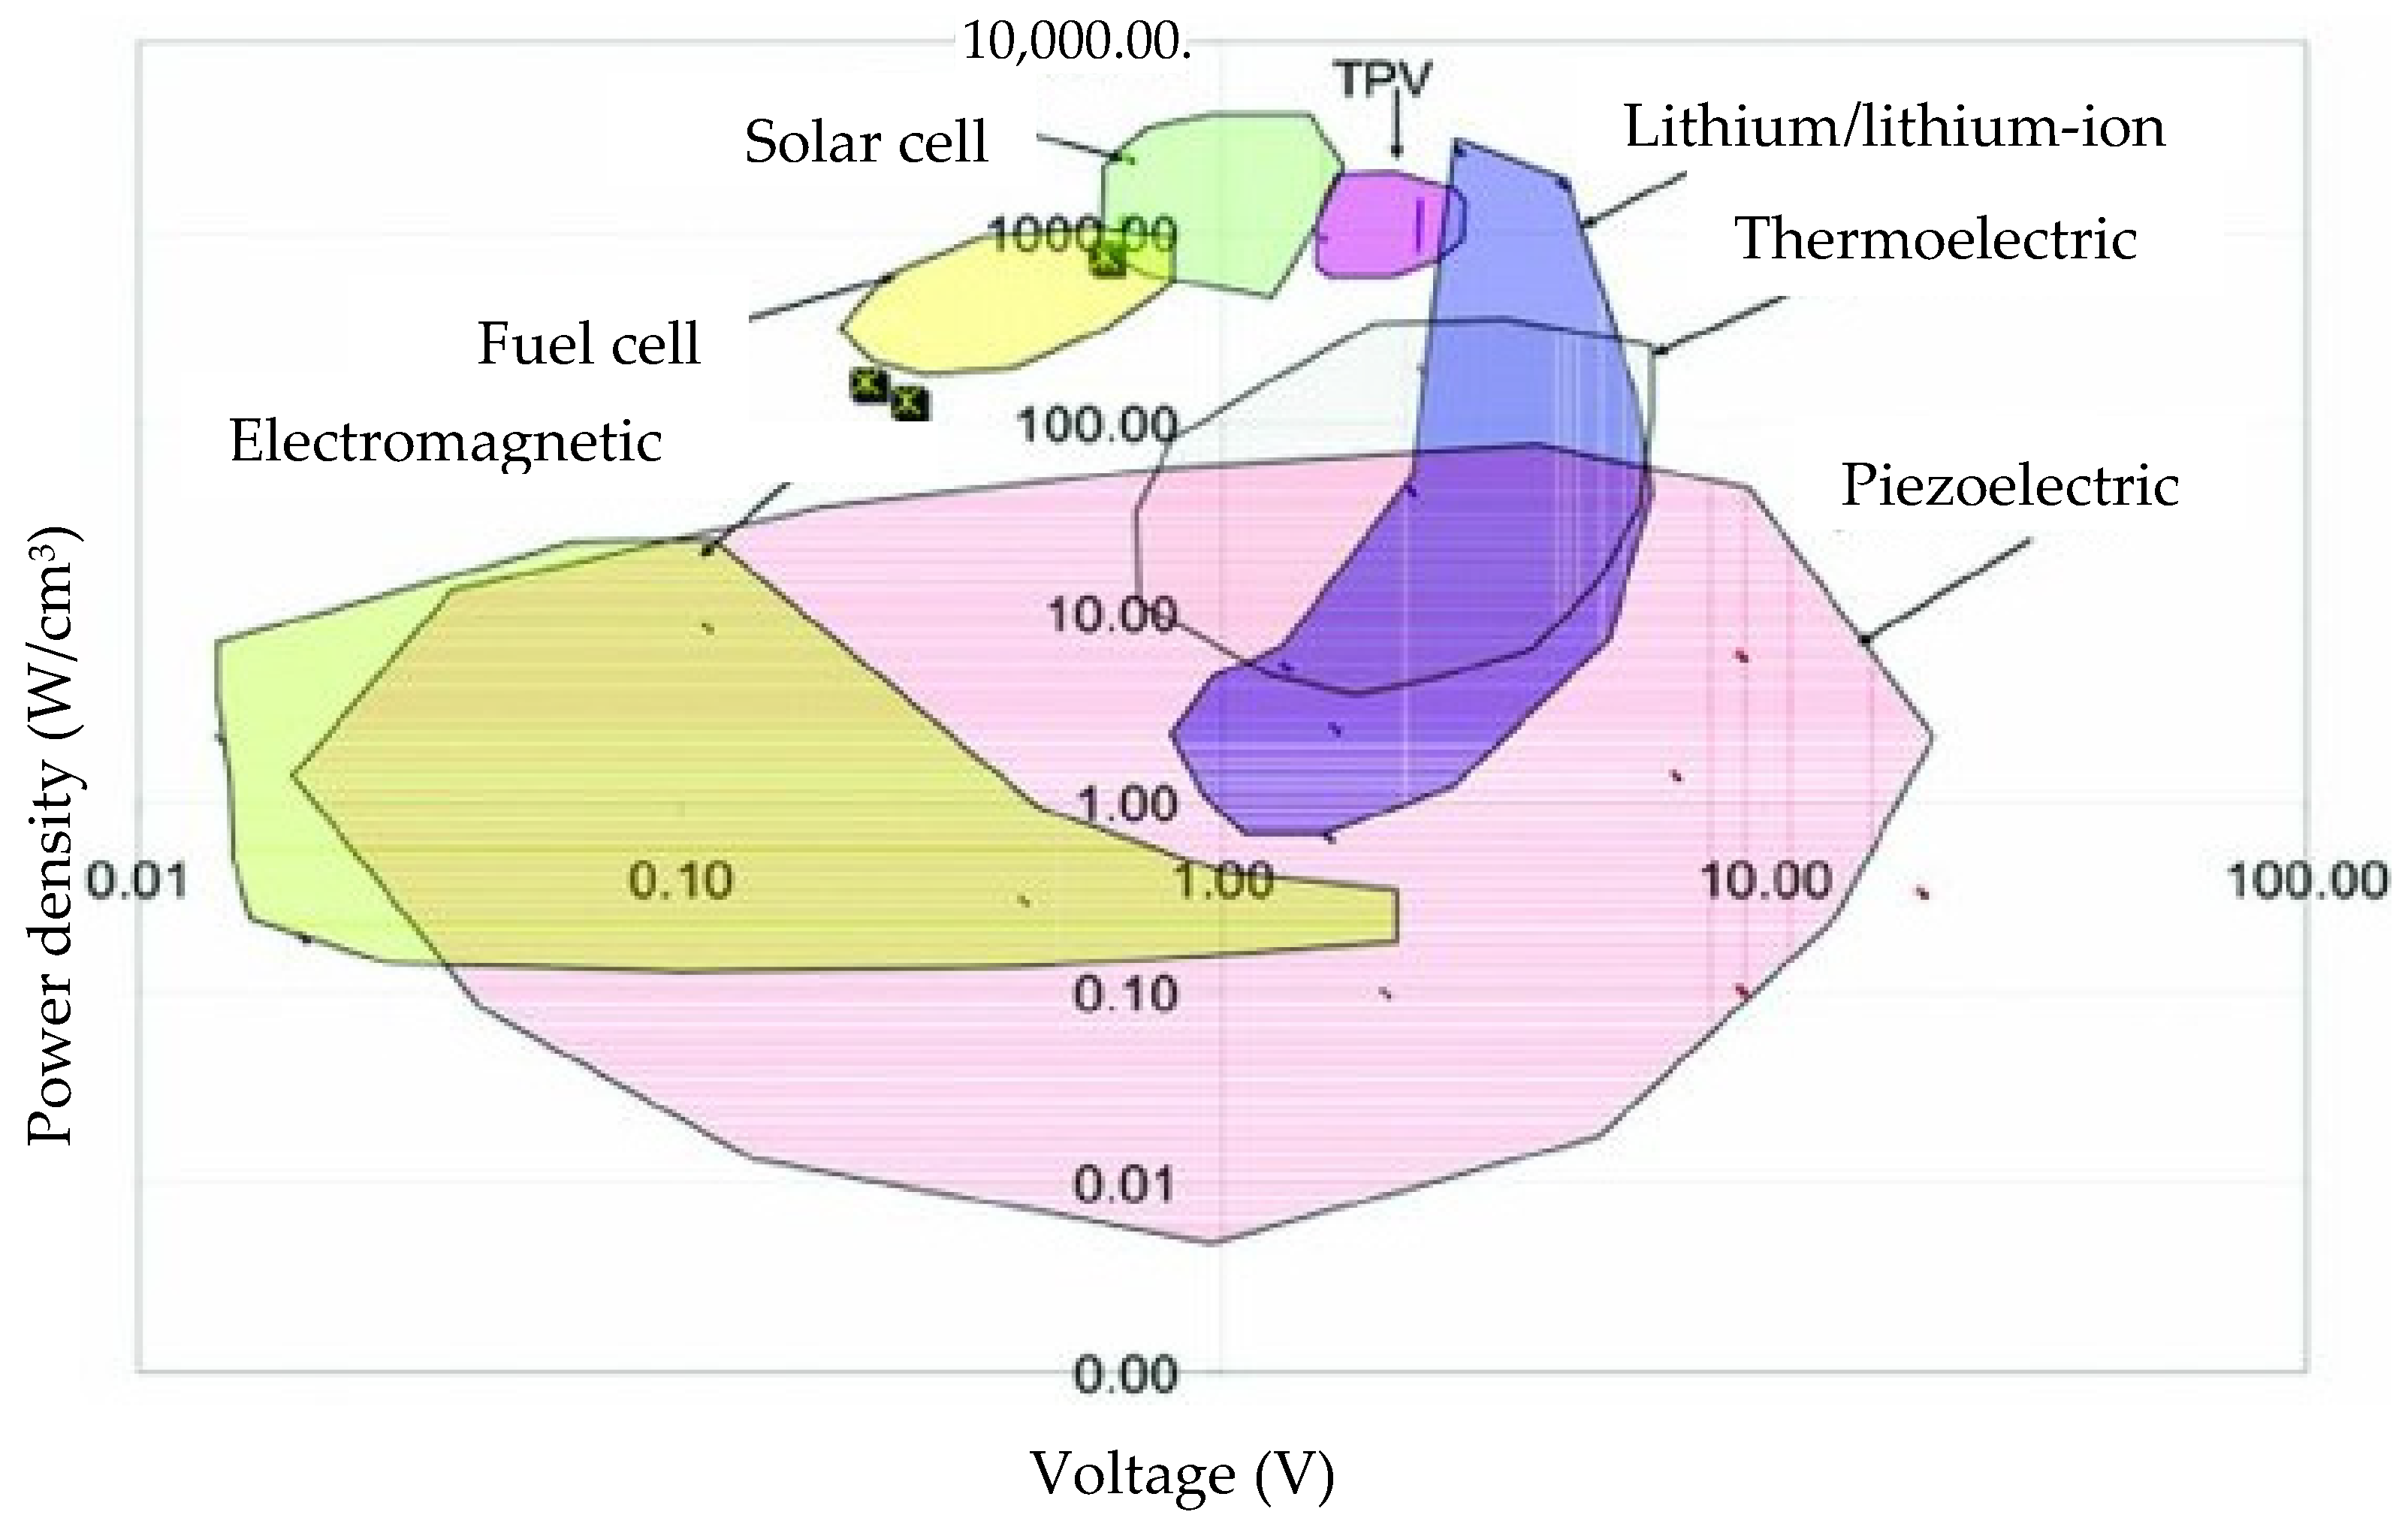
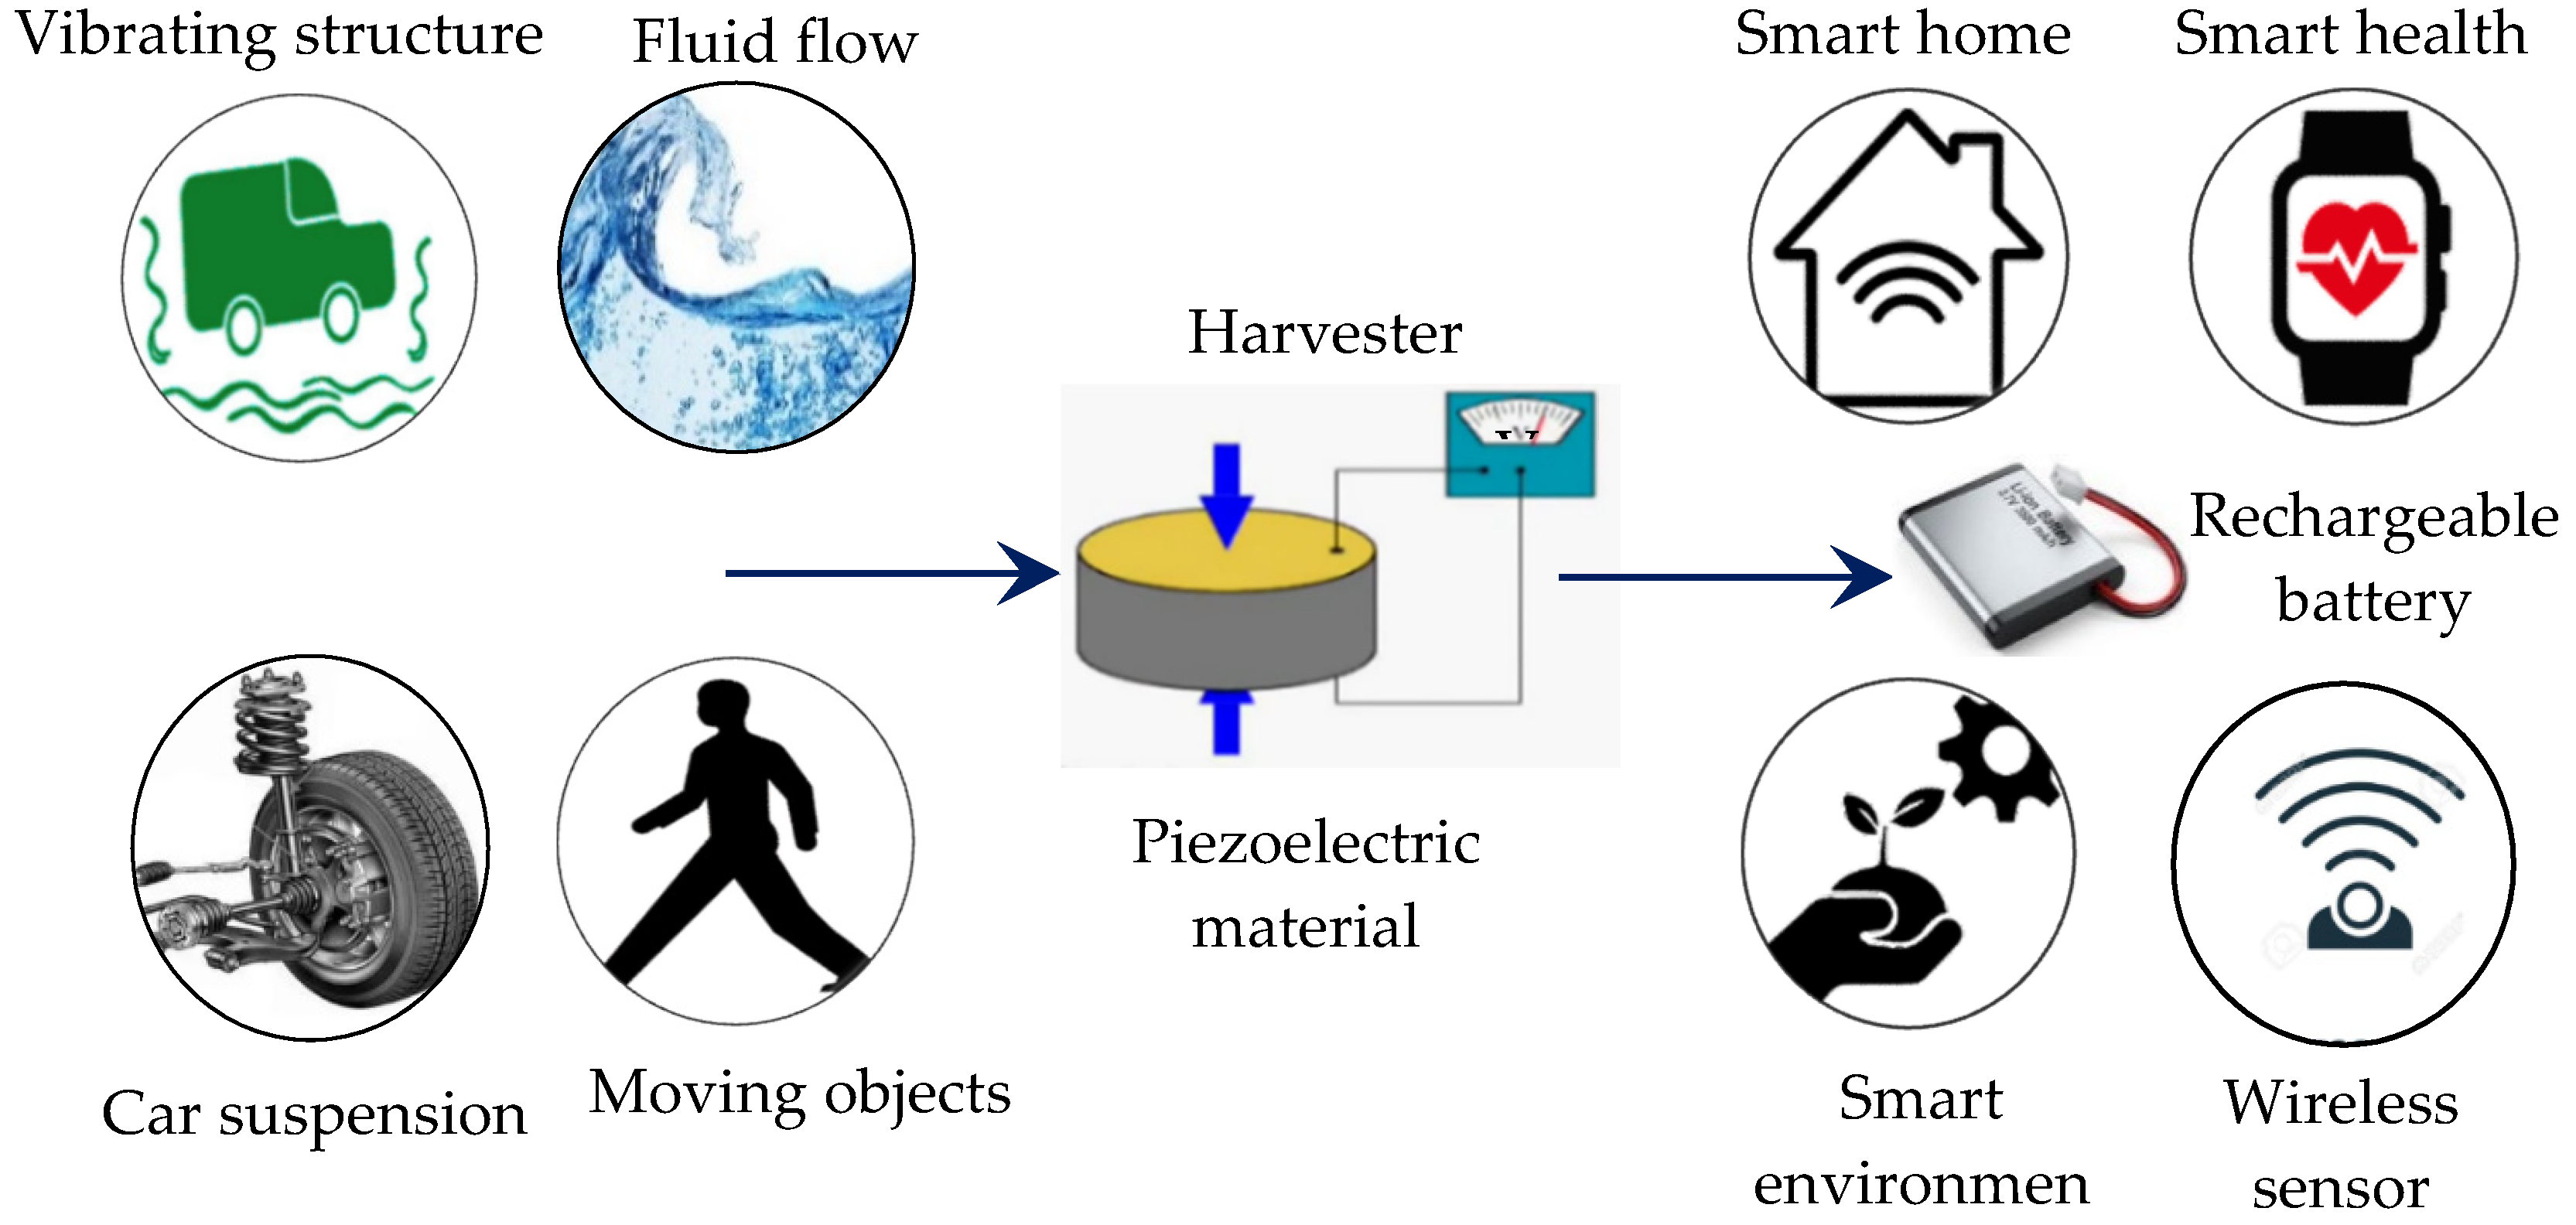
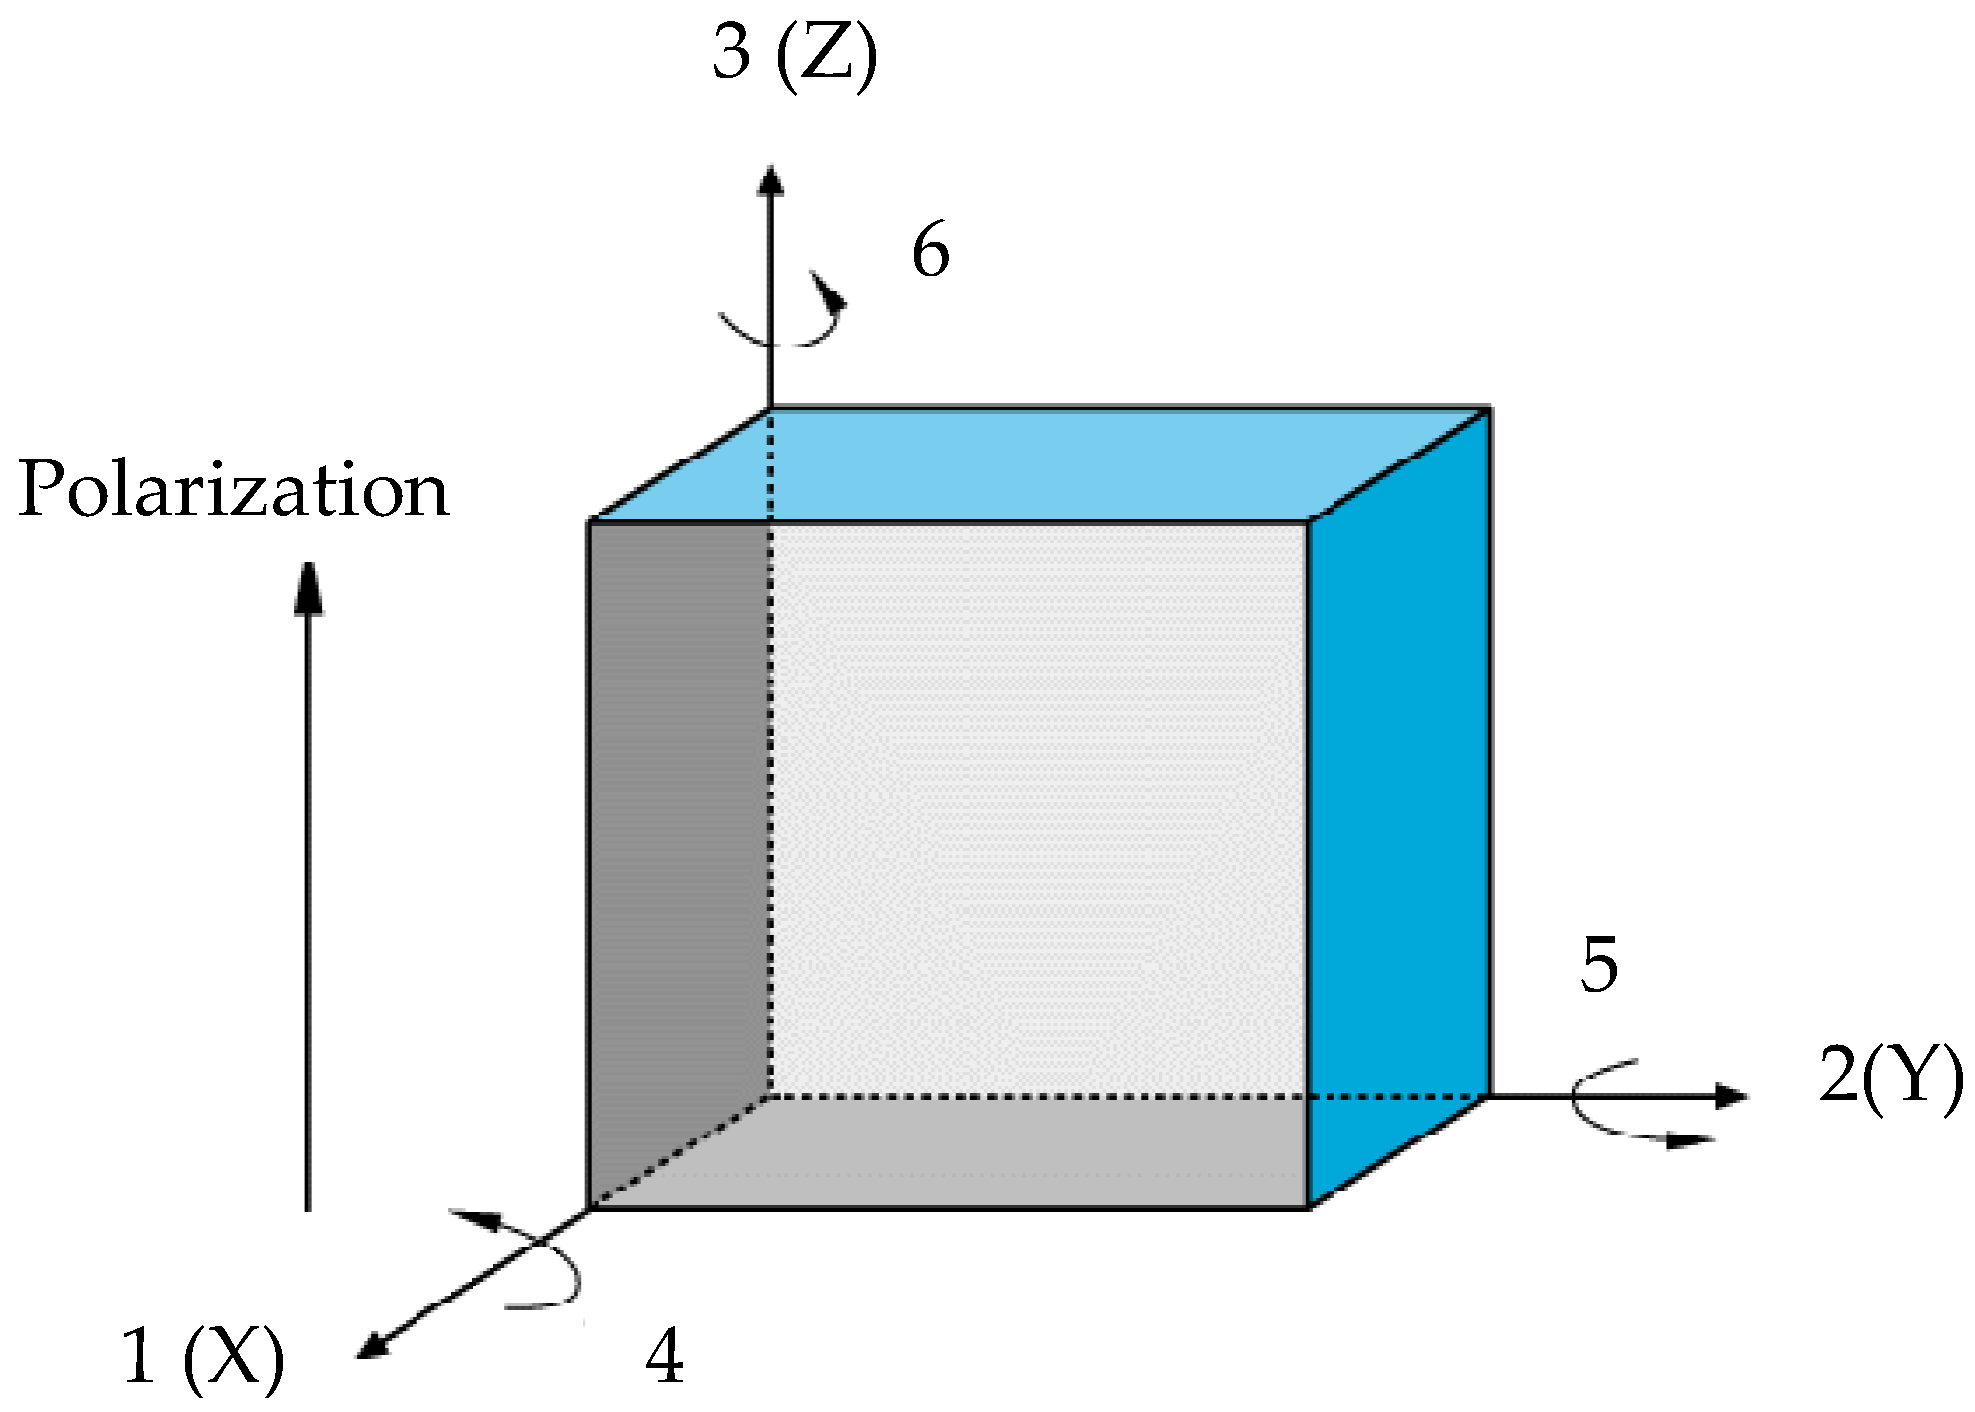
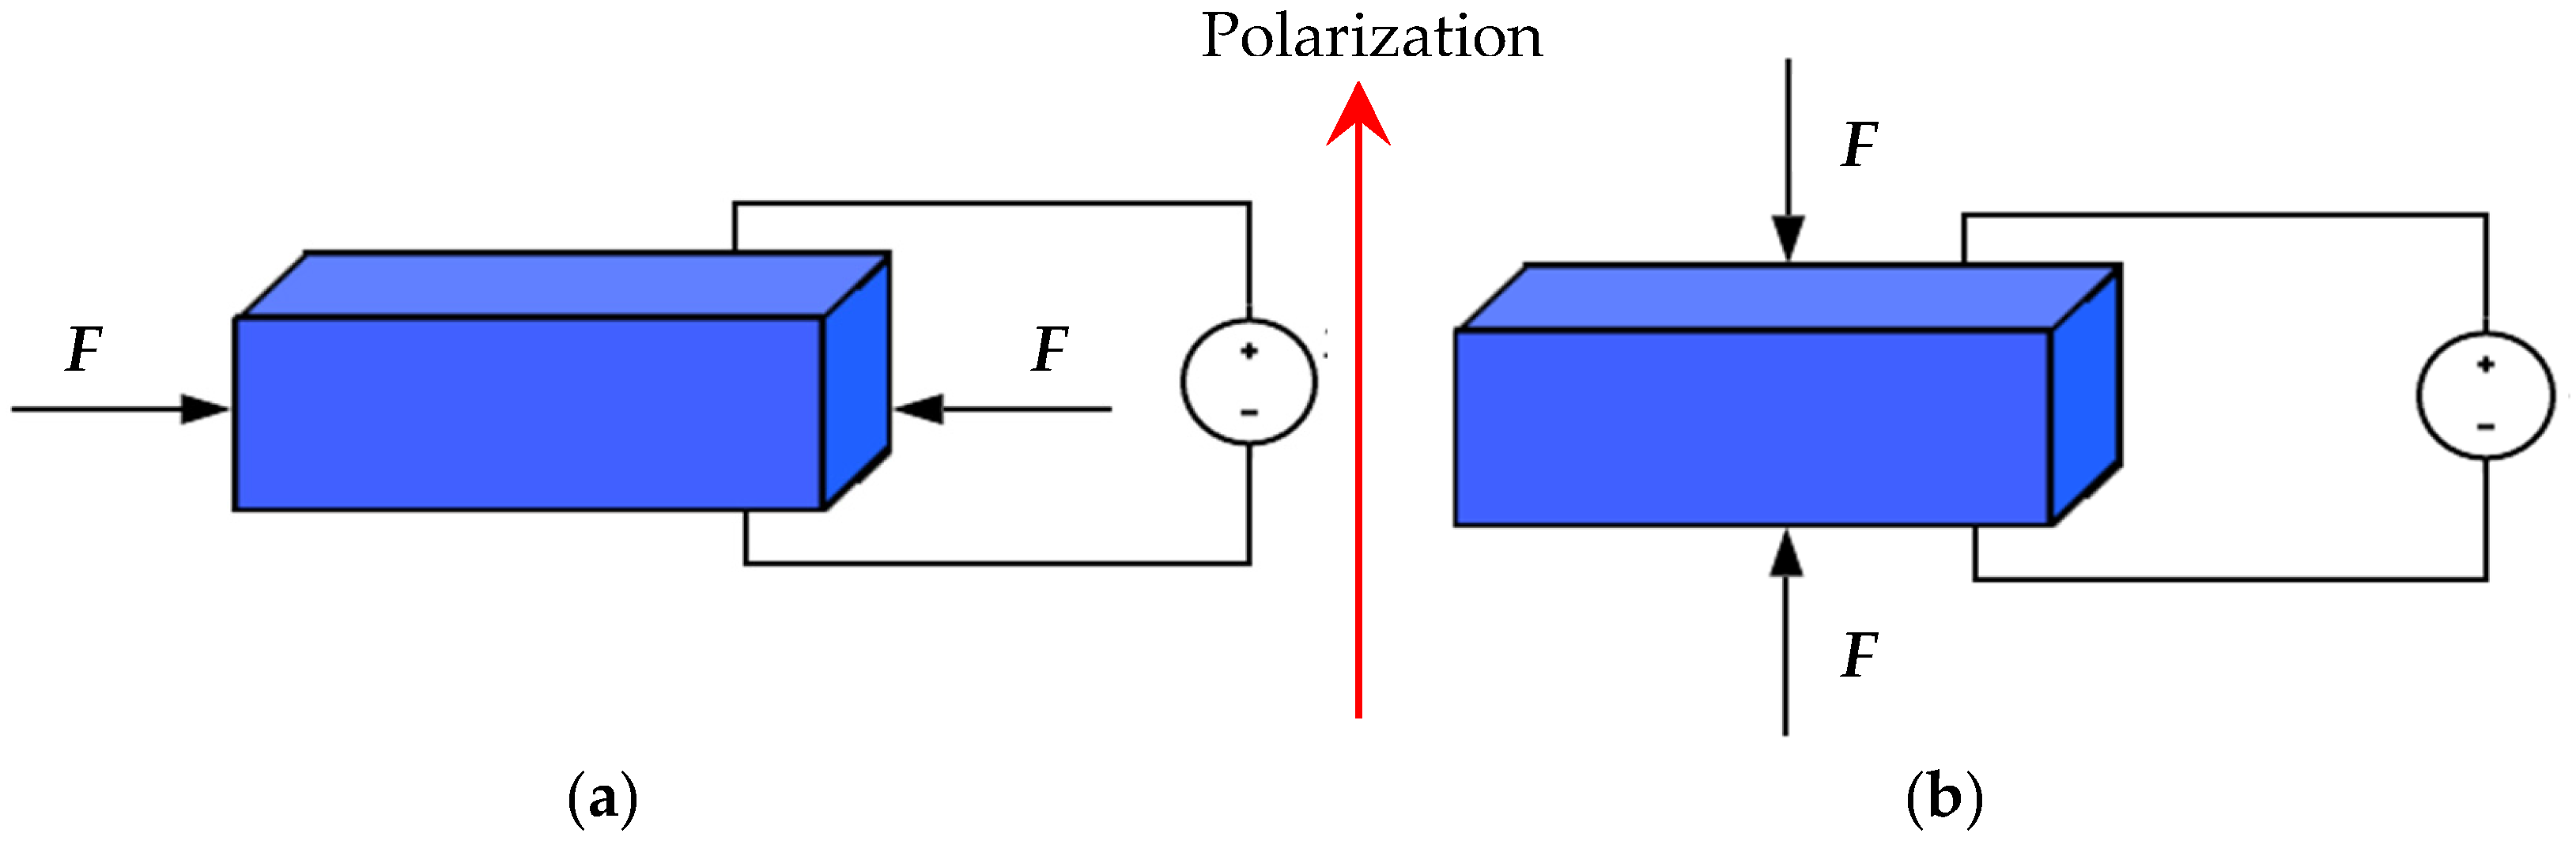
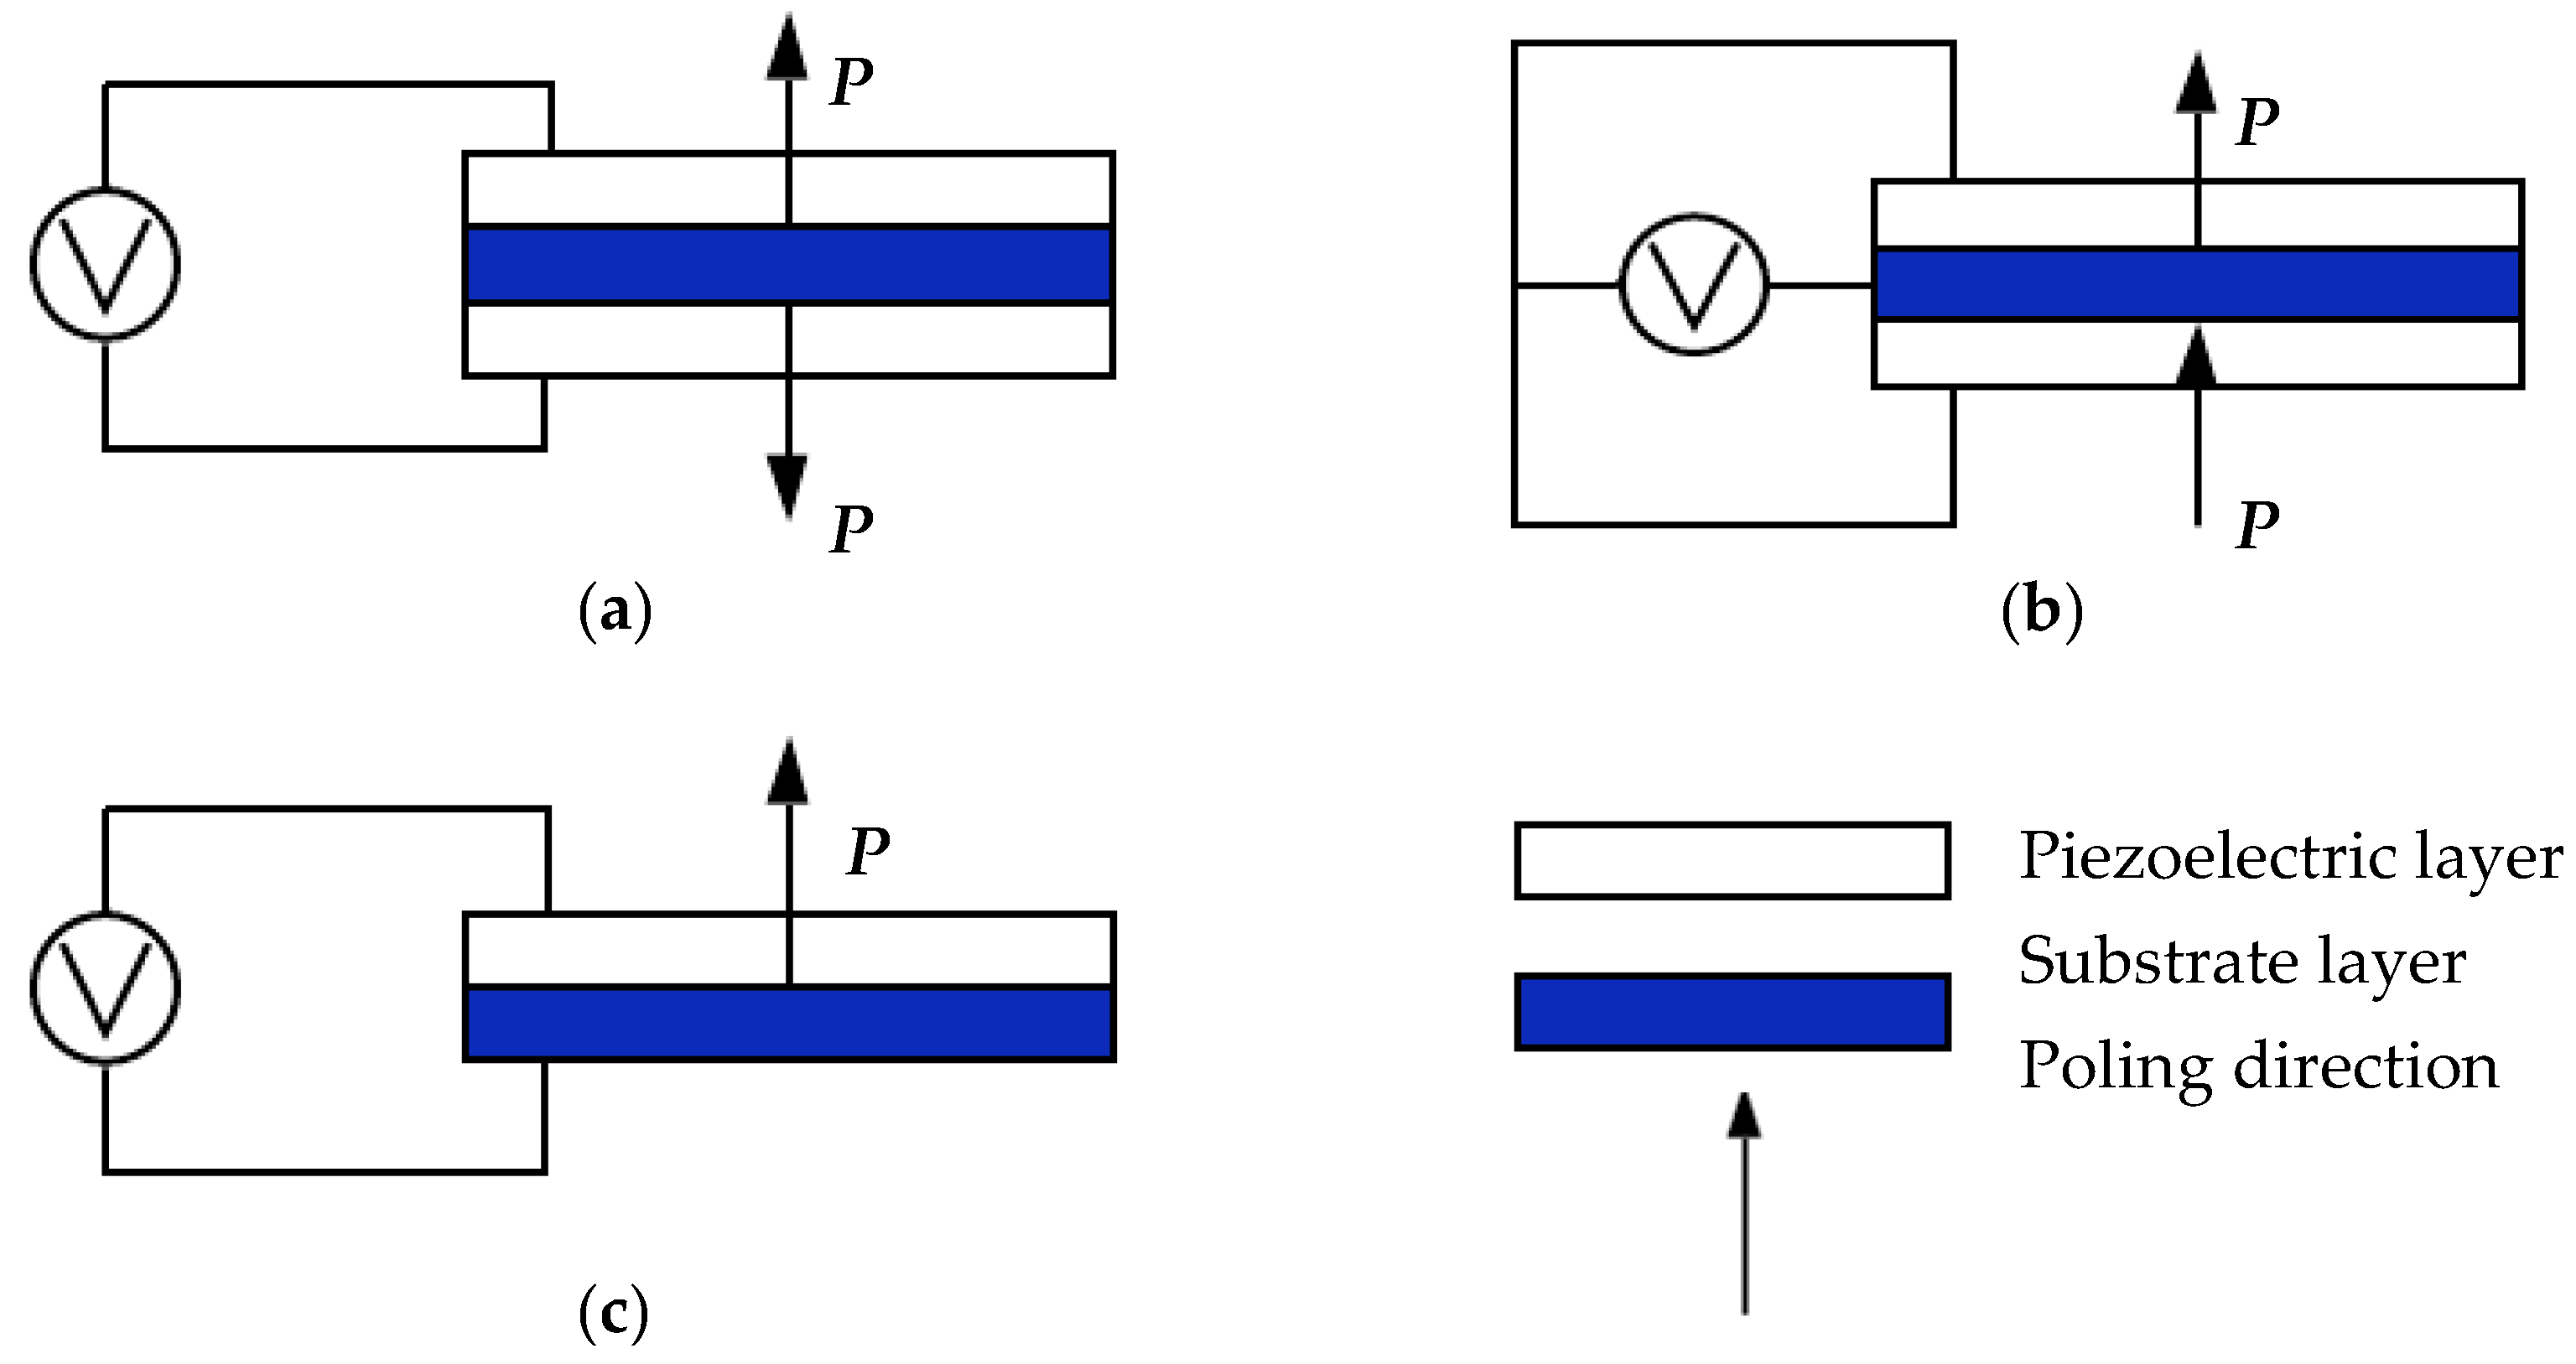
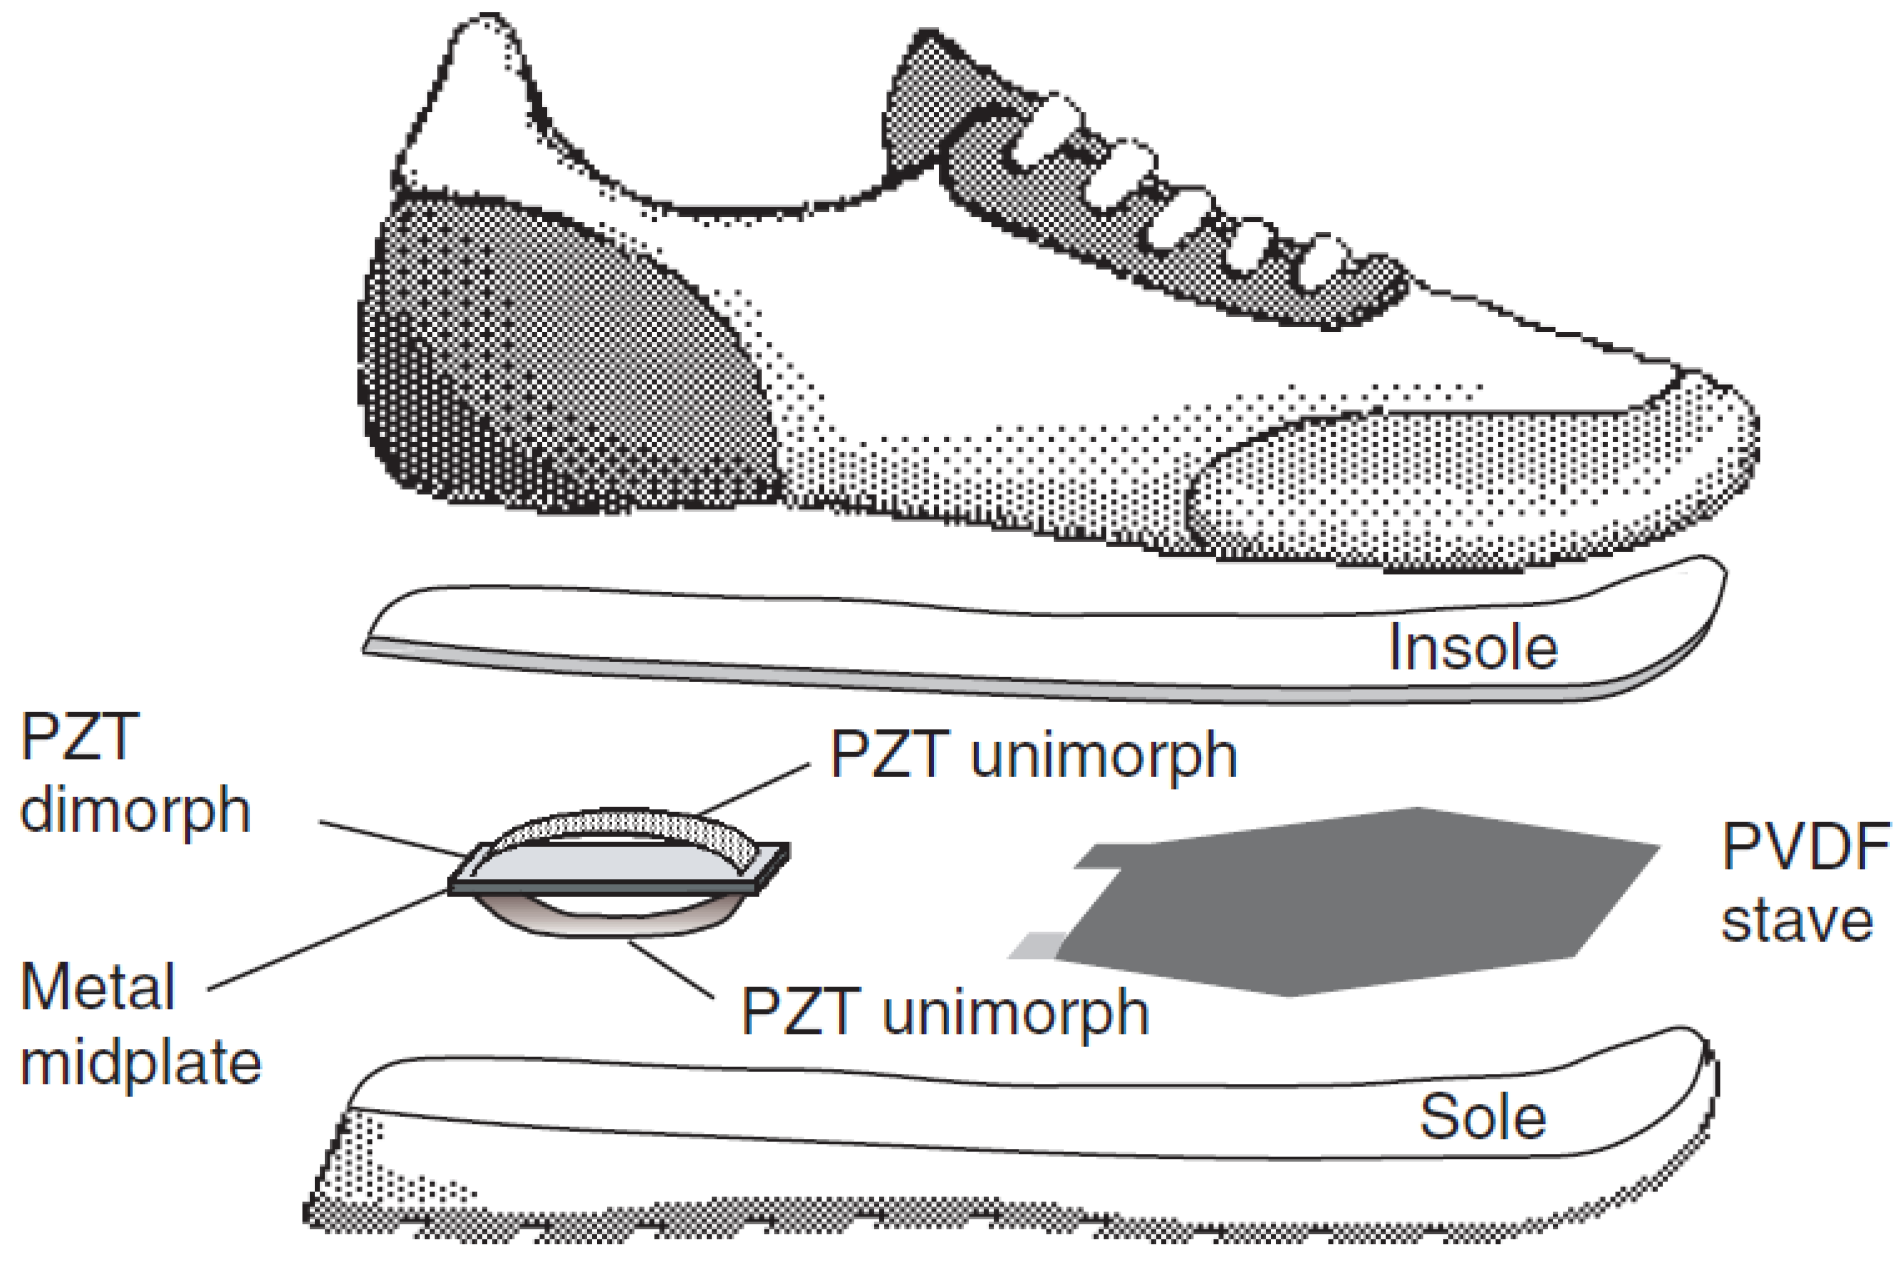
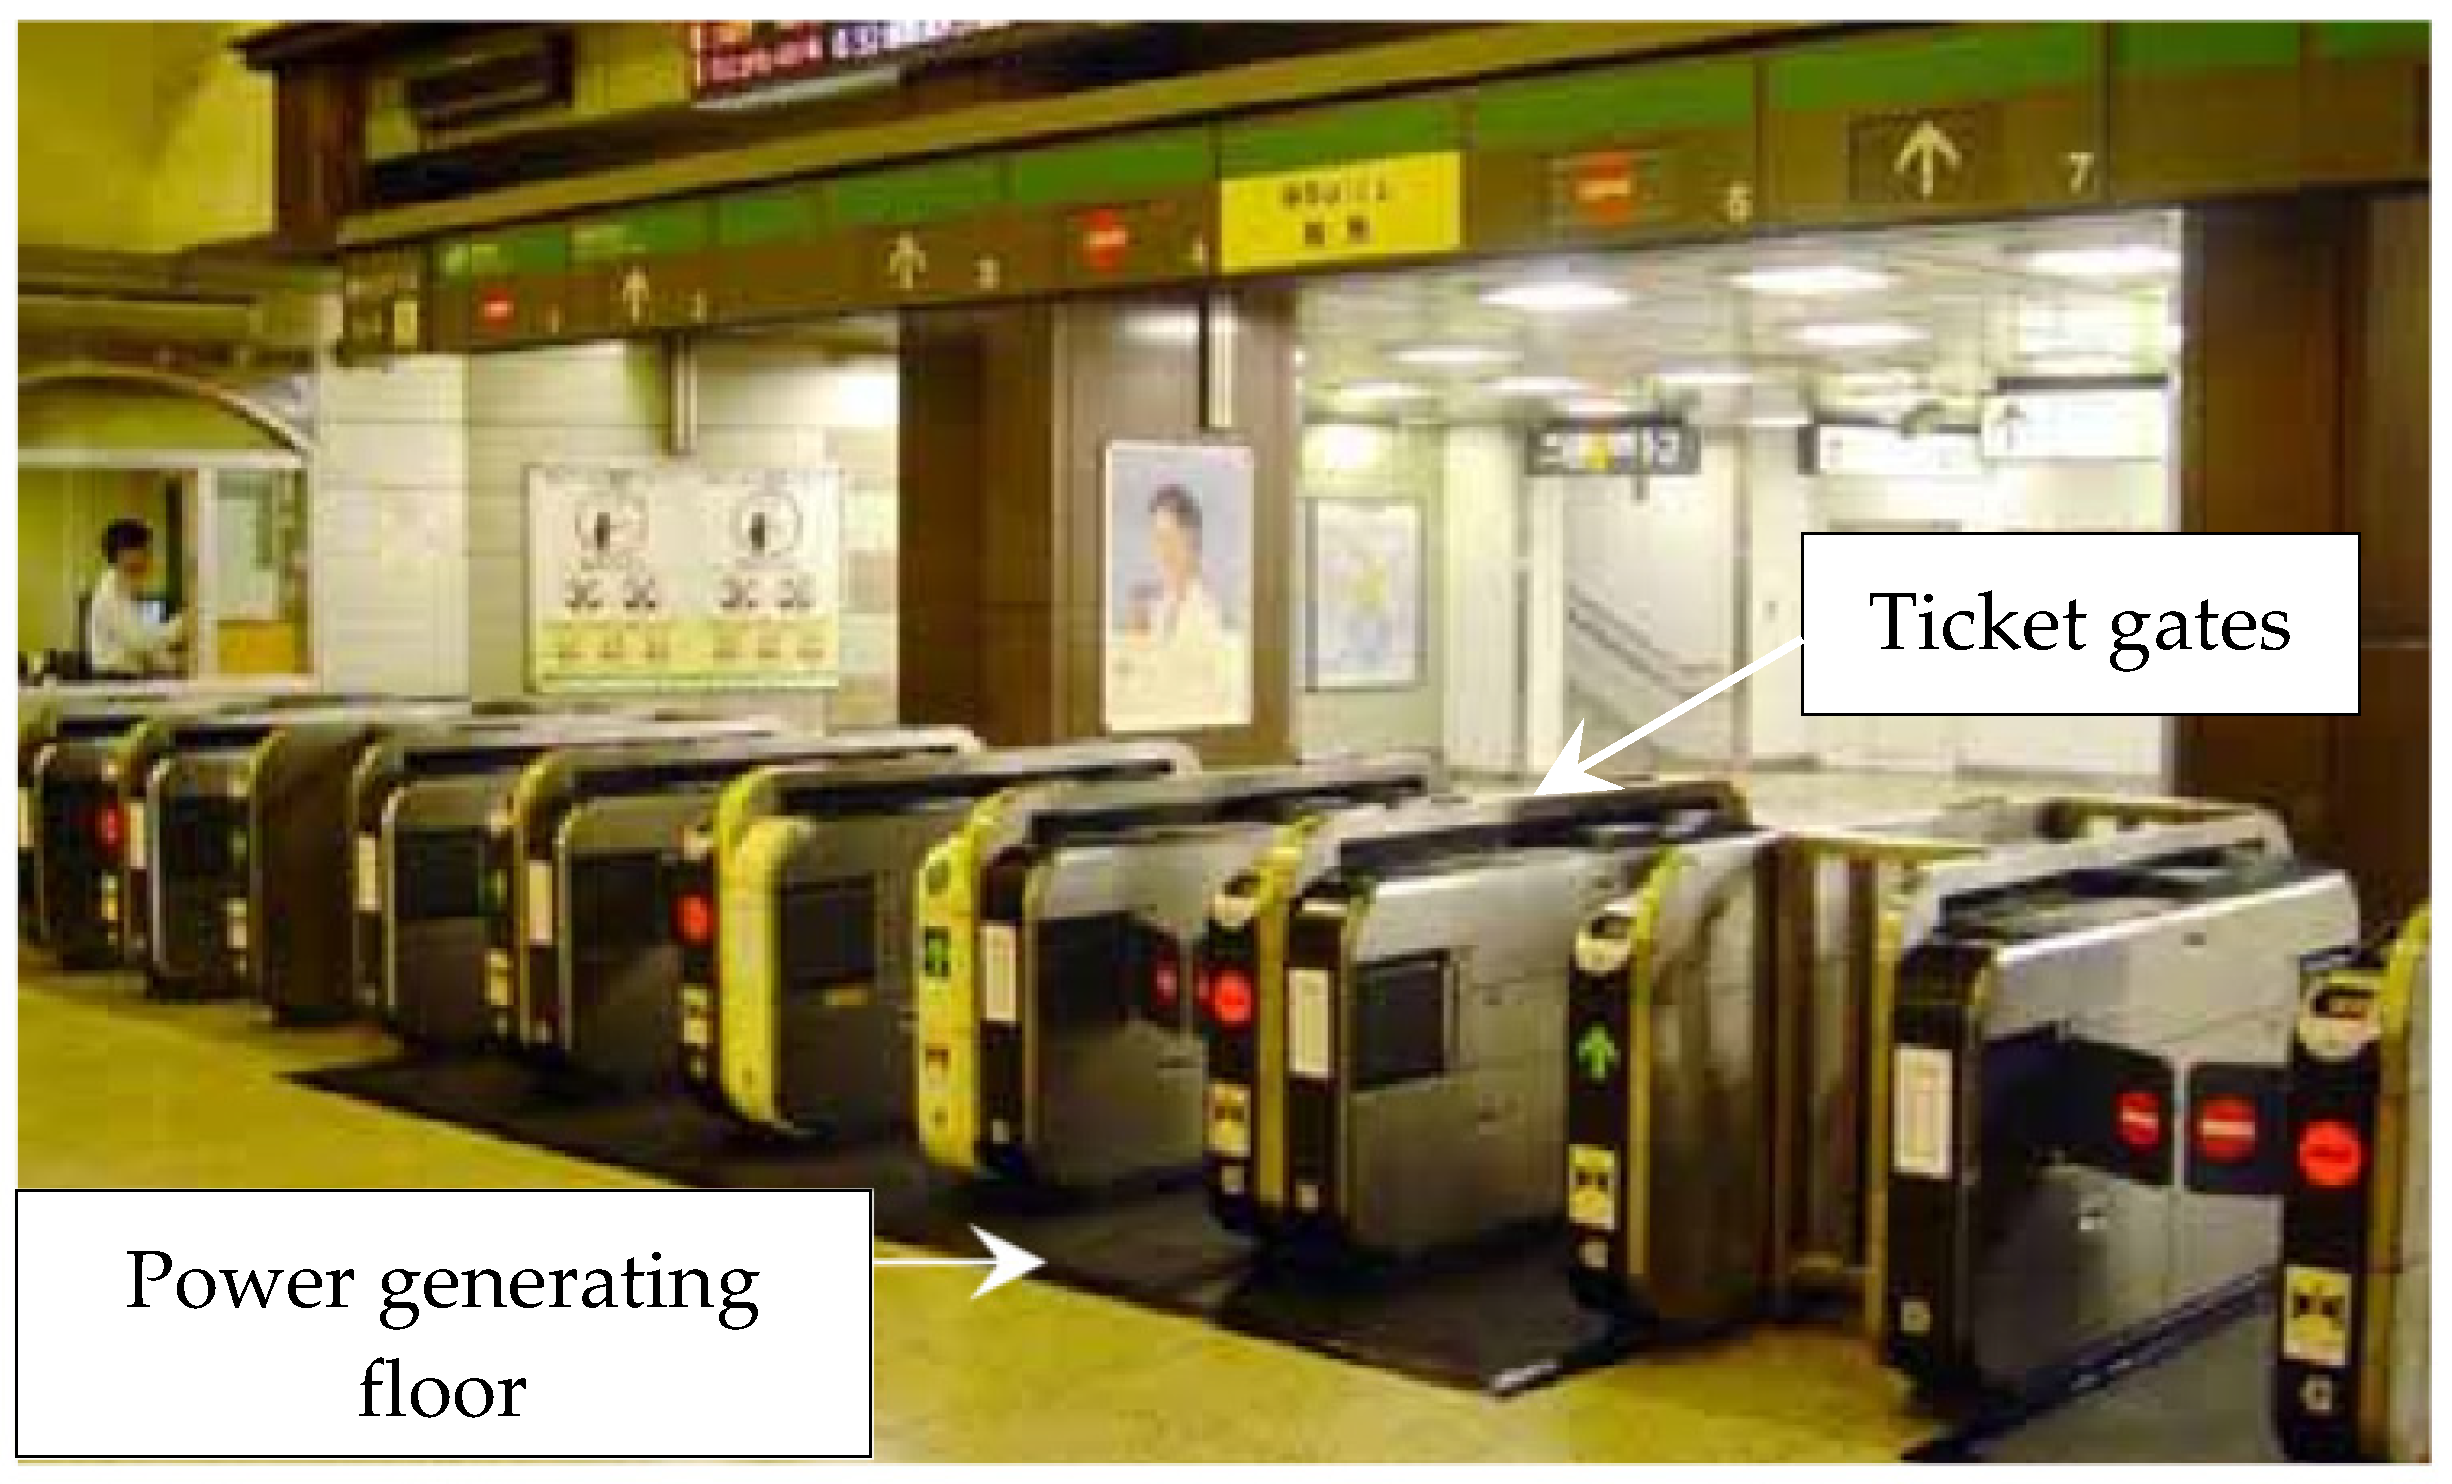
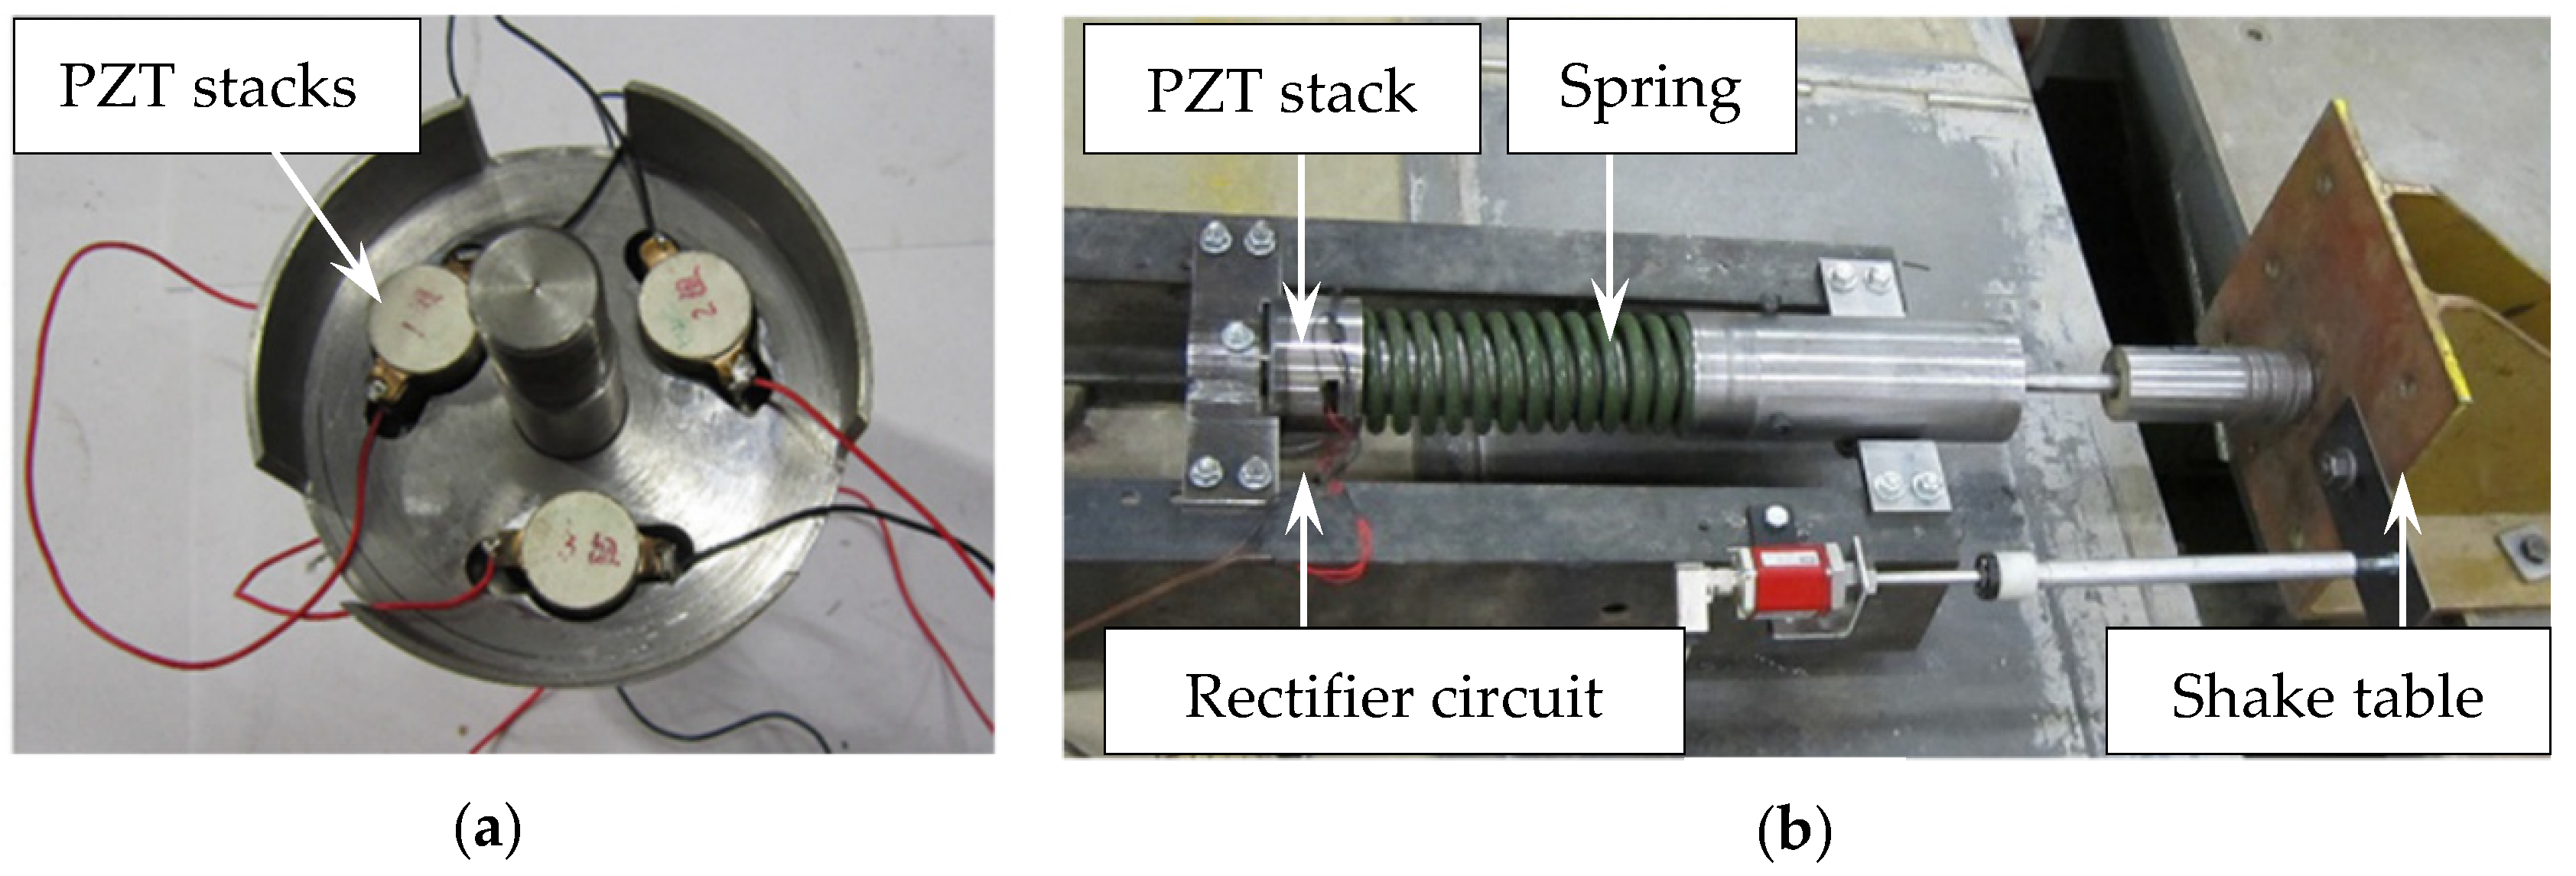
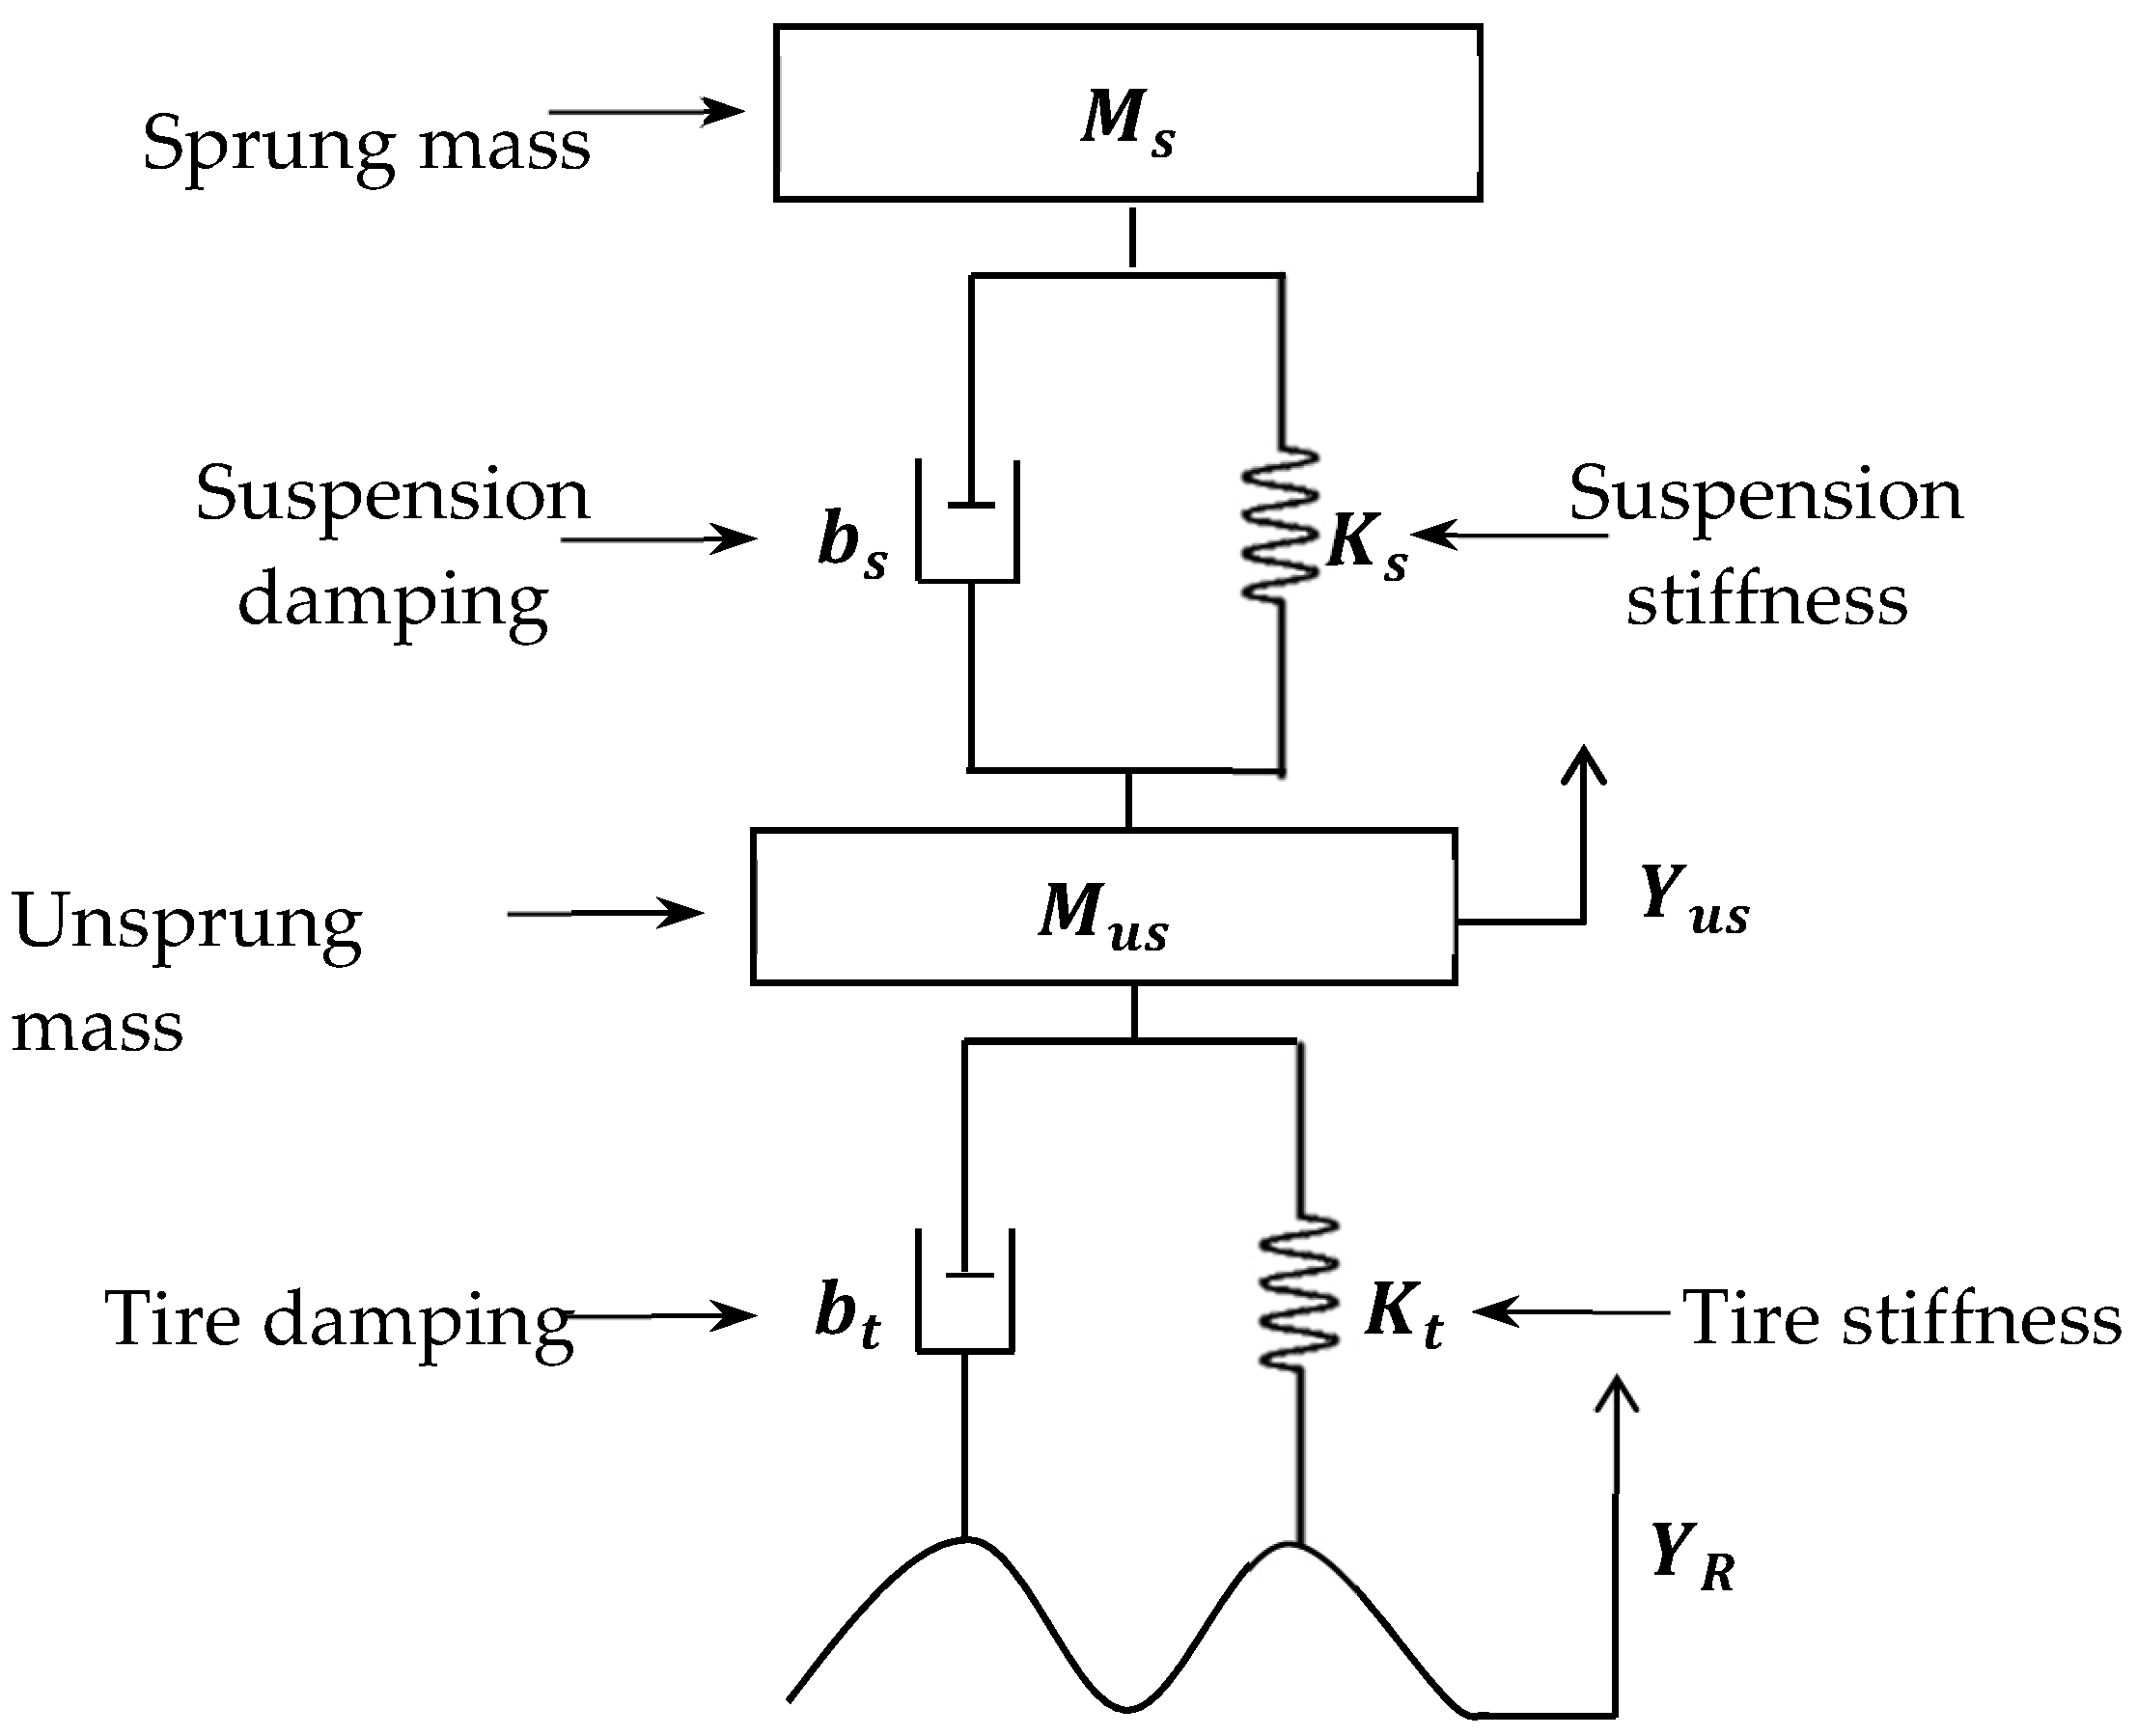
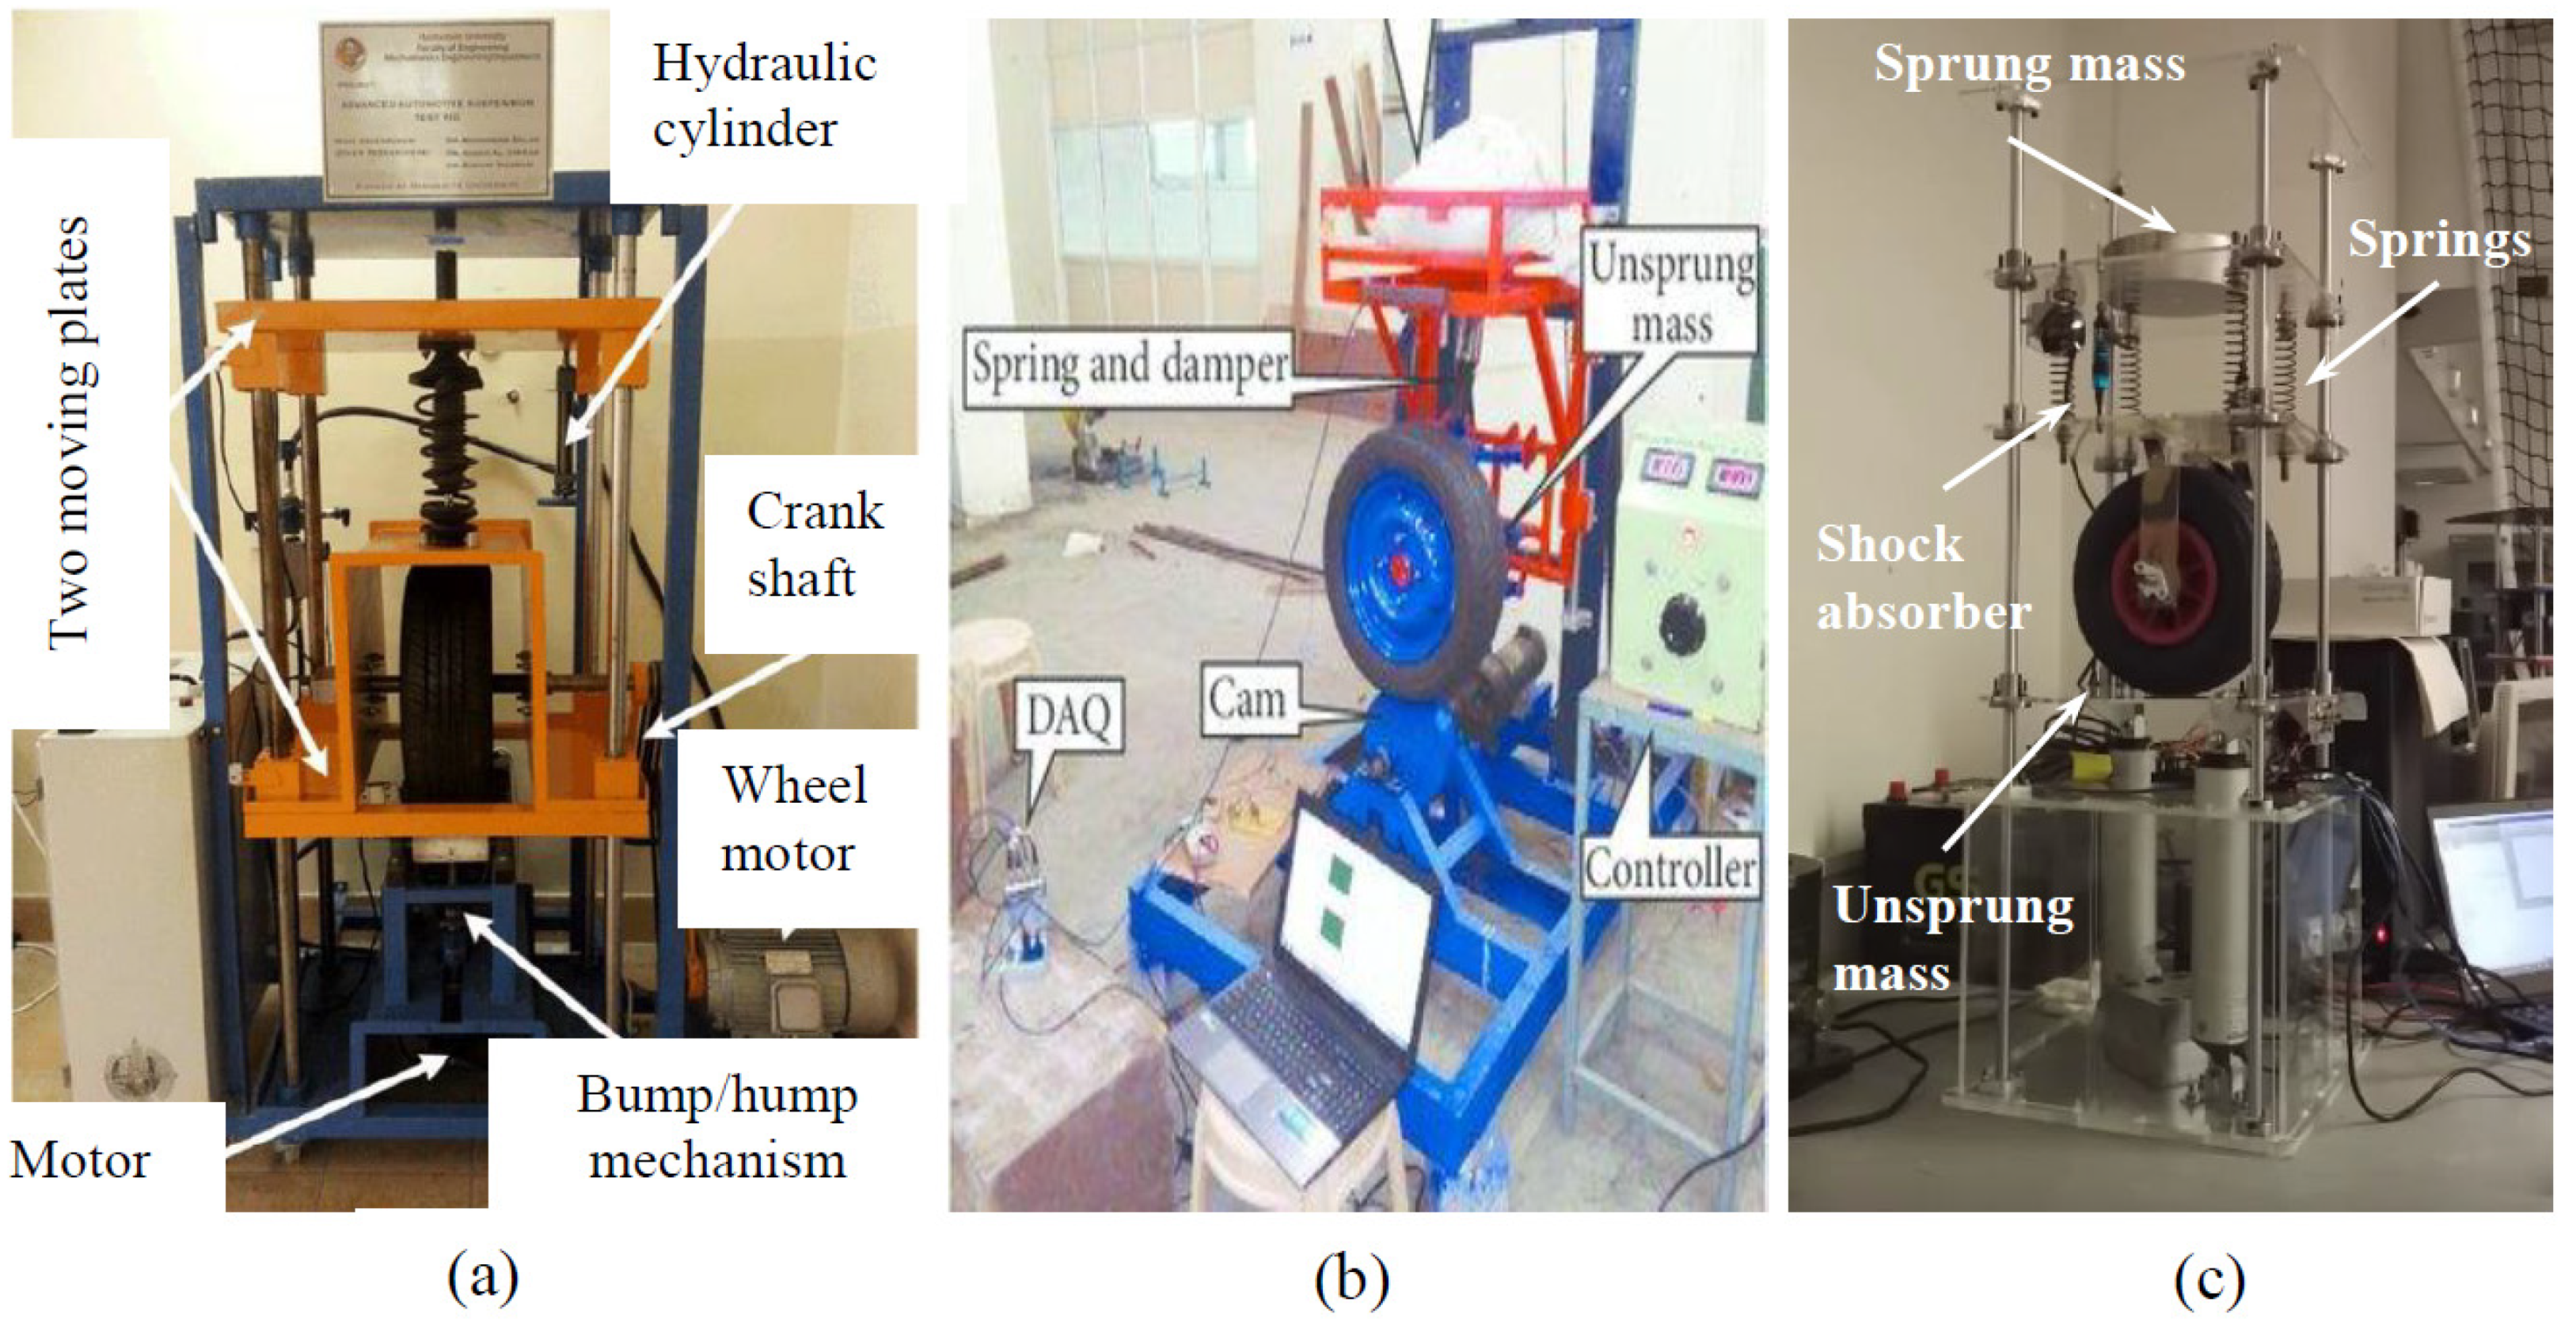
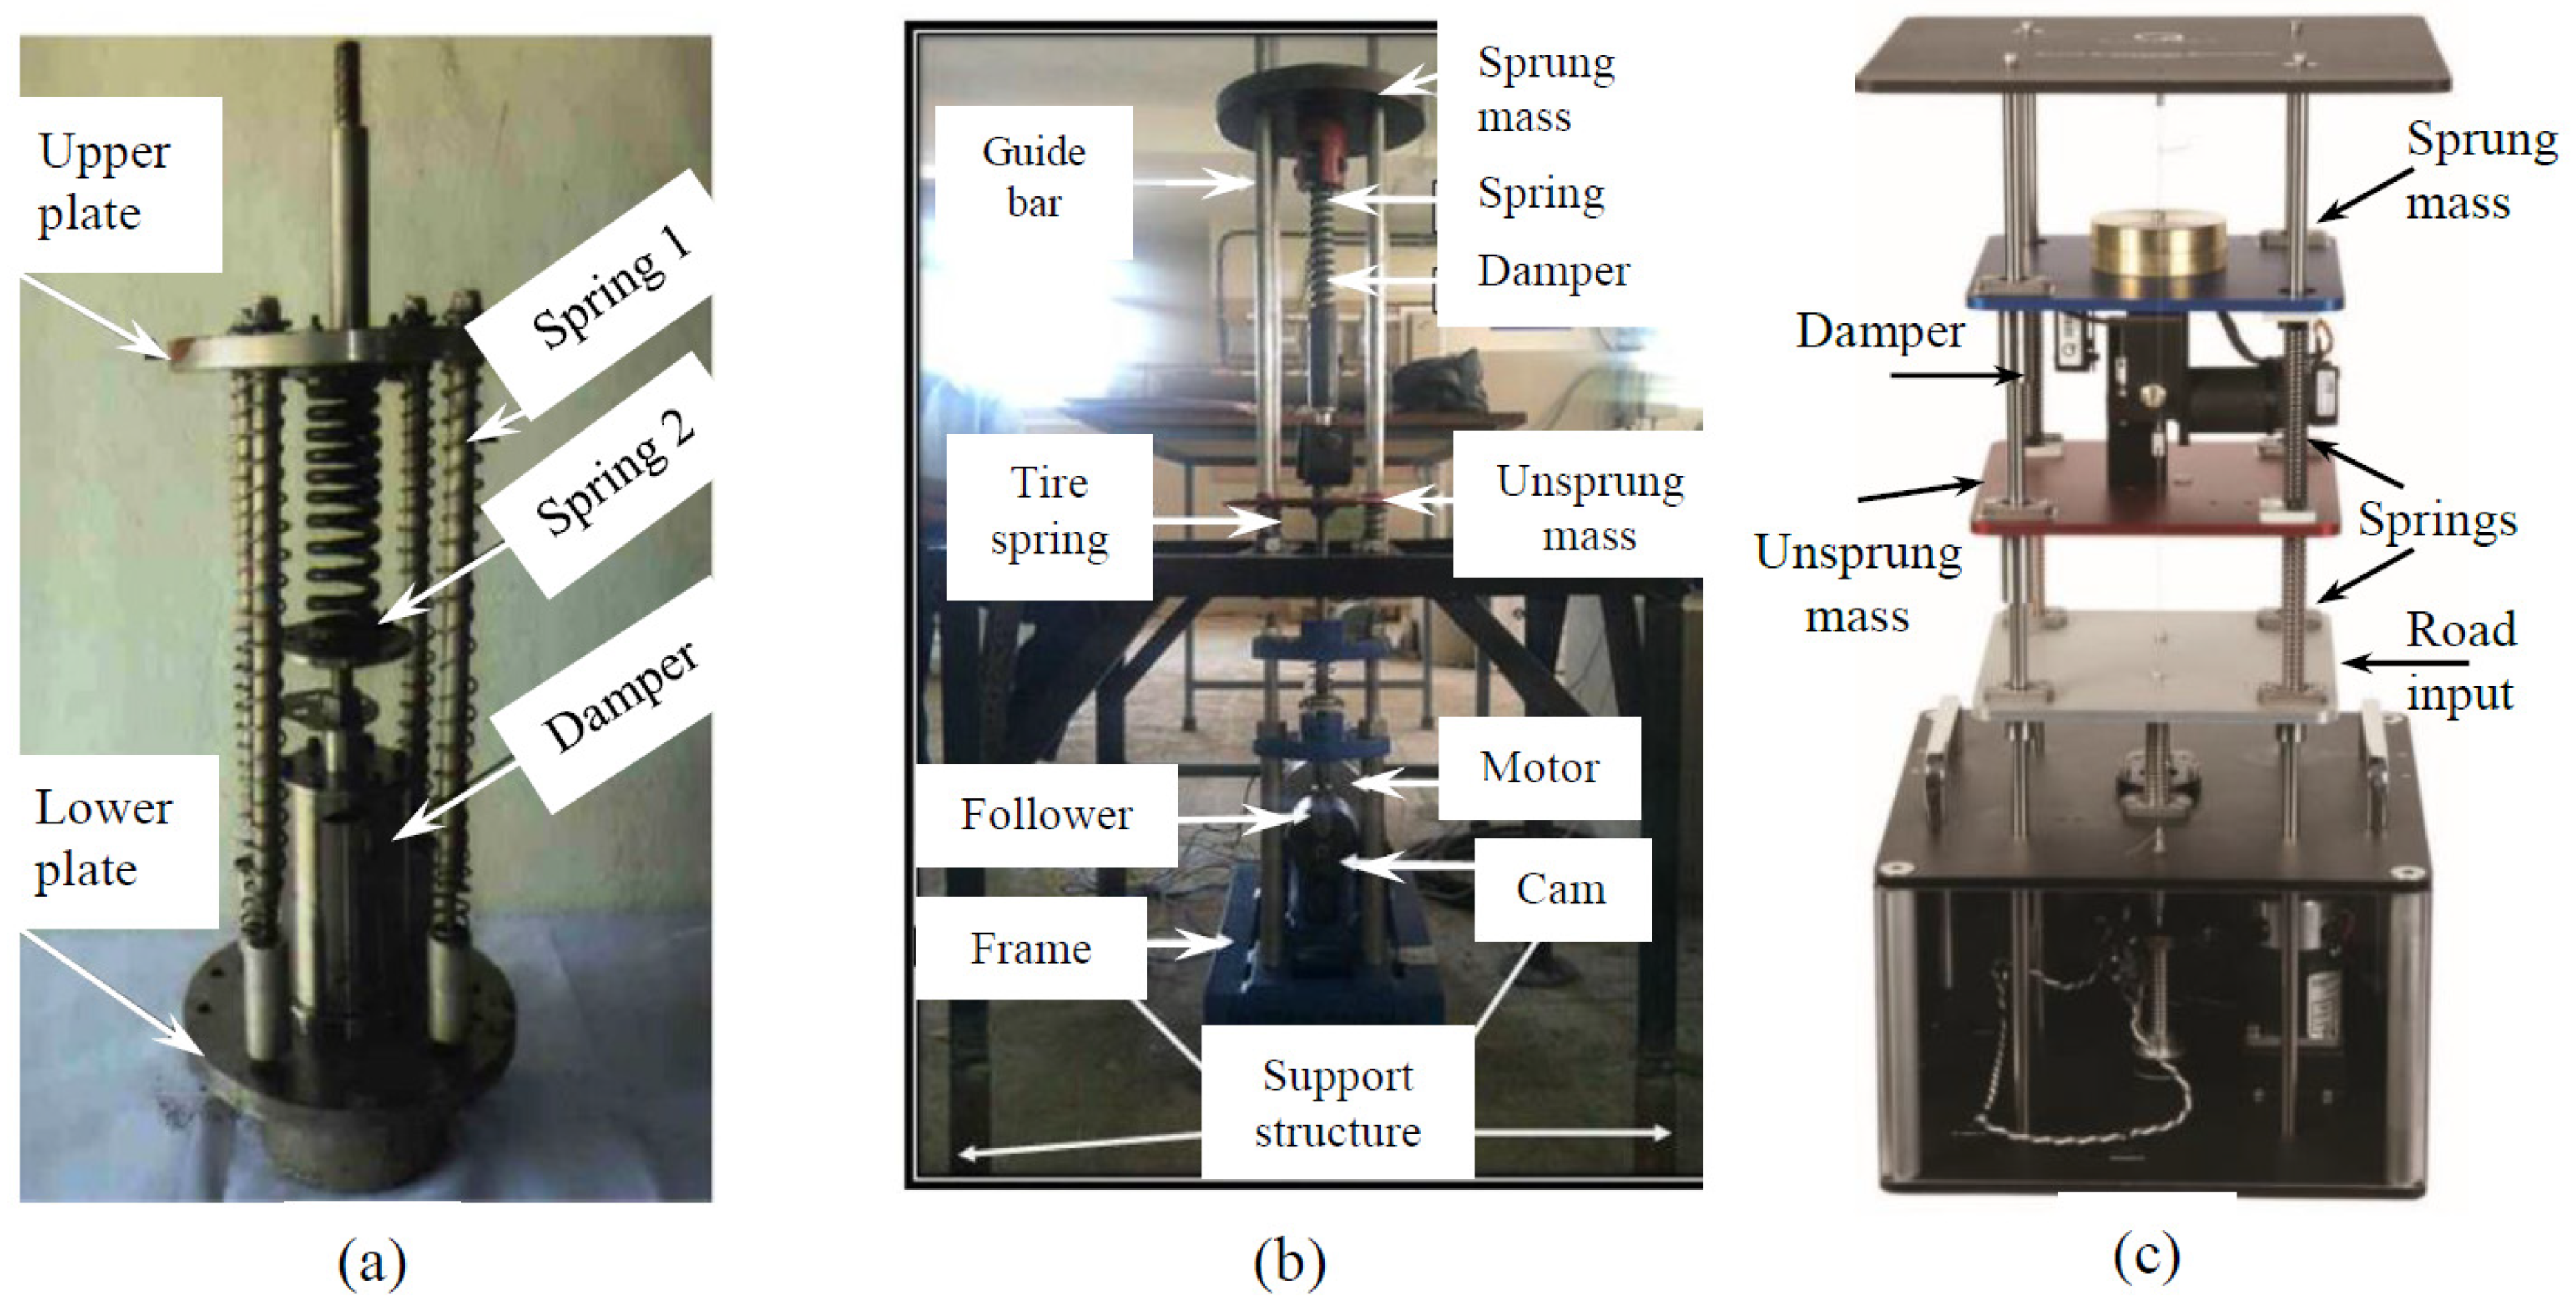
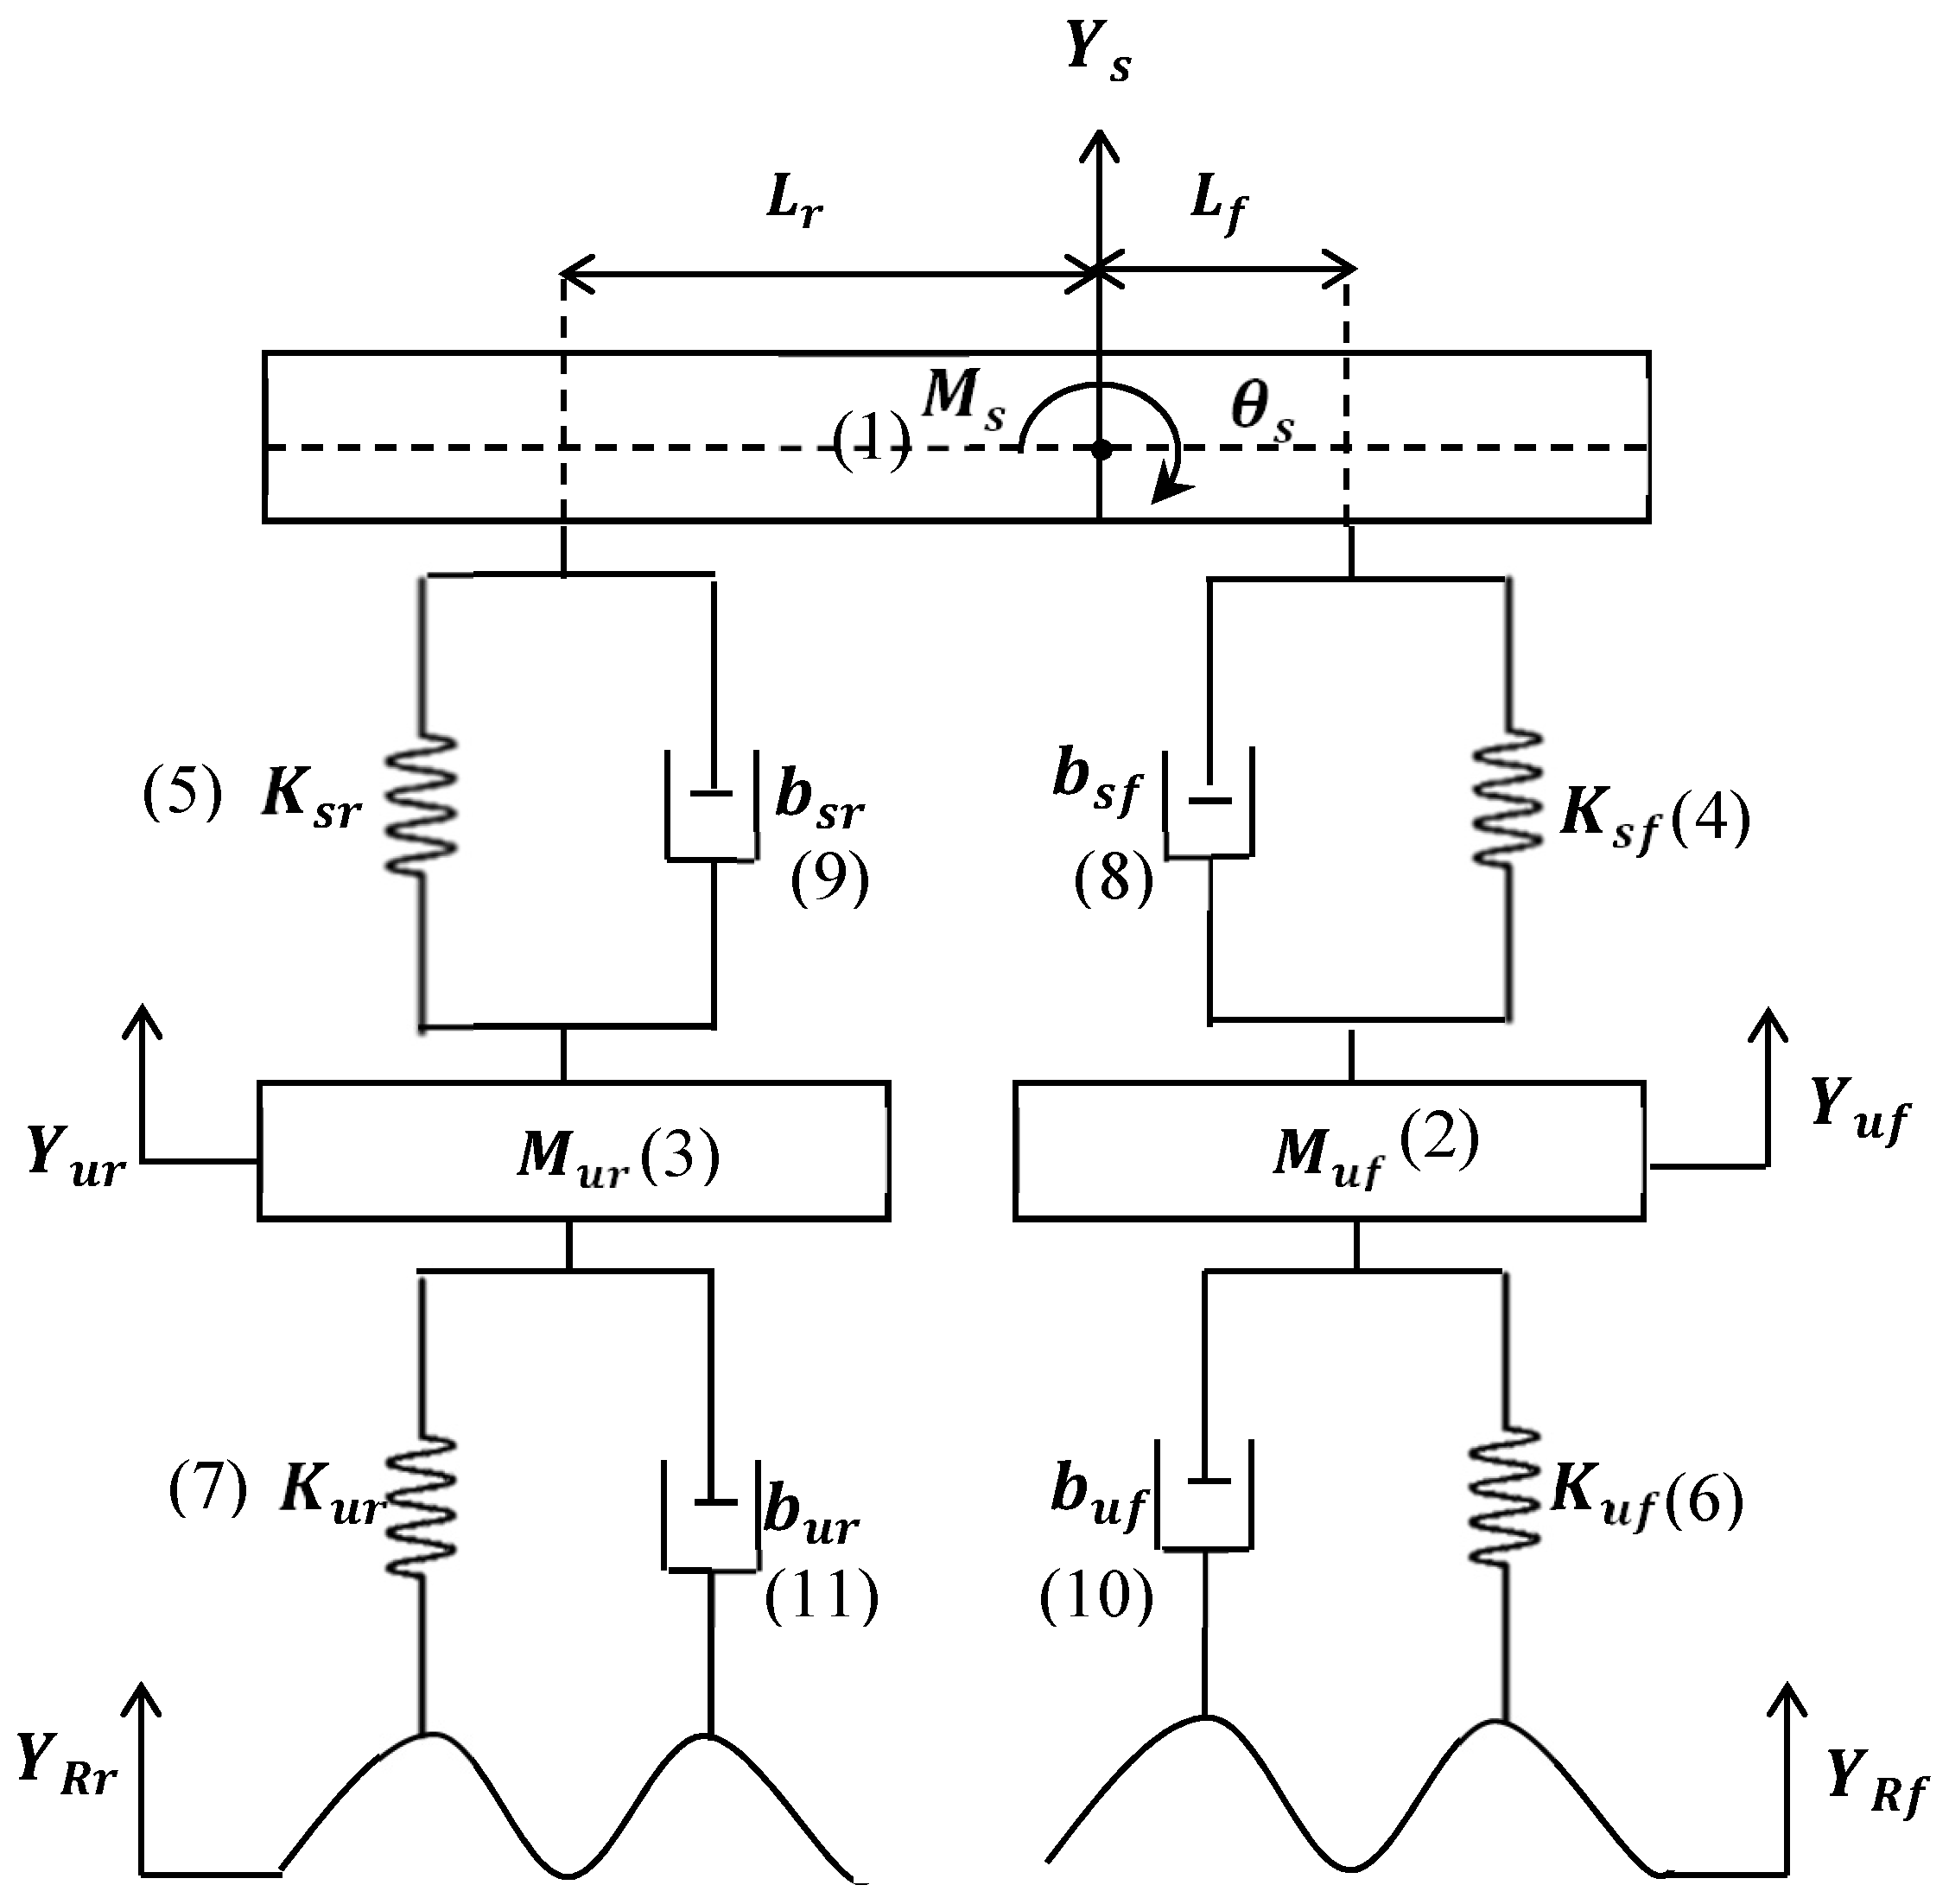
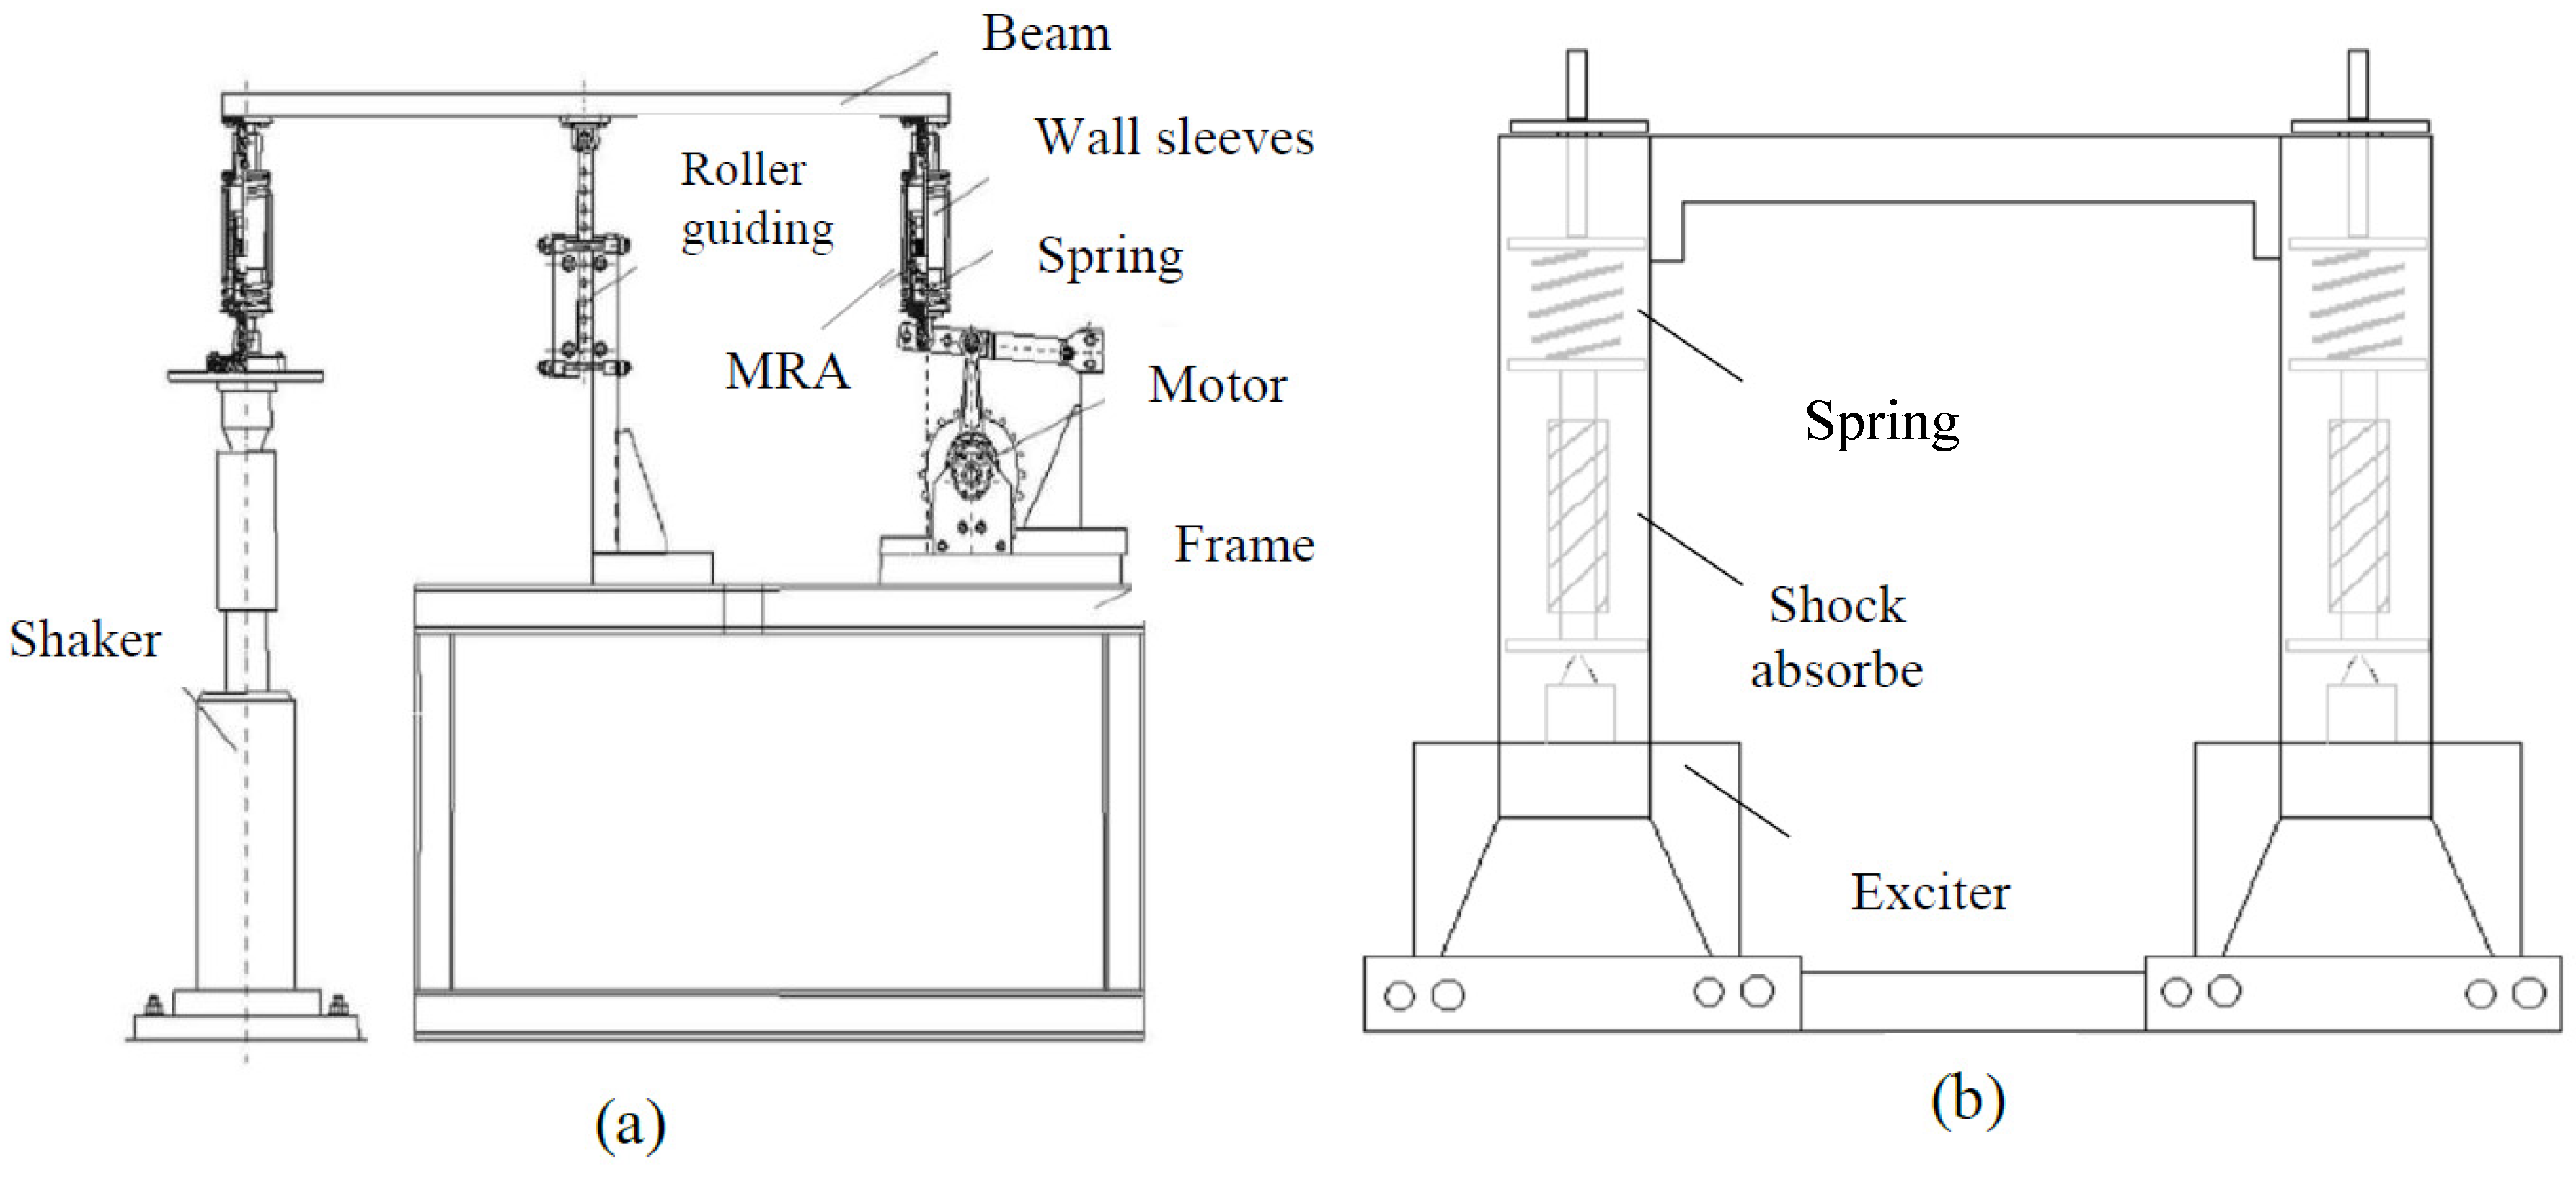
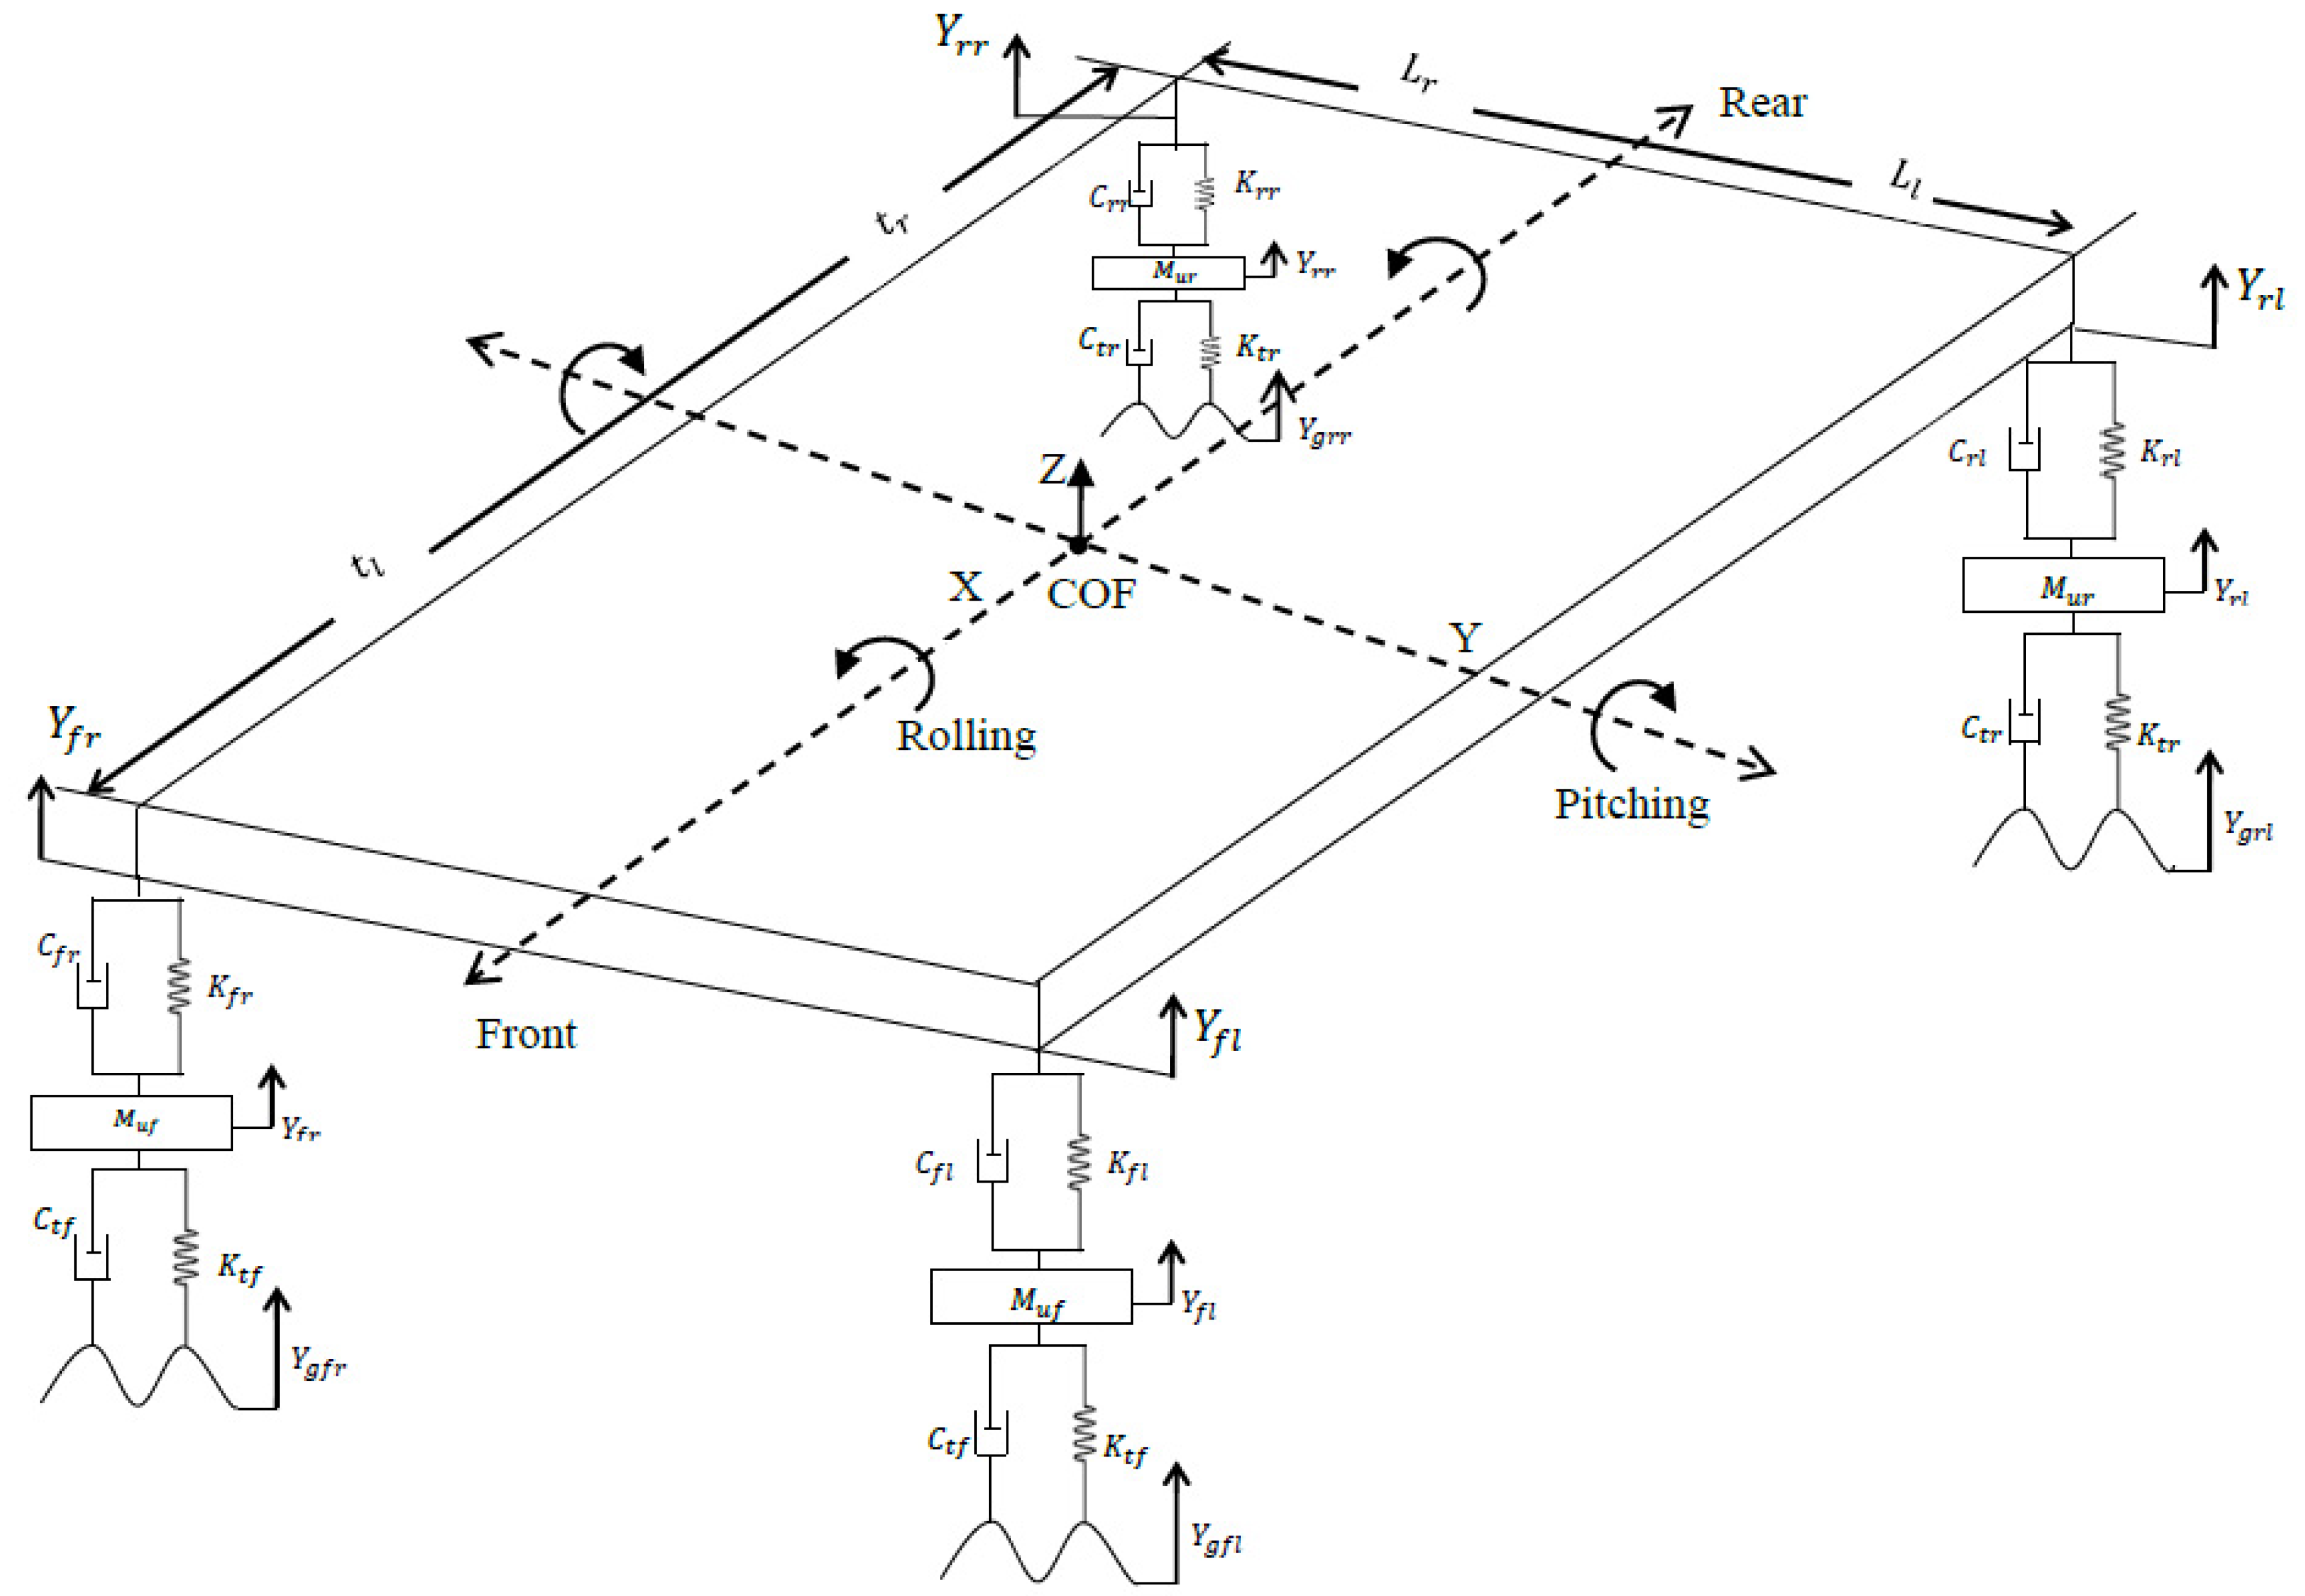
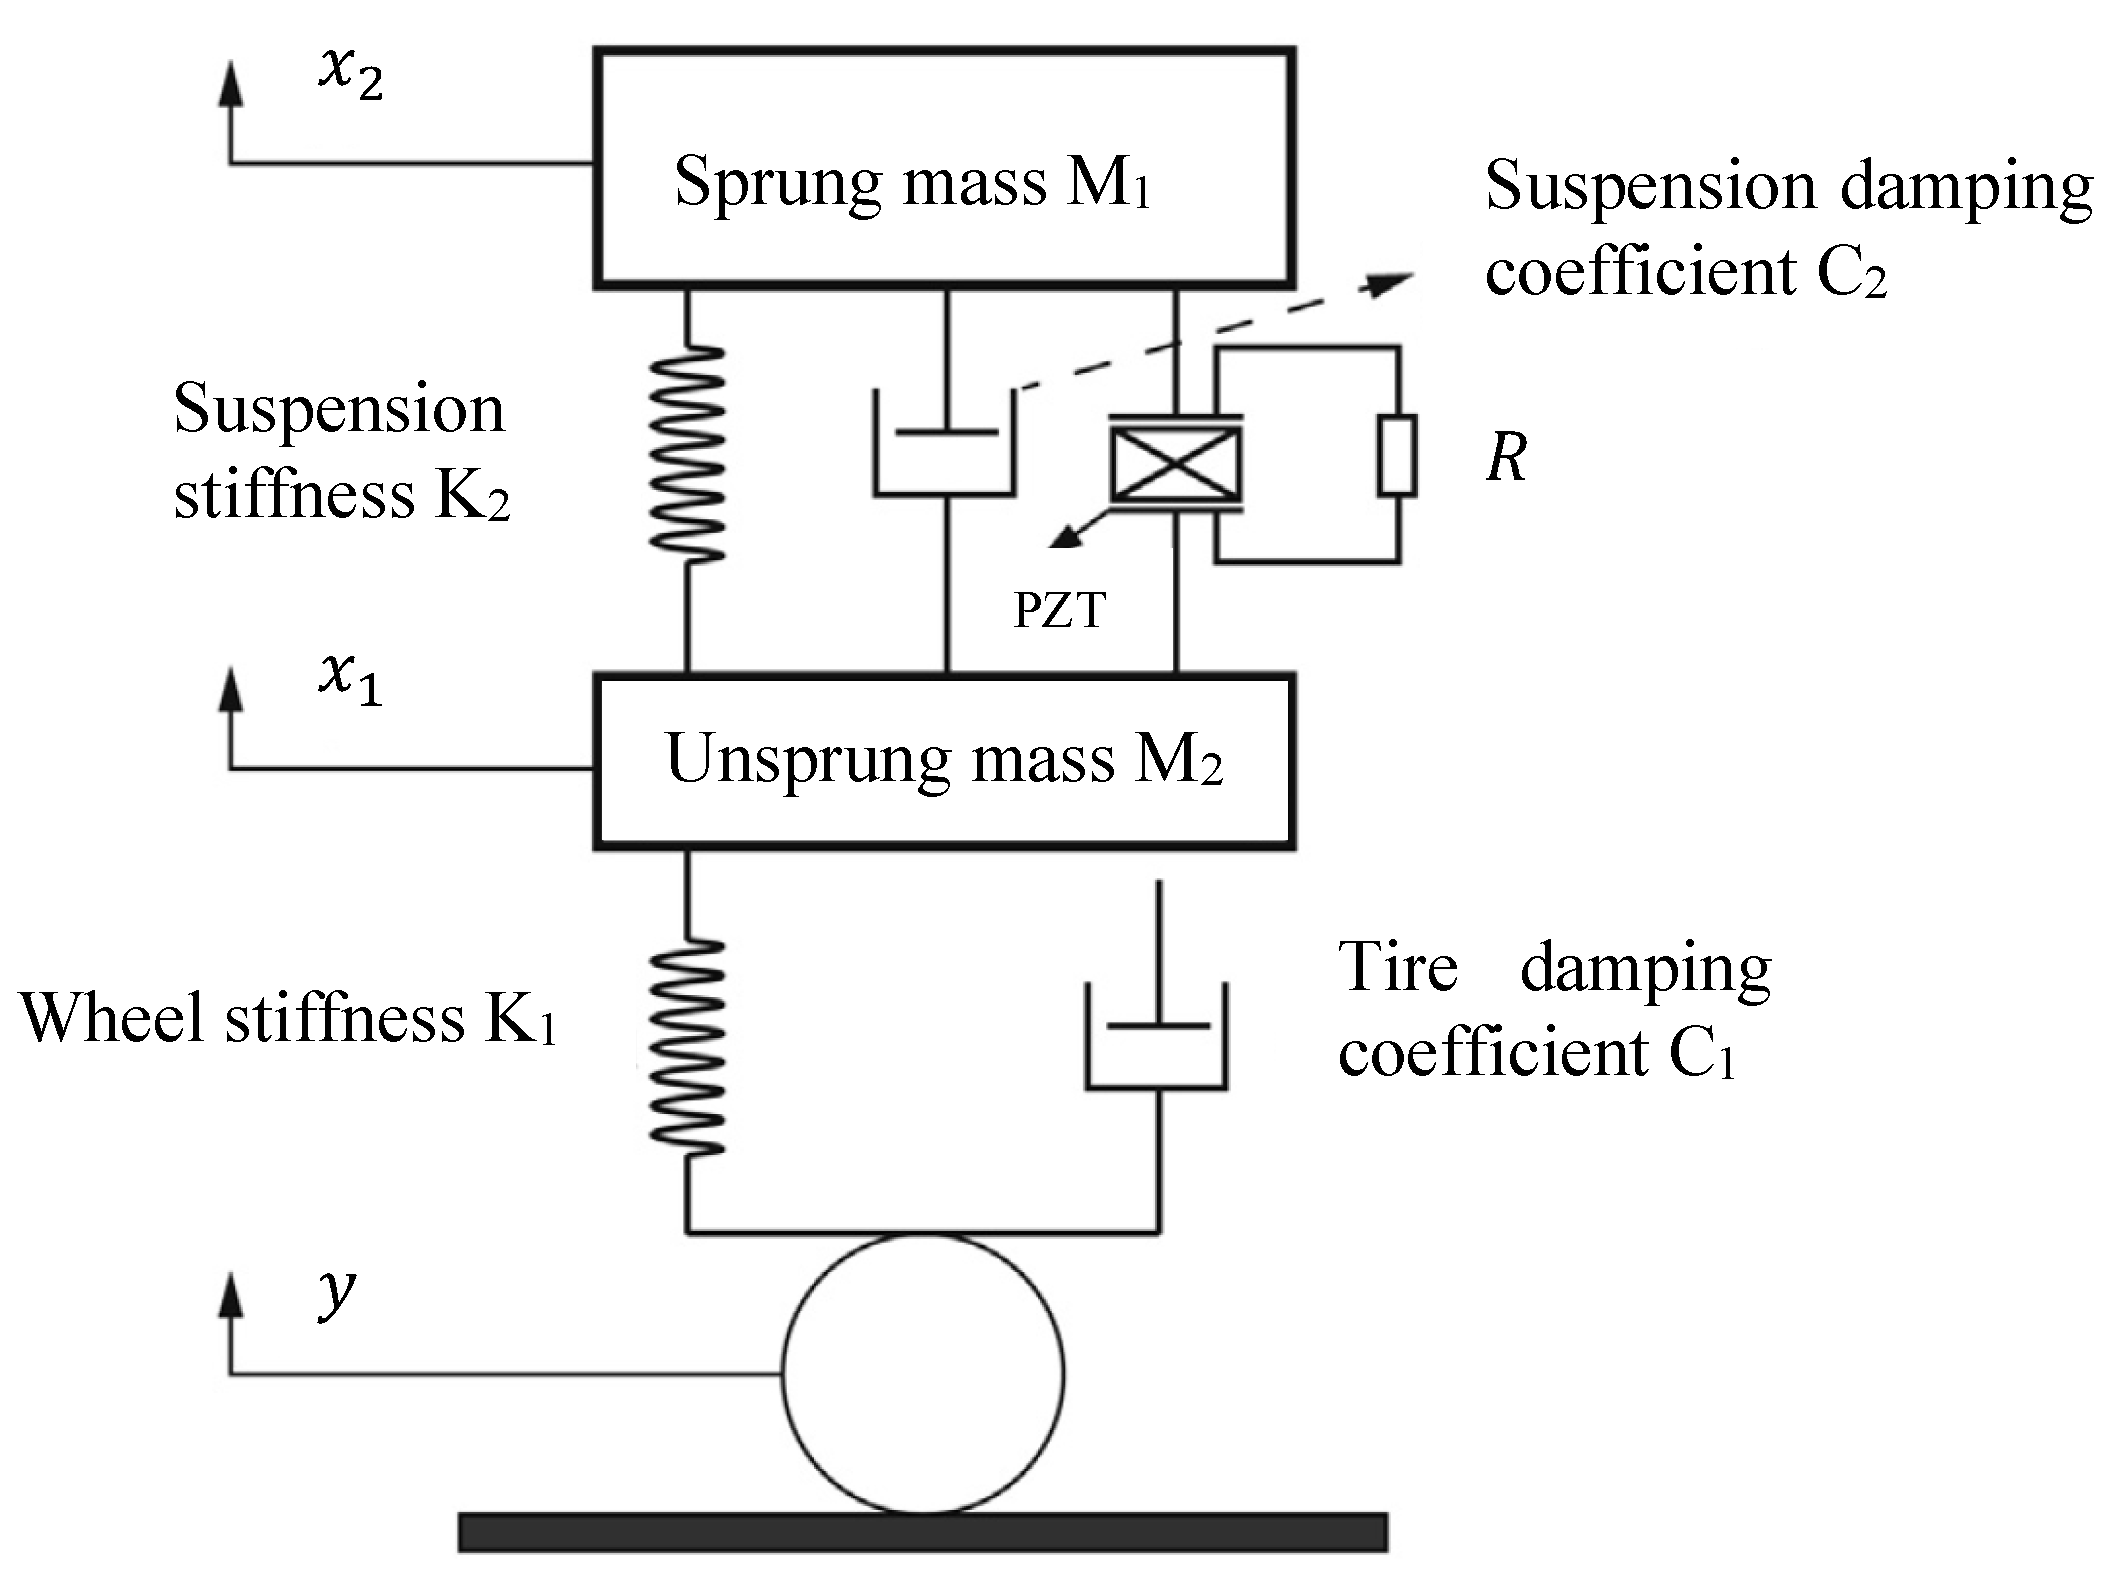
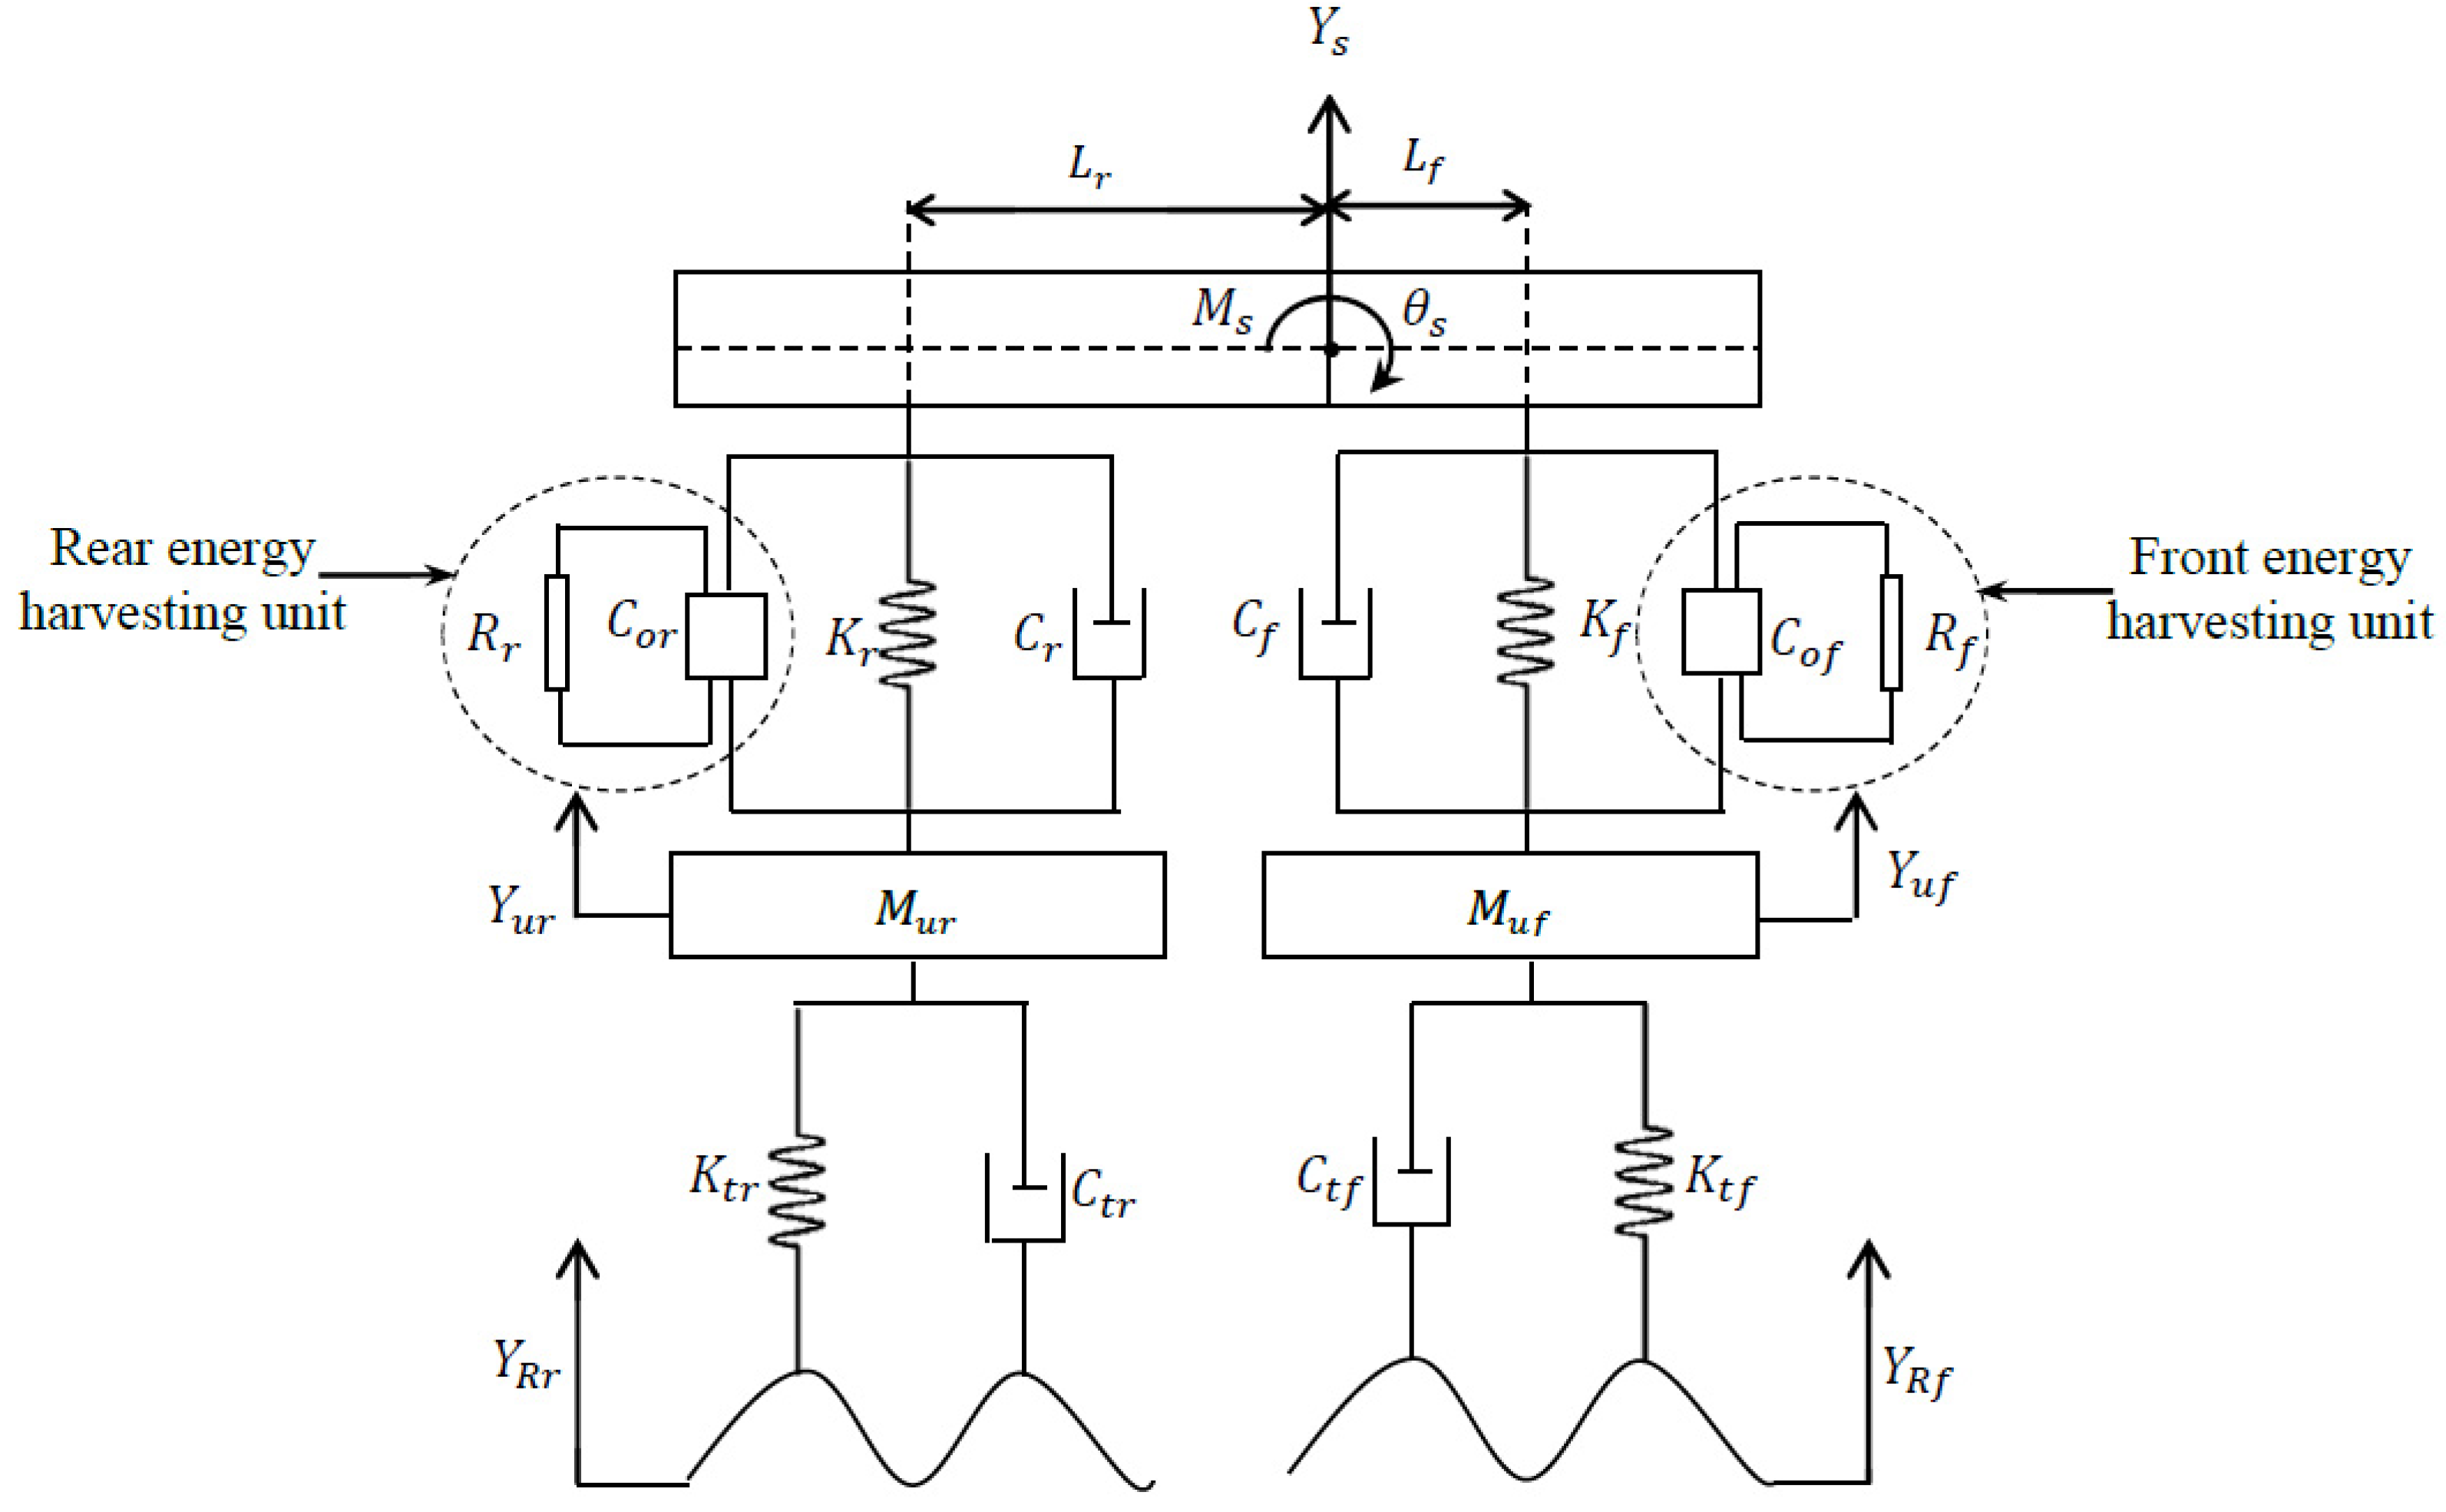
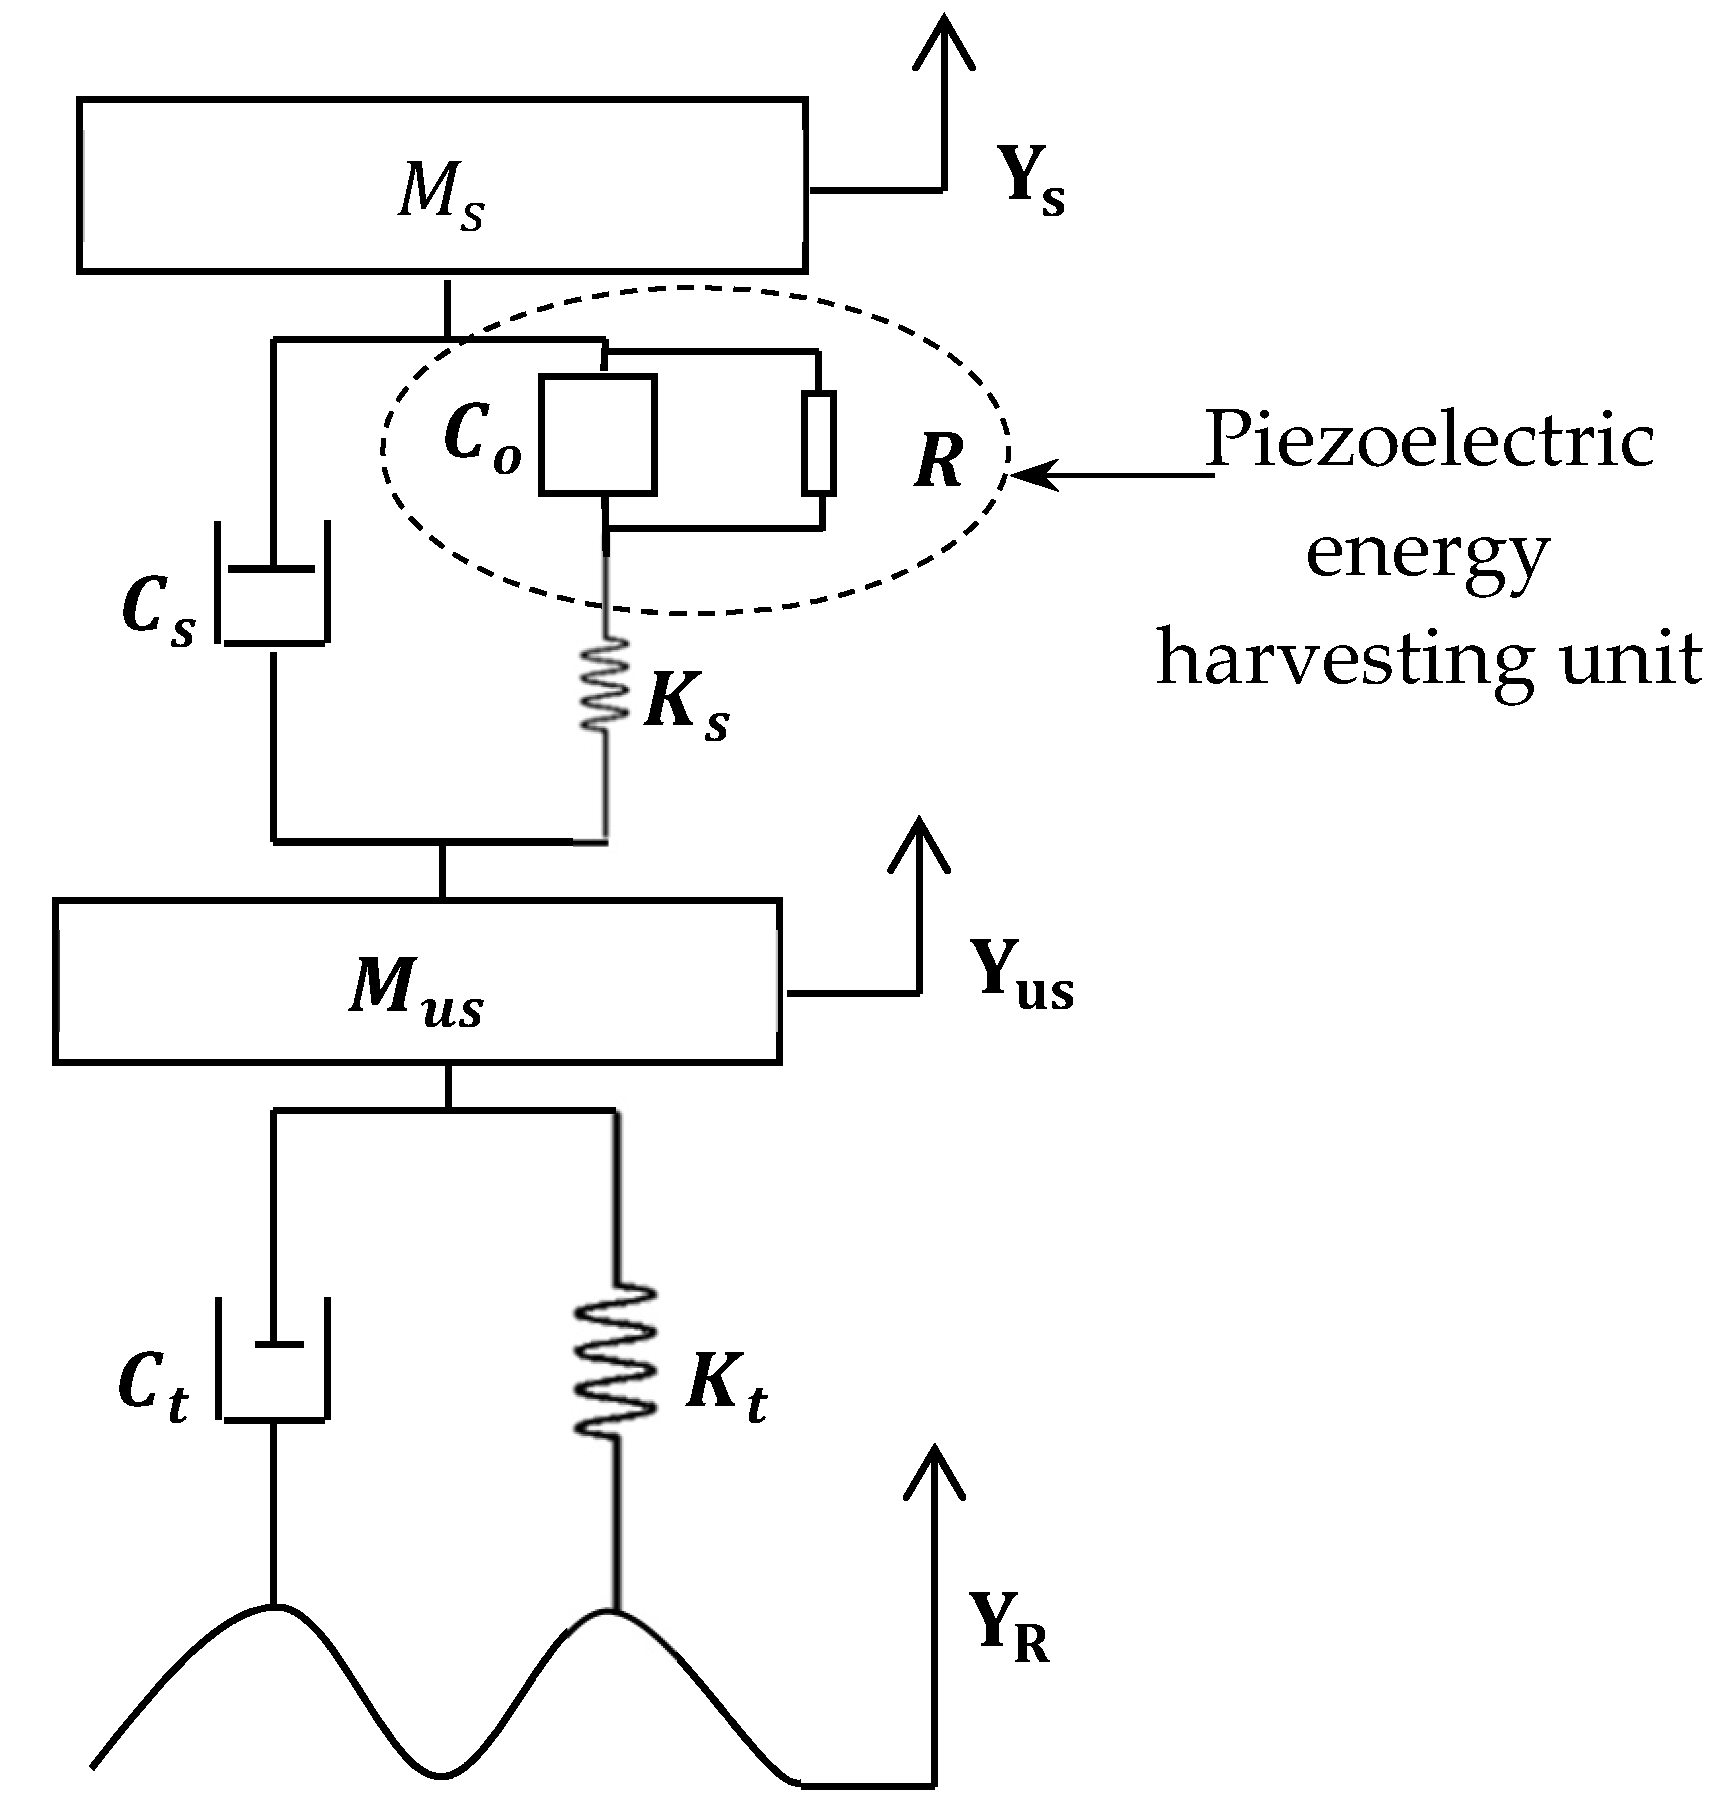
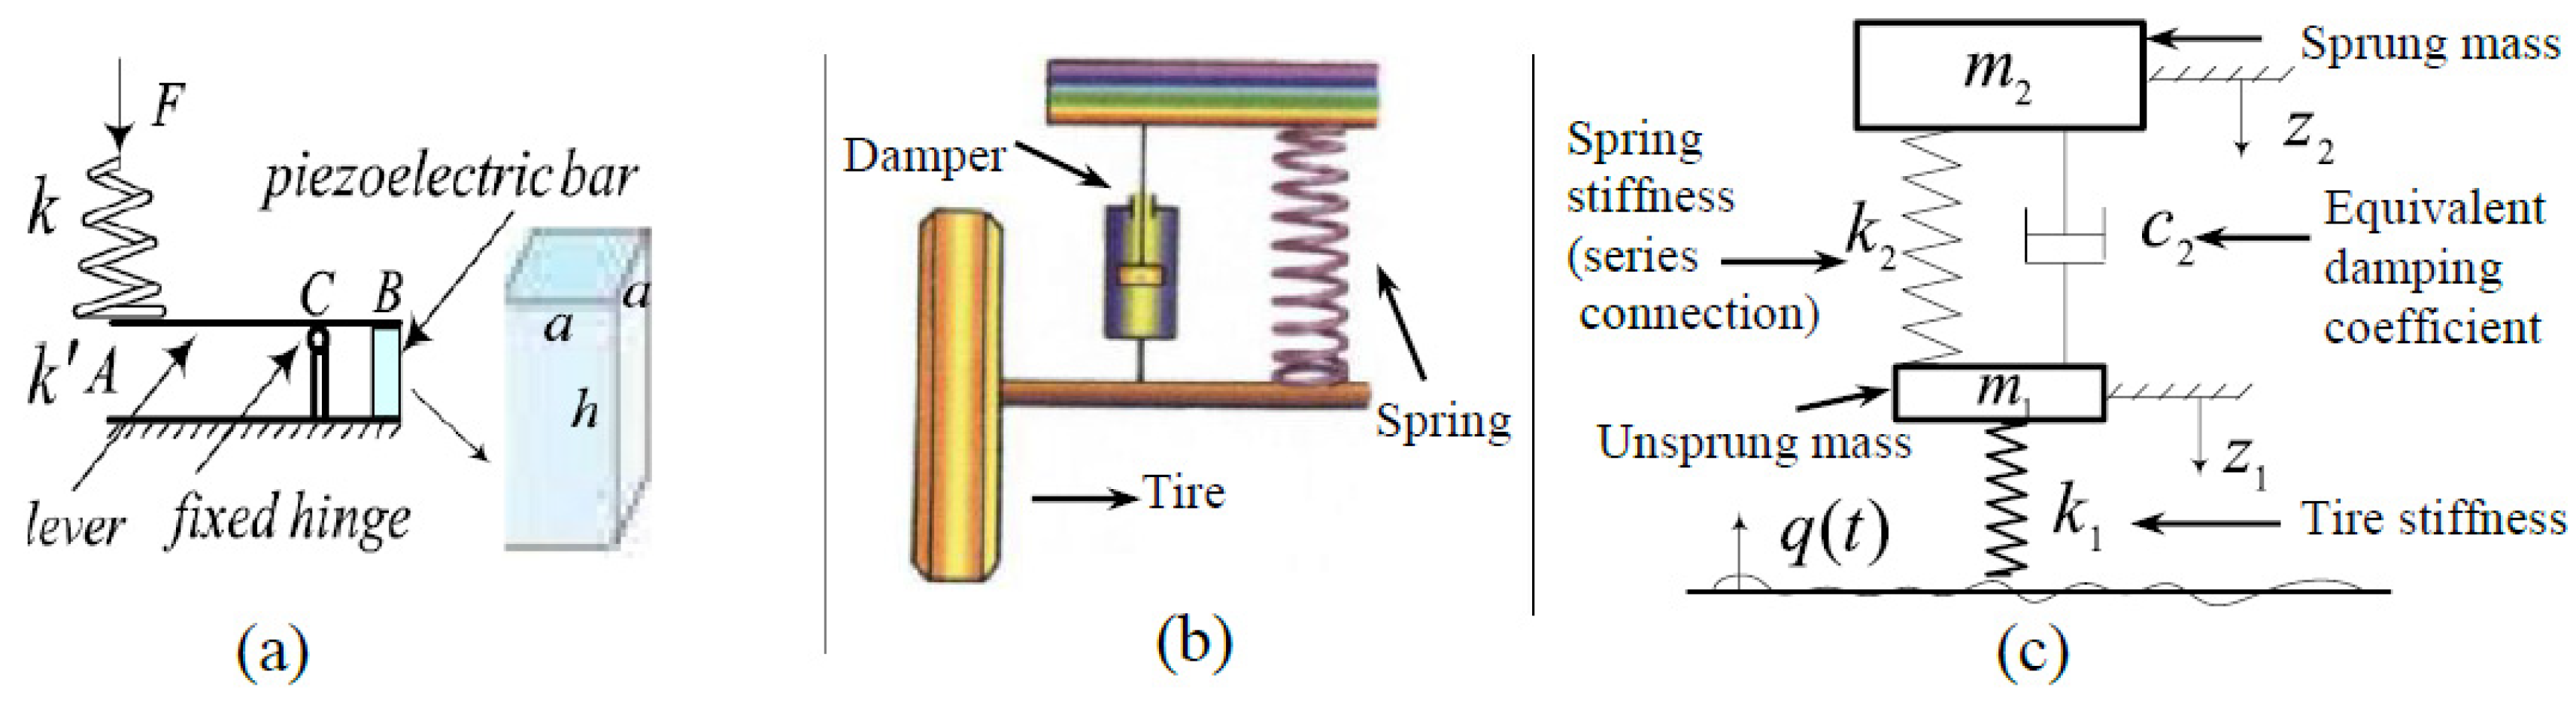
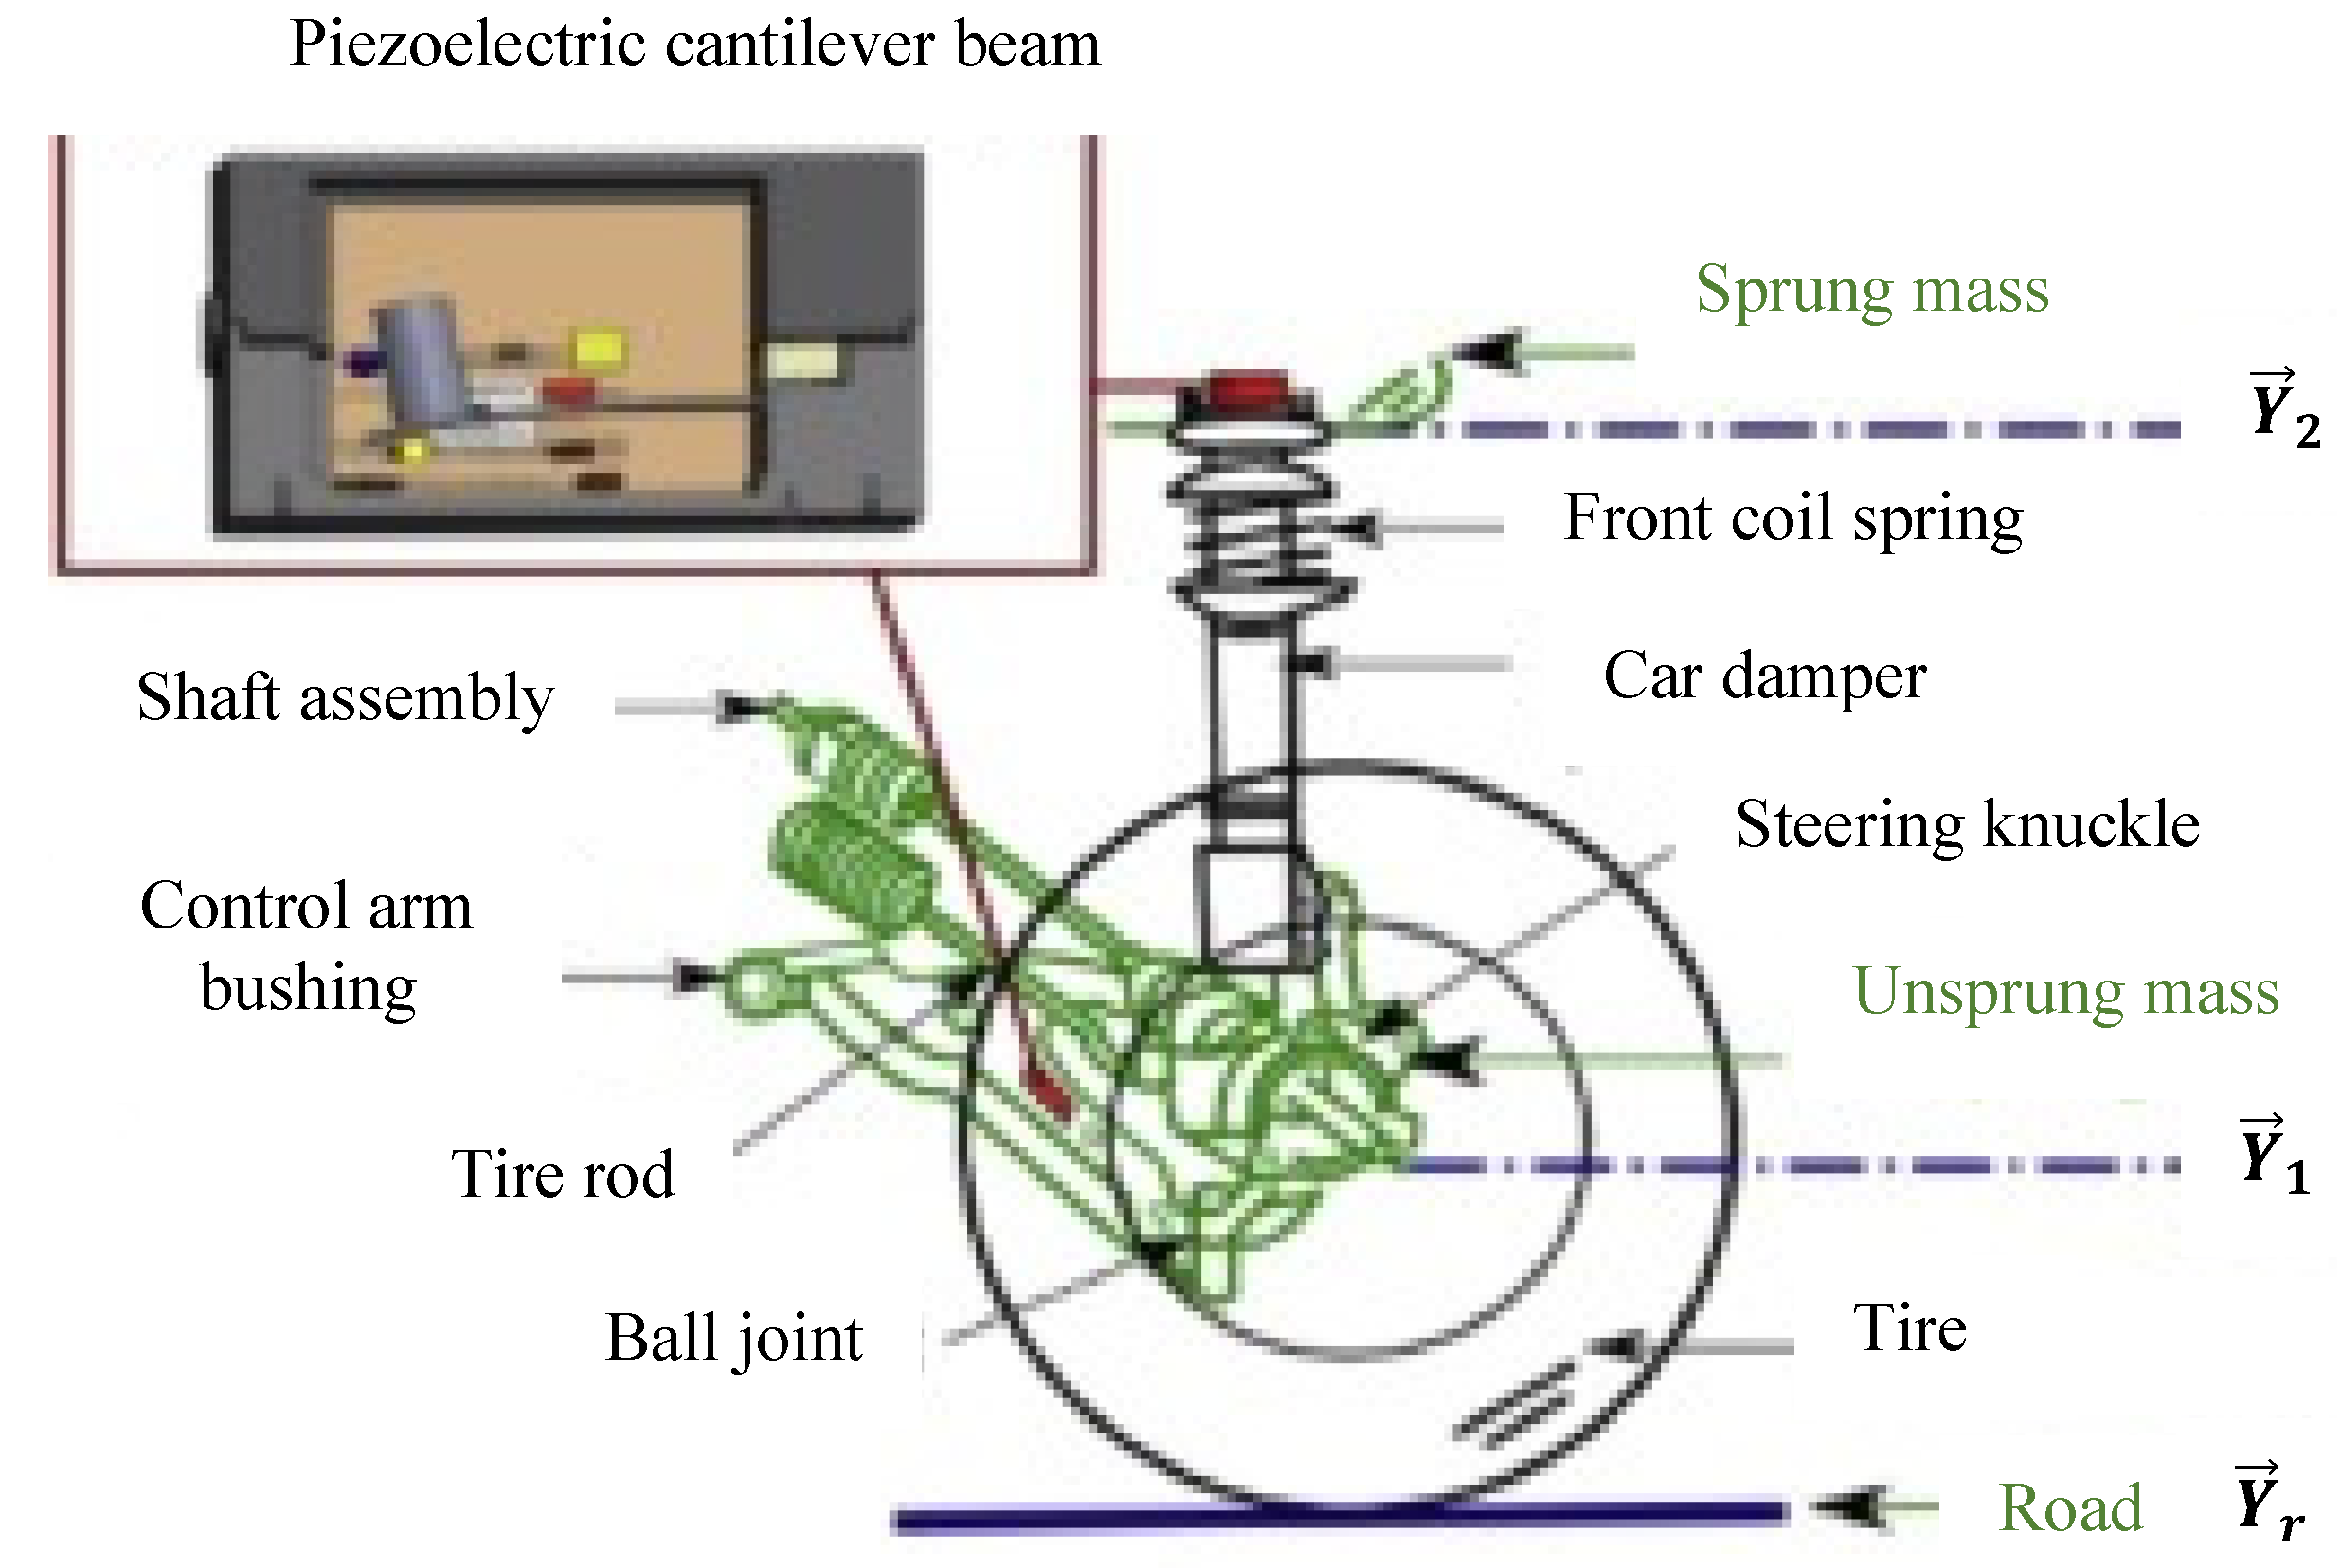
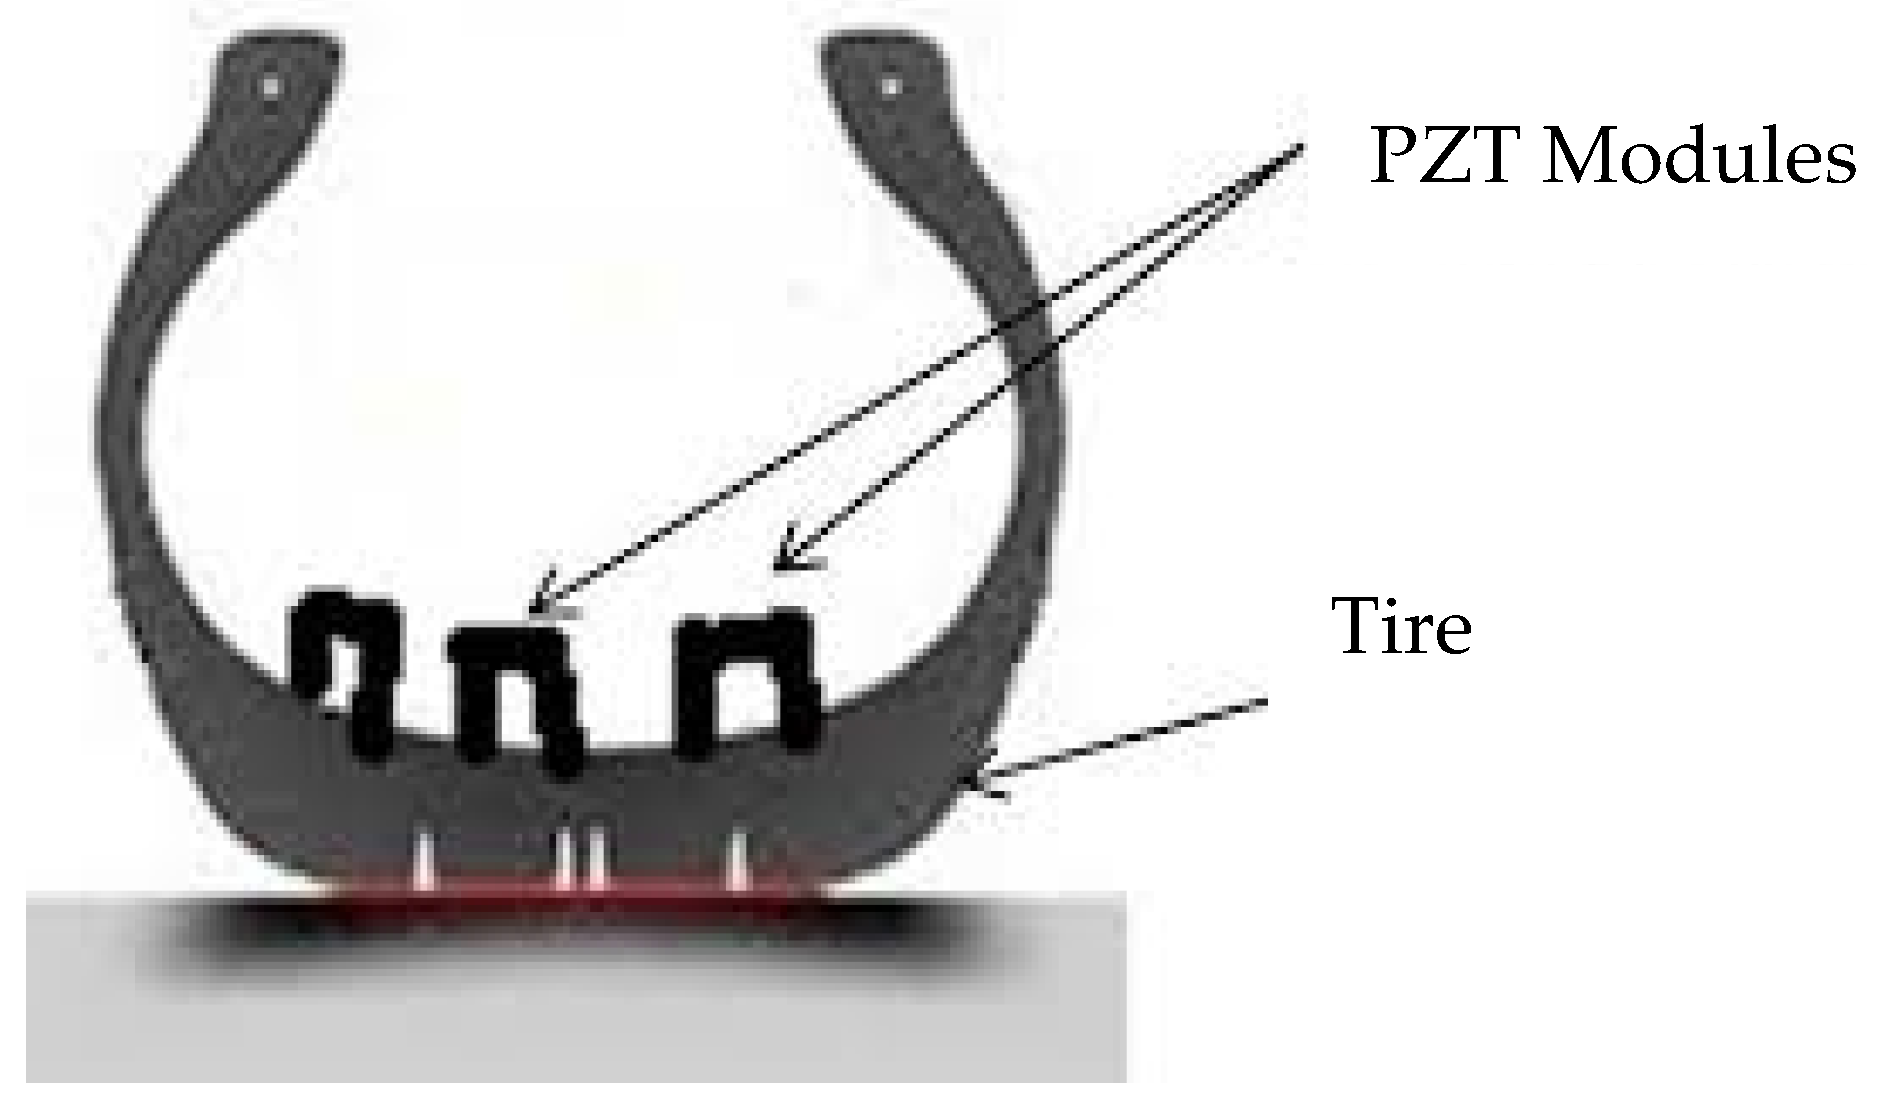
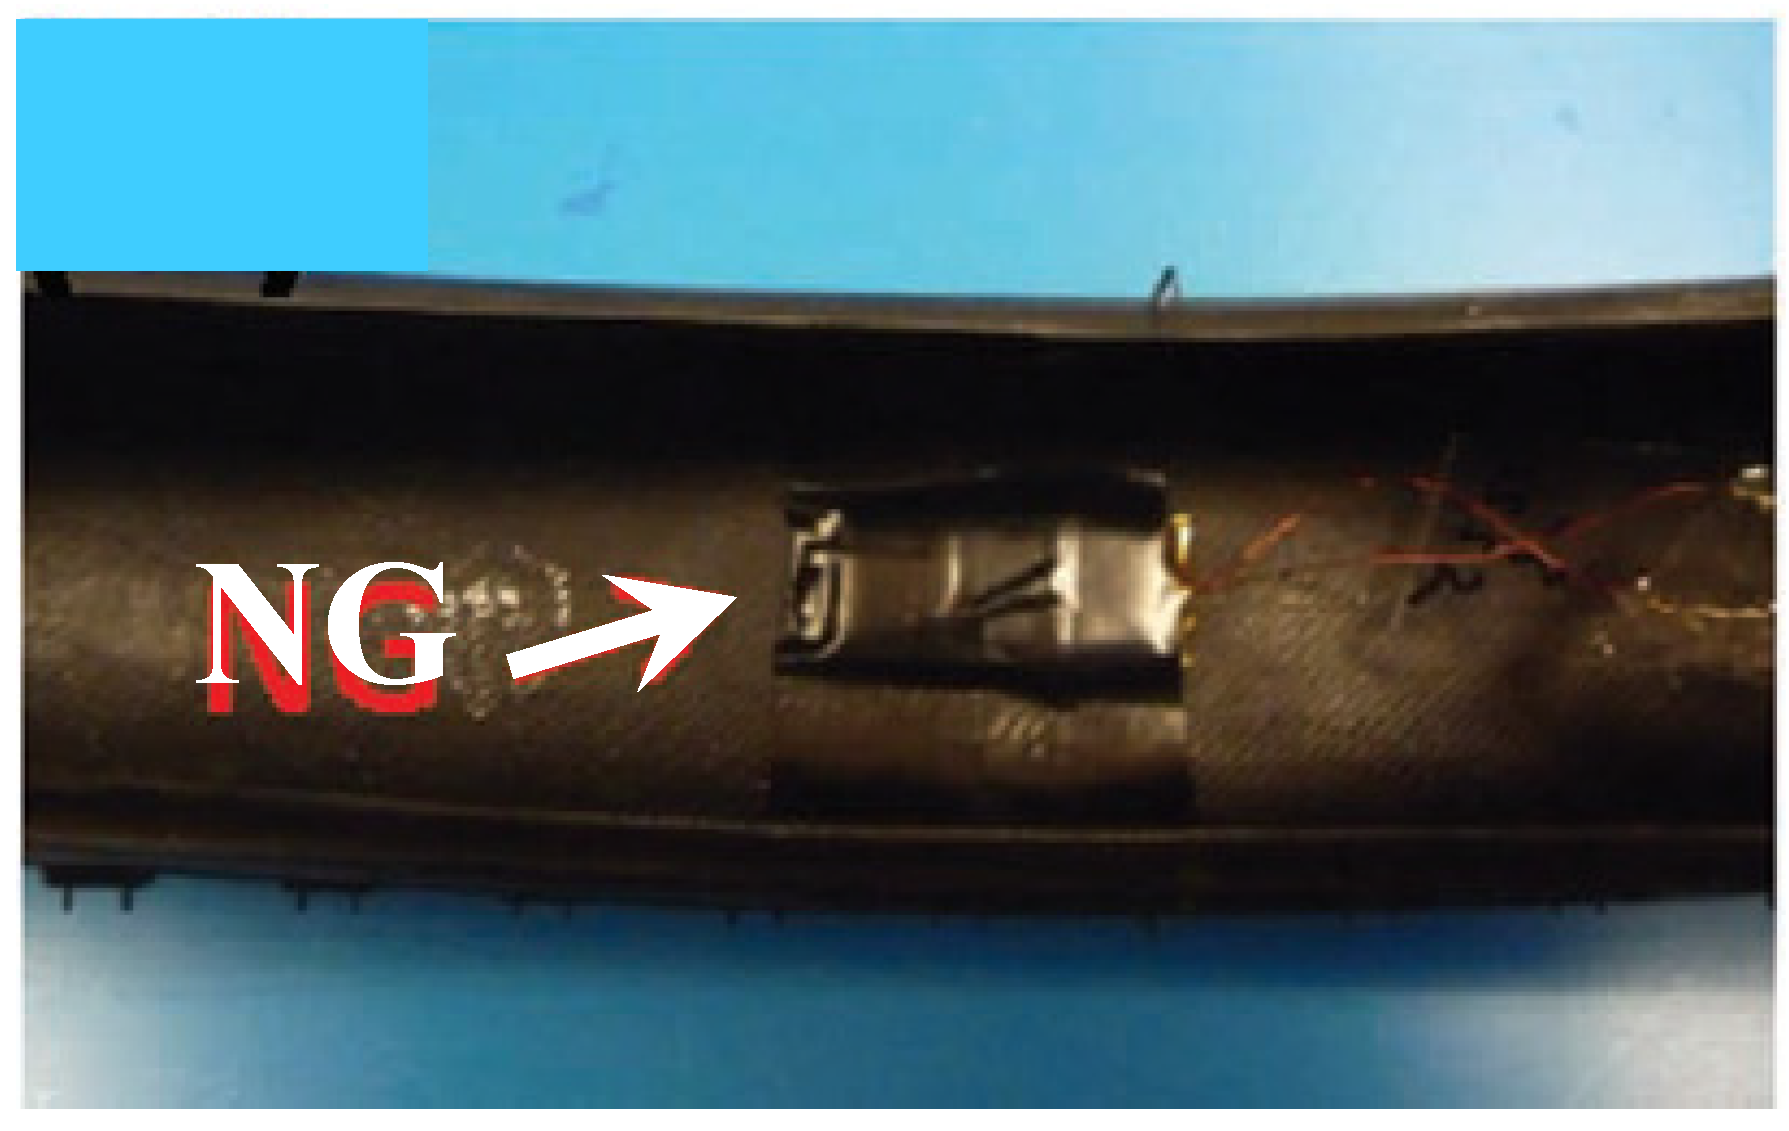
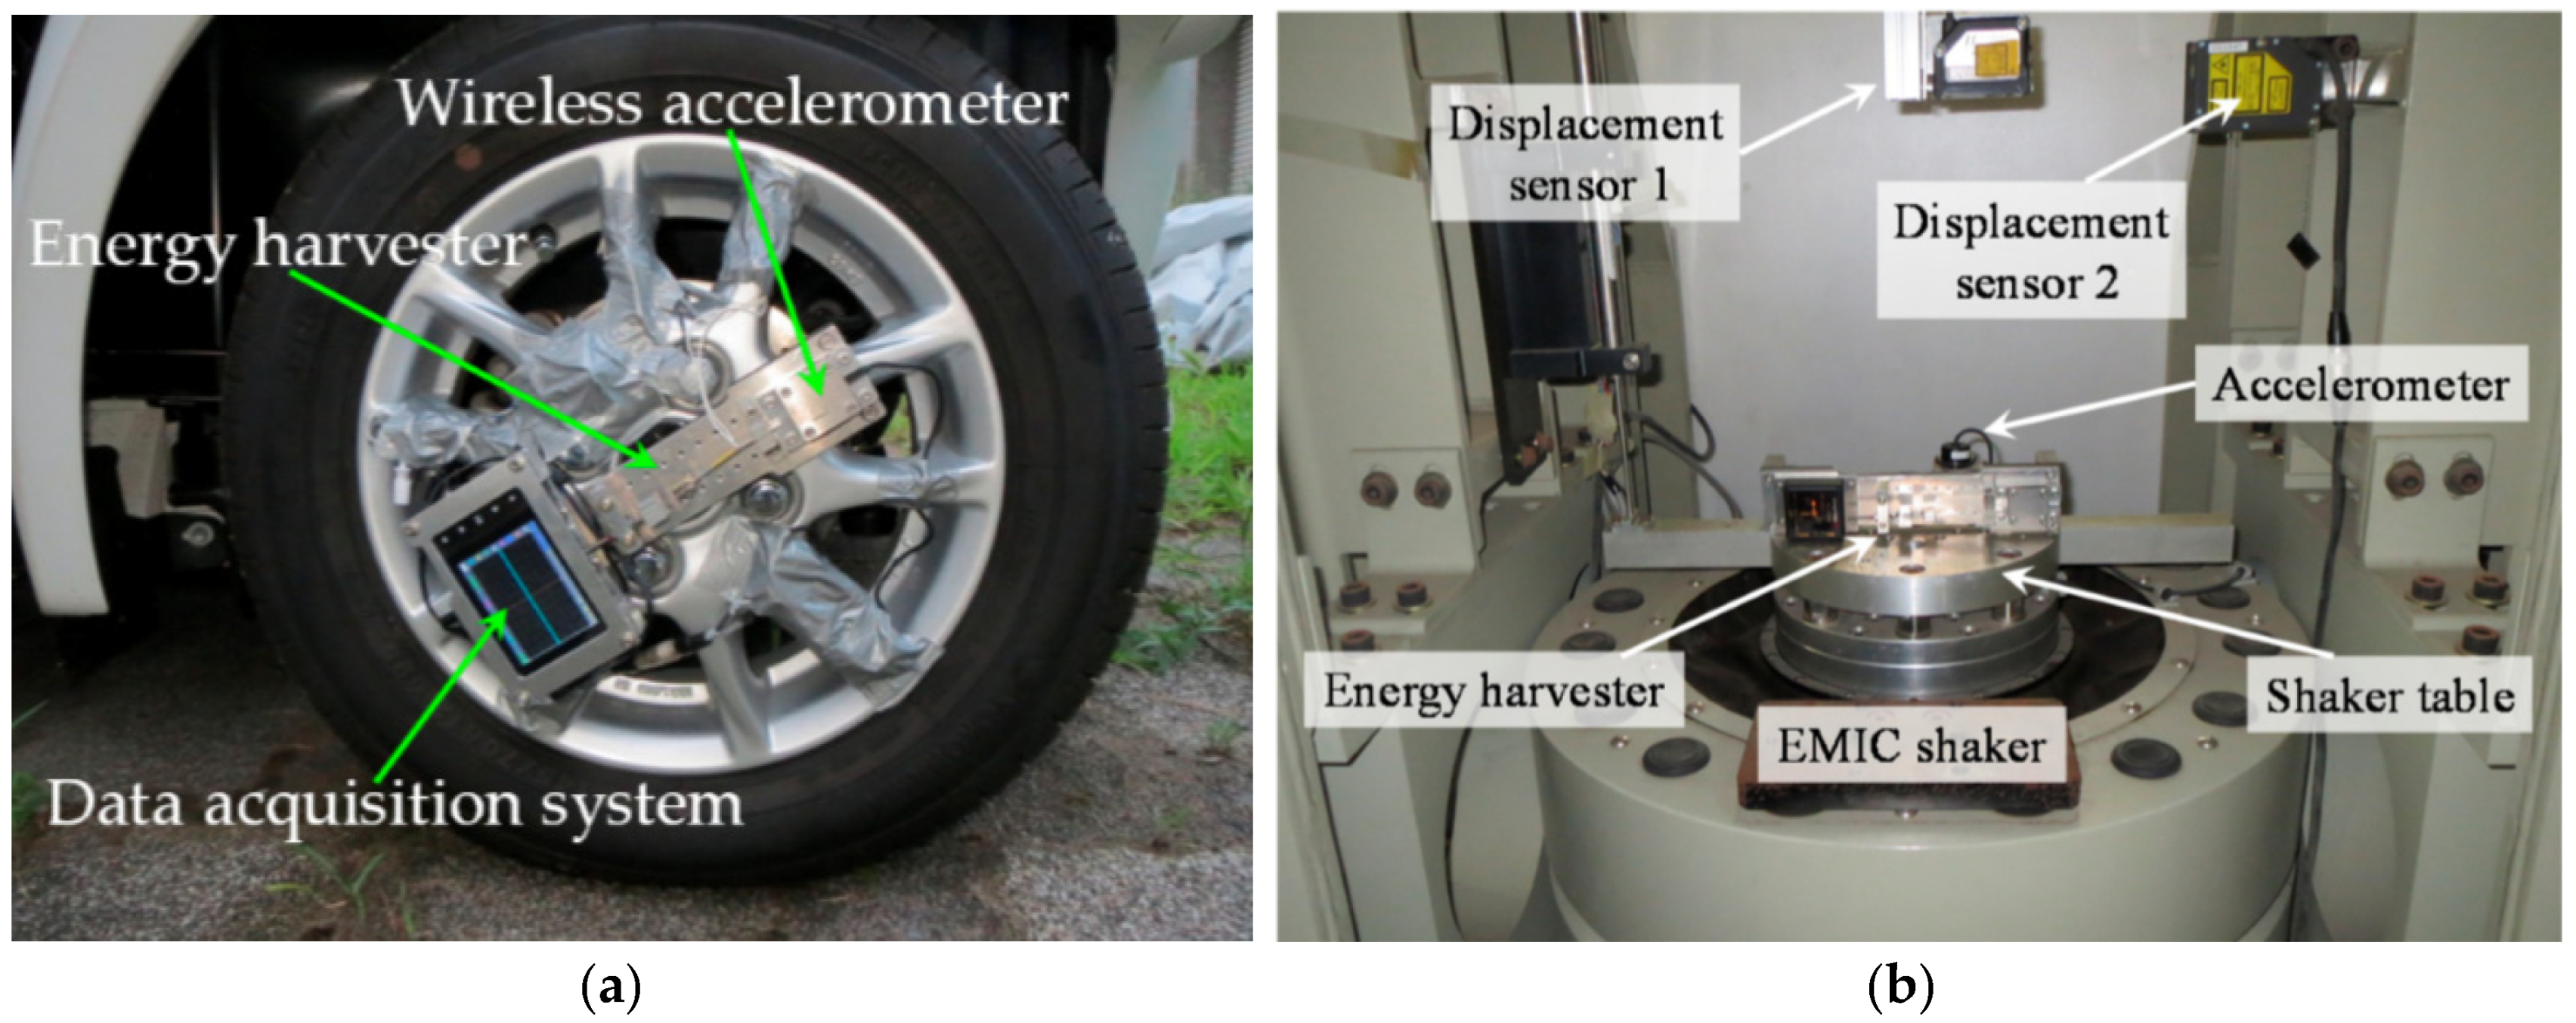
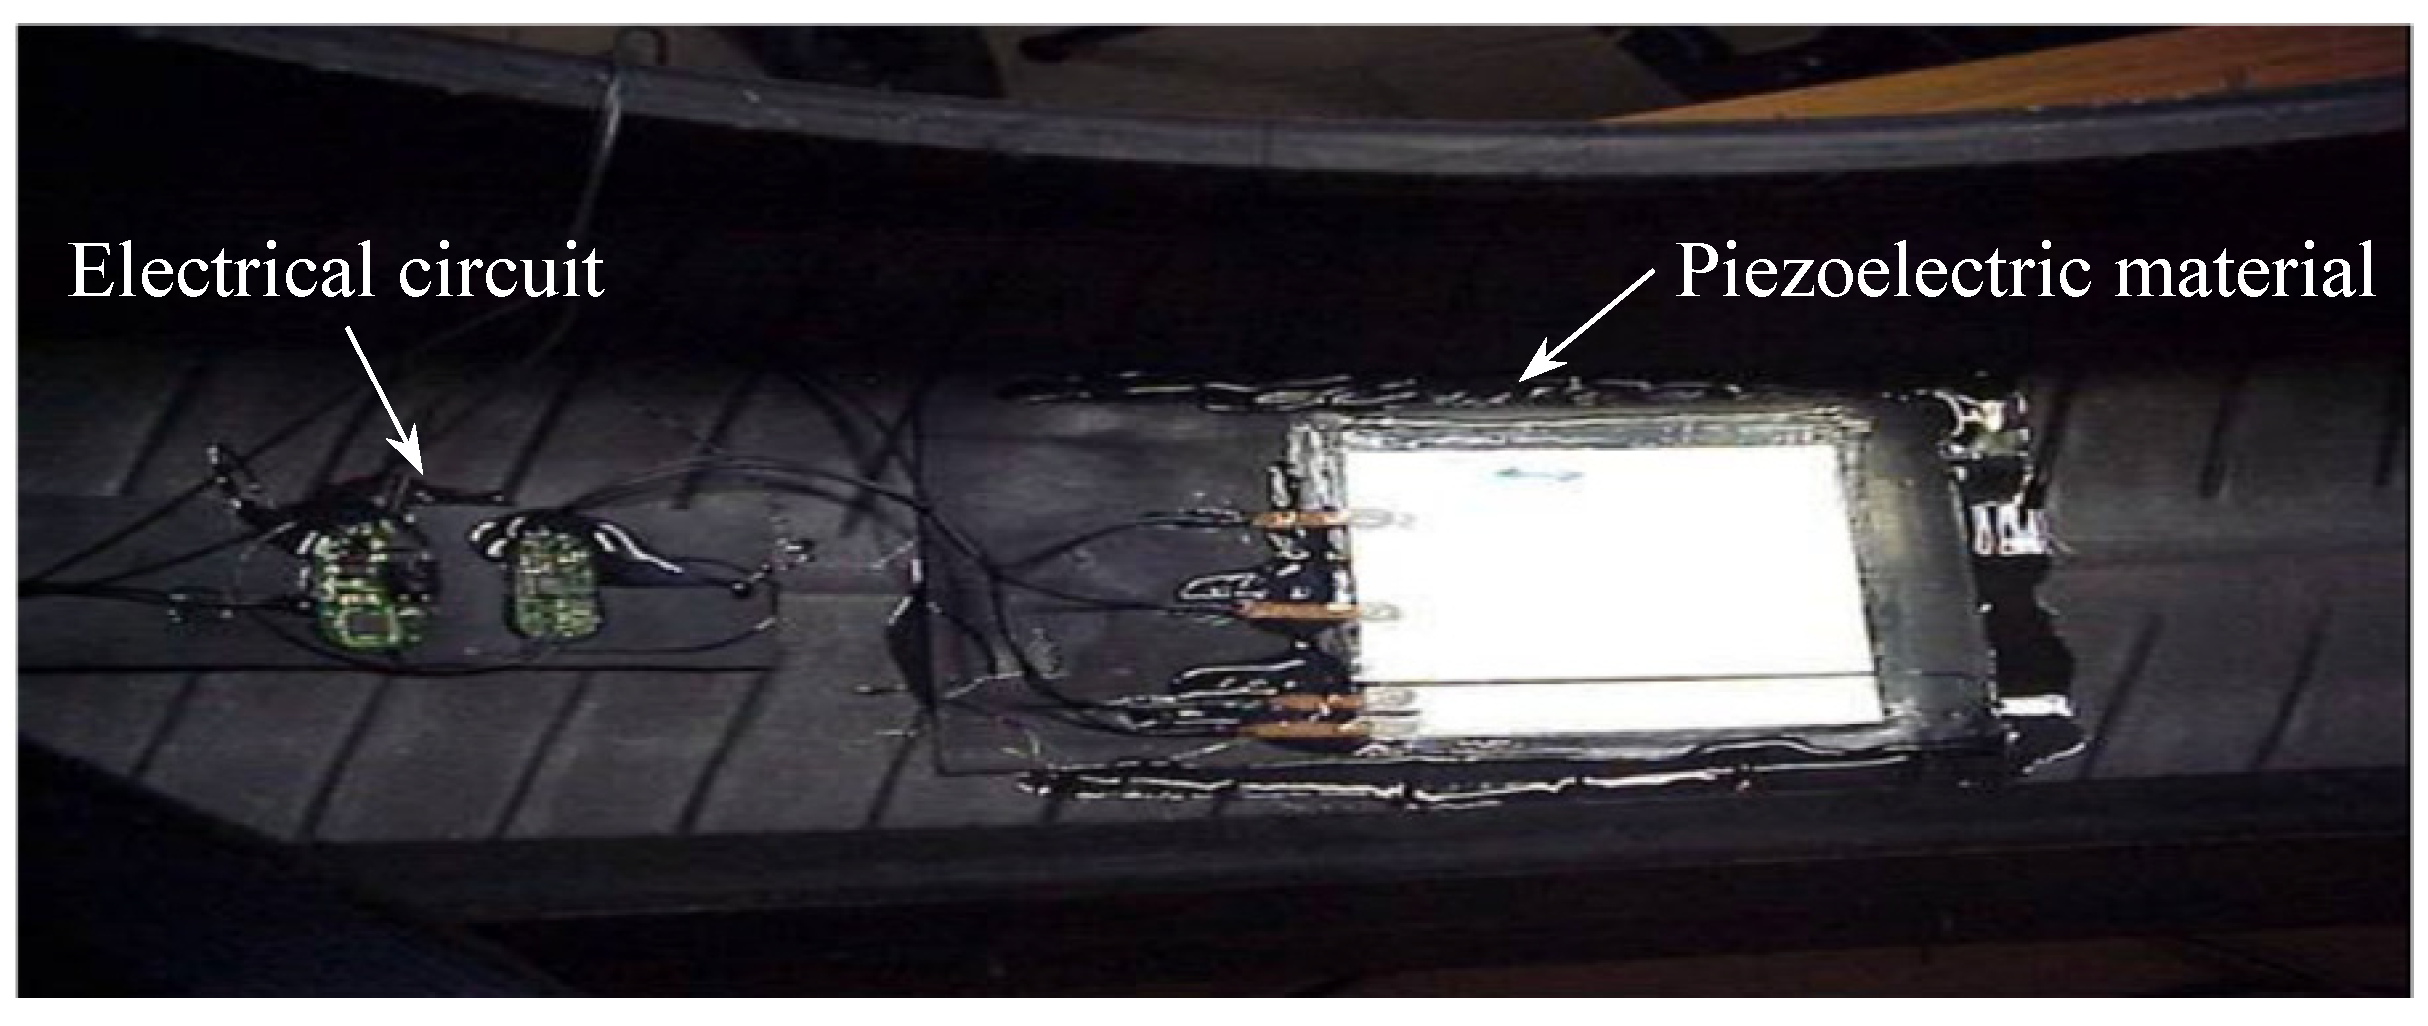
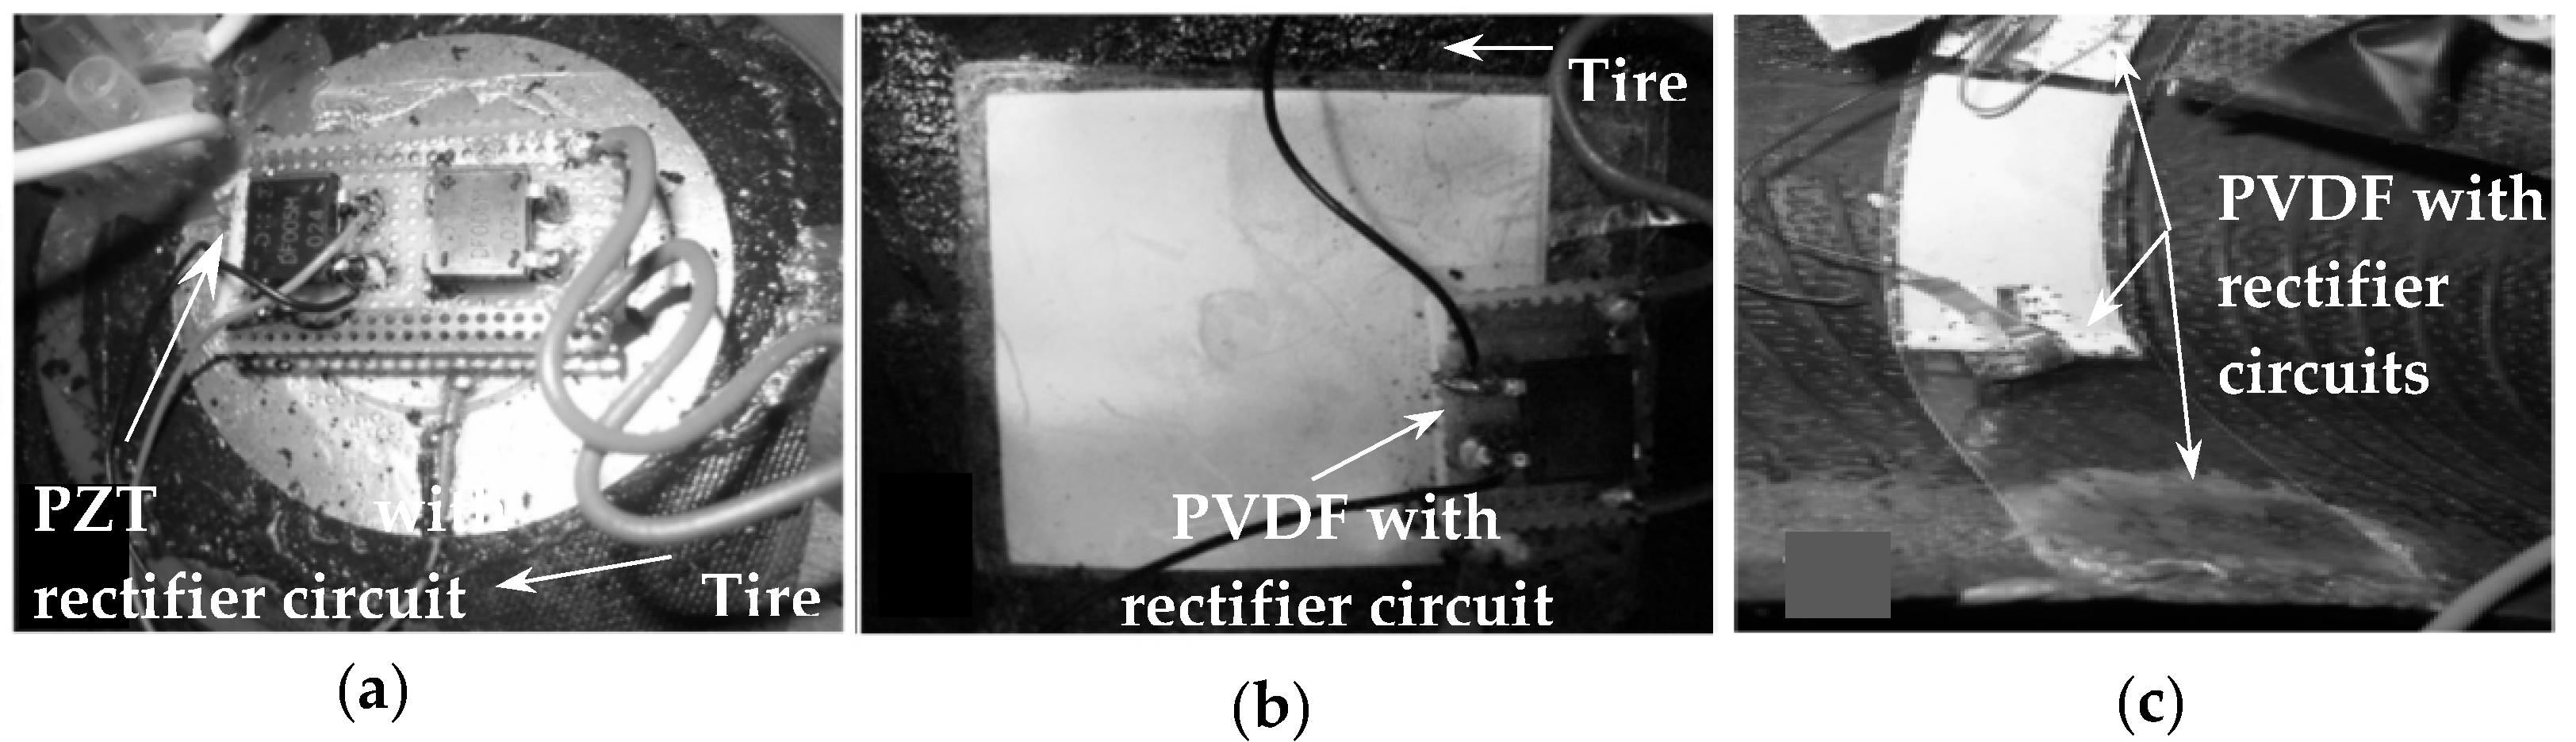
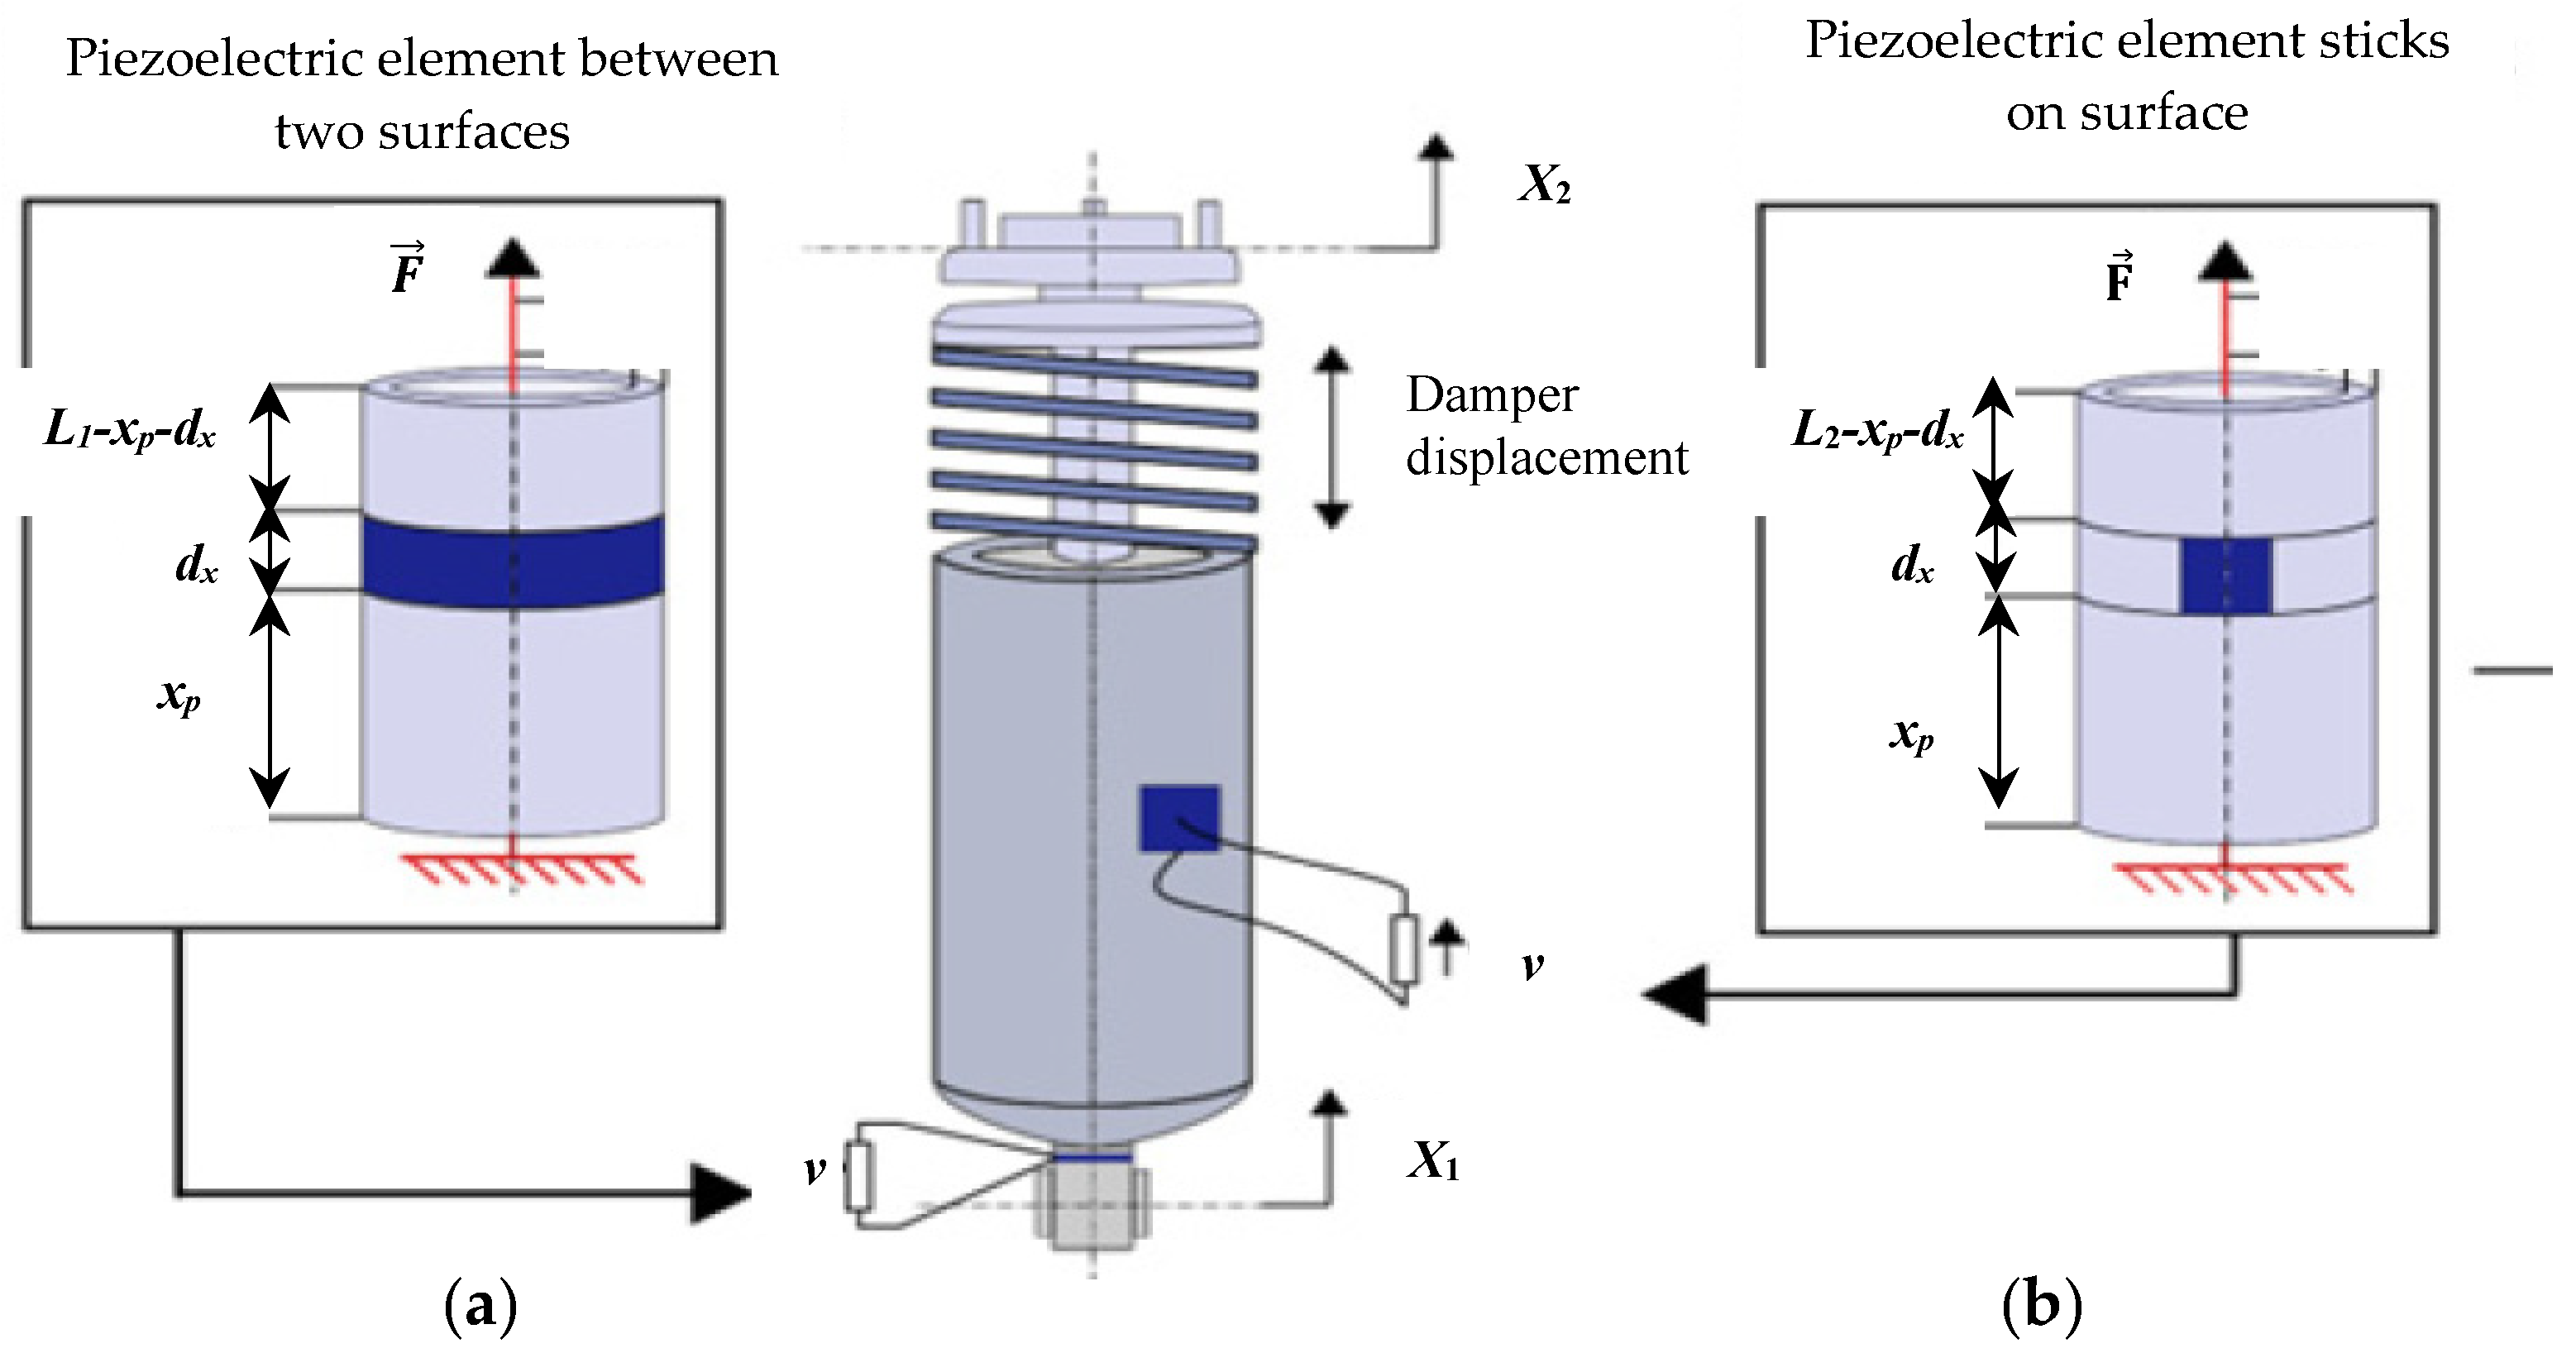
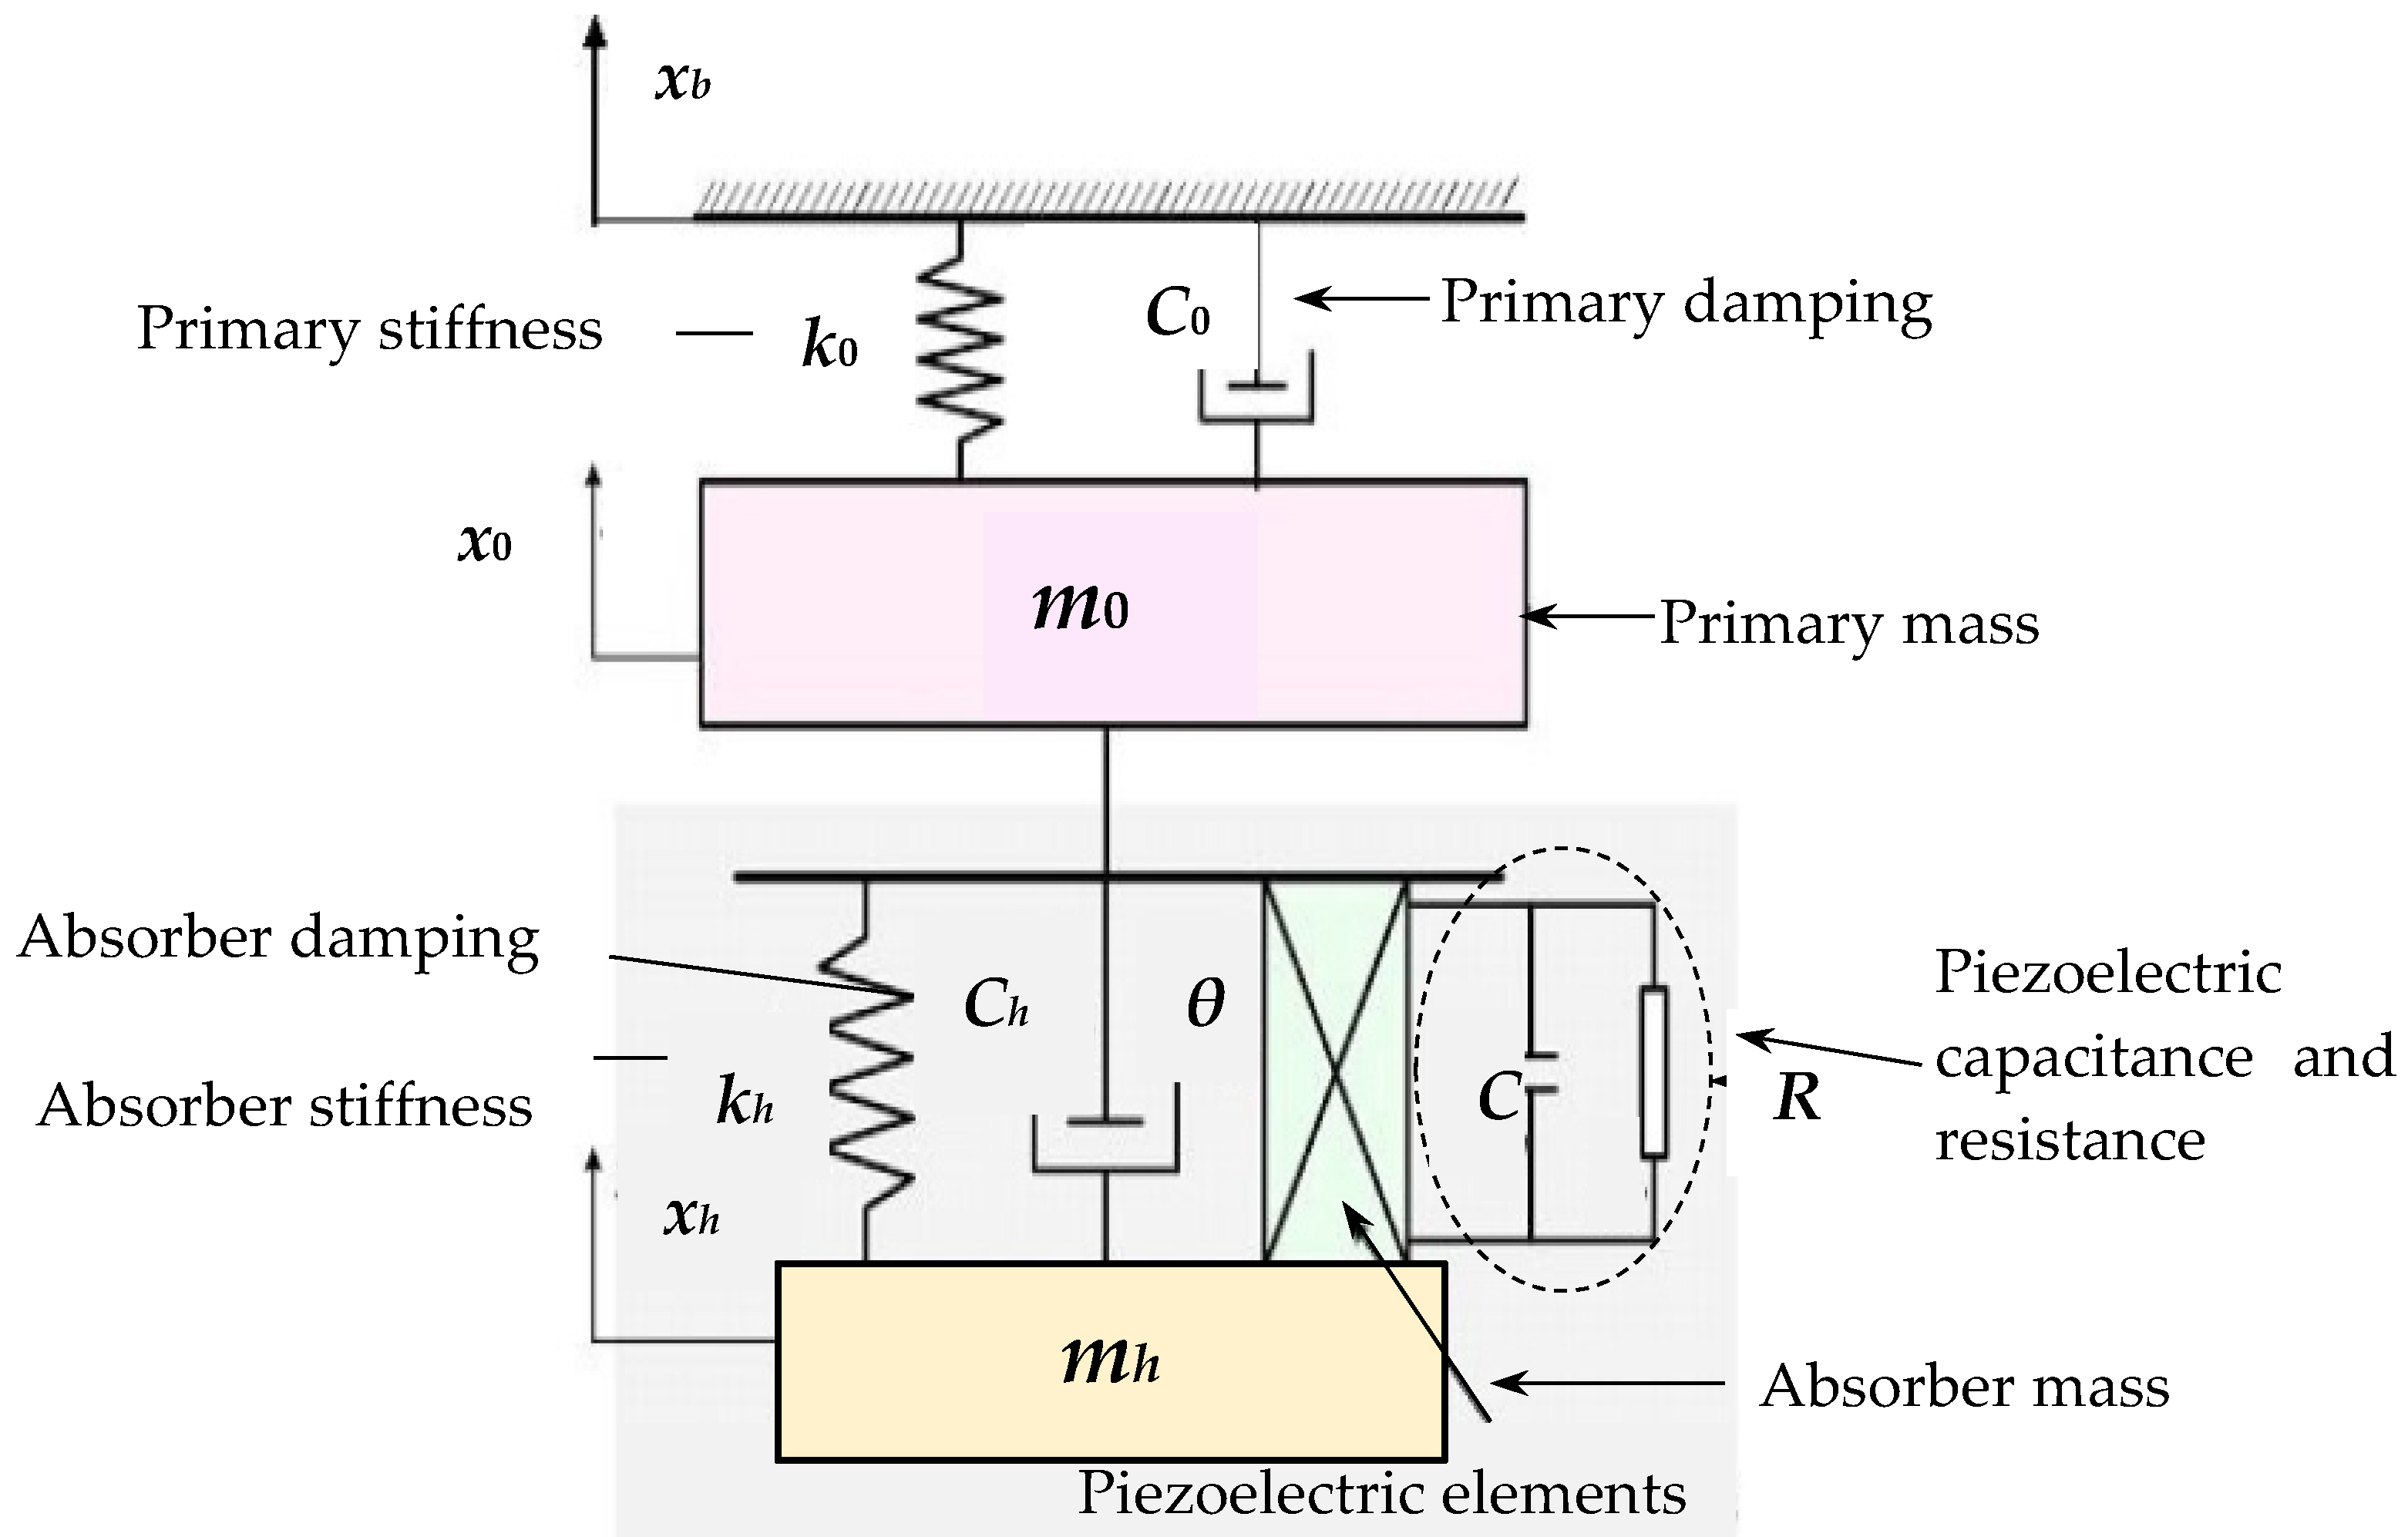
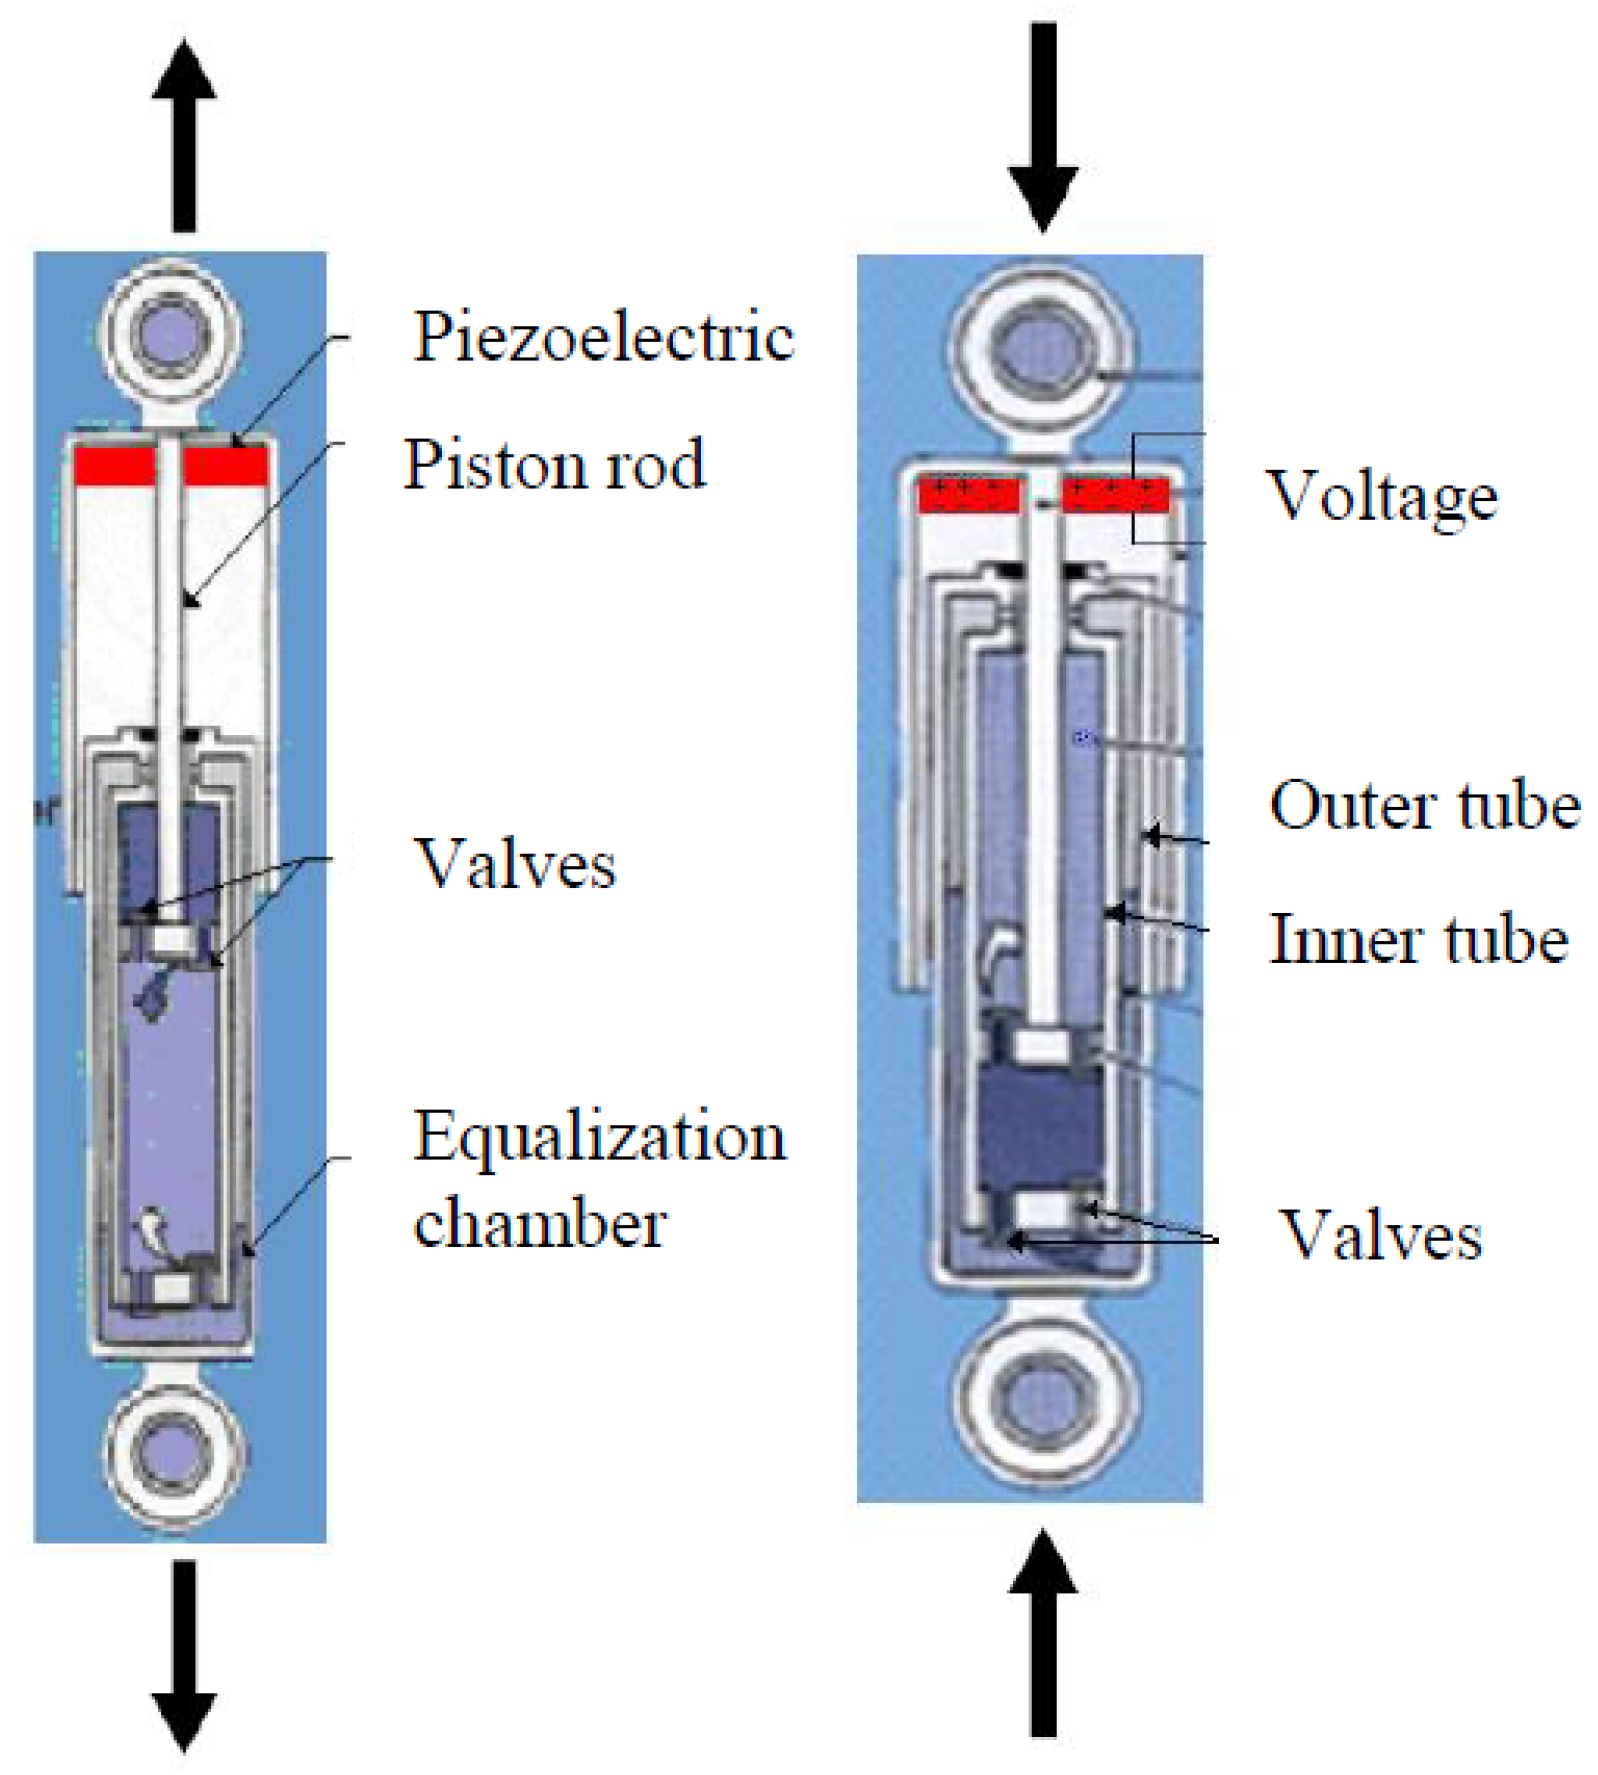
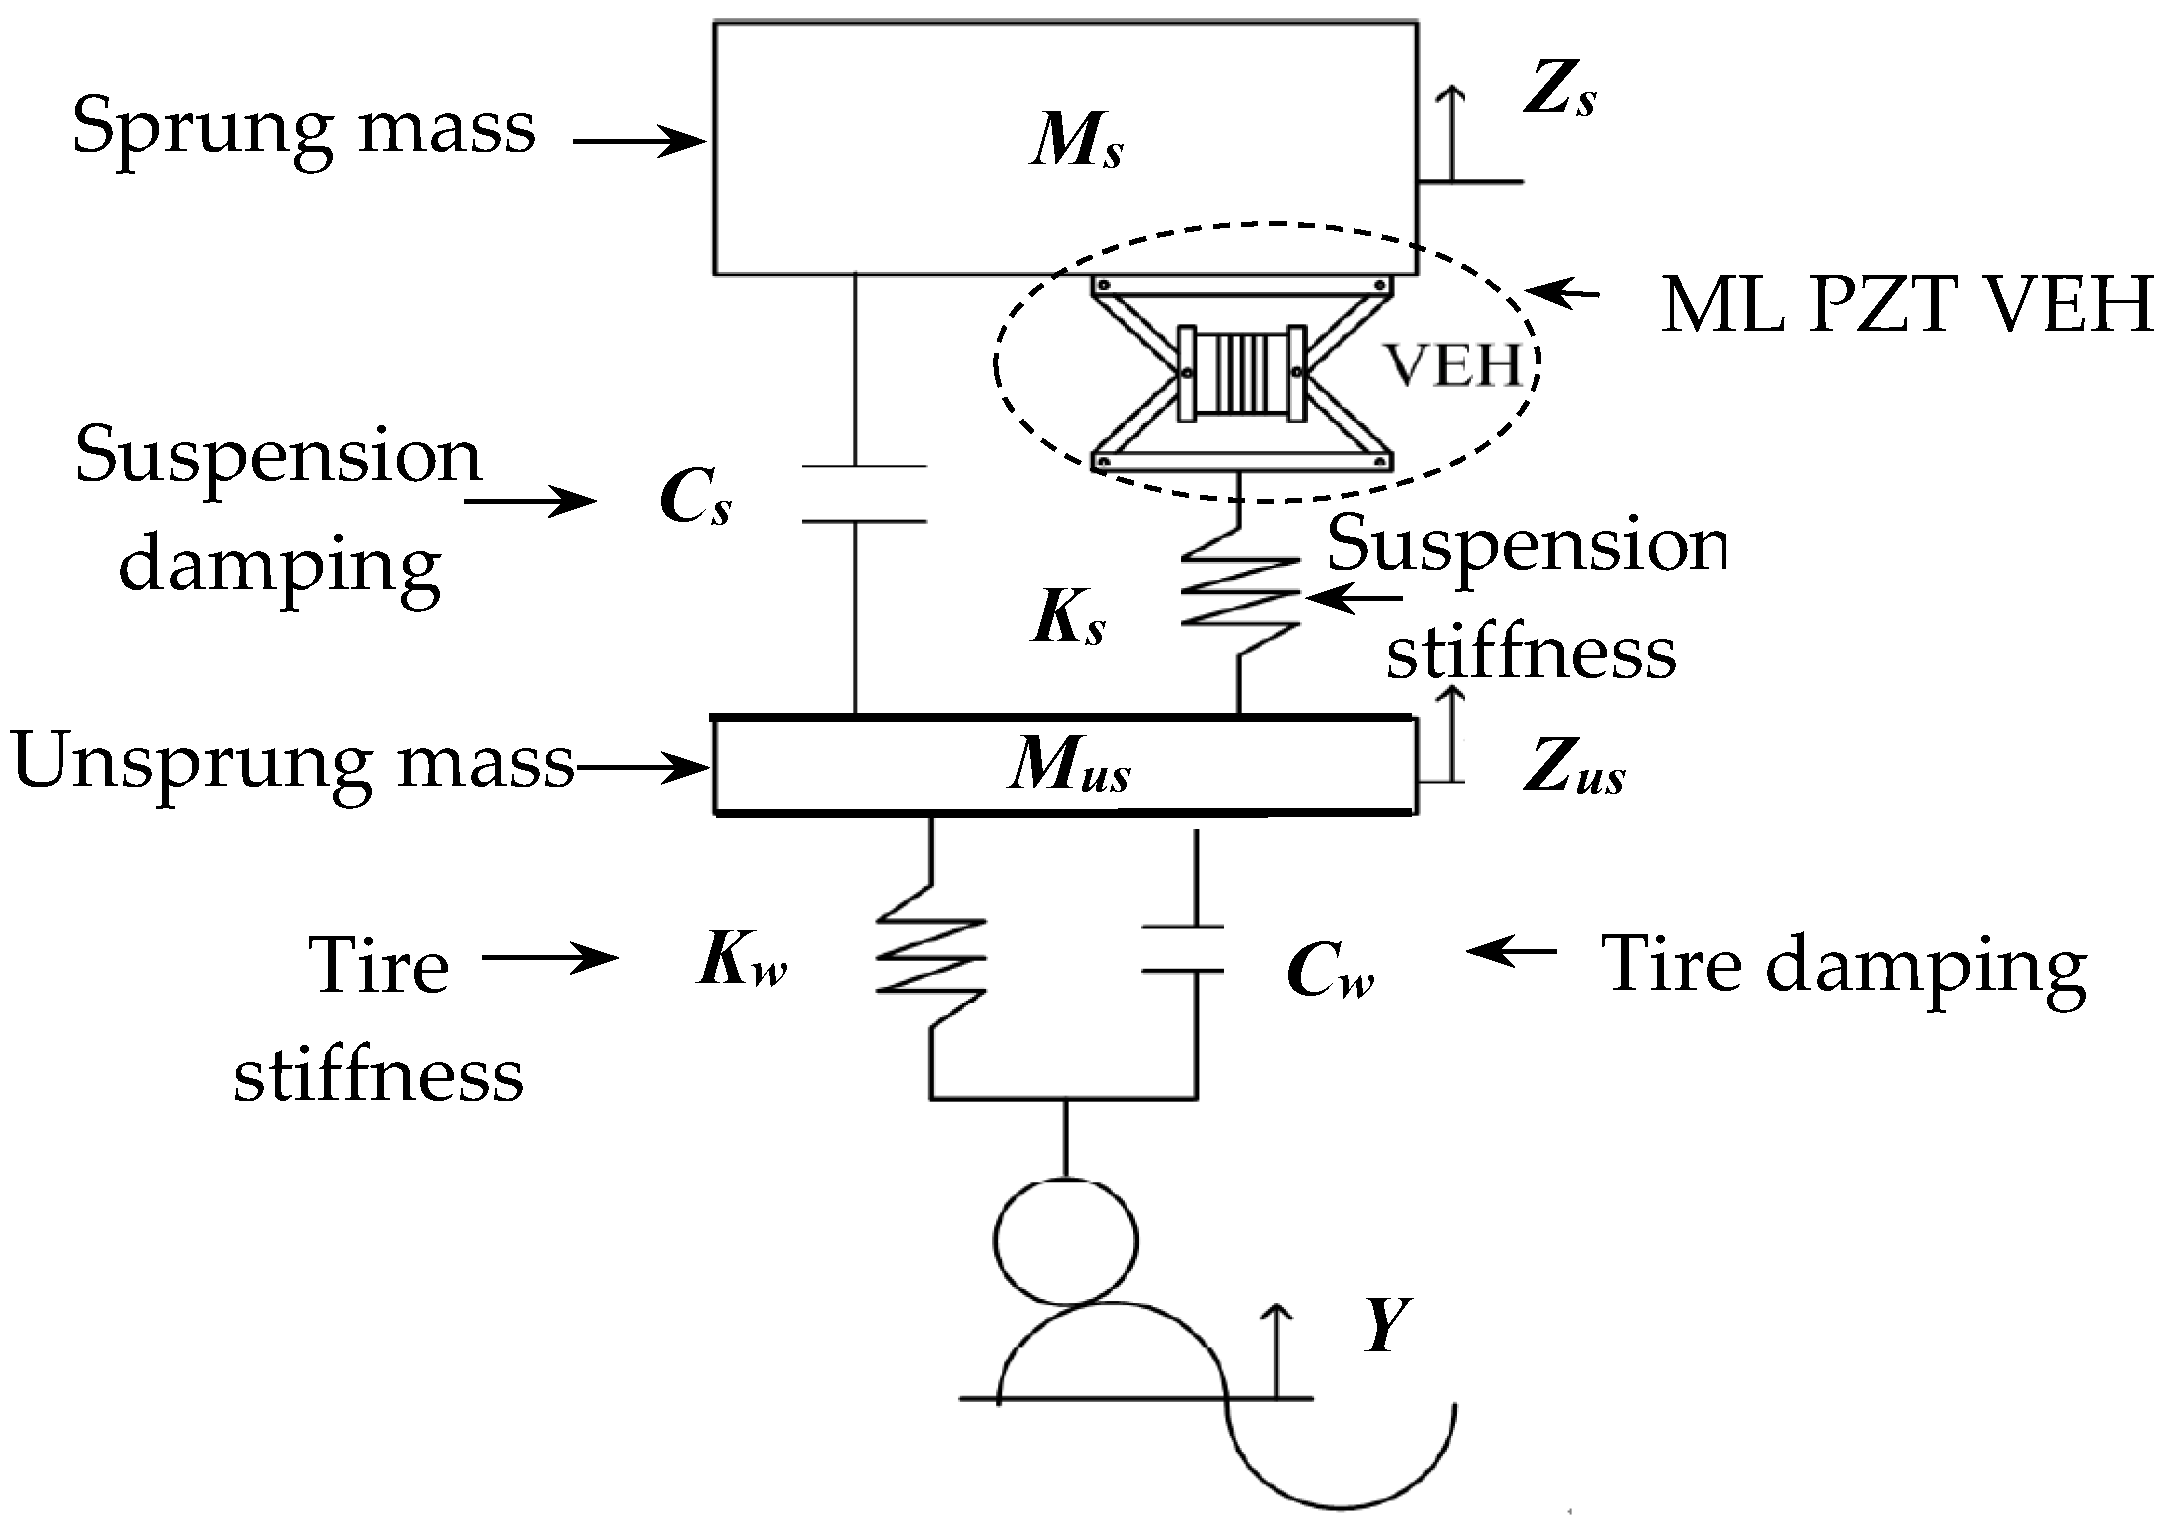
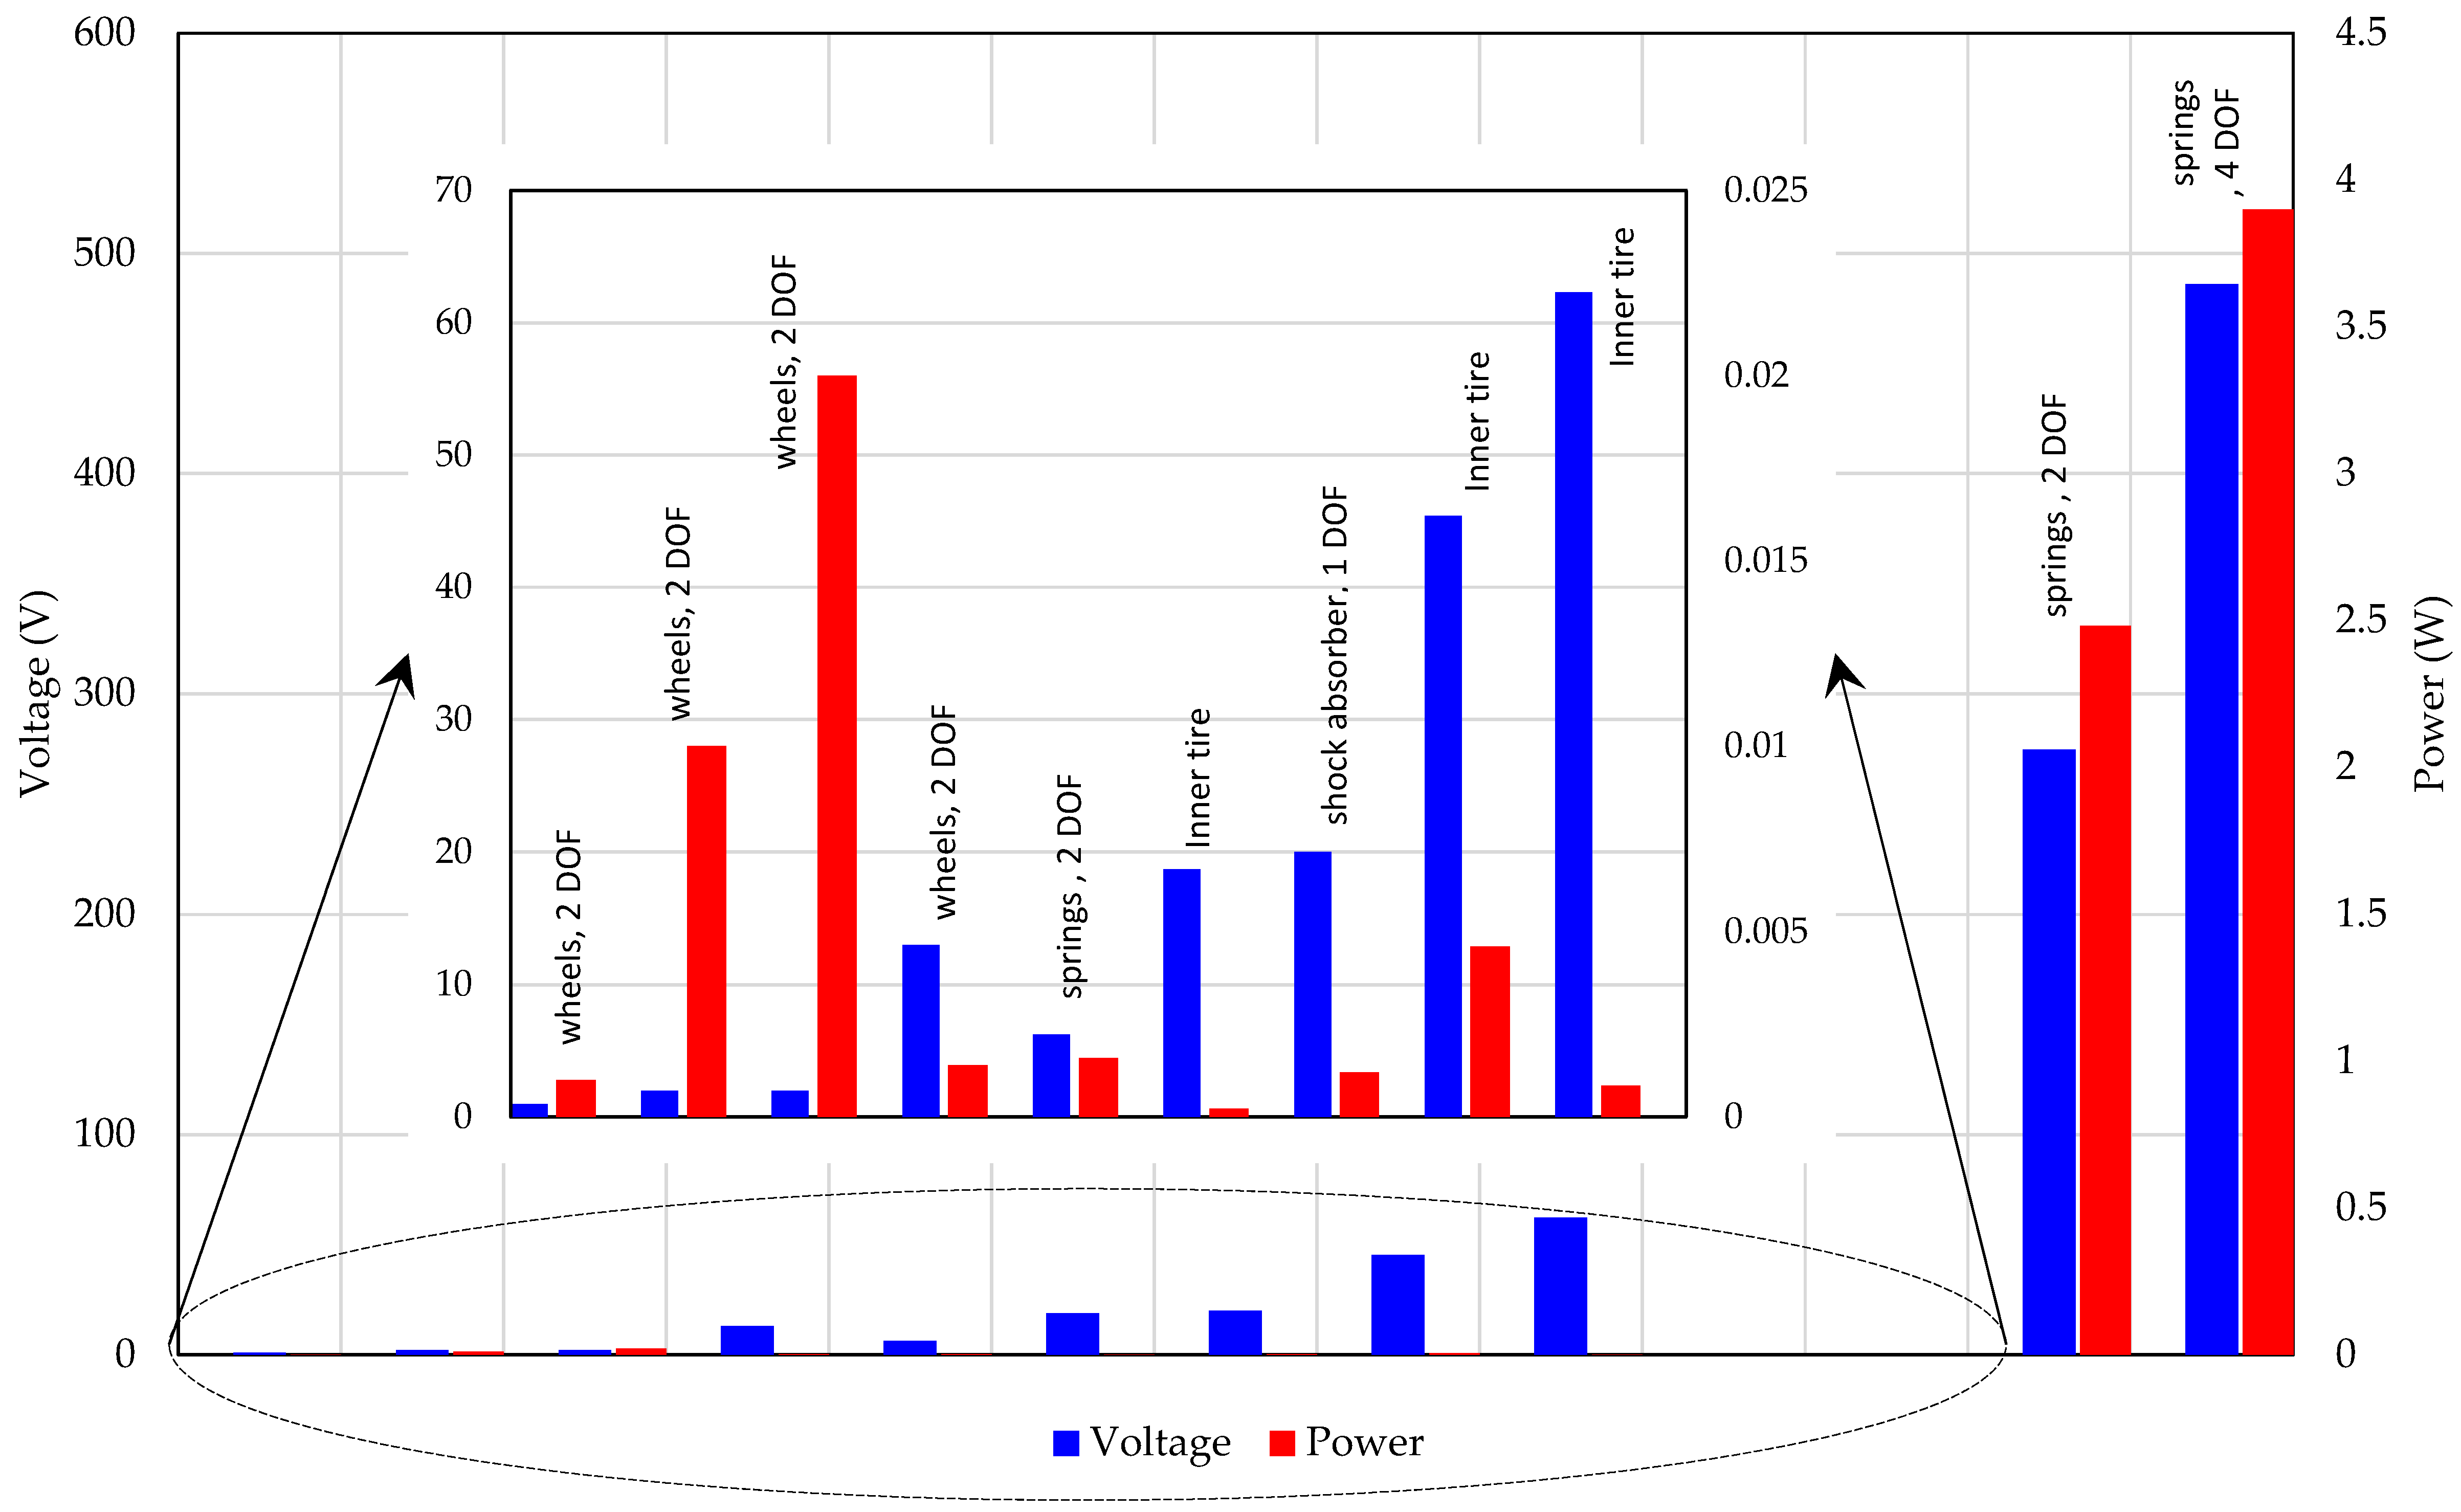
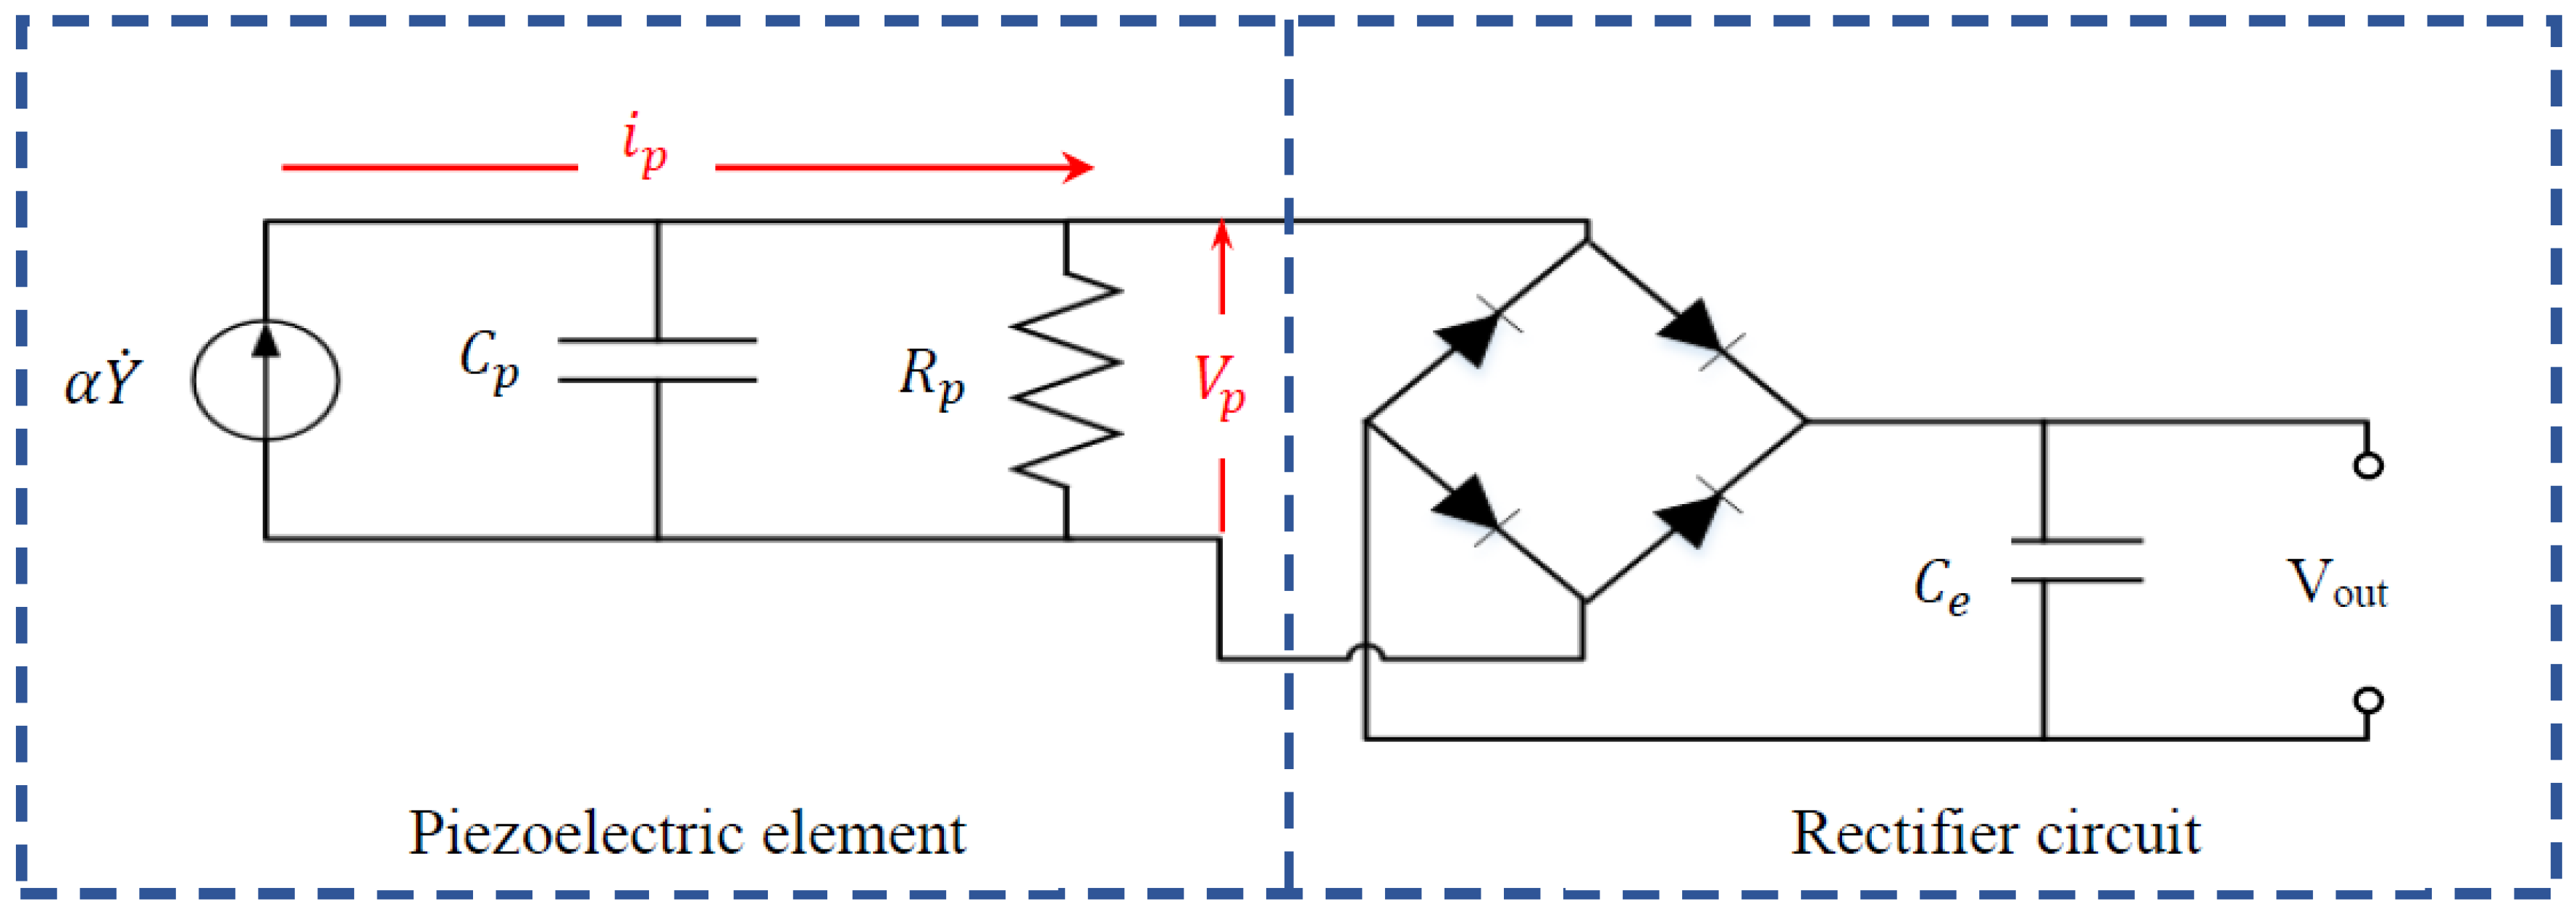
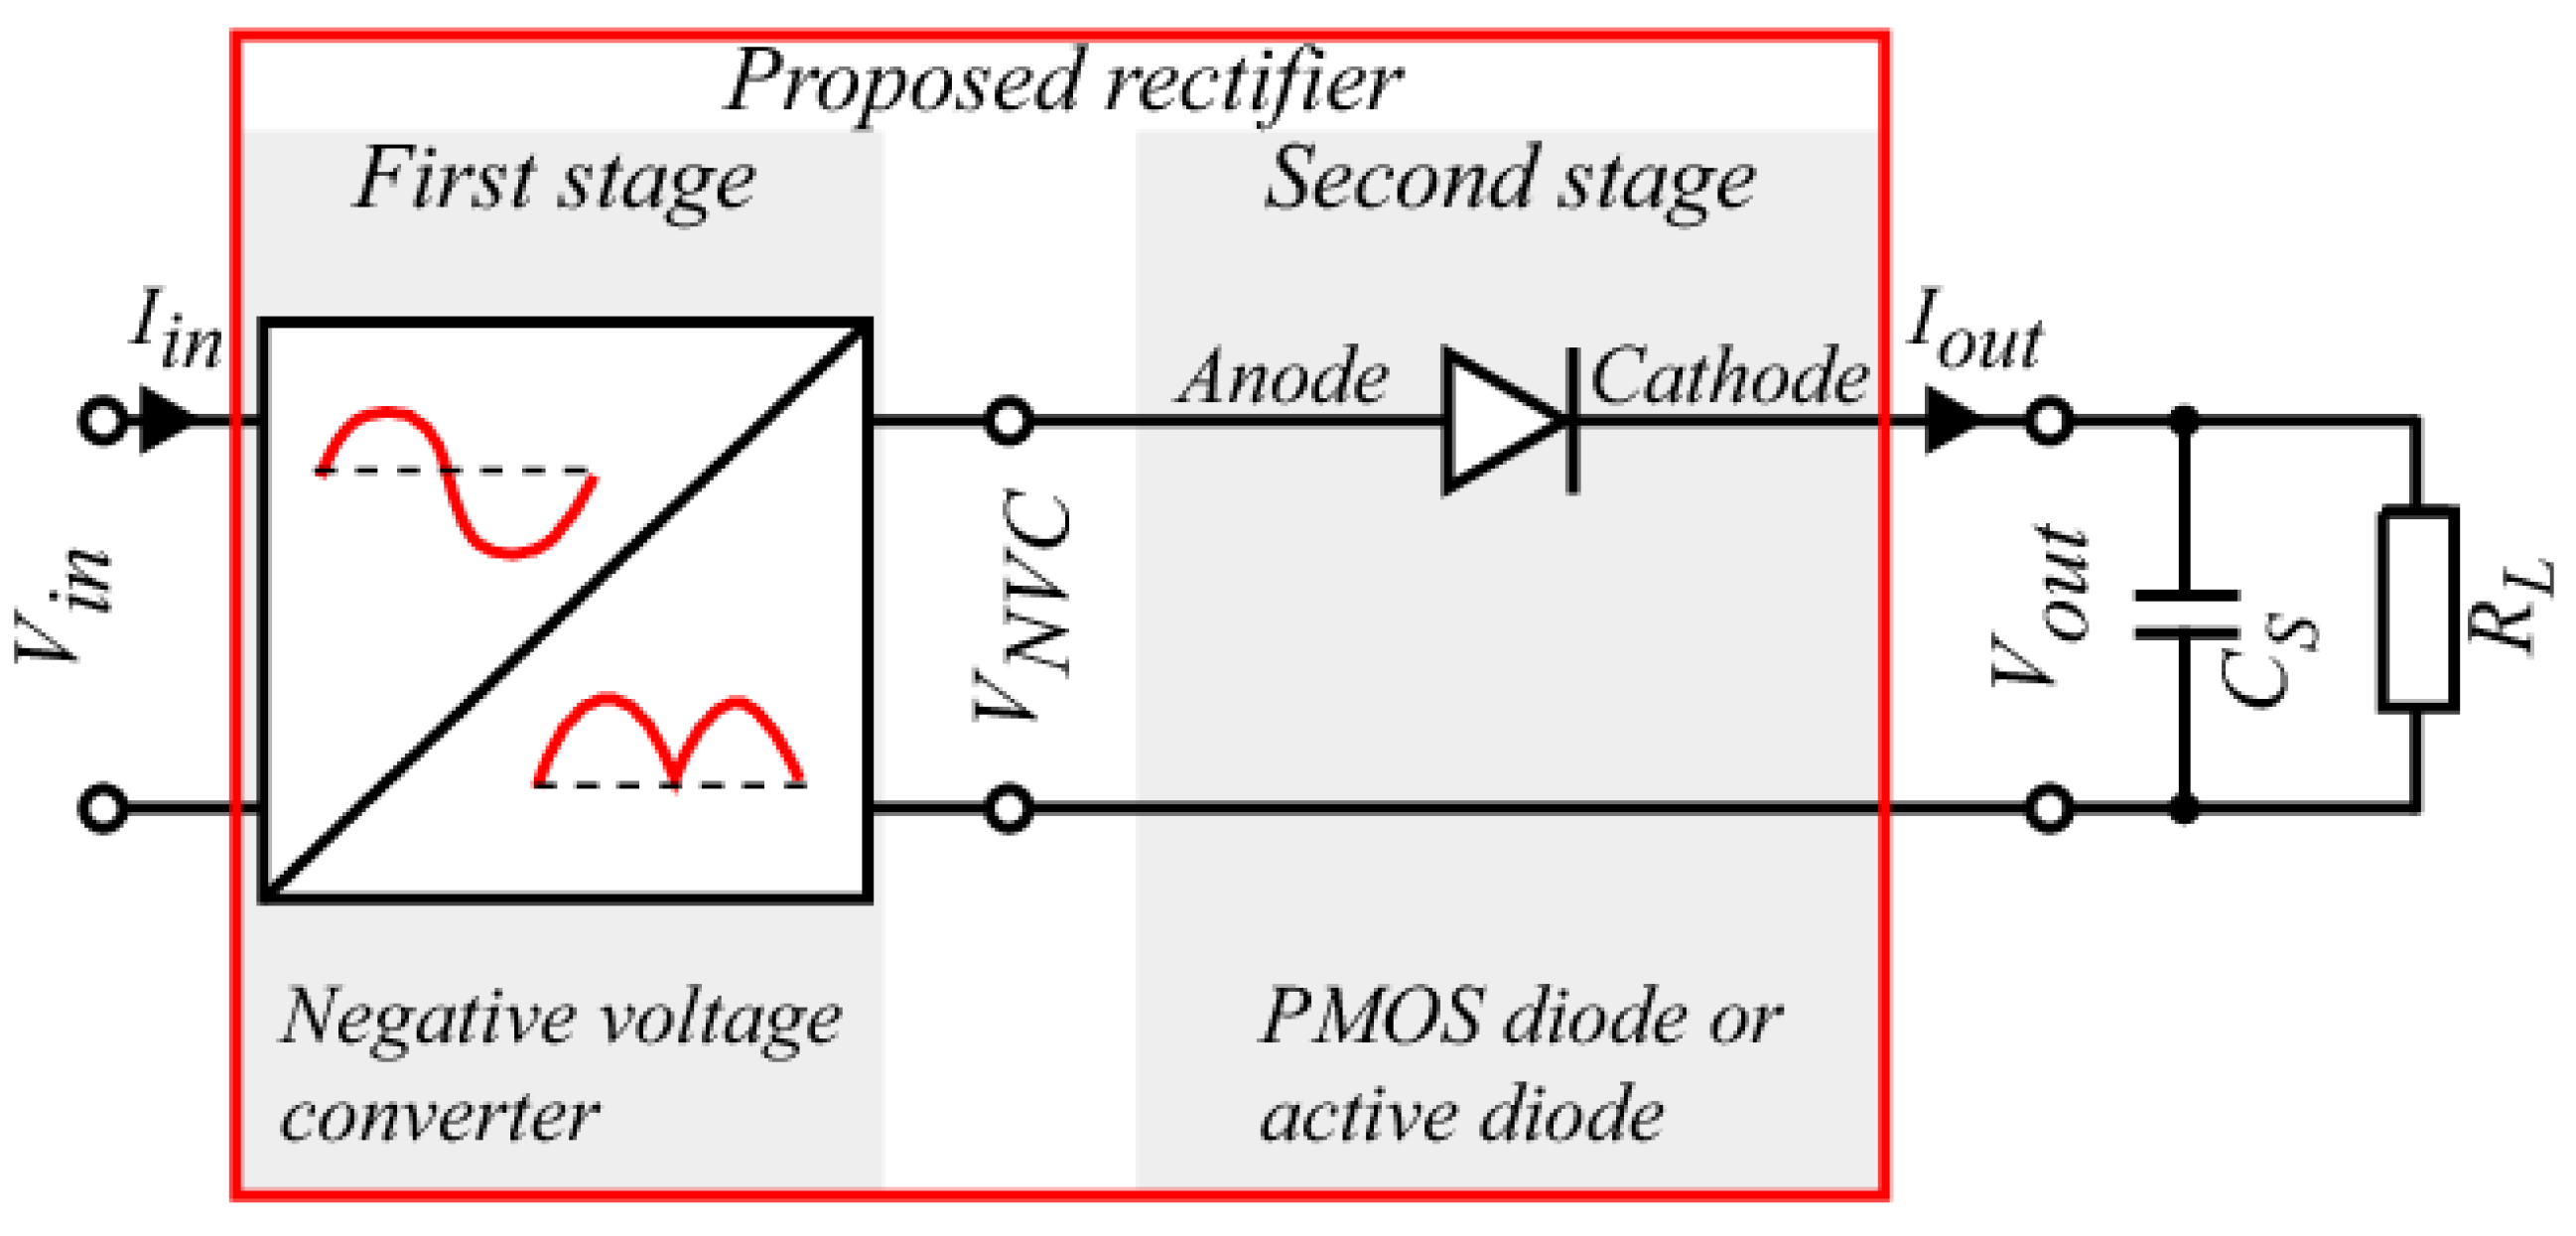
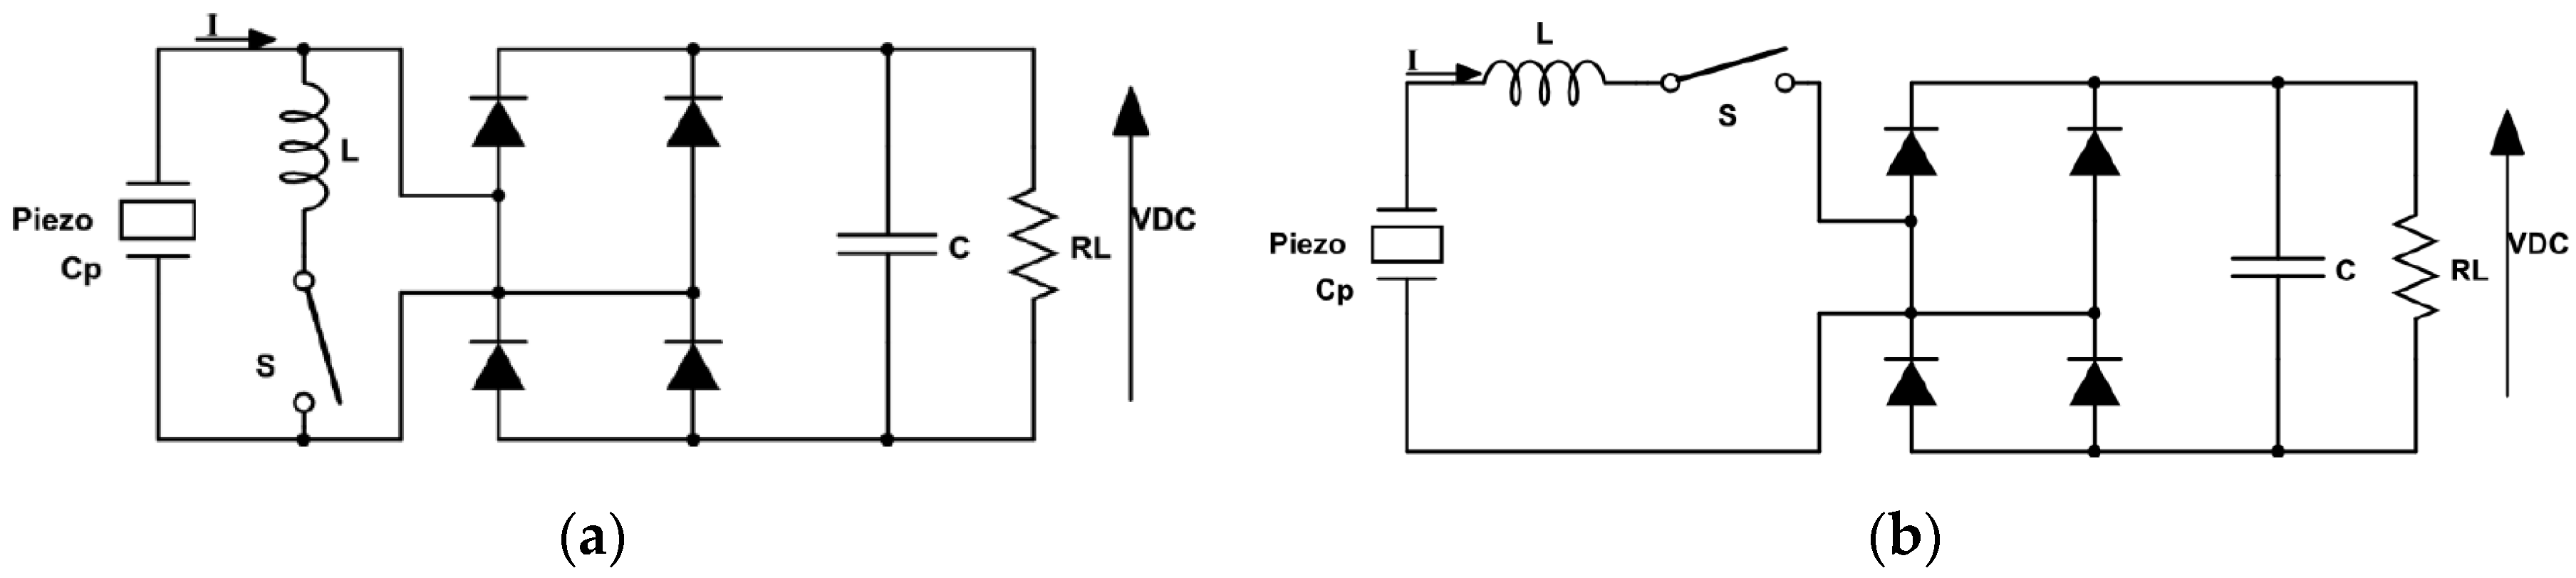
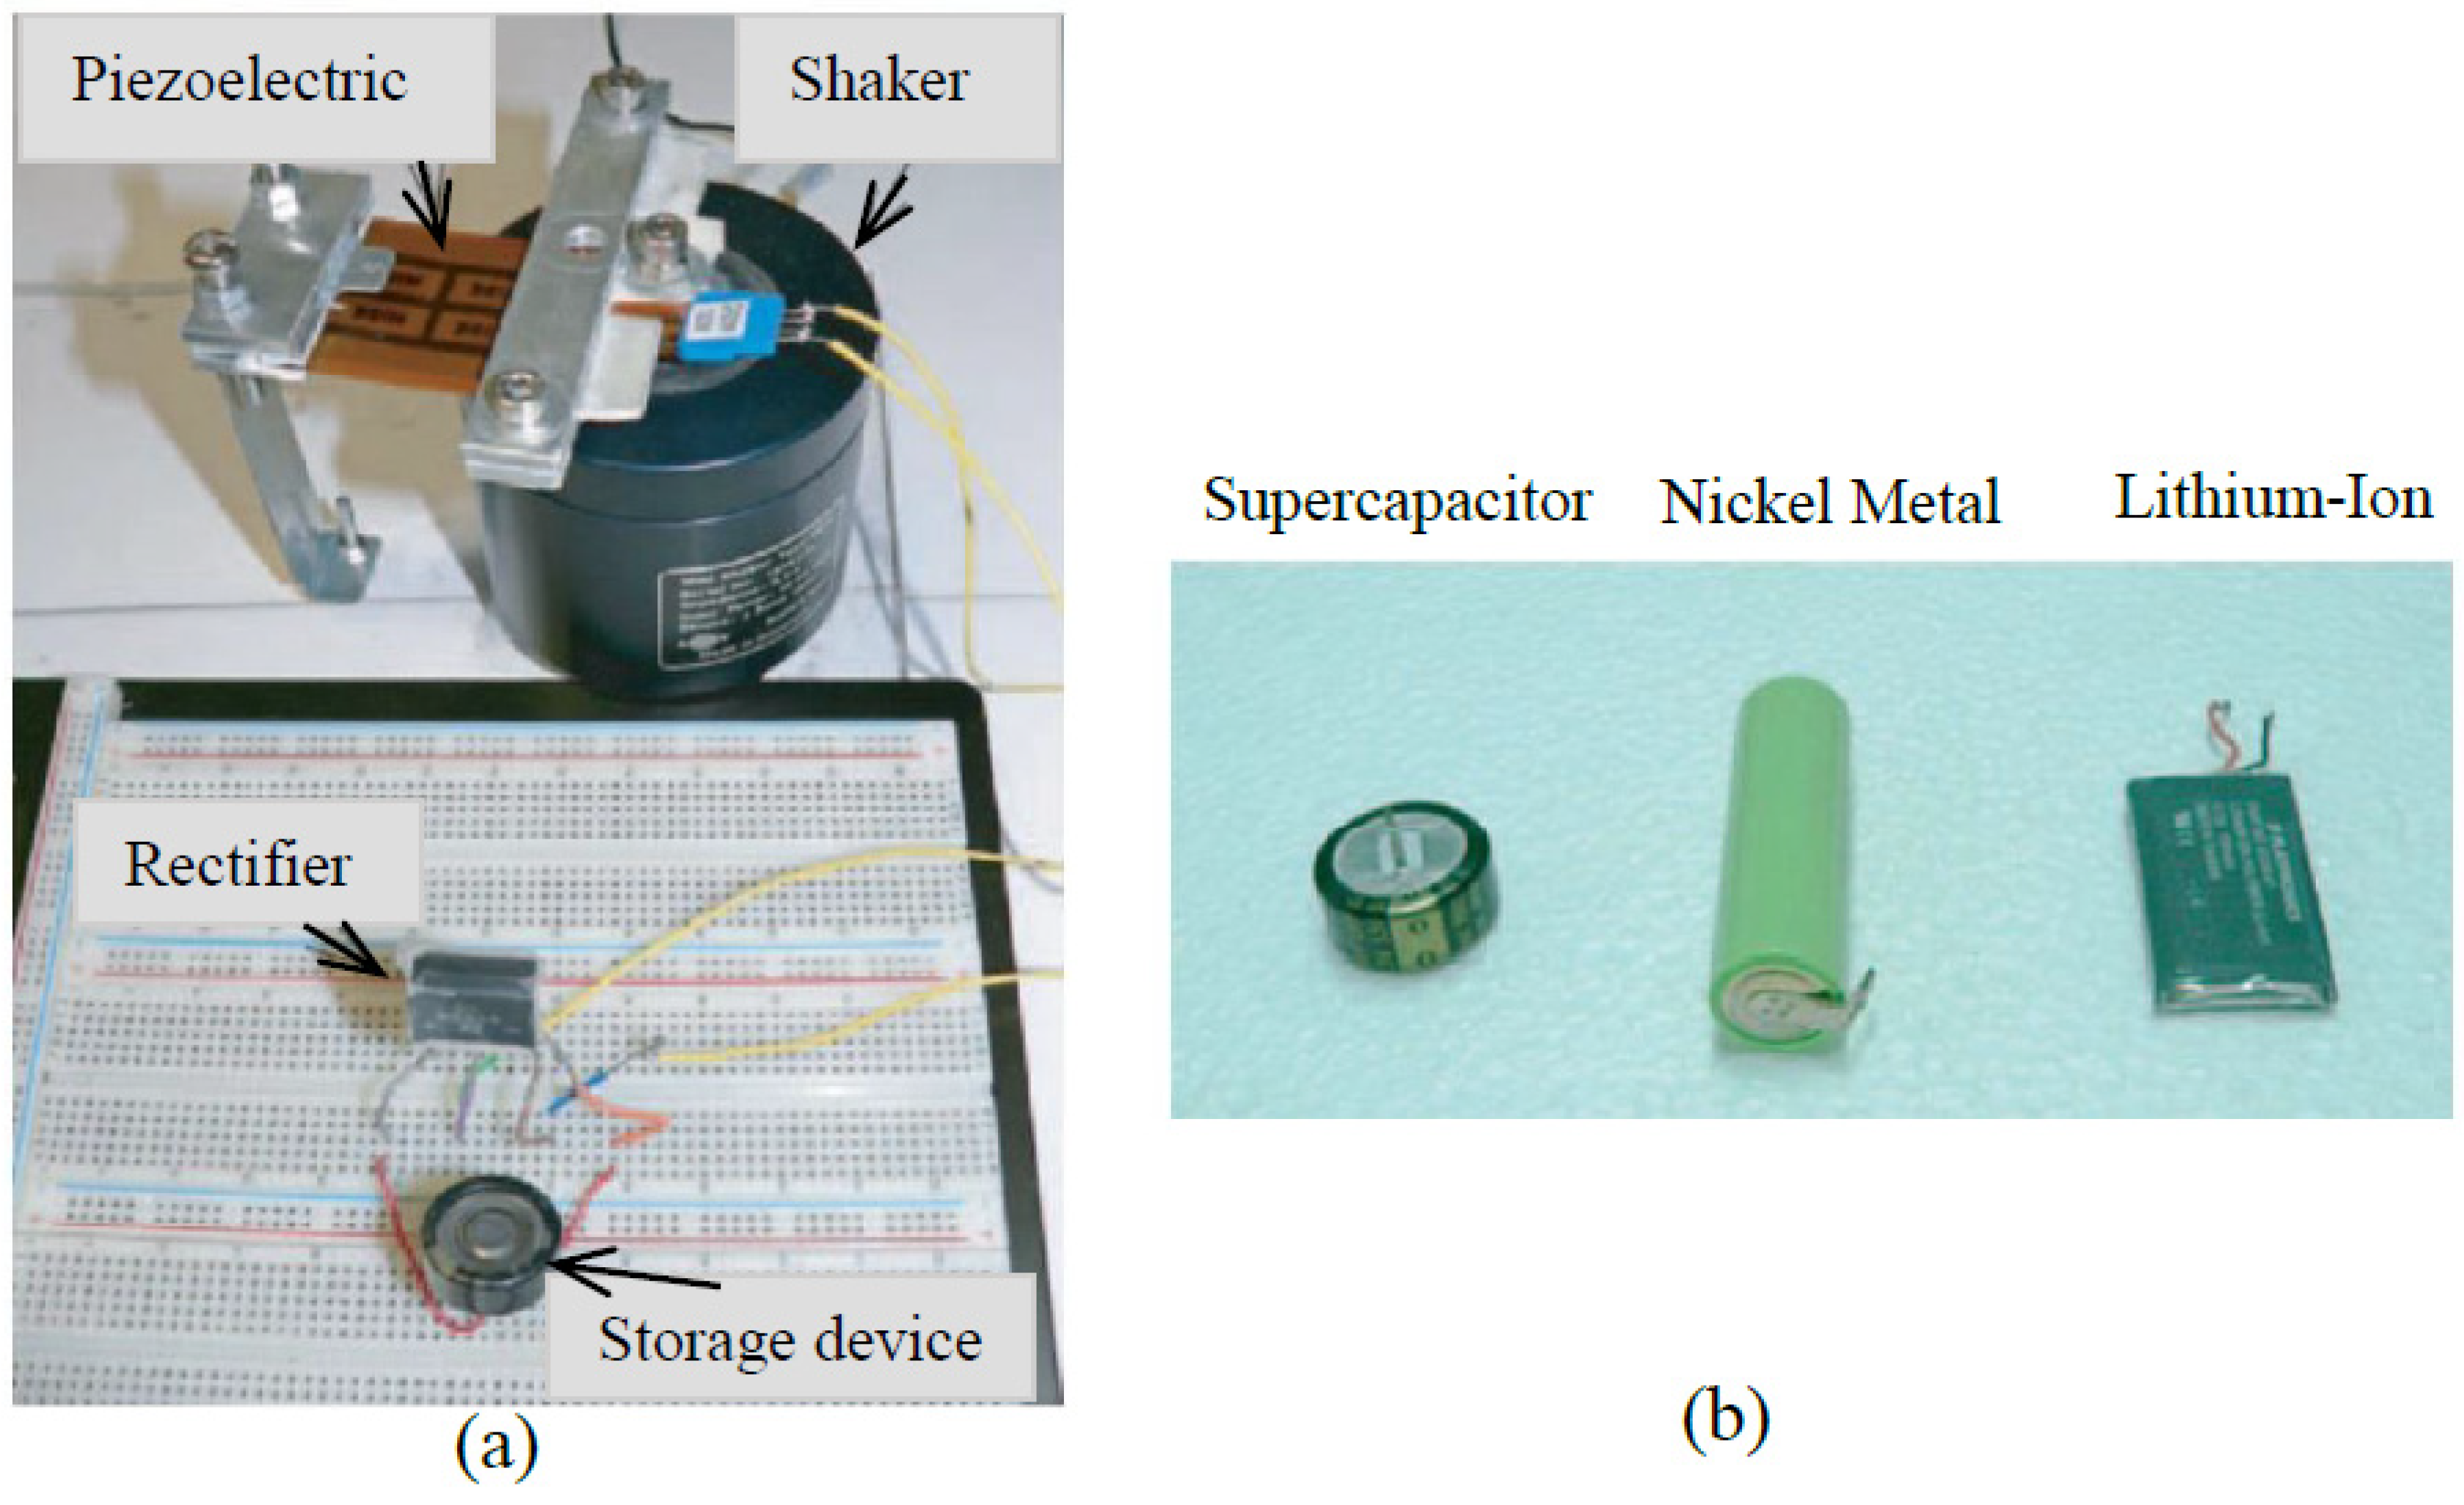
| Energy Source | Power Density (µW/cm3) |
|---|---|
| Solar (outdoors) | 15,000-direct sun, 150-cloudy day |
| Solar (indoors) | 6-office desk |
| Vibrations (piezoelectric conversion) | 250 |
| Vibrations (electrostatic conversion) | 50 |
| Acoustic noise | 0.003 at 75 dB, 0.96 at 100 dB |
| Temperature gradient | 15 at 10 °C gradient |
Table 2.
Advantages and disadvantages of the conversion mechanisms [36].
Table 2.
Advantages and disadvantages of the conversion mechanisms [36].
| Type | Advantages | Disadvantages |
|---|---|---|
| Electromagnetic |
|
|
| Piezoelectric |
|
|
| Electrostatic |
|
|
Table 3.
Comparison of the 31 and 33 modes [58].
Table 3.
Comparison of the 31 and 33 modes [58].
| Parameter | 31 Mode | 33 Mode |
|---|---|---|
| Electrode area (mm2) | 2.88 | 0.154 |
| Electrode gap (µm) | 1 | 12 |
| Volume of piezoelectric layer (mm3) | 0.00288 | 0.00205 |
| Output power (µW) | 2.15 | 2.23 |
| Power density (µWg−2mm−3) | 8.09 | 8.39 |
Table 4.
Harvested power from human motion [63].
Table 4.
Harvested power from human motion [63].
| Joint/Motion | Power (W) | Work (J/step) |
|---|---|---|
| Foot strike | 2–20 | 1–5 |
| Ankle | 66.8 | 33.4 |
| Knee | 36.4 | 18.2 |
| Hip | 38 | 8.96 |
| Elbow | 2.1 | 1.07 |
Table 5.
Levels of acceptability of the ride quality [100].
Table 5.
Levels of acceptability of the ride quality [100].
| Weighted RMS of Vertical Acceleration (m/s2) | Acceptability |
|---|---|
| >0.315 | Not uncomfortable |
| 0.315–0.63 | A little uncomfortable |
| 0.5–1 | Fairly uncomfortable |
| 0.8–1.6 | Uncomfortable |
| 1.25–2.5 | Very uncomfortable |
| <2 | Extremely uncomfortable |
Table 6.
Different energy harvesting of car suspension systems with their specifications and important outcomes.
Table 6.
Different energy harvesting of car suspension systems with their specifications and important outcomes.
| References | Type of Piezo | Location of Piezo | DOF | Road Input | Excitation Speed/Acceleration/Frequency | Harvested Voltage | Harvested Power /Power Density | Dissipated Power |
|---|---|---|---|---|---|---|---|---|
| Xiao et al. [114] | PZT | Parallel with the suspension springs | 2 DOF | Harmonic | 1.45 Hz | 274.62 V | 2.48 W | NA |
| Al-Yafeai et al. [115] | PZT | Parallel with the suspension springs | 4 DOF | Harmonic | 1.45 Hz | 486 V | 3.9 W | NA |
| Xie and Wang [30] | PZT 4 bar | On suspension wheels | 2 DOF | Random rough road classes of B, C, & D | 35 km/h | NA | NA | Class B: 40 W Class C: 162 W Class D: 652 W |
| Lafarge et al. [116] | Cantilever beam made of two PZT 27 layers | Embedded to the wheels | 2 DOF | Random rough road | Experimental test: 91 Hz Simulation: 30 km/h Real test: 10 km/h & 30 km/h | Experiment: 13 V Simulation: 2 V Real test: @10 km/h: 1–2 V @30 km/h: 2–3 V | Experiment: 1.4 mW Simulation: 0.02 W Real test: @10 km/h: 0.001–0.021 mW @30 km/h: 0.01–0.07 mW | NA |
| Behera [117] | 32 PZT-5A arranged in three strips | Inner tires’ circumference | NA | NA | 40 km/h | NA | 14 mW | NA |
| Hu et al. [119] | piezoelectric films bender | Inner surface of the tire | NA | NA | 30 m/s2 | 1.5 V | 70 µW/cm2 | NA |
| Zhang et al. [120] | Cantilever of ultrathin uni-morph ceramic piezoelectric | Center of the tire | NA | Random on road noise | Experimental test: 6 Hz Real test: 20 km/h | NA | Experimental lab. test: 0.032 mW Real car test: 0.017 mW | NA |
| Apollo project [121] | PVDF | Inner tire surface | NA | NA | 80 km/h | NA | 0.9 mW | NA |
| Makki and Pop-Iliev [53] | - PZT unimorph bender - PVDF thin sheet - PVDF ribbon | Inner tire | NA | NA | 9 km/h |
|
| NA |
| Lee et al. [122] | Two parallel plated of PZT 4 | Shock absorber | 1 DOF | NA | 10 Hz | 20 V | 1.2 mW | NA |
| Lafarge et al. [123] | PZT 5H | Shock absorber on two modes: d31 and d33 | 2 DOF | 30 km/h | NA | NA | Mode d33: 6 mW Mode d31: 3 mW | NA |
| Ali and Adhhikari [124] | Piezoelectric stack | Shock absorber | 2 DOF | sinusoidal excitation | NA | NA | 6.5 (normalized power) | NA |
| Madhav and Ali [125] | Piezoelectric stack | Shock absorber | 2 DOF | Random excitation | NA | NA | 2.4 (normalized power) | NA |
| Arizti [126] | PZT stack | Shock absorber | NA | NA | NA | 17.69 mV | NA | NA |
| Hendrowati et al. [127] | PZT stack | Series with the suspension’s spring | Quarter car model (2 DOF) | Harmonic excitation | 43.2 km/h | 6.23 V | 1.6 mW | NA |
© 2020 by the authors. Licensee MDPI, Basel, Switzerland. This article is an open access article distributed under the terms and conditions of the Creative Commons Attribution (CC BY) license (http://creativecommons.org/licenses/by/4.0/).
Share and Cite
MDPI and ACS Style
Al-Yafeai, D.; Darabseh, T.; I. Mourad, A.-H. A State-Of-The-Art Review of Car Suspension-Based Piezoelectric Energy Harvesting Systems. Energies 2020, 13, 2336. https://0-doi-org.brum.beds.ac.uk/10.3390/en13092336
AMA Style
Al-Yafeai D, Darabseh T, I. Mourad A-H. A State-Of-The-Art Review of Car Suspension-Based Piezoelectric Energy Harvesting Systems. Energies. 2020; 13(9):2336. https://0-doi-org.brum.beds.ac.uk/10.3390/en13092336
Chicago/Turabian StyleAl-Yafeai, Doaa, Tariq Darabseh, and Abdel-Hamid I. Mourad. 2020. "A State-Of-The-Art Review of Car Suspension-Based Piezoelectric Energy Harvesting Systems" Energies 13, no. 9: 2336. https://0-doi-org.brum.beds.ac.uk/10.3390/en13092336
Note that from the first issue of 2016, this journal uses article numbers instead of page numbers. See further details here.