A Case Study of the Supercritical CO2-Brayton Cycle at a Natural Gas Compression Station


Gas Engineering Department, Drilling, Oil and Gas Faculty, AGH University of Science and Technology, Mickiewicza 30 Av., 30-059 Kraków, Poland
*
Author to whom correspondence should be addressed.
Energies 2020, 13(10), 2447; https://0-doi-org.brum.beds.ac.uk/10.3390/en13102447
Submission received: 4 March 2020
/
Revised: 8 May 2020
/
Accepted: 9 May 2020
/
Published: 13 May 2020
(This article belongs to the Section B: Energy and Environment)
Abstract
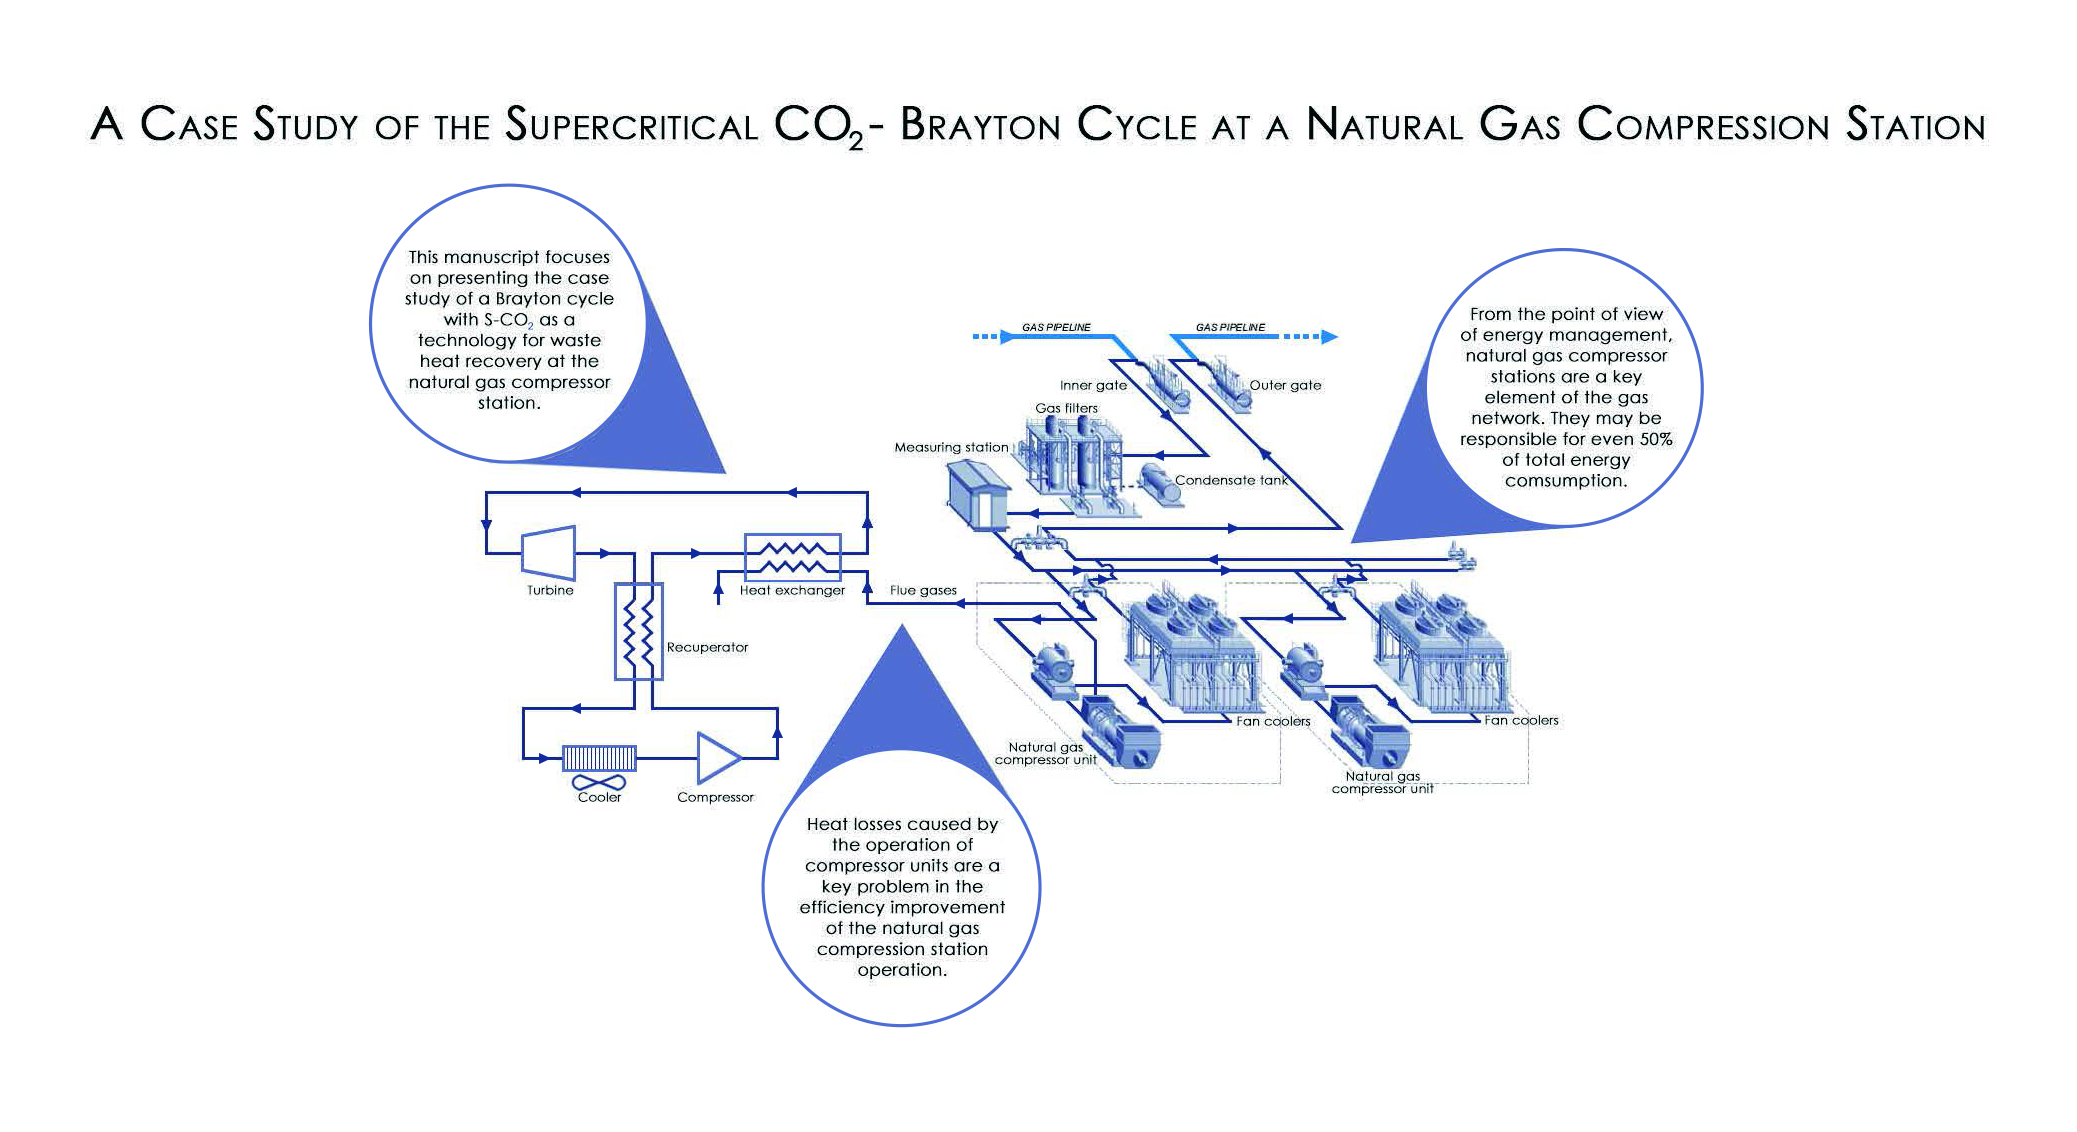
:Heat losses caused by the operation of compressor units are a key problem in the energy efficiency improvement of the natural gas compression station operation. Currently, waste heat recovery technologies are expensive and have low efficiency. One of these technologies is organic Rankine cycle (ORC) which is often analyzed in scientific works. In this paper, the authors decided to investigate another technology that allows for the usage of the exhaust waste energy—the supercritical Brayton cycle with CO2 (S-CO2). With a thermodynamic model development of S-CO2, the authors preformed a case study of the potential S-CO2 system at the gas compressor station with the reciprocating engines. By comparing the values of selected S-CO2 efficiency indicators with ORC efficiency indicators at the same natural gas compression station, the authors tried to determine which technology would be better to use at the considered installation. Investigations on parameter change impacts on the system operation (e.g., turbine inlet pressure or exhaust gas cooling temperatures) allowed to determine the direction for further analysis of the S-CO2 usage at the gas compressor station. When waste heat management is considered, priority should be given to its maximum recovery and cost-effectiveness.

1. Introduction
Due to the constant global increase in energy demand in various forms, humanity is more and more willingly looking for solutions that will reduce the energy consumption at the stage of production and transportation. In the case of natural gas transmission, it is assumed that the process that requires the consumption of the largest amount of energy is compression of natural gas—compressor stations may be responsible even for 50% of total cost of gas transmission [1]. Natural gas at compressor stations is most often compressed by means of combustion engines (reciprocating engines or gas turbines), which are powered by natural gas. From the point of view of managing the energy efficiency of the natural gas compression station, the heat losses caused by the operation of compressor units are a key problem. As a result of natural gas combustion, hot exhaust gases are emitted to the atmosphere, which may be treated as a potential source of energy. Currently, waste heat recovery technologies are expensive and have low efficiency. Therefore, it is important to (i) search for existing technologies used in other industries and which could be used at a gas compressor station; (ii) simulating various operating variants of these technologies, which will allow to optimize their performance indicators for operating conditions at the gas compressor station. One of the available options is waste heat recovery with the use of a system based on the organic Rankine cycle (ORC). This technology is often analyzed in scientific works e.g., [2,3,4,5]. For example, the possibilities of generating electrical energy with the ORC systems were checked in Jarosław II natural gas compression station, localized in Jarosław, Podkarpacie Province [2]. Results have shown that the available temperature and the stream of exhaust gases confirm the sense of considering the use of ORC technology. On the assumption of pseudo-steady operation of the system, the average annual net electric power of about 32 kW could be obtained when feeding the ORC system with waste heat from a compressor engine. However, as Kim M.S. et al. presented in their work [6] the ORC has a few disadvantages: the working fluids in ORC (such as R113 and R123) are expensive and strong climate-changing gases [7]. Furthermore, during the heating process of working fluid, its changes the phase, which creates a so-called “pinching” effect in the heat exchanger and thus limits heat exchanger performance [8].
In this paper, the authors decided to investigate a case study of another technology that allows for the usage of the exhaust waste energy—the supercritical Brayton cycle with CO2 (S-CO2). By analyzing different publications on S-CO2, it was found that this technology has a great potential to exceed organic Rankine cycles in certain conditions and applications [9,10]. One of the main reasons for the high potential is the relatively high cycle efficiency at moderate working medium temperatures at the turbine inlet (450–600 °C) [11]. This is particularly important in the context of waste heat temperature at gas compressor stations. Francis A. Di Bella (2011) in his work analyzed the development of a gas turbine engine exhaust waste heat recovery navy shipboard module [12]. Preliminary feasibility analysis has indicated a power improvement over the MT-30 gas turbine engine of from 20%, for the simple S-CO2 waste heat recovery system. According to this publication, a typical Rankine cycle system using an organic-based refrigerant (i.e., R245fa or R113), working with the same heat source temperature, could achieve only approximately 15%–17% power improvement. Although, the supercritical Brayton cycle with CO2 as a working medium is a solution to the disadvantages mentioned in the paragraph above. With the growing interest in increasing energy efficiency in the context of climate policy, high efficiency cycles are key to achieving cost-parity for non-renewable sources. The authors of this article did not find publications analyzing the use of S-CO2 for waste heat recovery at a gas compressor station. The main directions where the usage of S-CO2 systems is analyzed are the nuclear e.g., [13,14,15], geothermal e.g., [16], and solar industry e.g., [17,18,19]. Wright et al. [20] performed a thermo-economic analysis of four types of S-CO2 systems used for waste heat recovery. They conclude that the “Cascade”, the “Dual Recuperated”, and the “Preheating” cycle maximize the net annual revenue produced by appropriately selecting the operating conditions of the S-CO2 power system type, and by optimizing the amount of waste heat recovery that can be obtained. However, this study focused on the medium scale gas turbine (above 20 MWe). Sarkar and Bhattacharyya [21] carried out an optimization of compressor pressure ratio and intermediate pressure between HP and LP turbines leading to maximum thermal efficiency. They also calculated a 3.5% improvement in the efficiency when reheating is used. A new concept of the combined S-CO2 recompression Brayton/organic Rankine cycle were studied by Akbari and Mahmoudi [22]. The rejected heat in the pre-cooler of SCRBC is at a temperature range suitable to run an ORC (organic Rankine cycle). These studies were carried out for the nuclear application, however, the idea of combining S-CO2 Brayton cycle with ORC can be applicable at compression stations.
This manuscript focuses on presenting the case study of a Brayton cycle with S-CO2 as a technology for waste heat recovery at the natural gas compressor station. The main purpose of the work is to determine the capabilities and operating parameters of the potential S-CO2 system at the natural gas compressor station with the reciprocating engines. This paper presents also the impact of system operation parameters (e.g., turbine inlet pressure or exhaust gas cooling temperatures) changes on the energy efficiency indicators of this system. Investigating the impact of parameter changes on the system operation should allow determining the direction of further analysis of the S-CO2 usage at the gas compressor station The assumed waste heat parameters (e.g., stream, temperature, etc.) are real and have been determined for flue gas at the Jarosław II gas compressor station. This publication does not focus on issues related to the use of mechanical work generated by the turbine nor to technical aspects of the studied installation.
2. Supercritical Brayton Cycle with CO2 (S-CO2)
Cycles operating with carbon dioxide as a working fluid can be divided into two groups in terms of the operating temperature level. The first group is high-temperature cycles, which are usually designed for a heat source temperature above 300 °C. The second group is low-temperature cycles, designed mainly for waste heat recovery, where the temperature of the heat source is below 300 °C. The low temperature systems operate in a transcritical cycle, in which the parameters of the working medium are below the critical point in a certain area of circulation. This type of cycle achieves lower efficiency compared to high-temperature cycles, however, it can be profitable in cases when high heat source parameters are not available but the available quantities of heat are significant.
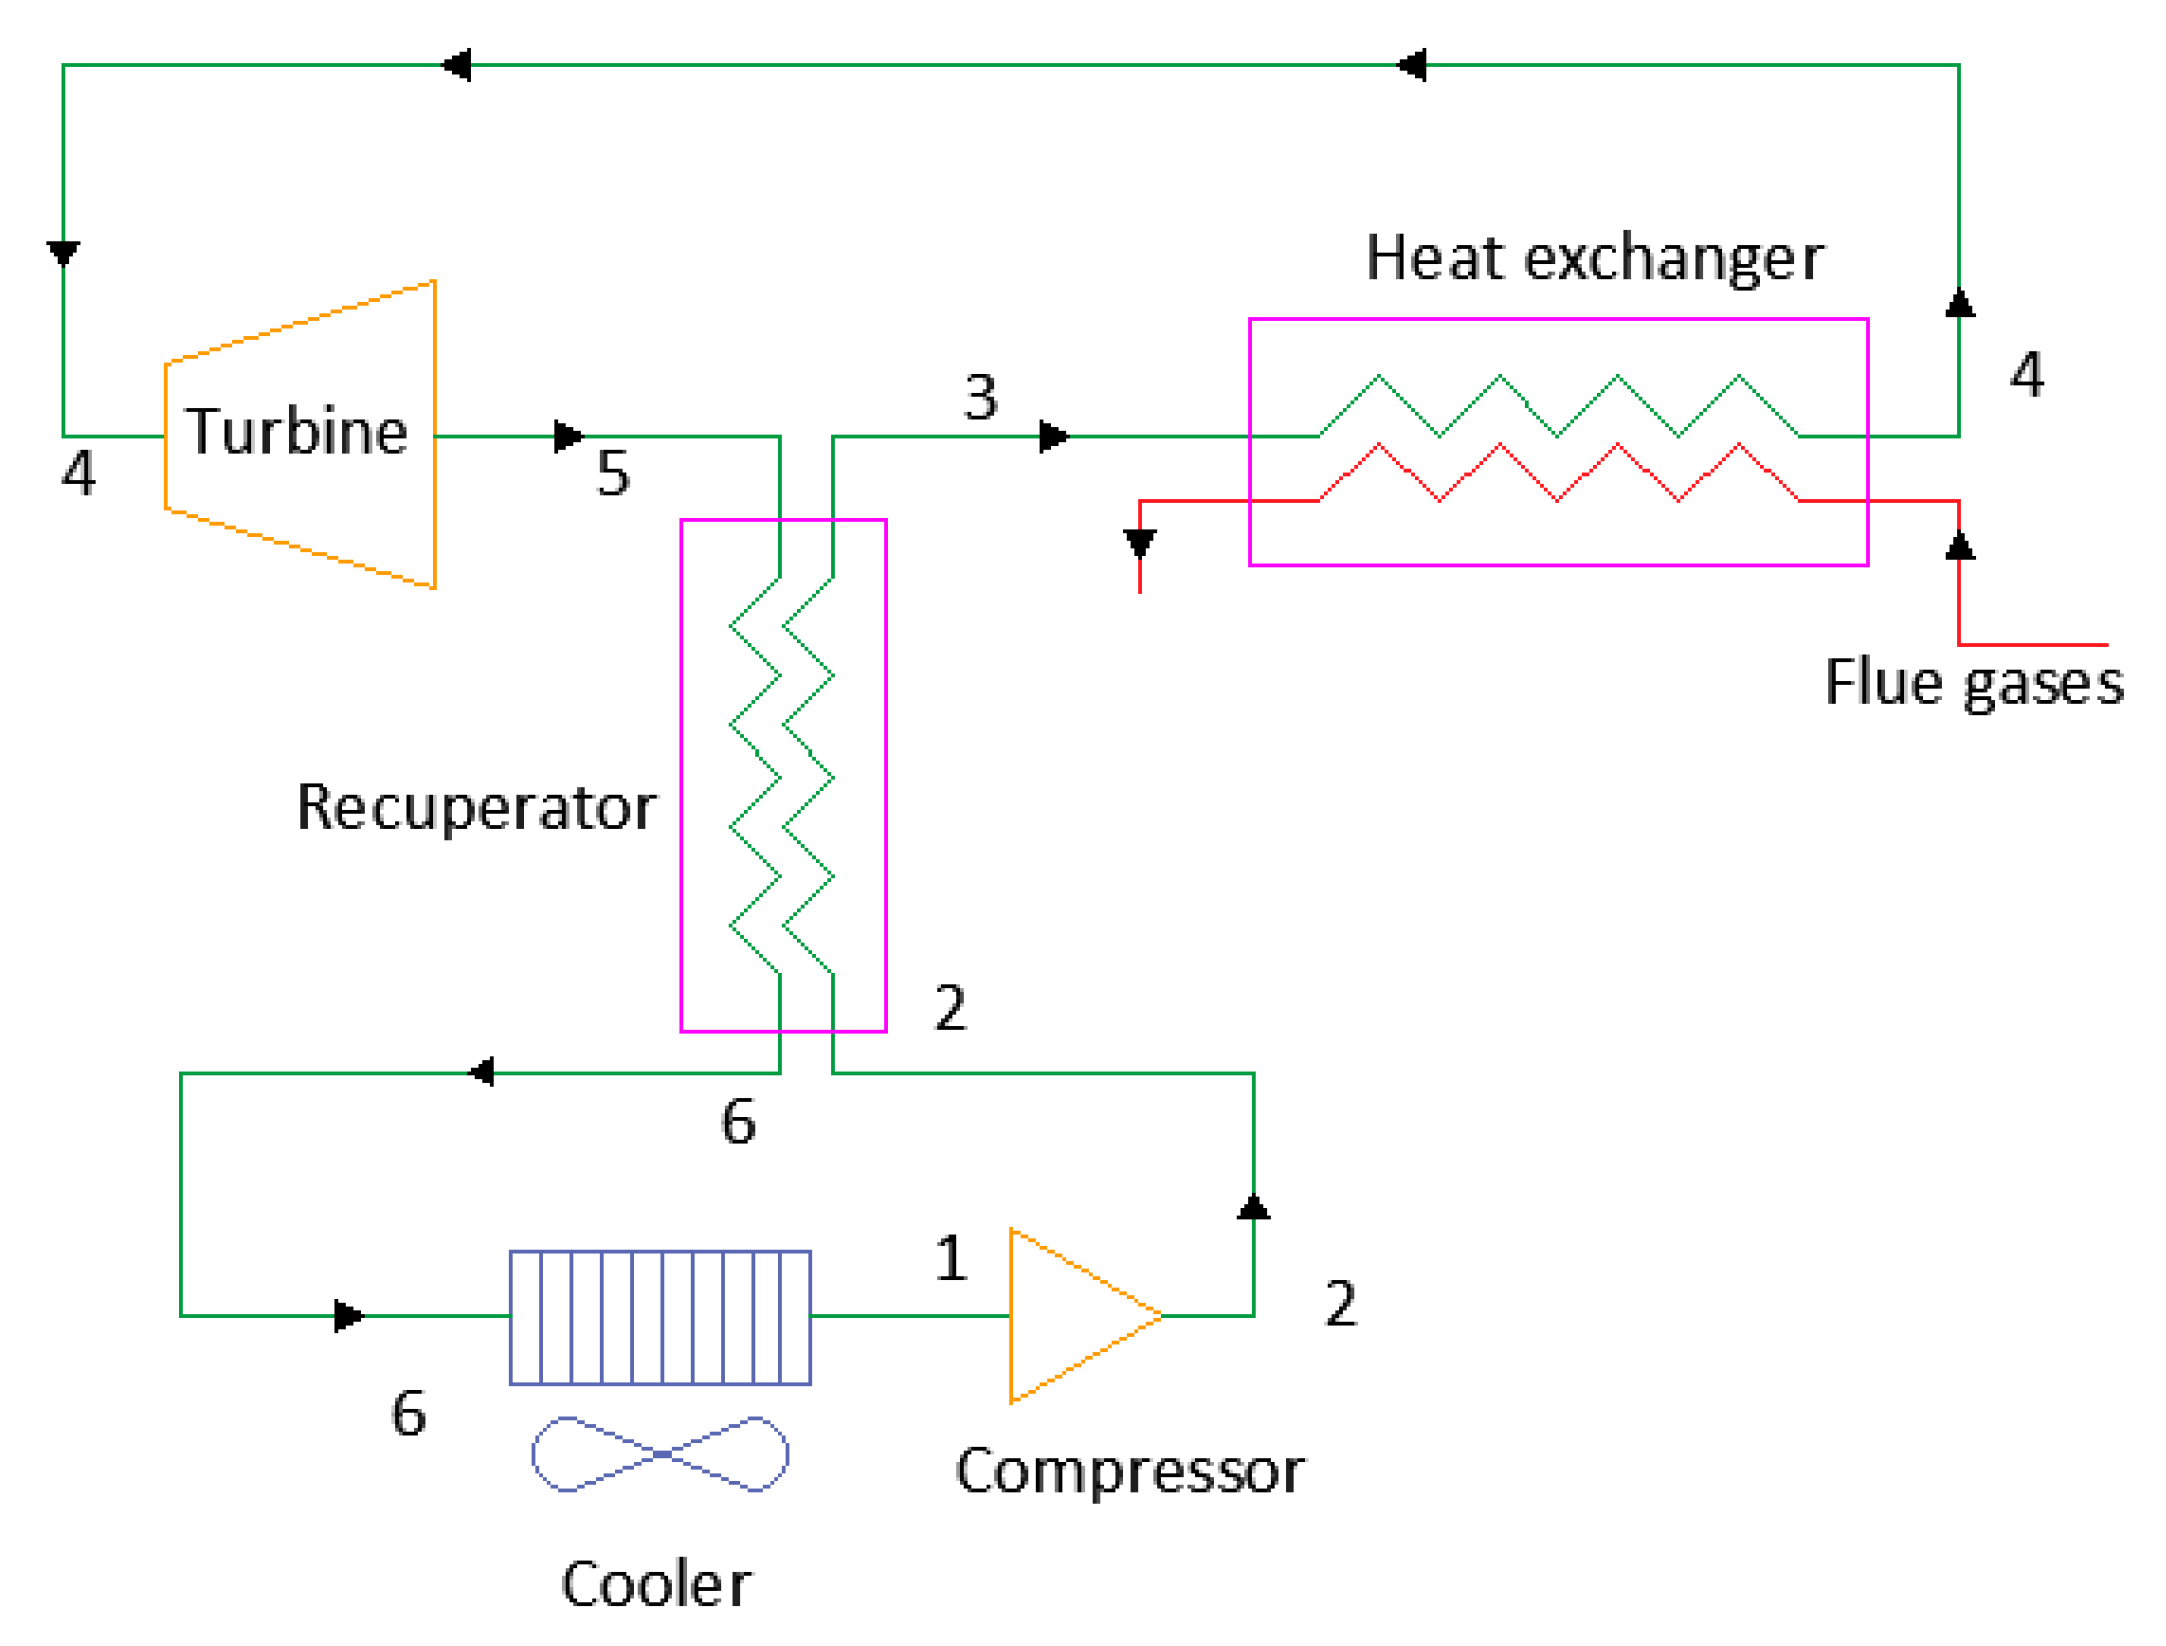
The technological scheme of the transcritical CO2 cycle is basically identical to the ORC. The cycle consists of a turbine (expander), heat exchanger, recuperator (not necessary), a pump, and a condenser. In the case of a high-temperature cycle, like S-CO2, a compressor and cooler are used in place of the pump and the condenser. A simple schematic of S-CO2 cycle is presented in Figure 1.
The following processes take place as the medium flows through the successive parts of the system.
- Stage 1 to 2 is a compression stage. Cooled CO2 is pressurized with a compressor. The process is treated as adiabatic because the heat losses are negligible. However, Heo J, Y et al. in their work [23] showed that for certain conditions of the system’s operation it is worth considering the isothermal compression—assuming the isothermal compressor for S-CO2 cycles it is possible to reduce the compression work by nearly 50%, compared to the adiabatic process in some range of inlet and outlet pressures. This is because the generated heat is rejected after each small stage compression, the working fluid becomes more liquid-like in density as the pressure is increased near the ambient temperature, requiring much less work. The main mechanism to improve the efficiency in the S-CO2 cycle is to reduce the compression work by performing a compression process near the critical point of CO2. Due to the fact that the temperature range near the critical point corresponds to the ambient temperature (30.98 °C) it gives the possibility to set the compressor’s work near the point where CO2 behaves like liquid and the compression work decreases (approaching pumping work).
- Stages 2 to 3 and 5 to 6 are the process of heat exchange in the recuperator. The working medium, which has been compressed, goes to the recuperator where it flows on the cold side of the exchanger. On the hot side of the recuperator CO2 flows, which has been previously expanded, but it still has a relatively high temperature. Heat transport takes place to the compressed CO2, increasing its temperature. This step is theoretically not necessary, but it significantly improves the internal efficiency of the cycle. At this stage the temperature of the returning CO2 is also decreasing, so that less heat will have to be taken away in the cooler.
- Stage 3 to 4 is a process of main heat exchange. Preheated and highly pressurized CO2 is directed to heat exchanger, where energy is obtained from waste heat. It is important that working medium undergoes heating in one phase—differently than in ORC where working medium undergoes three stages: heating, evaporation, and overheating. Thanks to that, during the heating process there is no so-called “pinching” in the heat exchanger and thus heat exchange performance in S-CO2 cycle is better than ORC.
- Stage 4 to 5 can be described with the decompression process. A CO2 at high pressure and high temperature is directed to the turbine, where the pressure and temperature values drop, and part of the generated mechanical energy can be used for instance to drive electric generator. The heat loss is negligible, and the process can be treated as adiabatic.
- Stage 6 to 1 is a process during which the working medium gives off the heat to the cooling medium in the cooler.
Carbon dioxide was used as a working medium a relatively long time ago (the end of the 19th century). Since the application of systems for supercritical CO2 was re-proposed at the beginning of the 21st century, intensified research and development works on these systems have begun. The compressor’s efficiency was the key issue for the work being carried out, because it works closest to the critical point, where the properties of the fluid differ most significantly between all other points of the cycle. Currently, modules for generating electricity using the supercritical CO2 cycle are commercially available. An example can be the product developed by Echogen company and called Thermafficient. The aim of the article is to present S-CO2 as an alternative to ORC in the utilization of waste heat at a gas compressor station. ORC has a number of advantages, but also disadvantages, which include:
- -
- high investment costs,
- -
- large size due to the low temperature level at the heat flow,
- -
- large streams of working medium in circulation,
- -
- high price of the working medium,
- -
- properties of the working medium (often dangerous),
- -
- low efficiency of the cycle.
S-CO2 technology is a solution for some of the above-mentioned disadvantages. One of the key advantages of S-CO2 technology is the compactness of the solution due to the high density of the working medium. Compactness is particularly visible when the size of this system is compared to technology based on steam Rankine cycle. For example, Ahn et al. [10] write that the S-CO2 turbomachinery becomes 10 times smaller than that of the steam Rankine cycle. Furthermore, the overall system size can be reduced up to four times when compared to the steam Rankine cycle. Another advantage mentioned earlier is that the cycle can operate in single-phase without passing through the saturation dome because the critical point of CO2 is below the heat sink condition. Apart the lack of appearance of so-called “pinching” in the heat exchanger, this feature also results in the no need for devices adapted to operate in two phases, which reduces the total costs of the system [13]. One more advantage is the relatively high thermal cycle efficiency at turbine inlet temperatures, which are moderate. This is mainly due to the smaller work needed to compress the medium thanks to the incompressible nature of the working fluid near the critical point. Thus, the use of a S-CO2 allows to increase the efficiency of the circulation and is characterized by a low ratio of the working fluid volume to the obtained mechanical power. It is also important that CO2 is a non-toxic, easily available, and relatively cheap working medium.
3. Thermodynamic Model of S-CO2
As mentioned in the introduction, this publication focuses on checking the applicability of the S-CO2 system at the Jarosław II gas compressor station. The most important issue for this type of calculation is to determine the amount of waste heat and its parameters. To make the calculations, it was decided to use the data achieved in a previous preformed analysis [2]. As the amount of waste heat and its parameters during the year did not differ significantly for particular compressor units, it was decided to use the average parameters of flue gases. Table 1 shows the exhaust gas average properties and mole fraction of each component.
To compare the performance of different cycle operation parameters under the same exhaust gas conditions, the working out of a thermodynamic model was preceded by the following assumptions:
- The maximum operating pressure is limited to 22.5 MPa (compressor outlet pressure) in order to avoid high capital costs and to create a realistic S-CO2 power cycle model. The maximum temperature (turbine inlet temperature) is limited by the exhaust gas temperature.
- Constant temperature and pressure of working medium at the compressor inlet were assumed. The values of 35 °C (308.15 K) and 7.7 MPa were appropriately assumed to assure that the heat sink temperature is not very far from the ambient temperature while the fluid in the cycle maintains the supercritical state.
- Compression and expansion of the S-CO2 is an adiabatic process.
- The temperature difference between CO2 and flue gas at the heat exchanger inlet and outlet is always constant for the analyzed variant.
- The limit temperature to which exhaust gases can be cooled is 100 °C (373.15 K).
- Irreversibilities such as due to turbine and compressor isentropic efficiencies, finite temperature differences, pressure losses in the heat exchanger and recuperator were also considered so as to generate thermodynamic data for real cycles. For the sensitivity analysis of cycles, component efficiency and heat exchanger effectiveness are based on the literature review. For convenience, the pressure losses in each heat exchanger and recuperator are considered as 0.5% of the inlet pressure. Pressure losses in exhaust gas side are neglected in this paper because it has practically no effect on the energy efficiency of the system. However, it should be remembered that in reality the heat exchanger must be chosen in such a way that the pressure drops of the exhaust gases do not exceed the limit value given by the manufacturer of the compressor unit. In the case of the compressor station under consideration, the value for installed machines is 100 kPa.
The model of S-CO2 cycle was prepared with the use of CoolProp [24] and REFPROP [25] database. Table 2 shows the S-CO2 assumptions and constraints.
For the purposes of this section, all subscripts represent the cycle stages, as in Figure 1. As already mentioned, compression stage is treated as adiabatic process because the heat losses are negligible. Due to this assumption, and information about pressure and temperature of CO2 at the inlet to the compressor, as well as the desired value of pressure at the outlet from the compressor, it is possible to calculate the actual temperature of CO2 after compression which is given by Equation (1):
where:
—actual temperature of CO2 after compression (K),
T2—ideal temperature of CO2 after compression (K),
T1—temperature of CO2 at the inlet to the compressor (K),
ηc—isentropic efficiency of the compressor (-).
Knowing the temperature and pressure of CO2 at the compressor outlet, it is possible to calculate the enthalpy of CO2 in stage 2. As a result, the required compressor power can be calculated based on Equation (2):
where:
W1-2—required compressor power (W),
—mass stream of CO2 (kg/s),
h2—specific enthalpy of CO2 at the compressor outlet (J/kg),
h1—specific enthalpy of CO2 at the compressor inlet (J/kg).
At this stage of the calculations, the CO2 stream is unknown, but it is not required. In the next step, the model determines the state parameters (pressure and temperature) of the CO2 in stage 3 of the cycle (at the inlet to the main heat exchanger). The pressure is determined based on the assumption of a 0.5% pressure drop in the recuperator (in relation to the pressure from stage 2). The temperature at the inlet to the heat exchanger depends on the assumed cooling temperature of the flue gas and should be lower by a few degrees from the mentioned cooling temperature of the exhaust gases. Based on the pressure and temperature in stage 3, it is possible to calculate the enthalpy and entropy (h3, s3).
On the same principle, the model calculates the state parameters in stage 4, except that the CO2 pressure at the heat exchanger outlet is calculated based on the assumption of a 0.5% pressure drop in relation to the pressure from stage 3. The temperature in stage 4 depends on the temperature of the exhaust gases at the heat exchanger inlet and should be a few degrees lower than the mentioned exhaust gases temperature. Based on the pressure and temperature in stage 4, it is possible to calculate the enthalpy and entropy (h4, s4). Having calculated the enthalpy at stages 3 and 4, the following Equation (3) determines the CO2 mass stream, which is dependent on the assumed exhaust gas cooling temperature.
where:
—mass stream of CO2 (kg/s),
mh—mass stream of waste heat (kg/s),
hIN—specific enthalpy of waste heat (flue gases) at heat exchanger hot side inlet (J/kg),
hOUT—specific enthalpy of waste heat (flue gases) at heat exchanger hot side outlet (J/kg),
h4—specific enthalpy of CO2 at the heat exchanger cold side outlet (J/kg),
—specific enthalpy of CO2 at heat exchanger cold side inlet (J/kg),
ηh—efficiency of the heat exchange (-).
The next stage of the cycle is CO2 passing through the turbine to generate mechanical energy (step 5). First, the model assumes a pressure to which the CO2 will expand. Knowing the pressure at the compressor inlet (minimum operating pressure of the cycle—7.7 MPa) and knowing that CO2 after passing through the turbine goes to the recuperator, it is necessary to take into account the pressure drop in the recuperator (no pressure drop was assumed on the cooler) and thus determine the pressure at the turbine outlet. The CO2 temperature in stage 5 is calculated based at the assumption that the turbine expansion can be described by an adiabatic process which is given by Equation (4):
where:
—actual CO2 temperature after expansion (K),
T5—ideal CO2 temperature after expansion (K),
T4—CO2 turbine inlet temperature (K),
ηp—isentropic efficiency of the compressor (-).
Knowing the temperature and pressure of CO2 at the turbine outlet, it is possible to calculate the CO2 enthalpy at stage 5. Thanks to this, the power on the turbine shaft can be calculated based on Equation (5):
where:
W4-5—the power on the turbine shaft (W),
mCO2—mass stream of CO2 (kg/s),
—specific enthalpy of CO2 at the turbine inlet (J/kg),
h5—specific enthalpy of CO2 at the turbine outlet (J/kg).
The net power of the system was assumed as the power difference on the turbine shaft and the required power of the compressor by Equation (6):
where:
Wnet—the net power of the system (W),
W4-5—the power on the turbine shaft (W),
W1-2—required compressor power (W).
The last stage of the model calculation is stage 6 of the cycle. The cooler has no pressure drop, so that the pressure at the compressor inlet is identical to the inlet pressure to the cooler. Using the CoolProp database, the model determines the CO2 temperature at the inlet to the cooler based on the CO2 pressure and enthalpy in stage 6. The CO2 enthalpy value in stage 6 is calculated according to Equation (7):
where:
h6—specific enthalpy of CO2 at the recuperator hot side outlet (J/kg),
—specific enthalpy of CO2 at the recuperator hot side inlet (J/kg),
h3—specific enthalpy of CO2 at the recuperator cold side outlet (J/kg),
—specific enthalpy of CO2 at the recuperator cold side inlet (J/kg),
ηh—efficiency of the heat exchange (-).
For comparative purposes, it was decided to define parameters that would allow to evaluate the energy efficiency of the cycle for different operating conditions. The first parameter is the waste heat utilization rate which is given by Equation (8):
where:
WHUR—waste heat utilization rate (%),
hIN—specific enthalpy of waste heat (flue gases) at heat exchanger hot side inlet (J/kg),
hAM—specific enthalpy of waste heat (flue gases) at heat exchanger hot side outlet, assuming exhaust gases cooling to 25 °C (298.15 K) (J/kg).
The next parameter is the percent of waste heat transferred to CO2, which is given by Equation (9):
where:
PWHT—percent of waste heat transferred to CO2 (%),
hIN—specific enthalpy of waste heat (flue gases) at heat exchanger hot side inlet (J/kg),
hOUT—specific enthalpy of waste heat (flue gases) at heat exchanger hot side outlet (J/kg),
hAM—specific enthalpy of waste heat (flue gases) at heat exchanger hot side outlet, assuming exhaust gases cooling to 25 °C (298.15 K) (J/kg).
The last parameter allowing to evaluate the energy efficiency of the cycle is internal cycle efficiency, which is given by Equation (10):
where:
CE—cycle efficiency (%),
h5—specific enthalpy of CO2 at the turbine outlet (J/kg),
—specific enthalpy of CO2 at the turbine inlet (J/kg),
h4—specific enthalpy of CO2 at the heat exchanger cold side outlet (J/kg),
—specific enthalpy of CO2 at the heat exchanger cold side inlet (J/kg),
h2—specific enthalpy of CO2 at the compressor outlet (J/kg),
h1—specific enthalpy of CO2 at the compressor inlet (J/kg).
4. Cycle Operation Parameters and Calculation Results
As part of this research, the authors performed a series of simulations of the Brayton system with S-CO2. It was established that the lower heat source is the energy from the exhaust gas of reciprocating engines which drives compressors at the gas compressor station. During the simulation the following operating parameters of the system were changed: (i) turbine inlet pressure, (ii) degree of exhaust gas cooling, (iii) temperature difference of CO2 and flue gas in the heat exchanger, (iv) temperature of CO2 after passing the hot side of recuperator were changed.
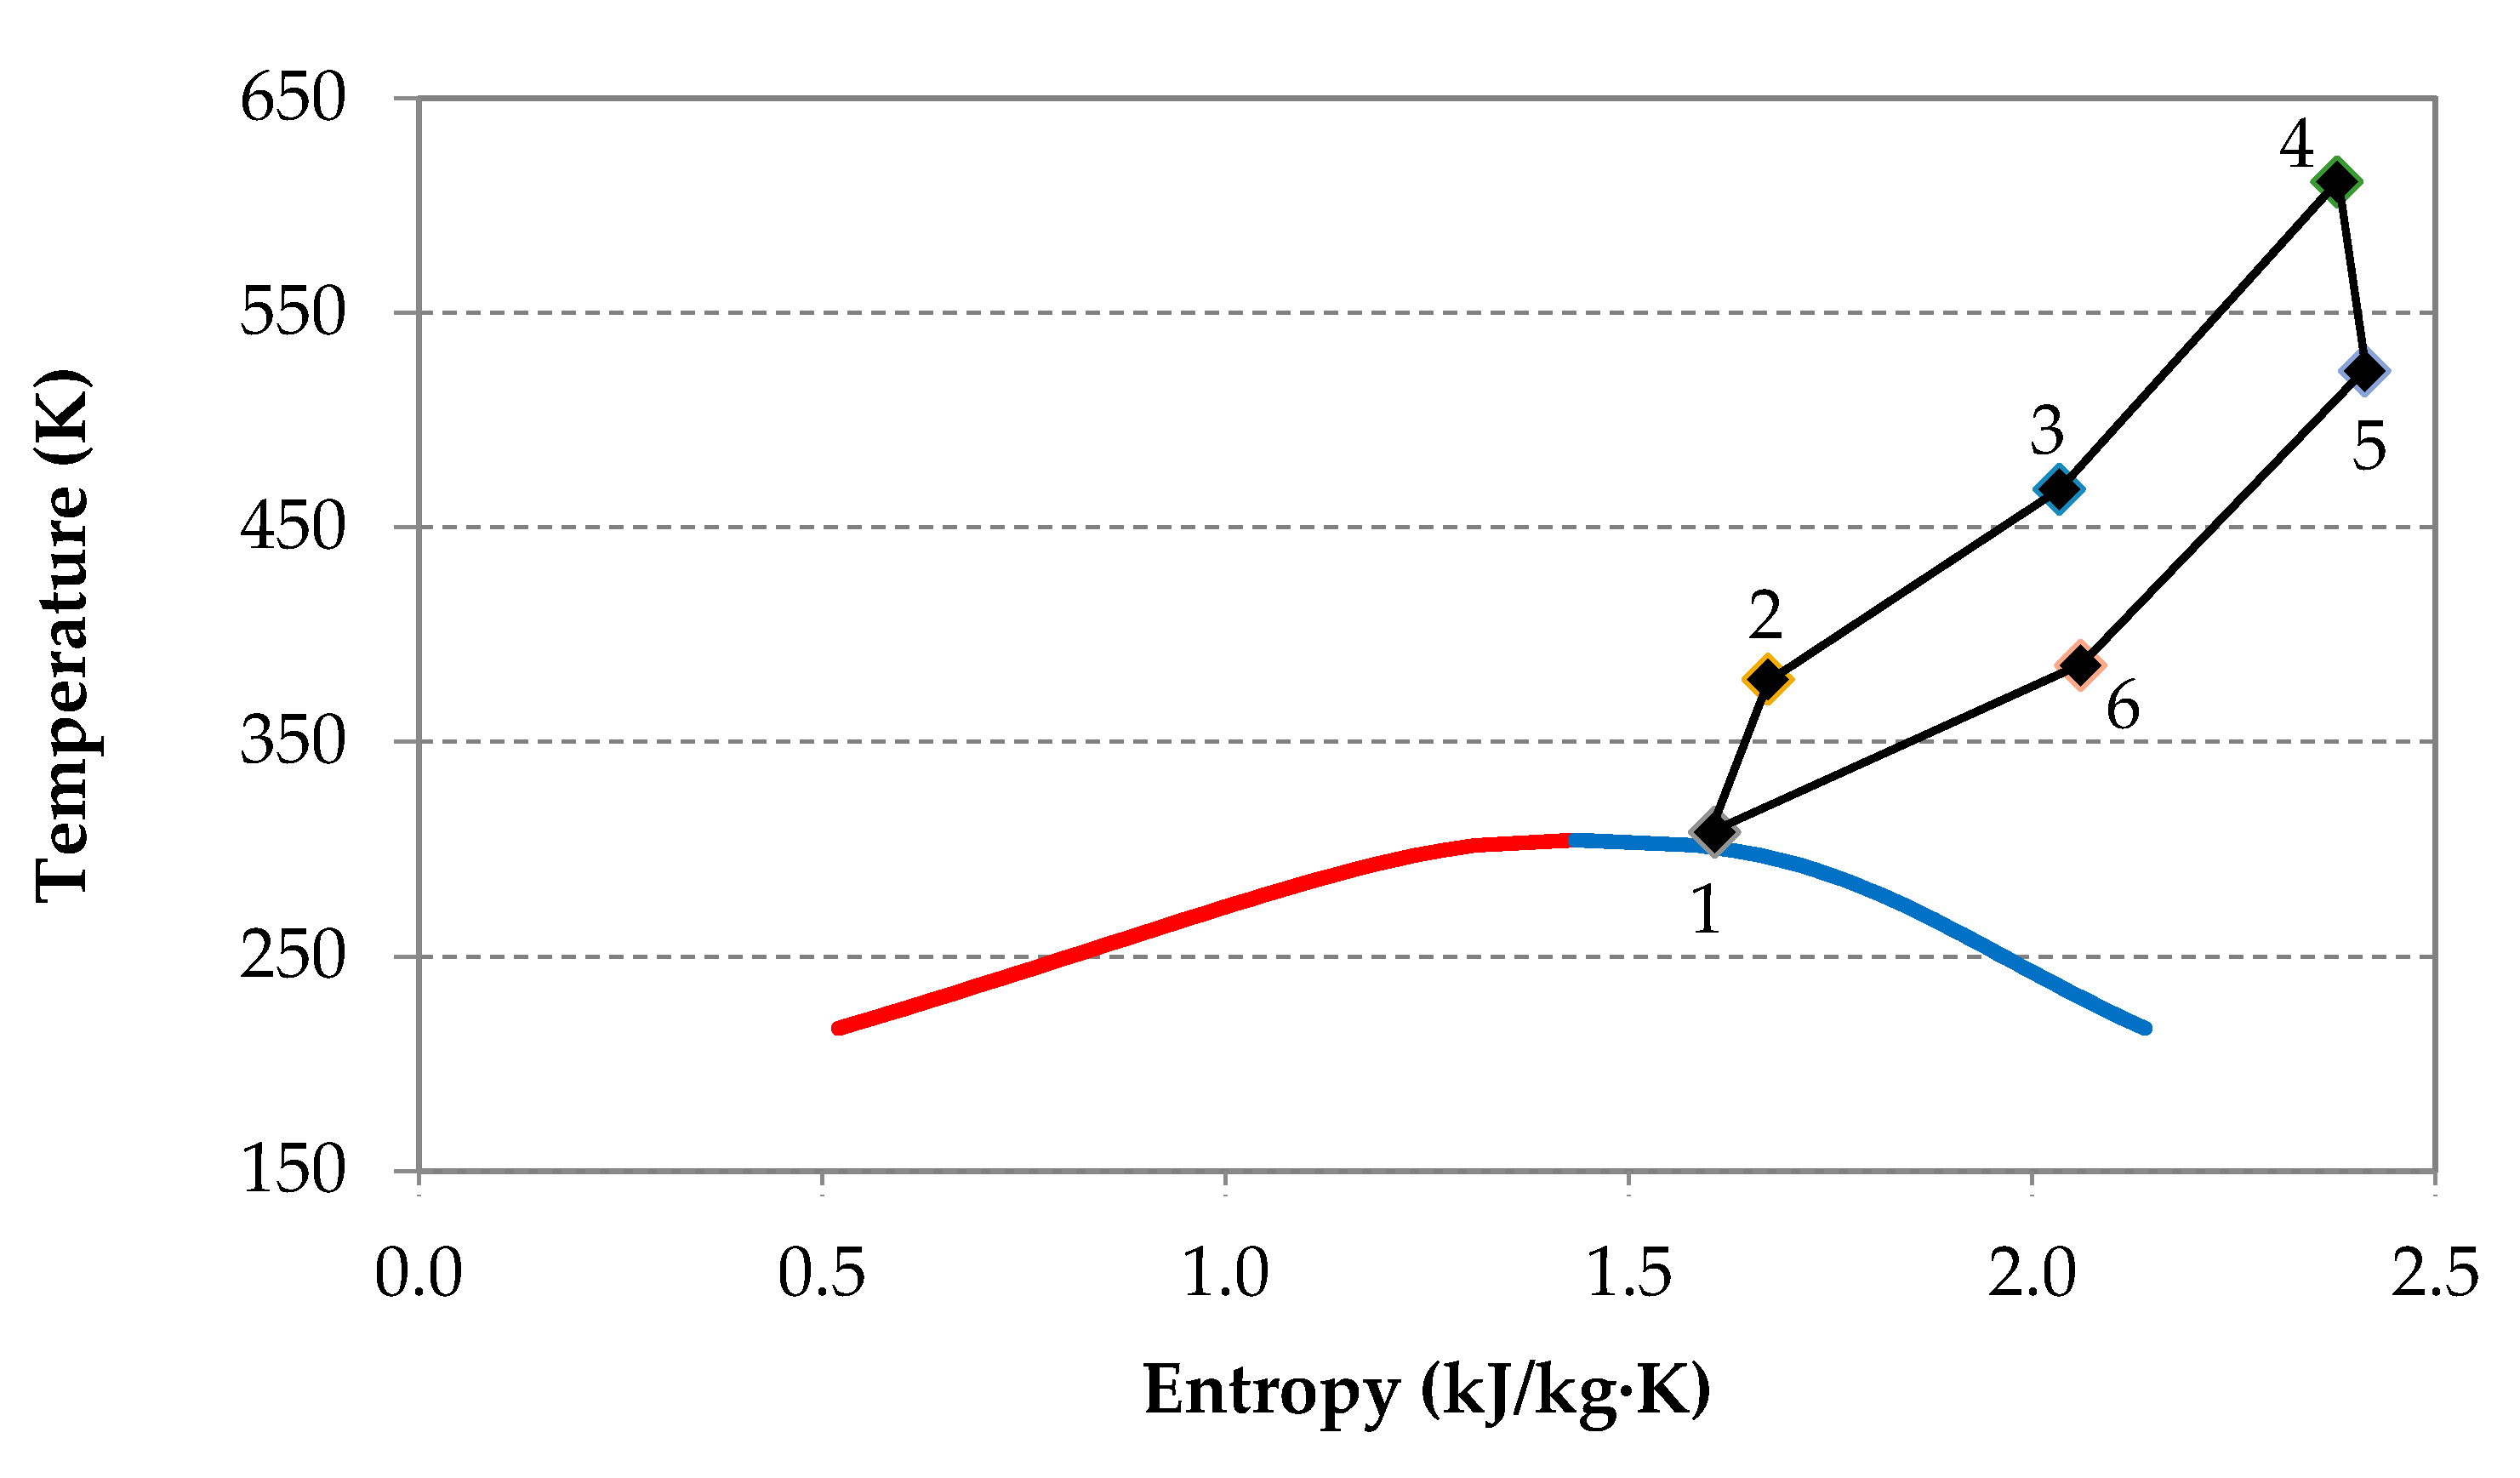
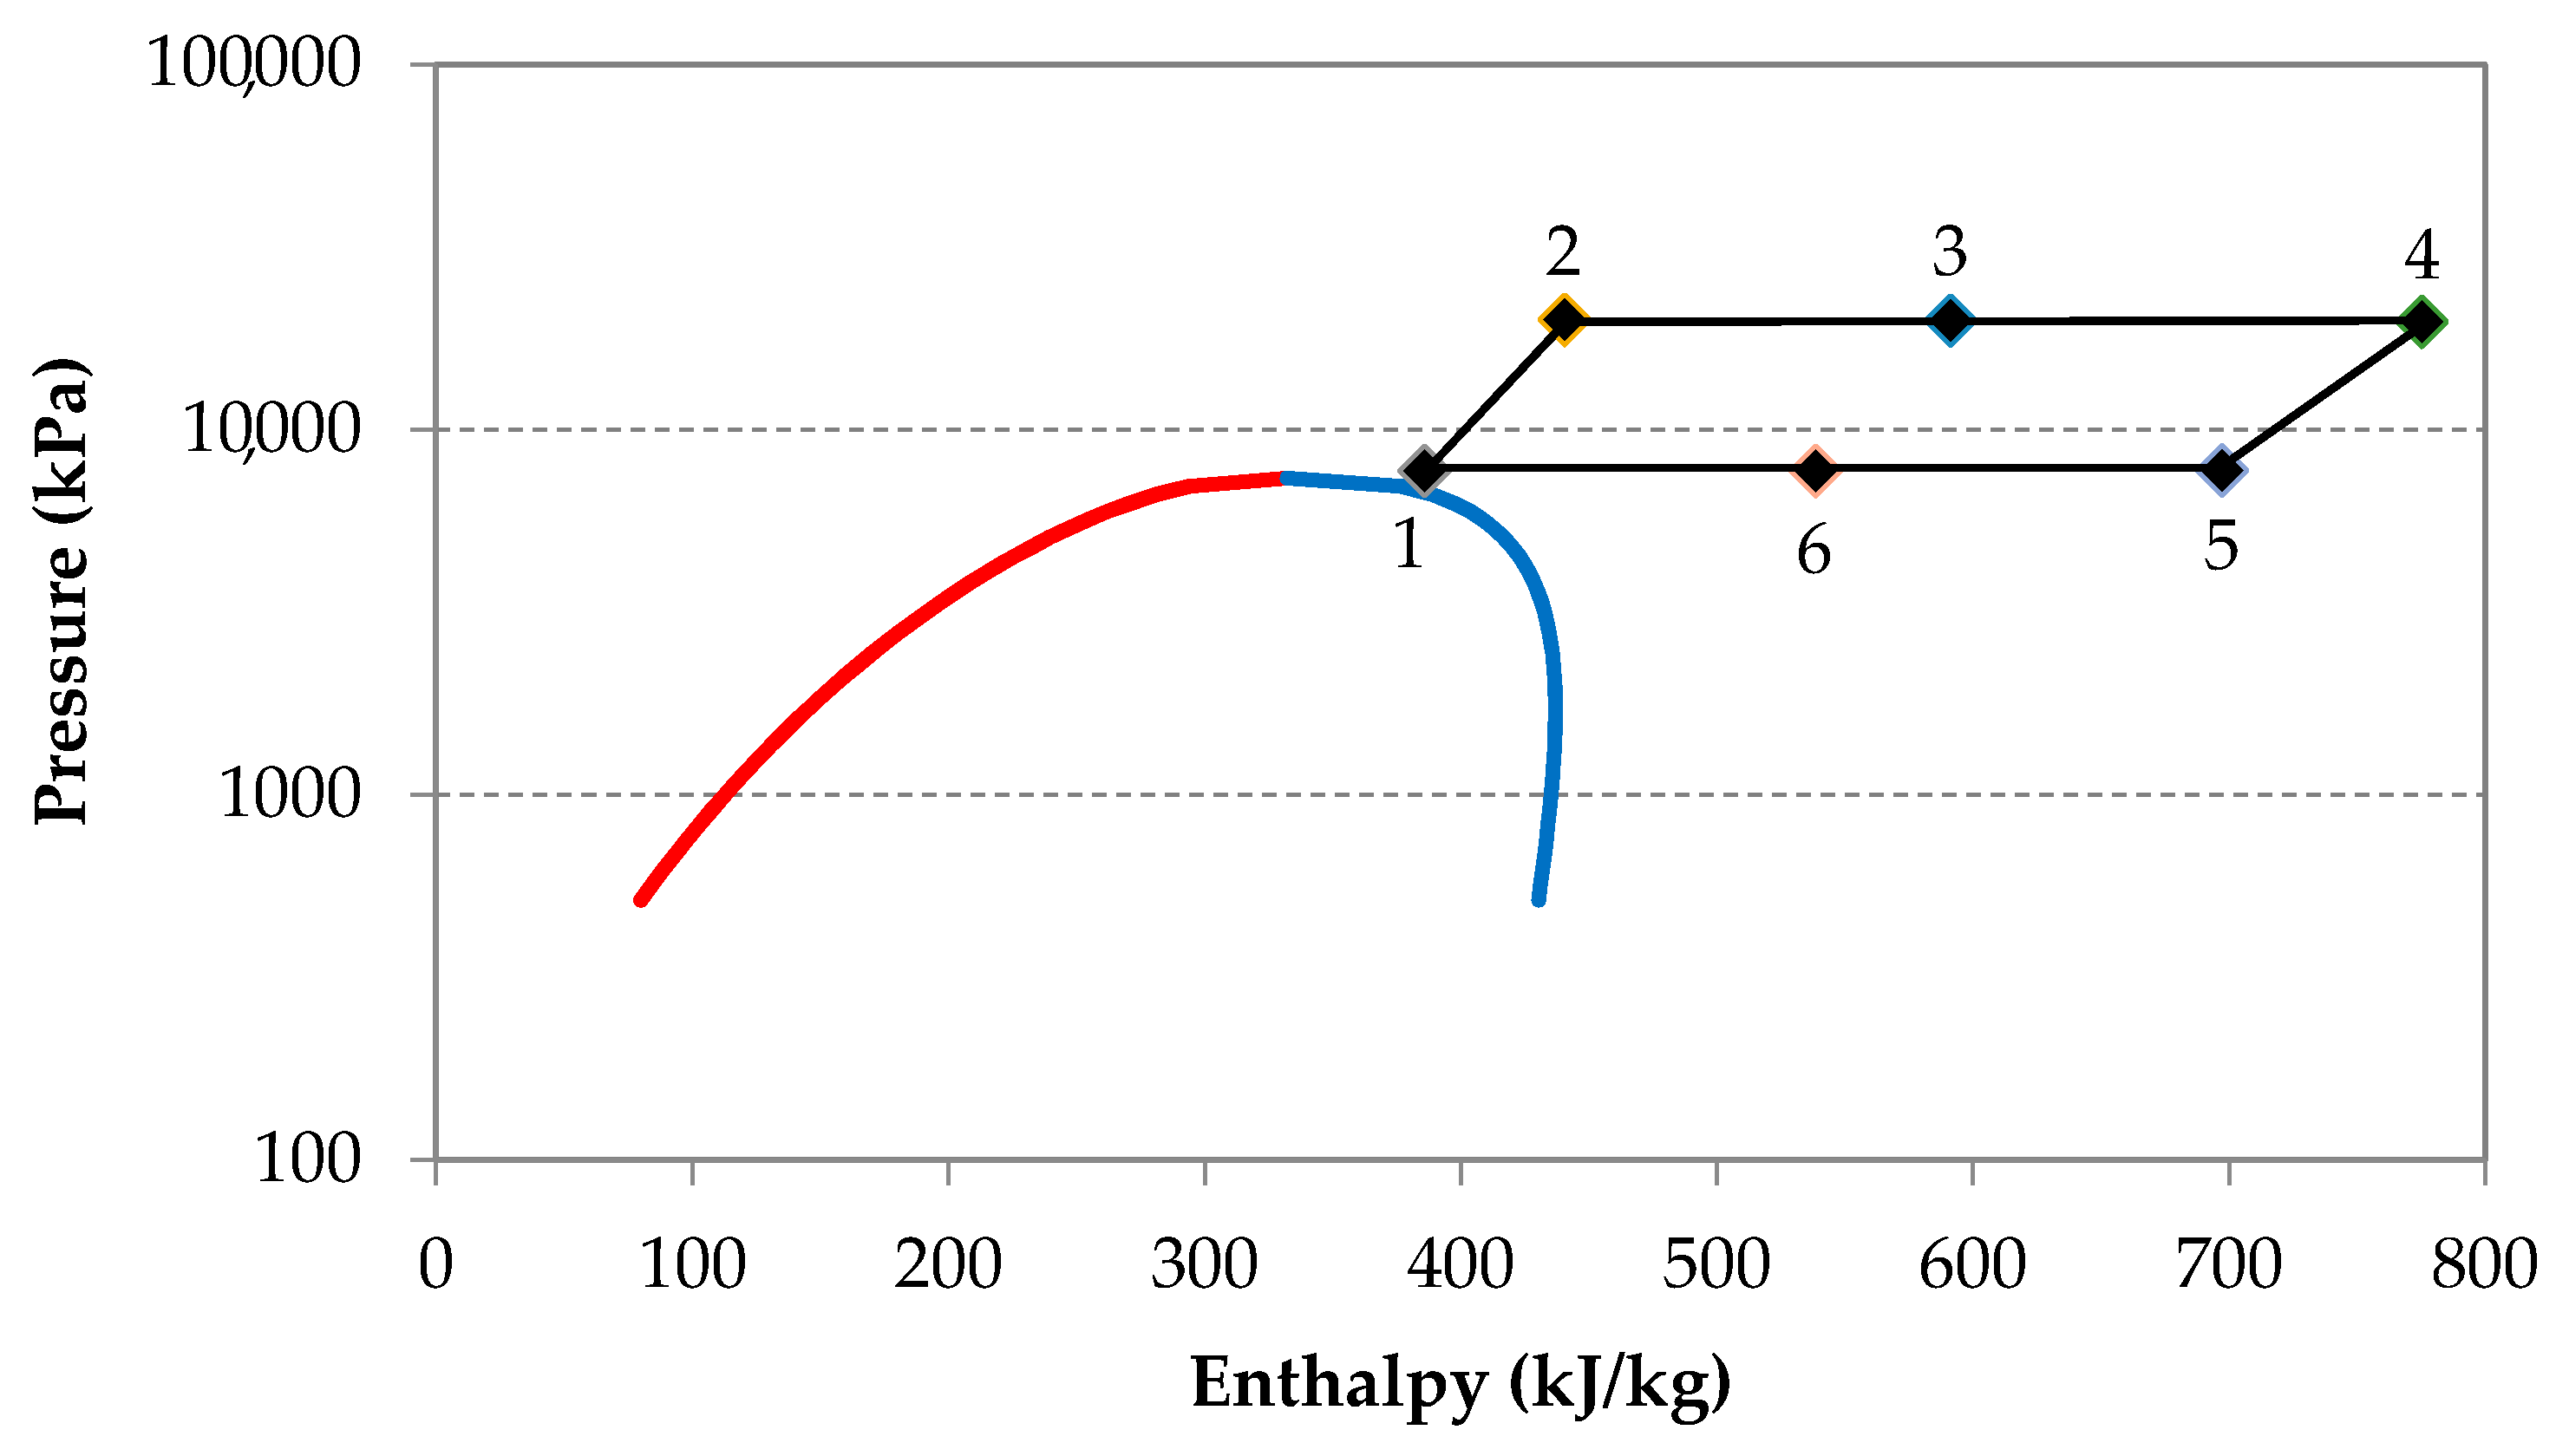
Aggregated simulation results in the form of graphs and discussions are presented on the following pages. Additionally, exemplary system operation parameters are presented, which assumes the cooling of exhaust gases to a temperature of 200 °C and compression of CO2 to a pressure of 20 MPa. It also has been established that the temperature difference between CO2 and the exhaust gases at the inlet and outlet of the heat exchanger is 5 K. The simulated cycle for the above mentioned operating conditions is presented in Figure 2 and Figure 3 in the form of temperature/entropy and pressure/enthalpy plots. Stages 1–6 correspond to the stages described in Section 2 and Section 3.
Additional conditions of the described above exemplary cycle are as follows: mass stream of flue gases: 3.55 kg/s, temperature of flue gases at heat exchanger inlet: 616.38 K, temperature of flue gases at heat exchanger outlet: 473.15 K, mass stream of CO2: 3.04 kg/s, the net power system Wnet: 40.86 kW, waste heat utilization ratio WHUR: 3.37%, waste heat transferred to CO2 PWHT: 47.29%, and cycle efficiency CE: 12.73%. Calculated temperature, pressure, enthalpy, and entropy values at successive stages are presented in Table 3.
4.1. Investigation on Turbine Inlet Pressure Change
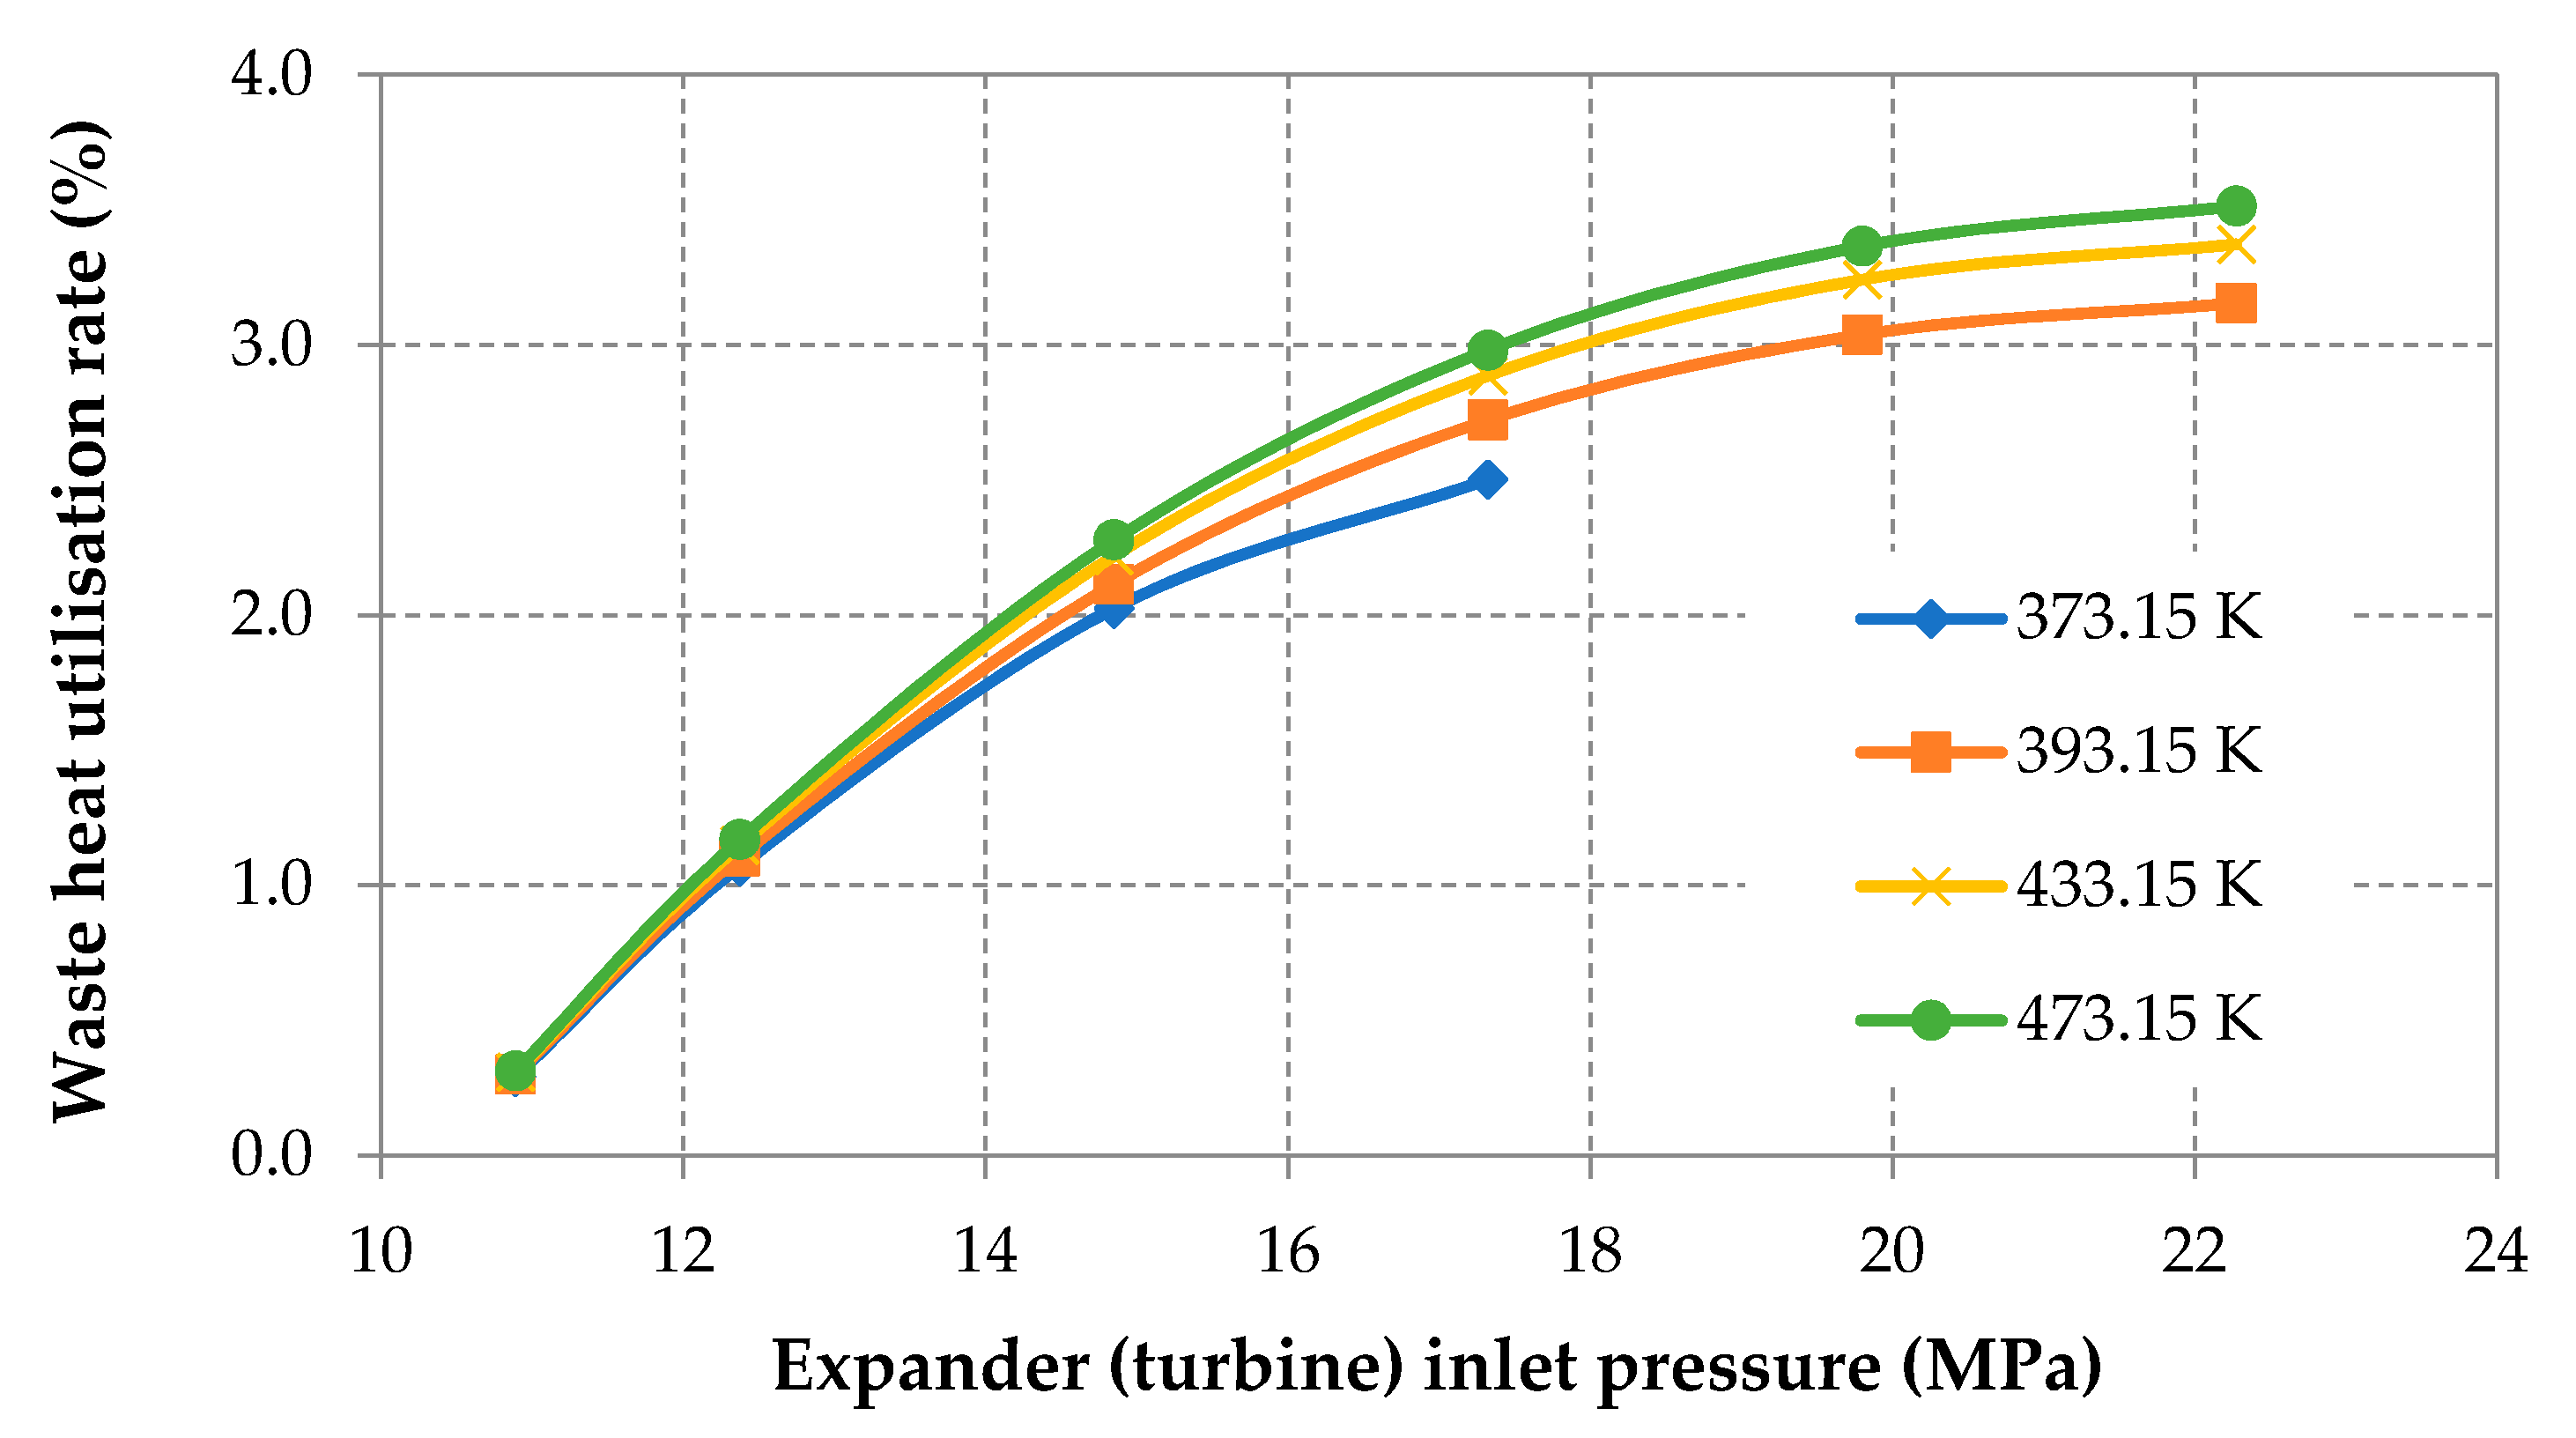
It is well known that the efficiency of a Brayton cycle is highly dependent on the turbine inlet temperature and pressure ratio [6,26,27]. In this work, it was decided to investigate how the change in the turbine inlet pressure will affect the cycle performance, assuming constant pressure at the turbine outlet (7.74 MPa). Different turbine inlet pressures from 11 to 22.5 MPa were assumed. For each of the assumed pressures, the energy efficiency indicators were determined for different values of exhaust gas temperatures at the heat exchanger outlet, ranging from 100 (373.15 K) to 200 °C (473.15 K). In addition, it was assumed that the temperature difference between CO2 and the exhaust gases at the inlet and outlet of the heat exchanger is always constant and is 5 K. Figure 4 presents the relationship between turbine inlet temperature and waste heat utilization rate.
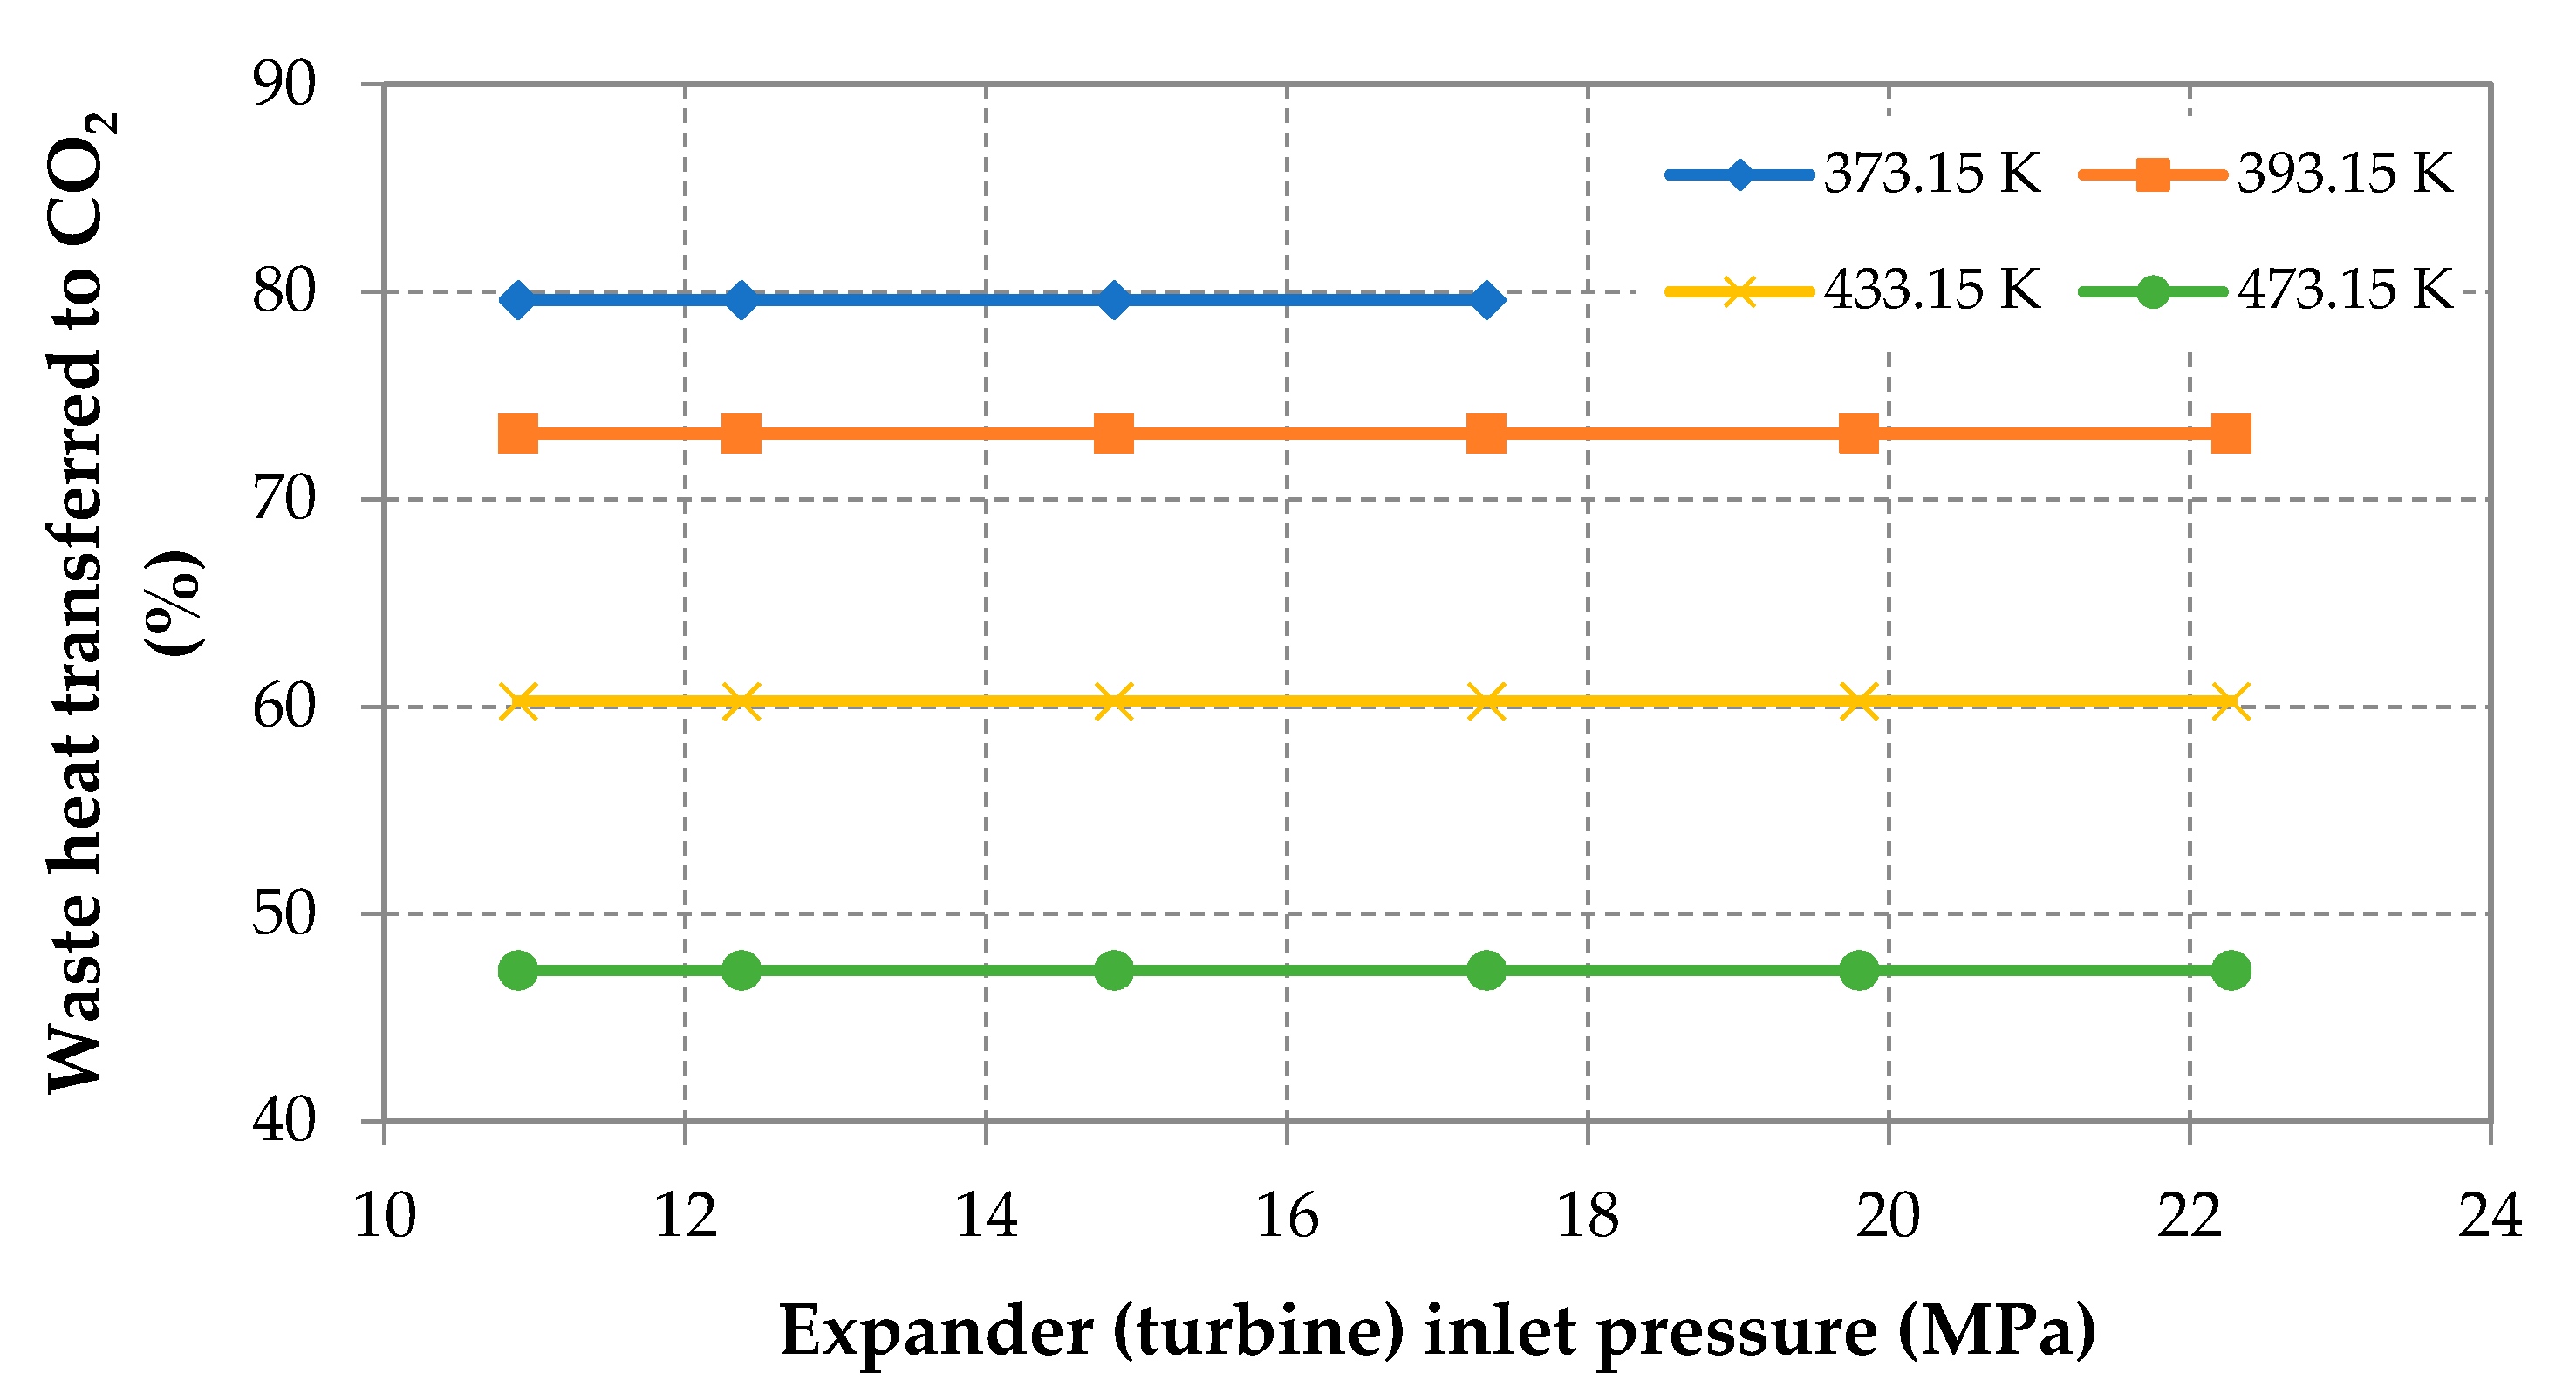
The plot presented in Figure 4 shows the dependence according to which the waste heat utilization rate grows with the exhaust gases temperature at the heat exchanger outlet and with the turbine inlet pressure. Waste heat utilization rate (Equation (7)) is a quotient in which the denominator has a constant value. This means that the higher the WHUR value, the larger the counter, which refers to the net power of the system. The higher the turbine inlet pressure, the greater the difference between the power on the turbine shaft and the required compressor power. This is due to the compression of CO2 near the critical point. The WHUR growth is related to the exhaust gas temperature increase at the heat exchanger outlet, which results from the use of a recuperator. At the assumed flue gases temperature at the exchanger outlet—100 °C (373.15 K)—the calculation results are shown for the maximum turbine inlet pressure of 17 MPa. This is due to the fact that, for higher pressures, the temperature of CO2 after compression was greater than the assumed exhaust gas cooling temperatures. This applies to the plots in Figure 4, Figure 5, Figure 6 and Figure 7. In Figure 5 the relationship between turbine inlet temperature and percent of waste heat transferred to CO2 is shown.
The analysis assumes that waste heat transferred to CO2 is constant for a given exhaust gas temperature at the heat exchanger outlet. PWHT is described by Equation (8), where all variables are independent of the inlet pressure to the turbine. Figure 5 presents examples of PWHT values for the described above assumptions.
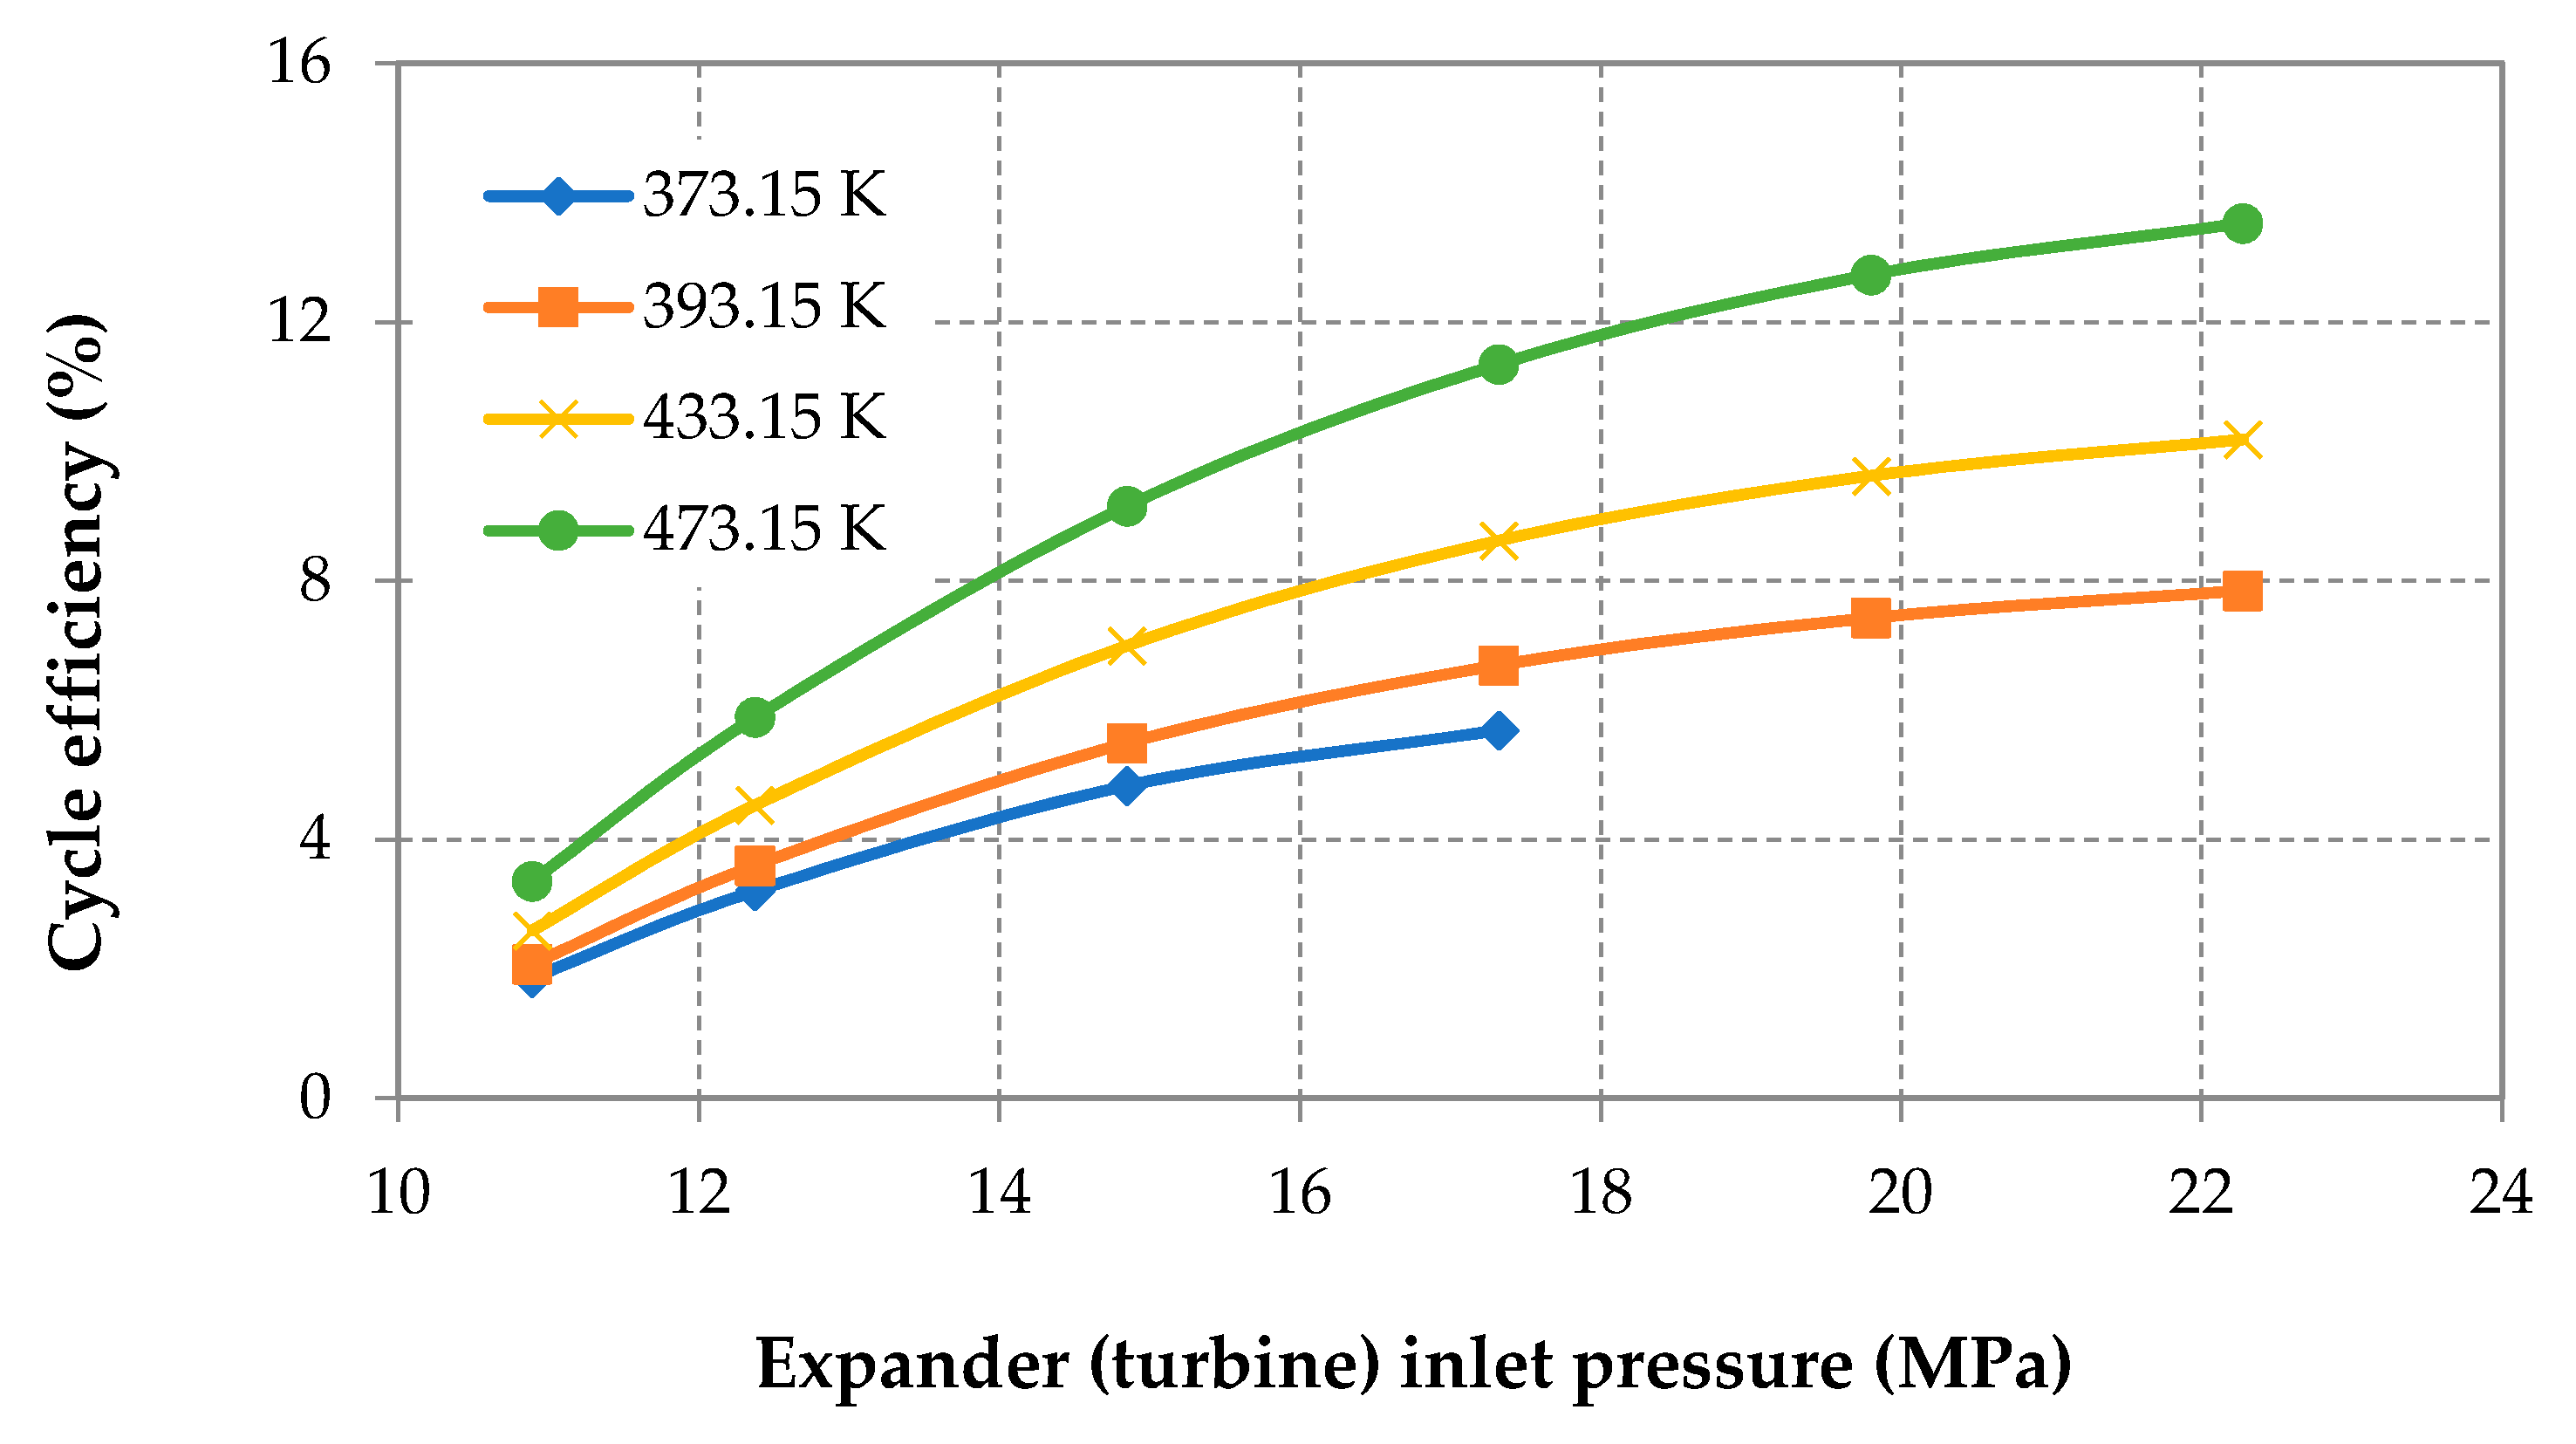
The last energy efficiency indicator is cycle efficiency. The relationship between turbine inlet temperature and cycle efficiency is presented in Figure 6.
Figure 6 shows that the higher the exhaust gases temperature at the heat exchanger outlet and the higher the turbine inlet pressure, the greater the cycle efficiency. Cycle efficiency refers to the internal efficiency of the system and is independent of the total waste heat amount, which is available in the exhaust gases (with assumption of exhaust gases cooling to 25 °C). The increase in the CE value with the increase of the turbine inlet pressure results from the fact that the higher the turbine inlet pressure, the greater the difference between the power on the turbine shaft and the required compressor power. This is due to the compression of CO2 near the critical point. The increase in CE value with the growth of exhaust gases temperature at the heat exchanger outlet (similar to WHUR), results from the use of a recuperator, which improves the efficiency of the cycle (Figure 8, Figure 9 and Figure 10).
As the mass flow rate of CO2 is also an important parameter, in Figure 7 the relationship between turbine inlet pressure and mass flow rate of CO2 is presented.
The CO2 mass flow was not the assumed value. CO2 mass flow was calculated as the required flow so that the given amount of waste heat could be transferred to the S-CO2 system. In the pressure and temperature range assumed for the system operation, the CO2 enthalpy value (for a constant temperature) decreases with increasing pressure. In the case of the discussed system, this is especially noticeable after passing CO2 through a recuperator (cold side). Assuming a constant heat flux to be transferred to the system, the smaller enthalpy at the main heat exchanger inlet causes that the CO2 velocity in the exchanger must be lower, and hence also the mass stream. When it comes to the increase in the mass stream of CO2 with the growth of exhaust gases temperature at the heat exchanger outlet, this is due to the fact that less energy from the outside is required for transfer to the system (the merit of the recuperator, which raises the temperature of CO2 at the heat exchanger inlet). The less energy from the outside that must be transferred to the system, the higher the CO2 velocity in the exchanger that can be achieved, and hence the mass stream. Figure 4, Figure 5, Figure 6 and Figure 7 show that if the temperature of exhaust gases at heat exchanger outlet is higher, the cycle efficiency is better.
4.2. Investigation on Temperature Difference between the Hot and Cold Side of the Recuperator
To investigate the reasons for the cycle efficiency growth related to the increase of temperature of exhaust gases at heat exchanger outlet, it was decided to additionally examine the influence of temperature difference between the hot and cold sides of the recuperator. For this purpose, the authors defined logarithmic mean temperature difference of the recuperator given by Equation (11):
where:
LMTD—logarithmic mean temperature difference of the recuperator (K),
—temperature of CO2 at the recuperator cold side inlet (K),
T3—temperature of CO2 at the recuperator cold side outlet (K),
—temperature of CO2 at the recuperator hot side inlet (K),
T6—temperature of CO2 at the recuperator hot side outlet (K).
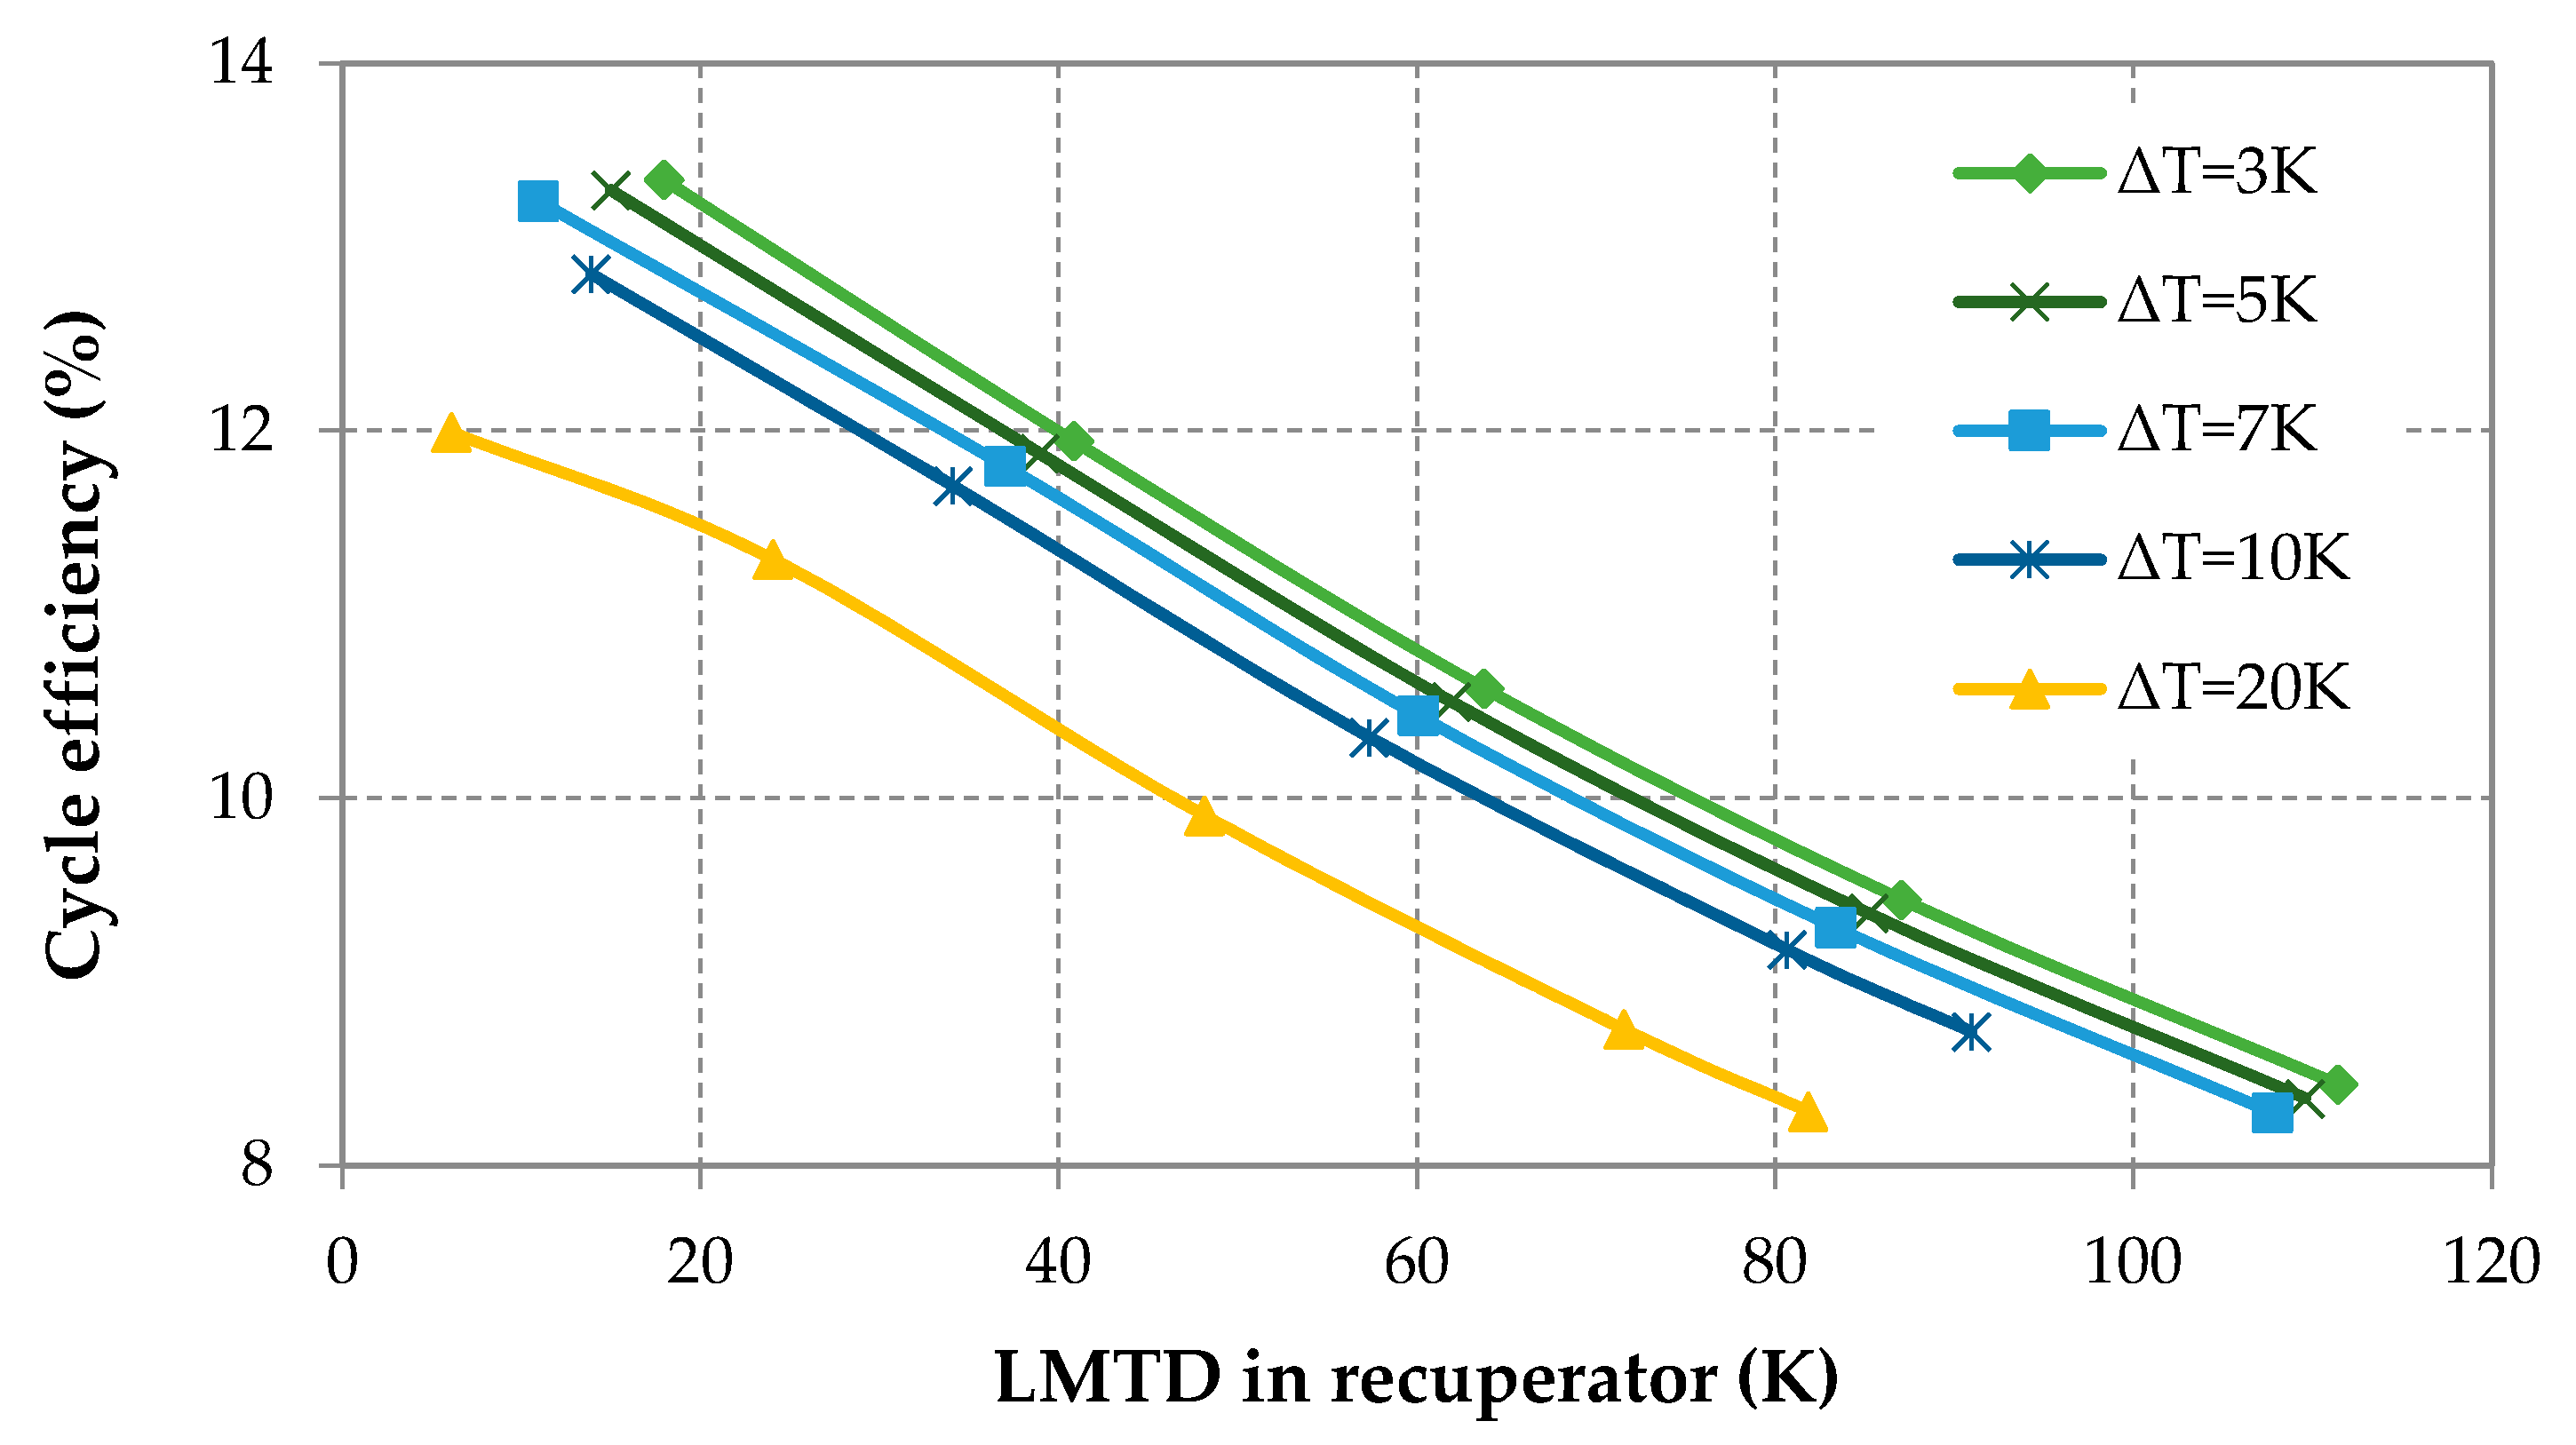
Calculations of the energy efficiency indicators were carried out for different LMTD values, for a constant turbine inlet pressure of 22.5 MPa. In addition, the same calculations were repeated for varied temperature differences between CO2 and the exhaust gases at the inlet and outlet of the heat exchanger, ranging from 3 to 20 K. The relationship between the LMTD and cycle efficiency is presented in Figure 8.
Figure 8 shows that the internal efficiency of the cycle increases if the difference in temperature of CO2 at the entry to and exit from the recuperator (between hot and cold side) is smaller. The smaller temperature difference between CO2 streams flowing countercurrent means that more heat of returning CO2 is transferred to CO2 after compression. Otherwise, this energy would have to be “taken” from the system at the cooler so the energy would be “wasted”. The increase in CE with the decrease in the LMTD results from the fact that the smaller the LMTD, the more energy is transferred from the hot side of recuperator to the cold side of recuperator. By this way, more internal energy in the system is re-used and thus the efficiency of the cycle is increasing. The relationship between the LMTD and percent of waste heat transferred to CO2 is presented in Figure 9.
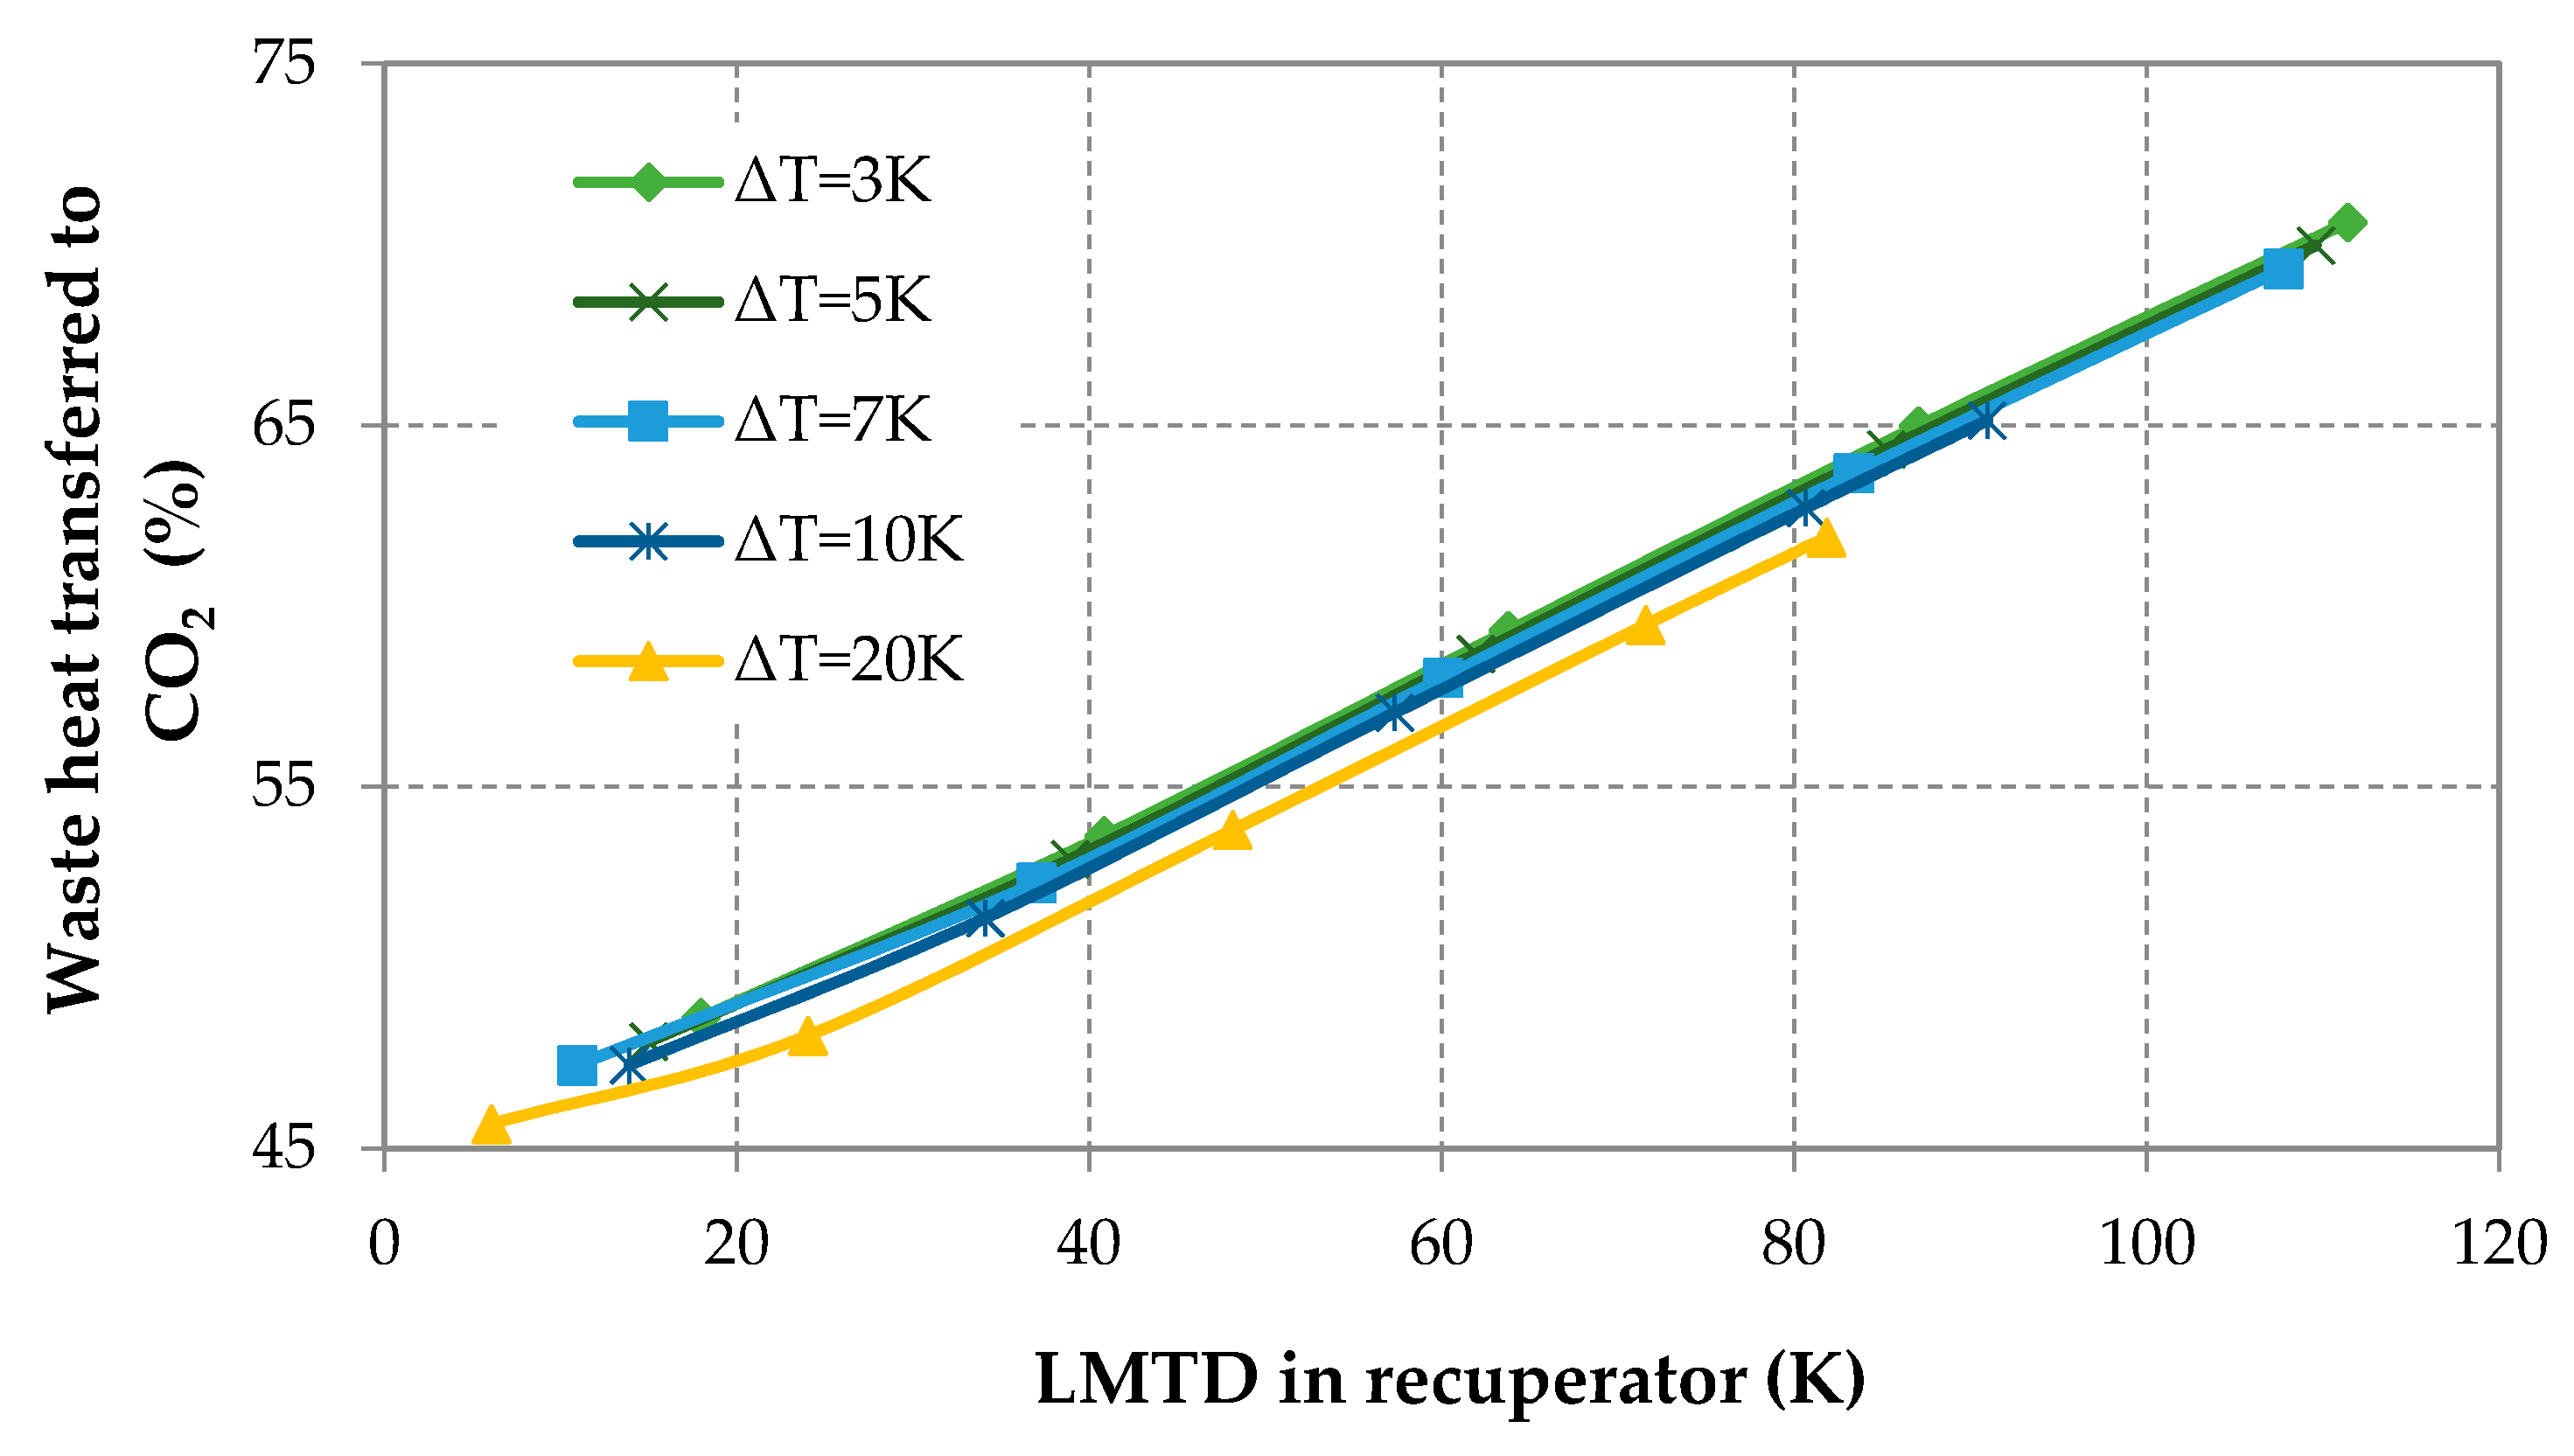
In Figure 9 a very clear relationship is presented, where, with the increase in LMTD in recuperator, the percent of waste heat transferred to CO2 also increases. This results from the fact that with larger values of LMTD in recuperator, more energy is “wasted” and “taken” from the system at the cooler. To compensate this, a correspondingly greater amount of waste heat from the flue gases must be supplied to the system.
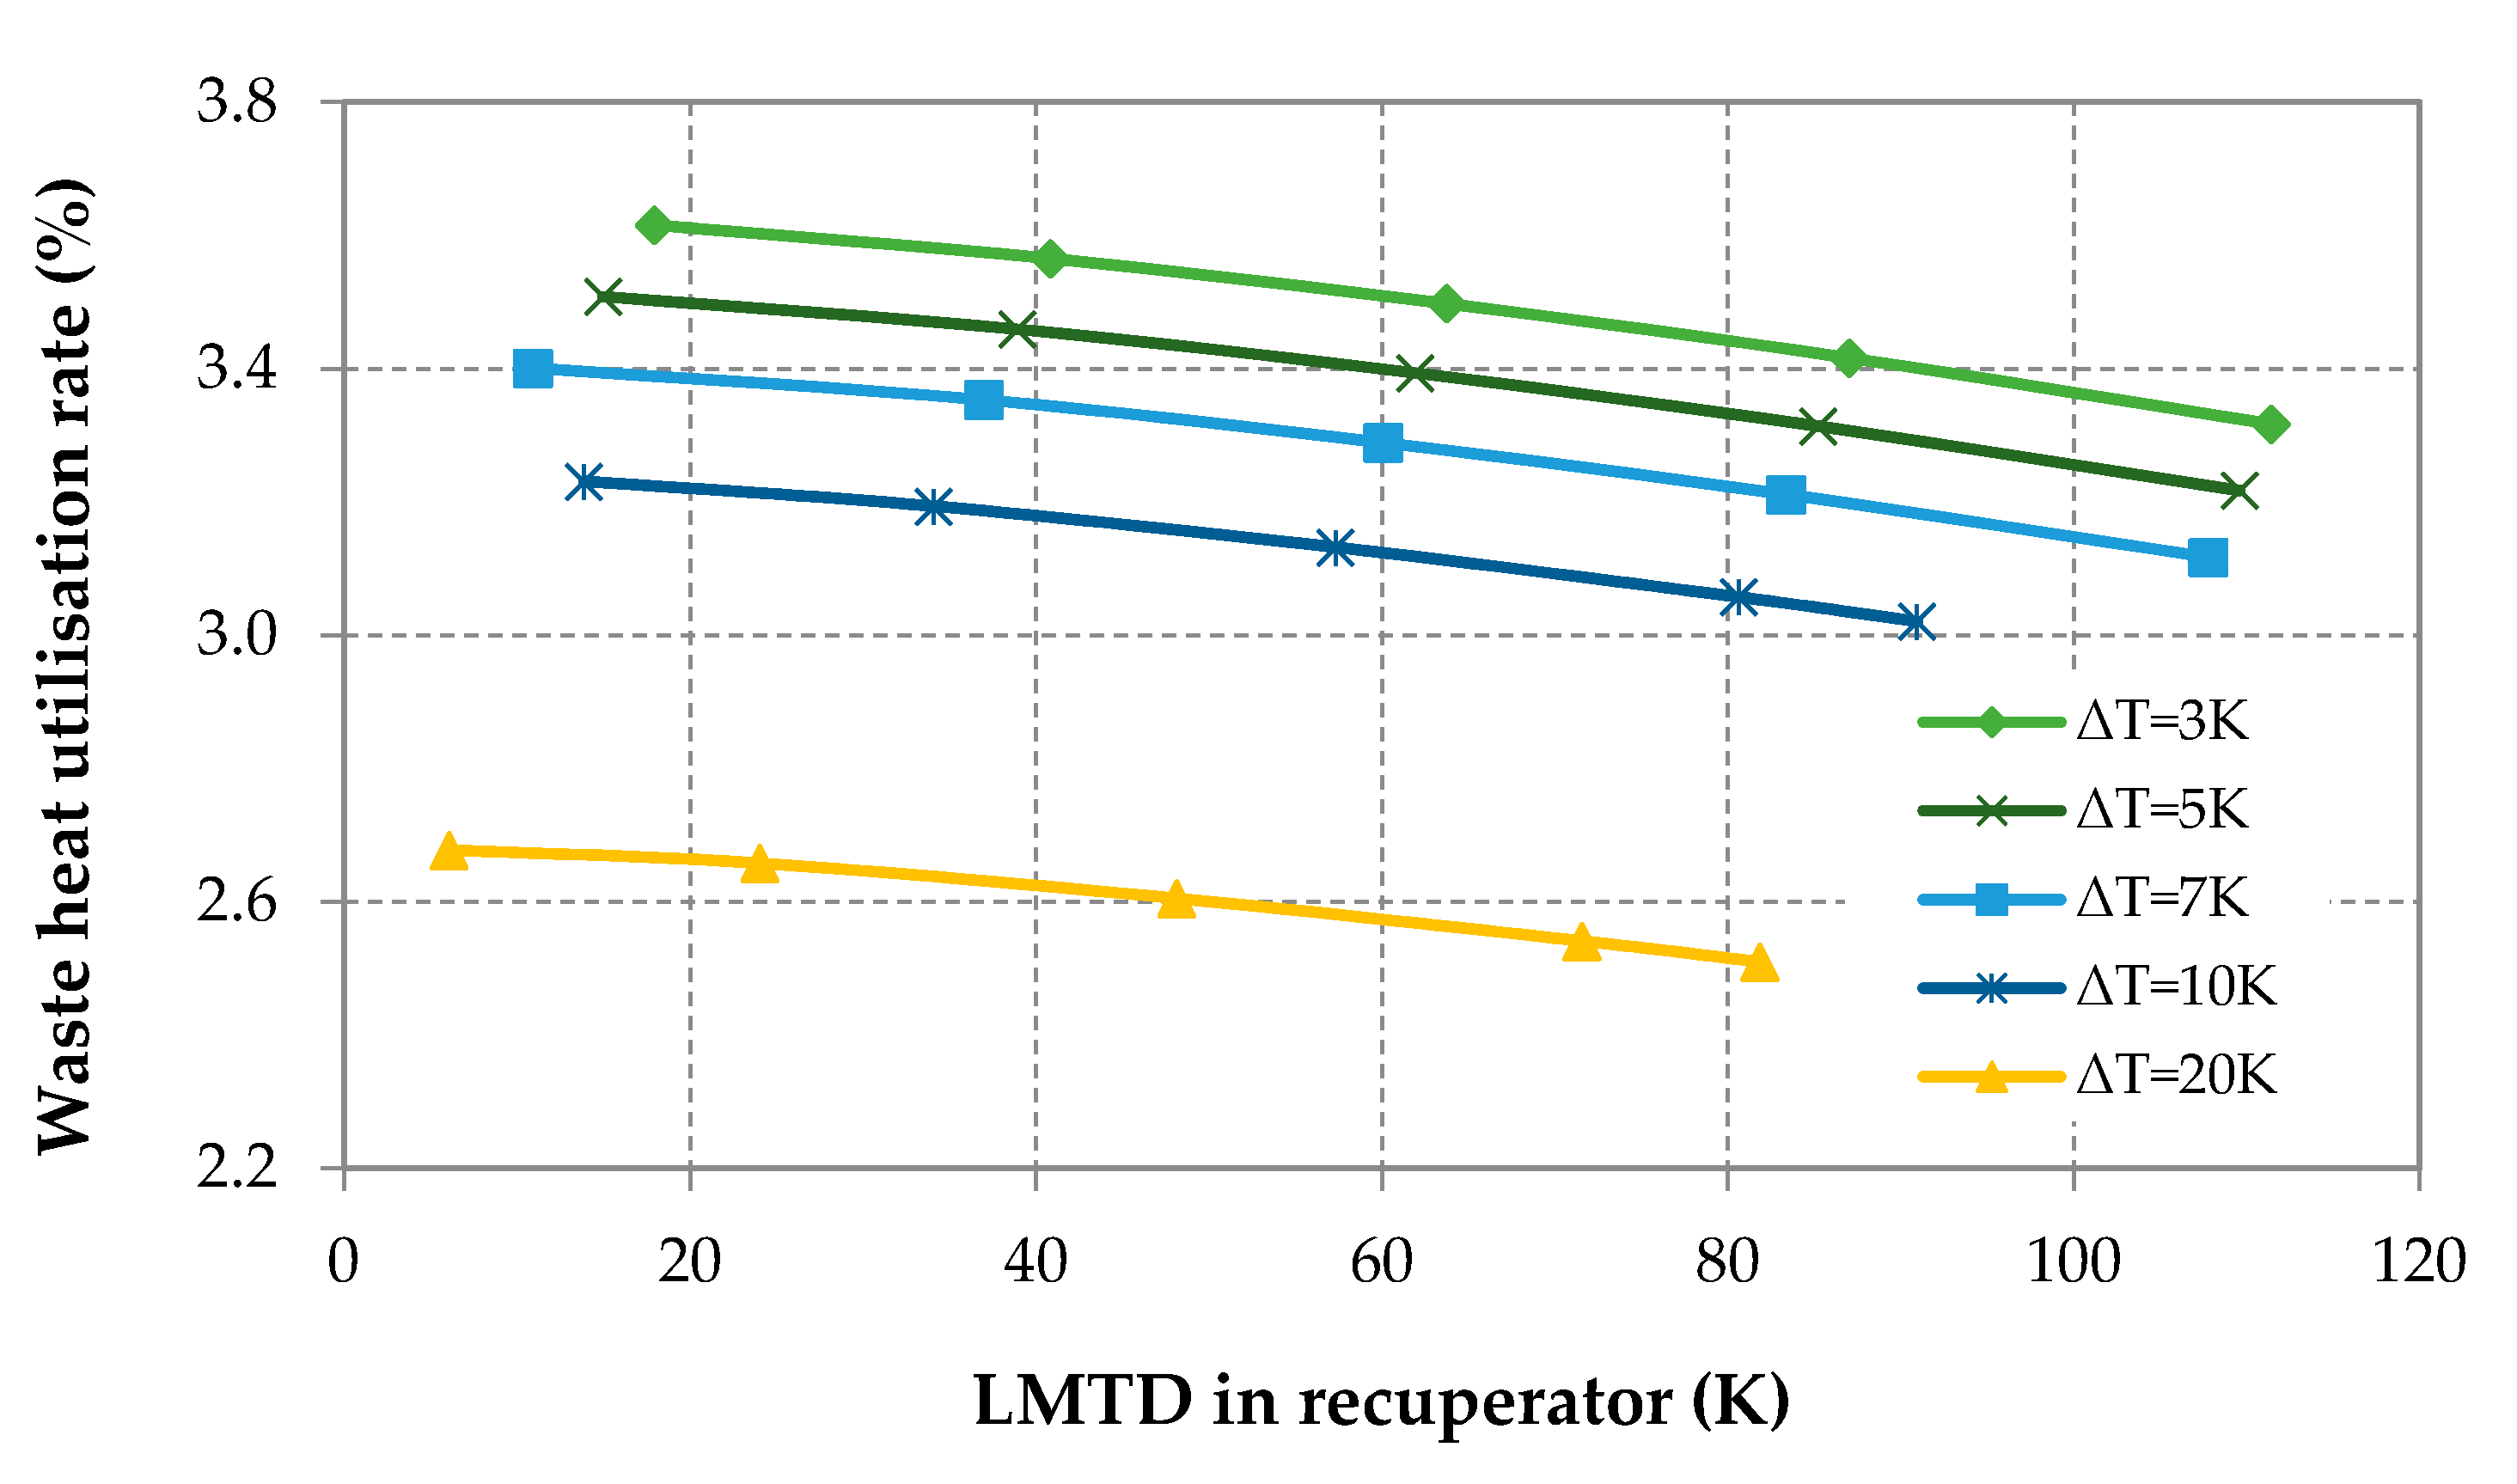
In Figure 10 the relationship between the LMTD and waste heat utilization rate is presented.
Waste heat utilization rate is an energy efficiency indicator, which combines CE and PWHT. The value of WHUR increases both with the growth in CE and PWHT. The data presented in Figure 10 shows that the WHUR value increases slightly with the decrease of LMTD in recuperator.
Results presented in Figure 8, Figure 9 and Figure 10, show that for the adopted operating conditions, the increase in internal efficiency has a greater impact on the WHUR than decrease in percent of waste heat transferred to CO2 (PWHT). The increase of WHUR is much more significant when the temperature difference between CO2 and flue gases in the heat exchanger decreases. This is due to the fact that both CE and PWHT grow with the temperature difference drop. By overlapping these growths, the increase in WHUR is evident.
5. Results and Discussion
As mentioned in the introduction, no other publications were found that presented an analysis of S-CO2 cycle application for the waste heat recovery at a natural gas compressor station. Detailed comparison of cycle efficiency indicators values between its applications in various industries is pointless, because these are different operating parameters (power of devices, waste heat temperature, etc.). For example, Kim et al. [6] studied the supercritical CO2 power cycle for landfill gas fired gas turbine bottoming cycle. They concluded that for the simple recuperated cycle the net produced work is 2.18 MWe with 29.98% cycle net efficiency. For comparison, in this paper maximum net power system was 47 kW with cycle efficiency 14%. However, it should be noticed that Kim et al. assumed exhaust temperature 519.69 °C and mass flow rate of the flue gases of 21.3 kg/s. In this work it was, respectively, 343.23 °C and 3.55 kg/s. Similarly, the maximum system operating pressure was taken as 27.6 MPa (22.5 MPa in this paper).
Taking this into account, it was decided to compare the values of selected S-CO2 efficiency indicators with ORC efficiency indicators, analyzed for the same gas compressor station. Kowalski et al. [2] analyzed the application of ORC system at Jarosław II natural gas compression station. The ORC system was proposed for the production of eclectic energy. They conclude that the average net electric power of about 32 kWe could be obtained when ORC system was fed with waste heat from a compressor engine. The obtained exergy efficiency of the cycle was about 7.06%. In another paper, Kostowski et al. [3] analyzed the methods of waste heat recovery at gas compressor station. They performed a case study for the Jarosław II gas compressor station and compared different technologies including ORC. The ORC output power was estimated in a simplified black-box approach based on nominal parameters and performance curves given by the manufacturer (Heat Recovery Solutions). The average net electrical output was assumed as 140 kWe.
The above discrepancy does not allow to clearly state which technology would be better to use at the Jarosław II gas compressor station. The high value of net electrical power in for a Heat Recovery Solutions product is caused (probably) due to the advanced optimization of the entire ORC system. At first glance, the advantage of the ORC system seems to be indisputable, but in this paper the analysis of the S-CO2 cycle was limited to the simple recuperated cycle and to conditions which occur at natural gas compressor stations.
The cycle efficiency and heat recovery coefficient must be carefully considered in the context of waste heat recovery system planning. These factors are directly related to the recovery work from the bottoming cycles. The net electrical efficiency of a heat recovery system is described as the product of cycle efficiency and the recovery rate of waste heat. In this case study, the defined waste heat utilization rate (WHUR) depends on both the cycle efficiency (CE) and the percent of waste heat transferred to CO2 (PWHT). The value of WHUR increases both with the growth in CE and PWHT. Thus, when optimizing the operational conditions of the waste heat recovery system, the aim is not only to maximize cycle efficiency (as for example like in fired plants). During operation optimization of the waste heat recovery system, it is necessary to take into account both cycle efficiency and percent of waste heat transferred to working fluid. It results from the fact that a significant increase in the CE value does not have such a large impact on the WHUR value. Each decrease in CE is compensated (not 100%) by an increase in the PWHT value. This dependence is very important, because the internal efficiency of the system can be increased by using, e.g., (i) more recuperators, (ii) stream splitting between several heat exchangers, etc. However, the increase in WHUR will not be proportional to the growth of CE. Implementation of additional devices in the system will increase its investment costs. In this case, when the management of waste heat is considered, the priority should be its maximum recovery (WHUR) with taking into account economic aspects. It may turn out that, instead of a complicated system, it will be possible to create a simpler system that will use more waste heat (PWHT) to increase the CO2 mass stream in the system. Increase in WHUR and PWHT is associated with heat exchange processes in exchangers and recuperators. That indicates one of the potential directions of further investigations on various heat exchanger solutions that will cooperate with S-CO2 in a selected temperature range.
Internal efficiency increase can bring other benefits. Waste heat after passing through a heat exchanger, can be reused in another process. An analysis of operational parameters (WHUR, PWHT, CE) of the Bryton S-CO2 cycle at the natural gas compressor station, showed that the temperature of the flue gases after passing the heat exchanger is high enough to reuse it (flue gases) as a heat source in an ORC system (there are organic fluids which operate at 100–200 K). That indicates additional direction for further research on Brayton S-CO2 cycle which operates in a cascade with the ORC system.
6. Conclusions
The aim of this case study was to estimate the possibility of application of the Brayton cycle with supercritical CO2 to utilize the waste heat from the exhaust gases at the natural gas compressor station. To achieve this, certain boundary conditions were assumed (e.g., waste heat parameters). The research was conducted in terms of impact of changes in the operating conditions of the S-CO2 system on defined energy efficiency indicators (temperature, pressure). The research demonstrated that energy efficiency indicators depend on the adopted operating conditions.
Other research groups results present better efficiency indicators of the Bryton S-CO2 cycle in comparison to the ORC cycle (in other branches of industry). Analysis of selected efficiency indicators values for S-CO2 and ORC (analyzed for the same natural gas compressor station) did not show direct advantages of S-CO2 cycle over ORC. This is due to the fact that ORC technology for the natural gas compressor station applications is relatively developed and thus the entire system is well optimized. In subsequent scientific studies, the authors focus on optimization of the Brayton S-CO2 cycle in terms of net electricity produced, which will allow to compare results with industrially available ORC technologies. However, it should be taken into consideration that the Brayton S-CO2 system has a number of technical advantages over the ORC system. The most important advantages are (i) lower investment costs, (ii) smaller streams of working medium in circulation, (iii) lower price of the working medium, (iv) properties of the working medium (ORC fluids are often hazardous). Therefore, it may turn out that, despite the slightly lower efficiency of the Brayton cycle, it will be more attractive for the investor.
The case study demonstrated the possibility of application of the S-CO2 Brayton cycle for waste heat parameters (temperature, stream) at a natural gas compressor station. It was proved that the increase in waste heat utilization rate (WHUR) is not proportional to the increase in cycle efficiency (CE). This makes it necessary to perform an individual case study, taking into account economic aspects. Additionally, disproportion indicates that it is better to create a simpler S-CO2 installation (i.e., less recuperators), which will use more waste heat (PWHT), thus increasing the mass flow of CO2 in the installation instead of complex system design (which is common practice). The study identified new potential directions for further research on application of S-CO2 at natural gas compressor stations, e.g., (i) focus on different types of heat exchangers and study of the S-CO2 heat flow in a specified temperature range; (ii) analysis of the Brayton S-CO2 cycle which operates in a cascade with ORC.
The presented case study did not focus on issues related to the use of mechanical work generated by the turbine. However, it should be pointed out that this an issue is as important as maximizing indicators values of the (i) cycle efficiency (CE) and (ii) the percent of waste heat transferred to CO2 (PWHT). Currently, the most commonly considered solution is the use of generated work to produce electricity (due to flexibility of electricity management system). Nowadays, heat recovery technologies are expensive, which means that there are not many such installations at natural gas compressor stations in the world. Regardless of that, applicability of results of this study may be beneficial when considering other scenarios of Brayton S-CO2 use, e.g., a Brayton S-CO2 system which operates in a cascade with the ORC system. Another application of the results of this study may be beneficial to underground gas storage magazines where the S-CO2 Brayton Cycle also could be used.
Author Contributions
Conceptualization, M.Ł. and A.S.; methodology, R.K., S.K. and T.W.; formal analysis, R.K.; investigation, S.K. and T.W.; resources, R.K., S.K., M.Ł., A.S. and T.W.; data curation, R.K.; writing—original draft preparation, R.K.; writing—review and editing, R.K. and S.K.; visualization, S.K.; supervision, M.Ł. and A.S. All authors have read and agreed to the published version of the manuscript.
Funding
This research received no external funding.
Conflicts of Interest
The authors declare no conflict of interest.
Abbreviations
| Symbols | |
| h1 | specific enthalpy of CO2 at the compressor inlet (J/kg) |
| h2 | specific enthalpy of CO2 at the compressor outlet (J/kg) |
| specific enthalpy of CO2 at the recuperator cold side inlet (J/kg) | |
| h3 | specific enthalpy of CO2 at the recuperator cold side outlet (J/kg) |
| specific enthalpy of CO2 at the heat exchanger cold side inlet (J/kg) | |
| h4 | specific enthalpy of CO2 at the heat exchanger cold side outlet (J/kg) |
| specific enthalpy of CO2 at the turbine inlet (J/kg) | |
| h5 | specific enthalpy of CO2 at the turbine outlet (J/kg) |
| specific enthalpy of CO2 at the recuperator hot side inlet (J/kg) | |
| h6 | specific enthalpy of CO2 at the recuperator hot side outlet (J/kg) |
| hIN | specific enthalpy of waste heat (flue gases) at heat exchanger hot side inlet (J/kg) |
| hOUT | specific enthalpy of waste heat (flue gases) at heat exchanger hot side outlet (J/kg) |
| hAM | specific enthalpy of waste heat (flue gases) at heat exchanger hot side outlet, assuming exhaust gases cooling to 25 °C (298.15 K) (J/kg) |
| mCO2 | mass stream of CO2 (kg/s) |
| mh | mass stream of waste heat (kg/s) |
| T1 | temperature of CO2 at the inlet to the compressor (K) |
| T2 | temperature of CO2 at the recuperator cold side inlet (K) |
| actual temperature of CO2 after compression (K) | |
| temperature of CO2 at the recuperator cold side inlet (K) | |
| T3 | temperature of CO2 at the recuperator cold side outlet (K) |
| T4 | CO2 turbine inlet temperature (K) |
| T5 | ideal CO2 temperature after expansion (K) |
| actual CO2 temperature after expansion (K) | |
| temperature of CO2 at the recuperator hot side inlet (K) | |
| T6 | temperature of CO2 at the recuperator hot side outlet (K) |
| W1-2 | required compressor power (W) |
| W4-5 | the power on the turbine shaft (W) |
| Wnet | the net power of the system (W) |
| Greek symbols | |
| ηc | isentropic efficiency of the compressor (-) |
| ηh | efficiency of the heat exchange (-) |
| ηp | isentropic efficiency of the compressor (-) |
| Abbreviations | |
| BC | Brayton cycle |
| CE | cycle efficiency (%) |
| LMTD | logarithmic mean temperature difference of the recuperator (K) |
| ORC | organic Rankine’s cycle |
| PWHT | percent of waste heat transferred to CO2 (%) |
| S-CO2 | supercritical CO2 Bryton cycles |
| WHUR | waste heat utilization rate (%) |
References
- Ríos-Mercado, R.Z.; Borraz-Sánchez, C. Optimization problems in natural gas transportation systems: A state-of-the-art review. Appl. Energy 2015, 147, 536–555. [Google Scholar] [CrossRef]
- Kowalski, R.; Łaciak, M.; Liszka, K.; Oliinyk, A.; Paszylk, P. Application of ORC systems at natural gas compression station. AGH Drill. Oil Gas 2017, 34, 513–530. [Google Scholar] [CrossRef] [Green Version]
- Kostowski, W.; Pajączek, K.; Pociecha, A.; Kalina, J.; Niedzielski, P.; Przybył, A. Methods of waste heat recovery—A compressor station case study. Energy Convers. Manag. 2019, 197, 111837. [Google Scholar] [CrossRef]
- Yilmazoglu, M.Z.; Amirabedin, E.; Shotorban, B. Waste heat utilization in natural gas pipeline compressor stations by an organic Rankine cycle. Energy Explor. Exploit. 2014, 32, 317–328. [Google Scholar] [CrossRef]
- Bianchi, M.; Branchini, L.; De Pascale, A.; Melino, F.; Peretto, A.; Archetti, D.; Campana, F.; Ferrari, T.; Rossetti, N. Feasibility of ORC application in natural gas compressor stations. Energy 2019, 173, 1–15. [Google Scholar] [CrossRef]
- Kim, M.S.; Ahn, Y.; Kim, B.; Jeong, J.I. Study on the supercritical CO2 power cycles for landfill gas firing gas turbine bottoming cycle. Energy 2016, 111, 893–909. [Google Scholar] [CrossRef]
- Chen, Y. Novel Cycles Using Carbon Dioxide as Working Fluid. Licentiate Thesis, School of Industrial Engineering and Management, Stockholm, Sweden, 2006. [Google Scholar]
- Kalina, A.I. Combined-cycle system with novel bottoming cycle. J. Eng. Gasturbines Power 1984, 106, 737–742. [Google Scholar] [CrossRef]
- Chen, Y.; Lundqvist, P.; Johansson, A.; Platell, P. A comparative study of the carbon dioxide transcritical power cycle compared with an organic rankine cycle with R123 as working fluid in waste heat recovery. Appl. Eng. 2006, 26, 2142–2147. [Google Scholar] [CrossRef]
- Ahn, Y.; Bae, S.J.; Kim, M.; Cho, S.K.; Baik, S.; Lee, J.I.; Cha, J.E. Review of supercritical CO2 power cycle technology and current status of research and development. Nucl. Eng. Technol. 2015, 47, 647–661. [Google Scholar] [CrossRef] [Green Version]
- Yoon, H.J.; Ahn, Y.; Lee, J.I.; Addad, Y. Potential advantages of coupling supercritical CO2 Brayton cycle to water cooled small and medium size reactor. Nucl. Eng. Des. 2012, 245, 223–232. [Google Scholar] [CrossRef]
- Di Bella, F.A. Gas Turbine Engine Exhaust Waste Heat Recovery Navy Shipboard Module Development. In Proceedings of the Supercritical CO2 Power Cycle Symposium, Boulder, CO, USA, 24–25 May 2011. [Google Scholar]
- Dostal, V. Supercritical Carbon Dioxide Cycle for Next Generation Nuclear Reactors. Ph.D. Thesis, Department of Nuclear Engineering, Massachusetts Institute of Technology, Cambridge, MA, USA, 2004. [Google Scholar]
- Sabharwall, P.; Kim, E.S.; Patterson, M. Fluoride High Temperature Reactor Integration with Industrial Process Applications; TEV-1160; Idaho National Laboratory: Idaho Falls, ID, USA, 2011.
- Dostal, V.; Hejzlar, P.; Driscoll, M.J. The supercritical carbon dioxide power cycle: Comparison to other advanced power cycles. Nucl. Technol. 2006, 154, 283–301. [Google Scholar] [CrossRef]
- Chen, H.; Goswami, D.Y.; Stefanakos, E.K. A review of thermodynamic cycles and working fluids for the conversion of low-grade heat. Renew. Sustain. Energy 2010, 14, 3059–3067. [Google Scholar] [CrossRef]
- Utamura, M.; Tamaura, Y.; Hasuike, H. Some alternative technologies for solar thermal power generation. In Proceedings of the International Solar Energy Conference, Denver, CO, USA, 8–13 July 2006; pp. 75–84. [Google Scholar]
- Garg, P.; Kumar, P.; Srinivasan, K. Supercritical carbon dioxide Brayton cycle for concentrated solar power. J. Supercrit. Fluids 2013, 76, 54–60. [Google Scholar] [CrossRef]
- Turchi, C.S.; Ma, Z.; Neises, T.; Wagner, M. Thermodynamic study of advanced supercritical carbon dioxide power cycles for high performance concentrating solar power systems. In Proceedings of the Energy Sustainability, San Diego, CA, USA, 23–26 July 2012. [Google Scholar]
- Wright, S.A.; Davidson, C.S.; Scammell, W.O. Thermo-economic analysis of four sCO2 waste heat recovery power systems. In Proceedings of the Supercritical CO2 Power Cycle Symposium, San Antonio, TX, USA, 29–31 March 2016. [Google Scholar]
- Sarkar, J.; Bhattacharyya, S. Optimization of recompression S-CO2 power cycle with reheating. Energy Convers. Manag. 2009, 50, 1939–1945. [Google Scholar] [CrossRef]
- Akbari, A.D.; Mahmoudi, S.M.S. Thermoeconomic analysis & optimization of the combined supercritical CO2 (carbon dioxide) recompression Brayton/organic Rankine cycle. Energy 2014, 78, 501–512. [Google Scholar]
- Heo, J.Y.; Kim, M.S.; Baik, S.; Bae, S.J.; Lee, J.I. Thermodynamic study of supercritical CO2 Brayton cycle using an isothermal compressor. Appl. Energy 2017, 206, 1118–1130. [Google Scholar] [CrossRef]
- Bell, I.; Wronski, J.; Quoilin, S.; Lemort, V. Pure and Pseudo-pure Fluid Thermophysical Property Evaluation and the Open-Source Thermophysical Property Library CoolProp. Available online: http://coolprop.sf.net (accessed on 1 March 2020).
- Lemmon, E.W.; Huber, M.L.; McLinden, M.O. NIST Standard Reference Database 23: Reference Fluid Thermodynamic and Transport Properties-REFPROP, Version 9.0. Available online: https://www.nist.gov/publications/nist-standard-reference-database-23-reference-fluid-thermodynamic-and-transport (accessed on 1 March 2020).
- Liu, Y.; Wang, Y.; Huang, D. Supercritical CO2 Brayton cycle: A state-of-the-art review. Energy 2019, 189, 115900. [Google Scholar] [CrossRef]
- Wang, L.; Pan, L.M.; Wang, J.; Chen, D.; Huang, Y.; Hu, L. Investigation on the temperature sensitivity of the S-CO2 Brayton cycle efficiency. Energy 2019, 178, 739–750. [Google Scholar] [CrossRef]
Figure 1.
Schematic of a simple supercritical Brayton cycle with CO2 (S-CO2) cycle.

Figure 2.
Temperature vs. entropy of S-CO2 cycle.

Figure 3.
Pressure vs. enthalpy of S-CO2 cycle.

Figure 4.
Relationship between turbine inlet temperature and waste heat utilization rate for the different exhaust gas temperature at the heat exchanger outlet.
Figure 4.
Relationship between turbine inlet temperature and waste heat utilization rate for the different exhaust gas temperature at the heat exchanger outlet.

Figure 5.
Relationship between turbine inlet temperature and percent of waste heat transferred to CO2 for the different exhaust gas temperatures at the heat exchanger outlet.
Figure 5.
Relationship between turbine inlet temperature and percent of waste heat transferred to CO2 for the different exhaust gas temperatures at the heat exchanger outlet.

Figure 6.
Relationship between turbine inlet temperature and percent of waste heat transferred to CO2 for the different exhaust gas temperatures at the heat exchanger outlet.
Figure 6.
Relationship between turbine inlet temperature and percent of waste heat transferred to CO2 for the different exhaust gas temperatures at the heat exchanger outlet.

Figure 7.
Relationship between turbine inlet pressure and mass flow rate of CO2 for the different exhaust gas temperatures at the heat exchanger outlet.
Figure 7.
Relationship between turbine inlet pressure and mass flow rate of CO2 for the different exhaust gas temperatures at the heat exchanger outlet.

Figure 8.
Relationship between the LMTD and cycle efficiency for varied temperature differences between CO2 and the exhaust gases at the inlet and outlet of the heat exchanger.
Figure 8.
Relationship between the LMTD and cycle efficiency for varied temperature differences between CO2 and the exhaust gases at the inlet and outlet of the heat exchanger.

Figure 9.
Relationship between the LMTD and percent of waste heat transferred to CO2 for varied temperature differences between CO2 and the exhaust gases at the inlet and outlet of the heat exchanger.
Figure 9.
Relationship between the LMTD and percent of waste heat transferred to CO2 for varied temperature differences between CO2 and the exhaust gases at the inlet and outlet of the heat exchanger.

Figure 10.
Relationship between the LMTD and waste heat utilization rate for varied temperature differences between CO2 and the exhaust gases at the inlet and outlet of the heat exchanger.
Figure 10.
Relationship between the LMTD and waste heat utilization rate for varied temperature differences between CO2 and the exhaust gases at the inlet and outlet of the heat exchanger.


Table 1.
Exhaust gases average properties [2].
Table 1.
Exhaust gases average properties [2].
| Component of Wet Waste Gases | Molar Participation (% mol) |
|---|---|
| Carbon dioxide | 5.10 |
| Oxygen | 9.40 |
| Nitrogen | 73.55 |
| Water vapor | 11.95 |
| Stream parameters | |
| Mh = 3.55 kg/s | |
| TIN = 616.38 K | |
Table 2.
Assumptions and constraints of S-CO2 cycle.
| Parameter | Value |
|---|---|
| Maximum operating pressure of the cycle | 22.5 MPa |
| Maximum operating temperature of the cycle | Limited by the exhaust gases temperature (616.38 K) |
| Minimum operating pressure of the cycle | 7.7 MPa |
| Minimum operating temperature of the cycle | 308.15 K |
| Pressure drop during the heat exchange | 0.5% of the inlet pressure |
| Isentropic efficiency of the compressor | 0.85 |
| Isentropic efficiency of the turbine | 0.85 |
| Efficiency of the heat exchanger | 0.95 |
© 2020 by the authors. Licensee MDPI, Basel, Switzerland. This article is an open access article distributed under the terms and conditions of the Creative Commons Attribution (CC BY) license (http://creativecommons.org/licenses/by/4.0/).
Share and Cite
MDPI and ACS Style
Kowalski, R.; Kuczyński, S.; Łaciak, M.; Szurlej, A.; Włodek, T. A Case Study of the Supercritical CO2-Brayton Cycle at a Natural Gas Compression Station. Energies 2020, 13, 2447. https://0-doi-org.brum.beds.ac.uk/10.3390/en13102447
AMA Style
Kowalski R, Kuczyński S, Łaciak M, Szurlej A, Włodek T. A Case Study of the Supercritical CO2-Brayton Cycle at a Natural Gas Compression Station. Energies. 2020; 13(10):2447. https://0-doi-org.brum.beds.ac.uk/10.3390/en13102447
Chicago/Turabian StyleKowalski, Rafał, Szymon Kuczyński, Mariusz Łaciak, Adam Szurlej, and Tomasz Włodek. 2020. "A Case Study of the Supercritical CO2-Brayton Cycle at a Natural Gas Compression Station" Energies 13, no. 10: 2447. https://0-doi-org.brum.beds.ac.uk/10.3390/en13102447
Note that from the first issue of 2016, this journal uses article numbers instead of page numbers. See further details here.