Global Energy Security Index and Its Application on National Level


School of Energy Systems, LUT University, Yliopistonkatu 34, 53850 Lappeenranta, Finland
*
Author to whom correspondence should be addressed.
Energies 2020, 13(10), 2502; https://0-doi-org.brum.beds.ac.uk/10.3390/en13102502
Submission received: 30 April 2020
/
Revised: 12 May 2020
/
Accepted: 13 May 2020
/
Published: 15 May 2020
(This article belongs to the Special Issue Energy and Economic Security)
Abstract
:Energy security is an international concern for all countries in the world, particularly, for the policymakers looking for the wellbeing of citizens. While proper methods to measure energy security without ignoring the different aspects and multidimensional interplay is necessary, the need for an objective evaluation with numerical indicators is of utmost importance. This research covers these gaps by providing a detailed numerical method to formulate an energy security index that is globally comprehensive, but also nationally applicable to all countries in the world. This implies to include all needed aspects and dimensions of energy security. Results of this research show the global performance of all countries in the world in energy security and the performance of these countries in each of the 15 dimensions that articulate energy security. Germany and the United States performed best in the world, when it comes to overall energy security levels, whereas the Central African Republic and Turkmenistan are on the lowest end of performance. Conclusions show that there is not a single way for development and enhancing energy security but rather different alternatives and options. Countries need to learn from each other to identify what works best for their context and implement these strategies in order to enhance energy security.

1. Introduction
Energy security is an universal concern [1]. Many studies have tried to discuss this topic [2,3,4] from different point of views like various fields of science [5], international relationships [6] and national security [7]. The ability of energy security to shape policies and national behaviour [8] makes it very important. While policies and regulations are prepared, energy security has to be addressed first because of its relevance [9]. The needs of energy consumers are covered when policymakers aim to ensure energy security [10].
Although, the concept of energy security is ‘as old as fire’ [11] and the discussion has a long history, scientific analysis following current research principles and standards are rare before 1975 [12]. Ang et al. [1] state that publications on energy security were rare before 2001, however, it has emerged as one of the important topics [13] in the 21st century. The emergence of this field is because energy is an engine for economic growth [3,14] with close links to economy [15,16] and a driver for civilisation [17] and society [18]. In general, energy affects every aspect of life [19] and therefore crucial to the survival of the functioning modern society [3]. Therefore, enhancing energy security is a key goal of a society [2,20,21,22,23,24,25]. Personal and national energy security are paths to freedom of choice, and thereafter, self-actualisation as in Maslow’s hierarchy of needs [26].
Consequently, the question about the needed level of energy security arises. Many answers based on different assessment tools and approaches have been offered [27,28,29,30,31] based on the definitions and dimensions used in the assessment. The analysis of energy security by Azzuni and Breyer [32] is further developed in this research. Azzuni and Breyer devised 15 dimensions for energy security analysis: Availability, Diversity, Cost, Technology and Efficiency, Location, Timeframe, Resilience, Environment, Health, Culture, Literacy, Employment, Policy, Military and Cyber Security. This approach is one of the most comprehensive and detailed approaches. However, as many tried to conceptualise energy security, there is still a need for a proper tool to quantify the level of energy security that allows for better interpretation for policymaking. In addition, there is a need for holistic approaches but detailed enough for all individual countries with a global context as was proposed by Hansen et al. [33].
Quantification is one of the important aspects of social science and many other fields of science. It gives the ability for comparing different situations and status. Also, it allows for decision-makers to address exact options as a direct way to enhance the quantified concept. Therefore, this paper aims to evaluate energy security with an energy security index that covers sustainable development of the energy system.
This index is built on the 15 dimensions and their parameters presented by Azzuni and Breyer [32]. The newly introduced energy security index is designed to overcome one or more existing research gaps of the previous studies, as they had been identified as follows:
- Not enough dimensions and parameters to cover all the aspects of energy security;
- No transparency of methods of building the index;
- Limited data or use of the proposed numerical indicators;
- Limited application of the index on one country or region, or for a short period of time;
- Equal weighting approach for all dimensions and parameters within the index;
- No or limited interpretation of the results into policy recommendations that can enhance energy security.
Examples for research gaps are found in literature [34,35,36]. Although Wang and Zhou [34] proposed a global framework to analyse energy security, their research lacks many aspects of energy security as they have limited their analysis to only three dimensions. In our research, a more comprehensive use of dimensions is presented. In total 15 dimensions are used and evaluated. This by itself is novel as there is no literature to evaluate all 15 dimensions together with their respective parameters. Furthermore, unlike clustering countries into categories that was presented by Wang and Zhou [34], our novel approach is to represent all countries individually. Our research has more resolution for the national level. Furthermore, the same research gap of limiting energy security to a more simplified concept was noticed from [35,36], where only 6 and 8 indicators were used, respectively, to measure energy security. That is a simplified approach as energy security consists of more aspects that need to be addressed. Overcoming this major limitation by evaluating 15 dimensions, 50 parameters and 76 indicators is one of the novelties of this research. Unlike previous research [35,36] that was limited on a certain country or region, the novelty of this research is to evaluate energy security for all countries in the world.
The above listed research gaps are intended to be overcome by the following advancements:
- Building an energy security index that is comprehensive and representative: This research is based on the selected 15 dimensions approach with several parameters in each dimensions following the earlier conceptualisation [32]. These dimensions and parameters are to provide a holistic analysis of energy security. The relationship of each of the parameters and dimensions has been fully established and presented in [32]. This research uses the same dimensionalisation, but further develops it to accommodate numerical indicators that can be measured for each parameter and dimension.
- Representing energy security dimensions and parameters with overarching indicators: The choice of numerical indicators is based on several criteria that are not well established in previous research or at least with limited transparency of how these indicators were chosen. This research choses the following criteria for numerical indicators:
- Data used from trusted sources;
- Indicator values are available for all countries in the world or at least most of them;
- Close proxy to the parameters;
- Indicator values can be in absolute of relative numbers;
- Normalisation should be possible for energy security analysis;
- Availability for current and future scenarios;
- Accounting for sustainability [37] as much as possible.
- A transparent approach: This research is based on open science. The detailed methods are presented in a maximum level of detail to fully track all the established relationships between dimensions, parameters and indicators of energy security. The building steps of the index are represented with numbers and values.
- A weighting procedure: This research in the first phase will follow the same trend of previous credible research of having equal weights for all dimensions and parameters. But this research will build on that first phase to accomplish a complete index that uses a reasonable weighting procedure. The weighting will be based on a survey from experts in the field of energy security, energy policy and sustainability. The survey is planned as a follow-up research.
- Policy recommendations: This research will provide recommendations to policymakers of what policies are supportive in order to enhance energy security. With a bigger picture, this research will analyse energy security with energy scenarios that aim to enhance energy security in related countries.
The paper is organised as follows: After the Introduction, the methods of choosing suitable indicators for each of the parameters is presented in the Methods section. In the Results and Discussion section, the final index is presented with its application on selected case countries, in addition, the results of applying the index on the case countries are addressed and discussed in detail with ways to enhance the energy security level. Recommendations for achieving higher energy security level are provided in the Conclusions and Recommendation section.
2. Methods
For each dimension, parameters are assigned, measured or calculated indicators. Then, all values are normalised and standardised to a percentage value. The normalisation of each indicator is based on global values, in order to make the index applicable globally. These percentages for each parameter are then multiplied by their weights. If a parameter affects the ES index positively when increased, it is assigned a positive value. If the increase in a parameter represents a negative impact on energy security, the indicator value is subtracted from unity (100%). After that, the parameters (Yj) and their weights (Wj) are summed up to form the value of each dimension (Xi). The next step is the aggregation of the dimensions using their weights (Vi) to form the ES index. Details of the methods are presented below for each of the dimensions and its parameters. The overall energy security index is presented in Equation (1), while Equation (2) represents the formula for each dimension
where Vi is the weight of each dimension and Xi is the value of each dimension.
where Wj is the weight of each parameter and Yj is the value of each parameter. Yj is built by one indicator or an average of several indicators. Values of each indicator are normalised to a percentage value with the same meaning. If there is more than one indicator for any parameter, then Equation (3) is applied
where In is a normalised indicator used for the specific parameter Yj and o is the number of indicators.
All parameters are given equal weights (Wj) within their dimension because of lack of data for individual weighting. The same is applied to the dimensions which are given equal weights (Vi) in the aggregation of the ES index. If valid justification for specific weighting for the dimensions (Xi) or the parameters (Yj) exists in the future, a room for future improvement arises. Many other previous studies have used equal weighting when aggregating their energy security index [38,39,40].
Many indicators are normalised by a max-min approach in linear regression to obtain a percentage indicator with relevance to the global achievement in that indicator. Equation (4) describes the max-min normalisation method. Usually, normalisation takes place if the original indicator is not already in a percentage value.
where (In.Yj) is the normalised indicator, (Ia) is the absolute value of the indicator, (Imin) is the minimum value in the world for (Ia) and (Imax) is the maximum value in the world for (Ia).
Nevertheless, sometimes normalisation is done by linear regression for an optimal-worst relationship of an indicator, this is done for the indicators where relationship to energy security is more complex. Equation (5) shows the conversion from Equation (4) to an optimal-worst normalisation method. Such a choice of optimal-worst normalisation is justified separately for indicators that need such alternations.
where (In.Yj) is the normalised indicator, (Ia) is the absolute value of the indicator, (Iworst) is the worst value in the world for this indicator (Ia) and (Ioptimal) is the optimal value in the world for this indicator (Ia).
In case some values do not exist for certain indicators, these indicators are set as empty cells and therefore, do not affect the calculation of the respected parameter. That is in case of indicators used to measure a parameter. In the case there is only one indicator for a parameter, then the value of that parameter is set as the worst value (0%). The list of missing indicators is presented in the Supplementary Material.
The detailed methods for formulating each of the dimensions and their corresponding parameters and indicators are provided in Appendix A.
3. Results and Discussion
3.1. Energy Security Index
The designed energy security index is presented in Table 1 where dimensions, parameters and indicators are detailed, in addition, units and normalisation methods for each indicator are summarised. All notations and abbreviations in Table 1 are explained in detail in Appendix A.
The design of the energy security index makes it clear that it is absolutely quantified and can account for many aspects of energy security. Unlike earlier research and literature that would propose parameters and indicators that are not possible to quantify and measure for most countries in the world [20], Table 1 shows an analysis for what indicators are included for energy security dimensions and parameters according to the rules stated in the Introduction (Section 1). Table 1 shows how research gaps, that were addressed in the Introduction (Section 1), are now covered in detail by 15 dimensions, 50 parameters and 78 indicators.
Although it might appear that some proxy indicators do not have a direct relationship to energy security, but that is due to the angle perspective energy security is viewed from. As this analytical framework builds the concept of energy security on hierarchical levels (dimensions, parameters, indicators), it is justified to have relevant and suitable proxy indictors for each parameter, together with a justifiable correlation between parameters and dimensions, up to the level of correlation of dimensions and energy security. The relationship between all parameters and dimensions with energy security was well-established in a previous research [32]. Correlations between all indicators and their respective parameters and dimensions are presented in detail in Appendix A. After the energy security index is built and designed, its global application is presented in the following section.
3.2. Global Energy Security
Scientific approaches to measure an energy security index are the key for proper analysis of the situation. Quantitative methods with quantified values of the energy security level will allow for real comparison between countries and their performance. Also, such a representation of an energy security index will provide valuable insights for countries on how to maintain their performance and what can to be done to improve the respective energy security level. Furthermore, a global representation of energy security on international maps for the overall energy security and for the 15-individual dimensions will provide relevant policy concept implications for what regions in the world can be clustered for what reason. Figure 1 represents the detailed achievement for all the countries in the world for the overall energy security index. In addition, a colour code for the certainty of the results is embedded in Figure 1.
The overall number of parameters is 50 but for some countries data are unavailable, thus their aggregated ESI suffers from some missing indicators. The number of missing parameters is indicated by colour coded categories so that the uncertainty of the resulting ESI is better visible. Certainty levels are:
- Blue—very good (115 countries): for countries with not more than 5 missing parameters;
- Yellow—good (28 countries): for countries with 6–10 missing parameters;
- Orange—acceptable (22 countries): for countries with 11–15 missing parameters;
- Red—others (64 countries): for countries with more than 15 missing parameters.
The most common reason for missing parameters in the red category is due to either data are for non-sovereign country or the country’s population is less than 100,000 as was detailed in the methods. In total there are 64 countries in the red category of which 44 are either non-sovereign or with low population.
The reorientation of the ESI distribution on the global level is also provided by an overview world map with a colour code. Figure 2 shows all countries in the world and their energy security performance, where yellow represents the best energy security level (highest ESI) and the dark blue represents the worst energy security level (lowest ESI).
First, energy security levels are higher in developed countries than in emerging and developing countries. This shows the importance of developmental status which has a strong influence to achieve higher levels of energy security. Therefore, more focus on progressively driving development, can enhance energy security. Second, neighbouring countries do not necessarily have same levels of energy security. This can be attributed to natural features of countries, e.g., resources or its political system, such as the example pairs Finland and Russia, and the United States and Cuba. Third, countries with wars and natural disasters in general have a lower energy security performance, as found for Somalia and Afghanistan. Fourth, some countries scored a low performance because of the absence of some indicators’ values. If some data points are missing for an indicator, the lowest value is assumed for that country. This impacts the whole parameter and thus the corresponding dimension. Therefore, the aggregated ESI value will be lower. Finally, no single feature of a country can determine its energy security performance, but rather the aggregated mix of many variables. For examples, having the largest area in the world alone (Russia), having the highest population alone (China), or achieving the highest GPD/capita (Qatar) does not create the best energy security. Therefore, countries with low performance in energy security should not focus only on a single parameter to enhance, but rather on a broad set of comprehensive improvements to cover many parameters in order to achieve a higher energy security level.
A global overview of each of the 15 dimensions is presented in the following and brief remarks on specific findings.
3.2.1. Availability
The aggregation of the three parameters of the availability dimension is shown in Figure 3 where the global performance in the availability dimension is presented. Exact values for all countries can be found in the Supplementary Material.
Figure 3 highlights that the United States and Brazil have the highest value for the availability dimension. Reasons for the United States to top this dimension is the abundance of resources together with large demand and easy access. The same applies for Brazil. Many European countries lack access to their own resources and have a small population to increase demands, thus they do not perform well for this dimension. Furthermore, developing countries show better results than some of the developed countries, this can be a good motivation and a driving force to utilise this advantage to progressively improve the overall energy security level. Also, it can be noticed that, area and population can have a correlation with this dimension, as larger countries and more populous ones tend to have a better performance in this dimension.
3.2.2. Diversity
The aggregation of the four parameters of the diversity dimension is shown in Figure 4, where the global performance in this dimension is presented. Exact values for all countries can be found in the Supplementary Material.
Finland, Bulgaria and Sweden rank the highest in the diversity dimension as shown in Figure 4. This contributes to the policy these countries follow to balance their energy system elements. In contrast, resource curse seems to strike on some countries where policies are not in place to meditate the economy. The lowest achievement for this dimension is noticed from small islands that need to be dependent on others or African countries that have abundant resources, but their energy system is dependent on one element, e.g., Chad or Lesotho. The best strategy that can be adopted for such countries is to enforce policies to diversify energy system elements.
3.2.3. Cost
The aggregation of the three parameters of the Cost dimension is shown in Figure 5, where the global performance in this dimension is presented. Exact values for all countries can be found in the Supplementary Material.
As for the cost dimension, Kyrgyzstan shows the best performance as can be seen from Figure 5. Although Kyrgyzstan is a land-locked country with relatively small area in comparison to neighbouring countries, its infrastructure and energy cost structure proves to be the best for this dimension. It does not cost much to secure their energy infrastructure, and the income at risk for energy disruption is less. This might be attributed to the fact that Kyrgyz people depend more on traditional way of life than more modern ways. Similar results can be seen for countries such as Lesotho, Thailand and South Africa. In contrast, the United States which scored high in previous dimensions and China with the largest population in the world seem to struggle with the Cost dimension. For the developed world, Germany performs well relatively because of the wide spread of renewable energy.
3.2.4. Technology and Efficiency
The aggregation of the four parameters of the technology and efficiency dimension is shown in Figure 6, where the global performance in this dimension is presented. Exact values for all countries can be found in the Supplementary Material.
Analysing Figure 6 reveals that Japan is leading the world with implementing advanced technologies and thus reaching a more efficient energy system. This is done particularly by reducing the dependency on energy in the economy. A low performance for this dimension can be seen for countries such as Canada where efficiency needs to be improved particularly by enhancing the fuel economy, and technology advancement can be enhanced by generating more patents.
3.2.5. Location
The aggregation of the eight parameters of the location dimension is shown in Figure 7, where the global performance in this dimension is presented. Exact values for all countries can be found in the Supplementary Materials.
Although the location dimension might seem to be dependent on factors that are difficult to change, many of the parameters can be enhanced to achieve higher levels of this dimension. This is exactly what Malta, Luxembourg and the Netherlands have done. Figure 7 reveals that these countries have the highest level of performance for this dimension. The trade, infrastructure and geography utilisation are the key elements for their success in this dimension. In contrast, many African countries seem to struggle with this dimension. That is attributed to their industrial intensity, level of globalisation and population density. For these countries, more focus should be on enabling more industrial activities and production facilities in order to have more exports and connections to the global market.
3.2.6. Timeframe
The aggregation of the three parameters of the Timeframe dimension is shown in Figure 8, where the global performance in this dimension is presented. Exact values for all countries can be found in the Supplementary Material.
For the timeframe dimension it can be noticed that countries with the highest performance are distributed globally, not concentrated in one region. Figure 8 shows Luxembourg, Costa Rica, Denmark, Cambodia and Ethiopia to have the highest score for this dimension. This makes it clear that the infrastructure for these countries can be fixed very fast and the events of disruption for the energy system do not last long. Although life expectancy is not the highest for any of these countries, their energy systems are not affected for a long time with disruption events and impacts on their energy systems are minimised. Some of the developed countries (e.g., the United States and Canada) in addition to many African countries must work harder so that events of disruption will not last long, if they occur the impacts’ length of these events is minimised. That can be achieved by having more international and good relationships and by building a more robust energy system.
3.2.7. Resilience
Figure 9 shows the global performance in the resilience dimension. Exact values for all countries can be found in the Supplementary Material.
The resilience index is used to cover the whole resilience dimension. It is shown in Figure 9 that western countries in general have more resilience and more adaptive capacity for their energy systems. Leaders are Switzerland, Luxembourg and Sweden. This can be attributed to the good economy rating of these countries, that they can build alternatives for energy system elements very fast and sustain the flow of their operations as normal. Such leverage is used also to build alternative options in case of emergencies. Rich countries that do well economically but with large area or population do not have necessarily high adaptive capacity e.g., Russia and China.
3.2.8. Environment
The aggregation of the five parameters of the environment dimension is shown in Figure 10, where the global performance in this dimension is presented. Exact values for all countries can be found in the Supplementary Material.
Figure 10 shows many facts of the environment dimension. African countries and countries in Latin America do better in the environment dimension than many developed countries in Europe, North America and Oceania. From Africa, Gabon, Nigeria and Congo DR lead the efforts to keep the environment dimension on the highest values. Same is done by Guatemala and Costa Rica. This proves that European countries claiming to care about environment are behind many African countries. This can be attributed to the lifestyle people live in developed countries that cause high ecological footprints. A simpler lifestyle in Africa proves to have a better relationship with the environment. Another aspect of this dimension is for those countries with the worst achievement for the environment dimension, e.g., Uzbekistan, Kuwait and Turkmenistan. They all have a combination of fossil fuel dependency with a high level of autocratical policy reality and a high level of corruption. This can be also found for many other countries with low achievements in this dimension. Corruption prioritises the benefits of the elite over the environment and the population therefore, decisions are often done with no consideration to the environment.
3.2.9. Health
The aggregation of the two parameters of the Health dimension is shown in Figure 11, where the global performance in this dimension is presented. Exact values for all countries can be found in the Supplementary Material.
The results for the health dimension shown in Figure 11 present Bahrain, Saudi Arabia and United Arab Emirates with the highest performance in this dimension. This is attributed to the expenditure on healthcare in these countries together with the number of deaths attributed to cancer. It also can be explained with the healthy habits of people in these countries, where alcohol consumption is minimal and rich governments that spend lavishly on health infrastructures and medical staff. This is the opposite to other countries where the performance in the health dimension is on a low level, such as the United States and Russia. These two countries spend much of their budget on military-related programmes in addition to the habits of alcohol and drug consumption of the population, plus a health system not equally accessible to all people.
3.2.10. Culture
The aggregation of the two parameters of the Culture dimension is shown in Figure 12, where the global performance in this dimension is presented. Exact values for all countries can be found in the Supplementary Material.
The culture dimension puts Qatar and United Arab Emirates on top of all countries in the world as shown in Figure 12. This can be supported by the fact that people’s lives in these two countries are fossil fuel-dependent with a lot of interactions with the energy system. Qatar has the highest energy use per capita in the world. Also, both countries have very high air transport rates relatively to their population. Furthermore, wealthy citizens of these countries with a high percentage of their population in activity age (15–64) contribute a lot to how they affect the energy system and how they use it. In contrast, Congo DR and Zambia and many other African countries are in the lower end of performance in the culture dimension. This is attributed to poverty and less access to air transports.
3.2.11. Literacy
The aggregation of the three parameters of the literacy dimension is shown in Figure 13, where the global performance in this dimension is presented. Exact values for all countries can be found in the Supplementary Material.
The United States, Zimbabwe and Germany are the top countries in the Literacy dimension, as shown in Figure 13. It can be noticed from the Supplementary Material that the United States and Germany achieved this high score by the good performance in the information availability. On the other hand, Zimbabwe performs well because of expenditure on education. This makes a strong case for both developing and developed countries. For developing countries in Africa and Latin America, more expenditures on education are needed to improve their energy security. Developed countries in Europe, North America and Oceania, where the education infrastructure is on an advanced level, need to invest more in scientific publications in order to spread knowledge further, and even more to their own people.
3.2.12. Employment
The aggregation of the two parameters of the employment dimension is shown in Figure 14, where the global performance in this dimension is presented. Exact values for all countries can be found in the Supplementary Material.
As the employment dimension is concerned about the effect of the energy system on employment and the impact of employment on the energy system, countries with a spacious room for developing their energy infrastructure have the highest scores. Figure 14 highlights Bhutan, Nepal and India have the highest score in the employment dimension. There is a huge opportunity for more employment with the development of renewable energy businesses in these countries. The employment dimension in Europe and the Americas does not seem promising because there seems to be a saturation in energy infrastructure development and a lower number of employment is needed for energy systems development.
3.2.13. Policy
The aggregation of the three parameters of the policy dimension is shown in Figure 15, where the global performance in this dimension is presented. Exact values for all countries can be found in the Supplementary Material.
The interplay of geopolitics and respective effects on the policy dimension as shown in Figure 15 points to many aspects. Denmark, Iceland and Finland prove to be on the top of the list of high performance within the policy dimension. These countries have a small population, which seem relatively easy to govern, in addition to a clear political framework to handle matters in hand. In particular, corruption is on low levels which allows for wealth to be more equally distributed in these countries. Countries with a developed political framework to ensure responsibility and power distribution with lower levels of corruptions achieve high values in the policy dimension. Countries which do not have a good political framework in place because of wars or autocratical regimes score low in this dimension, e.g., Korea DR, Libya and Turkmenistan.
3.2.14. Military
The aggregation of the four parameters of the military dimension is shown in Figure 16 where the global performance in this dimension is presented. Exact values for all countries can be found in the Supplementary Materials.
Many countries in the world seem to be in a high performance in the military dimension. Two countries in Latin America and two countries in Africa top this dimension. Mexico and Argentina in addition to Ethiopia and Ghana have the highest achievement in this dimension. In contrast, countries being involved in wars together with high dependency on energy resources show a poor performance in this dimension, such as Turkmenistan, Syria and Yemen. Figure 16 reveals rather good values for the United States and Russia, which would be further improved by reducing their energy consumption for military.
3.2.15. Cyber Security
The aggregation of the three parameters of the Cyber security dimension is shown in Figure 17, where the global performance in this dimension is presented. Exact values for all countries can be found in the Supplementary Material.
The last dimension to be analysed is the cybersecurity dimension as presented in Figure 17. Egypt, India and the United States stand out with high performance in this dimension. This is attributed to software use and IT skills. Many African and Asian countries lack connectivity and software use. These countries can invest more in IT education and networks’ infrastructure for improving this dimension.
3.3. Energy Security Analysis for Exemplary Countries
In this section, couple of countries are studied in depth for their energy security performance. These countries are chosen to cover a wider spectrum of energy security levels. The highest two countries in the world, Germany and the United States, in addition to two countries, the upper and lower part of the middle of energy security ranking, together with two countries with the lowest energy security level in the world are presented. China and Jordan are chosen from the middle of the list with a rank of 29 and 118, respectively. The Central African Republic and Turkmenistan represents the lowest end of energy security performance.
3.3.1. Germany
Germany has achieved the highest energy security level in the world according to the aggregated ESI. This is attributed to several factors. Figure 18 shows the performance of Germany in each of the 15 dimensions of energy security.
Figure 18 highlights that Germany achieved the highest energy security level in the world by coordinating many of the dimensions. Germany excels is the resilience dimension in which Germany achieved the best performance in comparison to all other dimensions. This high performance in the resilience dimension means that Germany has high adaptive capacity to cope with changes and shocks in the energy system in order to ensure the continuity of a functioning society and system. This high performance in the resilience dimension comes together with the second highest performing dimension, which is the policy. Germany has developed an advanced political system and regulations with regard to the energy system to ensure energy security. Such an achievement within the policy dimension helped to have the resilience performance on the high end. Furthermore, Germany suffers in the availability dimension. This dimension is the worst of all other dimensions for Germany. The impact of the scarce availability in Germany was mitigated by good policies and high adaptive capacity. The performance from Germany shows clearly that lacking in natural resources should not hinder energy security, if political will exists to advance resilience and regulations. Furthermore, Germany has the location and employment dimensions on the worst end. The location dimension is affected hugely by the area of country, its geography and population density. For the employment dimension, Germany is an advanced industrial country where employment is more connected to industries rather than to the energy system, which explains the low achievement in this dimension.
3.3.2. The United States of America
The United States has achieved the second highest energy security level in the world according to the aggregated ESI. This is attributed to several factors. Figure 19 shows the performance of the United States in each of the 15 dimensions of energy security.
The second highest energy security performance in the world is the United States. However, the route how the United States achieved high performance is different than the previously discussed path of Germany. This proves the point that in order to achieve high energy security levels considering the 15 dimensions approach there are several routes to achieve such high energy security levels. More dimensions are of relevance for energy security than limiting energy security to only availability of resources.
The United States has a more of balanced distribution of the dimensions on a high level. Though, resilience stands again to be the highest dimension followed by policy and cybersecurity. Noticeably, the United States has a higher achievement in the availability dimension than Germany, but still is in the second place of the overall energy security. Implementing similar policies and regulations as Germany for the energy system together with the high level of availability could ensure the United States to climb to rank one in the energy security performance. On the other end, employment and timeframe are the worst of all dimensions for the United States. The reasons that were discussed for Germany still appear to be valid for the United States. Being the most industrialised country, employment in the United States seems to be more connected to industries and companies rather than to the energy system. For the timeframe, the United States needs more than 100 years to achieve a 100% renewable electricity output and the country suffers from old power plants. These two factors made the United States to perform low in this dimension.
3.3.3. China
China has achieved the 29th rank of in energy security according to the aggregated ESI. This is attributed to several factors. Figure 20 shows the performance of China in each of the 15 dimensions of energy security.
Moving to the bottom of the high-ranking countries in energy security, turns the attention to China with the rank of 29th in the world. There are many countries in the upper middle of energy security performance, but China was chosen because of being the country with the highest population in the world.
Figure 20 highlights that the best dimension for China is the Health dimension. China seems to spend a lot on healthcare with more healthy people in the workforce. The second remark for China is the high performance in the technology and efficiency dimension together with the cybersecurity dimension. This proves the need for advanced technologies to be implemented if countries want to achieve high energy security levels. Such advancement in technology and efficiency proves necessary because on the other hand China has low achievements in the location and availability dimensions. These natural factors that can be difficult to change are mitigated by advancing other dimensions.
3.3.4. Jordan
Jordan ranks 118th in energy security level according to the aggregated ESI, which places Jordan at the lower end of the middle range. This is attributed to many factors. Figure 21 shows the performance of Jordan in each of the 15 dimensions of energy security.
Moving down the ranks to the lower middle, Jordan stands on 118th of the world energy security levels. Jordan has a very low performance in the availability and literacy dimensions. Jordan has suffered always from scarce energy resources, which has affected the development of the country. Furthermore, literacy needs more attention by spreading knowledge on country level about energy security and energy systems. This can be attributed to the fact that many settlements in Jordan still live in villages with more interests of daily life needs of food and shelter than being involved on country level energy awareness aspects. On the other hand, Jordan pays a lot of attention for the Health dimension with high expenditures levels on healthcare. In addition, the military dimension is on high levels because of the level of immunity Jordan has against the resources curse and being destabilised because of resources availability. This looks like a trade-off for Jordan, less available energy resources make the country to have a higher level of military dimension.
3.3.5. Central African Republic
On the lowest end of energy security levels in the world stands the Central African Republic. This is attributed to many factors. Figure 22 shows the performance of Central African Republic in each of the 15 dimensions of energy security.
At the lowest end of energy security levels, some countries show different achievements and routes why they ended up in this category. The first example of this category is Central African Republic, where it has performed extremely high in the employment dimension. This means this country has a lot of opportunity to install new energy infrastructure and provide employment in this sector. Furthermore, unemployment is on low levels as most of the population is involved in traditional work in agriculture. On the other hand, many dimensions are on the worst end, for example the diversity dimension. This shows the long way ahead for Central African Republic to implement better practices in order to achieve a higher energy security.
3.3.6. Turkmenistan
The worst energy security level in the world has been found for Turkmenistan. This is attributed to many factors. Figure 23 shows the performance of Turkmenistan in each of the 15 dimensions of energy security.
Although Turkmenistan has very high levels of achievement in the cost dimension, together with the health dimension, it stands in the lowest end of energy security levels in the world. The cost structure for energy services is among the best in the world, owing to own natural gas resources. However, a totalitarian regime with high autocracy levels can make the cost dimension on high performance, but on the expense of other dimensions. That is seen clearly from the policy dimension, where Turkmenistan has one of the worst regimes in the world. This affects most of the other dimensions of energy security.
3.4. Limits of This Research
Although this research is novel with very promising results, some limitations exist. The first limitation is the use of equal weighting of all parameters and dimensions. Reality could be different. However, because of lack of justification of different weights in the present state, this research could be further enhanced by investigating in improved weighting values for all parameters and dimensions. This can be done by uncertainty and sensitivity analyses as it was done by Augutis et al. [105]. However, because of the large number of indicators (76 indicators), sensitivity analyses would substantially enlarge the length of this research and thus it was not included but rather planned for future research. It was found by Augutis et al. [105] that the average of simulated weights is similar to the use of equal weights, therefore, equal weights have a stronger support.
The second limitation is the static nature of such research. Energy security is analysed for a certain time period. That is attributed mainly to the indicators that were used. Although many of them have past records, but future projection of the indicators needs further research. Once, each indicator can be projected, energy security future scenarios can be applied using this research method. This is of interest since it is expected that the energy system changes structurally from a fossil basis to a solar basis [106]. Since the change from one year to another is negligible, more noticeable changes can be observed on the scale of at least 5–10 years. Therefore, a long-term future extrapolation of data for all indicators is needed as a future research. Once such indicators values are available and justified, ESI projections can be applied for future scenarios.
The third limitation was faced when searching for suitable indicators to represent individual parameters. There are some parameters which were represented by a proxy indictor or a combination of indicators because of the complex nature of these parameters. This shows the need for international efforts to investigate and build indexes in relation to these parameters.
The fourth limitation was the data availability of some indicators for some countries. Although, best efforts have been spent to choose indicators for which data are available for most countries, some indicators have a significant unavailability of data for several countries, though most countries have available data. Future research is needed to investigate the reasons of data unavailability from the sources and build a suitable replacement for these absent data.
4. Conclusions and Recommendations
After going through this intensive analysis of energy security on a global level, several key conclusions can be drawn. First, such detailed evaluation of the global energy security levels with all countries’ performance included proves to be a needed research to enable a deeper understanding of the current situation in this regard. This research contributes to close this gap by a novel approach with profound and detailed 15 dimensions for energy security analysis. Second, it is noticed that energy security has many relationships with different aspects. These relationships affect and are affected by energy security. The detailed interaction between these aspects are presented in this research by comprehensive methods and numerical indicators for each of the parameters within each dimension. Third, it is concluded that countries’ performances can vary in ways achieving high energy security, since there is not a single recipe but rather there are different paths that can be followed.
Countries vary in their energy security performance from very high achievements, like Germany and the United States, to low performance such as the Central African Republic and Turkmenistan. This is presented on the overall energy security level. Nevertheless, countries also have different achievements in each of the dimensions as has been presented in the Results section. Development pathways and needs for countries are different, so that there is no one solution for all countries, and thus there are multiple ways to transition and enhance the overall global energy system. That means countries need to implement a bunch of smaller steps and learn from other countries what is suitable to their context and test such changes. As was proven in [107], only a directed evolution of the current system is required to guarantee affordability, reliability and sustainability. Each country should focus on what dimension they are lagging and learn lessons from countries that have achieved high results in the respective dimension and implement the best options according to their own circumstances.
The six examples for countries performances in the world showed that lagging in one dimension can be compensated by a higher performance in another dimension and that, such a situation should not hinder development. This point proves the need of a multi dimension evolution of energy security in order to compile a comprehensive analysis. Recommendations are for policymakers and researchers to study the presented results in detail and formulate strategies to improve energy security both on the country and global level.
Supplementary Materials
The following are available online at https://0-www-mdpi-com.brum.beds.ac.uk/1996-1073/13/10/2502/s1, Excel: energy security. The spreadsheet file in the supplementary material consists of all collected data for all countries and for all indicators. The primary data table shows all these data clustered for 50 parameters and 15 dimensions. The aggregation methods that were described in details in the article (methods, appendix) are implemented in the spreadsheet file and in calculating the ESI for all countries. To adhere to our approach of total transparency, references for data collection for each indicator are also added in the supplementary spreadsheet file. Tables for detailed calculations are provided when needed. Furthermore, lists of missing indicators for each country together with their count is presented.
Author Contributions
A.A. did conceptualisation, methods, validation, formal analysis, investigation, data curation and collection, writing—original draft preparation, writing—review and editing, visualisation; C.B. contributed to conceptualisation, methods, formal analysis and was responsible for supervision, review and editing, project administration and funding acquisition. All authors have read and agreed to the published version of the manuscript.
Funding
This research received no external funding.
Acknowledgments
The authors gratefully acknowledge the public financing of Tekes, the Finnish Funding Agency for Innovation, for the ‘Neo-Carbon Energy’ project under the number 40101/14. Furthermore, the authors would like to thank Ashish Gulagi for valuable discussion and proofreading.
Conflicts of Interest
The authors declare no conflict of interest. The funders had no role in the design of the study; in the collection, analyses, or interpretation of data; in the writing of the manuscript, or in the decision to publish the results.
Appendix A
This Appendix A provides a detailed description of all methods and equations that are used to build the ESI. It includes all the equations and the needed relationships between indicators and parameters in their corresponding dimensions with energy security.
Appendix A.1. Availability
The availability dimension (A) consists of three parameters (A1, A2, A3) and each one is assigned as an indicator or a set of indicators to reflect that parameter in the aggregation. In addition, each parameter is given a weight (Wj). Equation (A1) represents the parameters and their weights. Equal weights for all parameters lead to Equation (A2) with each parameter having a weight of one third.
Appendix A.1.1. Existence of Resources
Energy resources are measured by the total available resource of fossil fuel and potential renewables. Fossil fuel resources are obtained from International Energy Agency (IEA) from their global energy balances [41]. Coal, crude oil and natural gas are summed up to form total fossil fuels. The existence of fossil fuel resources is considered as the current total production of total energy primary sources in each country. The renewable energy resources are obtained from the country-specific energy potential of solar photovoltaics (PV), concentrating solar thermal power (CSP), wind energy, hydropower, geothermal energy and bioenergy according to the LUT model data [108]. The indicator of total available energy resources is normalised by a max-min approach presented in Equation (4) for all countries in the world. The maximum was (360,724 TWh) for Australia and (289 TWh) for Lebanon. Countries that have access to more resources obtain also a higher level of energy security, and vice versa. The resultant Equation for this parameter is presented in Equation (A3)
where I1.A1 is the normalised total available energy resources.
Appendix A.1.2. Existence of Consumers
The existence of consumers is measured by a proxy indicator of the population. Data from United Nations for 2015 population in each country is taken [43]. The relationship to energy security for the consumers point of view is directly proportional. The more consumers the energy system has, the more secure it can become. The population is normalised by dividing on the world’s population (7.38 billion in 2015) [43] for each country, that means the best energy system to study is the one that covers the whole world, and the least secure energy system is the one with no population. The resultant Equation for this parameter is presented in Equation (A4)
where I1.A2 is the normalised population with normalisation according to Equation (5).
Appendix A.1.3. Existence of Means of Transport
The existence of means of transportation is measured by a proxy of airports number in each country. Data for the number of airports were taken from CIA fact book for 2013 or latest [44]. More airports mean more transportation is taking place, and thus a more secure system. Therefore, the relation is directly proportional. For the normalisation of these absolute numbers, the number of airports in each country is divided by the number of airports in the country with the highest number of airports (the United States with 13513 airports). The absence of airports (zero) is assumed to be the least energy security level. The parameter for the existence of means of transport (A3) is presented in Equation (A5).
where I1.A3 is the normalised number of airports with normalisation according to Equation (5).
Appendix A.2. Diversity
The diversity dimension (D) consists of four parameters (D1, D2, D3, D4) and each one is assigned one indicator or more. Equation (A6) represents the parameters and their weights (Wj). Since the weight is distributed equally, each parameter gets a weight of 0.25, as applied in Equation (A7):
In the diversity calculations, the parameters are calculated by using Simpson’s diversity index SIDI [109,110]. The formula for SIDI is represented in Equation (A8), and therefore each parameter equals SIDI or the average of SIDI indicators, as applied in Equation (A9):
where Zi is the share of each element in the studied system and j refers to each parameter. For example, if the systems consist of four elements, then the share of each element is obtained by dividing its value over the total sum of all elements. Equation (A10) shows how the shares are calculated:
where ei is the value of each element in the set.
Appendix A.2.1. Diversity of Sources
Diversity of sources regards the relative balance of sources. For instance, if the energy system has only one source, it is less secure than if there are different sources. Two main types of resources were analysed (domestic and imported). Data for 2014 that represent local and imported resources was taken from International Energy Agency IEA [41]. (Zi) for the two elements (local e1 and imported e2) was calculated as in Equation (A10). After that, the diversity of resources was calculated by Equations (A8) and (A9).
Appendix A.2.2. Diversity of Carriers
Energy carriers can be in the form of matter-based chemical materials (fossil fuels, biomass/waste) or in the form of non-matter-based electro-magnetic fields (electricity). Data are derived for the year 2014 [41]. Shares of elements (ei) (fossil fuels, renewable fuels, heat and electricity) were calculated according to Equation (A10). Fossil fuels include coal, crude oil, oil products and natural gas. Renewable energy includes hydropower, geothermal energy, wind and solar fuels, biofuels and waste. After that, the diversity of carriers was calculated by Equations (A8) and (A9).
Appendix A.2.3. Diversity of Means
Diversity of means consists of two parts: diversity of technology and diversity of transportation. With more technologies forming the energy system, energy security is enhanced. The same concept is applied for transportation options: the more diverse a system is, the more secure it becomes. The total installed capacities of different power generation technologies in 2014 (MW) were taken from Farfan and Breyer [45] for the following elements, (ei) (gas, oil, coal, nuclear, solar PV, CSP, wind, biogas, biomass, geothermal, hydro run-of-river, hydro reservoir, ocean) and were used to calculate (Zi) as in Equation (A10). SIDI for power generation technologies was calculated using Equation (A8). The second part of this parameter is the diversity of transportation. Shares (Zi) of elements (ei) (pipelines, railways, roadways and waterways), all measured in km, were calculated by Equation (A10). The data for each element were taken from Photius Coutsoukis PC [46]. Further, SIDI for transportation was calculated from Equation (A8). The diversity of means parameter consists of two indicators, and the arithmetic average of the two is taken into consideration according to Equation (A9) and applied in Equation (A11).
Appendix A.2.4. Diversity of Consumers
The last parameter is the consumers’ profile. Being able to provide energy services to more diverse users is considered more secure. In this research, analysis of the diversity of consumers is carried out by studying the shares (Zi) of consumer profiles. Elements (ei) of industry, transport, residential, commercial and public services, agriculture and forestry, fishing, non-specified, non-energy use were calculated using Equation (A10). Data of energy balances were taken for 2014 [41]. The diversity of consumers was calculated by Equations (A8) and (A9).
Appendix A.3. Cost
The cost dimension (Co) consists of three parameters (Co1, Co2, Co3) and each one is assigned to one indicator or a set of indicators to reflect that parameter in the aggregation. Each parameter is given a weight (Wj). Equation (A12) represents the parameters and their weights. Applying equal weights for all parameters leads to Equation (A13) with a weight of one third for each parameter:
Appendix A.3.1. Energy Price
This parameter is measured by the average of two indicators, after their normalisation. The first indicator is the diesel price (in units of USD/litre) as of mid-November 2014 in each country obtained from [47]. The diesel prices are normalised by dividing by the maximum value in the world (Eritrea with 3.00 USD/litre) and then subtracting from unity to have the lowest price as the most secure result. The second indicator is the weighted average price of electricity in three market segments residential, commercial and industrial (in units of €/kWh) derived from the LUT model [108]. The normalisation is done by dividing by the maximum in the world (Denmark with 0.192 €/kWh) and subtracting from unity, indicating cheap energy prices are best for energy security. Finally, the average of both normalised indicators is obtained in Equation (A14):
where I1.Co1 is the normalised diesel price and I2.Co1 is the normalised electricity price according to Equation (5).
Appendix A.3.2. Cost of Disruption
Income at risk due to power outage as income loss (in units of €/capita) is chosen as the indicator to measure this parameter. Data were calculated by dividing the GDP per capita from [48] by the 365 days in a year, resulting in income per day. That is multiplied by the power shortage in days [49] to be detailed later in the second parameter of the timeframe dimension (section 2.6). The result is lost income due to power shortage (in units of €/capita). The data are normalised by dividing the maximum in the world (Botswana with 930 €/capita) after removing the outliers by the quartile method [111] and then subtracting from unity, indicating that zero loss is the best for energy security and losing more is worse for energy security. This is summarised in Equation (A15):
where I1.Co2 is the normalised income at risk with normalisation according to Equation (5).
Appendix A.3.3. Cost of Securing the System
A key option to increase the security of an energy system is to lower the levelized cost of electricity (LCOE) on a system level. Low system LCOE indicates a high level of energy security. Total system LCOE of 2015 in each country was obtained from the LUT model [108]. The data were normalised by max-min method (Lebanon with 174.20 €/MWh and both Congo & Congo DR with 38.20 €/MWh) as defined in Equation (4). Lower LCOE means higher energy security level thus subtracting from unity. Equation (A16) shows the mathematical notion for this parameter:
where I1.Co3 is the normalised total system LCOE.
Appendix A.4. Technology and Efficiency
The technology and efficiency dimension (TE) consists of four parameters (TE1, TE2, TE3, TE4) and each one is assigned one indicator or a set of indicators to reflect that parameter in the aggregation. Each parameter is given a weight (Wj). Equation (A17) represents the aggregation of the parameters and their weights. Each parameter is weighted equally with 0.25 leading to Equation (A18):
Appendix A.4.1. New Technology Advancement
The technology advancement can be measured in many ways. In this parameter two proxy indicators are used to construct how much the technology gets advanced in a country. The first proxy to use is the number of patents in force in each country. The data are taken from World Intellectual Property Organisation for 2016 [50]. The number of patents in each country is normalised by dividing by the country that has the maximum number of patents (the United States with 2,763,055 patents). The more patents a country has accumulated indicates more technology advancement and thus the respective level of energy security. A low number of patents in a country means low energy technology advancement and therefore a low energy security level. The second indicator to be used as a proxy for the technology advancement is the number of scientific and technical journal articles from year 2016 obtained from the World Bank [51]. The more the number of scientific articles originated from a country is interpreted as an indicator for a higher energy security level, and vice versa. The normalisation for this indicator is carried out by dividing the highest value found for a country in the world (China with 426,165 articles), assuming again that a very low amount of scientific articles published indicates a low energy security level. The average of the two indicators is used to determine (TE1) as presented in Equation (A19):
where I1.TE1 is the normalised number of patents and I2.TE1 is the normalised number of articles with normalisation according to Equation (5).
Appendix A.4.2. Energy System Efficiency
Supply efficiency for the power sector is the chosen indicator to measure the energy system efficiency. Data were collected from the LUT model [42]. Normalisation is not needed because it is already in percentage. The mathematical notation for this parameter is represented in Equation (A20):
where I1.TE2 is the supply efficiency.
Appendix A.4.3. Energy Intensity
Energy intensity is calculated according to the energy intensity level of primary energy in each country (in units of MJ/USD2011 PPP GDP), with data for 2015 derived from the World Bank [52]. The values are normalised by dividing the highest value in the world (Liberia 26.0 MJ/USD2011 PPP GDP), where the highest value of energy intensity represents the lowest level of energy security. The obtained percentage was subtracted from unity. This is expressed by Equation (A21):
where I1.TE3 is the normalised energy intensity with normalisation according to Equation (5).
Appendix A.4.4. Energy Conservation
Energy conservation is an attitude that shows how efficient energy is consumed by people. As a proxy indicator the efficiency of light duty vehicles is considered (in units of litres of gasoline equivalent per 100 km of Worldwide Harmonised Light Vehicle Test Cycle (WLTC)) data for the year 2015. Data are collected from IEA and its Global Fuel Economy Initiative [53]. Average values from the report for EU-28, OCED and global average were used for countries that were not listed specifically by name. Normalisation is done by the max-min approach (Canada with 9.2 and France with 5.2) according to Equation (4) and subtracting from unity as summarised in Equation (A22), referring to more litres needed for 100 km means lower standards for energy conservation and respective more consumption thus a lower level of energy security.
where I1.TE4 is the normalised energy conservation with normalisation according to Equation (4).
Appendix A.5. Location
The location dimension (Lo) consists of eight parameters (Lo1, Lo2, Lo3, Lo4, Lo5, Lo6, Lo7, Lo8) and each one is assigned to one indicator or a set of indicators to reflect that parameter in the aggregation. In addition, each parameter is given a weight (Wj). Equation (A23) represents the parameters and their weights. Assuming equal weights for all parameters leads to Equation (A24), applying a weight of 0.125 each:
Appendix A.5.1. Energy Systems Boundaries
The energy boundaries parameter of a system is measured by the area in each country. The area in square kilometres is obtained from the World Bank [54]. The assumption for the system boundaries is that, the bigger the area, the higher the energy security level, and vice versa. The normalisation of the area indicator is executed by dividing the area of each country by the area of the whole world (129,733,173 km2), and expressed by Equation (A25):
where I1.Lo1 is the normalised area with normalisation according to Equation (5).
Appendix A.5.2. Location of Energy Source
To account for the parameter location of energy sources and its importance to energy security, the distance between production and consumption (km) is chosen as an indicator. Crude oil trade movement in 2016 between major players and regions in the world is obtained from BP [55]. The distances between countries are calculated individually for each region or country by using centre estimation presented in [56]. The crude oil movement is multiplied by the distance it is transported. If the country is a net exporter, then the values are for how far its crude oil needs to be transported to consumers as weighted average. If the country is a net importer, then the distance from all sources of crude oil is considered as weighted average. These values are represented by larger regions to an individual country, if the country is not mentioned directly in the data source, otherwise the values are assigned directly to countries. Normalisation is according to the max-min approach (Angola with 11,515 km and Canada with 2332 km) according to Equation (4), by linking long distances to low levels of energy security, thus subtracting the normalised value from unity, as presented in Equation (A26):
where I1.Lo2 is the normalised distance with normalisation according to Equation (4).
Appendix A.5.3. Density Factor (Centralised/Decentralised)
The density factor is expressed by the energy use per area. Primary energy use (in units of kWhth per capita) is derived from World Bank data for the year or later [57]. The value of every country is multiplied by its population (using the same value as for parameter A3) and divided by the area of the respective country (using the same value as for parameter Lo1), indicating the energy density (in units of MWhth of primary energy demand per square kilometre). The relation of this indicator to energy security is inversely proportional, i.e., the higher the energy density the lower energy security. After normalising the values by dividing the highest value in the world (Singapore 458,577 MWh/km2), they are subtracted from unity, as represented in Equation (A27):
where I1.Lo3 is the normalised energy density with normalisation according to Equation (5).
Appendix A.5.4. Land Use
This parameter is used as an indicator for terrestrial- and marine-protected areas (in units of percentage of total territorial area). Data are obtained from the World Bank [58] for the year 2017. Data are normalised by dividing the highest value in the world (Slovenia with 55.1%). More protected areas in a country as a percentage of its land is assumed to indicate a better support for energy security, while a very low share of protected land is interpreted the other way around. The parameter is represented by Equation (A28):
where I1.Lo4 is the normalised protected areas with normalisation according to Equation (5).
Appendix A.5.5. Globalisation
Globalisation can be measured by proxy indicators, such as international trade in a country as a percentage of GDP. Data were taken from the World Bank [59] for each country for the year 2015. The data were normalised by dividing the maximum value for a country in the world (Luxembourg 438%). More trade means more secure systems, whereas very low levels of trade means a high level of isolation and lowest levels of energy security. The second indicator used is the KOF globalisation index, obtained from KOF (Konjunkturforschungsstelle) Swiss Economic Institute for year 2013 data [60]. There is no need for further normalisation as these values are in a percentage form with relative terms to each other. High values indicate high levels of energy security. The average of the two indicators is used to determine Lo5, as presented in Equation (A29):
where I1.Lo5 is the normalised trade and I2.Lo5 is the KOF index with normalisation according to Equation (5).
Appendix A.5.6. Population Settlement and Distribution
This parameter is measured by the population density. It is calculated by dividing the population in a country (using the same value as for parameter A2) by the area (using the same value as for parameter Lo1). Normalisation is carried out by dividing the population density in each country by the highest population density in the world (Bahrain 1779 persons/km2), after excluding Singapore. Higher population density means higher level of energy security. This parameter is represented by Equation (A30):
where I1.Lo6 is the normalised population density with normalisation according to Equation (5).
Appendix A.5.7. Geography
The geography parameter consists of a complex relationship to energy security. The average of three indicators is chosen to reflect this complexity in the energy security index. The first indicator is the number of countries with shared borders obtained from [44]. More neighbours mean less security and stability and higher risks. Normalisation is done by dividing over the maximum in the world (China with 14 countries), and then subtracting from unity. The second indicator is the seaports infrastructure, derived from [44] for the year 2015. Evaluation for this indicator is based on the seaports sheet as provided in the Supplementary Material. Each type of infrastructure is given a default point, then the number of these infrastructure in each country is multiplied with the points of its own infrastructure. The types of infrastructure and their points are respectively: Container, Cargo, LNG, Oil, Major seaports, River/lake ports and Cruise; 20, 20, 10, 10, 10, 5 and 5. Normalisation is done by dividing the maximum value in the world (Japan with 500 points), whereas more points for seaports infrastructure means a higher energy security level. The third indicator is the total renewable surface water (in units of m3/year) for the year 2014 in each country, obtained from FAO [61]. Data are normalised in two steps: First, dividing by the area to get values in units of m3/(year·km2); second, dividing by the second highest in the world (Cambodia 2,604,397 m3/(year·km2), as the highest is considered an outlier and therefore is given the full score. More water surface area is better for energy security. This parameter is represented by Equation (A31):
where I1.Lo7 is the normalised number of countries with shared borders, I2.Lo7 is the normalised seaport infrastructure and I3.Lo7 is the normalised total renewable surface water, with normalisation according to Equation (5).
Appendix A.5.8. Industrial Intensity
Industrial intensity is measured by a calculated indicator. Industrial added value (in units of USD) is used as obtained from the World Bank for the year 2015 or latest available for each country [62]. The industrial added values for each country are divided by the area of the respective country (using the same value as for parameter Lo1). The results represent industrial intensity (in units of USD per km2). Higher industrial intensity means higher financial utilisation of the area and results in a higher energy security level. Normalisation is carried out by dividing each country’s values over the highest value in the world (South Korea 4,811,143), while considering Singapore, Bahrain and Qatar as outliners. This parameter is represented by Equation (A32):
where I1.Lo8 is the normalised industrial intensity with normalisation according to Equation (5).
Appendix A.6. Timeframe
The timeframe dimension (T) consists of three parameters (T1, T2, T3) and each one is assigned to one indicator or a set of indicators. Each parameter is given a weight (Wj). Equation (A33) represents the parameters and their weights with equal weights of one third, as summarised in Equation (A34):
Appendix A.6.1. Timeline
The timeline parameter is measured by a proxy indicator. The indicator is the life expectancy at birth from the World Bank for the year 2016 [63]. Normalisation is done by the max-min (Japan with 84.0 years and Sierra Leone with 51.8 years) method presented in Equation (4), with high life expectancy meaning higher level of energy security because of a higher opportunity of transferring experience between generations. The parameter is represented by Equation (A35):
where I1.T1 is the normalised life expectancy with normalisation according to Equation (4).
Appendix A.6.2. Length of the Event
The length of an event is measured by the average of two proxy indicators. The first indicator reflects electrical outages (in units of days), expressed as average number of days per year that settlements experience power outages or surges from the public grid. Data are obtained from [49]. Normalisation is done in two steps: First, dividing by the population in the respective country, leading to units of days per capita; second, dividing by the maximum value in the world (Namibia with 7.43 × 10⁻⁶ days per person) after removing outliers with the quartile method [111] and then subtracting from unity. Less outage days per capita means a more secure energy system. The second indicator is the average weighted age of power plants for all renewable and non-renewable technologies derived from [45]. Normalisation is done by the max-min (Timor-Leste with 45.35 years and Chad 2.94 years) approach presented in Equation (4). Older power plants are less secure than newer ones, therefore, the normalised value is subtracted from unity. The average of the two indicators is obtained in Equation (A36):
where I1.T2 is the normalised power outage and I2.T2 is the normalised power plants’ age, both with normalisation according to Equation (4).
Appendix A.6.3. Length of the Effect (Struggle or Impact)
The length of any effect on the energy system can be measured in time units. Therefore, the chosen indicator is the number of years that are needed to achieve 100% renewable electricity output. This indicator is calculated from two sets of data, the renewable electricity output (in percentage of total electricity output) for the year 2010 [64] and the renewable electricity output (in percentage of total electricity output) in 2015 [65]. The change rate of renewable electricity output in this 5-years period is calculated by subtracting these two sets of data. The as such obtained rate is used to calculate how long it will take the system to become 100% renewable. Some countries got minus values because they are moving in the wrong direction, i.e., investing more in non-renewable than in renewable power plant capacities. Normalisation is done in several steps: First, any country with a negative value is set to zero, as it implies a major burden for energy security that the country is not moving towards a sustainable and thus renewable electricity supply. Second, the country that needs the least number of years to reach a 100% renewable electricity supply applying this static measure is defined as the most secure and thus rewarded with the highest value. Third, the maximum number of years a country requires for the full transition is used as the worst situation for energy security. Finally, the values are normalised based on the longest found static transition period (50). This parameter is represented by Equation (A37):
where I1.T3 is the normalised number of years to reach 100% renewables, with normalisation according to Equation (5).
Appendix A.7. Resilience
The resilience dimension (R) consists of only one parameter (R1) and it is assigned to one indicator. In this case the weight (Wj) for the parameter is unity. Equations (A38) and (A39) represent this parameter description:
Adaptive Capacity
Adaptive capacity is measured by an existing index by FM Global called resilience index [66] and applied for the year 2015. Adaptive capacity represents the ability of the energy system in a country or an area to absorb any shocks in the energy system, and still adapt to function as normal or closely to normal. When a system adapts to the changes in e.g., price, supply chain or markets, then it means such a system has adaptive capacity which makes the system more secure. The resilience index is designed in relative form as percentage. There is no need for normalisation for this indicator. The resilience dimension has one parameter, the adaptive capacity, which also has only one indicator, the resilience index. The higher the resilience index the better for the energy security. This parameter is represented by Equation (A40):
where I1.R1 is the resilience index.
Appendix A.8. Environment
The environment dimension (E) consists of five parameters (E1, E2, E3, E4, E5) and each one is assigned to one indicator to reflect that the parameter in aggregation. Each parameter is given a weight (Wj). Equation (A41) represents the parameters and their equal weights, 0.2, which leads to Equation (A42) for the parameters:
Appendix A.8.1. Energy Resources Rate of Exploitation, and Location
The rate of exploitation is measured by the ecological footprint, as discussed by Azzuni and Breyer [32]. The indication of how many planet earths are needed to cover human activities relying on the energy system is a good way of representing this parameter. Data on the ecological footprint are taken from Global Footprint Network [67] for every country for the year 2012. Because many countries use resources more than their natural capacity of regeneration, the normalisation of this indicator was carried out by dividing the national values of each country by the second highest value in the world, Qatar (6.24). The highest value was obtained by Luxemburg (9.1), but it is considered as an unrepresentative outlier. It is obvious that the increase in this indicator means a less secure system. The data are subtracted from unity to show the inverse proportionality, as expressed by Equation (A43):
where I1.E1 is the normalised ecological footprint with normalisation according to Equation (5).
Appendix A.8.2. Extraction Methods of Energy Supply
The extraction method can be represented as CO2 intensity of the national energy consumption, which is measured by how much CO2 (in units of kg) is emitted for energy use (in units of MWh of primary energy). Cleaner fuels and extraction methods result in less CO2 emissions and thus a more secure energy system. The data for CO2 intensity in 2014 are derived from the World Bank [68]. The original data were measured in non-SI units (kg per kg of oil equivalent energy use) and have been converted to proper units (kg per MWh). The CO2 intensity values for each country were normalised by dividing over the maximum in the world (Mongolia) with a CO2 intensity of 333 kg CO2/MWhth. The parameter is represented by Equation (A44):
where I1.E2 is the normalised CO2 intensity with normalisation according to Equation (5).
Appendix A.8.3. Outcome of Energy Usage
When discussing the environment dimension in the energy system, it is supportive to study the outcome of energy use. Greenhouse gas (GHG) emissions are considered as an indicator of the outcome of the energy system. Data for GHG emissions are retrieved from the World Resources Institute [69] for the year 2012. The data are provided in absolute values of MtCO2eq, however, to make the parameter more sensible, GHG emissions should be related to economic performance. Therefore, the absolute value of GHG emissions for each country was divided by GDP PPP (in USD2011) [48] for the year 2012. The values (in units of kgCO2eq/USD) were then normalised on a global level by dividing each country’s value by the value of Mongolia (1.1935 kgCO2eq/USD), which obtained the highest value, applying the quartile method [111] to determine outliers. All values higher than Mongolia were excluded, for example Central African Republic and Gambia. The normalisation resulted in percentage values with an inversely proportional relationship to energy security. The most secure energy system is the one that has the least GHG emissions, so that the values are subtracted from unity, as described by Equation (A45):
where I1.E3 is the normalised GHG emissions with normalisation according to Equation (5).
Appendix A.8.4. Effects of Climate Conditions and Climate Change on the Energy Security
This parameter comprises effects of climate change on energy security, using temperature anomalies as indicator. Data were collected from NASA [70], and derived with the following criteria: GISS analysis, ERSST_v5, Map type (Anomalies), period Dec–Nov, time interval 2007–2016 (one decade for statistical reasons), base period 1931–1940 (the earliest with full data), and smoothing radius 1200 km. The data created with these criteria were plotted against the world map using QGIS [112]. With a temperature anomaly value for each intersection between a latitude and a longitude, the precision was acceptable. Then the area weighted average for all the data points within the borders of a country was calculated. The area of each data point was almost the same for all the points within a country. The average is assigned to each country as the temperature anomaly. The next step was to normalise these values which was carried out by dividing each country’s temperature anomaly by the highest global value (Uzbekistan, 1.791 °C). The result is a percentage normalised value, and the higher the percentage, the more negative the impact from the environment on the energy system reducing security. The values are subtracted from unity, as represented by Equation (A46):
where I1.E4 is the normalised temperature anomaly with normalisation according to Equation (5).
Appendix A.8.5. Energy-Water Nexus
The last parameter of the environment dimension is energy-water nexus, for the interdependence of water and energy [113,114,115]. An increase in energy demand typically leads to an increase in water demand in an energy system, and vice versa [116]. Water is typically required for power generation, heating and extraction of natural resources. Water extraction and treatment require energy. A balance is needed between the consumed energy to produce drinkable water and the water needed to satisfy energy demand [117]. Caldera et al. [118] propose renewable electricity-based seawater desalination to achieve the balance, or by proposing future scenarios for water stress [119]. A good indicator for this parameter is water stress, defined as water demand divided by fresh water resources [116]. Data were taken from the United Nations database, describing the level of water stress, as freshwater withdrawal as a proportion of available freshwater resources [71], at a country resolution for the year 2014. Water stress is represented in a relative value, however, further normalisation is needed, because some countries have water stress levels of more than 100%. Dividing by the highest water stress in the world results in a not well-balanced representation. Therefore, the 100% water stress was used as the maximum, and all countries with water stress more than 100% are considered as the maximum unsustainable situation and set to 100% water stress. The minimum for water stress normalisation was considered as zero, which means there is plenty of renewable fresh water. Water stress and energy security forms an inversely proportional relation, so that the indicator is subtracted from unity, as represented by Equation (A47):
where I1.E5 is the normalised water stress with normalisation according to Equation (5).
Appendix A.9. Health
The health dimension (H) consists of two parameters (H1 and H2), and each one is assigned to one indicator or a set of indicators to reflect that parameter in the aggregation. Each parameter is given a weight (Wj). This dimension is presented in Equation (A48), and the use of equal weights for the two parameters results in Equation (A49):
Appendix A.9.1. The Impact of Healthy Individuals and Society on the Energy System
There are two indicators to measure the impact of people’s health on the energy system in good approximation: health expenditure as percentage of GDP, and infant mortality rate. The data are taken from the World Bank database for both indicators for the total health expenditures (as percentage of GDP) [72] for the year 2014 and the mortality rate of infants (per 1000 live births) [73] for the year 2016. A higher expenditure as a percent of GDP indicates that there are many unhealthy people in the country and results in fewer resources allocated for energy systems. In addition, it can indicate that the healthcare system is inefficient and thus it needs more improvement. However, this will not change the result of the impact because there are fewer resources channelled to investments in the energy system. Further, no health expenditure at all means that people die because of small health issues. No spending at all means that people do not buy medicine for minor diseases. Therefore, there must be a minimum accepted value for health expenditure. For this reason, Singapore was used as the reference point, with health expenditure per GDP of 4.9%. In linear representation, Singapore’s values correspond to the highest. Zero health expenditure as percent of GDP and the highest health expenditure in the world, both, correspond to the worst case in this indicator. The highest health expenditure in the world is observed in the United States of America (17.1%). The second indicator for this parameter is the infant mortality rate. A higher death rate of infants indicates that people are less healthy, thus their productivity is reduced, and the energy system is affected negatively. An ideal situation is zero deaths of infants which is used for normalising together with the highest mortality rate in the world (Central African Republic of 0.0885 infant deaths per live births). As the relationship between mortality rate and energy security has inverse proportionality, the values for this indicator are subtracted from unity. The average of the two normalised indicators is used to determine the parameter (H1) as presented in Equation (A50):
where I1.H1 is the normalised health expenditure and I2.H1 is the normalised infant mortality, with normalisation according to Equation (5).
Appendix A.9.2. The Impact of the Energy System on the Health of Individuals and Societies
For the impact of the energy system on the health of individuals and societies, one indicator is used. It is the number of deaths attributed to cancer. Data for the total number of deaths attributed to cancer are taken from the United Nations database [74] for the year 2015. The data are converted to a percentage by dividing the number of deaths attributed to cancer by the population of each country. The data set is normalised with the max-min approach presented in Equation (4). The maximum was the percentage death rate of Hungary, at a value of 0.169%, and the minimum is set to zero, a level at which no one dies of cancer, assumingly. The higher the deaths attributed to cancer, the stronger indication of negative impacts from the energy system on the health of the society. It is true that death attributed to cancer can be a result of factors other than the energy system, but in this research, it is used as a proxy for the energy system. Therefore, the relation is inversely proportional, and the indicator is subtracted from unity, as represented by Equation (A51):
where I1.H2 is the normalised cancer deaths with normalisation according to Equation (4).
Appendix A.10. Culture
The culture dimension (Cu) consists of two parameters (Cu1, Cu2) and each one is assigned to an indicator or a set of indicators to reflect that parameter in the aggregation. Equation (A52) represents the parameters and their weights (Wj). Applying equal weights for all parameters leads to Equation (A53):
Appendix A.10.1. Cultural Effects on the Energy System
This parameter of cultural effect on the energy system has many issues to be addressed such as production, connection, consumption, cultural acceptance (NIMBY, Not In My Back Yard). Therefore, different proxy indicators can measure the parameter of cultural effects on the energy system. The first indicator is the poverty headcount ratio at national level (as percentage of population). The data are obtained from the World Bank [75] for the year 2015. Normalisation is done by subtracting the percentage value from unity, because of the inverse proportionality. A lower poverty ratio has more positive impact on the energy system, because people have more money to spend on more efficient choices of energy supplies. Poverty makes people to be more focused on survival rather than better energy security orientation. The second indicator is the GINI index as obtained from the World Bank [76] for the year 2014. The lower the GINI index, the higher the security level, because a lower GINI index means more equal distribution of wealth. Such equal distribution will make people more content and satisfied with their spending, and the energy market will have better choices for the whole population. Normalisation is done by subtracting the GINI index value from unity. The third indicator is the share of population in the ages between 15 to 64 years (as percentage of total population). The data are obtained from the World Bank [77] for the year 2015. The normalisation of this indicator is carried out by the max-min (United Arab Emirates with 84.9% and Niger with 47.0%) method presented in Equation (4). Higher percentage of the population in this age range means more positive attitude towards the energy system, and thus a higher energy security level. That is because this age category has most of the energy use and they feel to be more responsible towards the energy system. The fourth indicator is the coverage of social protection and labour programmes (as percentage of population). The data are taken from the World Bank [78] for the year 2014. There is no need for normalisation as the indicator is in percentage and a higher coverage indicates a better energy security level. The parameter (Cu1) is represented by the four indicators, as summarised by Equation (A54):
where I1.Cu1 is the normalised poverty headcount ratio, I2.Cu1 is the normalised GINI index, I3.Cu1 is the normalised share of population in the ages between 15 to 64 years and I4.Cu1 is the normalised coverage of social protection and labour programmes, with normalisation according to Equation (4).
Appendix A.10.2. Energy Conditions Shaping Cultural Aspects
For the energy conditions and how they shape cultural aspects, different indicators are used. The first indicator is the primary energy use. The data are obtained from the World Bank [57] for the year 2015. More energy use is a result of excess energy and ability to purchase, which leads to higher energy security levels. Normalisation is done by dividing by the highest energy use in the world (Qatar 236.0 MWh per capita), assuming that no energy use has the lowest positive impact on energy security. The second proxy indicator is passenger aviation transportation. The data are obtained from the World Bank [79] for the year 2015. Then, numbers of each country are divided by its population to get air transport per capita. Good energy conditions correlate to people travelling more often and using airplanes. The normalisation is carried out by dividing by the maximum number in the world (Ireland with 24073 passengers carried per capita), assuming that no air transport is the lowest level for energy security. The third proxy indicator is food supply, i.e., crops, livestock and fish (in units of g/capita/day). The data are derived from Food and Agriculture Organization of the United Nations (FAO) [80] for the year 2013. Normalisation of food supply is done by dividing by the highest value in the world (Montenegro 3317 g/capita/day). A high supply is the result of good energy conditions and therefore indicates a high energy security level. The fourth proxy indicator is the United Nations Human Development Index (HDI) [81] for the year 2014. There is no need for normalisation, as the HDI is already in a relative percentage. A higher HDI indicates a higher energy security level. This parameter (Cu2) is summarised by Equation (A55):
where I1.Cu2 is the normalised energy use, I2.Cu2 is the normalised passenger aviation transportation, I3.Cu2 is the normalised food supply and I4.Cu2 is the normalised HDI, with normalisation according to Equation (5).
Appendix A.11. Literacy
The literacy dimension (Li) consists of three parameters (Li1, Li2, Li3) and each one is assigned to one indicator or a set of indicators to reflect that parameter in the aggregation. In addition, each parameter is given a weight. Equation (A56) represents the parameters and their weights (Wj), which leads to Equation (A57) for equal weights:
Appendix A.11.1. Information Availability
The availability of information includes several aspects such as market information and public awareness. This parameter is measured with a proxy indicator for the numbers of citable scientific documents allocated to countries. More citable documents are used as a proxy for more information availability and hence a higher energy security level. Data for citable documents for all countries are taken from Scimago Journal and Country Rank (SJR) [82] for the year 2017. The values were normalised, dividing by the highest number of citable documents in the world (USA 546605 citable documents), as represented by Equation (A58):
where I1.Li1 is the normalised citable documents with normalisation according to Equation (5).
Appendix A.11.2. Information Presentation and Provision
To measure how information is presented and provided, proxy indicators are used. The first indicator is the expenditure on education (in units of percentage of total government expenditure) from the World Bank [83] for the year 2016 or later. Higher expenditure on education is interpreted by a higher level of energy security. Normalisation is carried out by dividing the highest value in the world (Zimbabwe, 30.0%), assuming close to zero expenditure to correspond to a very low level of energy security. The second indicator is the research and development (R&D) expenditure (in units of percentage of GDP) from the World Bank [84], for the year 2014 or later. Normalisation of R&D expenditure is done by dividing the highest in the world (South Korea, 4.29%). A higher R&D expenditure is indicated as a higher energy security level, and the indicators representing the parameter (Li2) are summarised by Equation (A59):
where I1.Li2 is the normalised expenditure on education, and I2.Li2 is the normalised R&D expenditure, with normalisation according to Equation (5).
Appendix A.11.3. Usage of Energy Information
The energy information usage is approximated by the percentage of tertiary graduates from science, engineering, manufacturing and construction programmes for the year 2015 or later. Data are obtained and combined from United Nations [85,86]. The normalisation of tertiary graduates is done by dividing the highest in the world (Gambia, 54.1%). The higher the percentage the more use of energy information is assumed and thus a higher energy security level is anticipated. The parameter is represented by Equation (A60):
where I1.Li3 is the normalised tertiary graduates with normalisation according to Equation (5).
Appendix A.12. Employment
The employment dimension (Em) consists of two parameters (Em1, Em2) and each one is assigned to one indicator or a set of indicators to reflect that parameter in the aggregation. Equation (A61) represents the parameters and their weights (Wj) as summarised by Equation (A62) for equal weights:
Appendix A.12.1. Effect of Energy Security on Employment Rate
The effect of a secure energy system on employment can be measured by the indicator of employment in the power sector (in units of jobs/TWhel), based on regional distribution derived from [89]. Countries in the same major region are assigned the same value as the sources presents employment aggregate to nine major regions globally. Normalisation of the employment in the power sector is done by the max-min (Afghanistan, 2508 jobs/TWhel and Canada 339 jobs/TWhel) method presented in Equation (4), i.e., the highest number of employments is set best for energy security. This parameter (Em1) is represented by Equation (A63):
where I1.Em1 is the normalised employment in the power sector with normalisation according to Equation (4).
Appendix A.12.2. Effect of Employment Rate on Energy Security
A higher employment rate indicates a higher level of energy security. This parameter is measured by the national unemployment rate (in units of percentage of total labour force) from the World Bank [88,89] for the year 2017. Normalisation is done by dividing the value for every country by the maximum (Solomon Islands 31.4%) and subtracting the result from unity to account for the negative impact of unemployment. This parameter (Em2) is represented by Equation (A64):
where I1.Em2 is the normalised unemployment rate with normalisation according to Equation (5).
Appendix A.13. Policy
The policy dimension (P) consists of three parameters (P1, P2, P3) and each one is assigned to one indicator or a set of indicators to reflect that parameter in the aggregation. Equation (A65) represents the parameters and their weights (Wj) leading to Equation (A66) for equal weights:
Appendix A.13.1. Political System
The parameter of the political system consists of many issues that need to be addressed such as level of democracy, nature and stability of the political system, citizen’s will and internal and external relationships. Thus, different proxy indicators can be used to reflect the relationship between the political system parameter and energy security. The first indicator is the democracy index presented by The Economist Intelligence Unit (EIU) [90] for the year 2016. It is assumed that a higher democracy index leads to a higher energy security level. As the indicator is in units of percentage values for all countries, no further normalisation is needed. The second indicator is the Fragile States Index (FSI) provided by the Fund For Peace (FFP) [91], used for the year 2016. Higher values for the FSI are interpreted as indicator for a more fragile political system and hence a lower level for energy security. The normalisation is carried out by dividing the FSI values for every country by the maximum in the index (120) and subtracted from unity to represent the inverse proportionality. The third indicator is the political stability/absence of violence and terrorism (in units of percentile ranking) obtained from the World Bank as part of the Worldwide Governance Indicators [92] for the year 2016. Higher stability leads to a higher energy security level. The values are already in a percentile ranking, so that no further normalisation is needed. The fourth indicator is built on the polity data series obtained from The Centre for Systemic Peace (CSP) [93] for the year 2015. The data provide a value from full democracy (10) to a full autocracy (−10) for all countries. These values are normalised by setting 0% to the lowest (−10) and 100% to the highest (10), assuming a full democracy (100%) will correspond to highest energy security level. The fifth indicator is the human freedom index (HFI) where a higher HFI means more human freedom and thus a higher energy security level. The data are retrieved from the CATO institute [94] for the year 2014. Normalisation of this indicator is not needed as it is already in percentage values. The sixth proxy indicator is the freedom in the World index obtained from Freedom House [95] for the year 2017. This indicator does not need to be normalised, as the relationship to energy security is directly proportional, assuming that more freedom leads to a higher energy security level. This parameter is represented by Equation (A67):
where I1.P1 is the democracy index, I2.P1 is the FSI, I3.P1 is the political stability, I4.P1 is the polity data series, I5.P1 is the HFI and I6.P1 is the freedom in the world index.
Appendix A.13.2. Regulations
The parameter of regulations includes the nature of the market (liberalised or controlled), rules and subsidies. Therefore, the parameter of regulations is measured by two proxy indicators. The first indicator traces subsidies and other transfers (in units of percentage of central government expenditures) as retrieved from the World Bank [96] for the year 2016. Subtracting the percentage value from unity was done, so that highest subsidies represent lowest energy security. The second indicator is the Regularity Indicator for Sustainability (RIES) obtained from the World Bank [97] for the year 2016. No further normalisations are needed for this indicator. High indicator values are interpreted for a high level of energy security. This parameter (P2) is represented by Equation (A68):
where I1.P2 is the subsidies and I2.P2 is the RIES.
Appendix A.13.3. Governance
The last parameter in the policy dimension is measured by two proxy indicators. The first indicator is the Rule of Law (RoL) (in units of percentile ranking), as obtained from the World Bank from the Worldwide governance indicators [92] for the year 2016. There is no need for further normalisation. A high value indicates a more secure energy system. The second indicator is the Corruption Perception Index (CPI) as obtained from Transparency International [98] for the year 2016. No normalisation is needed as this indicator is available in percentage values. Low values indicate a high level of corruption and thus a low energy security level. This parameter (P3) is represented by Equation (A69):
where I1.P3 is the RoL and I2.P3 is the CPI.
Appendix A.14. Military
The military dimension (M) consists of four parameters (M1, M2, M3, M4) and each one is assigned to one indicator or a set of indicators to reflect that parameter in the aggregation. Equation (A70) represents the parameters and their weights (Wj), and leads to Equation (A71) for equal weights:
Appendix A.14.1. Energy Use for Military Purposes
The choice of a valid proxy indicator to measure the energy use for military purposes has taken some efforts because of lack of direct data. The indicator is energy use in military sector. Energy use in each country [57] is multiplied with the percentage that accounts for military uses. It was assumed that this percentage is similar to the percentage of military expenditure of GDP [99]. The energy use for military purposes is the multiplication of these two values. Normalisation is done by dividing the maximum in the world (USA 794.4 TWh) indicating that higher energy consumption in the military sector reduces energy security, thus the resulting value is subtracted from unity. This parameter (M1) is represented by Equation (A72):
where I1.M1 is the normalised energy use in military sector with normalisation according to Equation (5).
Appendix A.14.2. Militarisation
The militarisation parameter can be measured with two proxy indicators. A higher military expenditure (in units of percentage of GDP) implies more use of military and indicates a lower energy security level. The first indicator is the military expenditure obtained from the World Bank [99] for the year 2017 or later. Normalisation is carried out by the max-min (Oman, 12.0% and Equatorial Guinea, 0.2%) method presented in Equation (4), where the minimum represents the highest energy security level. The second proxy indicator is the number of active armed forces (in units of persons). Data were retrieved from the International Institute for Strategic Studies (IISS) from the military balance [100] for the year 2015. Two steps of normalisation are executed: First, the values for active armed force are expressed as a percentage of the population; second, the normalisation was done by dividing the maximum value in the world (Korea DR, 4.7%). The results are subtracted from unity, because a higher percentage of armed forces in a population means a higher militarisation level and thus a less secure energy system. This parameter is represented by Equation (A73):
where I1.M2 is the normalised military expenditure and I2.M2 is the normalised number of active armed forces with normalisation according to Equation (4).
Appendix A.14.3. Energy as a Mean in a Military Conflict
To measure how much energy can be used as a political energy weapon, the share of fossil fuel production in a country as a percentage of the total global production is used as a proxy. Three indicators are chosen with the same concept: First, share of coal production to the world total; second, share of crude oil production to the world total; third, share of gas production to the world total. Data for energy balances are taken from IEA [41] for the year 2015. Each of these indicators is normalised by dividing the maximum in the world. Highest share of coal production was for China with 48.4%, highest share of oil production was for the United States with 13.2% and highest share of gas production was also for the United States with 21.3%. A higher share of the global production means a higher level of energy security as energy has the potential to be used as energy weapon. The average of the three indicators is considered to measure this parameter (M3) as presented by Equation (A74):
where I1.M3 is the normalised share of coal production, I2.M3 is the normalised share of oil production and I3.M3 is the normalised share of gas production, with normalisation according to Equation (5).
Appendix A.14.4. Destabilisation Factor
Destabilising factors consist of many aspects such as the concept of resources curse, environmental deterioration and economies of violence. To account for energy as destabilisation factor, two indicators are chosen, and their average is calculated to measure this parameter. First, the percentage of net energy imports or net energy exports to the total energy use in every country is used as an indicator. Data are collected from the World Bank [101] for the year 2015. Normalisation is done by dividing the highest absolute (Norway with 581%), both more net export or more net import as a percentage of energy use indicates a less secure energy system. The resulting value is subtracted from unity. The second indicator is the income from net exporting minerals from HS4 international product classification (in units of million USD) [102] for every country for the year 2016. Normalisation is done by two steps: First, dividing by the GDP of every country; second, by dividing over the maximum in the world (Qatar, 15.61% of GDP) and then subtracting the result from unity. A high share of minerals revenue as a percentage of the GDP is less favourable for energy security. This parameter (M4) is represented by Equation (A75):
where I1.M4 is the normalised net energy export/import and I2.M4 is the normalised income from net exporting minerals with normalisation according to Equation (5).
Appendix A.15. Cyber Security
The cyber security dimension (Cy) consists of three parameters (Cy1, Cy2, Cy3) and each one is assigned to one indicator or a set of indicators to reflect that parameter in the aggregation. Equation(A76) represents the parameters and their weights (Wj) leading to Equation (A77) for equal weights:
Appendix A.15.1. Connectivity and Cyberattacks
The connectivity parameter can be measured with a proxy indicator for individuals using the Internet (in units of percentage of population). The data were retrieved from the World Bank [103] for the year 2016. More Internet users mean more connectivity to the Internet and thus a lower energy security level, therefore, subtracting this value from unity. This parameter (Cy1) is represented by Equation (A78):
where I1.Cy1 is the percentage of individuals using Internet.
Appendix A.15.2. Software Use
To measure the software usage a proxy indicator is chosen in form of the technical aspect of the Global Cybersecurity Index (GCI), as adopted from the International Communication Union [104] for the year 2017. Values are already normalised. The higher the score, the higher the level of energy security. This parameter (Cy2) is represented by Equation (A79):
where I1.Cy2 is the normalised GCITechnical.
Appendix A.15.3. IT Skills
To account the IT skills, the Capacity Building Indicator from the Global Cybersecurity Index is adopted from the International Communication Union [104] for the year 2017. Values are already normalised. The higher the score, the higher the level of energy security. This parameter (Cy3) is represented by Equation (A80):
where I1.Cy3 is the normalised GCICapacity.building.
References
- Ang, B.W.; Choong, W.L.; Ng, T.S. Energy security: Definitions, dimensions and indexes. Renew. Sustain. Energy Rev. 2015, 42, 1077–1093. [Google Scholar] [CrossRef]
- Vivoda, V. Evaluating energy security in the Asia-Pacific region: A novel methodological approach. Energy Policy 2010, 38, 5258–5263. [Google Scholar] [CrossRef] [Green Version]
- Bielecki, J. Energy security: Is the wolf at the door? Q. Rev. Econ. Financ. 2002, 42, 235–250. [Google Scholar] [CrossRef]
- Jun, E.; Kim, W.; Chang, S.H. The analysis of security cost for different energy sources. Appl. Energy 2009, 86, 1894–1901. [Google Scholar] [CrossRef]
- Löschel, A.; Moslener, U.; Rübbelke, D.T.G. Indicators of energy security in industrialised countries. Energy Policy 2010, 38, 1665–1671. [Google Scholar] [CrossRef]
- Kirchner, E.; Berk, C.A.N. European energy security co-operation: Between amity and enmity. JCMS J. Common Mark. Stud. 2010, 48, 859–880. [Google Scholar] [CrossRef]
- Dyer, H.; Trombetta, M.J. International Handbook of Energy Security; Edward Elgar Publishing: Cheltenham, UK, 2013. [Google Scholar]
- Kovačovská, J. Energy Security in European Conditions. Ph.D. Thesis, Masaryk University, Faculty of Social Studies, Brno, Czech Republic, 2010. [Google Scholar]
- Sovacool, B.K. Energy security: Challenges and needs. Wiley Interdiscip. Rev. Energy Environ. 2012, 1, 51–59. [Google Scholar] [CrossRef]
- Johnson, C.; Boersma, T. The politics of energy security: Contrasts between the United States and the European Union. Wiley Interdiscip. Rev. Energy Environ. 2015, 4, 171–177. [Google Scholar] [CrossRef]
- Valentine, S.V. Emerging symbiosis: Renewable energy and energy security. Renew. Sustain. Energy Rev. 2011, 15, 4572–4578. [Google Scholar] [CrossRef]
- Augutis, J.; Krikštolaitis, R.; Pečiulytė, S.; Konstantinavičiūtė, I. Sustainable development and energy security level after Ignalina NPP shutdown. Technol. Econ. Dev. Econ. 2011, 17, 5–21. [Google Scholar] [CrossRef]
- Yergin, D. Ensuring energy security. Foreign Aff. N. Y. 2006, 85, 69. [Google Scholar] [CrossRef]
- Kunz, A. Indian Energy Security. Nuclear Energy Policy; Charles University: Prague, Czech Republic, 2012. [Google Scholar]
- Magazzino, C. Is per capita energy use stationary? Time series evidence for the EMU countries. Energy Explor. Exploit. 2016, 35, 24–32. [Google Scholar] [CrossRef]
- Magazzino, C. Is per capita energy use stationary? Panel data evidence for the EMU countries. Energy Explor. Exploit. 2016, 34, 440–448. [Google Scholar] [CrossRef] [Green Version]
- Asif, M.; Muneer, T. Energy supply, its demand and security issues for developed and emerging economies. Renew. Sustain. Energy Rev. 2007, 11, 1388–1413. [Google Scholar] [CrossRef]
- Haghighi, S.S. Energy Security: The External Legal Relations of the European Union with Major Oil and Gas Supplying Countries; Bloomsbury Publishing: London, UK, 2007. [Google Scholar]
- Ciută, F. Conceptual notes on energy security: Total or banal security? Secur. Dialogue 2010, 41, 123–144. [Google Scholar] [CrossRef]
- Sovacool, B.K. Evaluating energy security in the Asia pacific: Towards a more comprehensive approach. Energy Policy 2011, 39, 7472–7479. [Google Scholar] [CrossRef]
- Dunham, I.M.; Schlosser, K. Energy security discourses and environmental protection measures in U.S. federal energy legislation: An introductory exploration. Extr. Ind. Soc. 2016, 3, 86–94. [Google Scholar] [CrossRef]
- Eaves, J.; Eaves, S. Renewable corn-ethanol and energy security. Energy Policy 2007, 35, 5958–5963. [Google Scholar] [CrossRef]
- Jordan, M.; Manley, D.; Peters, R.S.; Stoltz, R. Goals of Energy Policy: Professional Perspectives on Energy Security, Economics, and Environment; Our Energy Policy and Sandia National Laboratory: Washington, DC, USA, 2012. [Google Scholar]
- International Energy Agency. Energy Security and Climate Policy-Assessing Interactions; 1281720488; Organisation for Economic Co-Operation and Development (OECD) Publishing: Paris, France, 2007. [Google Scholar]
- Franki, V.; Višković, A. Energy security, policy and technology in South East Europe: Presenting and applying an energy security index to Croatia. Energy 2015, 90, 494–507. [Google Scholar] [CrossRef]
- Maslow, A.H. A theory of human motivation. Psychol. Rev. 1943, 50, 370–396. [Google Scholar] [CrossRef] [Green Version]
- Kumar, S. Assessment of renewables for energy security and carbon mitigation in Southeast Asia: The case of Indonesia and Thailand. Appl. Energy 2016, 163, 63–70. [Google Scholar] [CrossRef]
- Sovacool, B.K. An international assessment of energy security performance. Ecol. Econ. 2013, 88, 148–158. [Google Scholar] [CrossRef]
- Kanchana, K.; Unesaki, H. ASEAN energy security: An indicator-based assessment. Energy Procedia 2014, 56, 163–171. [Google Scholar] [CrossRef] [Green Version]
- Lu, W.; Su, M.; Zhang, Y.; Yang, Z.; Chen, B.; Liu, G. Assessment of energy security in China based on ecological network analysis: A perspective from the security of crude oil supply. Energy Policy 2014, 74, 406–413. [Google Scholar] [CrossRef]
- Phdungsilp, A. Assessing energy security performance in Thailand under different scenarios and policy implications. Energy Procedia 2015, 79, 982–987. [Google Scholar] [CrossRef] [Green Version]
- Azzuni, A.; Breyer, C. Definitions and dimensions of energy security: A literature review. Wiley Interdiscip. Rev. Energy Environ. 2017, 7, e268. [Google Scholar] [CrossRef]
- Hansen, K.; Breyer, C.; Lund, H. Status and perspectives on 100% renewable energy systems. Energy 2019, 175, 471–480. [Google Scholar] [CrossRef]
- Wang, Q.; Zhou, K. A framework for evaluating global national energy security. Appl. Energy 2017, 188, 19–31. [Google Scholar] [CrossRef]
- Radovanović, M.; Filipović, S.; Pavlović, D. Energy security measurement—A sustainable approach. Renew. Sustain. Energy Rev. 2017, 68, 1020–1032. [Google Scholar] [CrossRef]
- Badea, A.C.; Tarantola, S.; Bolado, R. Composite indicators for security of energy supply using ordered weighted averaging. Reliab. Eng. Syst. Saf. 2011, 96, 651–662. [Google Scholar] [CrossRef]
- Child, M.; Koskinen, O.; Linnanen, L.; Breyer, C. Sustainability guardrails for energy scenarios of the global energy transition. Renew. Sustain. Energy Rev. 2018, 91, 321–334. [Google Scholar] [CrossRef]
- Wu, G.; Liu, L.-C.; Han, Z.-Y.; Wei, Y.-M. Climate protection and China’s energy security: Win-win or tradeoff. Appl. Energy 2012, 97, 157–163. [Google Scholar] [CrossRef]
- Kamsamrong, J.; Sorapipatana, C. An assessment of energy security in Thailand’s power generation. Sustain. Energy Technol. Assess. 2014, 7, 45–54. [Google Scholar] [CrossRef]
- Cabalu, H.; Alfonso, C. Energy security in Asia: The case of natural gas. In Energy Economics and Financial Markets; Dorsman, A., Simpson, J.L., Westerman, W., Eds.; Springer: Berlin/Heidelberg, Germany, 2013; pp. 13–30. [Google Scholar]
- International Energy Agency (IEA). World Energy Balances 2016; Organisation for Economic Co-Operation and Development (OECD) Publishing: Paris, France, 2016. [Google Scholar]
- Breyer, C.; Bogdanov, D.; Aghahosseini, A.; Gulagi, A.; Child, M.; Oyewo, A.S.; Farfan, J.; Sadovskaia, K.; Vainikka, P. Solar photovoltaics demand for the global energy transition in the power sector. Prog. Photovolt. Res. Appl. 2017, 26, 505–523. [Google Scholar] [CrossRef]
- United Nations (UN). World Population Prospects: The 2015 Revision, Key Findings and Advance Tables; United Nations (UN): New York, NY, USA, 2015. [Google Scholar]
- Central Intelligence Agency (CIA). The World Factbook 2018. Available online: https://www.cia.gov/library/publications/the-world-factbook/index.html (accessed on 8 September 2018).
- Farfan, J.; Breyer, C. Structural changes of global power generation capacity towards sustainability and the risk of stranded investments supported by a sustainability indicator. J. Clean. Prod. 2017, 141, 370–384. [Google Scholar] [CrossRef]
- Photius Coutsoukis (PC). Countries of the World. Available online: https://photius.com/rankings/spreadsheets_2015/transportation_2015.xlsx (accessed on 26 October 2017).
- Wagner, A. International Fuel Prices 2014; Federal Ministry of Economic Cooperation and Development BMZ: Bonn, Germany, 2015.
- World Bank (WB). GDP, PPP (Constant 2011 International $). Available online: http://api.worldbank.org/v2/en/indicator/NY.GDP.MKTP.PP.KD?downloadformat=excel (accessed on 27 October 2017).
- Nationmaster. Energy-Electrical outages-Days: Countries Compared. Available online: http://www.nationmaster.com/country-info/stats/Energy/Electrical-outages/Days (accessed on 15 October 2018).
- World Intellectual Property Organization (WIPO). Patnets in Force; WIPO IP Statistics Data Center: Geneva, Switzerland, 2016. [Google Scholar]
- World Bank (WB). Scientific and Technical Journal Articles. Available online: http://api.worldbank.org/v2/en/indicator/IP.JRN.ARTC.SC?downloadformat=excel (accessed on 30 May 2018).
- World Bank (WB). Energy Intensity Level of Primary Energy. Available online: http://api.worldbank.org/v2/en/indicator/EG.EGY.PRIM.PP.KD?downloadformat=excel (accessed on 4 June 2018).
- International Energy Agency (IEA). International Comparison of Light-Duty Vehicle Fuel Economy 2005–2015. Ten Years of Fuel Economy Bench-Marking; International Energy Agency IEA: London, UK, 2017. [Google Scholar]
- World Bank (WB). Land Area. Available online: http://api.worldbank.org/v2/en/indicator/AG.LND.TOTL.K2?downloadformat=excel (accessed on 4 June 2018).
- British Petroleum. BP Statistical Review of World Energy 2017; British Petroleum: London, UK, 2017. [Google Scholar]
- DistanceFromTo (DFT). Distance between Cities Places On Map. Available online: https://www.distancefromto.net (accessed on 10 October 2018).
- World Bank (WB). Energy Use. Available online: http://api.worldbank.org/v2/en/indicator/EG.USE.PCAP.KG.OE?downloadformat=excel (accessed on 6 June 2017).
- World Bank (WB). Terrestrial and marine protected areas (% of total territorial area). Available online: https://data.worldbank.org/indicator/ER.PTD.TOTL.ZS (accessed on 9 October 2018).
- World Bank (WB). Trade (% of GDP). Available online: http://api.worldbank.org/v2/en/indicator/NE.TRD.GNFS.ZS?downloadformat=excel (accessed on 14 June 2017).
- Gygli, S.; Haelg, F.; Sturm, J.-E. The KOF Globalisation Index-Revisited; KOF Swiss Economic Institute: Zurich, Switzerland, 2018; Volume 439. [Google Scholar]
- Food and Agriculture Organization (FAO). AQUASTAT Main Database. Available online: http://www.fao.org/nr/water/aquastat/data/query/index.html (accessed on 11 October 2018).
- World Bank (WB). Industry, Value Added (Current US$). Available online: http://api.worldbank.org/v2/en/indicator/NV.IND.TOTL.CD?downloadformat=excel (accessed on 9 May 2018).
- World Bank (WB). Life Expectancy at Birth, Total (Years). Available online: https://data.worldbank.org/indicator/SP.DYN.LE00.IN (accessed on 2 October 2018).
- World Bank (WB). Renewable Electricity Output 2010 (% of Total Electricity Output). Available online: https://data.worldbank.org/indicator/EG.ELC.RNEW.ZS (accessed on 27 September 2018).
- World Bank (WB). Renewable Electricity Output 2015 (% of Total Electricity Output). Available online: https://data.worldbank.org/indicator/EG.ELC.RNEW.ZS (accessed on 28 September 2018).
- FM Global. Resilience Index 2018 Data; FM Global: Johnston, RI, USA, 2018. [Google Scholar]
- Global Footprint Network (GFN). National Footprint Accounts, 2016 Edition. Available online: http://www.footprintnetwork.org/licenses/public-data-package-free-edition-copy/ (accessed on 21 February 2017).
- World Bank (WB). CO2 Intensity (kg per kg of Oil Equivalent Energy Use). Available online: http://api.worldbank.org/v2/en/indicator/EN.ATM.CO2E.EG.ZS?downloadformat=excel (accessed on 2 March 2017).
- World Resources Institute. CAIT-country greenhouse gas emissions data. In CAIT Climate Data Explorer; World Resources Institute: Washington, DC, USA, 2015; Volume 2017. [Google Scholar]
- National Aeronautics and Space Administration (NASA). GISS Surface Temperature Analysis. Available online: https://data.giss.nasa.gov/gistemp/news/2005/ (accessed on 27 October 2017).
- United Nations (UN). Level of Water Stress: Freshwater Withdrawal As a Proportion of Available Freshwater Resources. Available online: http://data.un.org/Data.aspx?d=SDGs&f=series%3aER_H2O_STRESS (accessed on 30 October 2017).
- World Bank (WB). Health Expenditure, Total (% of GDP). Available online: http://api.worldbank.org/v2/en/indicator/SH.XPD.TOTL.ZS?downloadformat=excel (accessed on 26 October 2017).
- World Bank (WB). Mortality Rate, Infant (per 1000 Live Births). Available online: http://api.worldbank.org/v2/en/indicator/SP.DYN.IMRT.IN?downloadformat=excel (accessed on 4 December 2017).
- United Nations (UN). Number of Deaths Attributed to Cancer. Available online: http://data.un.org/Data.aspx?q=cancer&d=SDGs&f=series%3aSH_DTH_CANCER (accessed on 26 October 2017).
- World Bank (WB). Poverty Headcount Ratio at National Poverty Lines. Available online: http://api.worldbank.org/v2/en/indicator/SI.POV.NAHC?downloadformat=excel (accessed on 15 February 2017).
- World Bank (WB). GINI Index. Available online: http://api.worldbank.org/v2/en/indicator/SI.POV.GINI?downloadformat=excel (accessed on 31 January 2017).
- World Bank (WB). Population Ages 15–64. Available online: http://api.worldbank.org/v2/en/indicator/SP.POP.1564.TO.ZS?downloadformat=excel (accessed on 27 June 2017).
- World Bank (WB). Coverage of Social Protection and Labor Programs (% of Population). Available online: http://api.worldbank.org/v2/en/indicator/per_allsp.cov_pop_tot?downloadformat=excel (accessed on 6 June 2017).
- World Bank (WB). Air Transport, Passengers Carried. Available online: http://api.worldbank.org/v2/en/indicator/IS.AIR.PSGR?downloadformat=excel (accessed on 18 June 2017).
- Food and Agriculture Organization (FAO). Food Supply-Crops Primary Equivalent. Available online: http://www.fao.org/faostat/en/#data/CC (accessed on 2 June 2017).
- United Nations Development Program (UNDP). Human Development Index. Available online: http://hdr.undp.org/en/indicators/137506 (accessed on 18 June 2018).
- SC Imago Journal and Country Ranking (SJR). Citable Documents. Available online: https://www.scimagojr.com/countryrank.php?year=2017 (accessed on 19 June 2018).
- World Bank (WB). Expenditure on Education as % of Total Government Expenditure (%). Available online: http://api.worldbank.org/v2/en/indicator/SE.XPD.TOTL.GB.ZS?downloadformat=excel (accessed on 18 June 2018).
- World Bank (WB). Research and Development Expenditure (% of GDP). Available online: http://api.worldbank.org/v2/en/indicator/GB.XPD.RSDV.GD.ZS?downloadformat=excel (accessed on 20 March 2017).
- United Nations (UN). Percentage of Tertiary Graduates from Engineering, Manufacturing and Construction Programmes. Available online: http://data.un.org/Data.aspx?q=graduate&d=UNESCO&f=series%3aFOSGP_56_F500 (accessed on 19 June 2018).
- United Nations (UN). Percentage of Tertiary Graduates from Science Programmes. Available online: http://data.un.org/Data.aspx?q=graduate&d=UNESCO&f=series%3aFOSGP_56_F400 (accessed on 19 June 2018).
- Ram, M.; Bogdanov, D.; Aghahosseini, A.; Oyewo, S.; Gulagi, A.; Child, M.; Fell, H.-J.; Breyer, C. Global Energy System Based on 100% Renewable Energy—Power Sector; Lappeenranta University of Technology and Energy Watch Group: Lappeenranta, Finland, 2017. [Google Scholar]
- World Bank (WB). Unemployment, Total (% of Total Labor Force) (Modeled ILO Estimate). Available online: http://api.worldbank.org/v2/en/indicator/SL.UEM.TOTL.ZS?downloadformat=excel (accessed on 16 April 2018).
- Ram, M.; Aghahosseini, A.; Breyer, C. Job creation during the global energy transition towards 100% renewable power system by 2050. Technol. Forecast. Soc. Chang. 2020, 151, 119682. [Google Scholar] [CrossRef]
- the Economist Intelligence Unit (EIU). Democracy Index 2016. Available online: http://www.eiu.com/public/topical_report.aspx?campaignid=DemocracyIndex2016 (accessed on 6 September 2017).
- Fund for Peace (FFB). Fragile States Index (FSI). Available online: http://fsi.fundforpeace.org/library/fragilestatesindex-2016.xlsx (accessed on 6 September 2017).
- World Bank (WB). The Worldwide Governance Indicators. Available online: http://info.worldbank.org/governance/wgi (accessed on 18 July 2018).
- Center for Systemic Peace (CSF). Polity Series. Available online: http://www.systemicpeace.org/ (accessed on 16 June 2017).
- The CATO Institute. The Human Freedom Index. Available online: https://object.cato.org/sites/cato.org/files/human-freedom-index-files/hfi-2016-scores-and-rankings-updated-2.xlsx (accessed on 18 July 2018).
- Freedom House (FdH). Freedom in the World. Available online: https://freedomhouse.org/sites/default/files/FIW2017_Data.zip (accessed on 18 July 2018).
- World Bank (WB). Subsidies and Other Transfers (% of Expense). Available online: https://data.worldbank.org/indicator/GC.XPN.TRFT.ZS (accessed on 23 July 2018).
- Banerjee, S.G.; Moreno, F.A.; Sinton, J.; Primiani, T.; Seong, J. Regulatory Indicators for Sustainable Energy A Global Scorecard for Policy Makers; The World Bank: Washington, DC, USA, 2016. [Google Scholar]
- Transparency International (TI). Corruption Perception Index (CPI). Available online: http://files.transparency.org/content/download/2060/13252/file/CPI2016_FullDataSetWithRegionalTables.xlsx (accessed on 23 July 2018).
- World Bank (WB). Military Expenditure (% per GDP). Available online: http://api.worldbank.org/v2/en/indicator/MS.MIL.XPND.GD.ZS?downloadformat=excel (accessed on 26 July 2018).
- International Institute for Strategic Studies (IISS). The Military Balance; International Institute for Strategic Studies: London, UK, 2017. [Google Scholar]
- World Bank (WB). Energy Imports, Net (% of Energy Use). Available online: https://data.worldbank.org/indicator/EG.IMP.CONS.ZS (accessed on 10 September 2018).
- Hausmann, R.; Hidalgo, C.; Bustos, S.; Coscia, M.; Chung, S.; Jimenez, J.; Simoes, A.; Yildirim, M. The Atlas of Economic Complexity. Available online: http://www.atlas.cid.harvard.edu (accessed on 3 October 2018).
- World Bank (WB). Individuals Using the Internet (% of Population). Available online: http://api.worldbank.org/v2/en/indicator/IT.NET.USER.ZS?downloadformat=excel (accessed on 27 July 2018).
- Brahima, S. Global Cybersecurity Index 2017; International Telecommunication Union: Geneva, Switzerland, 2017; pp. 1–77. [Google Scholar]
- Augutis, J.; Krikštolaitis, R.; Martišauskas, L.; Urbonienė, S.; Urbonas, R.; Ušpurienė, A.B. Analysis of energy security level in the Baltic States based on indicator approach. Energy 2020, 199, 117427. [Google Scholar] [CrossRef]
- Haegel, N.M.; Atwater, H.; Barnes, T.; Breyer, C.; Burrell, A.; Chiang, Y.-M.; De Wolf, S.; Dimmler, B.; Feldman, D.; Glunz, S.; et al. Terawatt-scale photovoltaics: Transform global energy. Science 2019, 364, 836. [Google Scholar] [CrossRef] [Green Version]
- Brown, T.W.; Bischof-Niemz, T.; Blok, K.; Breyer, C.; Lund, H.; Mathiesen, B.V. Response to ’Burden of proof: A comprehensive review of the feasibility of 100% renewable-electricity systems’. Renew. Sustain. Energy Rev. 2018, 92, 834–847. [Google Scholar] [CrossRef]
- Bogdanov, D.; Farfan, J.; Sadovskaia, K.; Aghahosseini, A.; Child, M.; Gulagi, A.; Oyewo, A.S.; de Souza Noel Simas Barbosa, L.; Breyer, C. Radical transformation pathway towards sustainable electricity via evolutionary steps. Nat. Commun. 2019, 10, 1077. [Google Scholar] [CrossRef] [Green Version]
- Nagendra, H. Opposite trends in response for the shannon and simpson indices of landscape diversity. Appl. Geogr. 2002, 22, 175–186. [Google Scholar] [CrossRef]
- Simpson, E.H. Measurement of diversity. Nature 1949, 163, 688. [Google Scholar] [CrossRef]
- Seo, S. A Review and Comparison of Methods for Detecting Outliers in Univariate Data Sets. Ph.D. Thesis, University of Pittsburgh, Pittsburgh, PA, USA, 2006. [Google Scholar]
- Open Source Geospatial (OSGeo). QGIS (Quantum Geographic Information System). Available online: http://qgis.osgeo.org (accessed on 6 March 2020).
- Sanders, K.T.; Webber, M.E. The energy-water nexus: Managing water in an energy constrained world. Earth 2013. [Google Scholar] [CrossRef] [Green Version]
- World Economic Forum (WEF). Introduction. In Water Security: The Water-Food-Energy-Climate Nexus; Island Press/Center for Resource Economics: Washington, DC, USA, 2011; pp. 1–16. [Google Scholar]
- Lohrmann, A.; Farfan, J.; Caldera, U.; Lohrmann, C.; Breyer, C. Global scenarios for significant water use reduction in thermal power plants based on cooling water demand estimation using satellite imagery. Nat. Energy 2019, 4, 1040–1048. [Google Scholar] [CrossRef]
- World Energy Council (WEC). World Energy Resources 2013 Survey; World Energy Council: London, UK, 2013. [Google Scholar]
- International Renewable Energy Agency (IRENA). Renewable Energy in the Water Energy & Food Nexus; International Renewable Energy Agency (IRENA): Abu Dhabi, Emirates, 2015. [Google Scholar]
- Caldera, U.; Bogdanov, D.; Breyer, C. Local cost of seawater RO desalination based on solar PV and wind energy: A global estimate. Desalination 2016, 385, 207–216. [Google Scholar] [CrossRef]
- Luo, T.; Young, R.; Reig, P. Aqueduct Projected Water Stress Country Rankings; World Resources Institute: Washington, DC, USA, 2015. [Google Scholar]
Figure 1.
Global energy security levels. The applied colour of the bars indicates the number of missing parameters: blue ≤ 5, yellow 5 ≤ 10, orange 10 ≤ 15, red > 15.
Figure 1.
Global energy security levels. The applied colour of the bars indicates the number of missing parameters: blue ≤ 5, yellow 5 ≤ 10, orange 10 ≤ 15, red > 15.

Figure 2.
Global view on the energy security index.

Figure 3.
Global view on the availability dimension.

Figure 4.
Global view on the diversity dimension.

Figure 5.
Global view on the Cost dimension.

Figure 6.
Global view on the technology and efficiency dimension.

Figure 7.
Global view on the location dimension.

Figure 8.
Global view on the timeframe dimension.

Figure 9.
Global view on the resilience dimension.

Figure 10.
Global view on the environment dimension.

Figure 11.
Global view on the health dimension.

Figure 12.
Global view on the culture dimension.

Figure 13.
Global view on the literacy dimension.

Figure 14.
Global view on the employment dimension.

Figure 15.
Global view on the policy dimension.

Figure 16.
Global view on the military dimension.

Figure 17.
Global view on the cybersecurity dimension.

Figure 18.
Detailed energy security view for Germany, values 0–100 represent worst to best.

Figure 19.
Detailed energy security view for the United States, values 0–100 represent worst to best.
Figure 19.
Detailed energy security view for the United States, values 0–100 represent worst to best.

Figure 20.
Detailed energy security view for China, values 0–100 represent worst to best.

Figure 21.
Detailed energy security view for Jordan, values 0–100 represent worst to best.

Figure 22.
Detailed energy security view for Central African Republic, values 0–100 represent worst to best.
Figure 22.
Detailed energy security view for Central African Republic, values 0–100 represent worst to best.

Figure 23.
Detailed energy security view for Turkmenistan, values 0–100 represent worst to best.


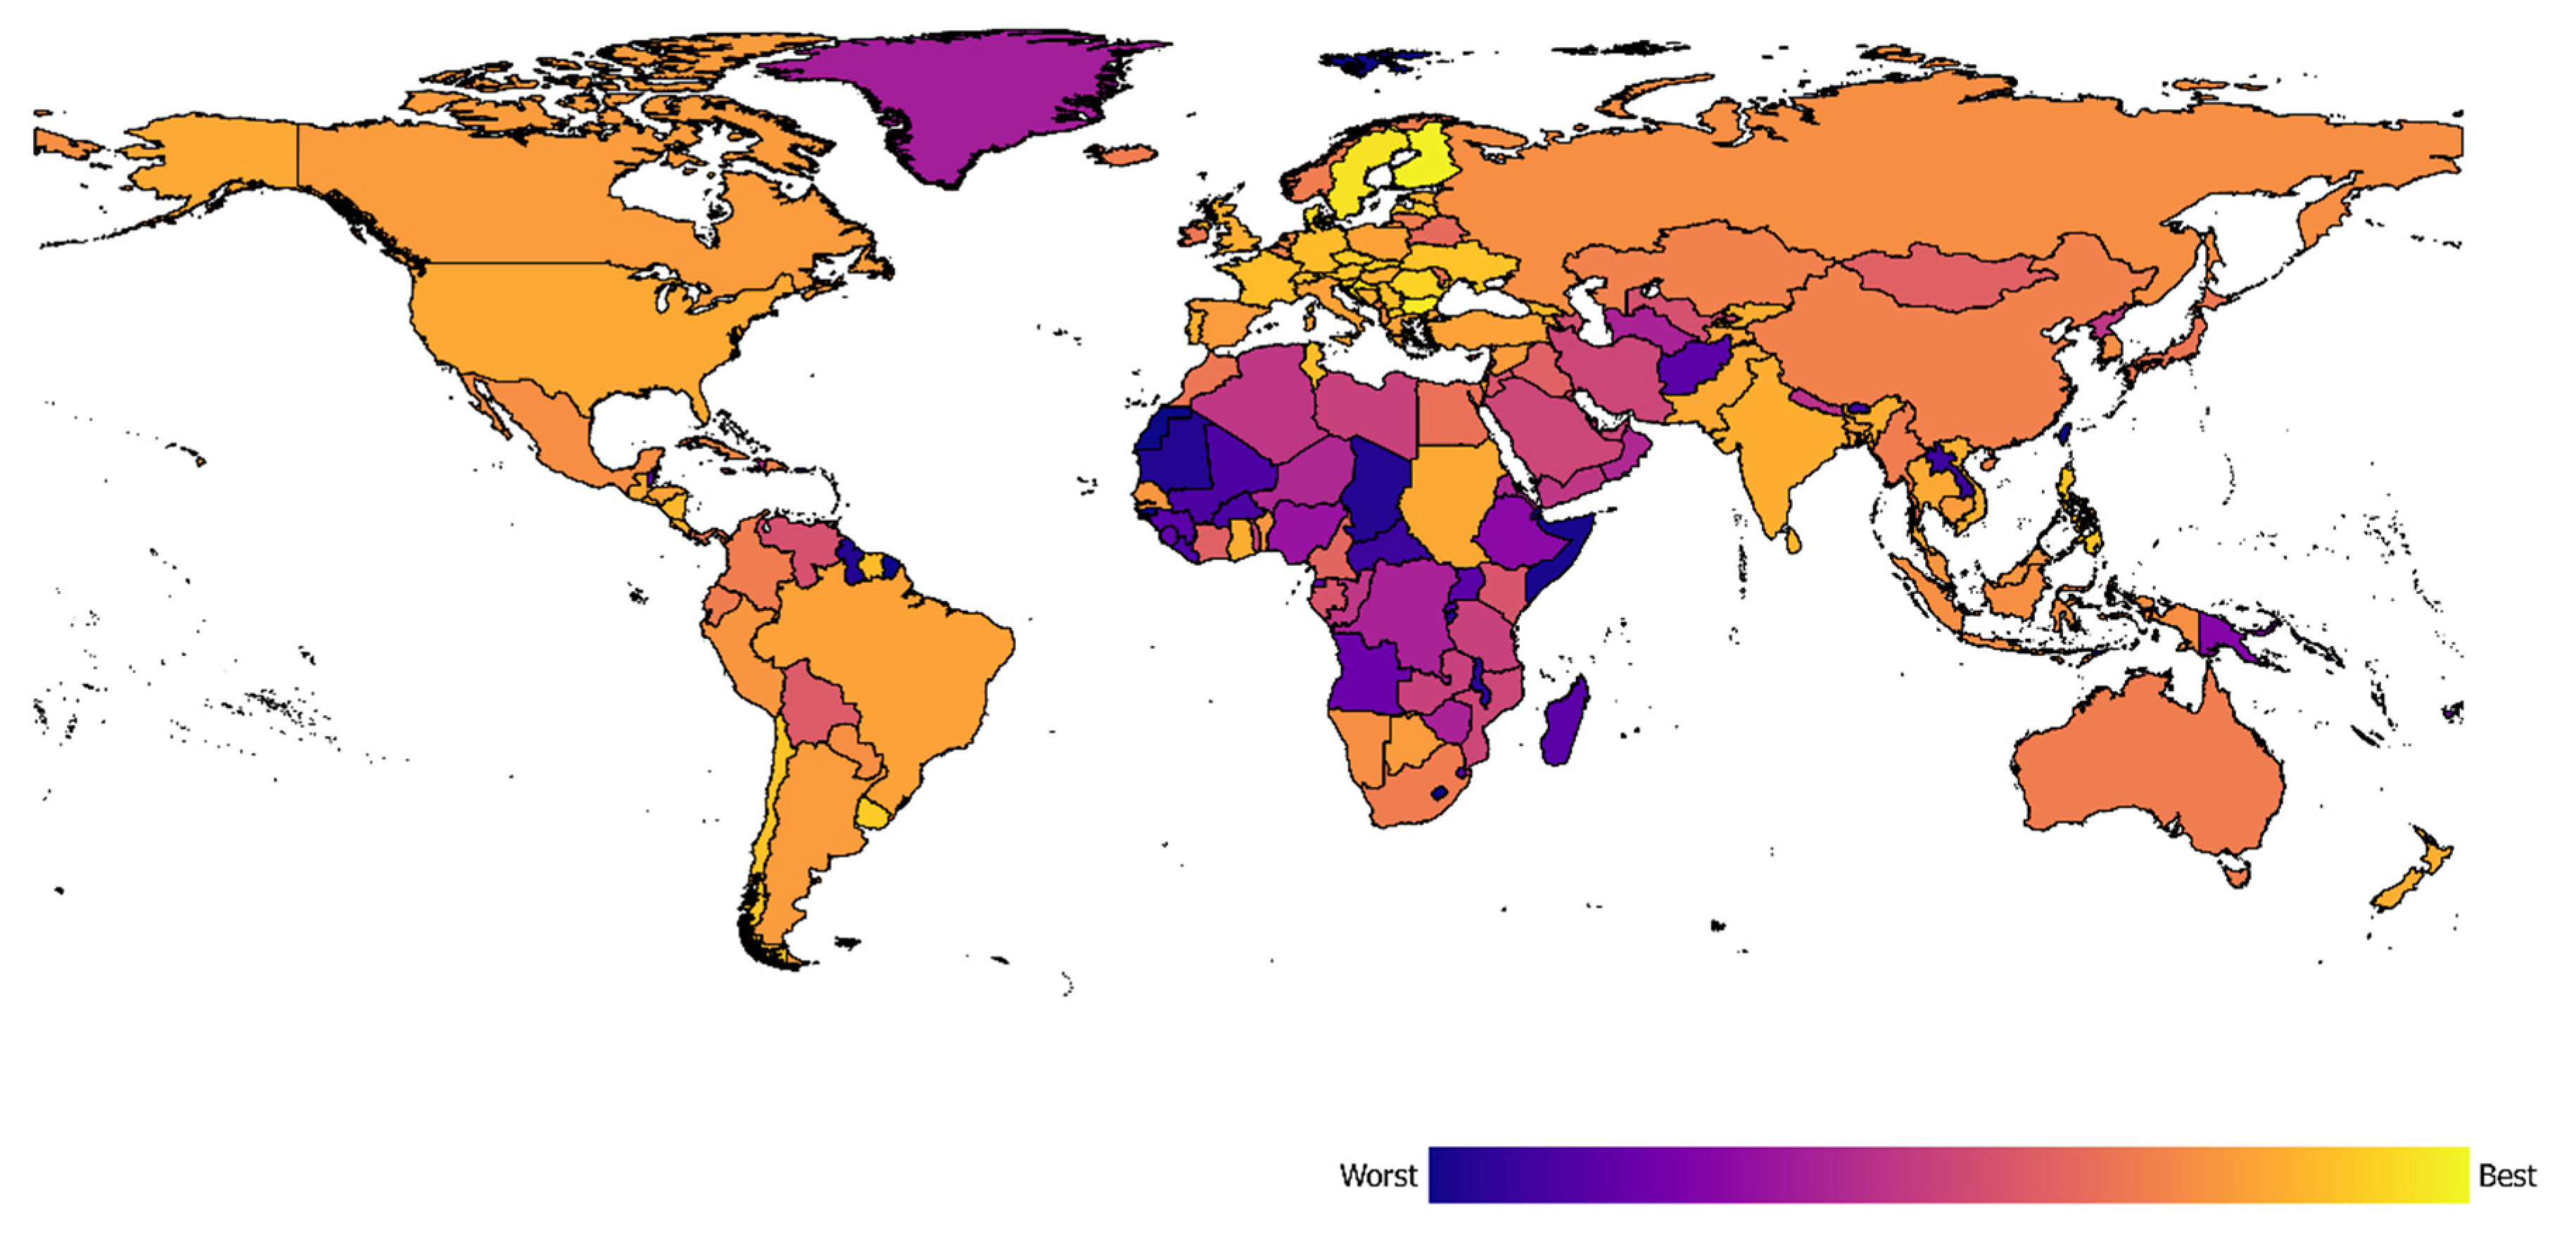
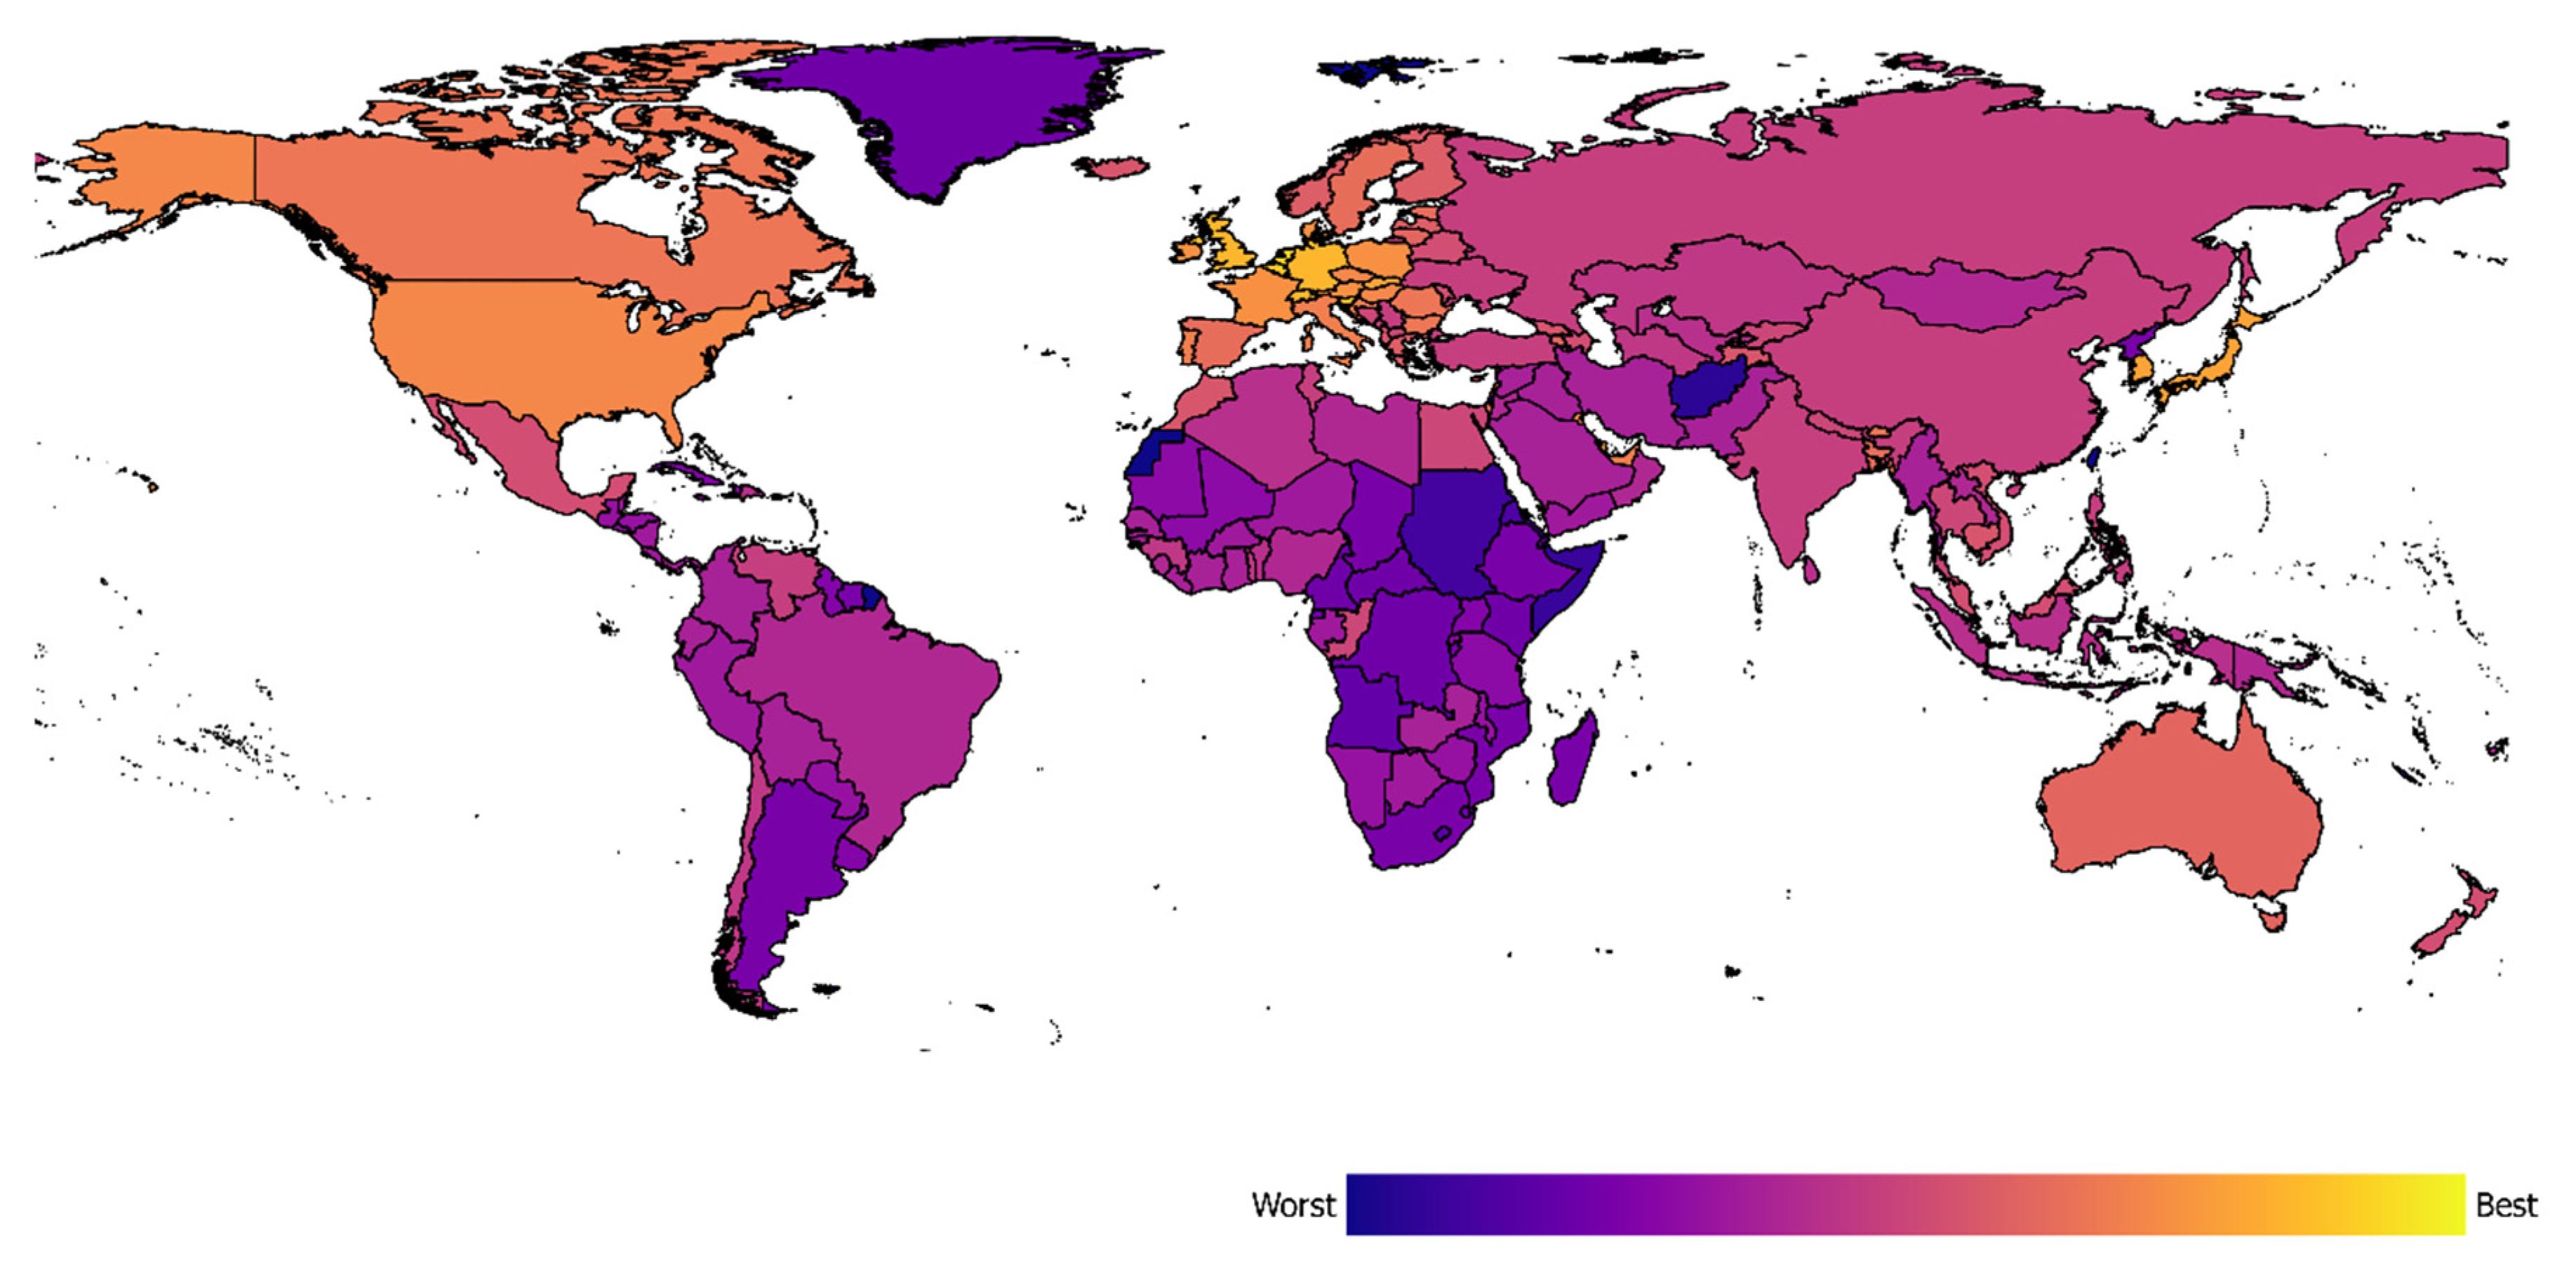
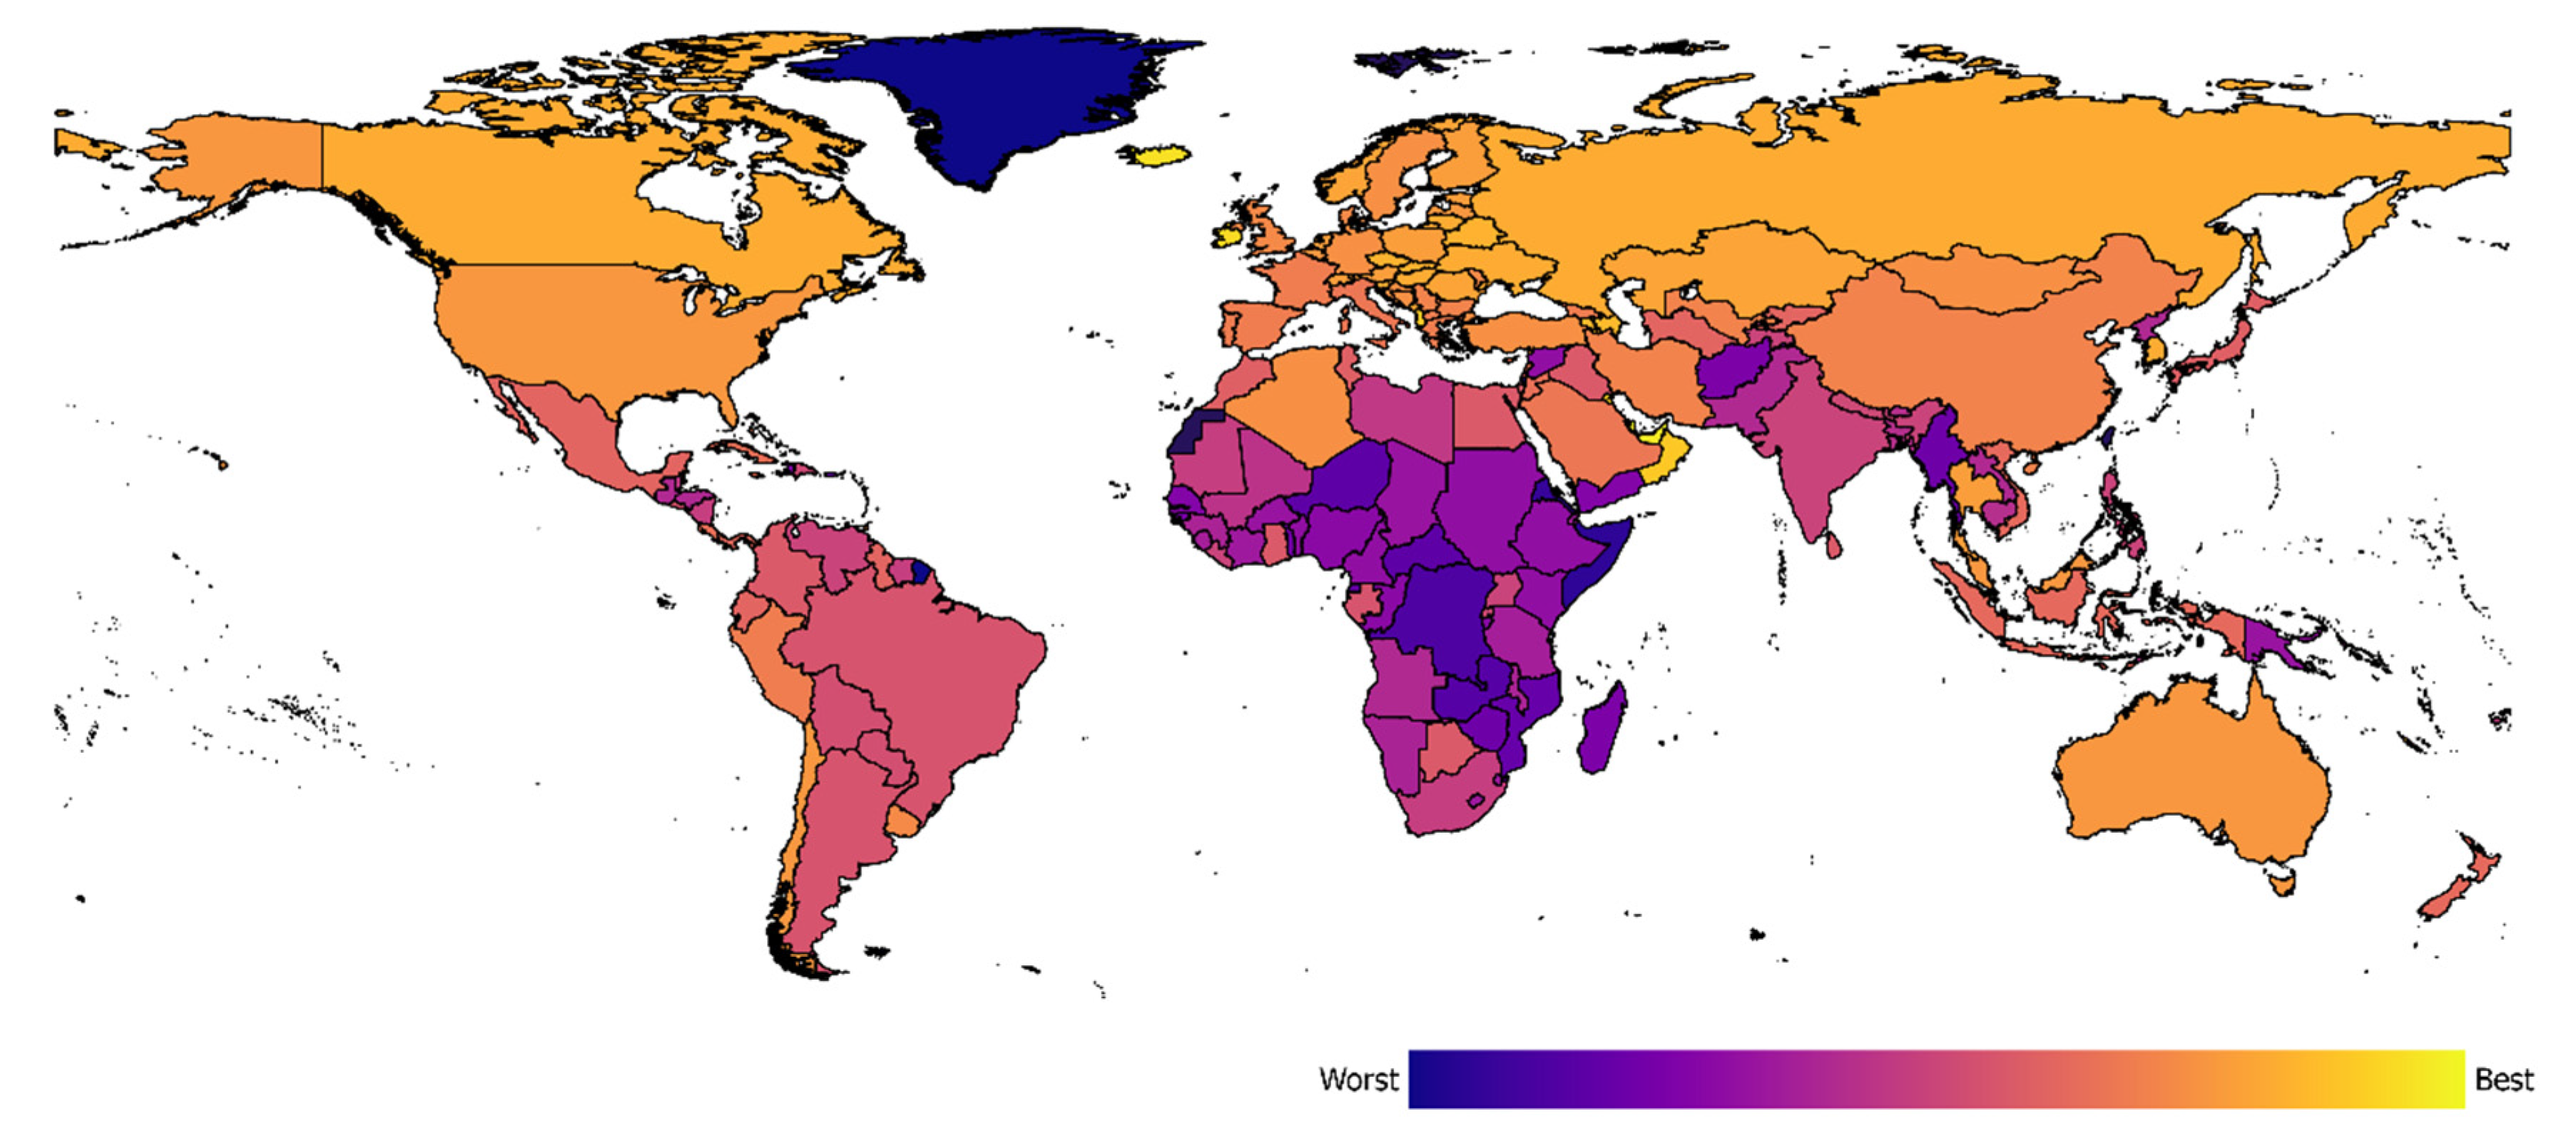
Table 1.
Energy security indicators forming the parameters and dimensions for the energy security index.
Table 1.
Energy security indicators forming the parameters and dimensions for the energy security index.
| Dimensions | Parameters | Indicators | Unit | Normalisation |
|---|---|---|---|---|
| A | A1 | Total available resource of fossil fuel and potential renewables [41,42] | TWh | Max-min |
| A2 | Population [43] | Persons | Dividing by the world’s population | |
| A3 | Number of airports [44] | Number | Dividing by the maximum in the world | |
| D | D1 | Simpsons Diversity Index of sources [41] | Percentage | Already normalised |
| D2 | Simpsons Diversity Index of carriers [41] | Percentage | Already normalised | |
| D3 | 1: Simpsons Diversity Index of Technologies [45] 2: Simpsons Diversity Index of Transportation [46] | Percentage | Already normalised | |
| D4 | Simpsons Diversity Index of consumers [41] | Percentage | Already normalised | |
| Co | Co1 | 1: Diesel prices [47] 2: Weighted average price of power demand [42] | 1: USD/litre 2: €/kWh | Dividing by the maximum in the world |
| Co2 | Income at risk due to power outage (income loss) [48,49] | €/capita | Dividing by the maximum in the world | |
| Co3 | LCOE total [42] | €/MWh | Max-min | |
| TE | TE1 | 1: Number of patents in force by the filling office [50] 2: Scientific and technical journal articles [51] | Number | Dividing by the highest |
| TE2 | Supply efficiency [42] | Percentage | Already normalised | |
| TE3 | Energy intensity level of primary energy [52] | (MJ/USD2011 PPP GDP) | Dividing by the maximum | |
| TE4 | Fuel economy [53] | (Litres of gasoline equivalent)/100 km, WLTC | Max-min | |
| Lo | Lo1 | Area [54] | km2 | Dividing by the worlds area |
| Lo2 | Distance between production and consumption [55,56] | km | Max-min | |
| Lo3 | Energy use per area [57] | kWh/km2 | Dividing by the highest | |
| Lo4 | Terrestrial and marine protected areas [58] | Percentage | Dividing by the highest | |
| Lo5 | 1: Trade (% of GDP) [59] 2: KOF Globalisation index [60] | Percentage | Already normalised | |
| Lo6 | Population density [43,54] | Persons/km2 | Dividing by the largest country | |
| Lo7 | 1: Number of countries with shared borders [44] 2: Seaports infrastructure [44] 3: Total renewable surface water [61] | 1: Number 2: Scored number 3: m3/(year·km2) | Dividing by the maximum | |
| Lo8 | Industrial added values [62] | USD/km2 | Dividing by the second highest | |
| T | T1 | Life expectancy at birth [63] | Years | Max-min |
| T2 | 1: Electrical outages [49] 2: Average weighted age of power plants [45] | 1: Days 2: Years | 1: Dividing by the maximum in the world 2: Max-min | |
| T3 | Number of years that are needed to achieve 100% renewable electricity output [64,65] | Years | Longest allowed time | |
| R | R1 | Resilience Index [66] | Percentage | Already normalised |
| E | E1 | Ecological footprint (number of earth required) [67] | Number | Max-min |
| E2 | CO2 intensity [68] | kg per kWh energy use | Dividing by the maximum in the world | |
| E3 | Total GHG emissions excluding land-use change and forestry per GDP [48,69] | MtCO2eq/USD | Dividing by the highest in the world | |
| E4 | Temperature anomalies [70] | Celsius | Dividing by the highest in the world | |
| E5 | Water stress [71] | Percentage | Already normalised, values more than 100% set to 100% | |
| H | H1 | 1: Health expenditure [72] 2: Mortality rate, infant [73] | 1: Percent of GDP 2: Number | 1: Optimal value 2: Dividing by the highest in the world |
| H2 | Number of deaths attributed to cancer in population [74] | Percentage | Dividing by the maximum in the world | |
| Cu | Cu1 | 1: Poverty headcount ratio at national poverty line [75] 2: GINI index [76] 3: Population ages 15–64 [77] 4: Coverage of social protection and labour programs [78] | 1: Percentage of population 2: Percentage 3: Percentage of population 4: Percentage of population | 1: Already normalised 2: Already normalised 3: Max-min 4: Already normalised |
| Cu2 | 1: Energy use per capita [57] 2: Air transport, passengers carried per capita [79] 3: Food supply (crops, livestock and fish) [80] 4: Human Development Index [81] | 1: kWh/capita 2: Number per capita 3: g/capita/day 4: Percentage | 1: Dividing by the maximum in the world 2: Dividing by the maximum in the world 3: Dividing by the highest in the world 4: Already normalised | |
| Li | Li1 | Citable documents [82] | Number | Dividing by the highest in the world |
| Li2 | 1: Expenditure on education as percentage of total government expenditure [83] 2: Research and development expenditure (percentage of GDP) [84] | Percentage | Dividing by the highest in the world | |
| Li3 | Percentage of tertiary graduates from science, engineering, manufacturing and construction programmes [85,86] | Percentage | Dividing by the highest in the world | |
| Em | Em1 | Employment in the power sector [87] | Jobs/TWhel | Max-min |
| Em2 | Unemployment (percentage of total labour force) [88,89] | Percentage | Dividing by the maximum | |
| P | P1 | 1: Democracy index [90] 2: Fragile States Index [91] 3: Political stability/absence of violence and terrorism (percentile ranking) [92] 4: Polity data series [93] 5: Human freedom index [94] 6: Freedom in the world [95] | 1: Percentage 2: Score 3: Percentage 4: Score 5: Percentage 6: Percentage | 1: Already normalised 2: Dividing by the maximum possible 3: Already normalised 4: Theoretical max-min 5: Already normalised 6: Already normalised |
| P2 | 1: Subsidies and other transfers (percentage of expense) [96] 2: Regularity indicator for sustainability (RIES) [97] | Percentage | Already normalised | |
| P3 | 1: Rule of law [92] 2: Corruption Perceptions Index (CPI) [98] | Percentage | Already normalised | |
| M | M1 | Energy consumption in military sector [57,99] | kWh | Dividing by the maximum |
| M2 | 1: Military expenditure (percentage per GDP) [99] 2: Active armed force (percentage of the population) [100] | Percentage | 1: Max-min 2: Dividing on the maximum in the world | |
| M3 | 1: Share of coal production to the world total [41] 2: Share of oil production to the world total [41] 3: Share of gas production to the world total [41] | Percentage | Dividing by the maximum in the world | |
| M4 | 1: Energy imports, net (percentage of energy use) [101] 2: Income from net exporting minerals classification [102] | 1: Percentage 2: USD | 1: Dividing by the highest absolute 2: Dividing by the maximum in the world | |
| Cy | Cy1 | Individuals using the Internet (percentage of population) [103] | Percentage | Already normalised |
| Cy2 | Global cybersecurity index - technical [104] | Score | Already normalised | |
| Cy3 | Global cybersecurity index - capacity building [104] | Score | Already normalised |
© 2020 by the authors. Licensee MDPI, Basel, Switzerland. This article is an open access article distributed under the terms and conditions of the Creative Commons Attribution (CC BY) license (http://creativecommons.org/licenses/by/4.0/).
Share and Cite
MDPI and ACS Style
Azzuni, A.; Breyer, C. Global Energy Security Index and Its Application on National Level. Energies 2020, 13, 2502. https://0-doi-org.brum.beds.ac.uk/10.3390/en13102502
AMA Style
Azzuni A, Breyer C. Global Energy Security Index and Its Application on National Level. Energies. 2020; 13(10):2502. https://0-doi-org.brum.beds.ac.uk/10.3390/en13102502
Chicago/Turabian StyleAzzuni, Abdelrahman, and Christian Breyer. 2020. "Global Energy Security Index and Its Application on National Level" Energies 13, no. 10: 2502. https://0-doi-org.brum.beds.ac.uk/10.3390/en13102502
Note that from the first issue of 2016, this journal uses article numbers instead of page numbers. See further details here.