Reviewing Usage, Potentials, and Limitations of Renewable Energy Sources


Department of Economics, University of Thessaly, 38333 Volos, Greece
*
Author to whom correspondence should be addressed.
Energies 2020, 13(11), 2906; https://0-doi-org.brum.beds.ac.uk/10.3390/en13112906
Submission received: 20 May 2020
/
Revised: 30 May 2020
/
Accepted: 3 June 2020
/
Published: 5 June 2020
Abstract
:The world’s ever-increasing population, combined with economic and technological growth and a new, modern way of life, has led to high energy demand and consumption. Fossil fuels have been the main energy source for many years, but their use has many negative impacts on the environment. This has made the transition to renewable energy sources necessary in order to address climate change and meet the 1.5 °C goal. This paper is a review of the different types of renewables, their potentials and limitations, and their connection to climate change, economic growth, and human health. It also examines consumers’ willingness to pay for renewables in different countries, based on the existing literature. IEA (International Energy Agency) data are analyzed, concerning renewables’ current use, the evolution of their usage, and forecasts about their future usage. Finally, policies and strategies are recommended in order to address climate change and fully integrate renewables as a sustainable energy source.
Keywords:
renewable energy; usage; economic growth; climate change; willingness to pay; human health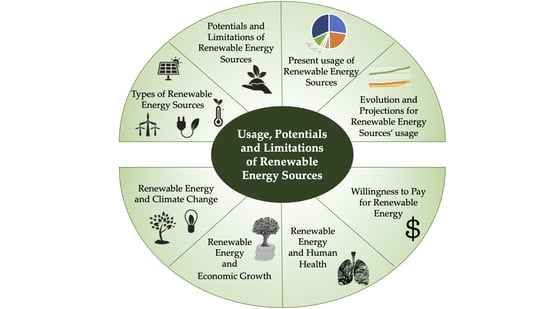
1. Introduction
Energy is vital for the satisfaction of basic human needs. It is essential for human health, everyday living, communications and mobility and, in general, economic and social development and well-being [1]. World’s energy needs have increased rapidly in the recent years and, as populations grow, combined with the economic and technological growth, they are expected to increase even more. The global population is predicted to rise to approximately 9 billion by 2050 [2]. According to the U.S. Energy Information Administration (EIA), between 2018 and 2050, the world energy consumption is predicted to rise by nearly 50% [3].
Since the industrial revolution and until now, fossil fuels have been the main energy source, and their usage has grown to nearly 10,000 million tons of oil equivalents. In 2010, fossil fuels provided about 80% of all primary energy worldwide [4] and they are expected to be used in the same significant amount in the future to meet the global energy needs [3]. More specifically, fossil fuels are expected to constitute 78% of total energy consumption worldwide in 2040 [5].
The negative impact of fossil fuels on the environment has been known for a long time. Their burning and usage lead to large emissions of greenhouse gases into the atmosphere, which is a direct cause of global warming and climate change [6]. According to the EPA (United States Environmental Protection Agency), 65% of total greenhouse gas (GHG) emissions are carbon dioxide emissions (CO2) that come from fossil fuel and industrial processes [7].
The United Nations Framework on Climate Change (UNFCCC) in 1992 set the foundations for the reduction of GHG emissions, stating that a reduction is essential in order to avoid catastrophic consequences on the environment [6]. In addition, the United Nations proposed the 17 Sustainable Development Goals in 2015 which include, among others, the topics of clean energy, climate change, and GHG emissions, setting a target of implementing GHG emissions reduction policies and strategies [8].
One of the main reduction measures is the limitation of fossil fuels’ use and the transition to renewable sources [9], as energy is considered to be a key factor in sustainable development [10]. In addition, the limited sources of fossil fuels and their high costs make the transition to renewable sources more essential in order to reassure energy security and meet the energy demand [11]. Renewable energy has an average share of 17.5% in total final energy consumption worldwide over the period 1990–2015 and it is expected to be the fastest growing form of energy in the future [3].
This paper examines the potentials and limitations of renewable energy sources and the advantages and disadvantages of their usage in relation to the environment, climate change, and economic growth. It also presents the customers’ Willingness to Pay (WTP) for renewable energy sources in different countries, as it was calculated by other studies in the recent literature. Finally, it analyzes data that concern the evolution of their usage in the past and the projections of their future usage.
2. Renewable Energy Sources
As renewable energy sources (RES) or alternative energy sources are considered all the energy sources that can be renewed, produce energy over and over, and are inexhaustible [12]. RES include solar energy, wind energy, bioenergy, geothermal, hydropower, and ocean energy [1] and they can be used for power generation, transportation, domestic use, urban heating, etc. [12].
2.1. Potentials and Limitations
Renewable energy sources have a significant number of potentials and advantages. They can improve the environmental quality, since they produce little or no GHG emissions. They distribute energy equally and solve energy security and energy poverty problems, since they can be found in almost every place on earth, while they can be considered as a reliable energy source, compared to fossil fuels. Also, they have a low operation cost and economic benefits and, at a macroeconomic level, they support the employment and stabilize energy prices. They can improve living conditions in a household and can cover most energy needs without running out [13]. In addition, they can have a positive impact on human health, as studies have shown that, because of their little GHG emissions, they do not lead to a large number of health problems, compared to fossil fuels [14].
The main disadvantages of renewable energy sources include their higher initial cost, that can be excessive and a deterrent for users, as well as the cost of storing systems, which is also quite high. Also, renewable energy depends on weather conditions, and unpredictable weather conditions for a long time period could lead to energy deficiency [1]. In addition to that, large land areas are required in order to install the necessary renewable energy technology. According to Brook and Bradshaw [15], renewable energy sources could provide around 50% of the total energy required in the United States, but more than 17% of the land would have to be used [5].
Despite the small obstacles that need to be overcome, renewable energy sources are considered to be the best option in order to meet the world’s energy demands, replace the excessive use of fossil fuels, and satisfy the 7th Sustainable Development Goal (SDG) for affordable and clean energy [1].
2.1.1. Solar Energy
Solar energy refers to the energy that comes from the light of the sun or its heat [16]. It is generated either in photovoltaics (PV) or in concentrated solar power (CSP) systems. PVs are panels that can convert sunlight into electricity fast, can be used for personal use and on a bigger scale, and are one of the most important modern renewable energy technologies. They are expected to have a very important role in future energy and electricity generation. CSPs use mirrors to collect solar rays which heat fluid, and the resulting steam moves a turbine to produce electricity [17]. Sun can produce energy endlessly, which means that solar energy could potentially eliminate the use of fossil fuels and meet all energy demands [18]. More specifically, sun can provide “more than 7500 times the world’s total annual primary energy consumption of 450 EJ”, according to the World Energy Council [19]. In addition, solar energy does not pollute and does not harm the environment and human health, while it could provide energy security, since solar power is available everywhere in the planet [16].
Even though the sun generates an infinite amount of energy, the energy used that comes from solar sources is estimated at about 0.04%. The reason for that is related to its cost, since photovoltaic panel installation still is expensive, despite the new technological developments and even though the cost has decreased a lot in the last decade. Even though it has high efficiency and low operating costs that would be economically beneficial in the future, the initial cost and the cost of the energy storing system are still quite high [20].
2.1.2. Wind Energy
Wind energy produces electricity by converting the kinetic energy of air to mechanical and then to electrical energy [11] through wind turbines or wind energy conversion systems. Turbines’ blades rotate pushed by the wind and then turn a connected turbine, producing energy that depends on turbine’s size and blades’ length [21]. In Europe, new wind installations accounted for 15.4 GW in 2019, 27% more compared to 2018, and wind energy fulfilled 15% of EU’s total electricity demand in 2019 [22].
Wind exists in every place in the world, and that makes wind energy available in many locations, providing energy security [1]. In addition, wind energy does not harm the environment, since it does not produce GHG emissions and does not pollute [20], while it seems to have one of the smallest carbon footprints, compared to other forms of energy. It is also considered to be beneficial for rural areas, since their installation in such areas would lead to economic growth.
Wind energy has many positive impacts and is one of the cleanest forms of energy, but there are certain constraints that should be taken into consideration. The main negative impact is on wildlife, directly and indirectly, especially on migratory birds (even though it is considered as the energy source most compatible with animals) [23]. Some other negative impacts include noise, interference with telecommunication signals, and visual unattractiveness [20].
2.1.3. Bioenergy
Biomass energy or bioenergy refers to that form of energy that is produced from the conversion of biomass, which can come directly from land products or from other crop residues [11]. More specifically, food crops, residues from agriculture and municipal or industrial wastes, grassy or woody plants, and even methane fume from landfills can be used for biomass energy production [20]. Also, modern bioenergy uses liquid biofuels, biogas, as well as bio-refineries and other technologies [24].
Bioenergy is renewable, can be produced everywhere, and can be used for electricity, heating, and transportation [25]. Because of these potentials and its wide usage, approximately 75% of the world’s renewable energy involves biomass energy [24]. In addition, it is carbon-neutral, which means that it does not cause any net addition of carbon dioxide to the atmosphere [26]. Bioenergy has also socioeconomic benefits, since its production can stimulate rural employment and income, while it can contribute to the reduction of poverty in developing countries [25].
As for the disadvantages, biomass energy has a low energy density and is not as efficient as fossil fuels [20]. Also, despite it being carbon-neutral, it seems to have a negative environmental impact, since it is often linked to soil and vegetation degradation and deforestation [1]. Bioenergy has great potential, if its disadvantages can be well managed and minimized [27].
2.1.4. Geothermal Energy
Geothermal energy refers to energy extracted from the interior of the earth with natural processes [1]. These natural processes include water and steam, which can transfer geothermal energy to the surface of the earth. There are different technologies that can be used, such as district heating, geothermal heat pumps, hydrothermal reservoirs, etc. Enhanced Geothermal Systems (EGS) are new technologies that are currently being developed [28].
Geothermal energy is considered a sustainable, reliable, and cost-effective source of energy [11], which could be developed everywhere. It was initially used by individuals on a small scale and recently, its usage has started to take bigger dimensions. It is friendly to the environment and has high capacity and efficiency [29]. Also, its use is considered to increase energy security and improve living standards.
The main negative impacts that arise from the use of geothermal energy include the release of certain GHG into the atmosphere, even though their amounts are significantly lower compared to those released by fossil fuels. In addition to that, and even though geothermal energy is considered renewable, the possibility of its depletion and overexploitation has been discussed due to the fact that its replenishment depends on many different factors. Finally, the high initial costs may discourage the users to invest on it [30].
2.1.5. Hydropower
Hydropower is the energy created from moving water, which can be converted into electricity [11]. Hydropower plants can be with or without dams and reservoirs: hydropower with dams has a large storage capacity and can produce energy on a bigger scale, whilst hydropower without dams is recommended for smaller needs and is considered an even more environmentally friendly option [31].
Hydropower is in general a clean energy source that does not harm the environment, since it does not produce waste or GHG emissions, can be fast and easily upgraded, and has a large potential [1]. It is a reliable energy source that has low operating costs and stimulates the socioeconomic development [32], while it has high efficiency and can adjust to different conditions [20]. Hydropower has one of the best conversion efficiencies among energy sources, which reaches 90% (water to wire) [11]. In addition, it provides about 97% of the electricity that is generated by renewable sources [33].
On the other hand, hydropower can interfere with aquatic habitats and their populations and requires monitoring and management of the water quality [32]. Also, it depends on precipitation, and the availability of the water cannot be controlled. Finally, cost-effective technological solutions should be developed, since the initial costs remain really high [20].
2.1.6. Ocean Energy
Ocean energy refers to the energy stored in the ocean, which comes from the interaction between wind and waves [1]. It can be divided into six categories: ocean wave, tidal range, tidal current, ocean current, ocean thermal energy, and salinity gradient [34]. The most common form is wave energy that is produced when a strong wind creates a large wave [1], whose energy is captured by converters and converted into electricity [35]. Ocean energy has a low environmental impact, since it does not produce emissions or waste, it is always available and abundant, and can usually be predicted [36].
The disadvantages of ocean energy include mainly the high costs of the necessary technology. Many issues related to it still need to be discussed, especially its socioeconomic and environmental impacts [37]. In general, the technology for the exploitation of ocean energy is not fully developed yet, and more research is required [36].
2.2. RES and Climate Change
Climate change is an issue that has taken on great dimensions in the last decades and has become a matter of concern for all scientists and policy-makers around the world [38]. The global energy supply and demand have negative environmental impacts, being linked to global warming, air pollution, deforestation, and ozone depletion [10]. Recent data show that fossil fuels are responsible for the majority of GHG emissions that come from human activities [39]. As it was mentioned before, it is considered that a reduction in the use of fossil fuels and a transition to renewable energy sources are among the most effective solutions to climate change.
Renewable energy sources can provide energy with zero or little direct GHG emissions compared to fossil fuels and can ensure a sustainable energy supply [12]. In addition, they do not deplete over time, and research shows that they could provide more than enough energy to meet the global demand. Therefore, they are considered an ideal solution to meet the target of GHG emissions mitigation and to limit the global temperature rise to below 2 °C [40].
Of course, there is a two-way relationship between RES and climate change. According to the IPCC (Intergovernmental Panel on Climate Change) [39], climate change could have an effect on renewable energy sources, since they depend on climate and nature. For instance, climate change could have a negative impact on biomass production and, therefore, biomass energy, and affect its potentials. On the other hand, it is considered to have a slightly positive impact on hydropower. Its impacts on solar, geothermal, and ocean energy are expected to be small and not significant.
2.3. RES and Economic Growth
A higher energy consumption can lead to a greater economic growth, whereas a developed economy could use energy more efficiently and, therefore, favor a reduction in total energy consumption [41]. The possibility that a reduction in CO2 emissions and, therefore, in energy consumption could have a negative impact on the economic growth is something that concerns the scientific community, and lots of researches have been focusing on the causality among economic growth, energy consumption, fossil fuels usage, renewable energy usage, and GHG emissions.
A plethora of studies have shown that there is a bidirectional causality between economic growth and renewable energy consumption. Apergis et al. [42] calculated that a 1% increase in renewable energy consumption in 20 OECD (Organisation for Economic Co-operation and Development) countries (over the period 1985-2005), would have led to a 0.76% increase in their real GDP (Gross Domestic Product). Inglesi-Lotz [43], studying all the OECD countries over the period 1990–2010, estimated that a 1% increase in renewable energy consumption would have led to a 0.105% increase in their GDP. Bhattacharya et al. [44], in their study of 38 countries over the period 1991–2012, found that renewable energy sources could be a significant driver force for economic growth for most countries but also that renewable energy sources could have a negative impact on economic growth in 5 countries, while for 11 eleven countries, they could not establish if renewable energy would have a positive or a negative impact on their economies. Adams et al. [45] examined 30 Sub-Saharan African countries over the period 1980–2012 and estimated that a 10% increase in renewable energy consumption would have led to a 0.27% increase in their economic growth, while a 10% increase in non-renewable energy consumption would have led to a 2.11% increase in their economic growth. The fact that non-renewable energy is more beneficial to the economic growth than renewable energy can be explained by the fact that investments in the field of RES and their technology have just started and their benefits have not been completely reaped. Finally, Halkos and Tzeremes [46], in a study of 25 European countries in 2010, found that the countries’ economic efficiency turns from neutral to positive as RES consumption increases, even though for some cases there was a negative or a neutral effect of RES consumption on their economic efficiency.
There is a rich and constantly growing literature on the linkages between RES and economic growth. Most of the studies indicate that both renewable and non-renewable sources can lead to economic growth and that there is a strong correlation between them. However, it is important that policy decisions are made after studying these relationships, whilst taking into consideration additional factors and contexts that occur in each country individually.
2.4. RES and Human Health
Studies have shown that climate change in general and especially fossil fuels usage can cause a series of serious health problems, through the emission of carbon dioxide, particulate matter, and other pollutants. More specifically, research shows that air pollution can provoke cardiovascular and respiratory diseases [14] and can increase developmental problems in childhood, which may persist into adulthood [47]. According to WHO [48] estimations, each year approximately 7 million people die prematurely, due to the effects of ambient and household air pollution. In addition, the WHO also estimated that the annual economic cost of the impacts of air pollution on health and mortality in 2010 in WHO European Region was US $1.575 trillion. A transition to renewable energy sources could benefit public health. Since RES reduce GHG and other dangerous pollutants emissions, their usage could improve air quality and, therefore, have a positive effect on human health [14].
2.5. RES and Willingness to Pay
To achieve the transition from fossil fuels to renewable energy sources and green electricity, it is important to achieve consumers’ acceptance. According to Sardianou and Genoudi [49], tax deduction is the most popular incentive for consumers to adopt RES, followed by energy subsidies and doubling of the price of conventional sources. It is obvious that financial incentives determine consumers’ decision to transit to RES, and the economic characteristics of households are strong factors that affect consumers’ decisions, too.
WTP for renewable energy sources has been studied in recent literature for different countries and households. For the United States, it has been calculated that the average consumer is willing to pay $162/year (13% increase in their electricity bill) in order to support a national clean energy standard (NCES) that requires 80% of clean energy by 2035 [50]. Also, Mozumder et al. [51] estimated that consumers in southwest USA are willing to pay approximately $10/month (14% increase in their electricity bill) for a 10% share of RES and $25/month (36% increase in their electricity bill) for a 20% share of RES.
In China, according to Zhang and Wu [52], most of the responders are willing to pay for green electricity, and the mean payment ranged from 7.91 to 10.30 yuan/month (US $1.15–1.51/month). Research for Australia indicated that about 83% of the responders are willing to pay for RES, and the mean payment was estimated at $28/quarter [53].
In Germany, research showed that the responders accept to pay for renewable energy and are willing to pay 9.21 eurocent/kWh for an increase from 0 to 33% of the share of RE and 14.4 eurocent/kWh for an increase from 0 to 66% [54]. For Italy, Bigerna and Polinori [55] estimated that the median WTP for green electricity from RES is between €4.62 and €8.05 bimonthly per household, while the results estimated by Hanemann et al. [56] for Spain showed that consumers are willing to pay a €29.91 increase in their monthly bill for green electricity. For an area of Athens in Greece, it was estimated that the WTP for RES being included as sources of electricity is €26.5/quarterly electricity bill [57], while for the island of Crete in Greece, the mean WTP for RES is estimated at €16.33/quarterly electricity bill [58]. Contrariwise, in the UK, it is estimated that the consumers’ willingness to pay is smaller than the average installation costs of RES technologies [59].
Also, according to Sundt and Rehdanz’s [60] study, consumers from Finland and the US seem to express the largest willingness to pay per household and per month when it comes to green electricity generated from renewable sources. They also found that consumers from Chile, Italy, and Germany express the highest willingness to pay per kWh.
3. Renewable Energy Sources Overview
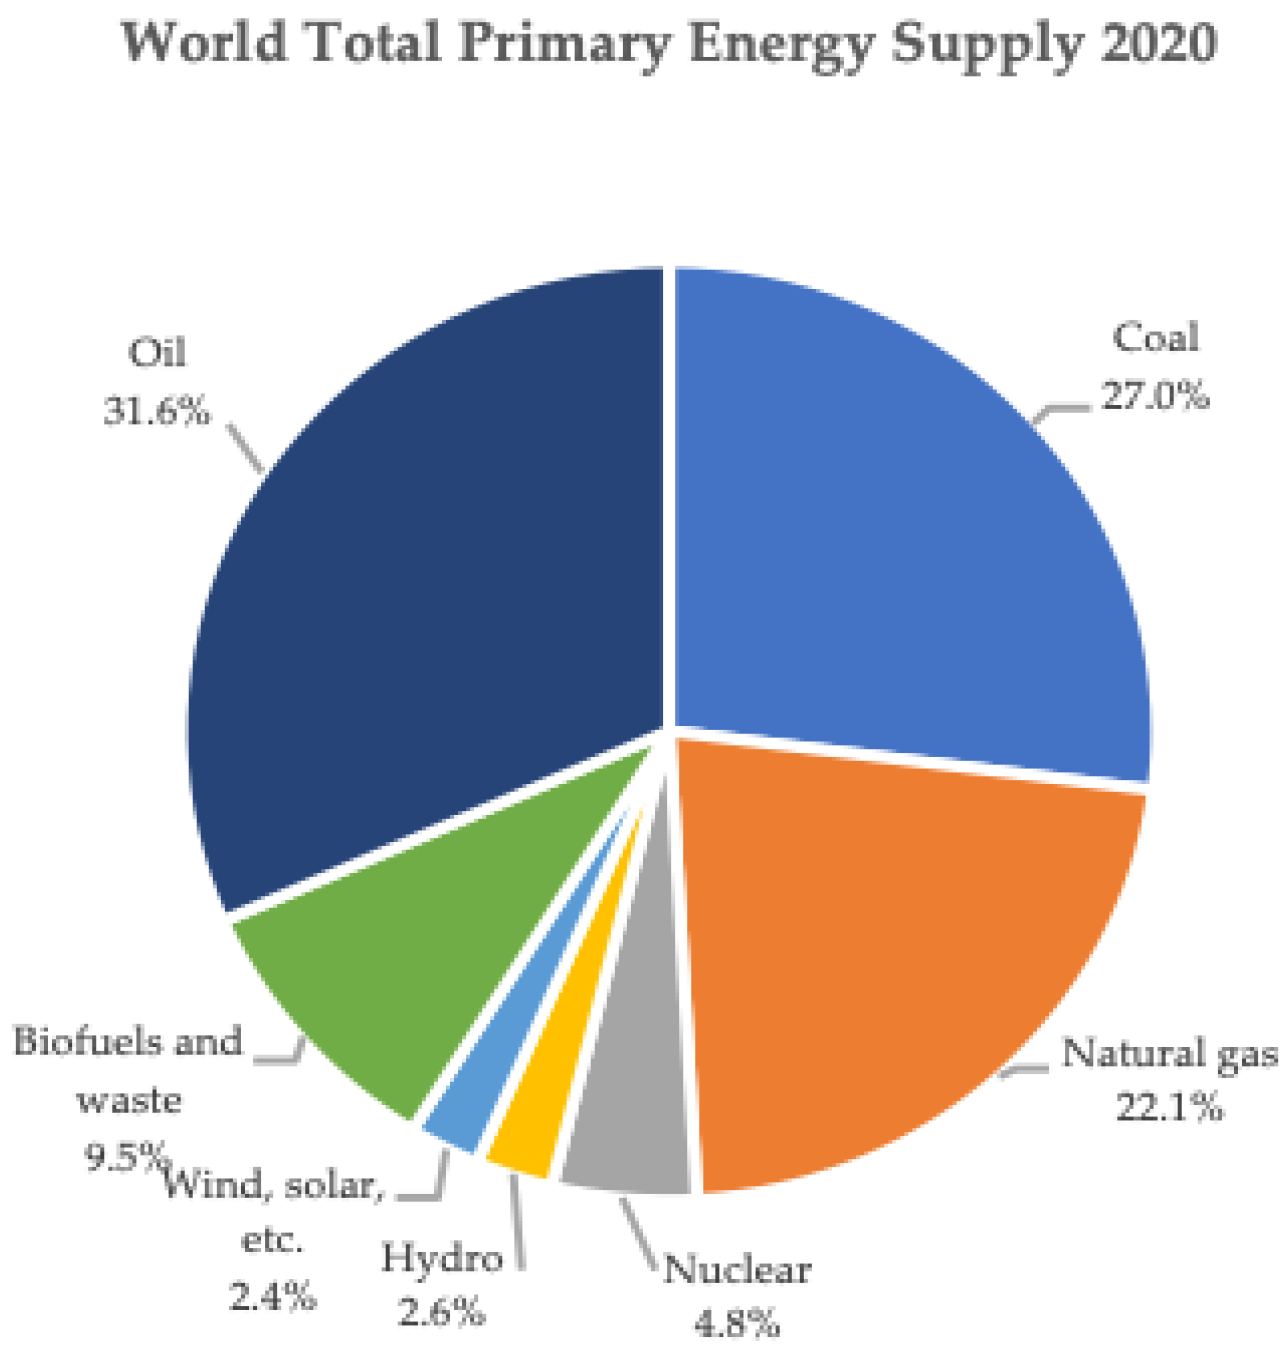
In 2017, renewable energy sources provided 13.9% of the world’s total primary energy supply, according to IEA (International Energy Agency) data [61]. More specifically, biofuels and waste provided 9.5% of the total primary energy supply, hydropower 2.5%, and solar, wind, and other RES 1.8%. Fossil fuels provided more than 80% of the total energy supply (Figure 1).
IEA provided data for the period 1990–2017. To have a better understanding of how energy supply looks like today, in 2020, we used these time series to obtain forecasts for the next three years, relying on exponential smoothing, an appropriate time series analysis technique. The selection of the appropriate forecast method was based on various forecast accuracy measures, like mean absolute percentage error, mean square deviation, etc. (Minitab Statistical Software was used). As Figure 2 shows, the shares of energy supply sources have not changed dramatically, but there seems to be a small increase in the share of renewables. Fossil fuels remain still the number one energy supplier, while renewables provide 14.5% of the world’s energy supply. The share of solar, wind, and other RES increased from 1.8% to 2.4%.
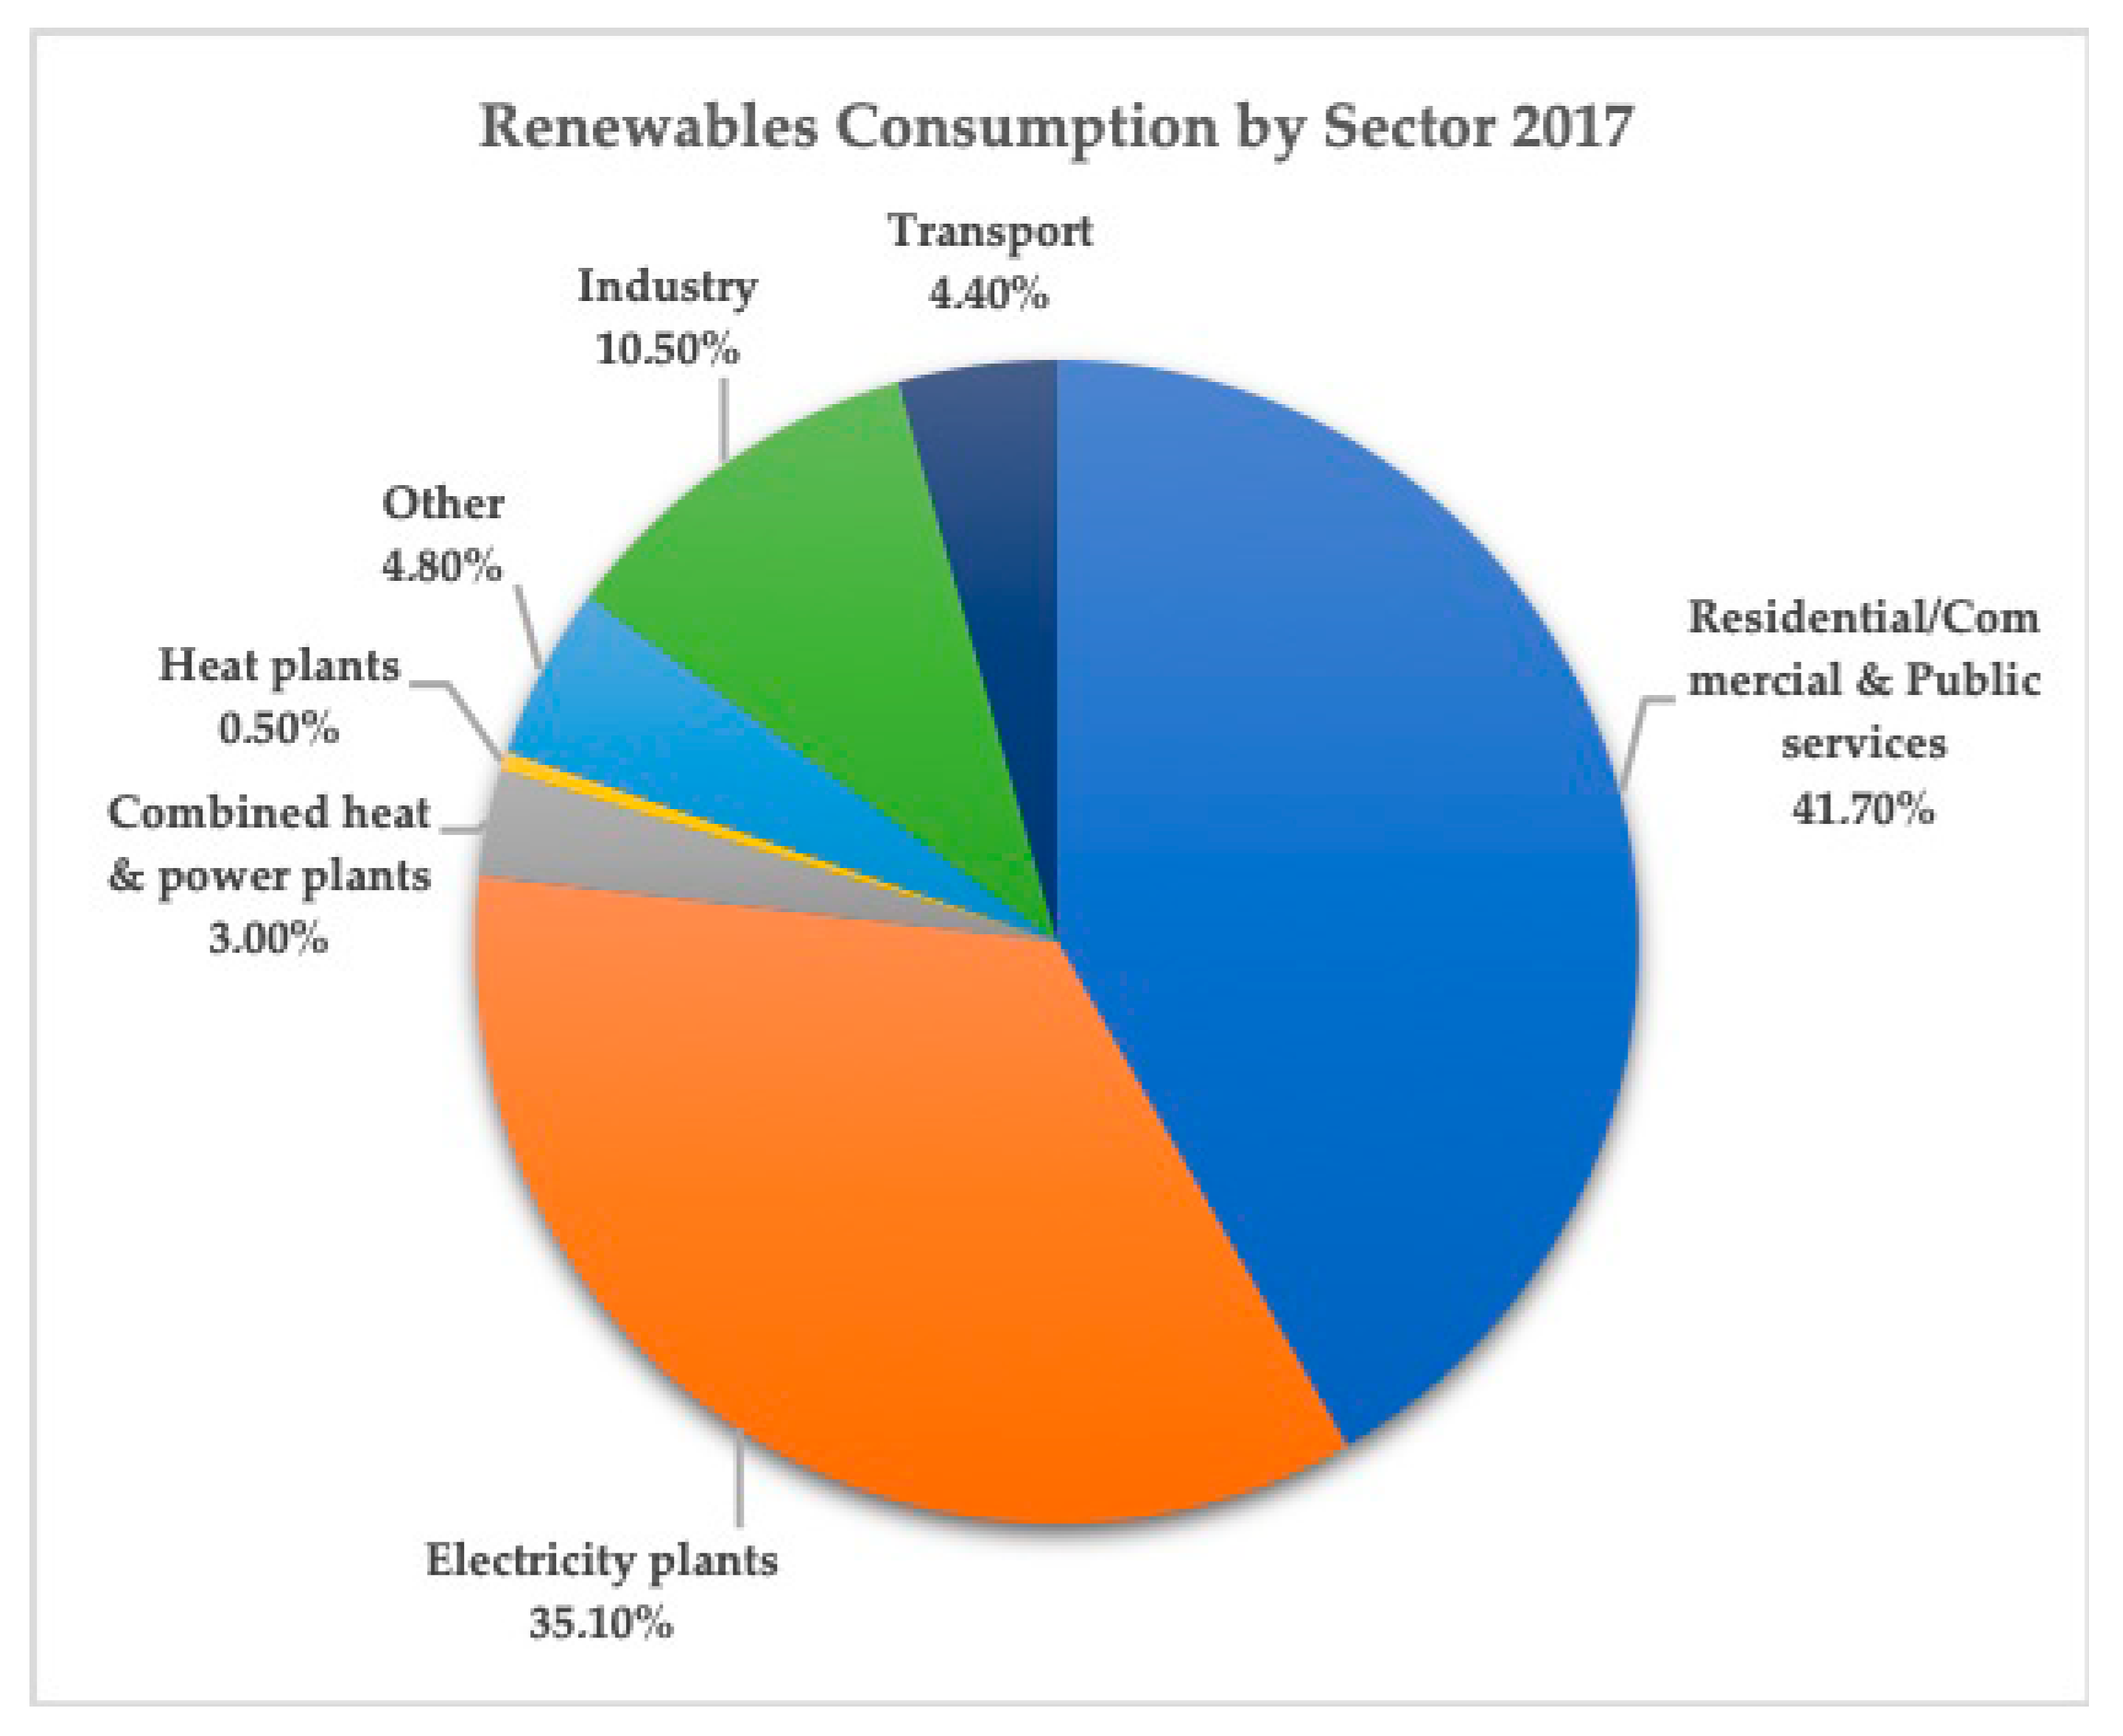
In total, renewable energy sources produced 1.936.923 tonnes of oil equivalent in 2017. These were distributed to different sectors. For instance, 41.7% of total renewable energy supply in 2017 were used in the residential/commercial & public services sector, which also includes the agriculture/forestry, fishing and non-specified industries. A large percentage (35.1%) of renewable energy supply is used in electricity plants (Figure 3).
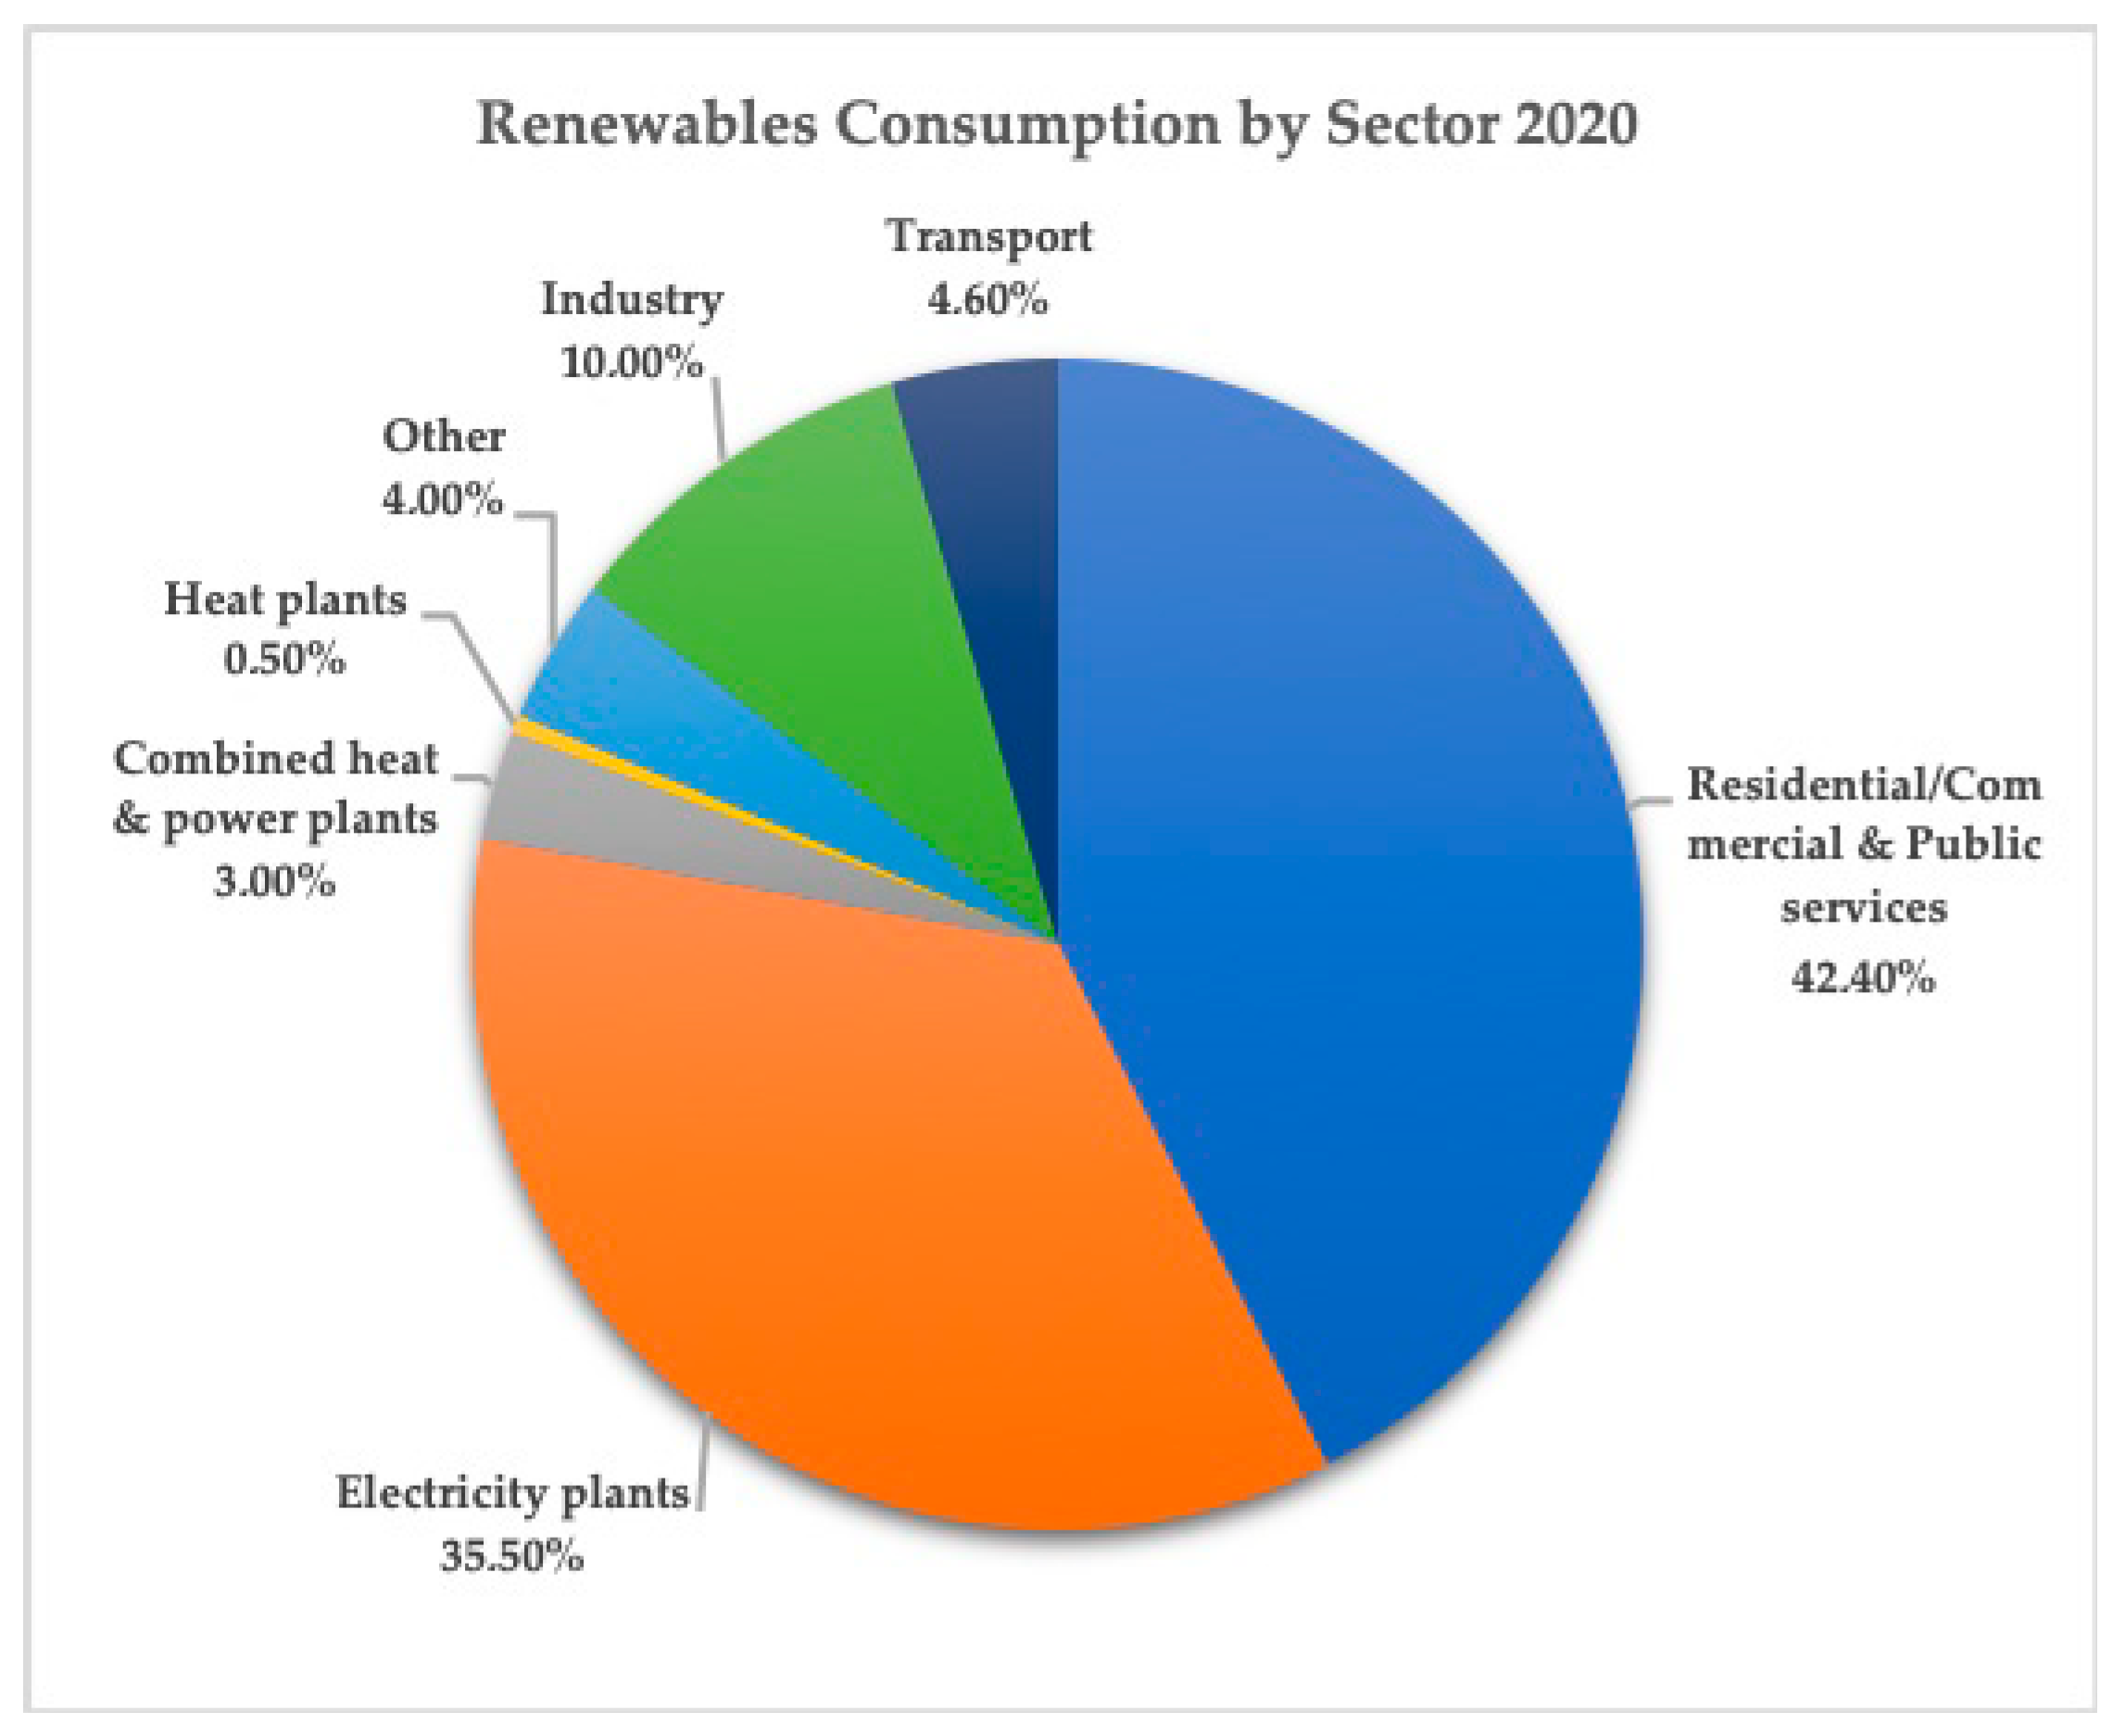
We also obtained forecasts for renewables’ consumption in 2020 based on IEA time series [61], which showed that renewables’ share in transport and in the residential sector increased a little. In general, the biggest renewables’ consumers have not changed (Figure 4).
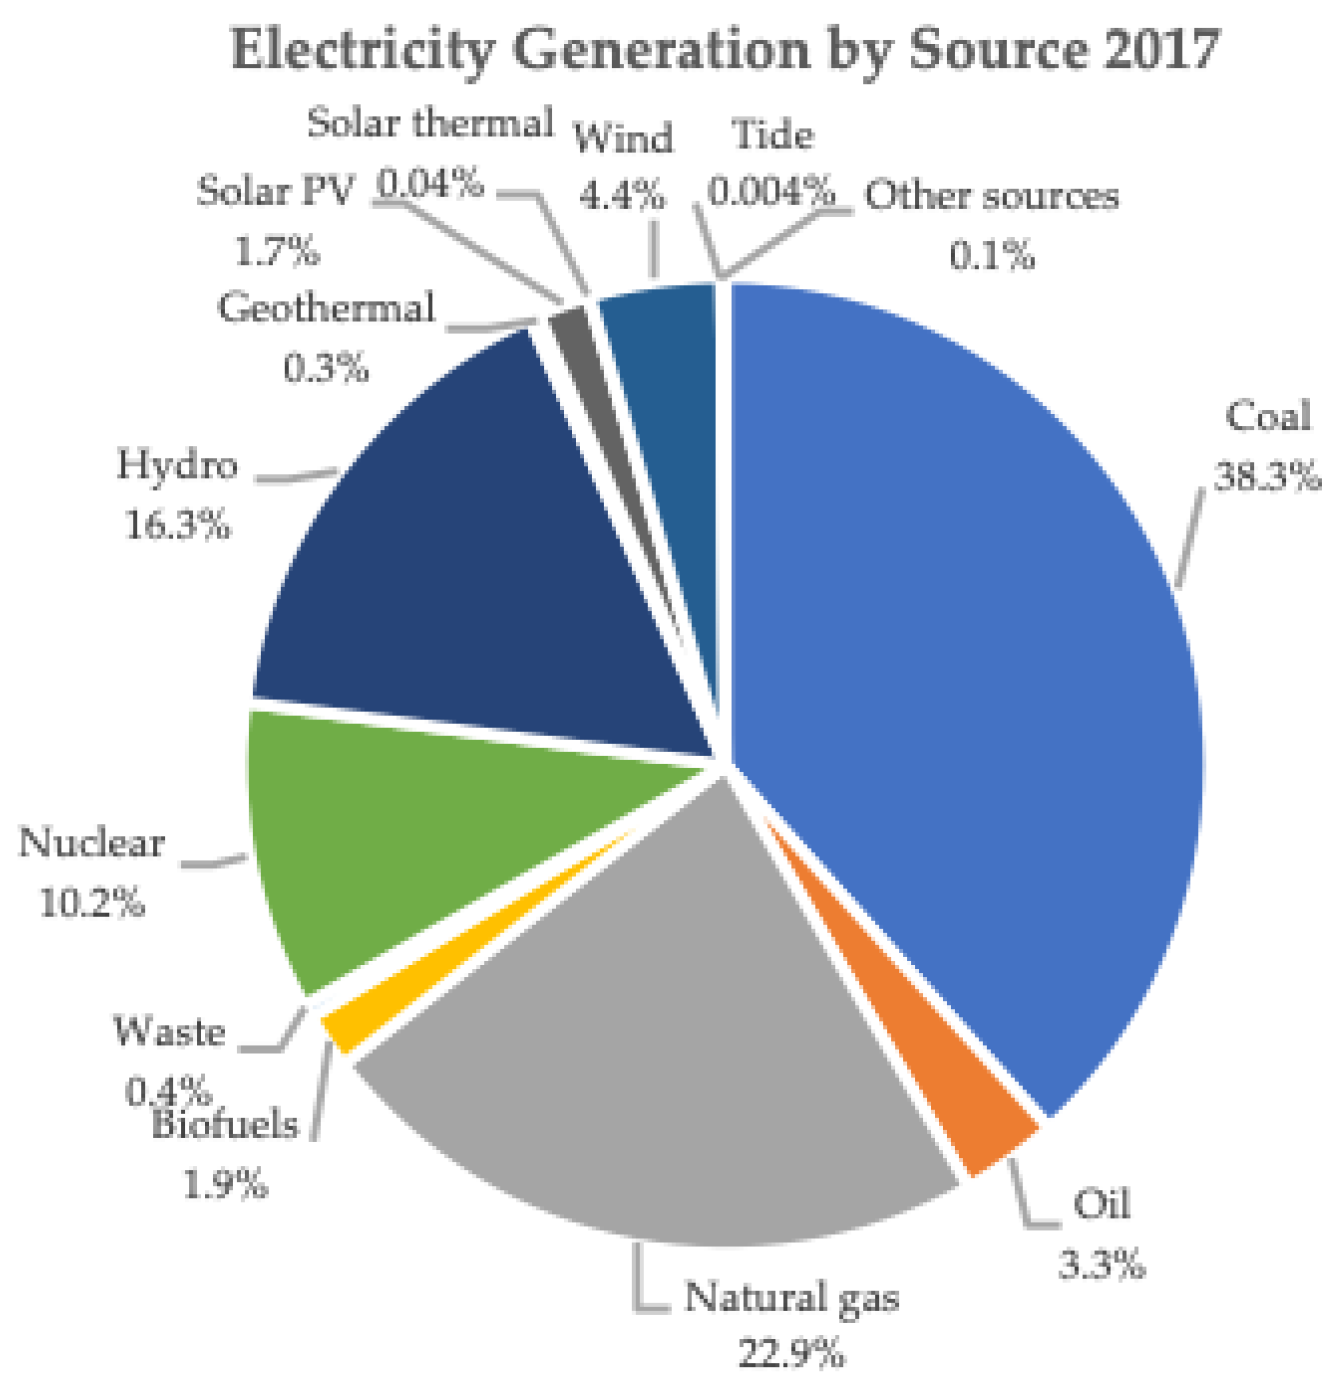
When it comes to electricity generation, fossil fuels provided more than 64% of world’s electricity in 2017, while renewables provided about 25%. Among the renewables, hydropower was the most widely used, since it provided 16.3% of total electricity (Figure 5). Similarly, based on our forecasts, in 2020, fossil fuels will generate most of the world’s electricity, even though the usage of coal seems to be decreasing. Renewables will provide about 27.5% of electricity in 2020; there will be an increase in the share of wind energy and biofuels and a decrease in the share of hydropower, which still remains the most widely used generator of electricity among the renewables (Figure 6).
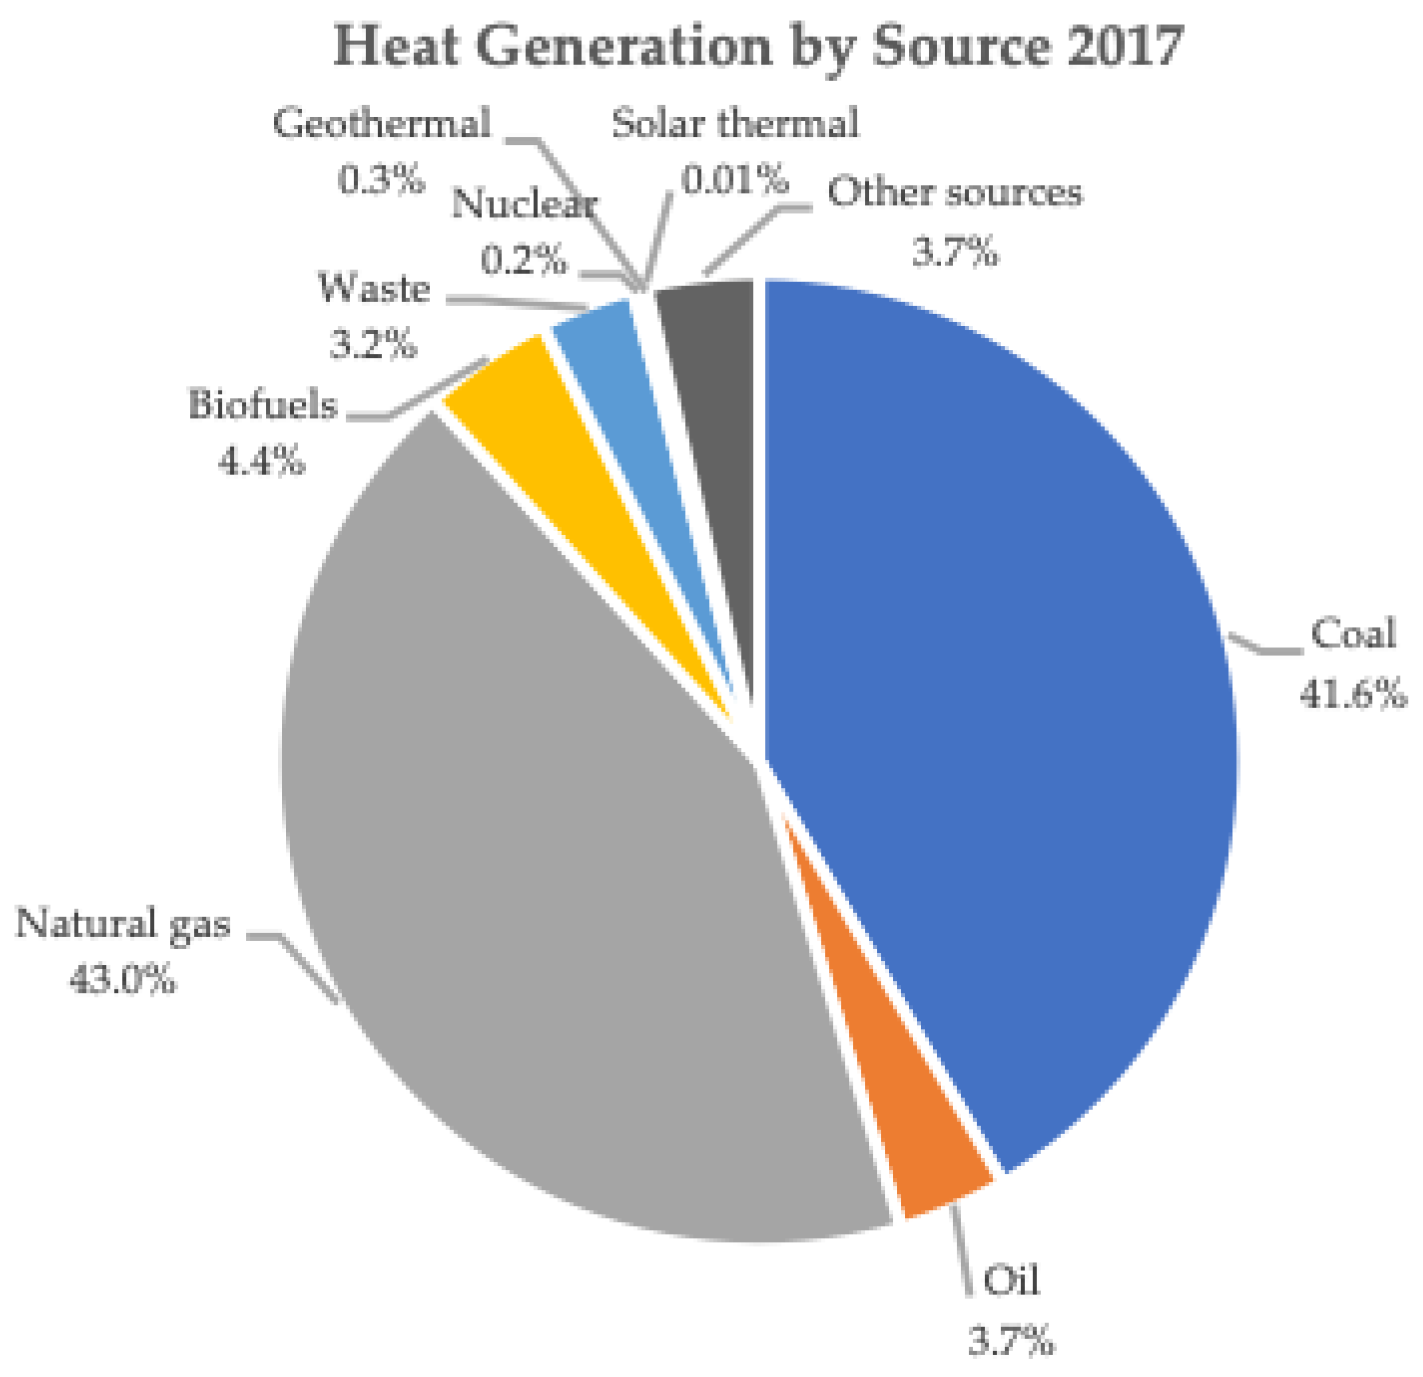
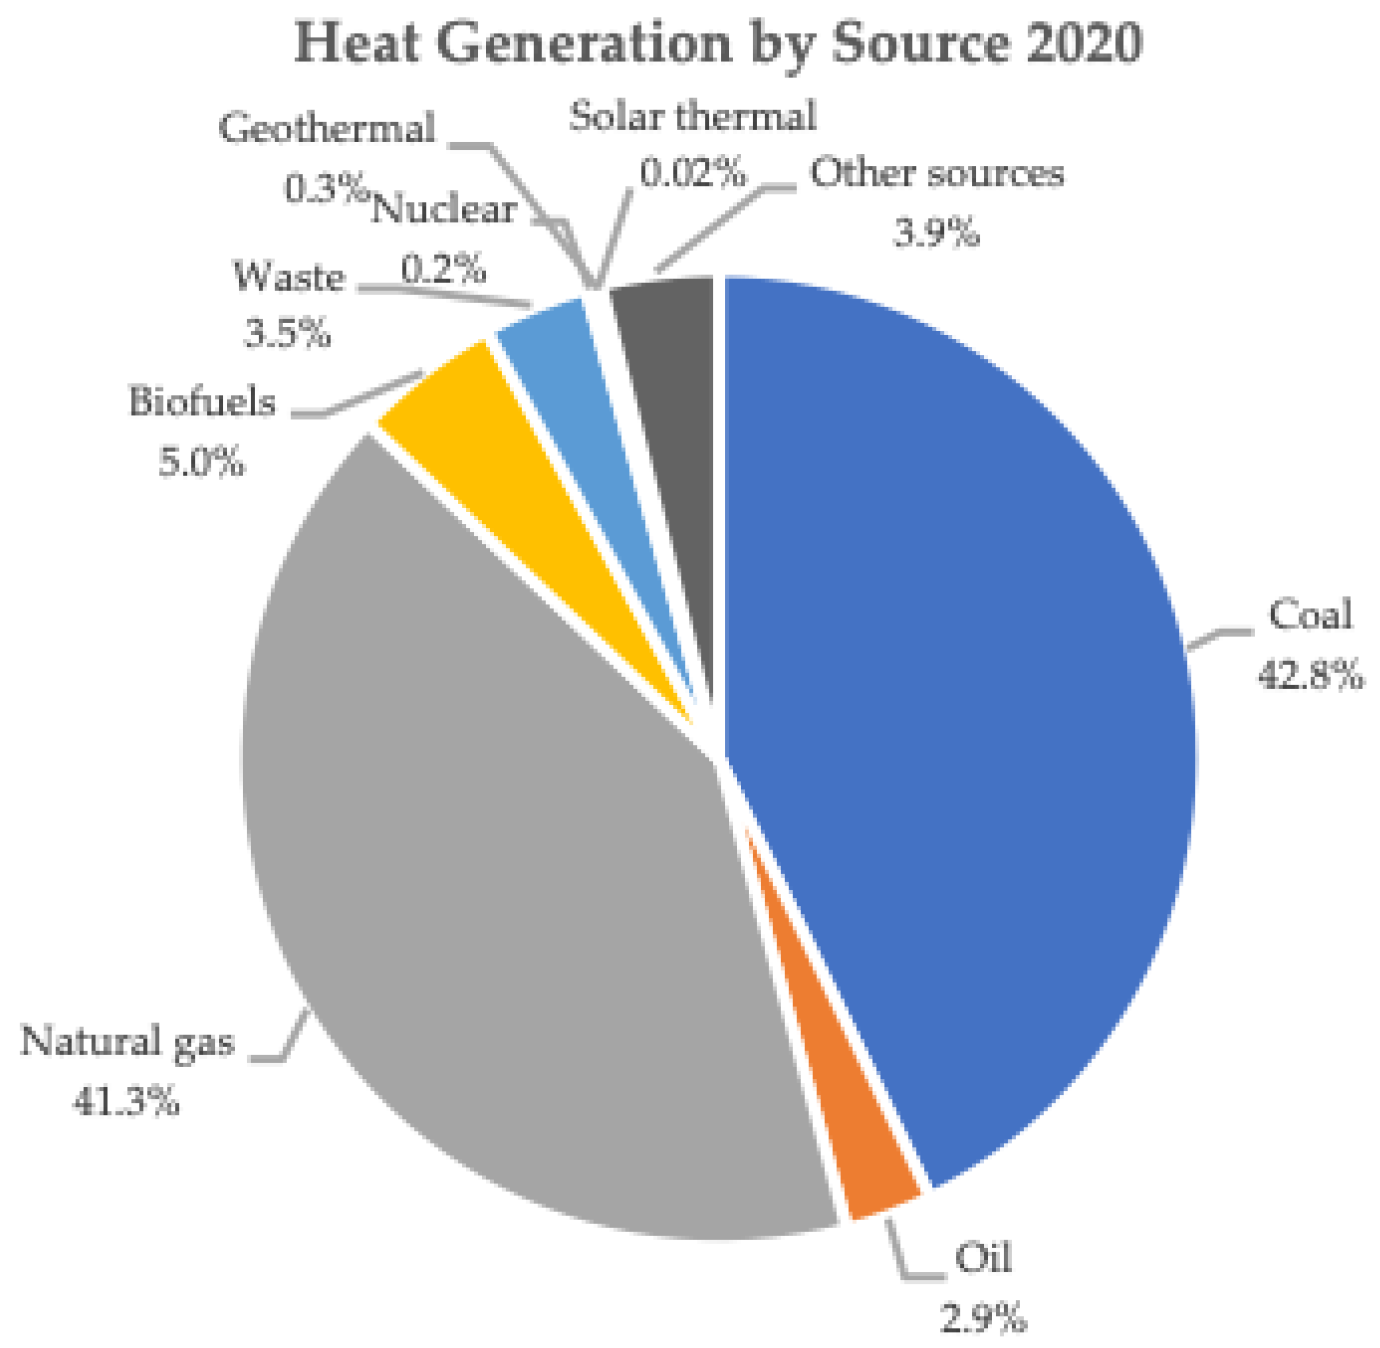
For heat generation, renewables only accounted for about 8% in 2017, while fossil fuels provided world’s heat for more than 88%. Among the renewables, biofuels were the most widely used, since they provided 4.37% of world’s total heat generation (Figure 7). In 2020, based on our forecasts, renewables will account for almost 9%, and the share of biofuels and waste in heat generation will increase compared to 2017. The share of coal will also increase a little, but that of oil and natural gas will decrease (Figure 8).
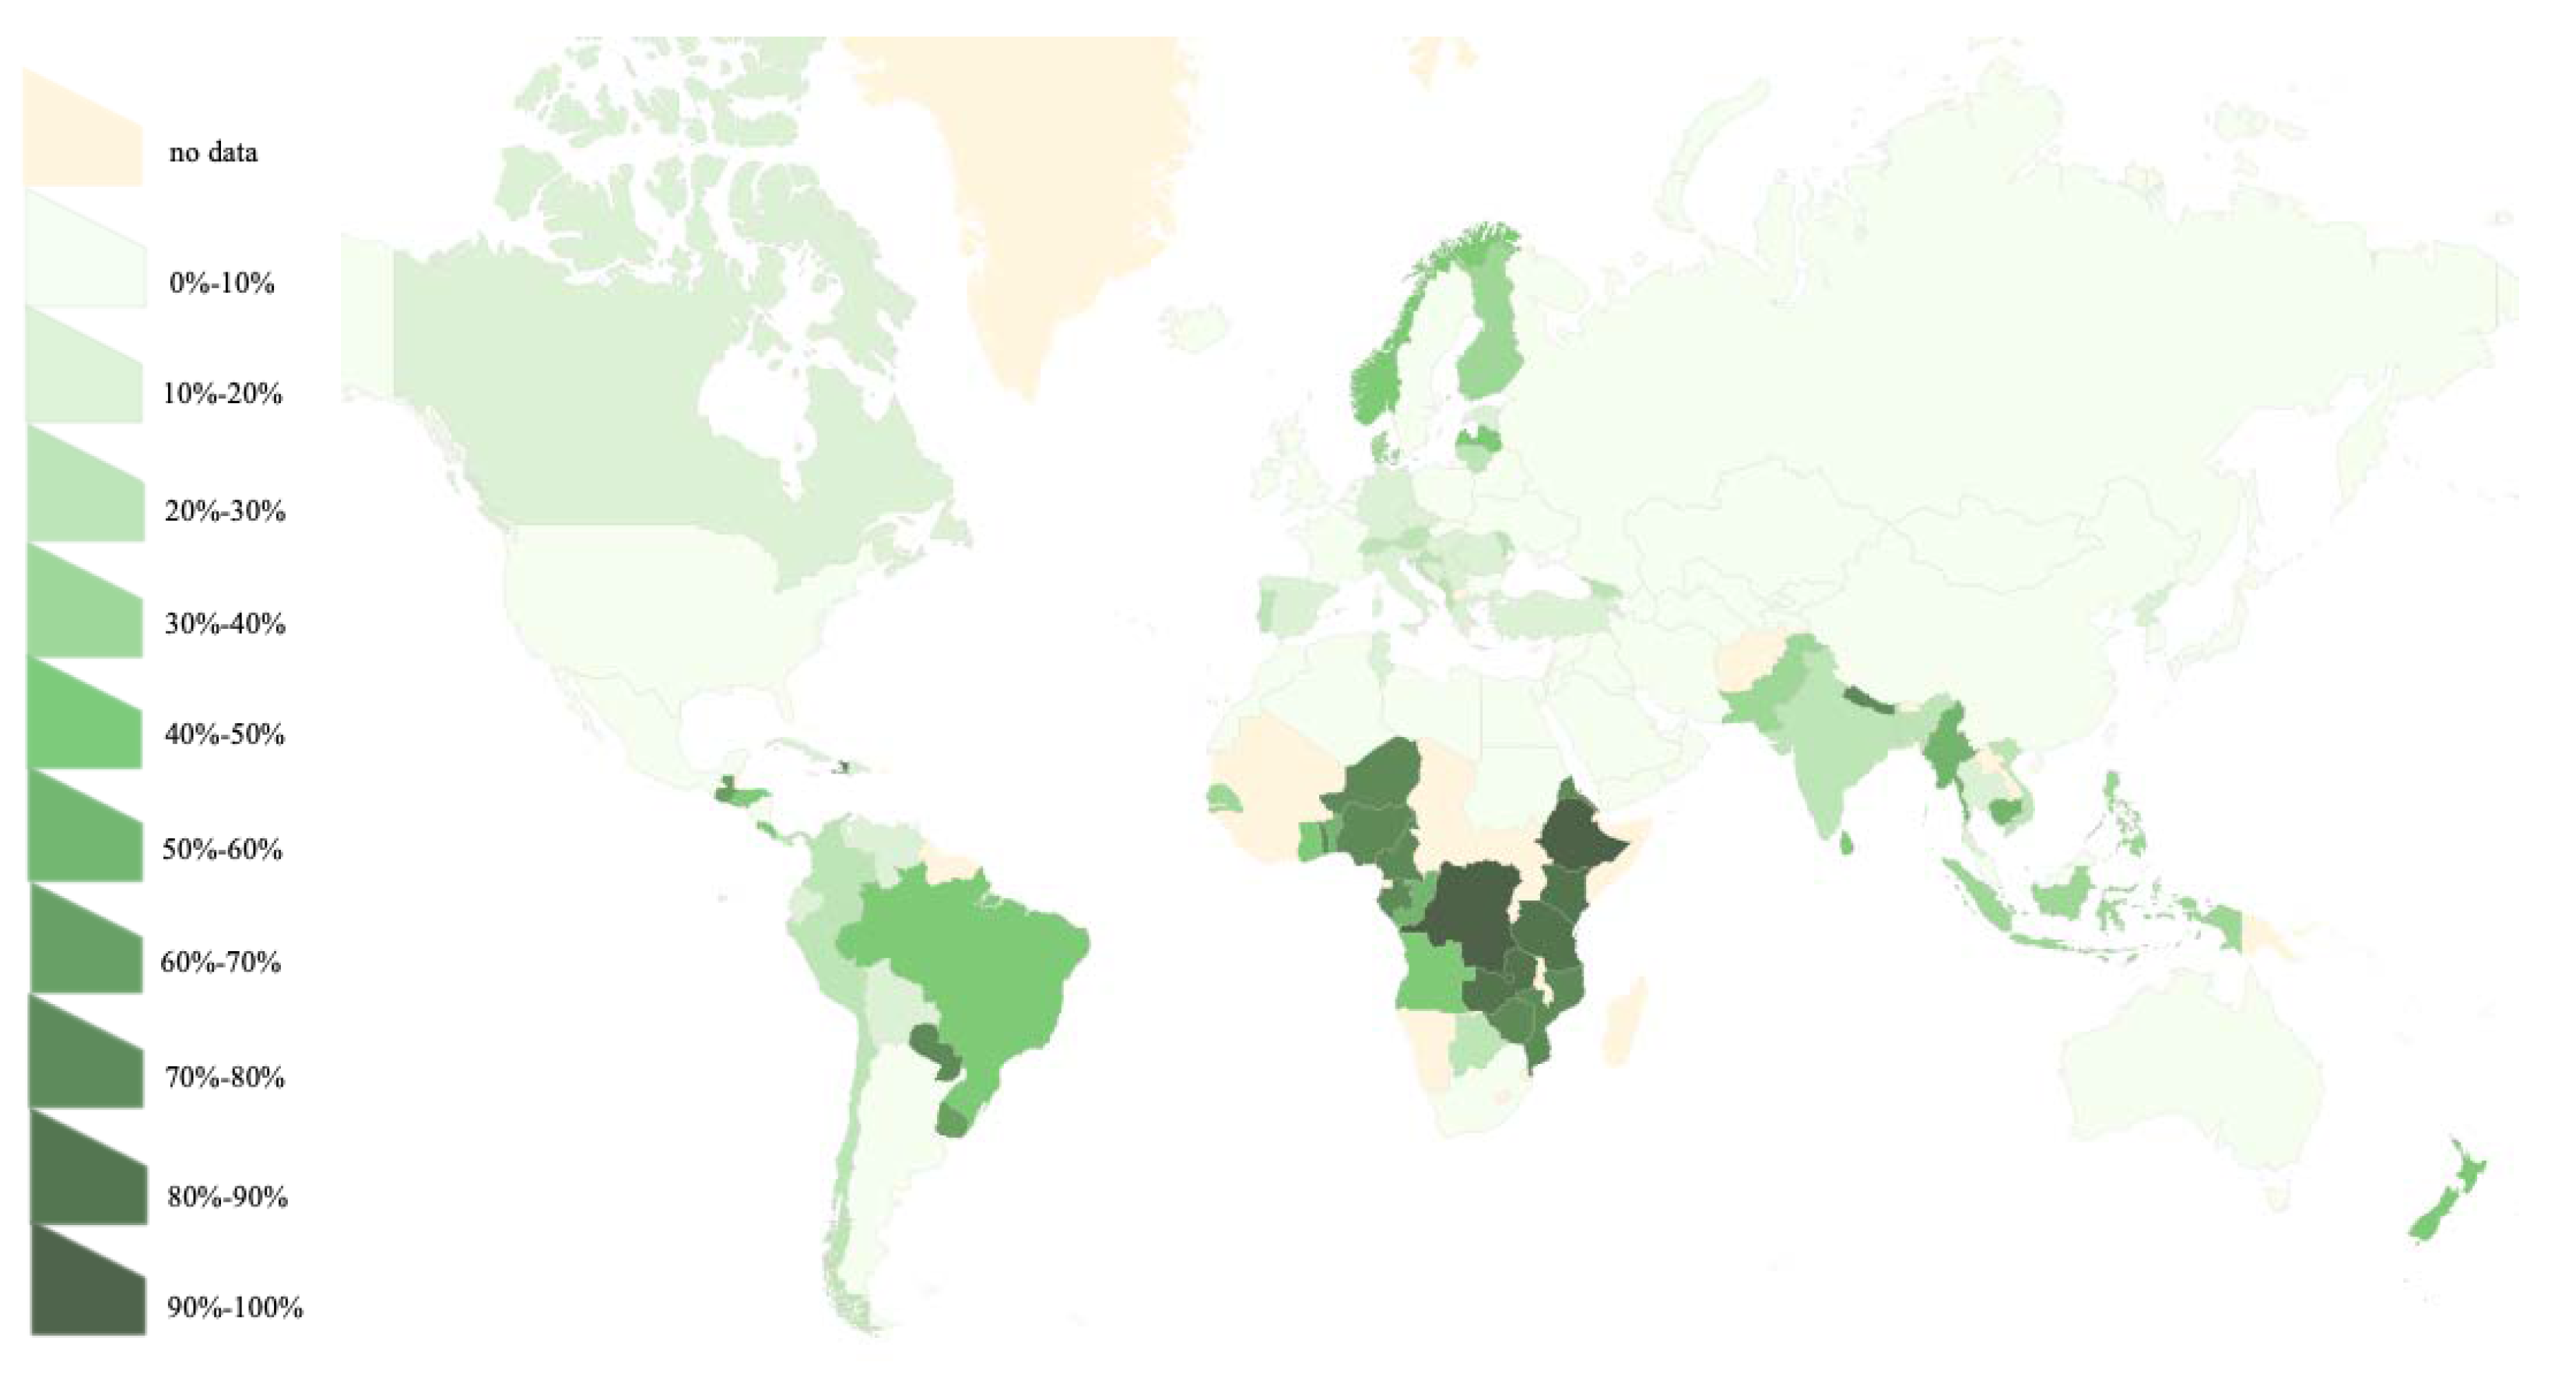
According to OECD (Organisation for Economic Co-operation and Development) data [62], renewable energy production (as a percentage of primary energy supply) in 2017 was the largest in the Democratic Republic of the Congo (97.38%), Ethiopia (90.76%), and Iceland (87.9%). In contrast, the countries that did not use at all renewable energy sources are Bahrain, Brunei, Kuwait, Oman, and Qatar (Figure 9). OECD data state that African countries used a bigger percentage of renewable energies in their total energy supply, compared to European countries and the USA. According to our forecasts for 2020, these percentages are not going to change radically: the Democratic Republic of the Congo will still have the biggest share of renewable energy (98.2%), and Ethiopia and Iceland will follow, while the countries that did not use at all renewables will continue to do so in 2020, too.
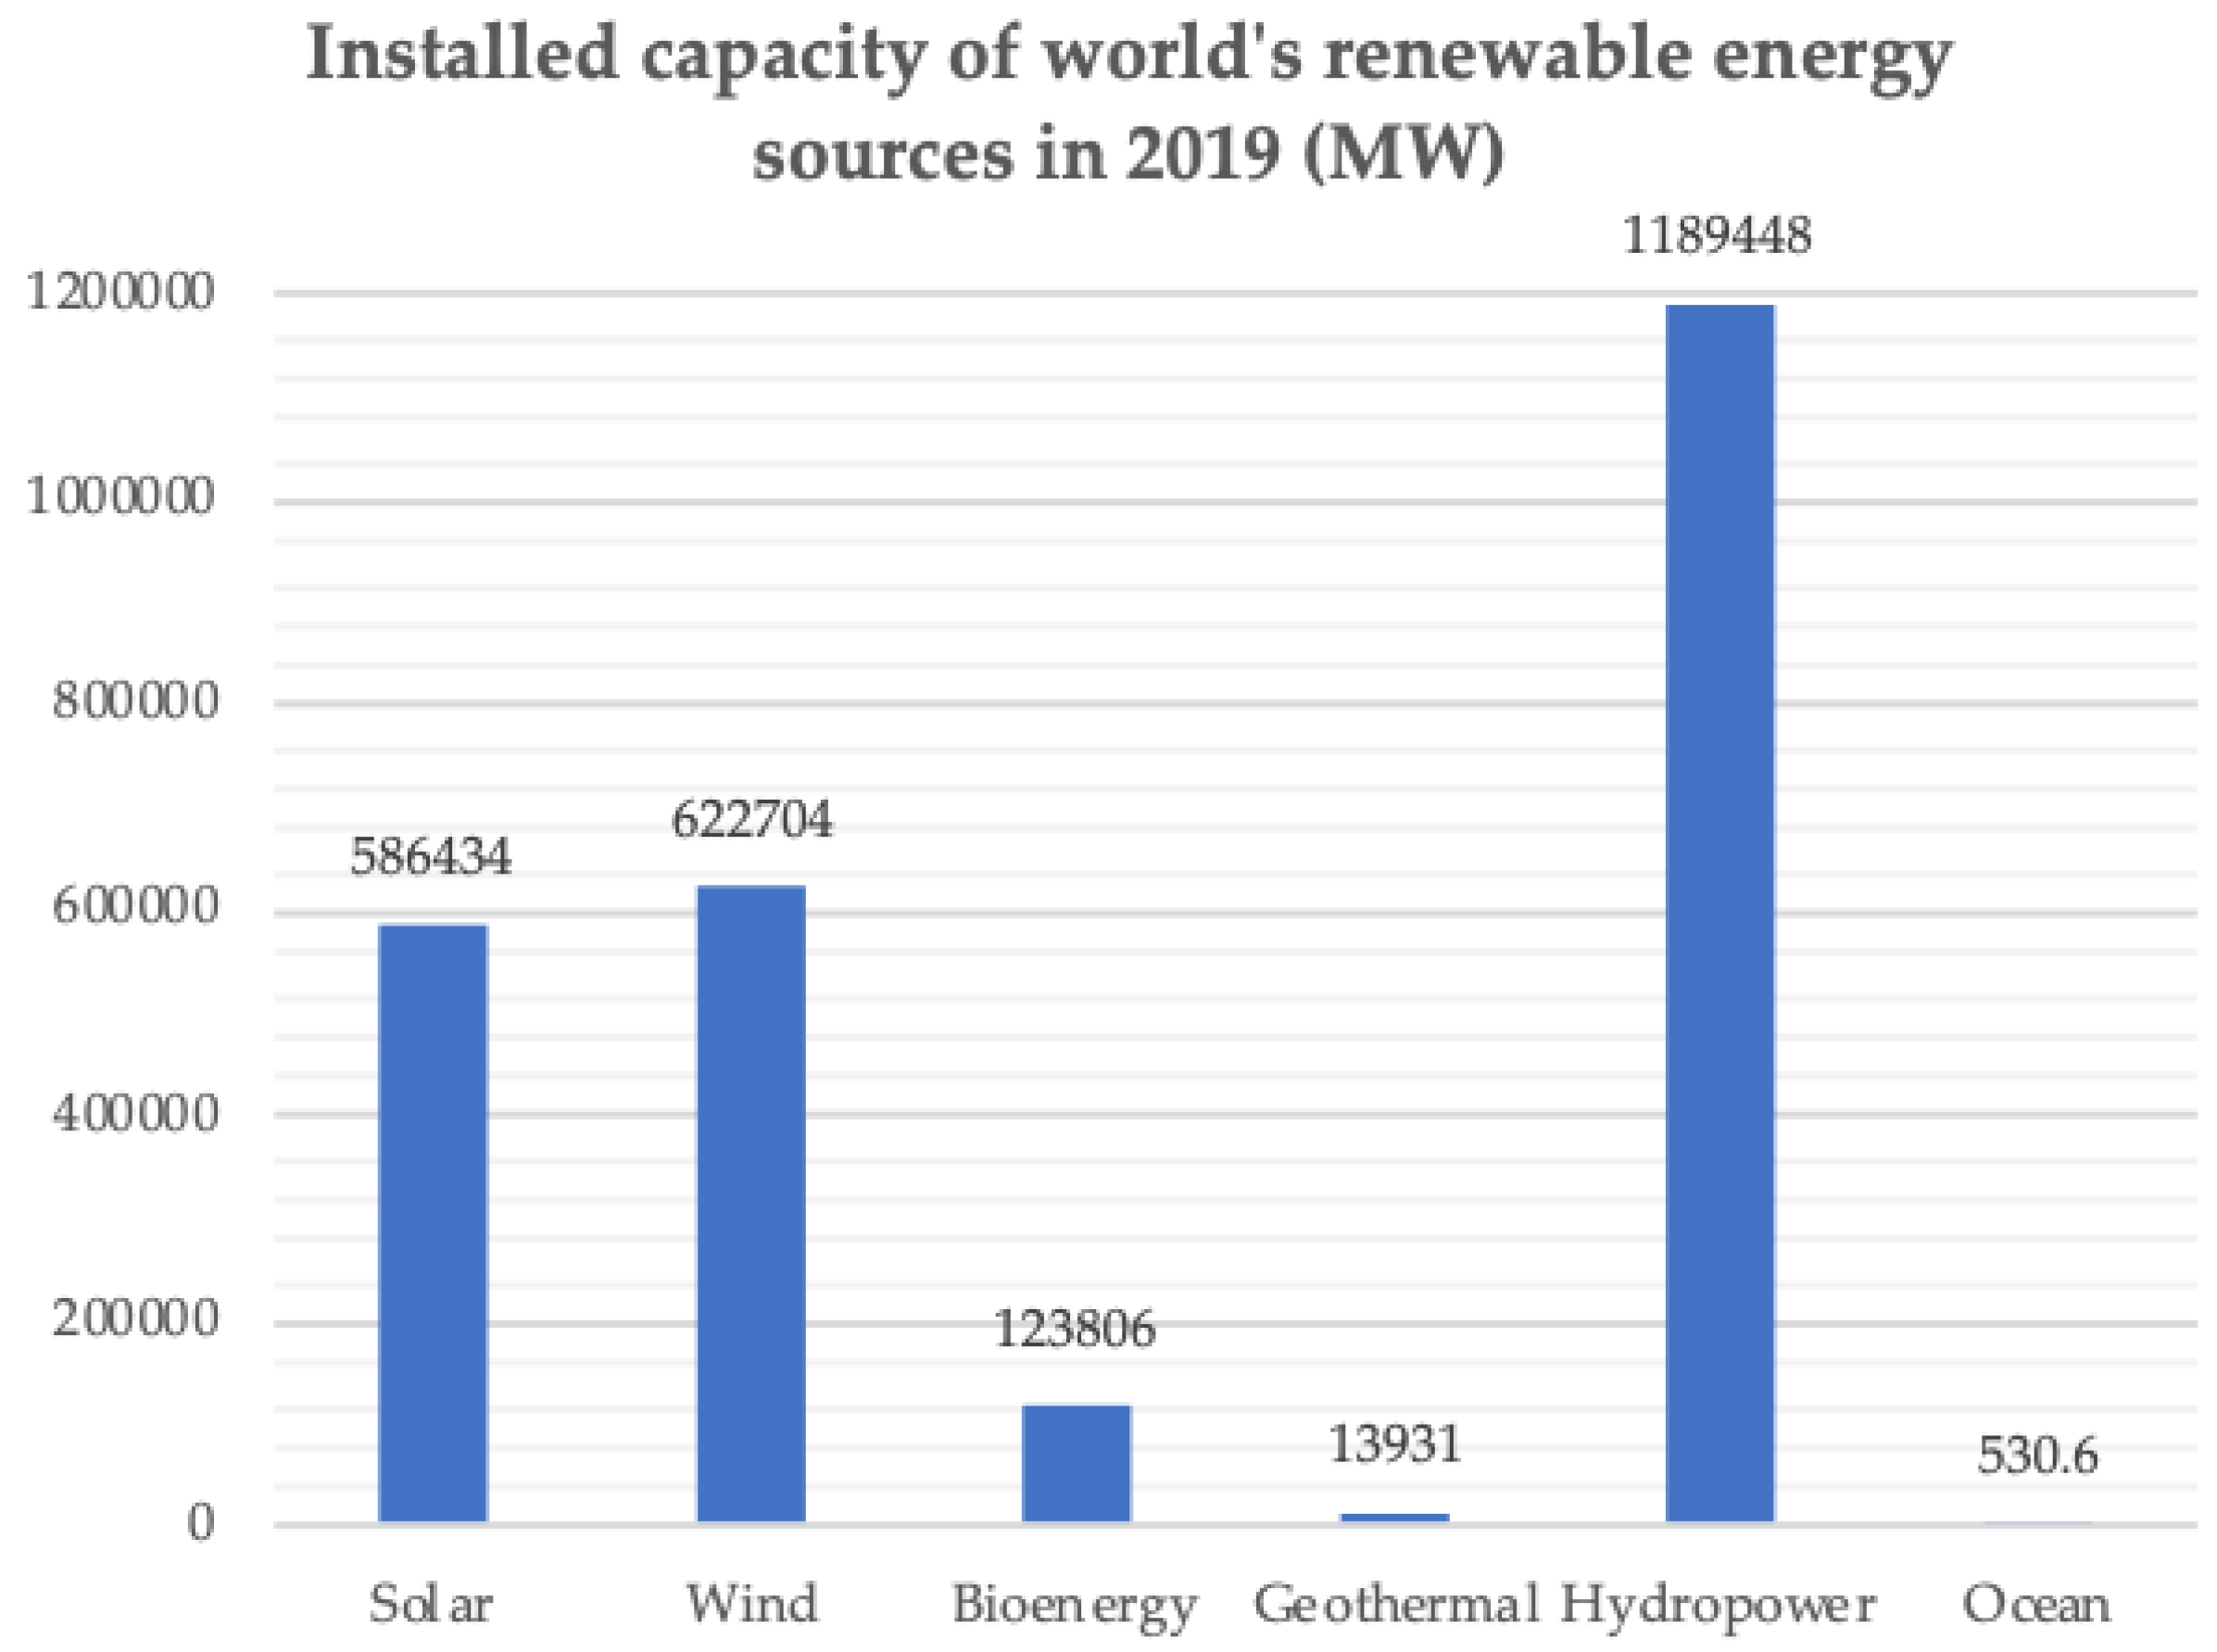
According to IRENA (International Renewable Energy Agency) data [63], the total installed capacity of renewable energy sources (maximum output of electricity that renewables can produce) was estimated at 2536853.6 MW in 2019, and hydropower accounted for almost 47%, having the largest installed capacity among the renewables (Figure 10). The total installed capacity doubled in the period 2010–2019 and, even though hydropower has had consistently the largest capacity over the years, other forms of energy showed greater increases: for instance, the installed capacity of solar energy increased by 1311% from 2010 to 2019.
3.1. Evolution of RES Usage
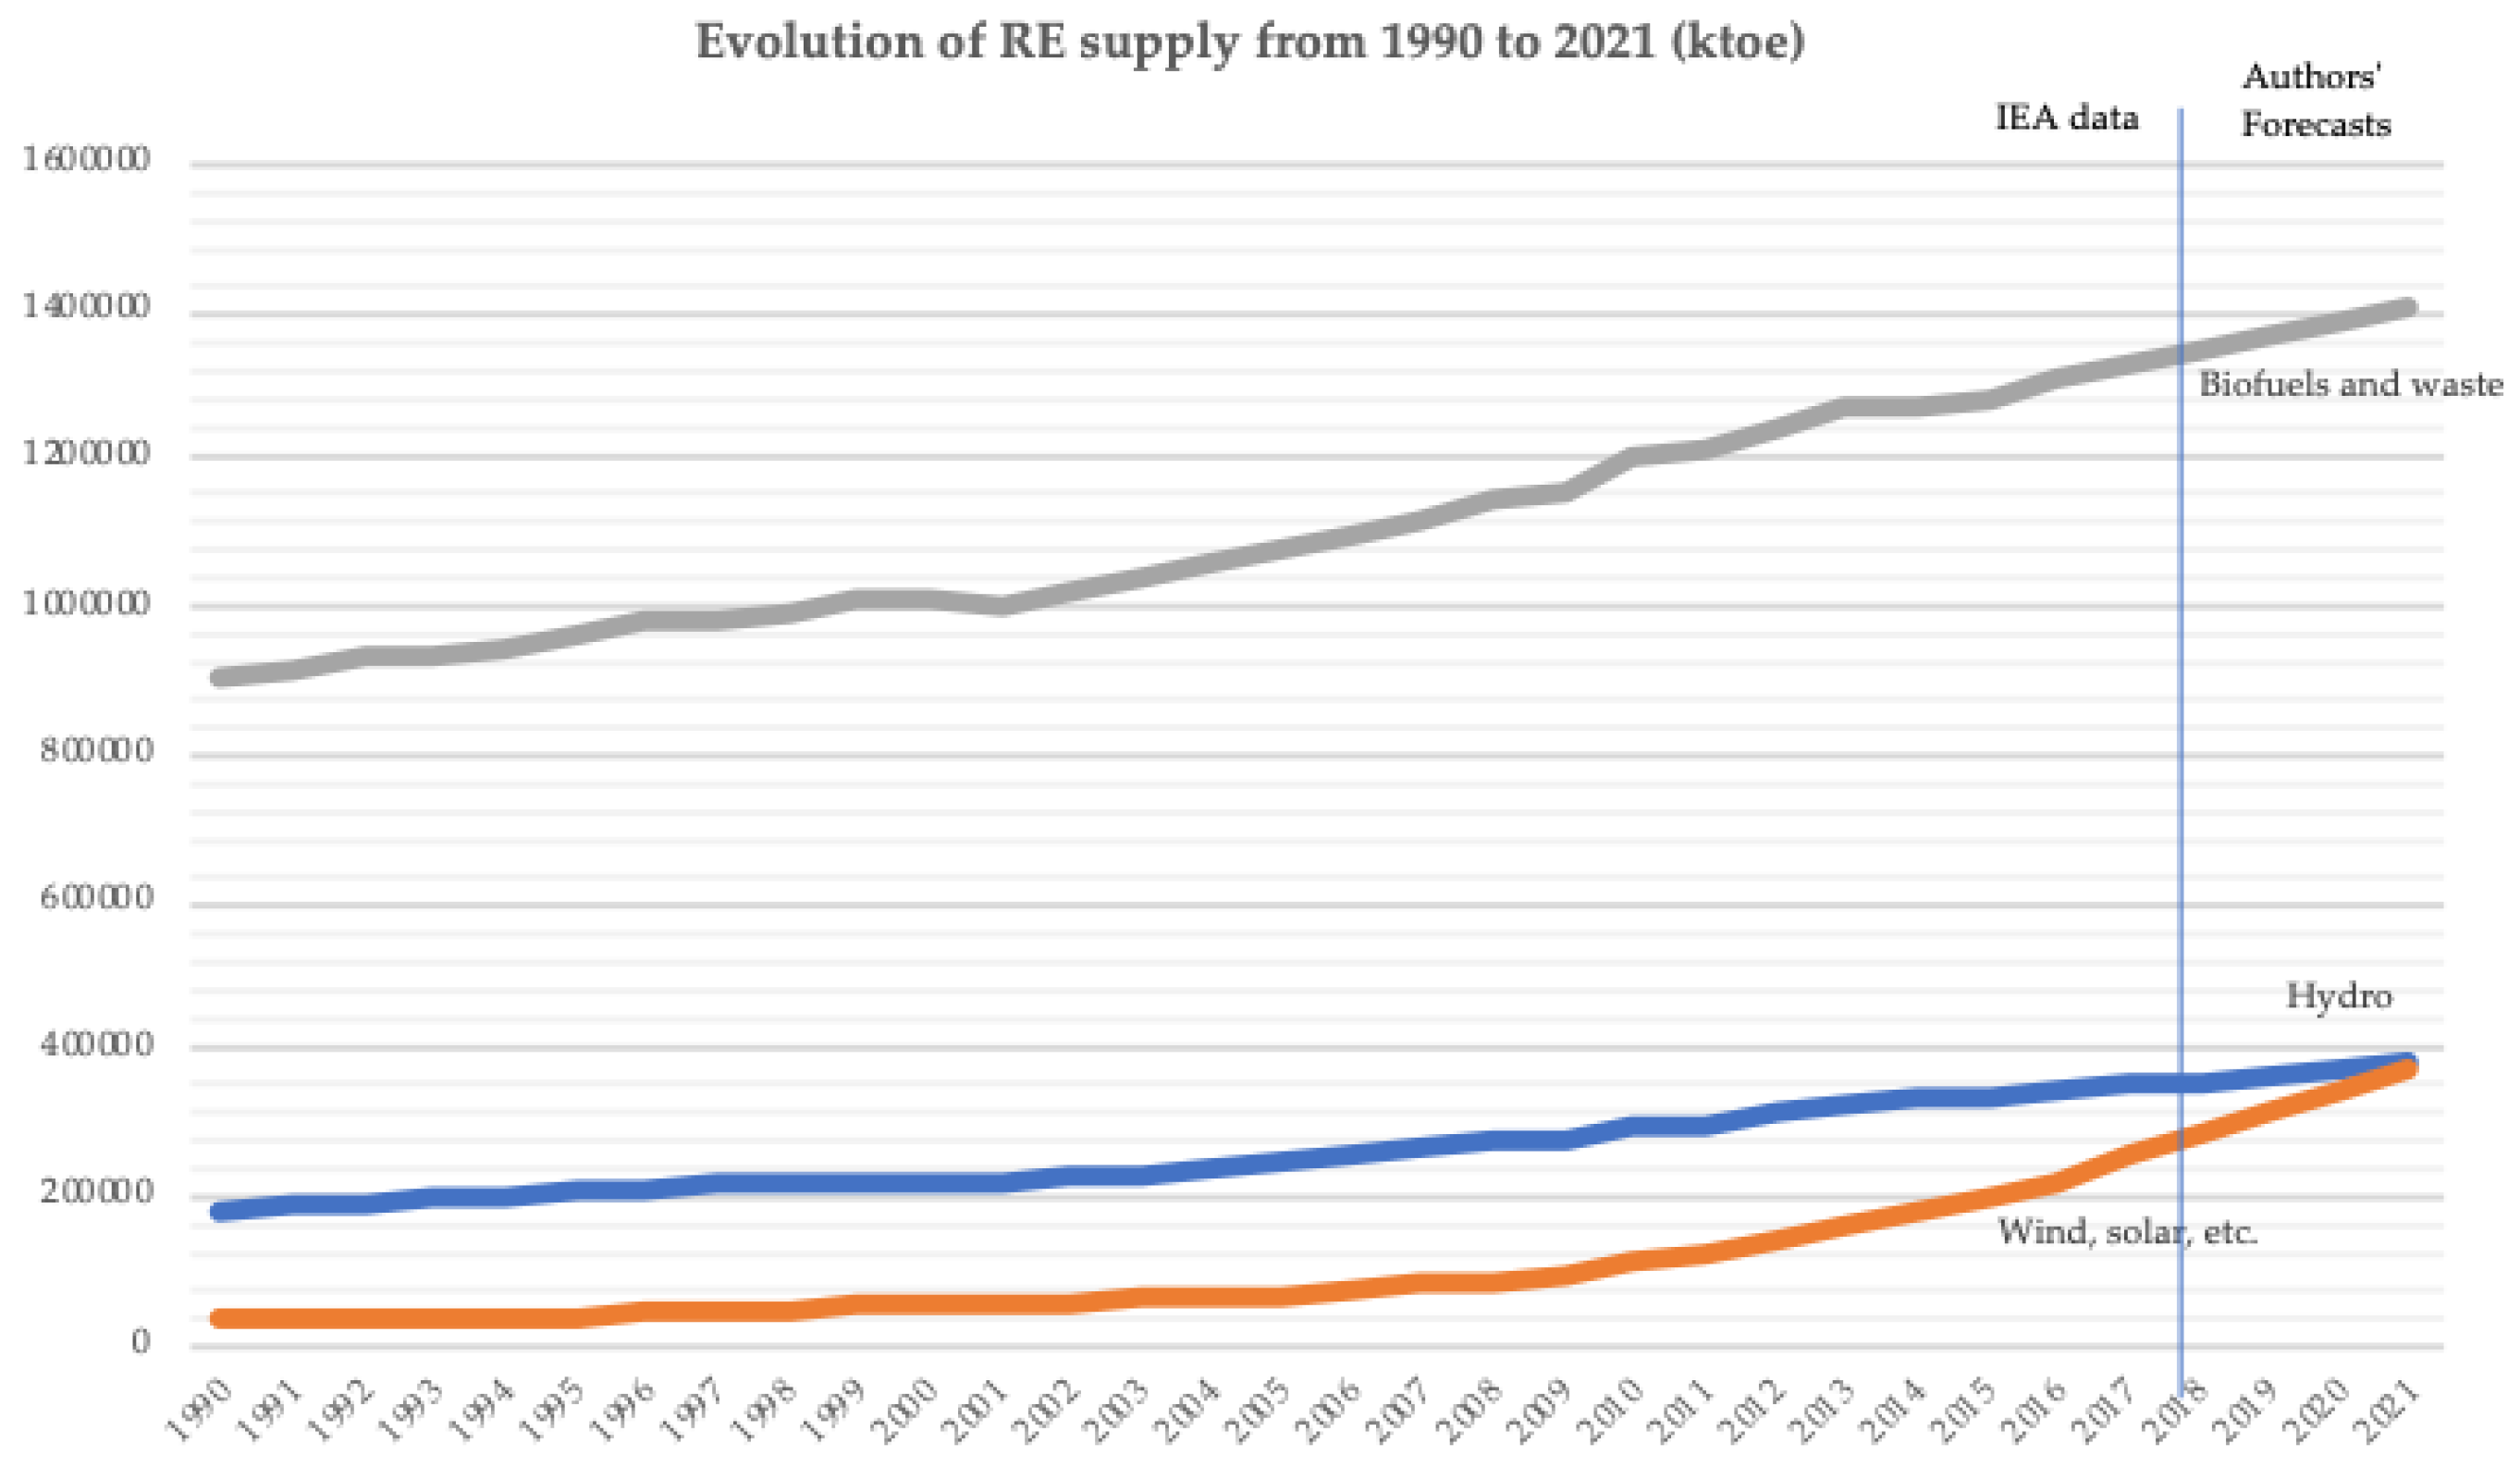
As it was presented in Figure 1, renewables provided 13.9% of the world’s total energy supply in 2017. This percentage has not changed radically over the years: in 1990, renewables provided 1,123,029 tons of oil equivalent, which was 12.8% of the world’s total energy supply. Even though the energy supply provided by RES in tons has increased over the years, the world’s total energy supply has increased, too; this is why the RES percentage remains about the same. There was an increase in the use of every type of renewable source (Figure 11), but there was also an increase in the usage of fossil fuels, to meet the increased energy demand [61]. We used IEA data and time series to provide forecasts about RE supply in 2018–2021. Based on those, it is expected that every type of renewables will provide more energy in the next few years. Especially, wind and solar energy supply will radically increase, reaching 375,739 ktoe in 2021.
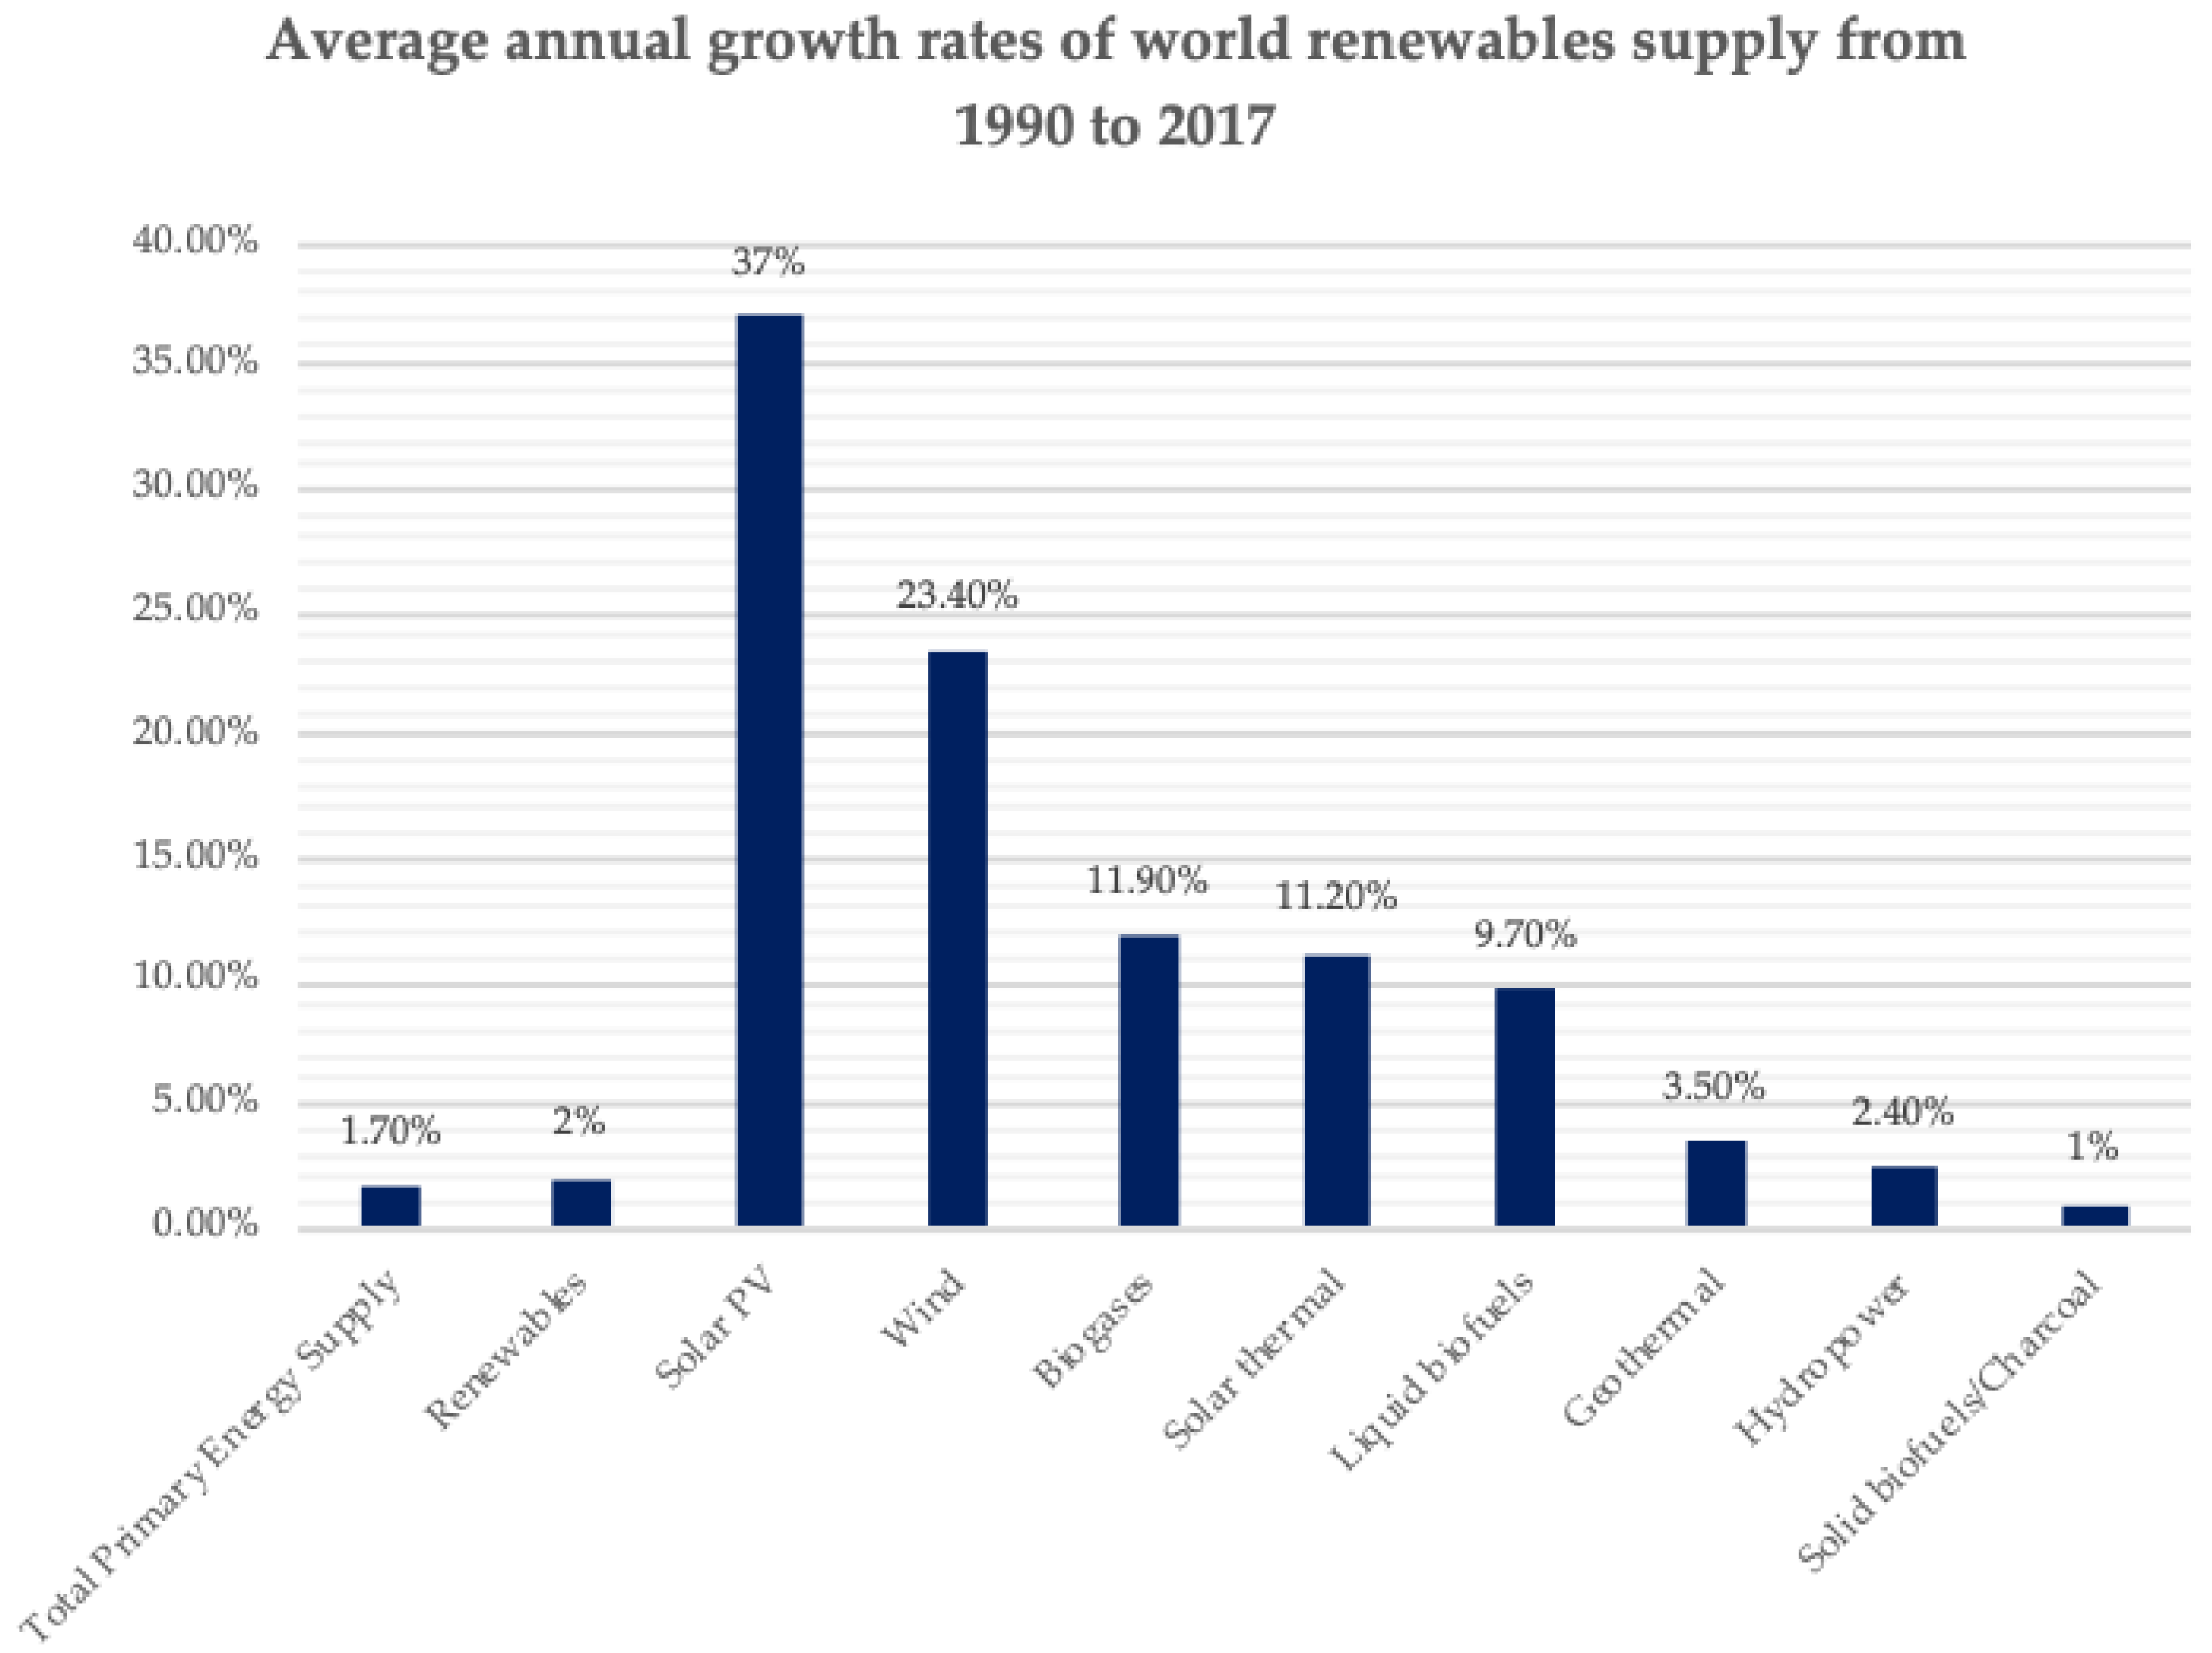
More specifically, according to IEA data [61], the average annual growth rate of renewables from 1990 to 2017 was 2%, a little higher than the average growth rate of total primary energy supply, which was calculated to be 1.7%. Figure 12 shows that solar photovoltaics and wind power had the biggest annual growth rates, followed by biogases.
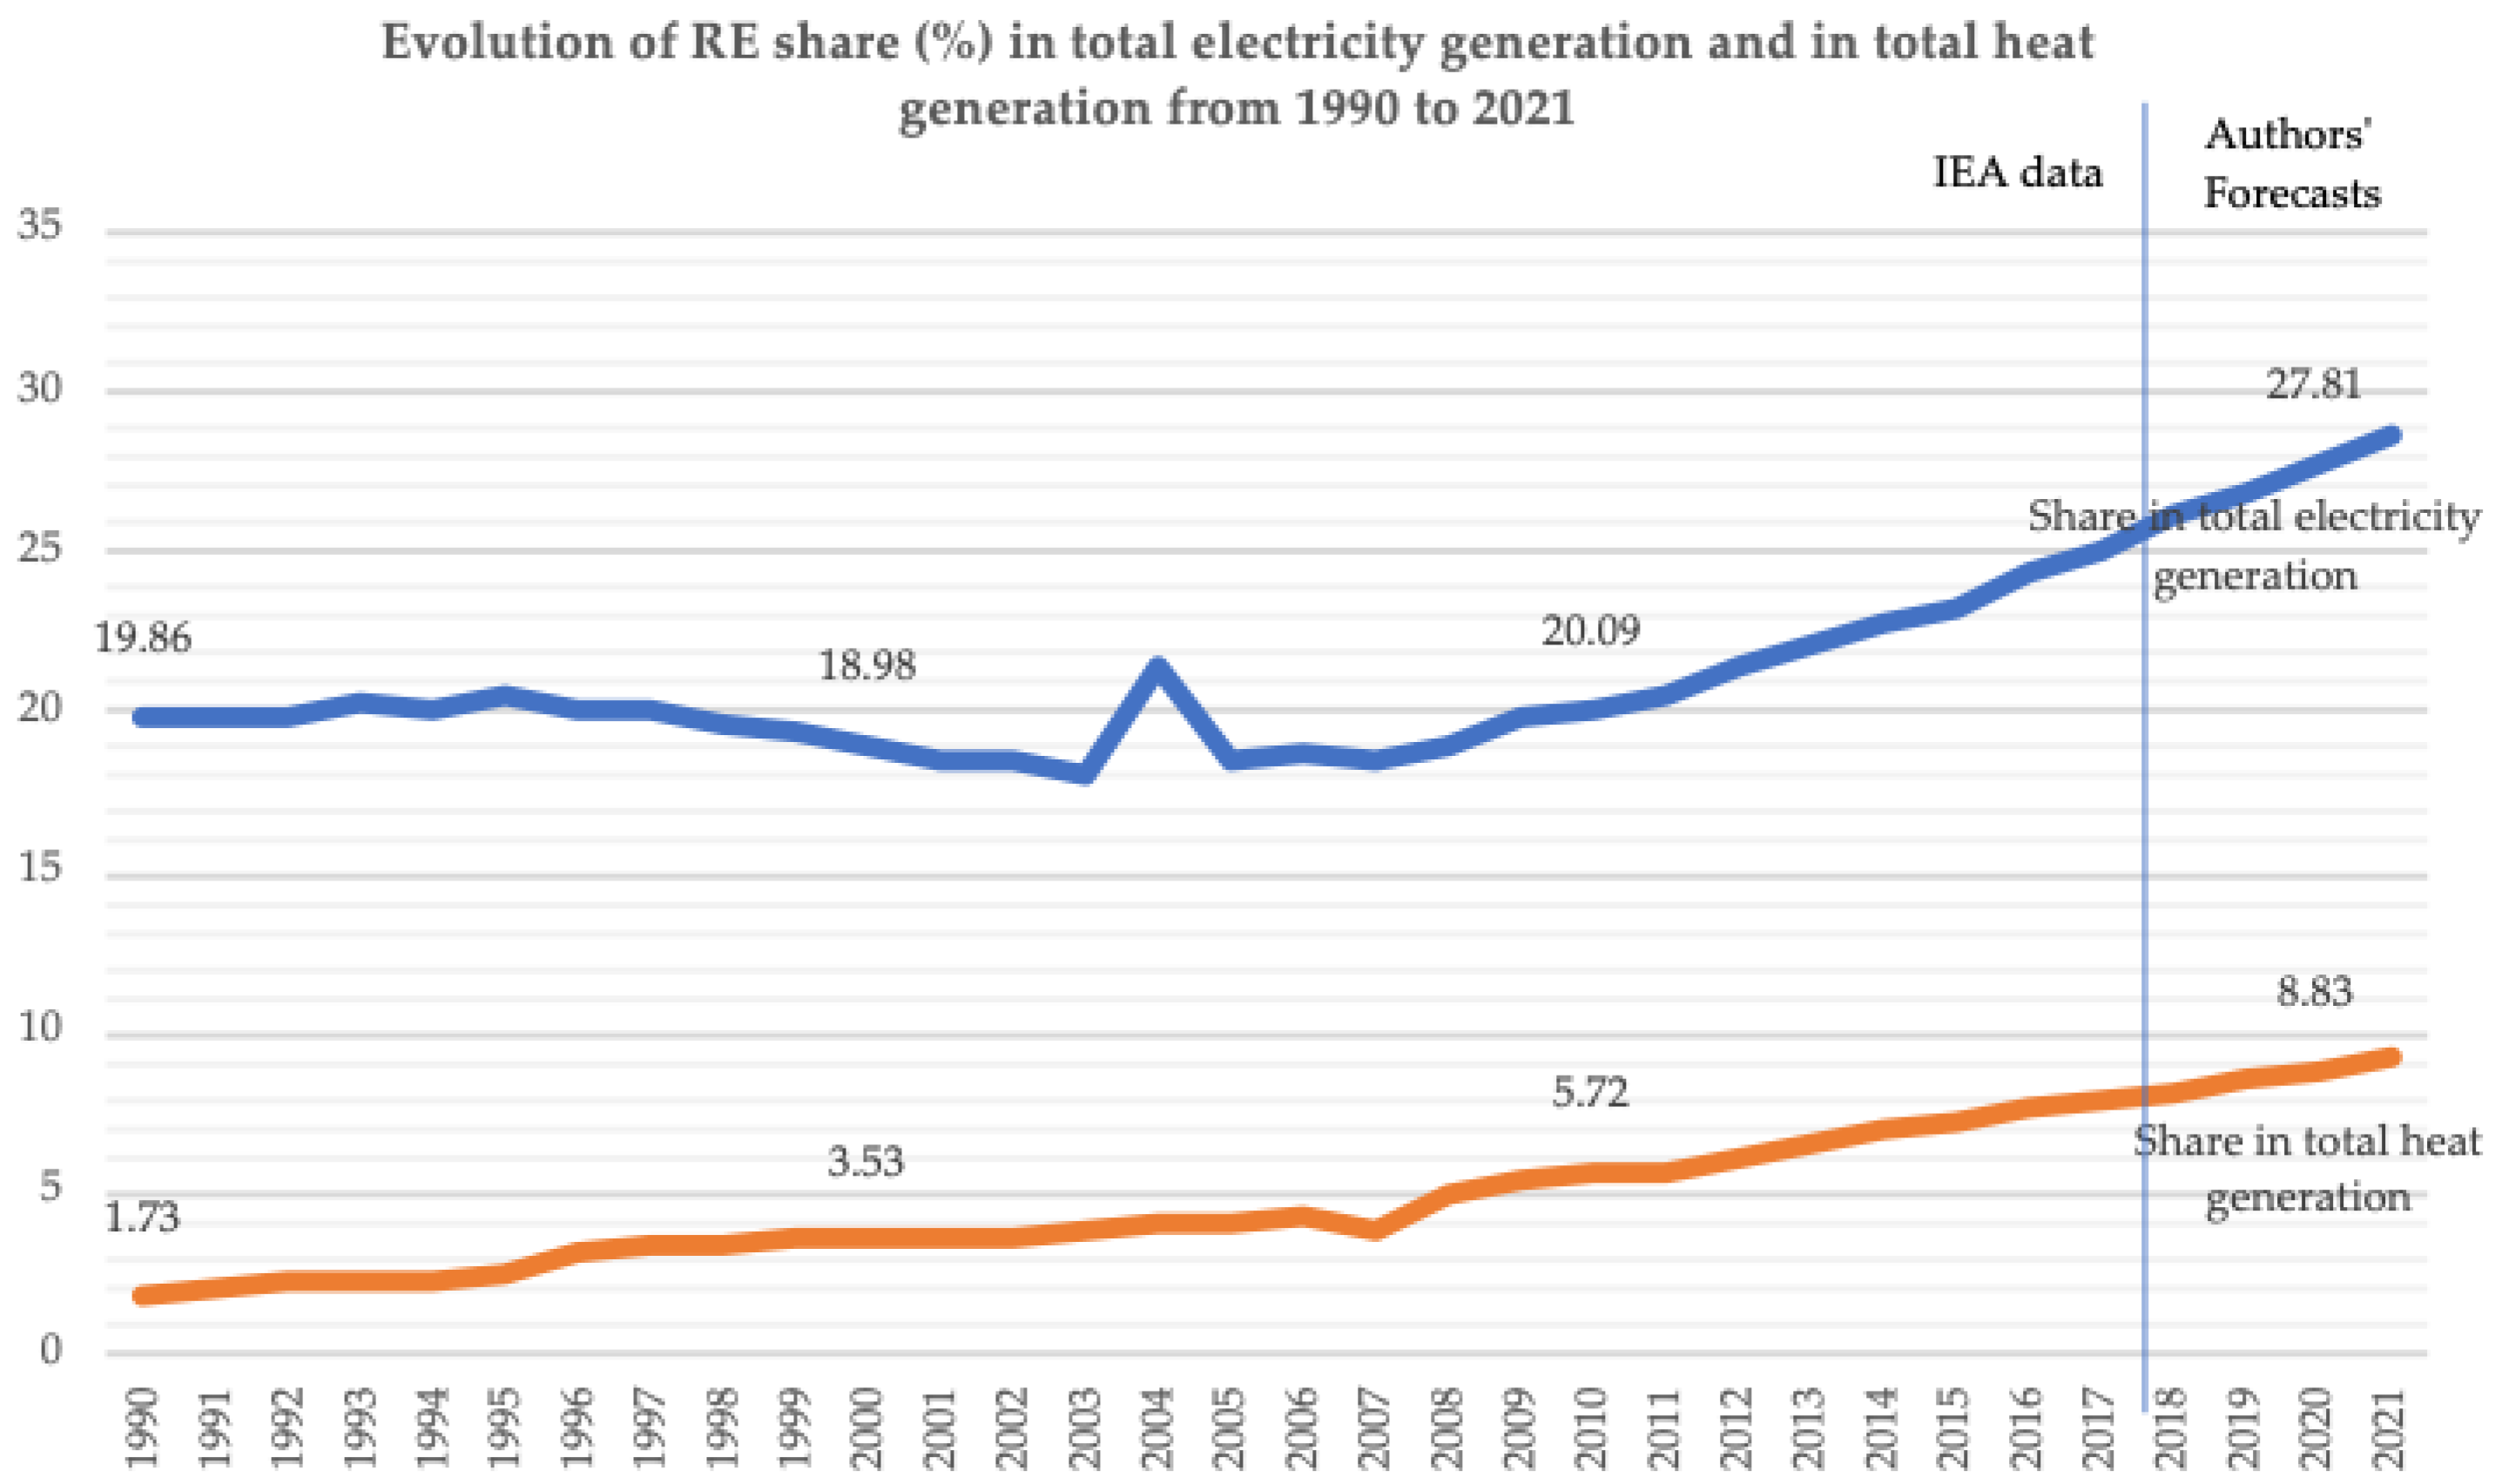
In the electricity sector, renewables provided approximately 19.9% of the world’s electricity in 1990, which was less compared to 2017, when they generated about 25% of the world’s electricity. There was also an increase in their share in heat generation; in 1990, RES provided only 1.73% of world’s total heat generation, which increased to 7.82% in 2017 (Figure 13). We predict that, in 2021, renewables will provide more than 28% of world’s total electricity and more than 9% of world’s total heat.
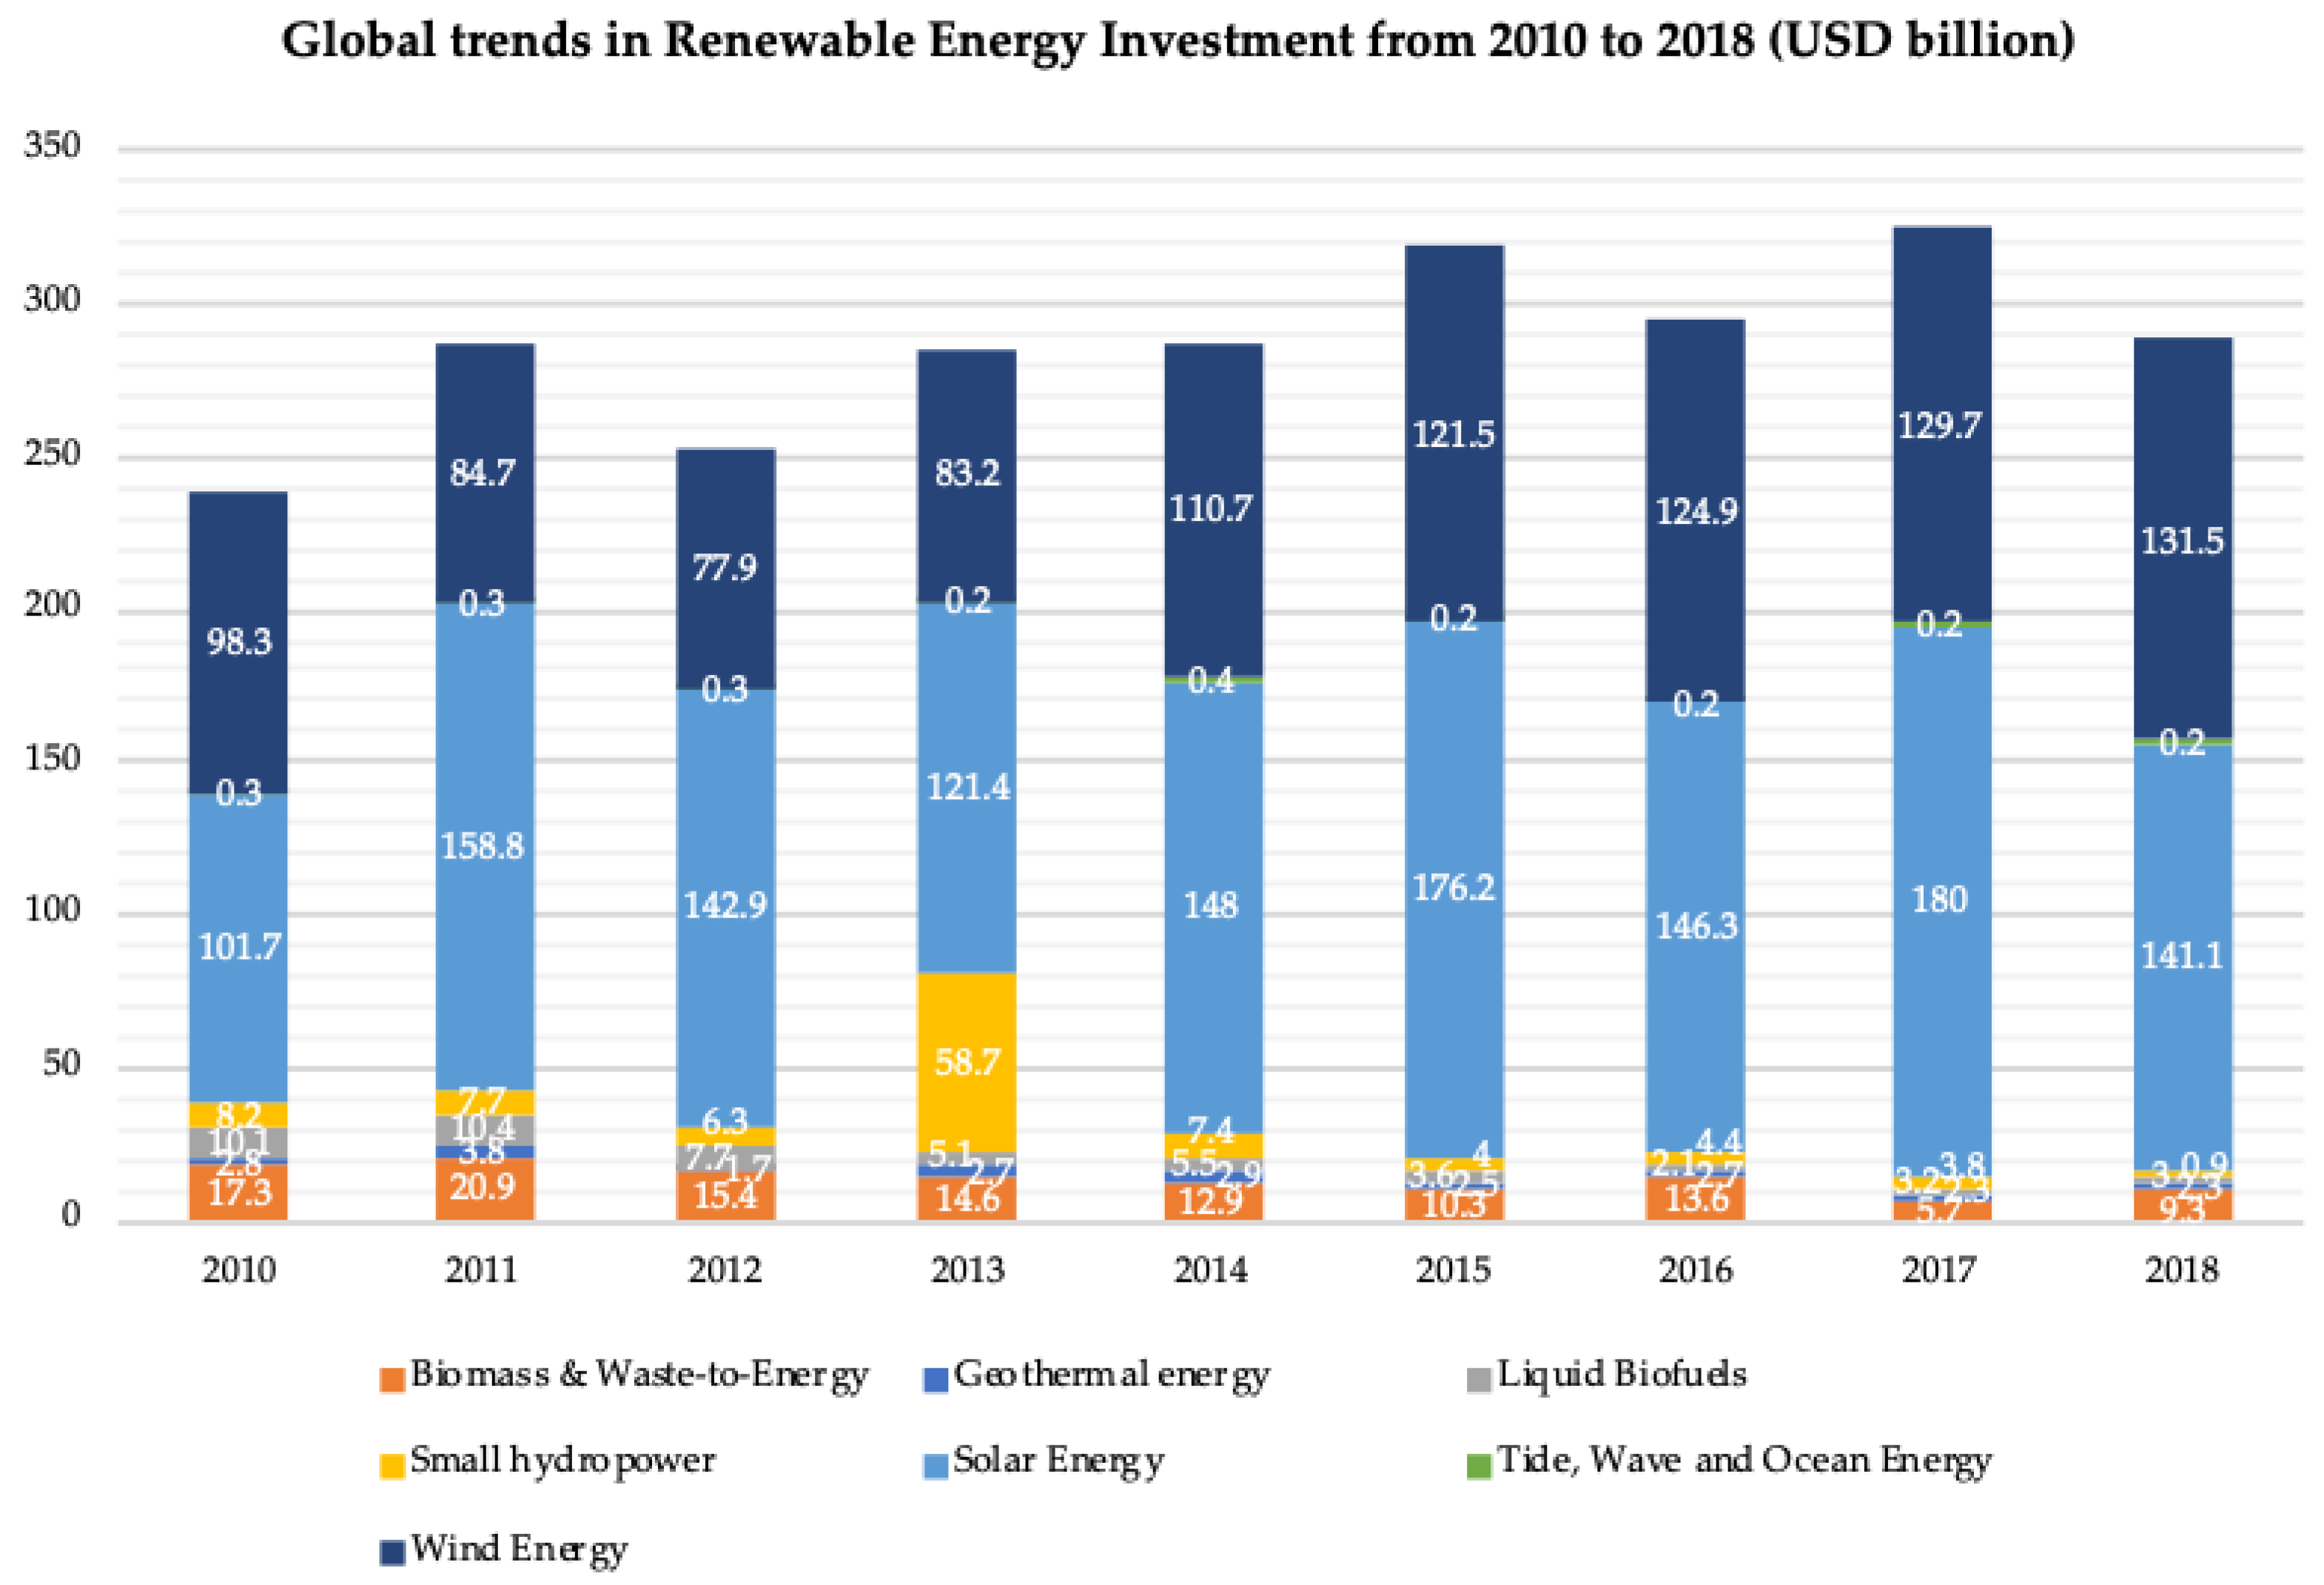
According to IRENA [64], investments in renewables have been increasing over the years. Between 2004 and 2005, there was a rapid increase in renewables’ investments that reached +55%, and since then, they kept growing. In 2018, RE investments accounted for $288.3 billion, less than in 2017, when they accounted for $324.9 billion (–11%). Most of them were in solar energy (48.9% of total RE investments in 2018) and in wind energy (45.6%). Investments in small hydropower were high in 2013 ($58.7 billions) but have kept decreasing ever since (Figure 14).
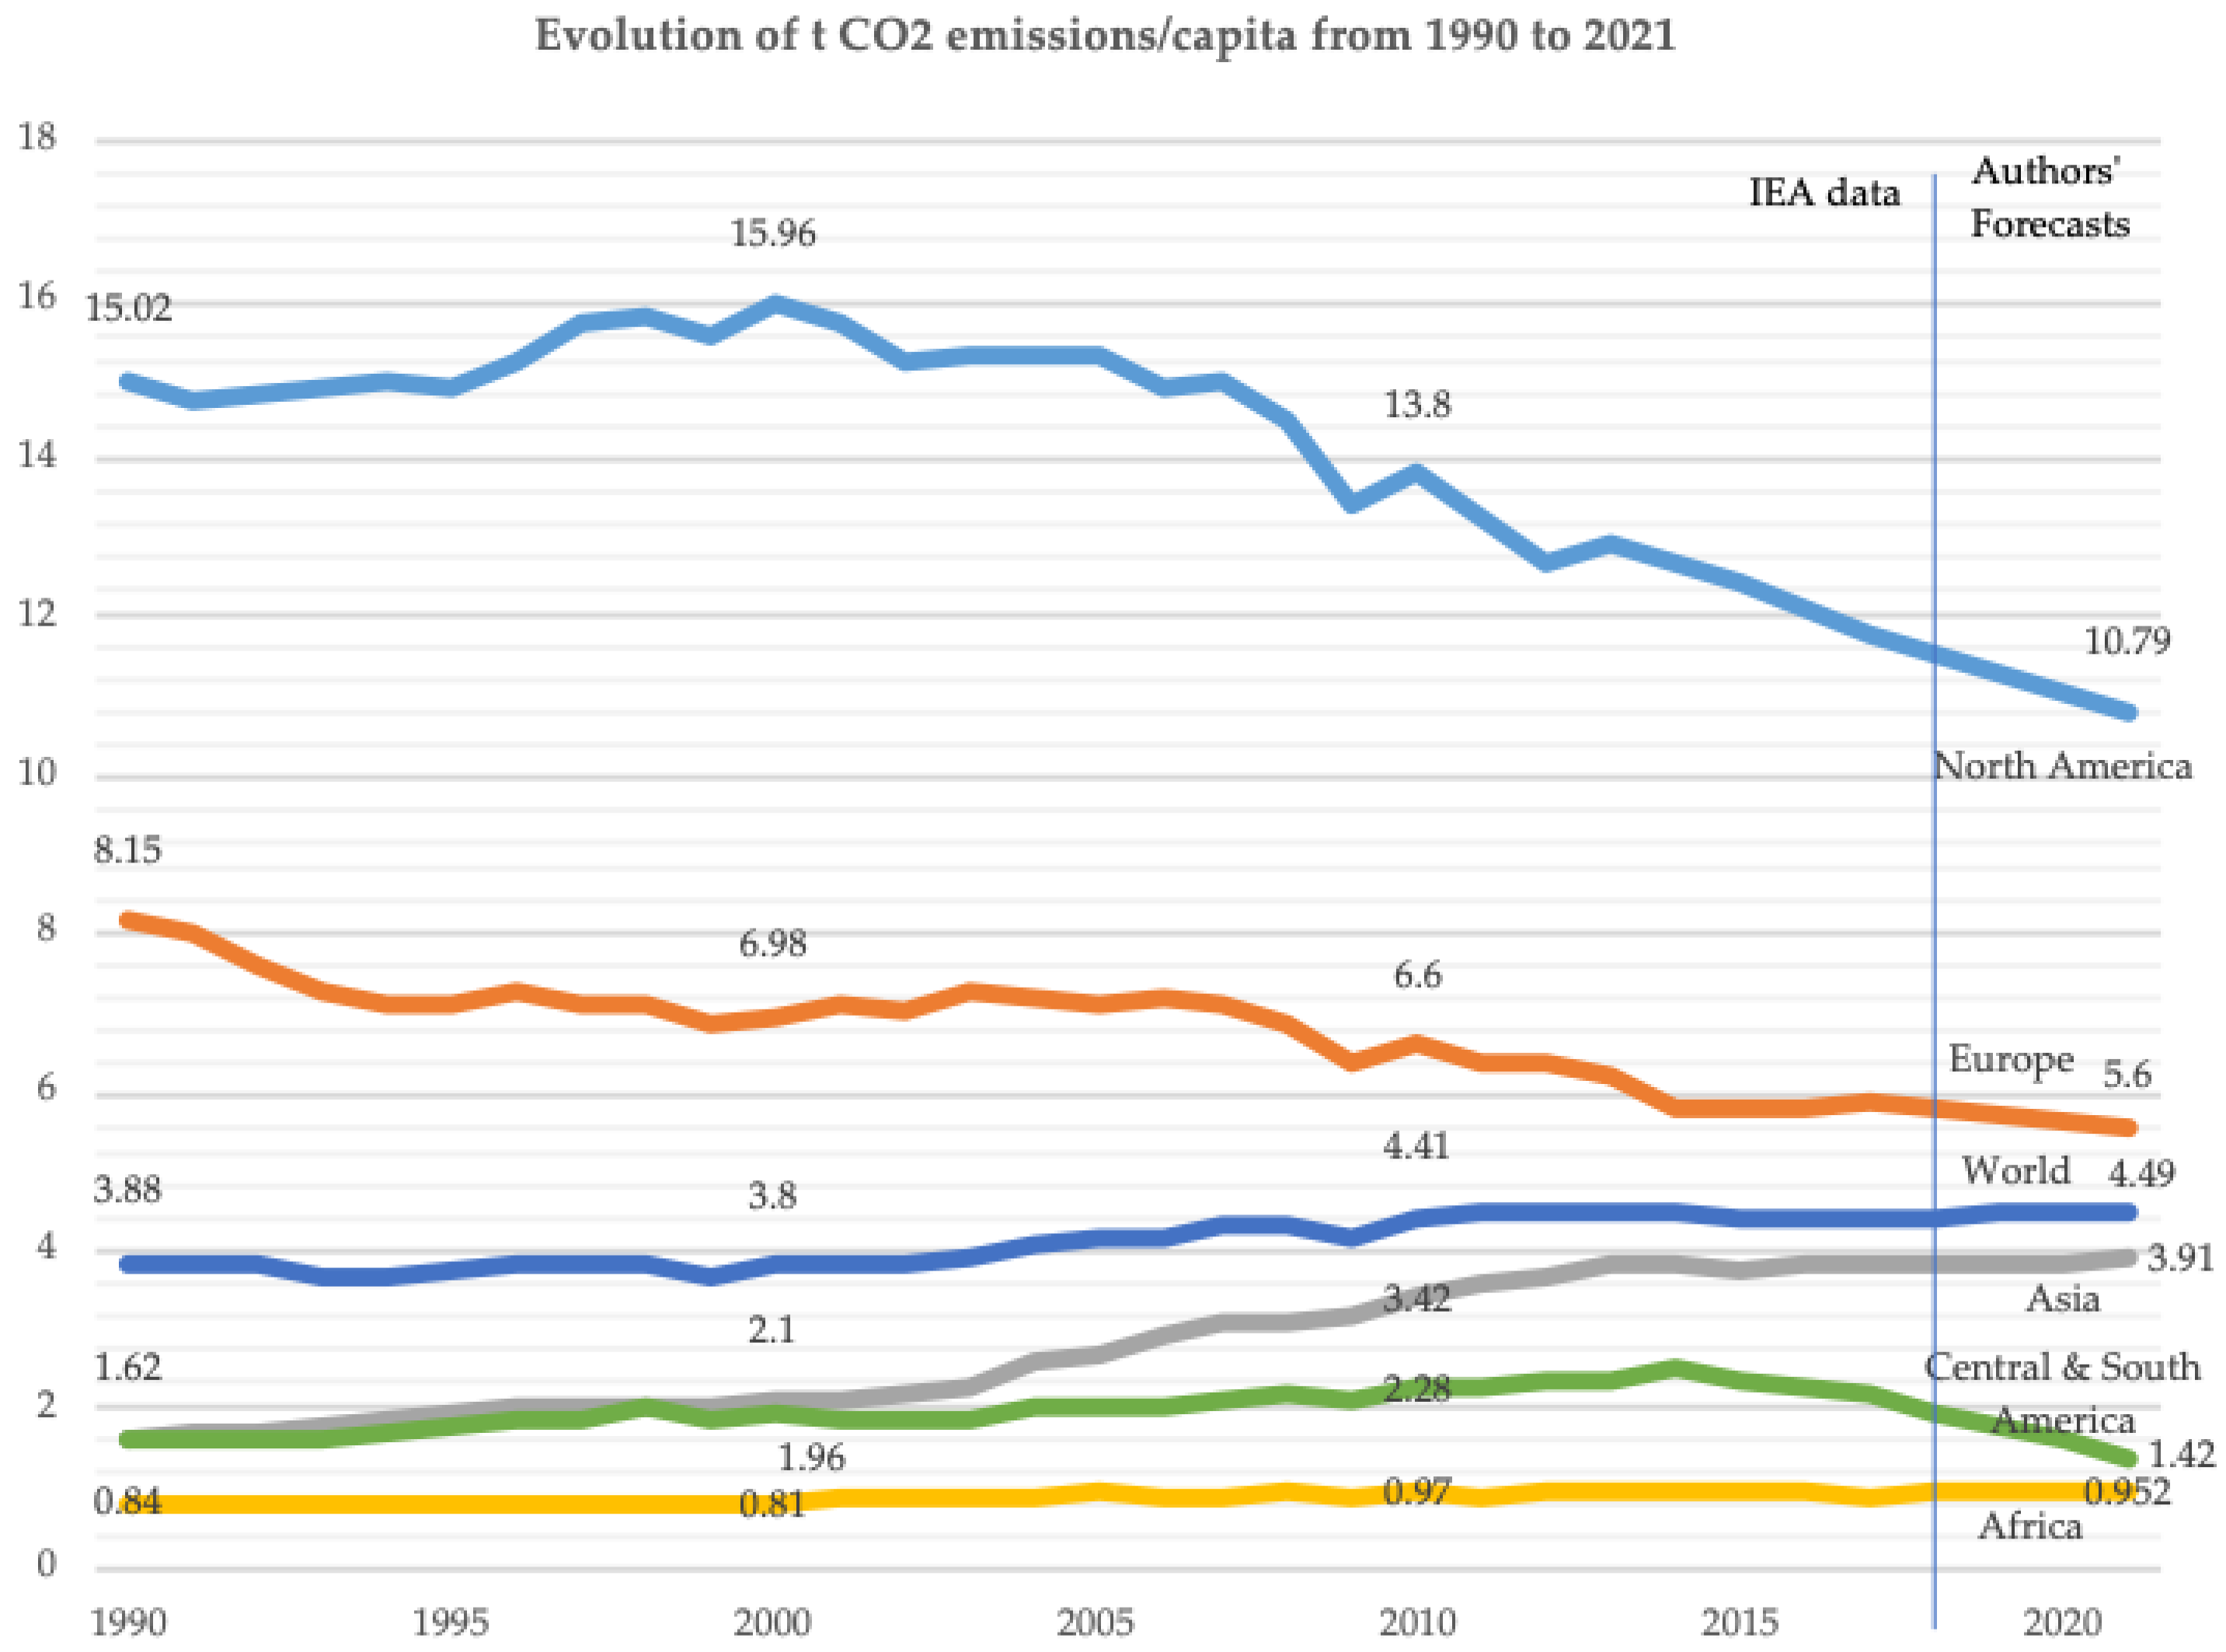
All data presented show that renewables’ usage has increased over the last 17 years. However, despite this increase, the world’s CO2 emissions not only remain high but keep increasing too: the total CO2 emissions increased by 60% from 1990 to 2017. This is not due only to the increase of the world’s population: economic and technological growth, combined with a new, modern way of life have led to a higher energy demand and, therefore, higher CO2 emissions per capita (Figure 15). This fact makes it obvious that, in order to reduce GHG emissions and their catastrophic results on the environment, it is necessary not only to increase RES share but also to reduce the world’s total energy demand and usage.
3.2. Projections
Lately, more and more countries have been setting goals to reduce their GHG emissions and to transit to clean forms of energy, such as renewable sources. According to the International Renewable Energy Agency [65], in order to reduce the impact of climate change and limit the global temperature rise to below 2 °C, it is necessary to increase the share of renewables in the final energy consumption from 19% (2017) to 65% by 2050. In addition to that, it is important that the share of renewables in world’s electricity generation is increased from 25% (2017) to approximately 85% by 2050.
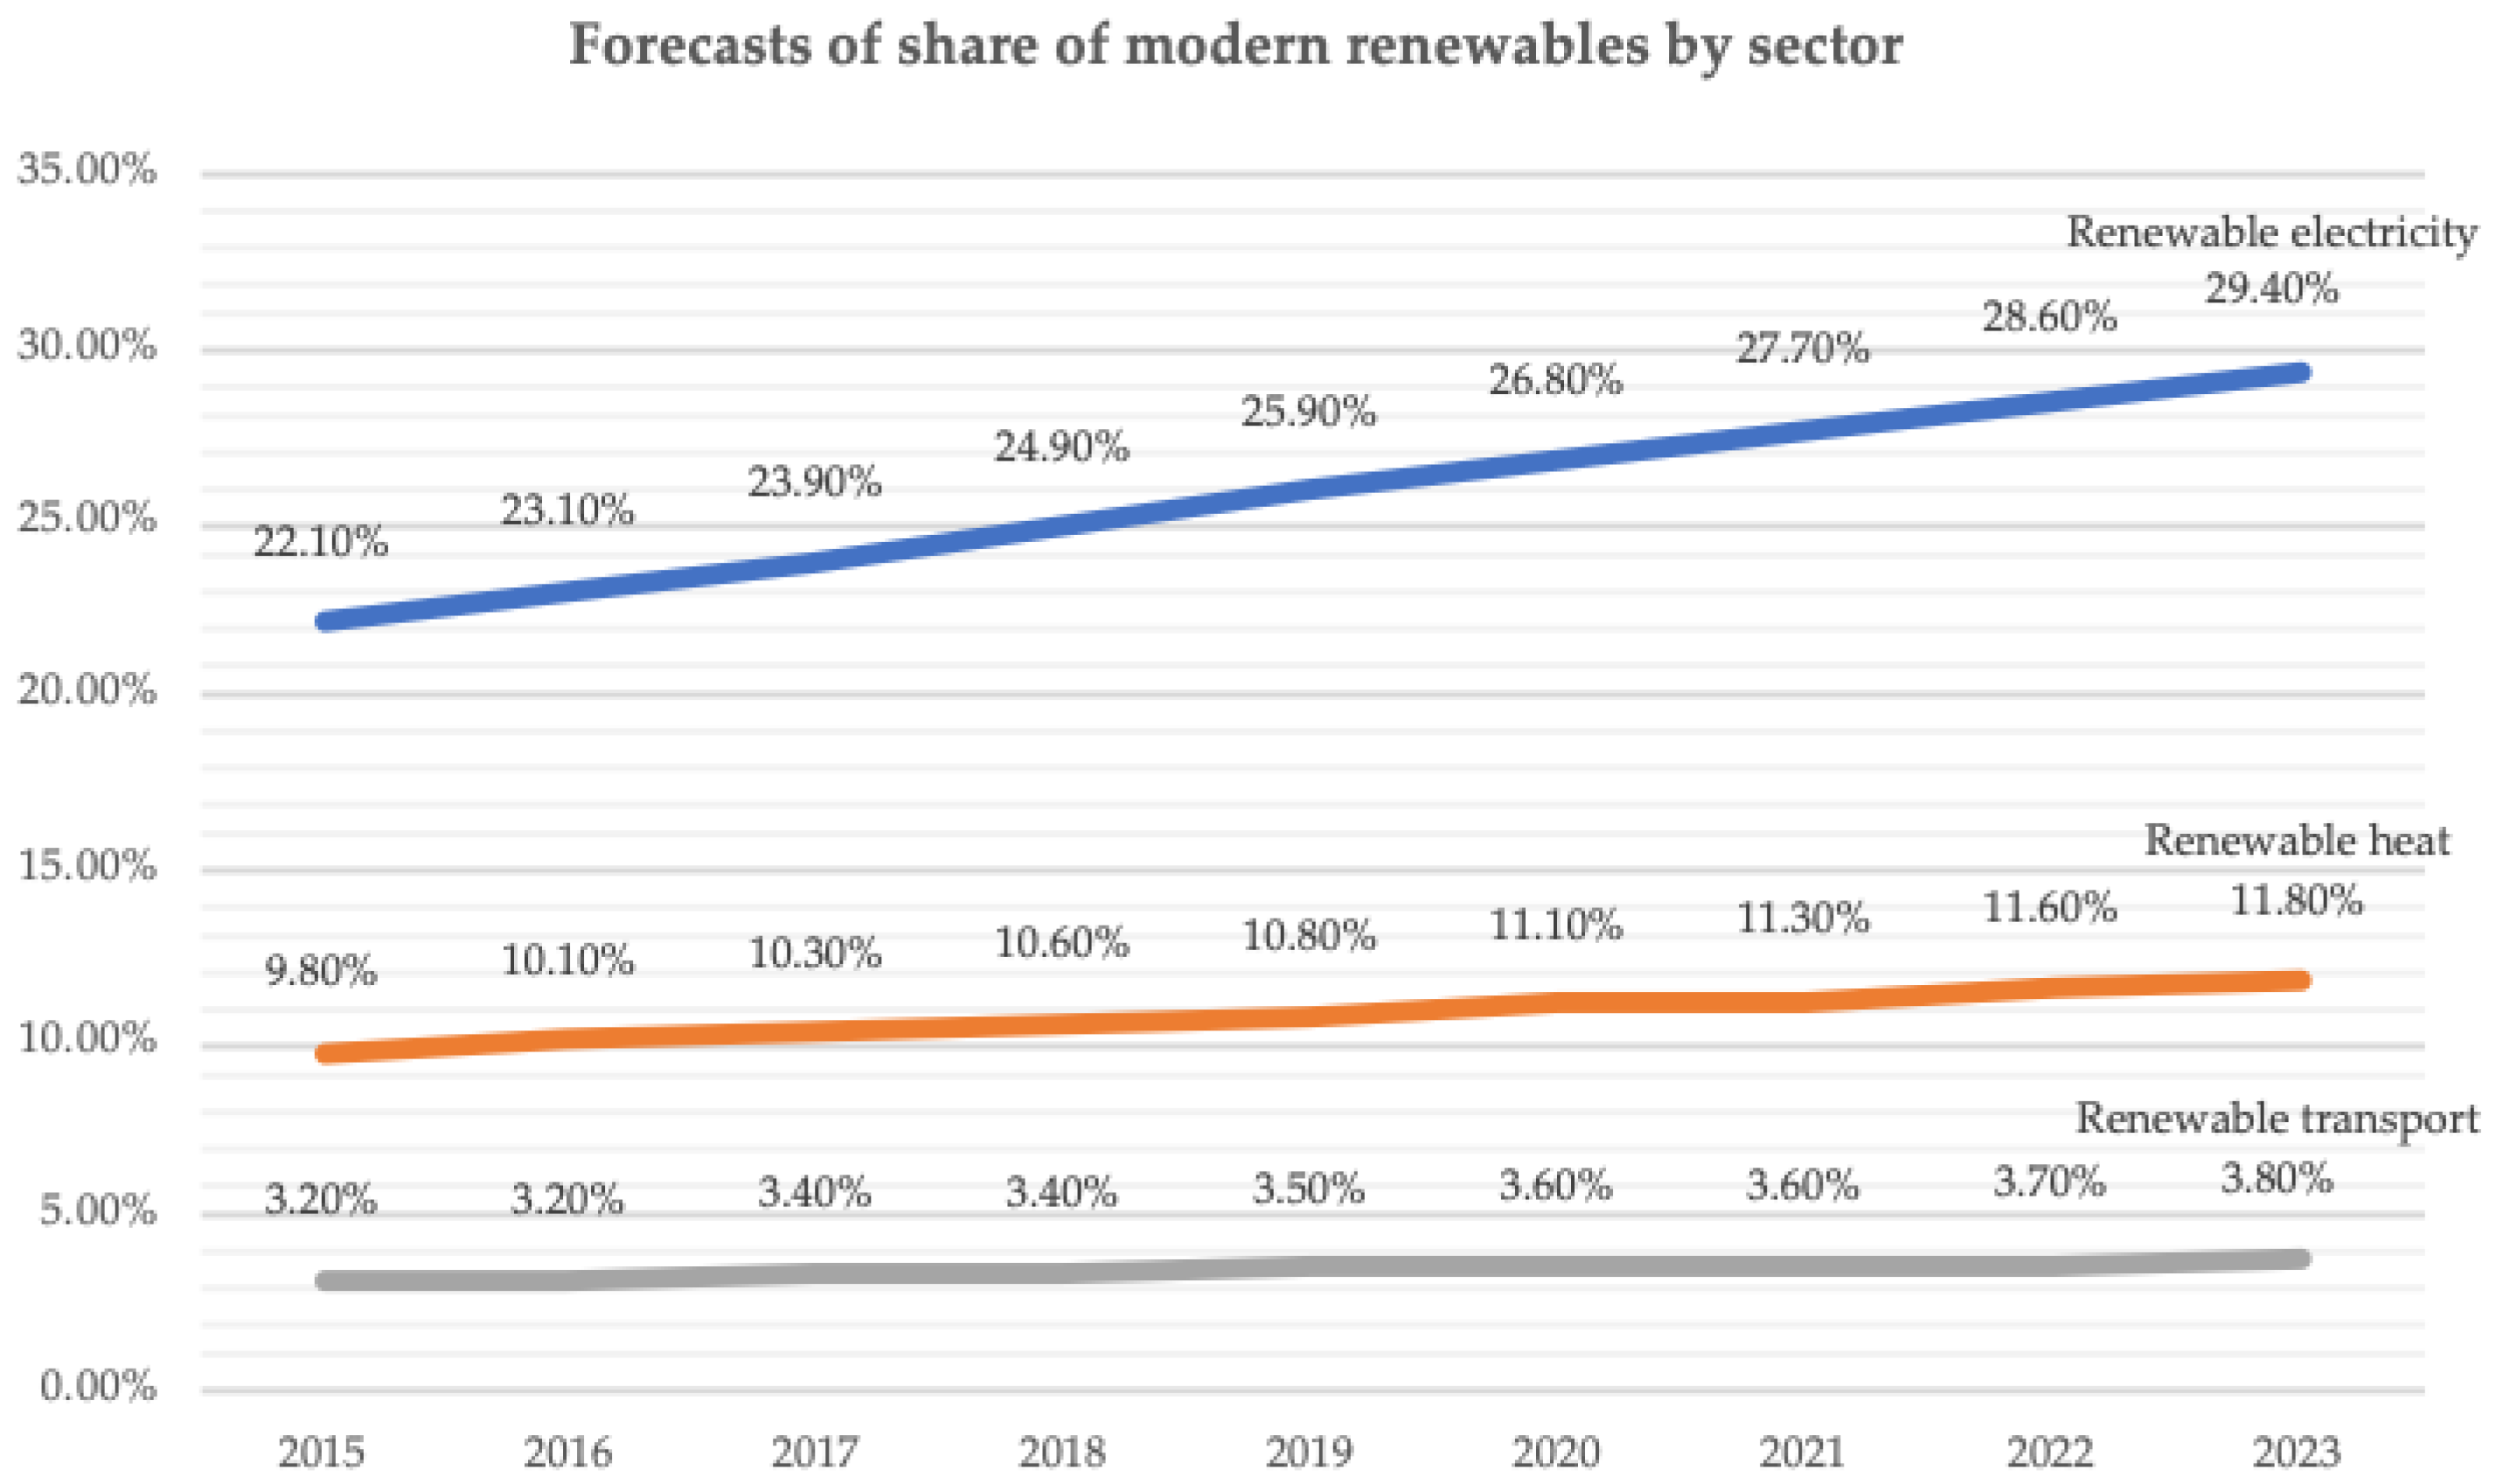
According to IEA’s projection report that was published in 2019 [66], the share of modern renewables (excluding the traditional use of biomass) in power demand is expected to increase from 26% in 2019 to 30% in 2024 (Figure 16), while the world’s electricity capacity based on renewables will grow by 50%. China is predicted to account for 40% of all renewable capacity growth, and solar photovoltaics will be the driving force of the growth of world’s renewable power capacity. This transition in the field of electricity is very important in order to minimize GHG emissions; however, it is equally important to decarbonize other sectors, like transport, buildings, and industries, for which the transition to renewables is considered much difficult [66].
Renewable heat is expected to expand by one-fifth in the period 2019–2024, but its share in total heat demand is not expected to increase by more than 12% (Figure 16). More specifically, biofuels, that are the largest renewable heat generators, are forecasted to lead growth, with a 12% increase.
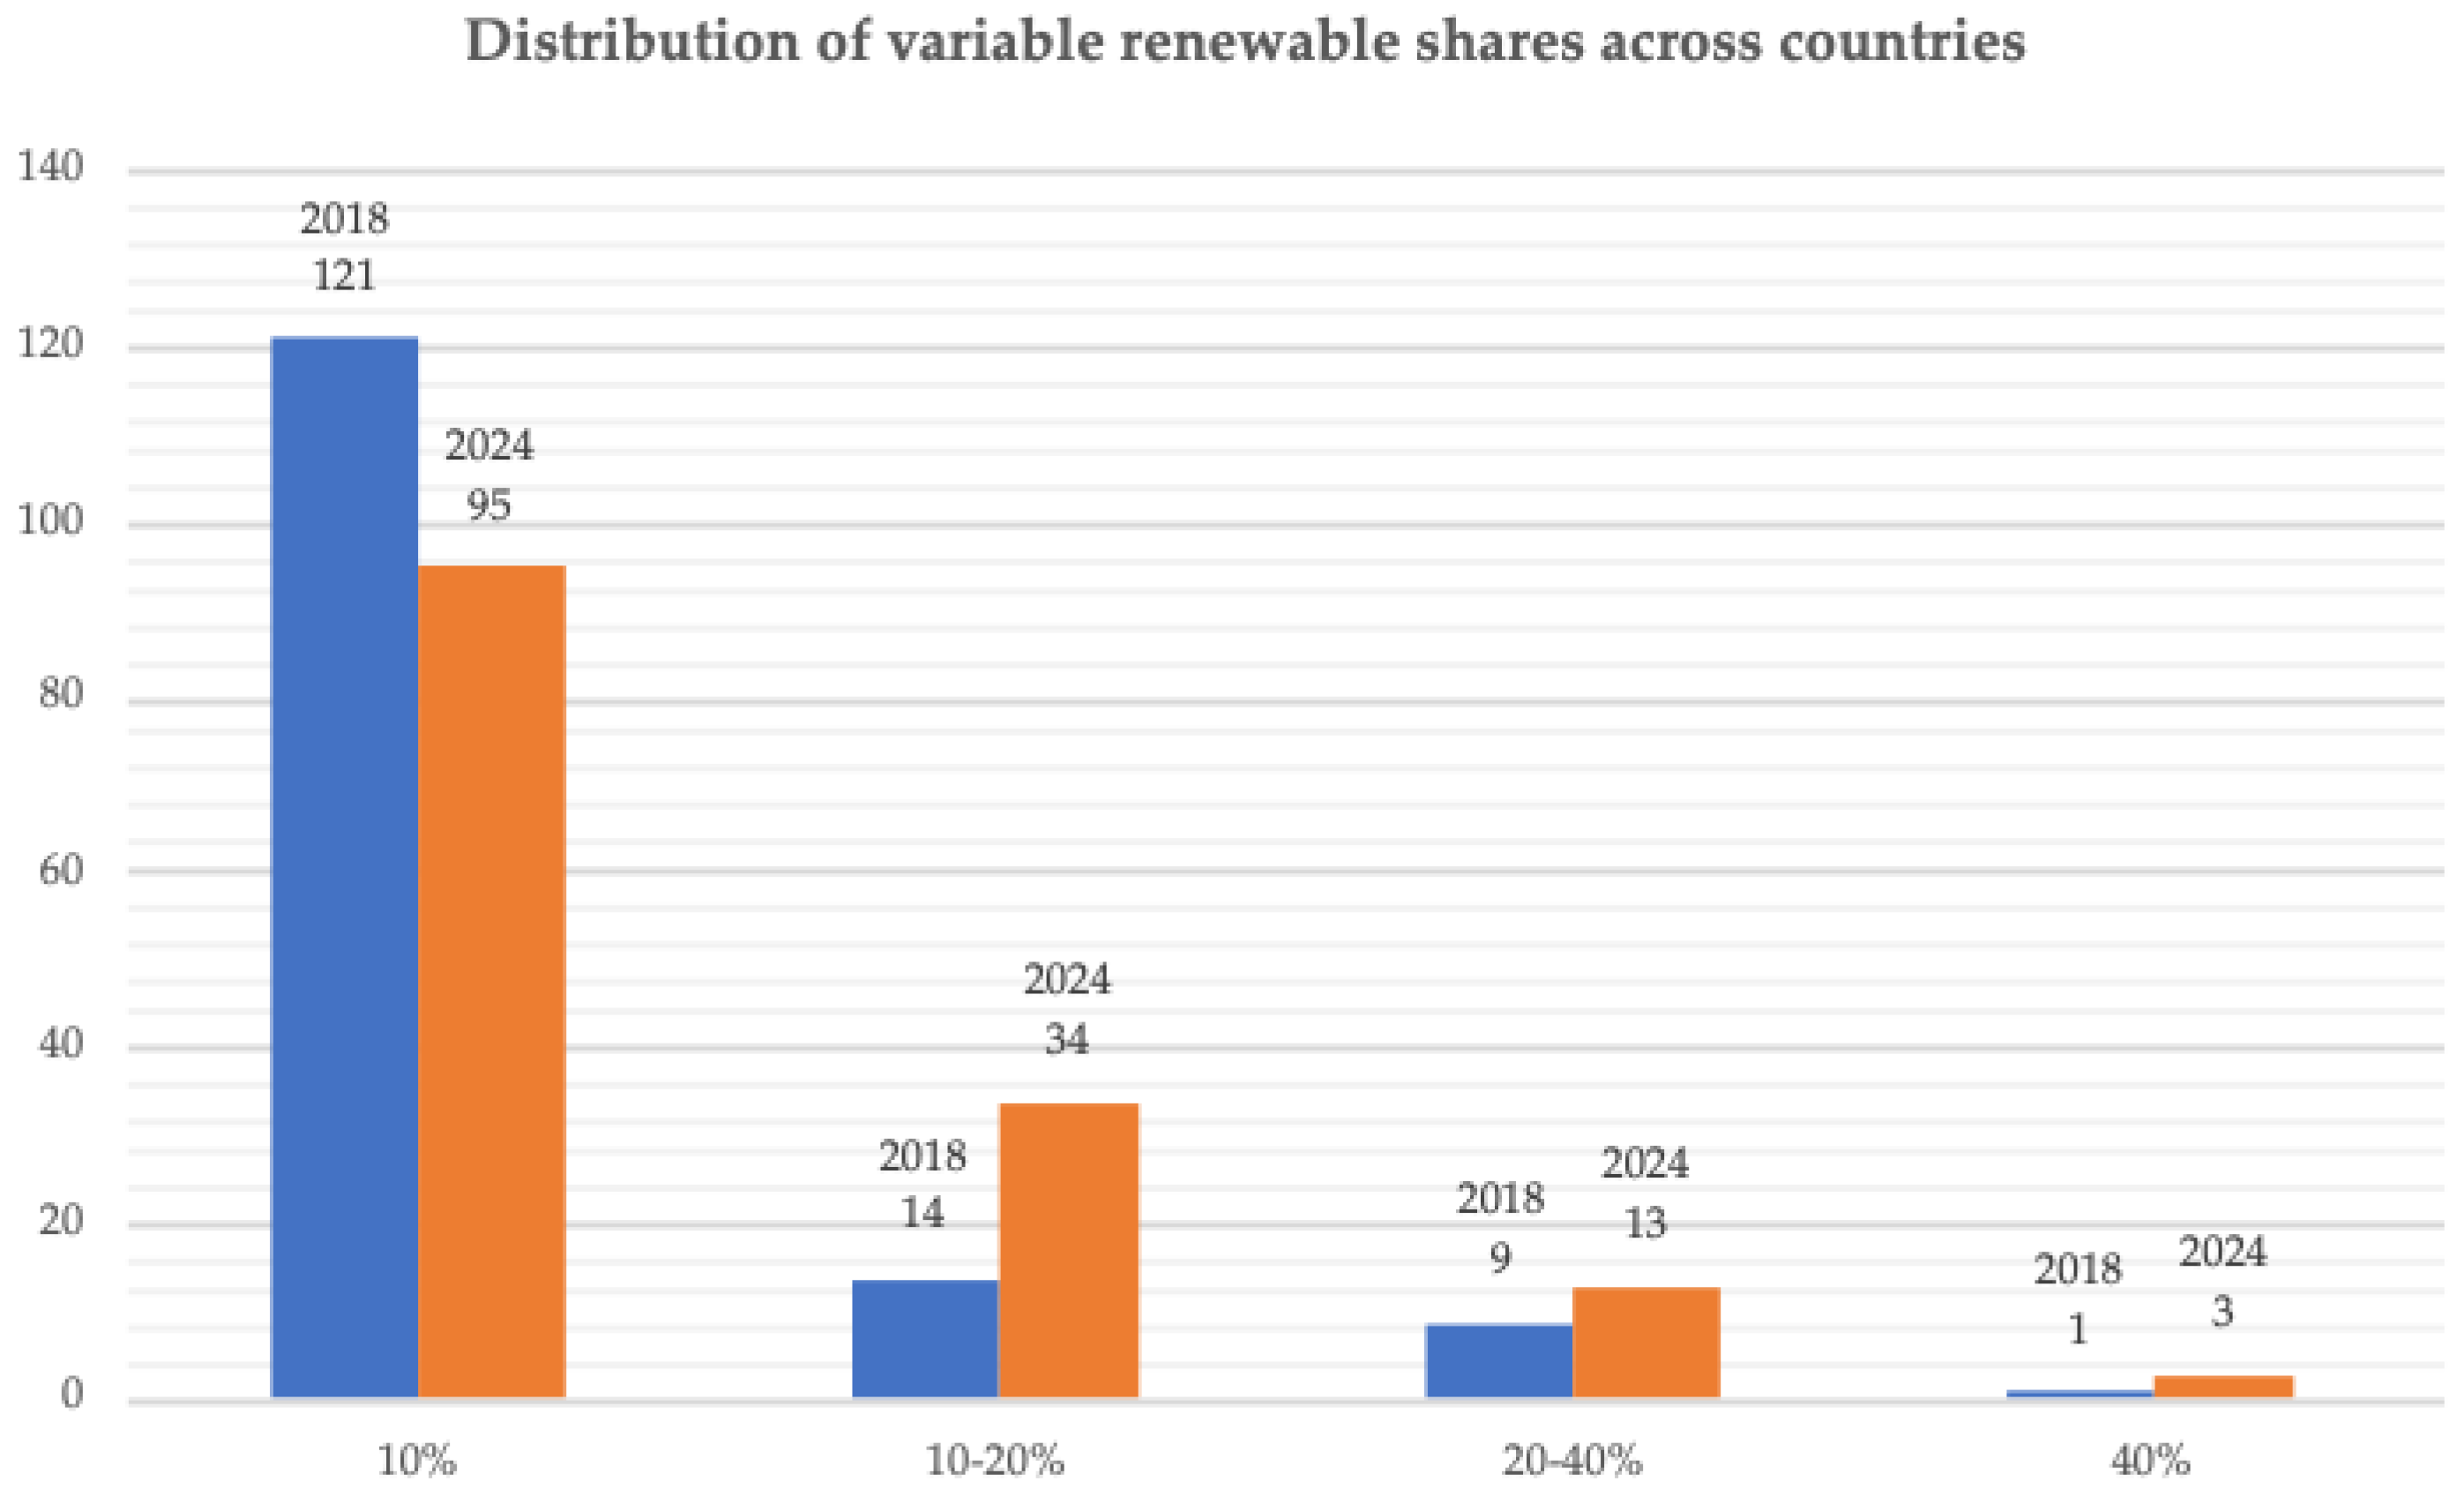
In most countries, the share of variable renewables (solar and wind energy) for 2018 was really low. More specifically, their share was under 10% for 121 countries around the world in 2018, between 10% and 20% for 14 countries, and between 20% and 40% for only 9 countries. According to IEA data [61], it is predicted that the number of countries that will use solar and wind power in highest percentages will increase by 2024, resulting in a highest share of variable renewables in many countries (Figure 17).
4. Conclusions
The excessive usage of fossil fuels and the GHG emissions that their burning produces are among the main driving forces of climate change. To limit their negative impact on the environment and the global temperature rise to below 2 °C, a transition to renewable energy sources is considered essential. Renewables are energy sources that are inexhaustible and can produce energy infinitely.
Renewable energy sources include solar energy, wind energy, biomass, geothermal energy, hydropower, and ocean energy. They have a number of advantages, since they can improve environmental quality and solve energy poverty problems, and are considered as a reliable energy source. Their main disadvantages include their high initial costs and their dependence on weather conditions.
A transition from fossil fuels to renewable energy sources is considered one of the most effective solutions for climate change, since it can ensure a carbon-free sustainable energy supply and meet the world’s energy demand. Because of their carbon-neutrality, RES are considered beneficial for human health: air pollution can provoke a plethora of health problems, which can be prevented with renewables’ usage. They also seem to have a positive impact on economic growth in most cases, since studies have shown that usually there is a bidirectional causality between them, and an increase in their usage would lead to an increase in countries’ GDP.
Consumers’ acceptance is important for the integration of renewables. Studies have shown that, usually, consumers are willing to pay for RES and green electricity, especially in the USA, Finland, Chile, Italy, and Germany.
According to IEA data, renewables provided 13.9% of the world’s total primary energy supply in 2017, while fossil fuels provided more than 80%. Most of that energy was used in the residential/commercial and public services sectors and for electricity generation. More specifically, in 2017, renewables provided about 25% of world’s electricity but only 8% of world’s heat. Historical data show that those shares have increased since 1990, and forecasts show that they are expected to increase more up to 2024.
Historical data show also that, even though the usage of renewables has increased over the years, world’s CO2 emissions have increased over 60%. This can lead to the conclusion that, even though the transition to renewable energy sources is important, energy saving and the reduction of energy consumption are equally important.
To limit global temperature rise to below 2 °C, it is important that the share of renewables in the final energy consumption is increased to 65% by 2050, according to the International Renewable Energy Agency. To achieve this goal and according to all data presented, we can recommend the following:
- Governments and decision-makers should focus on the integration of renewables and on the increase of RES shares in the total energy supply and demand. It is important that each country and each region are studied individually, so that all local factors are taken into consideration (local climate, economy, public needs), and the best solution is chosen.
- Governments and decision-makers should also focus on the wider context of climate change and global warming. They should promote decarbonization, energy saving strategies, and mitigation measures for GHG emissions in sectors such as transport, power generation, and industry, where fossil fuels are still the driving force.
- Research in the field of RES should be increased in order to improve the existing technologies. Improvements such as larger storage capacity and lower initial costs would solve the small obstacles that come with RES usage and, therefore, help increase their shares worldwide.
- Awareness about climate change should be increased, not only at the country level but also at the individual level. Improvements in education and early warning could promote higher levels of individual responsibility and a more efficient use of energy in each individual household, as well as a higher integration of RES.
- Developed countries that have economic resources to invest in research and development, education, and promotion of sustainable development and renewables’ usage should help developing countries that do not have the necessary economic resources to integrate environmentally friendly policies and address the challenges of climate change together.
Author Contributions
Both authors G.E.H. and E.-C.G. contributed equally to each section of this paper. All authors have read and agreed to the published version of the manuscript.
Funding
This research received no external funding.
Conflicts of Interest
The authors declare no conflict of interest.
References
- Owusu, P.A.; Asumadu-Sarkodie, S. A review of renewable energy sources, sustainability issues and climate change mitigation. Cogent Eng. 2016, 3, 1167990. [Google Scholar] [CrossRef]
- Masnadi, M.S.; Grace, J.R.; Bi, X.T.; Lim, C.J.; Ellis, N. From fossil fuels towards renewables: Inhibitory and catalytic effects on carbon thermochemical conversion during co-gasification of biomass with fossil fuels. Appl. Energy 2015, 140, 196–209. [Google Scholar] [CrossRef]
- EIA. International Energy Outlook 2019; U.S. Energy Information Administration: Washington, DC, USA, 2019.
- Höök, M.; Tang, X. Depletion of fossil fuels and anthropogenic climate change—A review. Energy Policy 2013, 52, 797–809. [Google Scholar] [CrossRef] [Green Version]
- Klemeš, J.J.; Varbanov, P.S.; Ocłoń, P.; Chin, H.H. Towards Efficient and Clean Process Integration: Utilisation of Renewable Resources and Energy-Saving Technologies. Energies 2019, 12, 4092. [Google Scholar] [CrossRef] [Green Version]
- Chiari, L.; Zecca, A. Constraints of fossil fuels depletion on global warming projections. Energy Policy 2011, 39, 5026–5034. [Google Scholar] [CrossRef]
- EPA. Greenhouse Gas. Emissions. Retrieved from United States Environmental Protection Agency. Available online: https://www.epa.gov/ghgemissions/overview-greenhouse-gases (accessed on 10 April 2020).
- United Nations. Sustainable Development Goals|UNDP. 2015. Available online: https://www.undp.org/content/undp/en/home/sustainable-development-goals.html (accessed on 10 May 2020).
- Levitan, O.; Dinamarca, J.; Hochman, G.; Falkowski, P.G. Diatoms: A fossil fuel of the future. Trends Biotechnol. 2014, 32, 117–124. [Google Scholar] [CrossRef]
- Dincer, I. Renewable energy and sustainable development: A crucial review. Renew. Sustain. Energy Rev. 2000, 4, 157–175. [Google Scholar] [CrossRef]
- Ellabban, O.; Abu-Rub, H.; Blaabjerg, F. Renewable energy resources: Current status, future prospects and their enabling technology. Renew. Sustain. Energy Rev. 2014, 39, 748–764. [Google Scholar] [CrossRef]
- Panwar, N.L.; Kaushik, S.C.; Kothari, S. Role of renewable energy sources in environmental protection: A review. Renew. Sustain. Energy Rev. 2011, 15, 1513–1524. [Google Scholar] [CrossRef]
- Siksnelyte-Butkiene, I.; Zavadskas, E.K.; Streimikiene, D. Multi-criteria decision-making (MCDM) for the assessment of renewable energy technologies in a household: A review. Energies 2020, 13, 1164. [Google Scholar] [CrossRef] [Green Version]
- Pablo-Romero, M.D.P.; Román, R.; Sánchez-Braza, A.; Yñiguez, R. Renewable Energy, Emissions, and Health. Renew. Energy Utilis. System Integr. 2016, 173. [Google Scholar] [CrossRef] [Green Version]
- Brook, B.W.; Bradshaw, C.J. Key role for nuclear energy in global biodiversity conservation. Conserv. Biol. 2015, 29, 702–712. [Google Scholar] [CrossRef] [PubMed]
- Timilsina, G.R.; Kurdgelashvili, L.; Narbel, P.A. Solar energy: Markets, economics and policies. Renew. Sustain. Energy Rev. 2012, 16, 449–465. [Google Scholar] [CrossRef]
- IRENA. Solar Energy. Retrieved from International Renewable Energy Agency. Available online: https://www.irena.org/solar (accessed on 26 May 2020).
- Kabir, E.; Kumar, P.; Kumar, S.; Adelodun, A.A.; Kim, K.H. Solar energy: Potential and future prospects. Renew. Sustain. Energy Rev. 2018, 82, 894–900. [Google Scholar] [CrossRef]
- Urban, F.; Mitchell, T. Climate Change, Disasters and Electricity Generation. Strengthening Climate Resilience Discussion Paper 8. 2011. Available online: https://opendocs.ids.ac.uk/opendocs/bitstream/handle/20.500.12413/2504/Climate+Change,+Disasters+and+Electricity+Generation.pdf?sequence=1 (accessed on 2 May 2020).
- Mohtasham, J. Renewable energies. Energy Procedia 2015, 74, 1289–1297. [Google Scholar] [CrossRef] [Green Version]
- IRENA. Wind Energy. Retrieved from International Renewable Energy Agency. 2019. Available online: https://www.irena.org/wind (accessed on 26 May 2020).
- Wind Europe. Wind Energy in Europe in 2019; Wind Europe: Brussels, Belgium, 2020. [Google Scholar]
- Saidur, R.; Rahim, N.A.; Islam, M.R.; Solangi, K.H. Environmental impact of wind energy. Renew. Sustain. Energy Rev. 2011, 15, 2423–2430. [Google Scholar] [CrossRef]
- IRENA. Bioenergy. Retrieved from International Renewable Energy Agency. 2019. Available online: https://www.irena.org/bioenergy (accessed on 26 May 2020).
- Bildirici, M.E. Economic growth and biomass energy. Biomass Bioenergy 2013, 50, 19–24. [Google Scholar] [CrossRef]
- Abbasi, T.; Abbasi, S.A. Biomass energy and the environmental impacts associated with its production and utilization. Renew. Sustain. Energy Rev. 2010, 14, 919–937. [Google Scholar] [CrossRef]
- Bilgili, F.; Koçak, E.; Bulut, Ü.; Kuşkaya, S. Can biomass energy be an efficient policy tool for sustainable development? Renew. Sustain. Energy Rev. 2017, 71, 830–845. [Google Scholar] [CrossRef]
- IRENA. Geothermal. Retrieved from International Renewable Energy Agency. 2019. Available online: https://www.irena.org/geothermal (accessed on 26 May 2020).
- Lund, J.W. Direct utilization of geothermal energy. Energies 2010, 3, 1443–1471. [Google Scholar] [CrossRef]
- Shortall, R.; Davidsdottir, B.; Axelsson, G. Geothermal energy for sustainable development: A review of sustainability impacts and assessment frameworks. Renew. Sustain. Energy Rev. 2015, 44, 391–406. [Google Scholar] [CrossRef]
- IRENA. Hydropower. Retrieved from International Renewable Energy Agency. 2019. Available online: https://www.irena.org/hydropower (accessed on 26 May 2020).
- Okot, D.K. Review of small hydropower technology. Renew. Sustain. Energy Rev. 2013, 26, 515–520. [Google Scholar] [CrossRef]
- Bagher, A.M.; Vahid, M.; Mohsen, M.; Parvin, D. Hydroelectric energy advantages and disadvantages. Am. J. Energy Sci. 2015, 2, 17–20. [Google Scholar]
- Uihlein, A. Life cycle assessment of ocean energy technologies. Int. J. Life Cycle Assess. 2016, 21, 1425–1437. [Google Scholar] [CrossRef] [Green Version]
- IRENA. Ocean. Retrieved from International Renewable Energy Agency. 2019. Available online: https://www.irena.org/ocean (accessed on 26 May 2020).
- Melikoglu, M. Current status and future of ocean energy sources: A global review. Ocean Eng. 2018, 148, 563–573. [Google Scholar] [CrossRef]
- Wright, G.; O’Hagan, A.M.; de Groot, J.; Leroy, Y.; Soininen, N.; Salcido, R.; Castelos, M.A.; Jude, S.; Rochette, J.; Kerr, S. Establishing a legal research agenda for ocean energy. Mar. Policy 2016, 63, 126–134. [Google Scholar] [CrossRef]
- Giddens, A.; Nugent, J. The politics of climate change. Hum. Geogr. 2010, 3, 111–114. [Google Scholar] [CrossRef]
- IPCC. Summary for Policymakers. In IPCC Special Report on Renewable Energy Sources and Climate Change Mitigation; Edenhofer, O., Pichs-Madruga, R., Sokona, Y., Seyboth, K., Matschoss, P., Kadner, S., Zwickel, T., Eickemeier, P., Hansen, G., Schlömer, S., et al., Eds.; Cambridge University Press: Cambridge, UK; New York, NY, USA, 2011. [Google Scholar]
- Luderer, G.; Krey, V.; Calvin, K.; Merrick, J.; Mima, S.; Pietzcker, R.; Van Vliet, J.; Wada, K. The role of renewable energy in climate stabilization: Results from the EMF27 scenarios. Clim. Chang. 2014, 123, 427–441. [Google Scholar] [CrossRef] [Green Version]
- Lotfalipour, M.R.; Falahi, M.A.; Ashena, M. Economic growth, CO2 emissions, and fossil fuels consumption in Iran. Energy 2010, 35, 5115–5120. [Google Scholar] [CrossRef]
- Apergis, N.; Payne, J.E. Renewable energy consumption and economic growth: Evidence from a panel of OECD countries. Energy Policy 2010, 38, 656–660. [Google Scholar] [CrossRef]
- Inglesi-Lotz, R. The impact of renewable energy consumption to economic growth: A panel data application. Energy Econ. 2016, 53, 58–63. [Google Scholar] [CrossRef]
- Bhattacharya, M.; Paramati, S.R.; Ozturk, I.; Bhattacharya, S. The effect of renewable energy consumption on economic growth: Evidence from top 38 countries. Appl. Energy 2016, 162, 733–741. [Google Scholar] [CrossRef]
- Adams, S.; Klobodu, E.K.M.; Apio, A. Renewable and non-renewable energy, regime type and economic growth. Renew. Energy 2018, 125, 755–767. [Google Scholar] [CrossRef]
- Halkos, G.E.; Tzeremes, N.G. Renewable energy consumption and economic efficiency: Evidence from European countries. J. Renew. Sustain. Energy 2013, 5, 041803. [Google Scholar] [CrossRef] [Green Version]
- Perera, F.P. Multiple threats to child health from fossil fuel combustion: Impacts of air pollution and climate change. Environ. Health Perspect. 2017, 125, 141–148. [Google Scholar] [CrossRef] [PubMed]
- WHO Regional Office for Europe, OECD. Economic Cost of the Health Impact of Air Pollution in Europe: Clean Air, Health and Wealth; WHO Regional Office for Europe: Copenhagen, Denmark, 2015.
- Sardianou, E.; Genoudi, P. Which factors affect the willingness of consumers to adopt renewable energies? Renew. Energy 2013, 57, 1–4. [Google Scholar] [CrossRef]
- Aldy, J.E.; Kotchen, M.J.; Leiserowitz, A.A. Willingness to pay and political support for a US national clean energy standard. Nat. Clim. Chang. 2012, 2, 596–599. [Google Scholar] [CrossRef]
- Mozumder, P.; Vásquez, W.F.; Marathe, A. Consumers’ preference for renewable energy in the southwest USA. Energy Econ. 2011, 33, 1119–1126. [Google Scholar] [CrossRef]
- Zhang, L.; Wu, Y. Market segmentation and willingness to pay for green electricity among urban residents in China: The case of Jiangsu Province. Energy Policy 2012, 51, 514–523. [Google Scholar] [CrossRef]
- Ivanova, G.A. Consumers’ Willingness to Pay for Electricity from Renewable Energy Sources, Queensland, Australia. Int. J. Renew. Energy Res. (IJRER) 2013, 2, 758–766. [Google Scholar]
- Sagebiel, J.; Müller, J.R.; Rommel, J. Are consumers willing to pay more for electricity from cooperatives? Results from an online Choice Experiment in Germany. Energy Res. Soc. Sci. 2014, 2, 90–101. [Google Scholar] [CrossRef] [Green Version]
- Bigerna, S.; Polinori, P. Italian households’ willingness to pay for green electricity. Renew. Sustain. Energy Rev. 2014, 34, 110–121. [Google Scholar] [CrossRef]
- Hanemann, M.; Labandeira, X.; Loureiro, M.L. Climate change, energy and social preferences on policies: Exploratory evidence for Spain. Clim. Res. 2011, 48, 343–348. [Google Scholar] [CrossRef] [Green Version]
- Ntanos, S.; Kyriakopoulos, G.; Chalikias, M.; Arabatzis, G.; Skordoulis, M. Public perceptions and willingness to pay for renewable energy: A case study from Greece. Sustainability 2018, 10, 687. [Google Scholar] [CrossRef] [Green Version]
- Zografakis, N.; Sifaki, E.; Pagalou, M.; Nikitaki, G.; Psarakis, V.; Tsagarakis, K.P. Assessment of public acceptance and willingness to pay for renewable energy sources in Crete. Renew. Sustain. Energy Rev. 2010, 14, 1088–1095. [Google Scholar] [CrossRef]
- Scarpa, R.; Willis, K. Willingness-to-pay for renewable energy: Primary and discretionary choice of British households’ for micro-generation technologies. Energy Econ. 2010, 32, 129–136. [Google Scholar] [CrossRef]
- Sundt, S.; Rehdanz, K. Consumers’ willingness to pay for green electricity: A meta-analysis of the literature. Energy Econ. 2015, 51, 1–8. [Google Scholar] [CrossRef] [Green Version]
- IEA. Data and Statistics. Available online: https://www.iea.org (accessed on 11 May 2020).
- OECD. Renewable Energy (Indicator). Retrieved from OECD iLibrary. 2020. Available online: https://0-www-oecd--ilibrary-org.brum.beds.ac.uk/energy/renewable-energy/indicator/english_aac7c3f1-en (accessed on 16 May 2020).
- IRENA. Trends in Renewable Energy. Retrieved from International Renewable Energy Agency. 2019. Available online: https://www.irena.org/Statistics/View-Data-by-Topic/Capacity-and-Generation/Statistics-Time-Series (accessed on 15 May 2020).
- IRENA. Global Trends in Renewable Energy Investment. Retrieved from International Renewable Energy Agency. 2019. Available online: https://www.irena.org/financeinvestment (accessed on 15 May 2020).
- IRENA. Global Energy Transformation: A Roadmap to 2050 (2019 Edition); International Renewable Energy Agency: Abu Dhabi, UAE, 2019. [Google Scholar]
- IEA. Renewables 2019; IEA: Paris, France, 2019. Available online: https://www.iea.org/reports/renewables-2019 (accessed on 11 May 2020).
Figure 1.
World Total Primary Energy Supply 2017 (Source: IEA).

Figure 2.
World Total Primary Energy Supply 2020 (authors’ forecasts).

Figure 3.
Renewables’ Consumption by Sector 2017 (Source: IEA).

Figure 4.
Renewables’ Consumption by Sector 2020 (authors’ forecasts).

Figure 5.
Electricity Generation by Source 2017 (Source: IEA).

Figure 6.
Electricity Generation by Source 2020 (authors’ forecasts).

Figure 7.
Heat Generation by Source 2017 (Source: IEA).

Figure 8.
Heat Generation by Source 2020 (authors’ forecasts).

Figure 9.
Renewable energy 2017 (as a % of primary energy supply) (Source: OECD).

Figure 10.
Installed capacity of world’s renewable energy in 2019 (Source: IRENA).

Figure 11.
Evolution of renewable energy (RE) supply from 1990 to 2021 (Source: IEA and authors’ forecasts).
Figure 11.
Evolution of renewable energy (RE) supply from 1990 to 2021 (Source: IEA and authors’ forecasts).

Figure 12.
Average annual growth rates of world renewables supply from 1990 to 2017 (Source: IEA).

Figure 13.
Evolution of RE share (%) in total electricity generation and in total heat generation from 1990 to 2021 (Source: IEA and authors’ forecasts).
Figure 13.
Evolution of RE share (%) in total electricity generation and in total heat generation from 1990 to 2021 (Source: IEA and authors’ forecasts).

Figure 14.
Global trends in Renewable Energy Investment from 2010 to 2018 (Source: IRENA).

Figure 15.
Evolution of CO2 emissions/capita from 1990 to 2017 (Source: IEA).

Figure 16.
Forecasts of the share of modern renewables by sector (Source: IEA).

Figure 17.
Distribution of variable renewable shares across countries (Source: IEA).

© 2020 by the authors. Licensee MDPI, Basel, Switzerland. This article is an open access article distributed under the terms and conditions of the Creative Commons Attribution (CC BY) license (http://creativecommons.org/licenses/by/4.0/).
Share and Cite
MDPI and ACS Style
Halkos, G.E.; Gkampoura, E.-C. Reviewing Usage, Potentials, and Limitations of Renewable Energy Sources. Energies 2020, 13, 2906. https://0-doi-org.brum.beds.ac.uk/10.3390/en13112906
AMA Style
Halkos GE, Gkampoura E-C. Reviewing Usage, Potentials, and Limitations of Renewable Energy Sources. Energies. 2020; 13(11):2906. https://0-doi-org.brum.beds.ac.uk/10.3390/en13112906
Chicago/Turabian StyleHalkos, George E., and Eleni-Christina Gkampoura. 2020. "Reviewing Usage, Potentials, and Limitations of Renewable Energy Sources" Energies 13, no. 11: 2906. https://0-doi-org.brum.beds.ac.uk/10.3390/en13112906
Note that from the first issue of 2016, this journal uses article numbers instead of page numbers. See further details here.