Fault Detection Methodology for Secondary Fluid Flow Rate in a Heat Pump Unit


1
Department of Mechanical Engineering, Cape Coast Technical University, P.O. Box DL 50, Cape Coast, Ghana
2
Graduate School of Mechanical Engineering, Hanbat National University, Daejeon 34158, Korea
3
Department of Architectural Engineering, Pusan National University, Busan 46241, Korea
4
Department of Mechanical Engineering, Hanbat National University, Daejeon 34158, Korea
*
Author to whom correspondence should be addressed.
Energies 2020, 13(11), 2974; https://0-doi-org.brum.beds.ac.uk/10.3390/en13112974
Submission received: 18 May 2020
/
Revised: 4 June 2020
/
Accepted: 5 June 2020
/
Published: 9 June 2020
(This article belongs to the Special Issue Designing, Modeling and Optimizing Energy and Environmental Systems for Buildings)
Abstract
:Fault detection and diagnosis (FDD) has become an important subject in heat pumps due to its potential for energy savings. However, research on multiple faults occurring at the secondary fluid side of heat pumps is rare in the open literature. This study experimentally examined single secondary fluid flow rate faults (SSFF) and multiple-simultaneous secondary fluid flow rate faults (MSSFF) and their effects on the performance of a heat pump unit, which is a core component of ground source heat pump systems, and proposed FDD methodology to detect these faults. The secondary fluid flow rate faults were simulated in cooling mode by varying the evaporator and condenser secondary fluid flow rates at 60%, 80%, 100%, 120%, and 140% of the reference value according to varying outdoor entering water temperature conditions. Condenser secondary fluid flow rate faults affected the heat pump coefficient of performance(COP) significantly more than the evaporator secondary fluid flow rate fault in SSFF. Cooling capacity was highly dependent on the evaporator secondary fluid flow rate fault while COP was greatly affected by the condenser secondary fluid flow rate fault in MSSFF. The FDD methodology was modeled using correlations and performance trends of the heat pump and can detect SSFF and MSSFF within an error threshold of ±1.6% and ±6.4% respectively.
1. Introduction
Ground source heat pumps (GSHP) are highly efficient new and renewable energy systems consisting of heat pump units and ground heat exchangers and are used for cooling, heating, and generating hot water [1]. The occurrence of faults during the operation of heat pump units can make GSHPs highly inefficient and energy-intensive. Faults such as refrigerant leak, fouling, compressor leak, and reduction in secondary fluid flow rates (SFFR) can reduce heat pump performance by about 30% [2,3,4]. This has attracted great research interest in heat pump fault detection and diagnosis (FDD) in recent times.
Many researchers have proposed FDD models for single faults occurring in heat pumps. Choi et al. Reference [5] developed an FDD model for refrigerant charge faults in a ground source heat pump using the degree of subcooling since it is directly related to the refrigerant charge amount. Payne et al. Reference [6] used a data-clustering methodology to detect and diagnose faults in packaged air-conditioners. The methodology was developed to apply laboratory-based FDD algorithms to that of real systems installed on the field. Gasche et al. [7] modeled a two-phase FDD algorithm for refrigerant faults in rolling piston compressors to determine if temperature affects the extent of refrigerant charge faults. The study found that refrigerant faults predicted using isothermal FDD models differ greatly from those predicted using non-isothermal FDD models. Cho et al. [8] developed correlations for the cooling mode performance parameters of a heat pump imposed with single faults according to indoor and outdoor temperature conditions. Yoo et al. [9] developed a methodology to detect slow and long-term refrigerant faults in a residential air conditioner using the difference between the inlet air temperature and midpoint temperature of a heat exchanger. The study found that the trend of the temperature difference was not affected by varying outdoor temperature conditions. Wang et al. [10] developed an FDD model for various heating, ventilation, and air conditioning(HVAC) subsystems with sensor faults and found that various faults in heat pump systems can be detected using processed data from sensor measurements. Casteleiro-Roca et al. [11] developed a new FDD approach for geothermal heat exchanger faults using classification techniques. Saththasivam et al. [12] developed an FDD mechanism for common faults in chillers using the standard thermodynamic model. The model was used to obtain thermal resistance and internal entropy generation as a coefficient, which was used to detect condenser fouling and flow rate faults. Sellami et al. [13] developed an FDD model to detect single faults in a refrigerator compartment using the bond graph method, which was done using linear fractional transformations. The authors adopted the bond graph approach due to its merit as far as the implementation of processed data is concerned. Zhao et al. [14] proposed an FDD algorithm for centrifugal chillers and tested it experimentally on fouling in the condenser, refrigerant faults, and un-condensable gas faults. Noel et al. [15] experimentally studied the impacts of refrigerant charge faults and heat exchanger fouling on the performance parameters of a variable speed compressor heat pump.
A few studies have also been carried on heat pump FDD for multiple faults. Zhao et al. [16] developed a decoupling-based FDD model to bridge the gap between laboratory and real-time FDD applications. The FDD model detected single and multiple-simultaneous refrigerant faults in a chiller. Han et al. [17] used a combined support vector machine and multi-label methods to automatically detect and diagnose faults in a building chiller. The study had enough experimental data to validate the single FDD model but had limited experimental data to validate the multiple-simultaneous FDD model. Du and Jin [18] used Fisher discriminant analysis to develop FDD algorithms for multiple-simultaneous faults in air handling units. The faults considered in the study included water valve and sensor faults.
According to literature, there is a decrease in the secondary fluid flow rate due to the blocking of strainer in heat pumps [19]. However, most works available in the open literature on heat pump FDD have focused on single faults that occur in the refrigerant side with little research on secondary fluid flow rate fault detection in the open literature. The few multi-fault FDD models available in the open literature have focused on sensor faults and faults occurring at the refrigerant side [16,17,18]. Meanwhile, multiple faults occurring at the secondary fluid side of heat pumps is inevitable. This study, therefore, analyzes the effect of simultaneously occurring condenser and evaporator secondary fluid flow rate faults on the performance of a water-to-water heat pump unit. The study also develops a methodology to detect single secondary fluid flow rate faults (SSFF) and multiple-simultaneous secondary fluid flow rate faults (MSSFF) for the water-to-water heat pump using linear correlations and rule-based fault categorization tables. The FDD methodology uses the measurement from temperature sensors to detect faults in heat pumps. It is therefore cheap and easy to apply to the control systems of heat pumps for the early detection of single and multiple-simultaneous secondary fluid faults to prevent performance reduction, higher energy consumption, and higher operating costs of heat pumps.
2. Materials and Methods
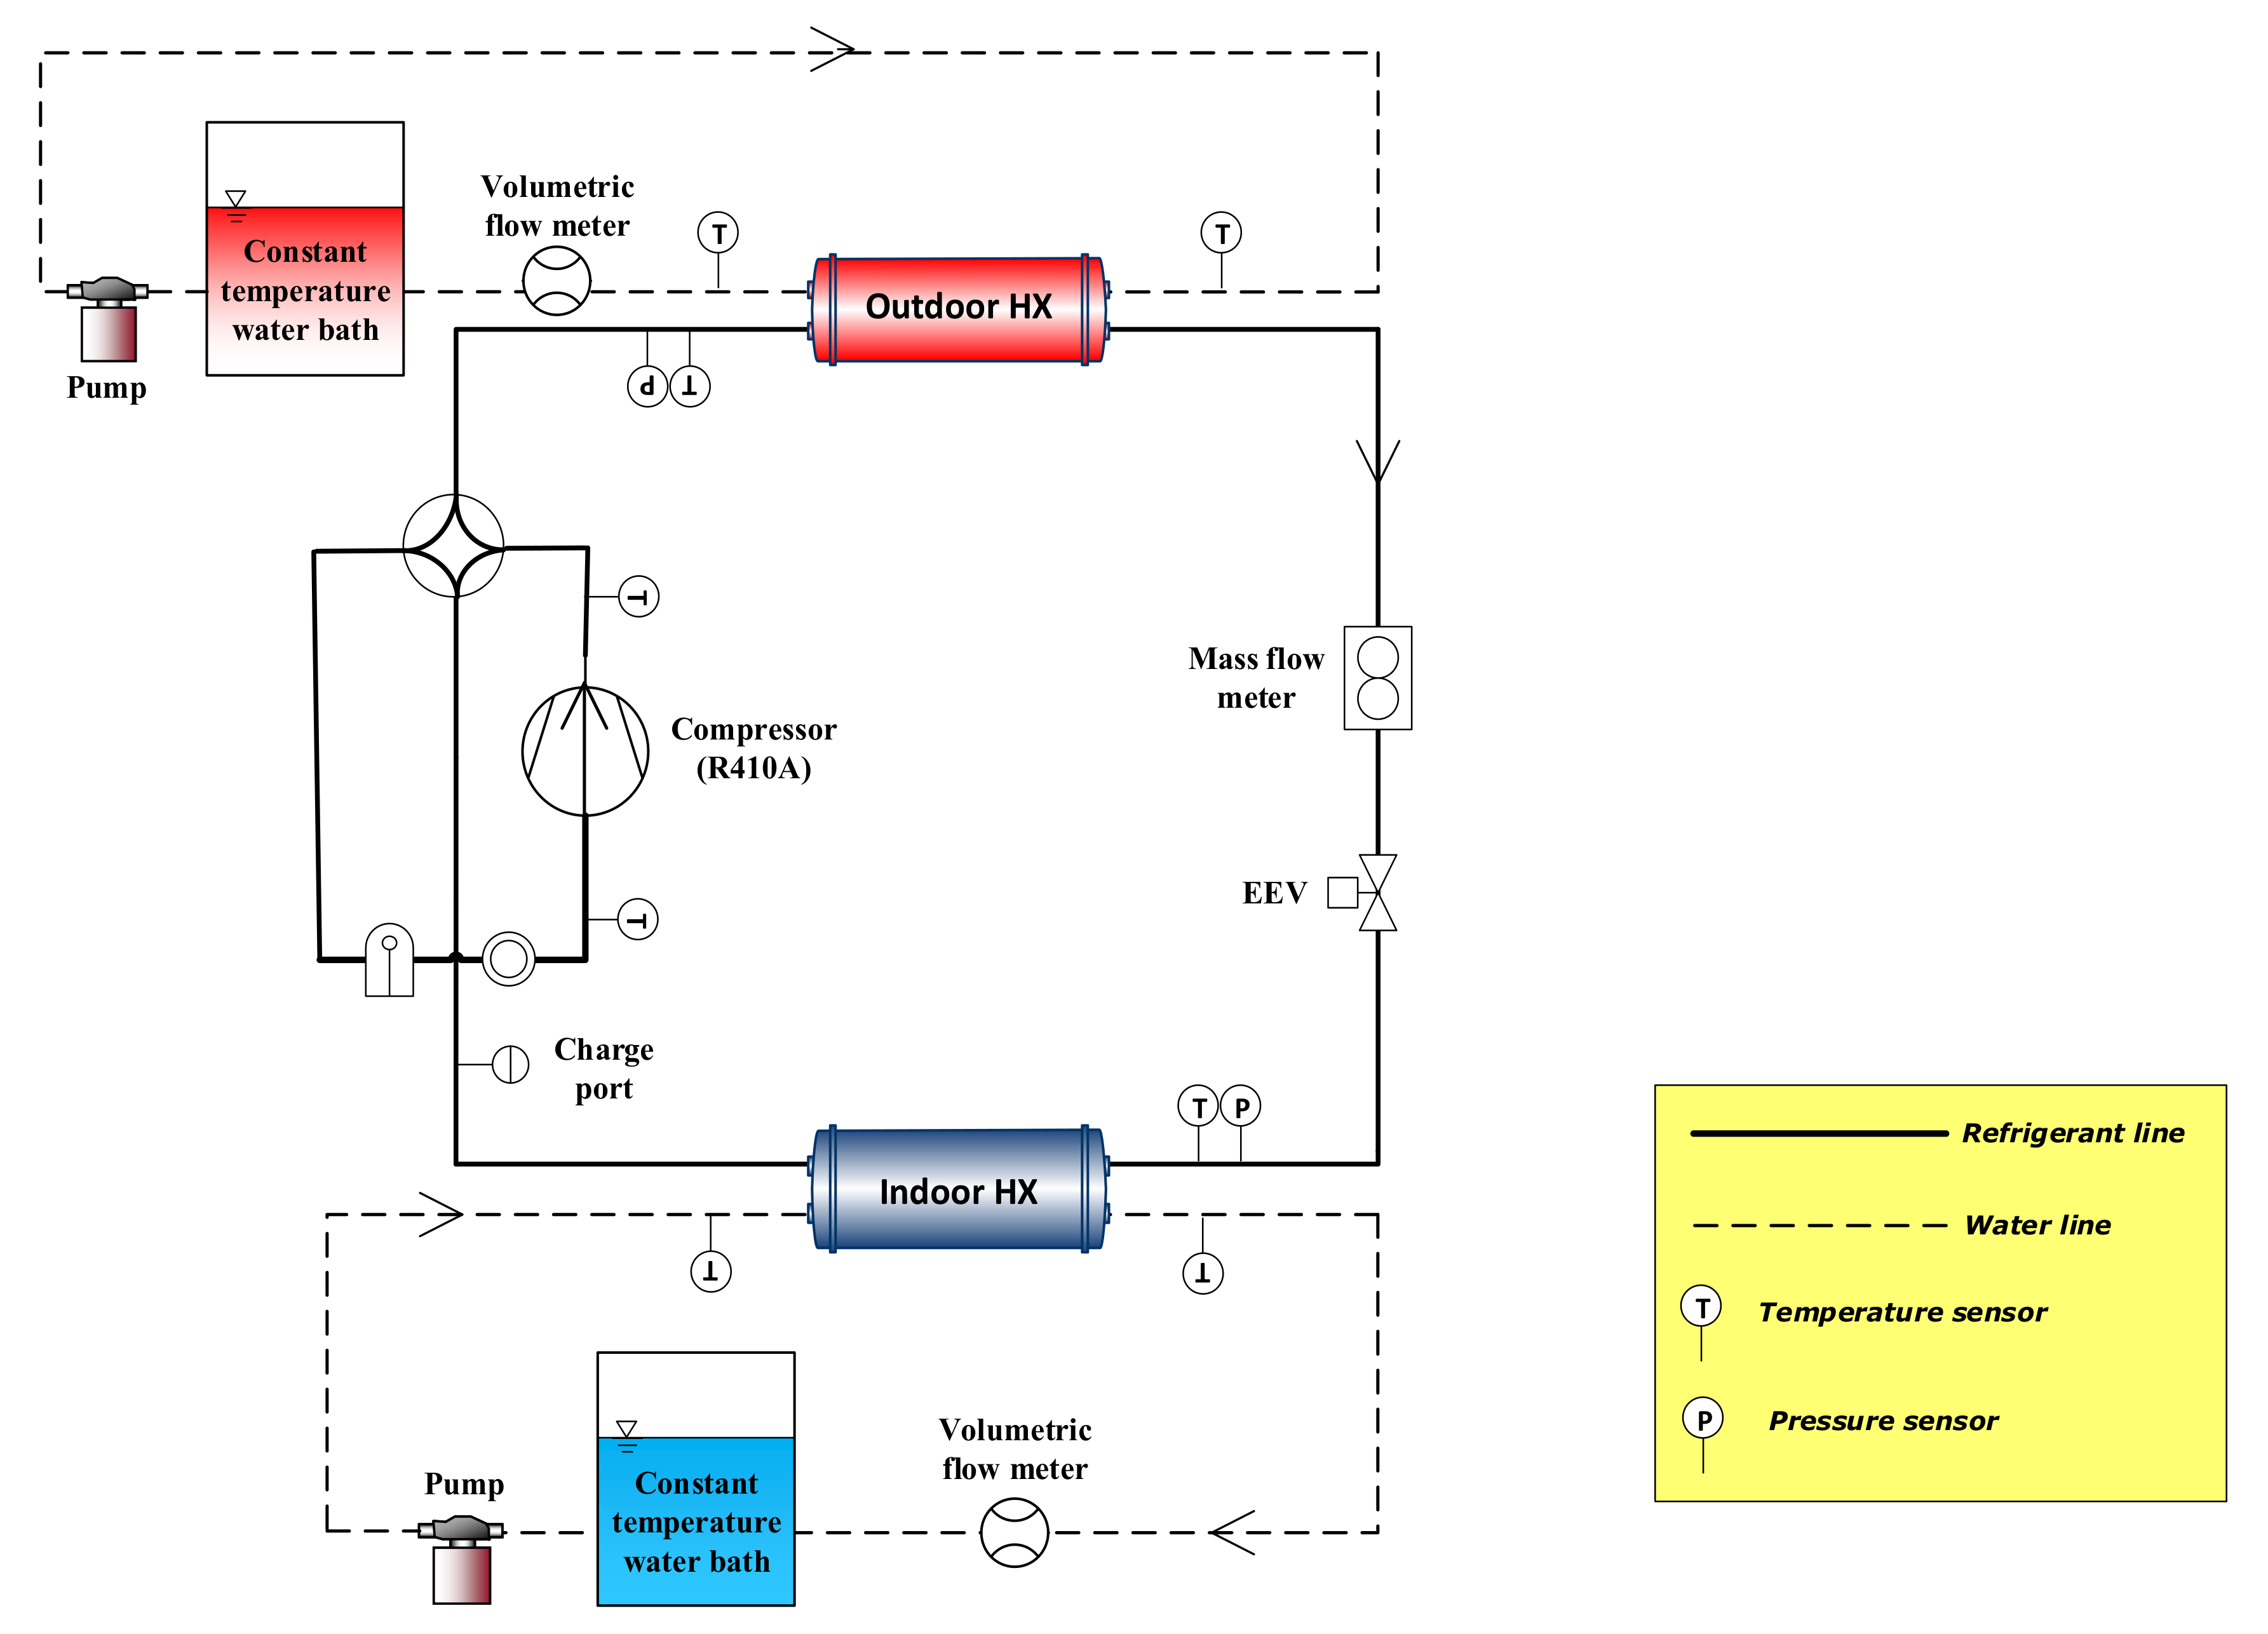
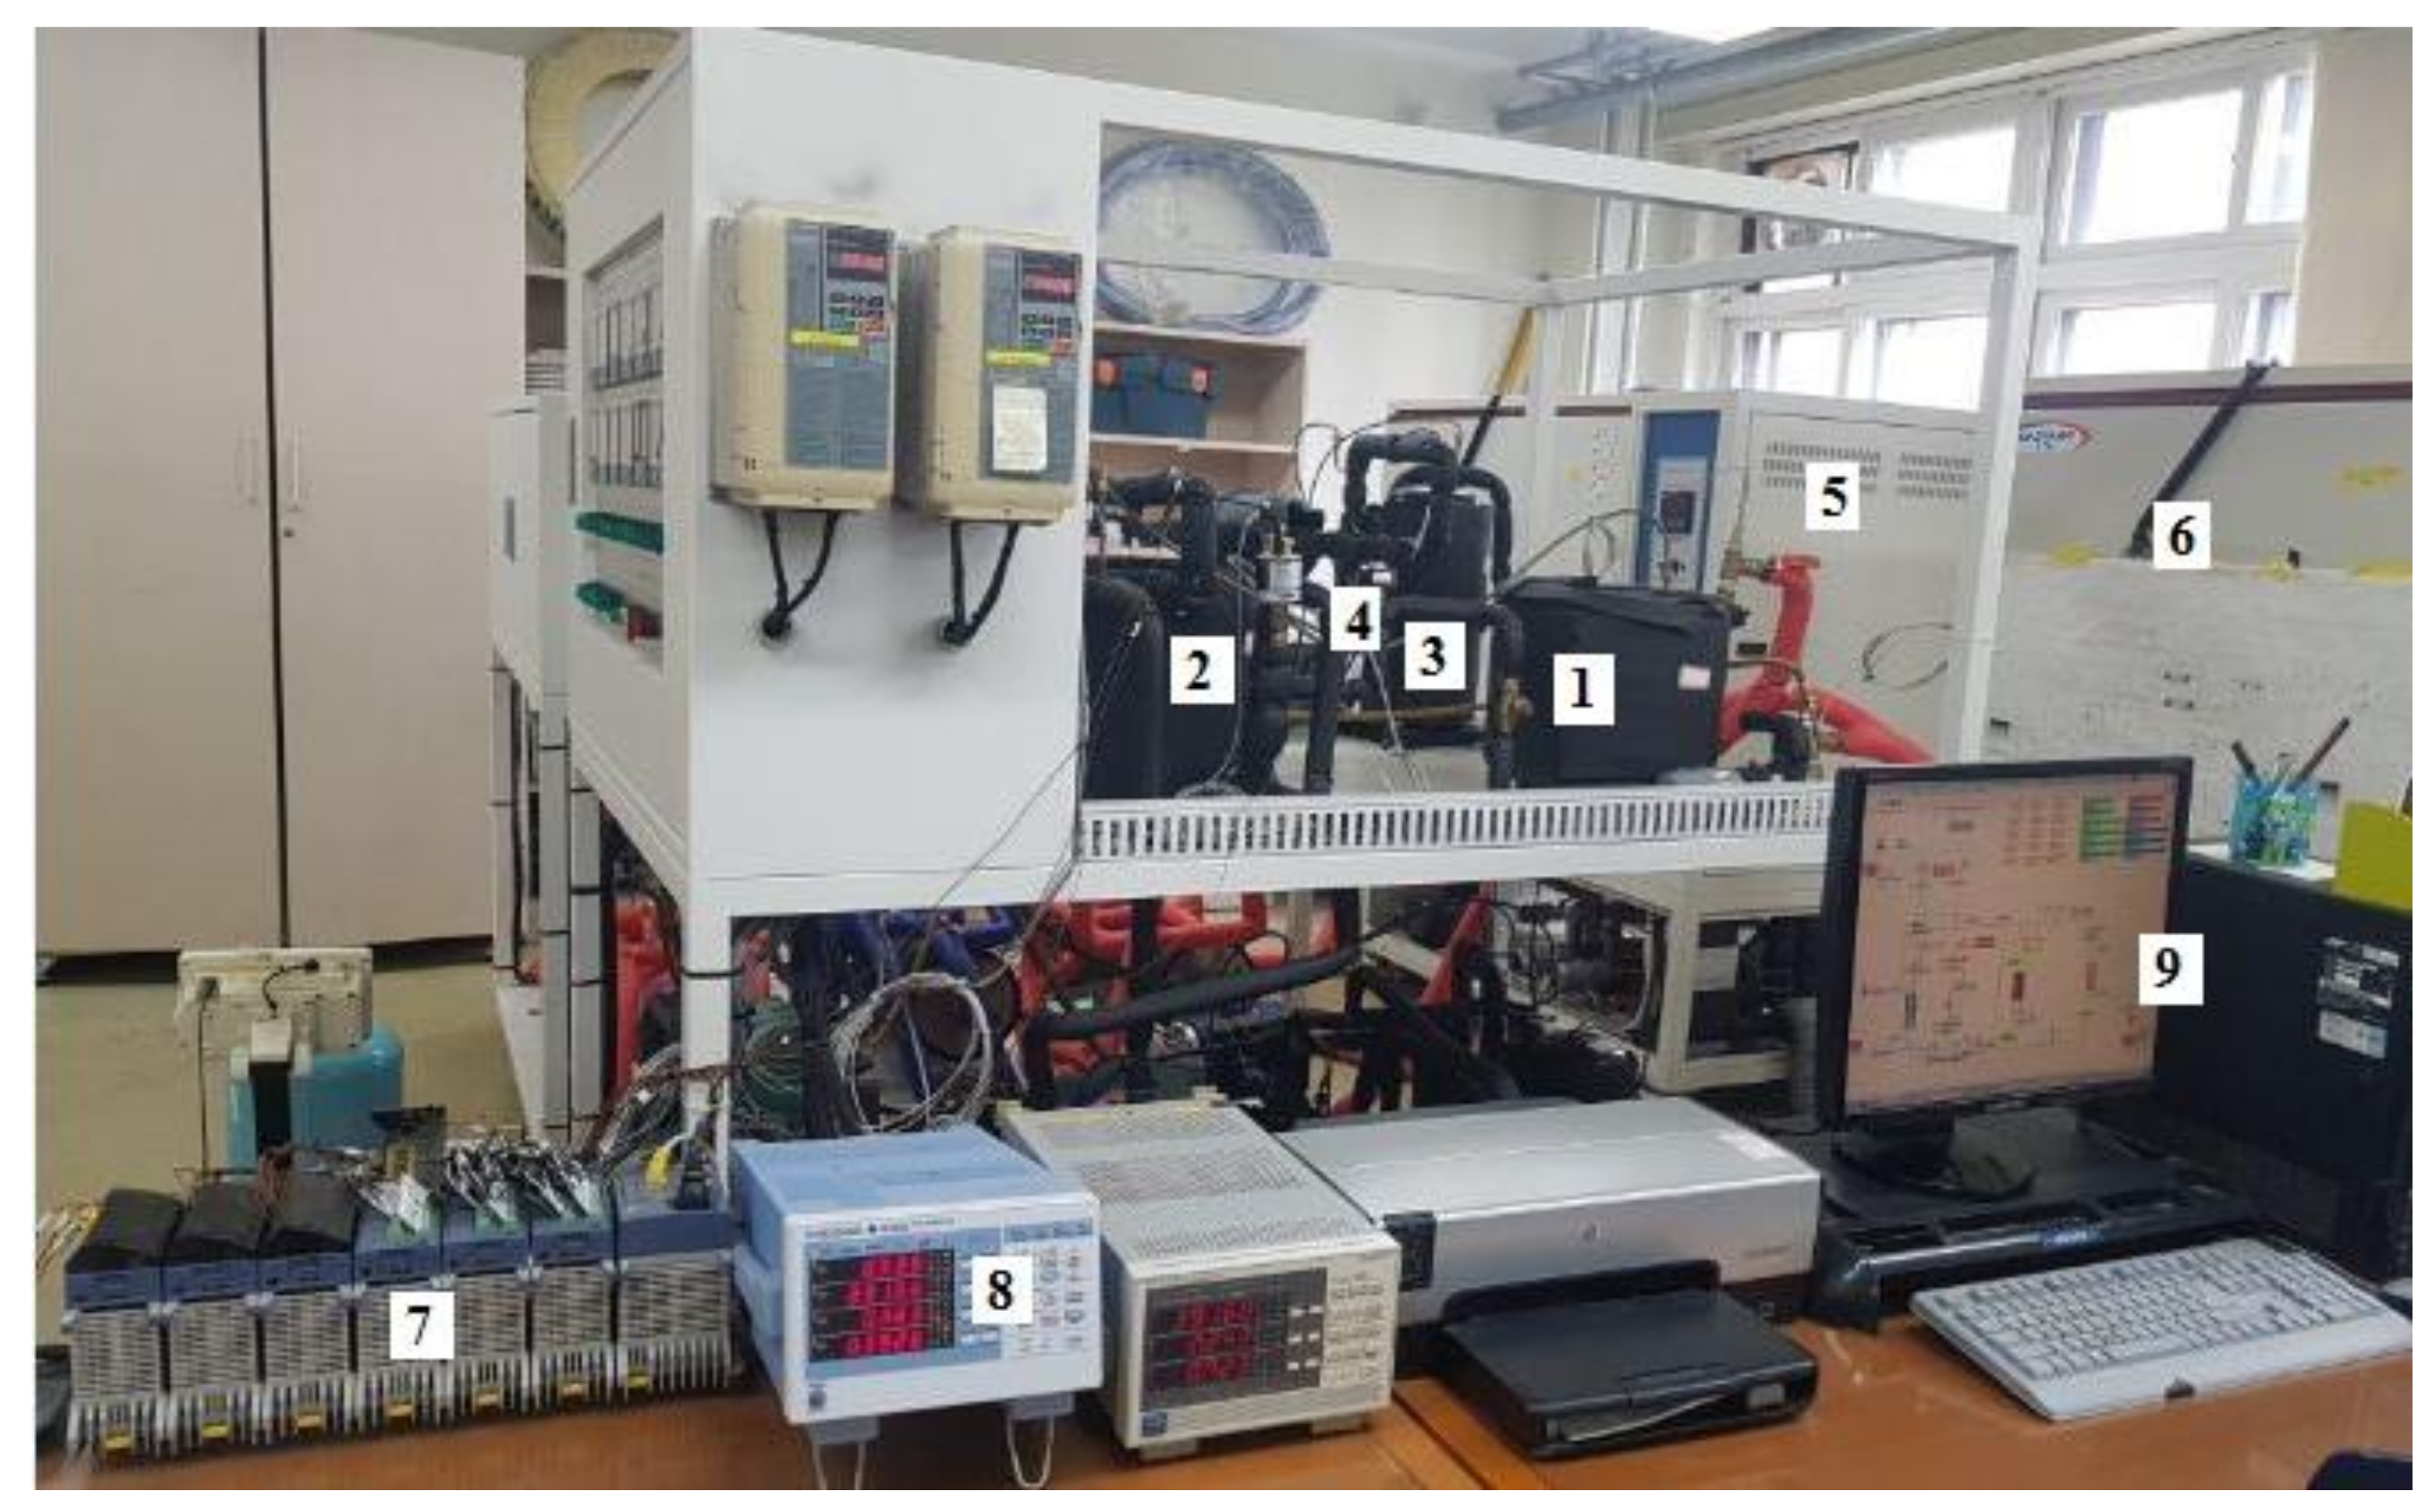
The test rig used for this study is presented in Figure 1. It was equipped with a compressor, condenser, electronic expansion device (EEV), evaporator, and a four-way valve. It is similar to the experimental setup used in the work of Boahen et al. [2] to develop an FDD model for refrigerant charge faults in heat pump units. In this study, the use of the test rig focused on analyzing the effect of multiple-simultaneous secondary fluid flow rate faults on the performance of heat pumps and developing FDD methodology for single and multiple-simultaneous secondary fluid flow rate faults. Figure 2 shows a picture of the experimental setup, where 1 is the condenser, 2 shows the evaporator, 3 shows the compressor, 4 shows the expansion device, 5 and 6 show the evaporator and condenser constant temperature water baths respectively, which forms the secondary fluid flow loop, 7 is the data acquisition unit, 8 is the power meter used in measuring the compressor power consumption and 9 shows the computer used for data storage. The test rig had a refrigerant flow loop and secondary fluid flow loops. R410A was used as the refrigerant, while brine of 40% ethylene glycol concentration was used as the secondary fluid in the secondary fluid flow loops. The test rig had inverter-driven pumps and a constant temperature water bath in the secondary fluid flow loops to simulate the evaporator and condenser secondary fluid flow rate faults.
The tests were conducted in cooling mode with the evaporator and condenser acting as the indoor heat exchanger (IDHX) and the outdoor heat exchanger (ODHX) respectively. During operation, R410A is compressed into vapor refrigerant which rejects heat to the secondary fluid in the condenser and gets condensed to a subcooled state. The subcooled refrigerant is expanded by the EEV to become a refrigerant of low pressure and temperature. The expanded refrigerant absorbs heat from the brine in the evaporator to turn superheated and is then compressed in the compressor into refrigerant of high pressure and temperature for the cycle to continue.
The first step in the experimental process was to determine the reference conditions at the standard cooling mode inlet water temperature of 25 °C and 12 °C across the condenser and evaporator respectively, according to ISO 13256-2 [20]. The reference test parameters were found as 4700 g optimum refrigerant charge, degree of superheat of 7 °C, and 8 LPM brine flow rate across the evaporator and condenser. The reference condenser and evaporator secondary fluid flow rates (SFFR) were designated as 100%. After establishing the reference test parameters, the evaporator SFFR was varied at 60%, 80%, 100%, 120%, and 140% of the reference value at constant reference condenser SFFR to simulate evaporator SFFR faults. Afterward, the condenser SFFR was varied at 60%, 80%, 100%, 120%, and 140% of the reference value at constant reference evaporator SFFR to simulate condenser SFFR faults. The evaporator SFFR and condenser SFFR were then varied simultaneously at 60%, 80%, 100%, 120%, and 140% of the reference values to simulate multiple-simultaneous secondary fluid flow rate faults (MSSFF), as shown in Table 1. The cases considered for SSFF include secondary fluid overflow or secondary fluid underflow at fixed reference conditions, while cases for MSSFF include secondary fluid underflow or overflow at the condenser side combined simultaneously with secondary fluid underflow or overflow at the evaporator side, as shown in Table 2. Secondary fluid flow rates at 60% and 80% of the reference value were considered as underflow, while secondary fluid flow rates at 120% and 140% of the reference value were considered as overflow. All imposed faults were examined at varying condenser inlet water temperatures () of 20 °C, 25 °C, 30 °C, and 35 °C to evaluate the effect of on the SFFR faults. Each experiment was repeated three times in the pre-test to ensure the repeatability and reliability of the collected data. The experiments were controlled by adjusting the EEV opening to achieve a 7 °C superheat.
Sensors were used on the test rig to measure the operating parameters and performance of the heat pump during the test period. Resistance temperature detector(RTD) sensors and volumetric flow meters were installed to measure temperature and SFFR respectively. Thermocouples, pressure transducers, power meter, and mass flow meter were used to measure refrigerant temperatures, refrigerant pressure, compressor power, and mass flow rate respectively. Table 3 shows the sensor accuracies in the test rig.
Data from the test rig were collected and saved on the computer using Yokogawa MX 100 at 30 min saving time with 3 s scanning time. Cooling capacity (Q) was calculated as the product of the density of the secondary fluid, the specific heat capacity of the secondary fluid, volumetric flow rate of the secondary fluid in the evaporator, and temperature difference of the secondary fluid across the evaporator, as shown in Equation (1), where is the density of the secondary fluid, is specific heat capacity of the secondary fluid. is the volumetric flow rate of the secondary fluid, LWT is the temperature of secondary fluid leaving the evaporator, and EWT is the temperature of the secondary fluid entering the evaporator. COP was calculated as the ratio of the cooling capacity to power consumption of the compressor, as shown in Equation (2), where Q is the cooling capacity and W is the power consumption of the compressor. The uncertainty analysis on the parameters of the heat pump was done using the uncertainty theorem according to the root of the sum of squares of the measured variables [21], as presented in Equation (3), where x is the deviation of all measured parameters of the calculated value caused by sensor errors and U is the uncertainty of the calculated value. The COP and cooling capacity had uncertainties of 3.1% and 2.9% respectively.
3. Results
3.1. Evaporator Secondary Fluid Flow Rate Fault
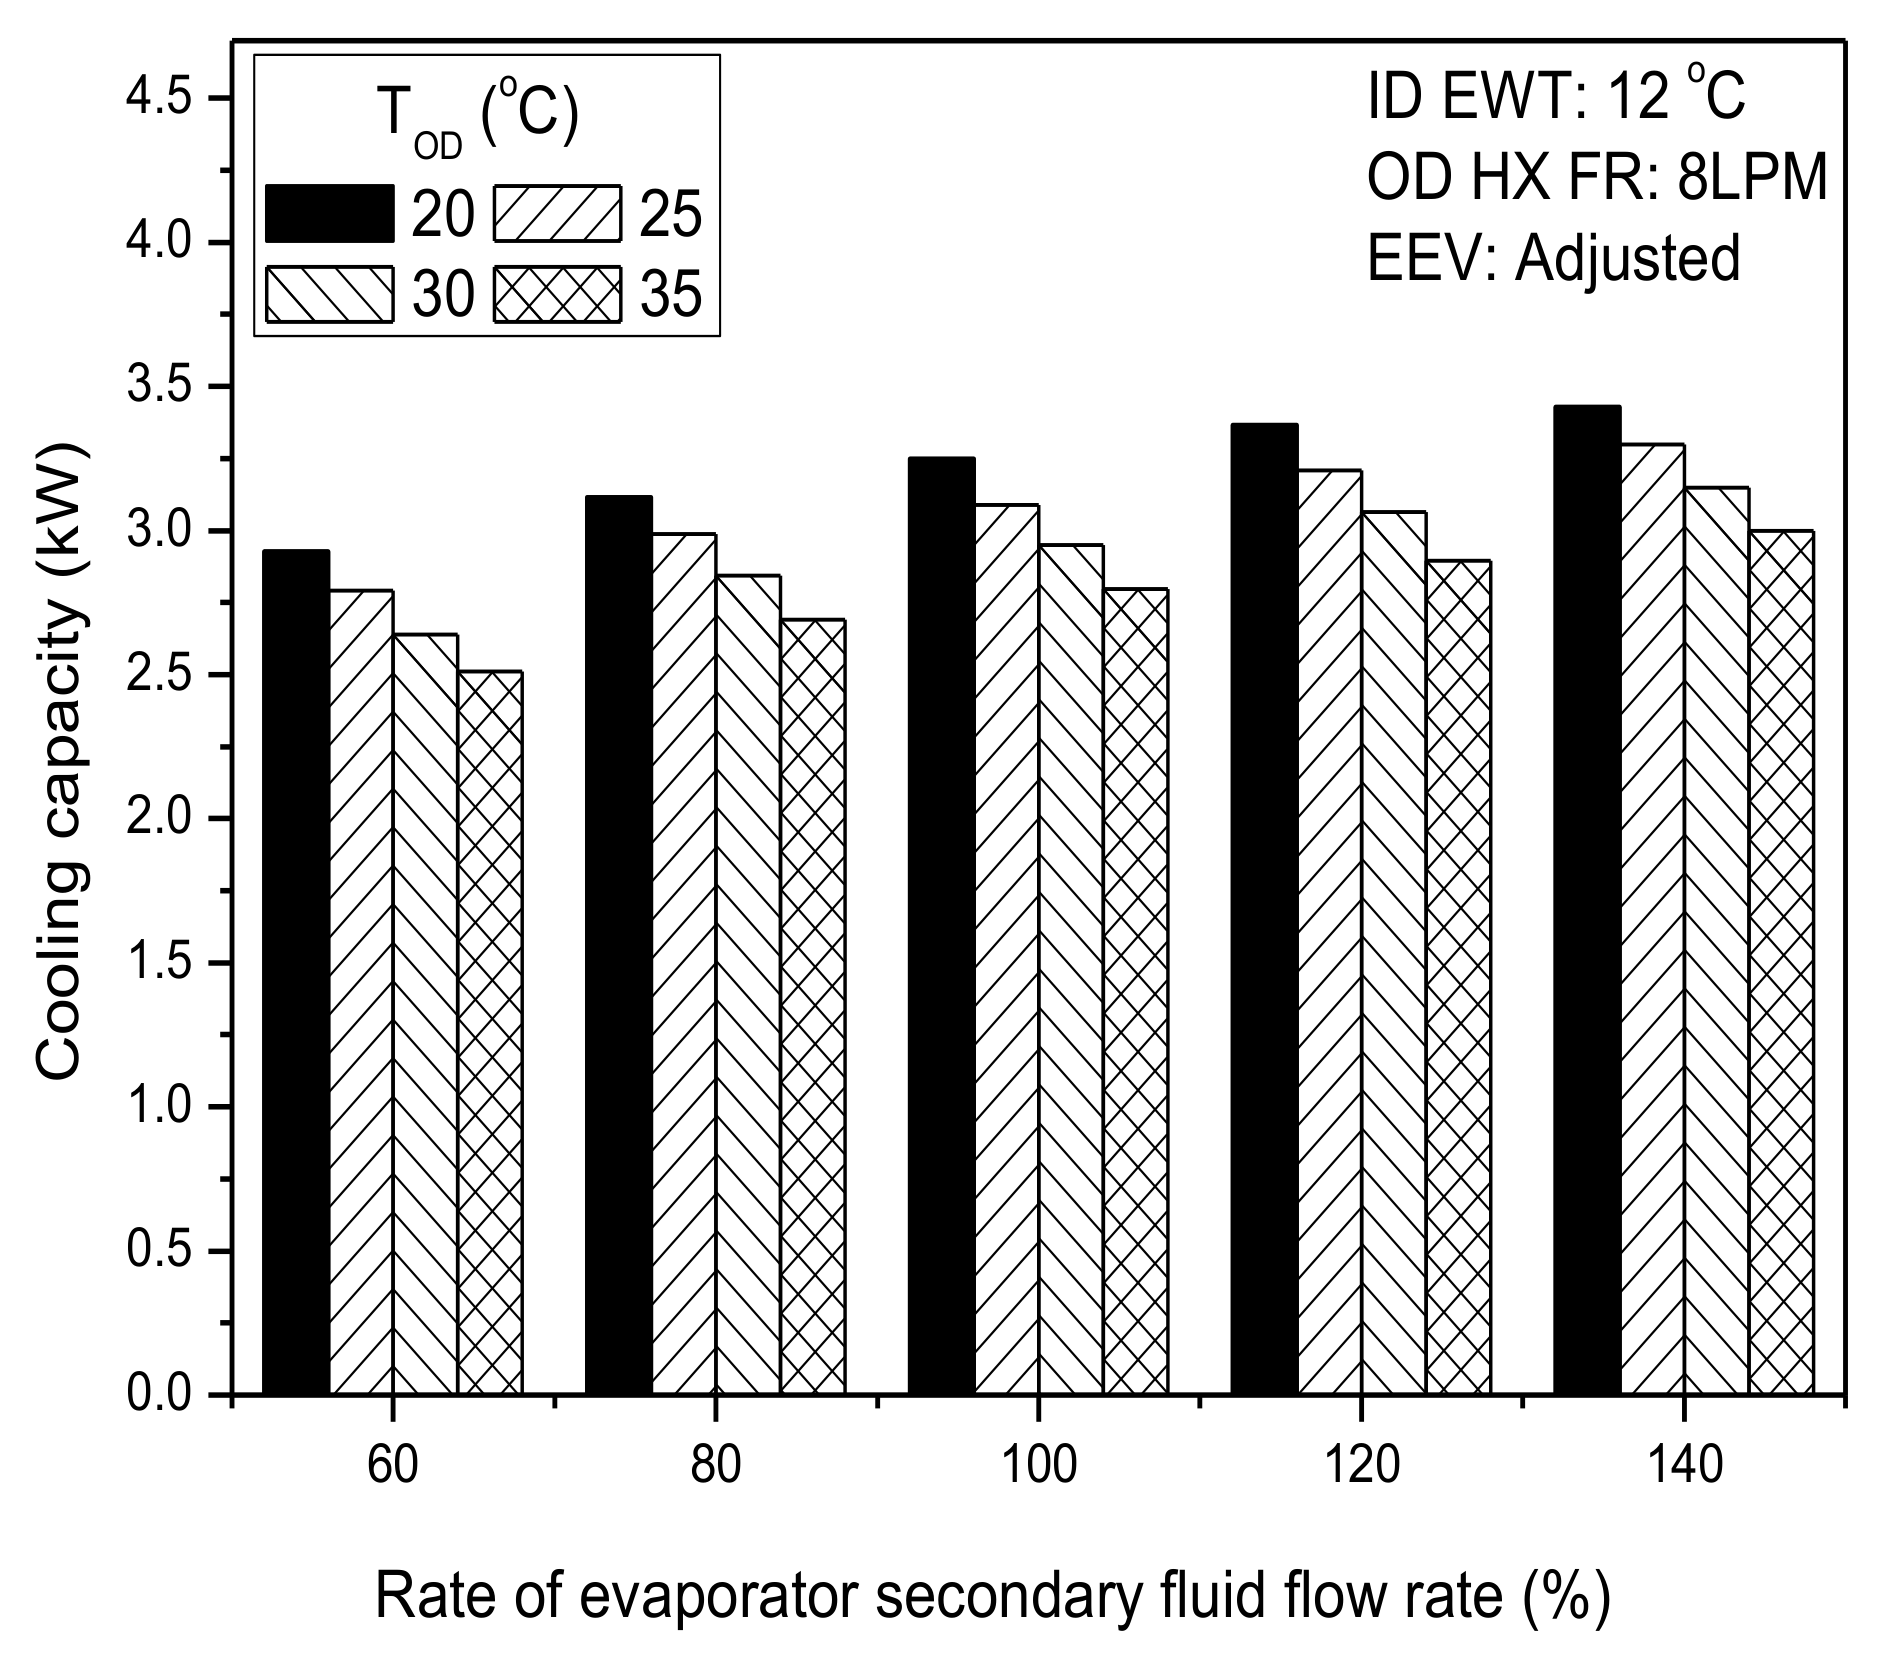
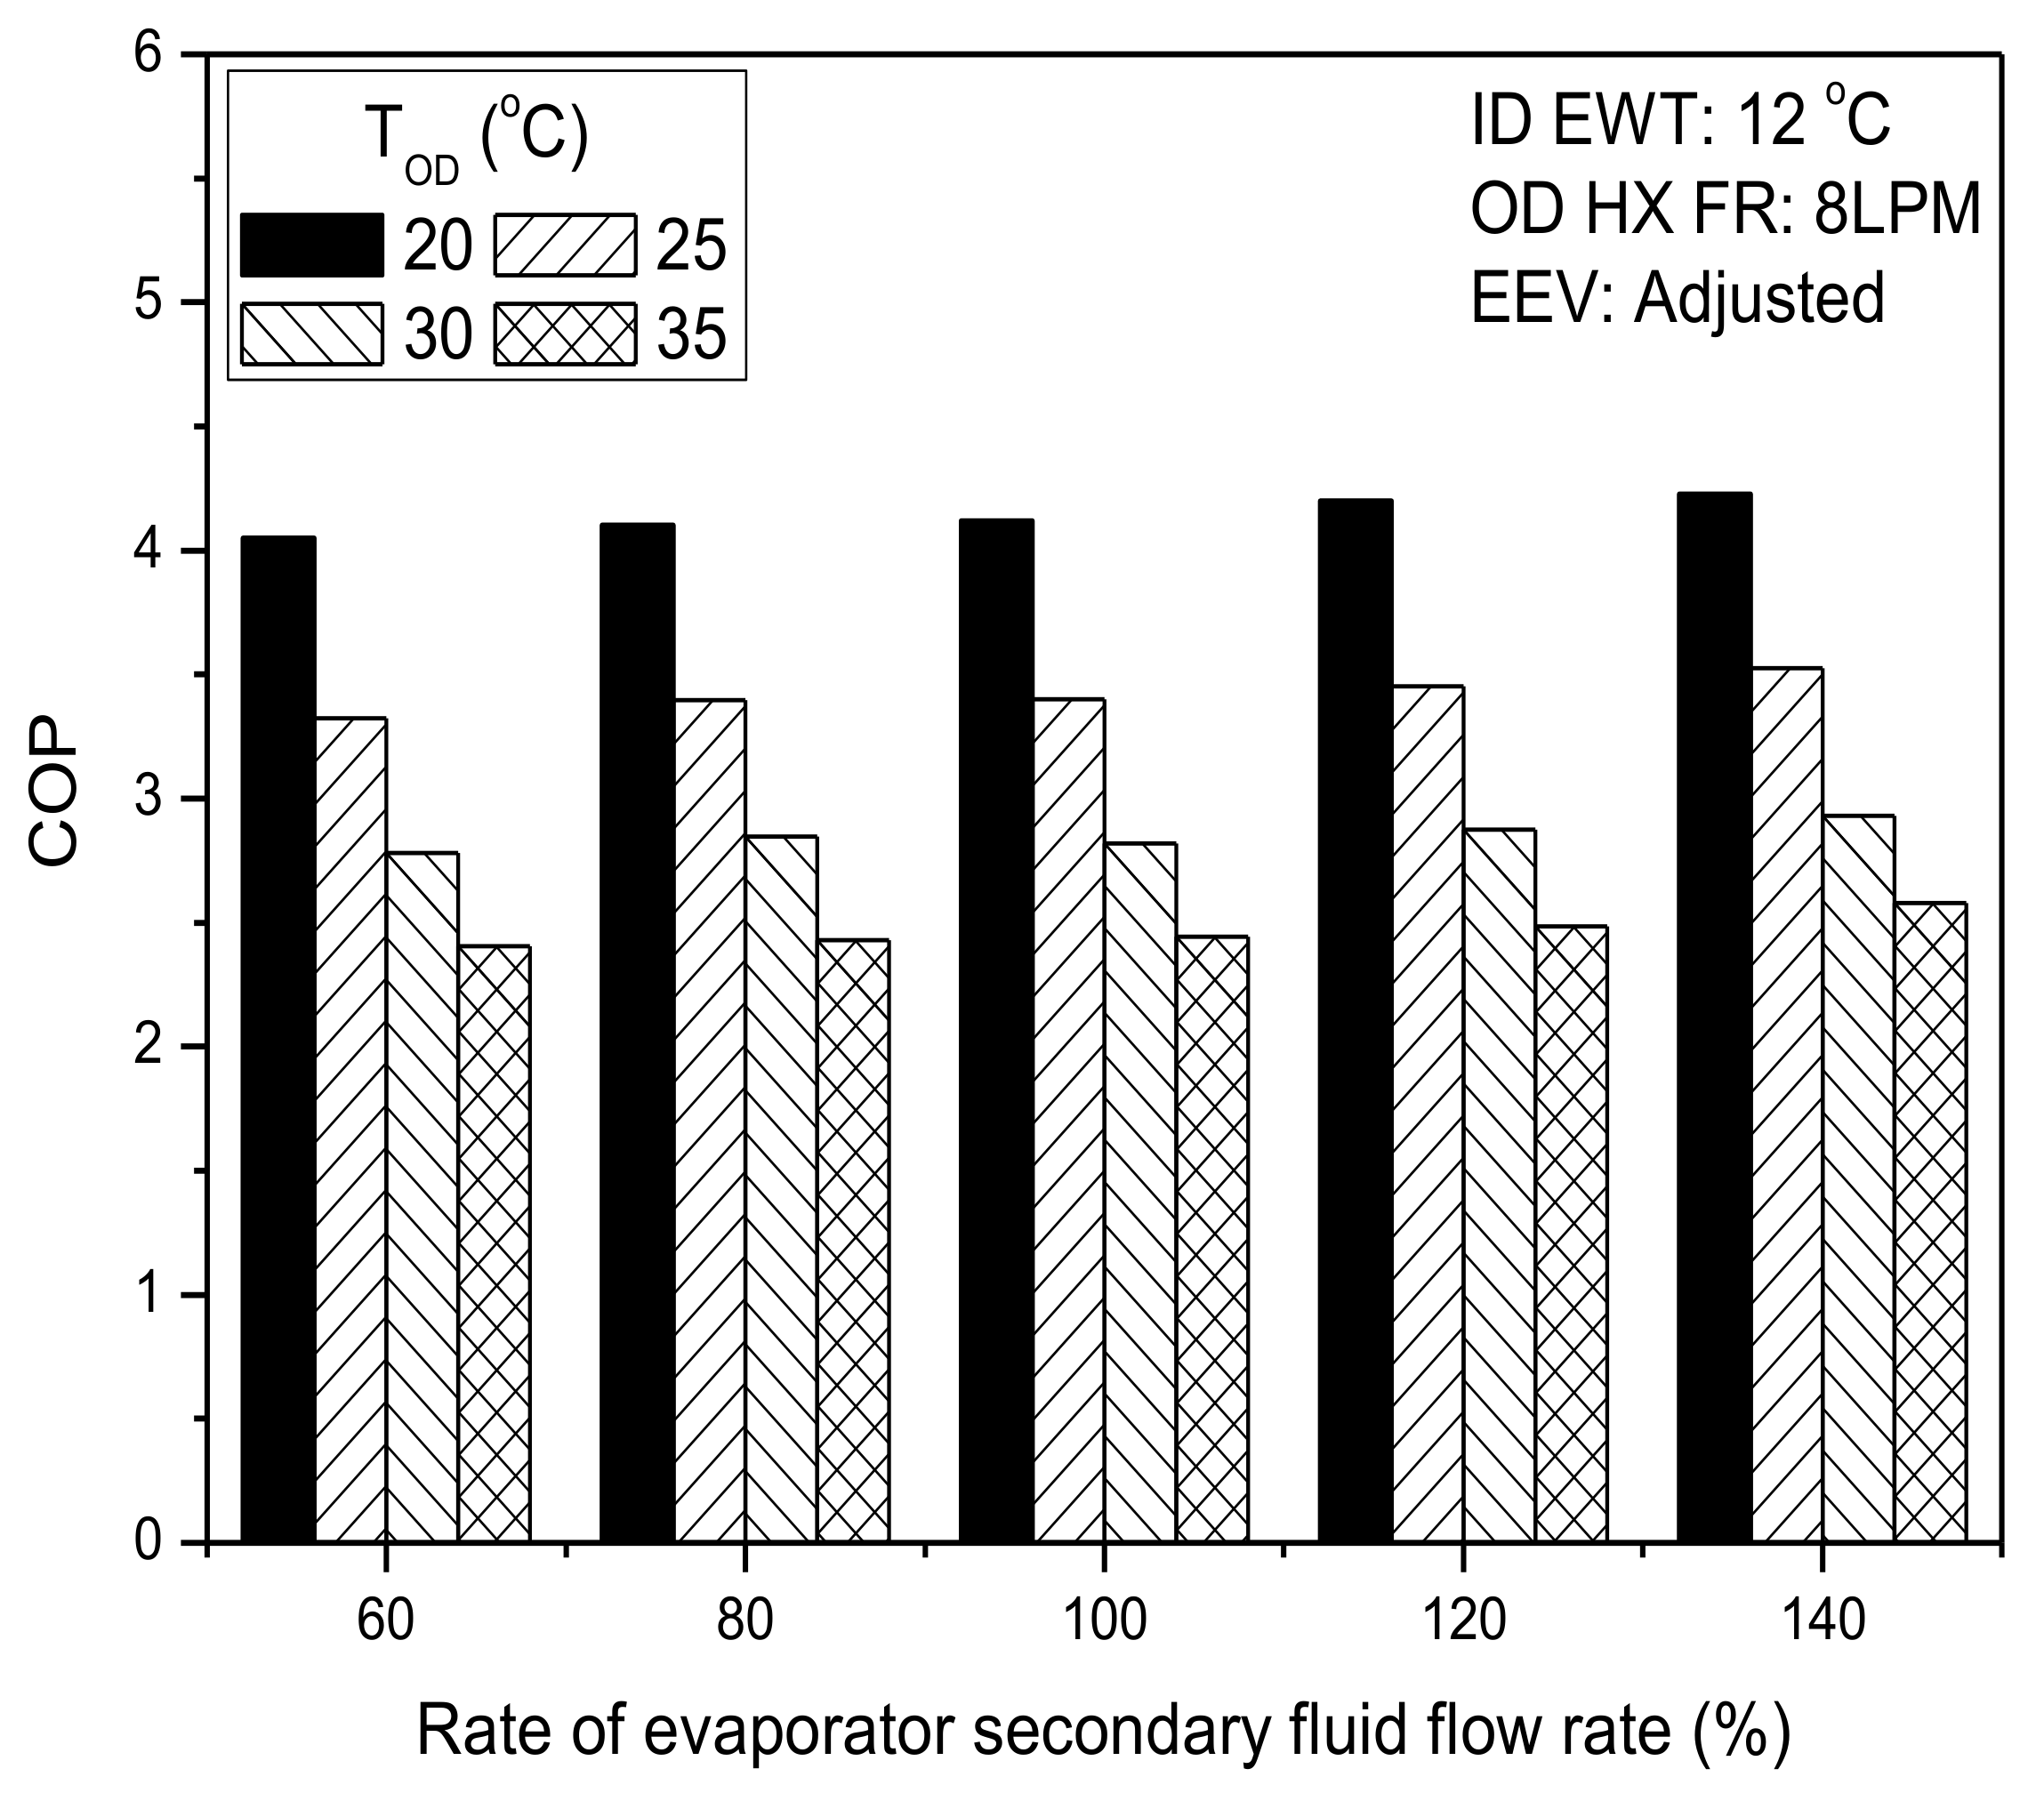
The flow rate of brine in the evaporator was varied at 60%, 80%, 100%, 120%, and 140% of the reference value to simulate evaporator SFFR faults. The 60% and 80% SFFR represented underflow condition and 100% SFFR represented the reference value, while 120% and 140% SFFR represented overflow condition. Figure 3 and Figure 4 show cooling capacity and COP, respectively, of the heat pump with the variation of the evaporator SFFR and outdoor inlet water temperature (). The cooling capacity decreased at underflow conditions and increased at overflow conditions, however, COP was not affected by the evaporator SFFR at all conditions.
3.2. Condenser Secondary Fluid Flow Rate Fault
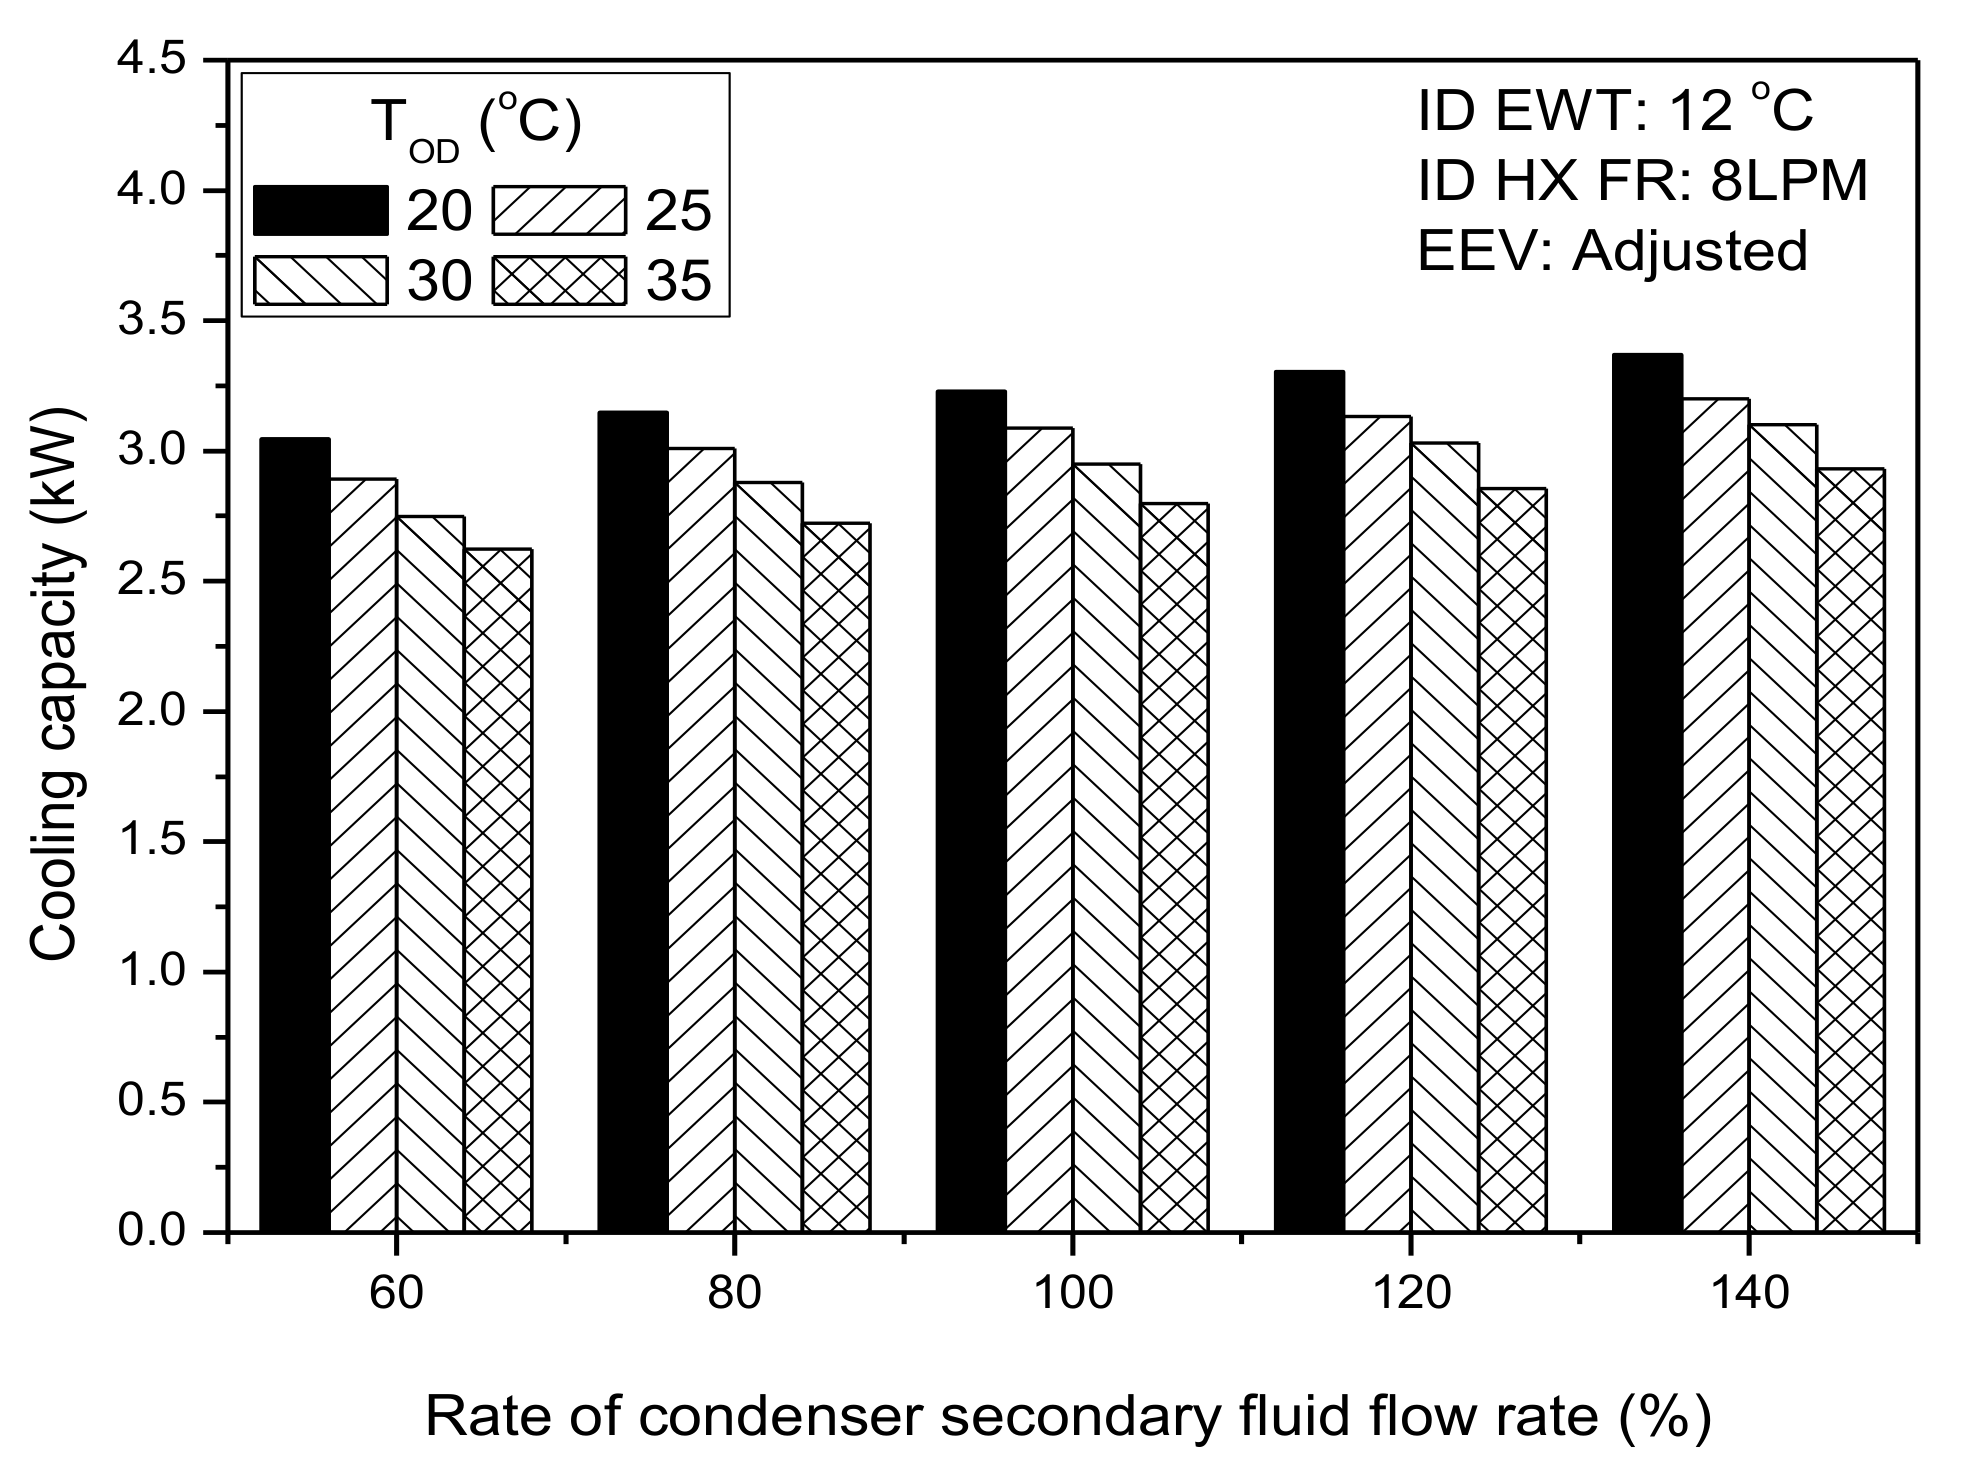
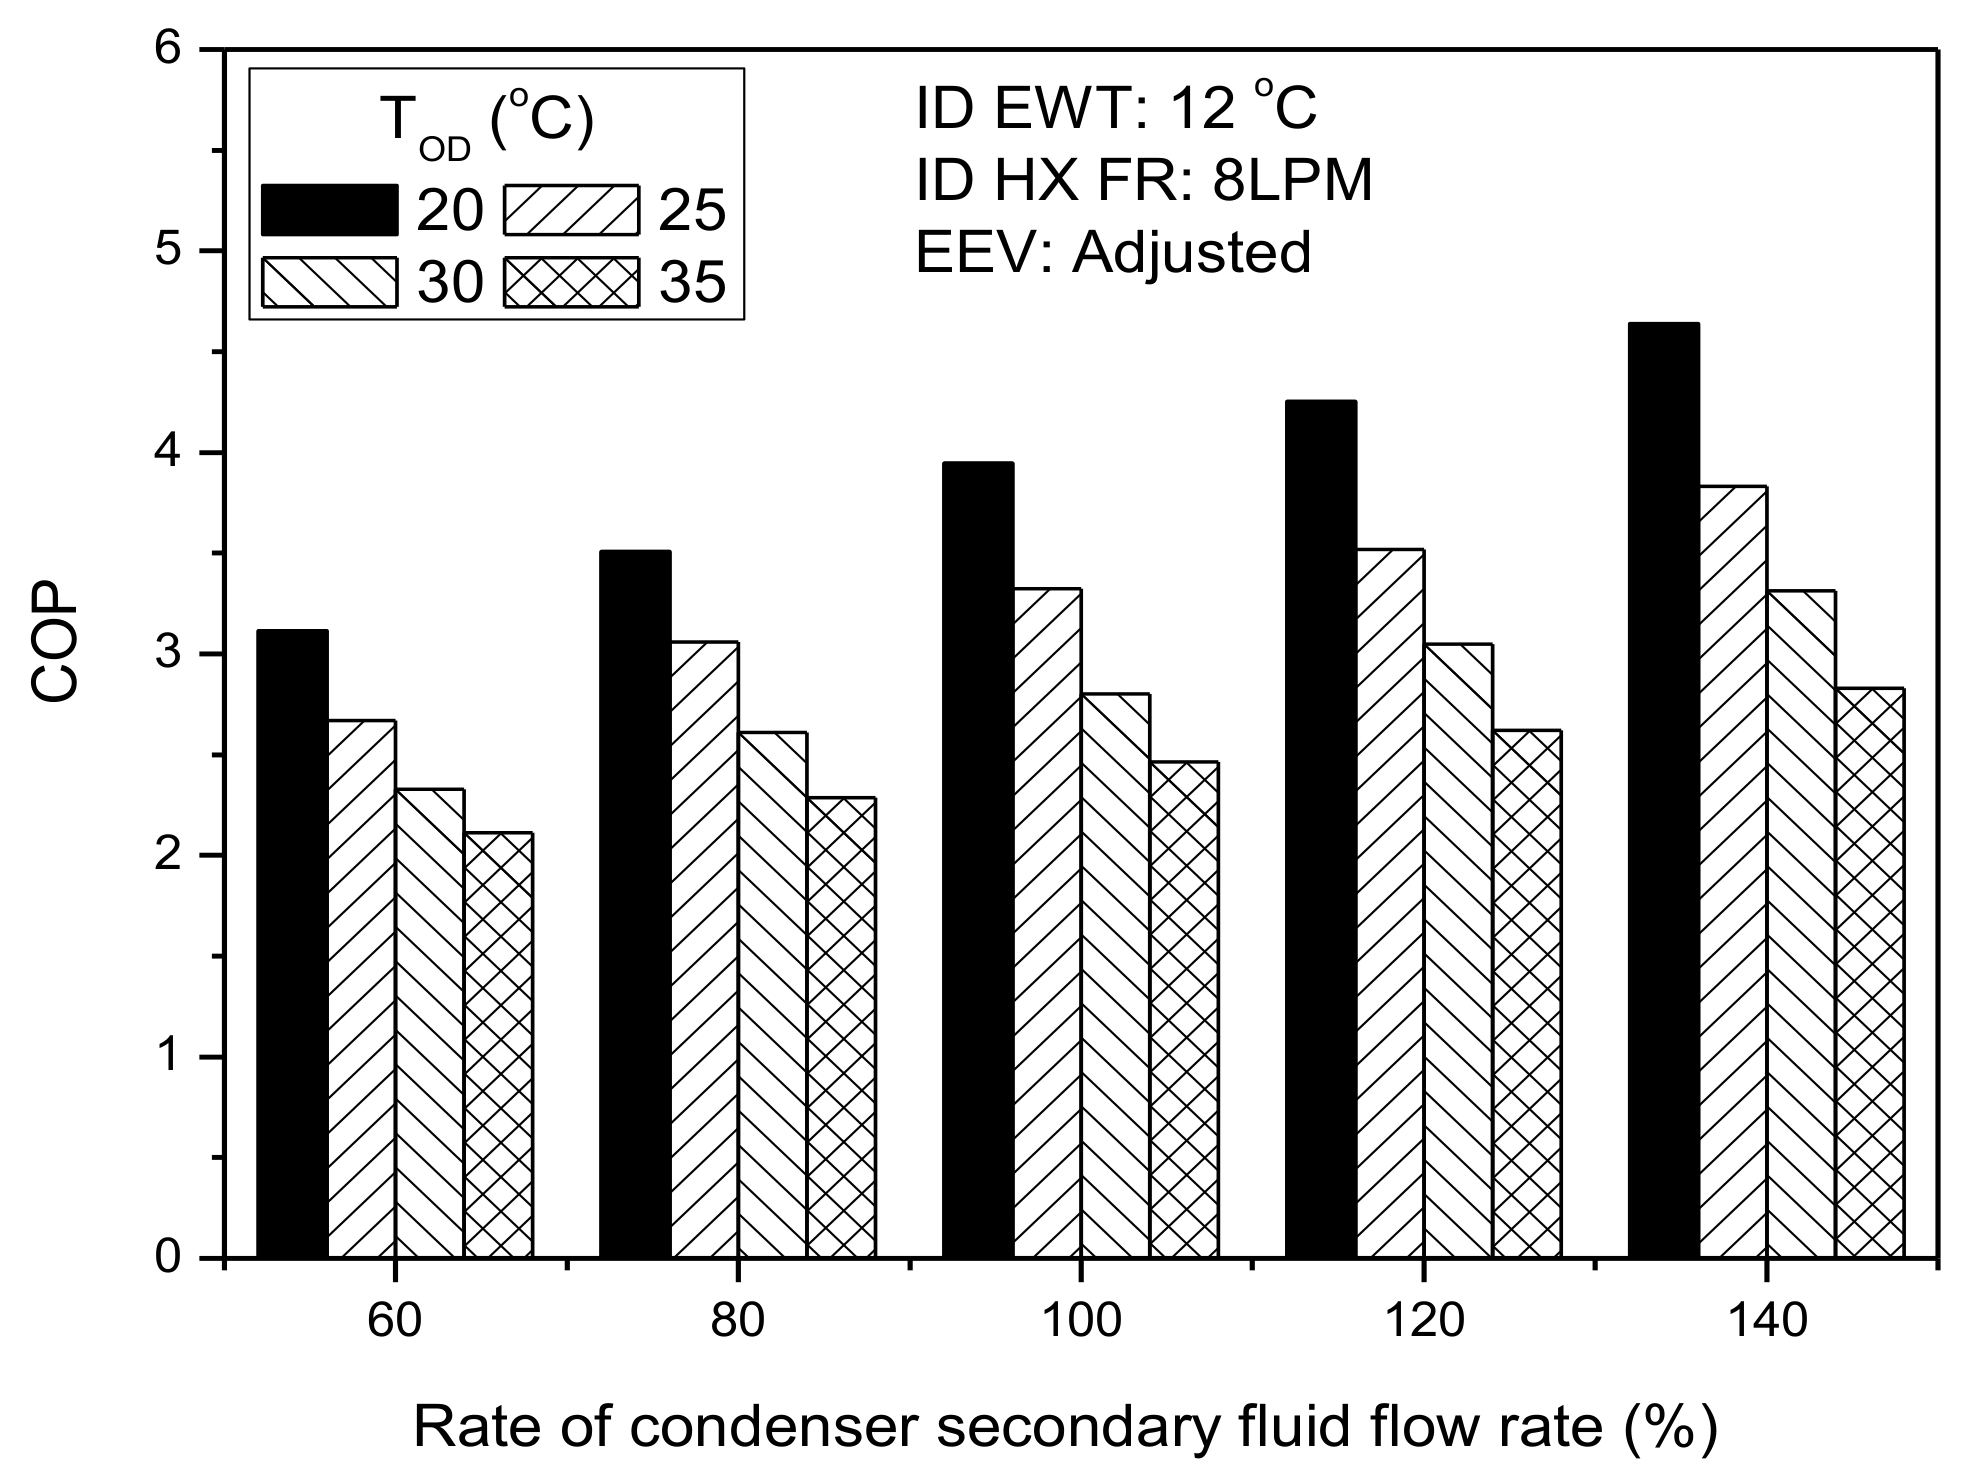
Figure 5 shows the effect of condenser SFFR faults on the capacity of the heat pump, while Figure 6 shows the effect of condenser SFFR faults on COP of the heat pump. The cooling capacity decreased slightly at underflow conditions and increased slightly at overflow conditions at all conditions. However, COP decreased significantly at condenser secondary fluid underflow conditions and increased significantly at condenser secondary fluid overflow conditions at all .
3.3. Multiple-Simultaneous Secondary Fluid Flow Rate Fault (MSSFF)
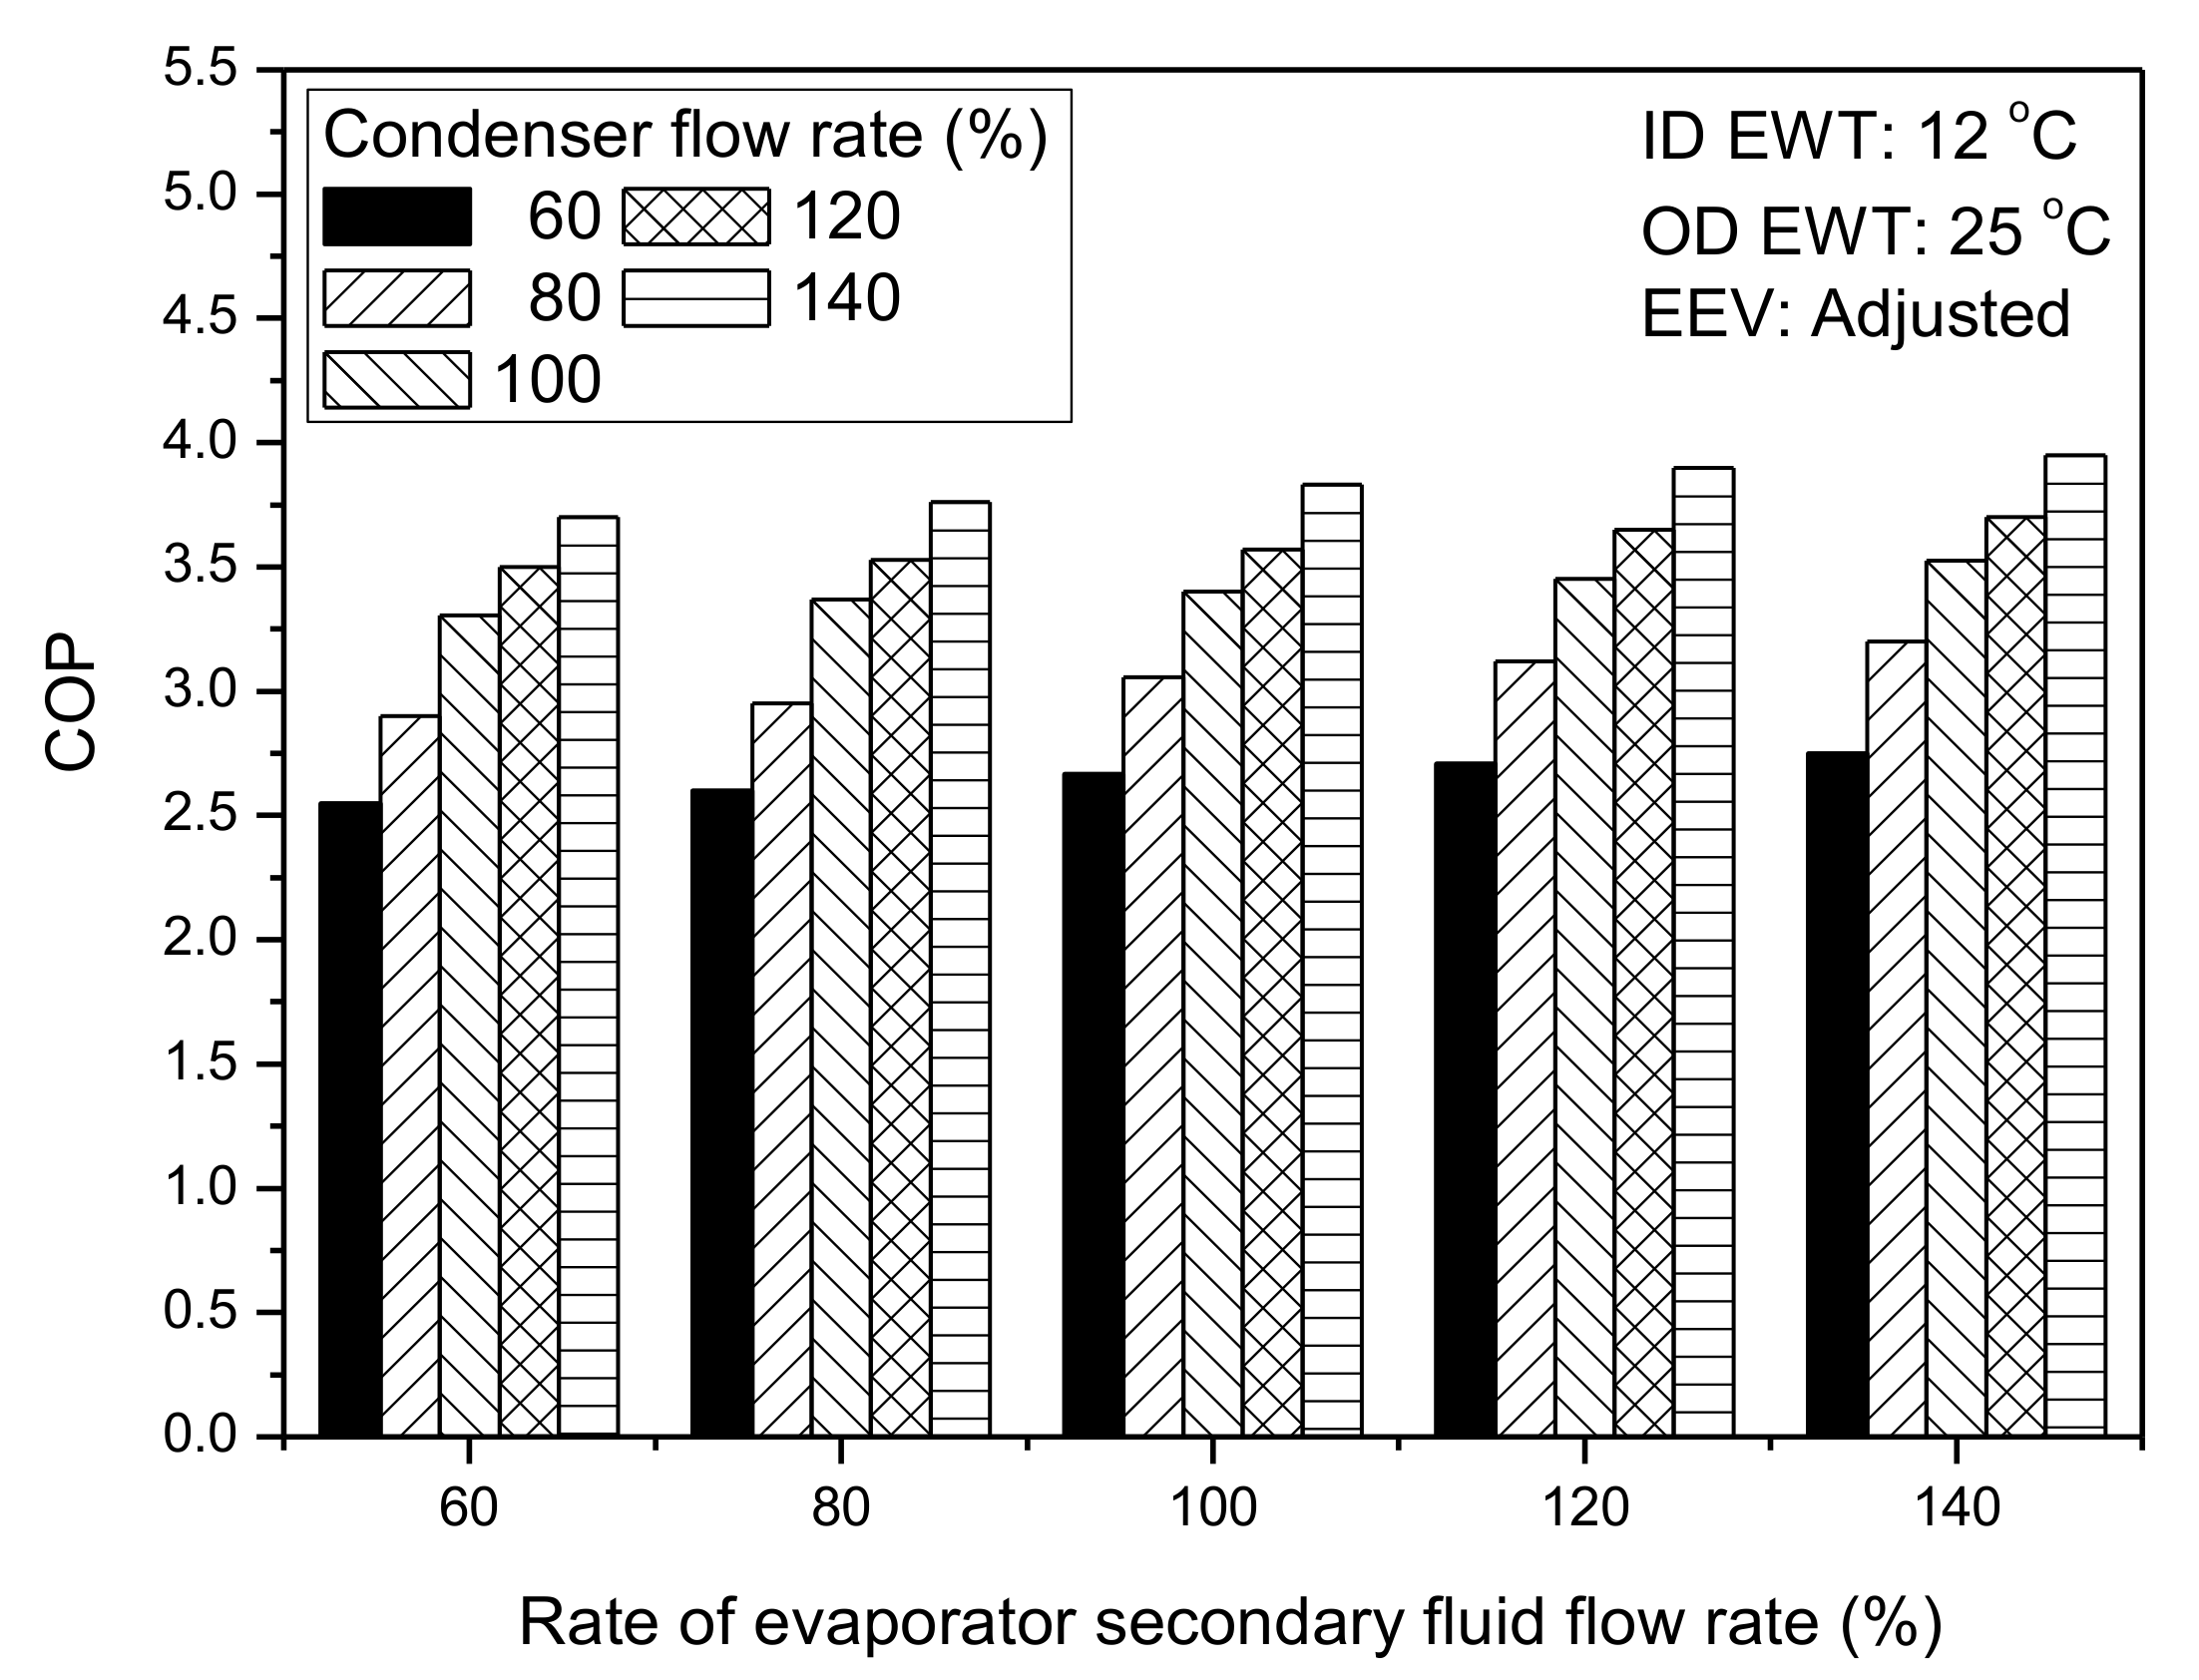
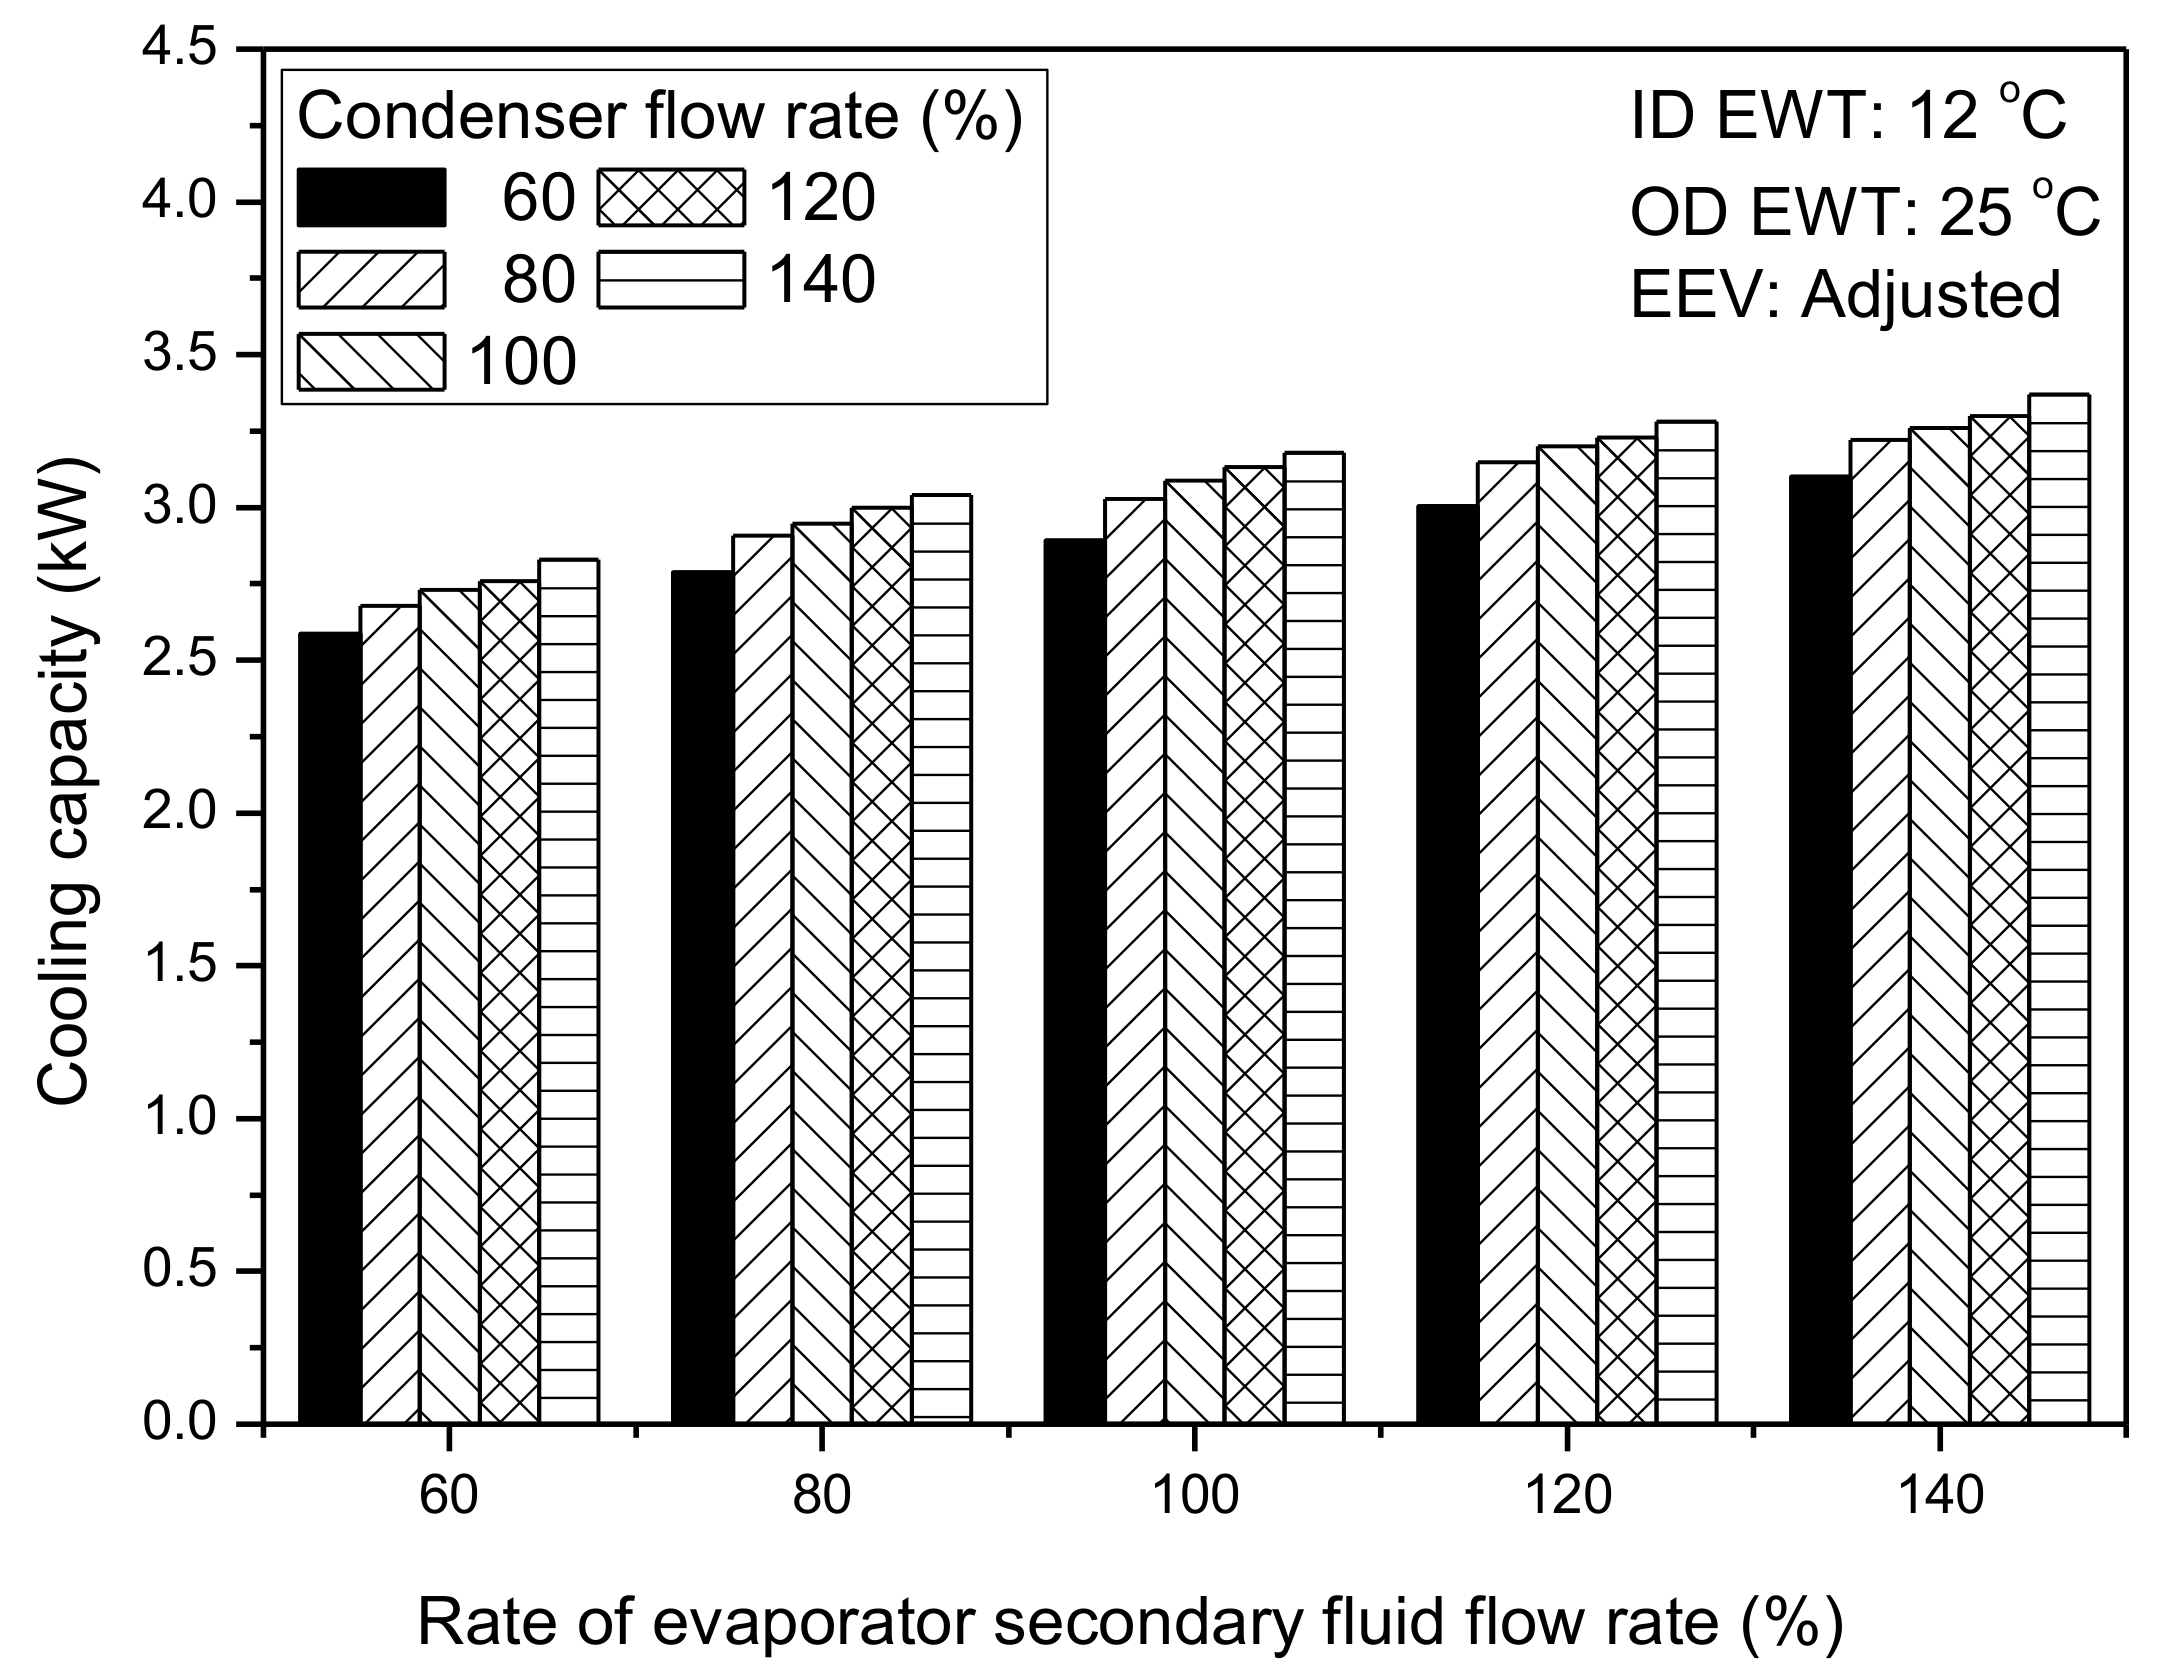
Four MSSFF can exist during the operation of heat pumps, namely, simultaneous evaporator underflow and condenser underflow (SUUF), simultaneous evaporator underflow and condenser overflow (SUOF), simultaneous evaporator overflow and condenser underflow (SOUF), and simultaneous evaporator overflow and condenser overflow (SOOF). Figure 7 and Figure 8 show the heat pump’s COP and cooling capacity respectively with a MSSFF at the standard inlet water temperature conditions. COP decreased at SUUF and SOUF conditions but increased at SUOF and SOOF conditions, while cooling capacity decreased at SUUF and SUOF conditions and increased at SOOF and SOUF conditions.
4. Discussion
4.1. Evaporator Secondary Fluid Flow Rate Fault
The cooling capacity of the heat pump according to the evaporator SFFR decreased at underflow conditions and increased at overflow conditions because refrigerant mass flow rate decreased at underflow conditions and increased at overflow conditions, respectively. The rate of heat transfer increased at underflow conditions and decreased at overflow conditions, however, the increasing refrigerant flow rate was higher than the rate of heat transfer at both underflow and overflow conditions. Furthermore, the cooling capacity decreased as increased in all SFFR faults. A decrease in therefore has a similar effect on the cooling capacity as evaporator SFFR overflow. Therefore, for space cooling, the underflow of secondary fluid flow rate in the evaporator will decrease the cooling effect of the heat pump such that the heat pump will not be able to meet the room cooling set temperature at the standard operating condition, while the overflow of the secondary fluid flow rate will increase the cooling effect of the heat pump. Furthermore, COP was not affected by evaporator SFFR faults because COP is affected by the heat pump’s cooling capacity and power consumption. Power consumption slightly decreased at underflow conditions and slightly increased at overflow conditions. This resulted in the COP trend with variation in the evaporator SFFR. Furthermore, the COP decreased greatly with an increase in because of decreased cooling capacity and increased power consumption as increased. COP is related to the operating cost of the heat pump. The results of the study, therefore, show that evaporator secondary fluid flow rate faults have no significant effect on the operating cost of the heat pump unit.
4.2. Condenser Secondary Fluid Flow Rate Fault
The slight decrease in cooling capacity at underflow conditions and the slight increase in cooling capacity at overflow conditions is due to a slight increase in evaporating temperature at underflow conditions and a slight decrease in evaporating temperature at overflow conditions. This means that the heat pump will generate a little lower space temperature below the setting value at underflow conditions and a space cooling temperature slightly higher than the set temperature when the condenser secondary fluid flow rate is higher than the rated value. Furthermore, the compressor power consumption of the heat pump increased at underflow conditions and decreased at overflow conditions. The COP trend was therefore caused by the combined effect of the cooling capacity and power consumption at underflow and overflow faults. This means that when in operation, much energy will be needed for the heat pump to produce space cooling at the set temperature when the condenser secondary fluid flow rate is below the rated value. This will increase the operating cost of the heat pump. The COP decreased by 10% and 21% at 80% and 60% underflow faults respectively and increased by 6.4% and 16.6% at 120% and 140% overflow faults respectively at the reference .
4.3. Multiple Simultaneous Secondary Fluid Flow Rate Fault (MSSFF)
COP decreased at SUUF and SOUF conditions but increased at SUOF and SOOF conditions due to an increase in power consumption at SUUF and SOUF conditions and decrease in the same at SUOF and SOOF conditions. This implies that higher energy consumption and operating costs will be needed for the heat pump to produce the required room cooling setting temperature when the evaporator and condenser secondary fluid flow rates decrease simultaneously below the rated value, or when there is a simultaneous increase in the evaporator secondary fluid flow rate and decrease in condenser secondary fluid flow rate. Furthermore, cooling capacity decreased at SUUF and SUOF conditions and increased at SOOF and SOUF conditions due to a decrease in the refrigerant mass flow rate at SUUF and SUOF conditions and an increase in the refrigerant mass flow rate in the evaporator at SOOF and SOUF conditions. Thus, a simultaneous decrease in the evaporator and condenser secondary fluid flow rates below the rated value and simultaneous decrease of the evaporator secondary fluid flow rate with an increase in condenser secondary fluid flow rate above the rated value will result in the inability of the heat pump to generate the required set temperature of the room to produce the required cooling effect in the room. Therefore, for MSSFF, the cooling capacity is highly dependent on the evaporator SFFR fault, while COP is highly dependent on the condenser SFFR fault.
5. Development of Secondary Fluid Flow Rate FDD Correlations
5.1. Evaporator Secondary Fluid Flow Rate FDD Correlation
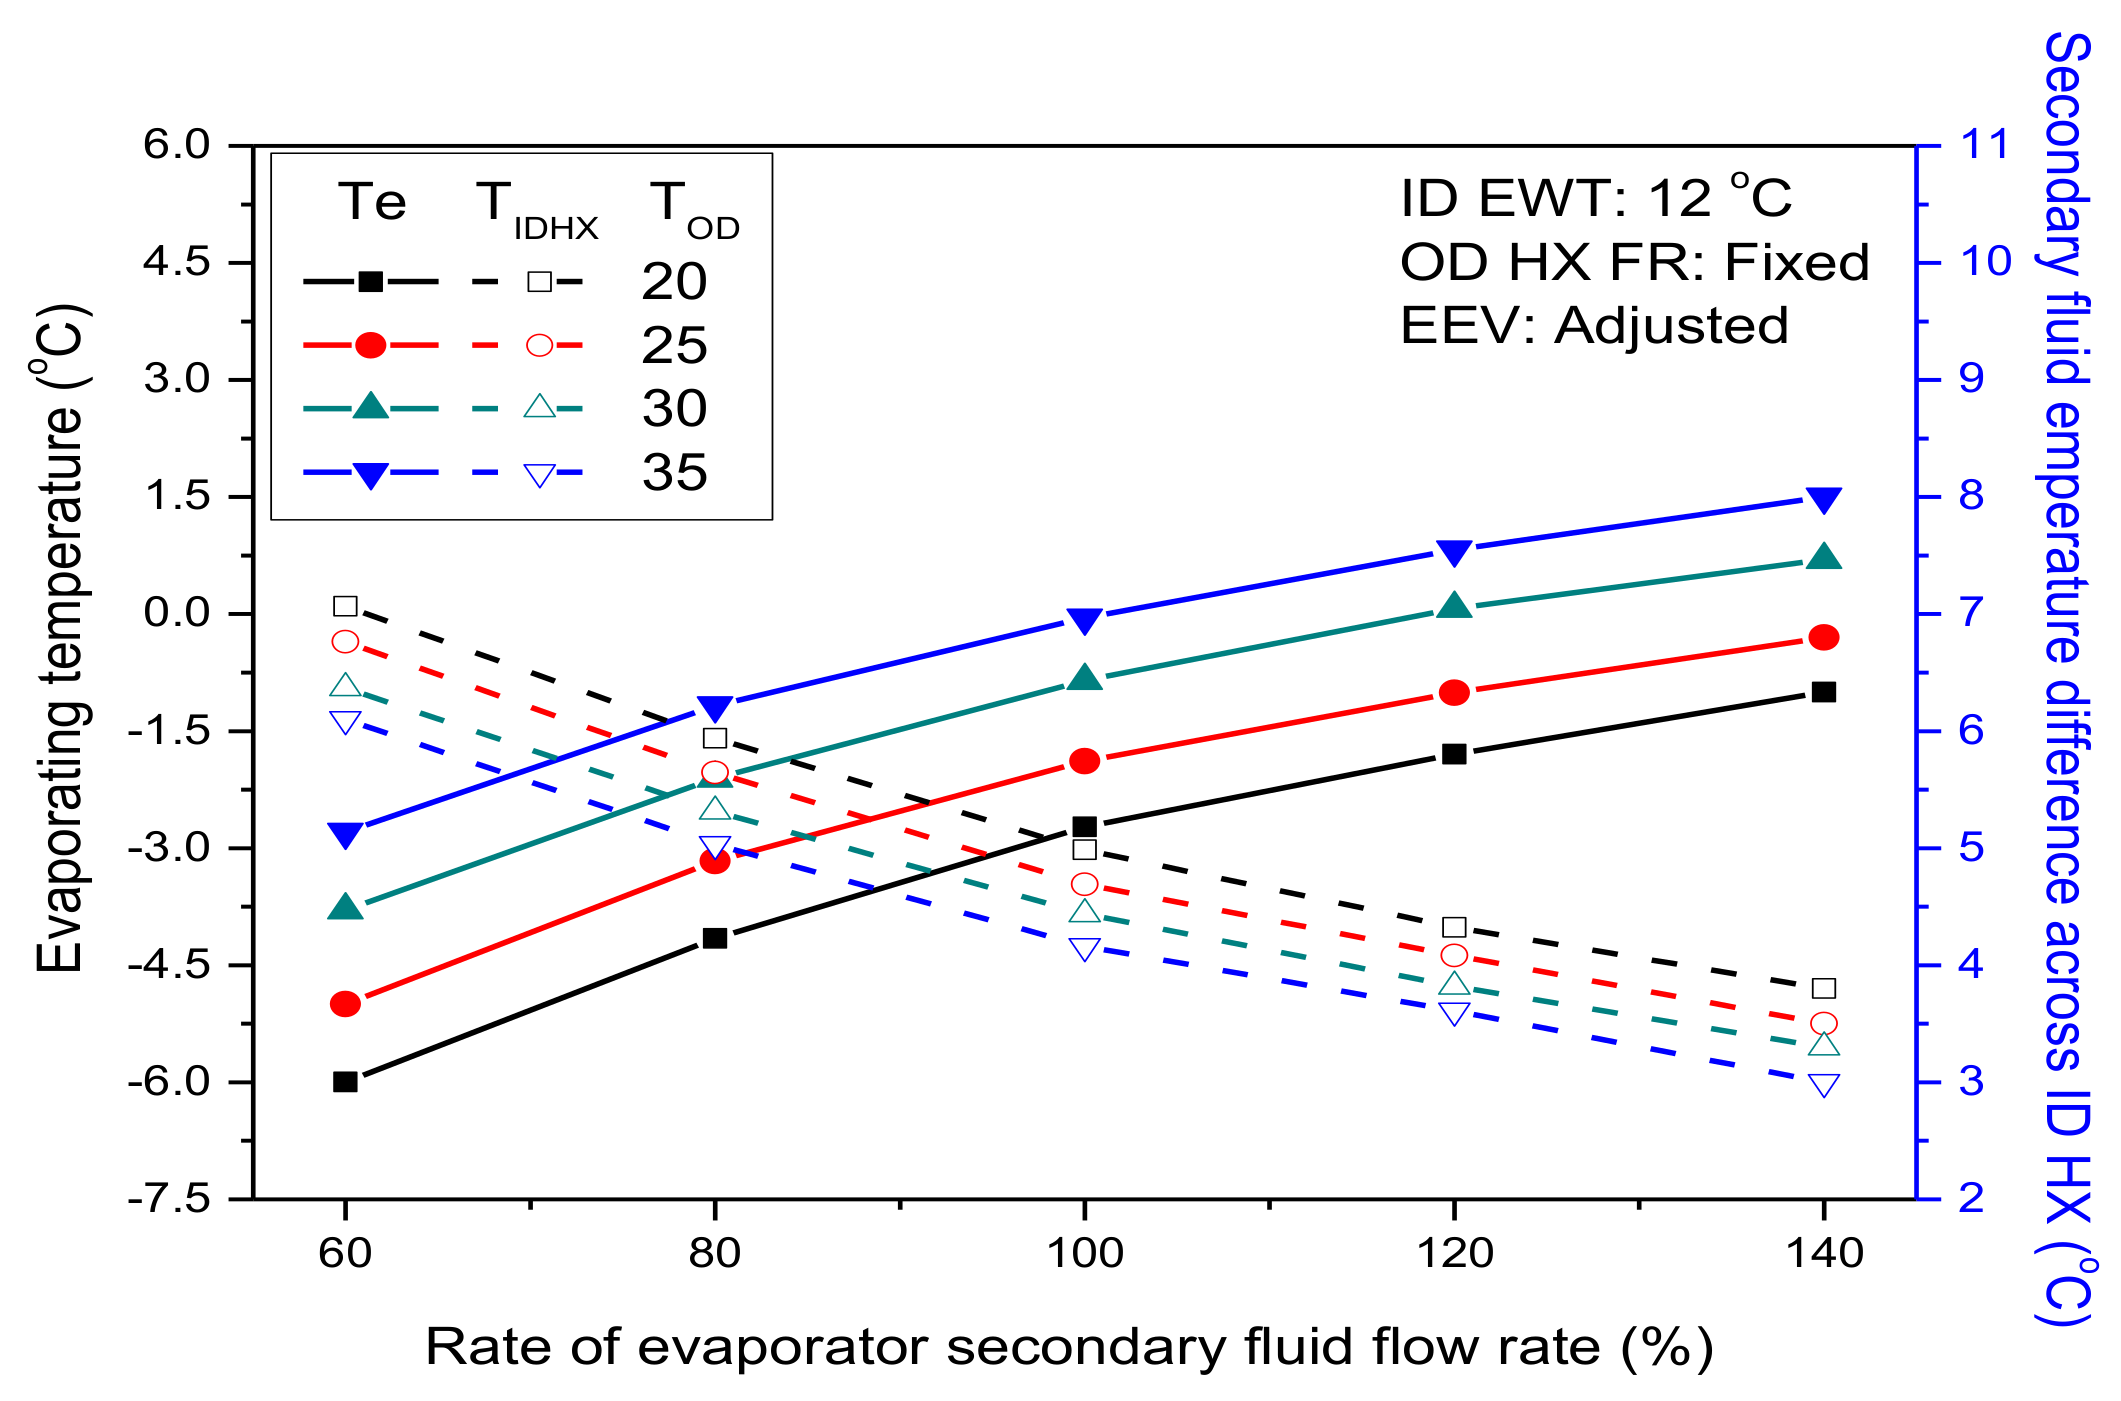
FDD correlations were developed to predict single secondary fluid flow rate faults (SSFF) and multiple-simultaneous secondary fluid flow rate faults (MSSFF) of the heat pump at the range discussed in this study. The evaporating temperature and brine temperature difference at the evaporator is greatly affected by the evaporator SFFR fault, as shown in Figure 9, and are therefore selected to model the evaporator SFFR FDD correlation. The correlations were modeled as second order polynomials, according to the relationship between the selected parameters and the SFFR faults. The FDD correlation with the evaporating temperature and brine temperature difference at the evaporator as selected heat pump parameters is as shown in Equations (4) and (5), respectively, where EFR is the evaporator secondary fluid flow rate fault, is the evaporating temperature, is the brine temperature difference across the evaporator and represents the condenser inlet water temperature. Coefficients of the terms in the correlation were determined using multiple linear regression. To estimate the evaporator flow rate in the heat pump at any operating time, temperature sensors are installed in the heat pump to measure , , and . The measured parameters are substituted into Equations (4) and (5) to determine the evaporator flow rate.
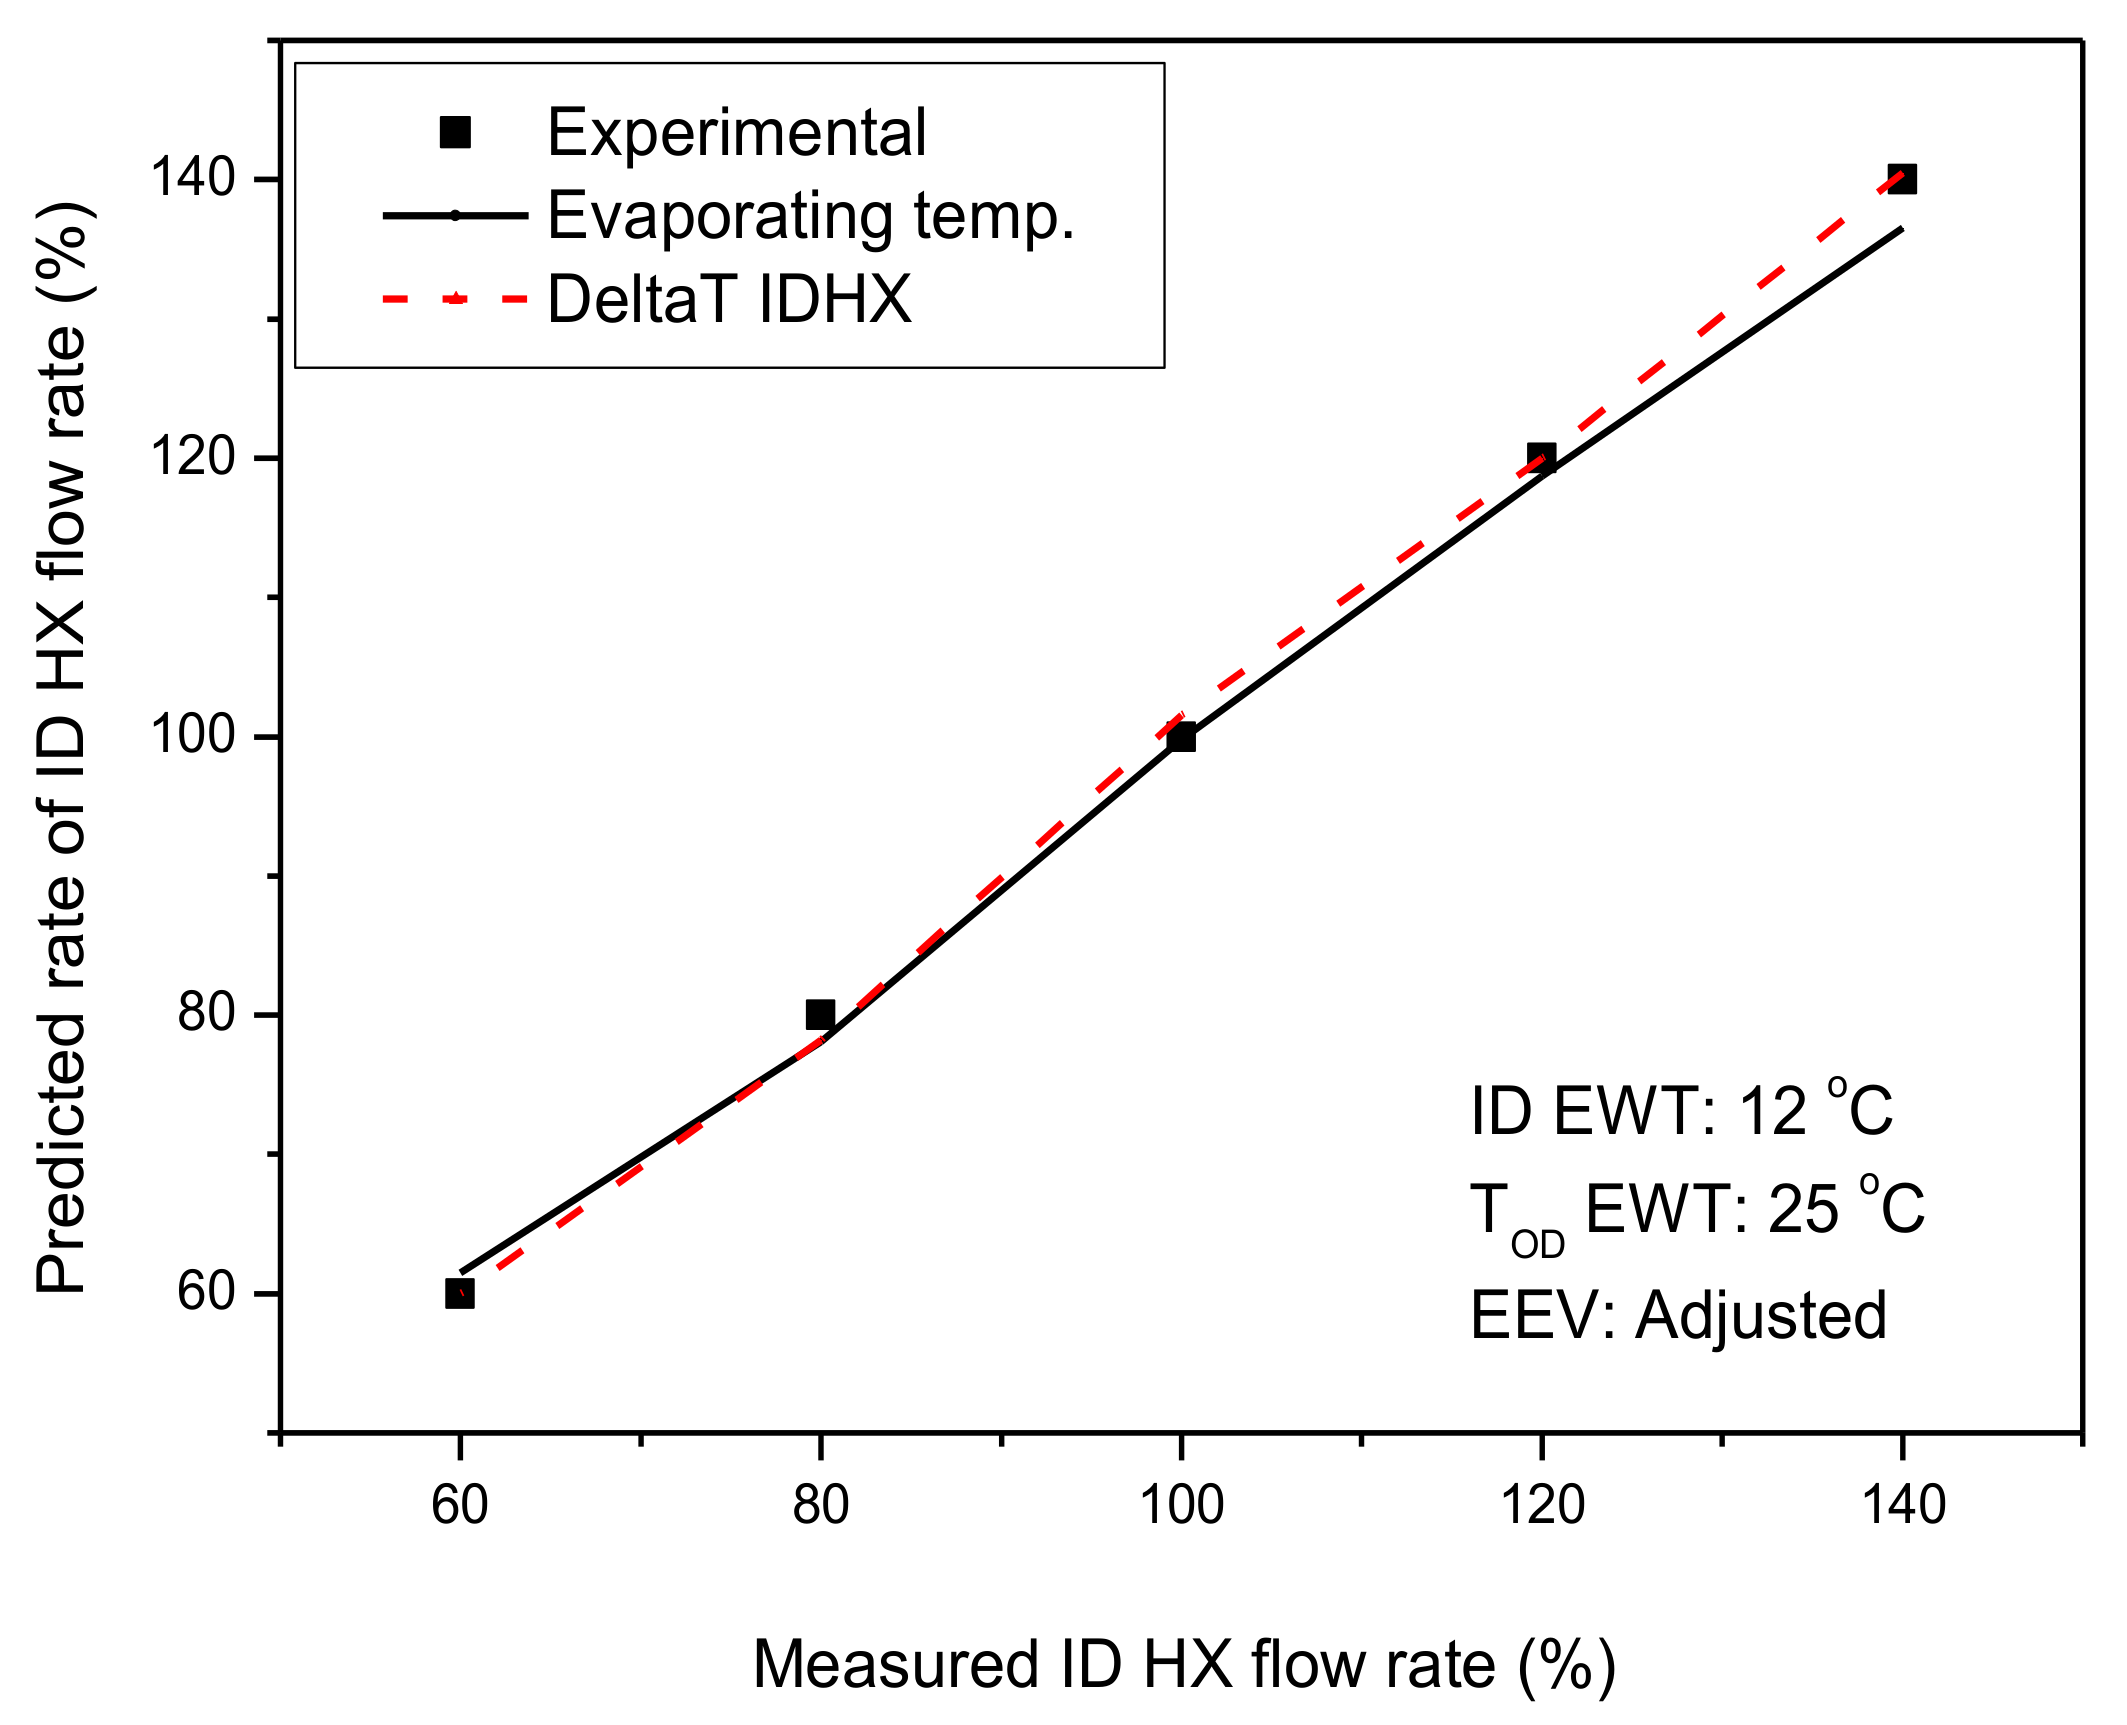
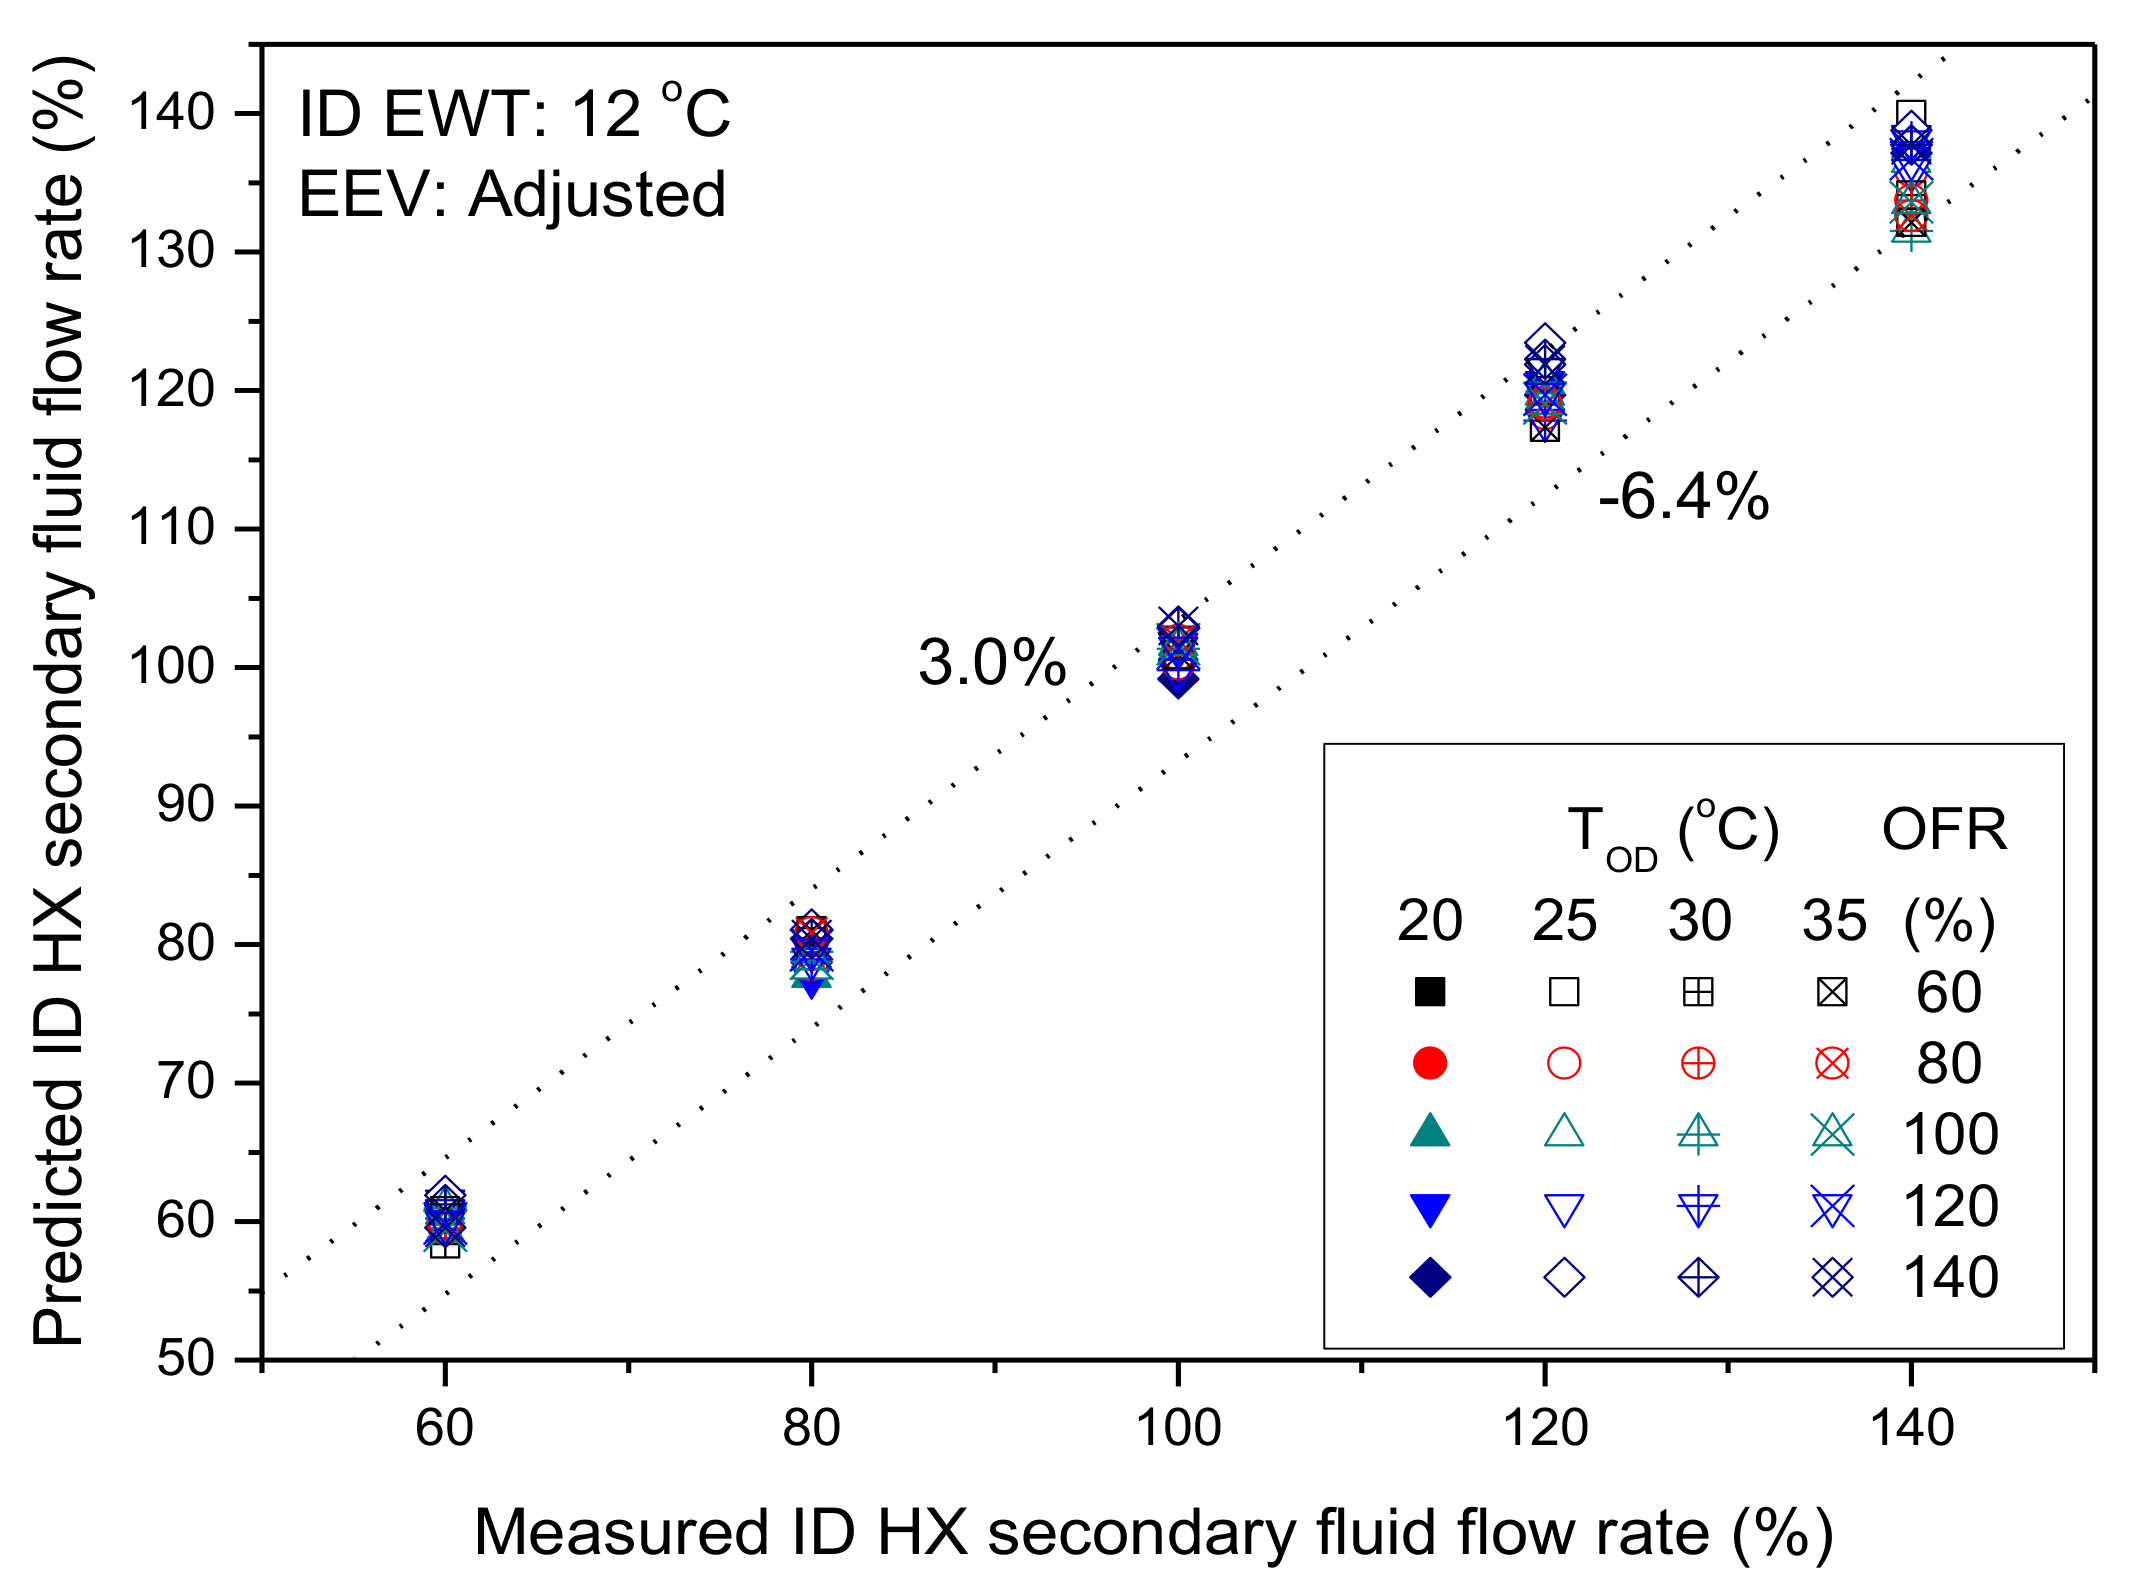
The correlation was validated by predicting the experimental evaporator SFFR. Figure 10 compares the experimental evaporator SFFR and predicted evaporator SFFR at the standard . The correlation correctly predicted the experimental evaporator SFFR within an error threshold of ±2.7% and ±2.2% when the evaporating temperature and brine temperature difference at the evaporator were used as independent variables respectively. Brine temperature difference at the evaporator has the lowest error threshold and is therefore selected as the heat pump parameter for the evaporator secondary fluid FDD correlation.
5.2. Condenser Secondary Fluid Flow Rate FDD Correlation
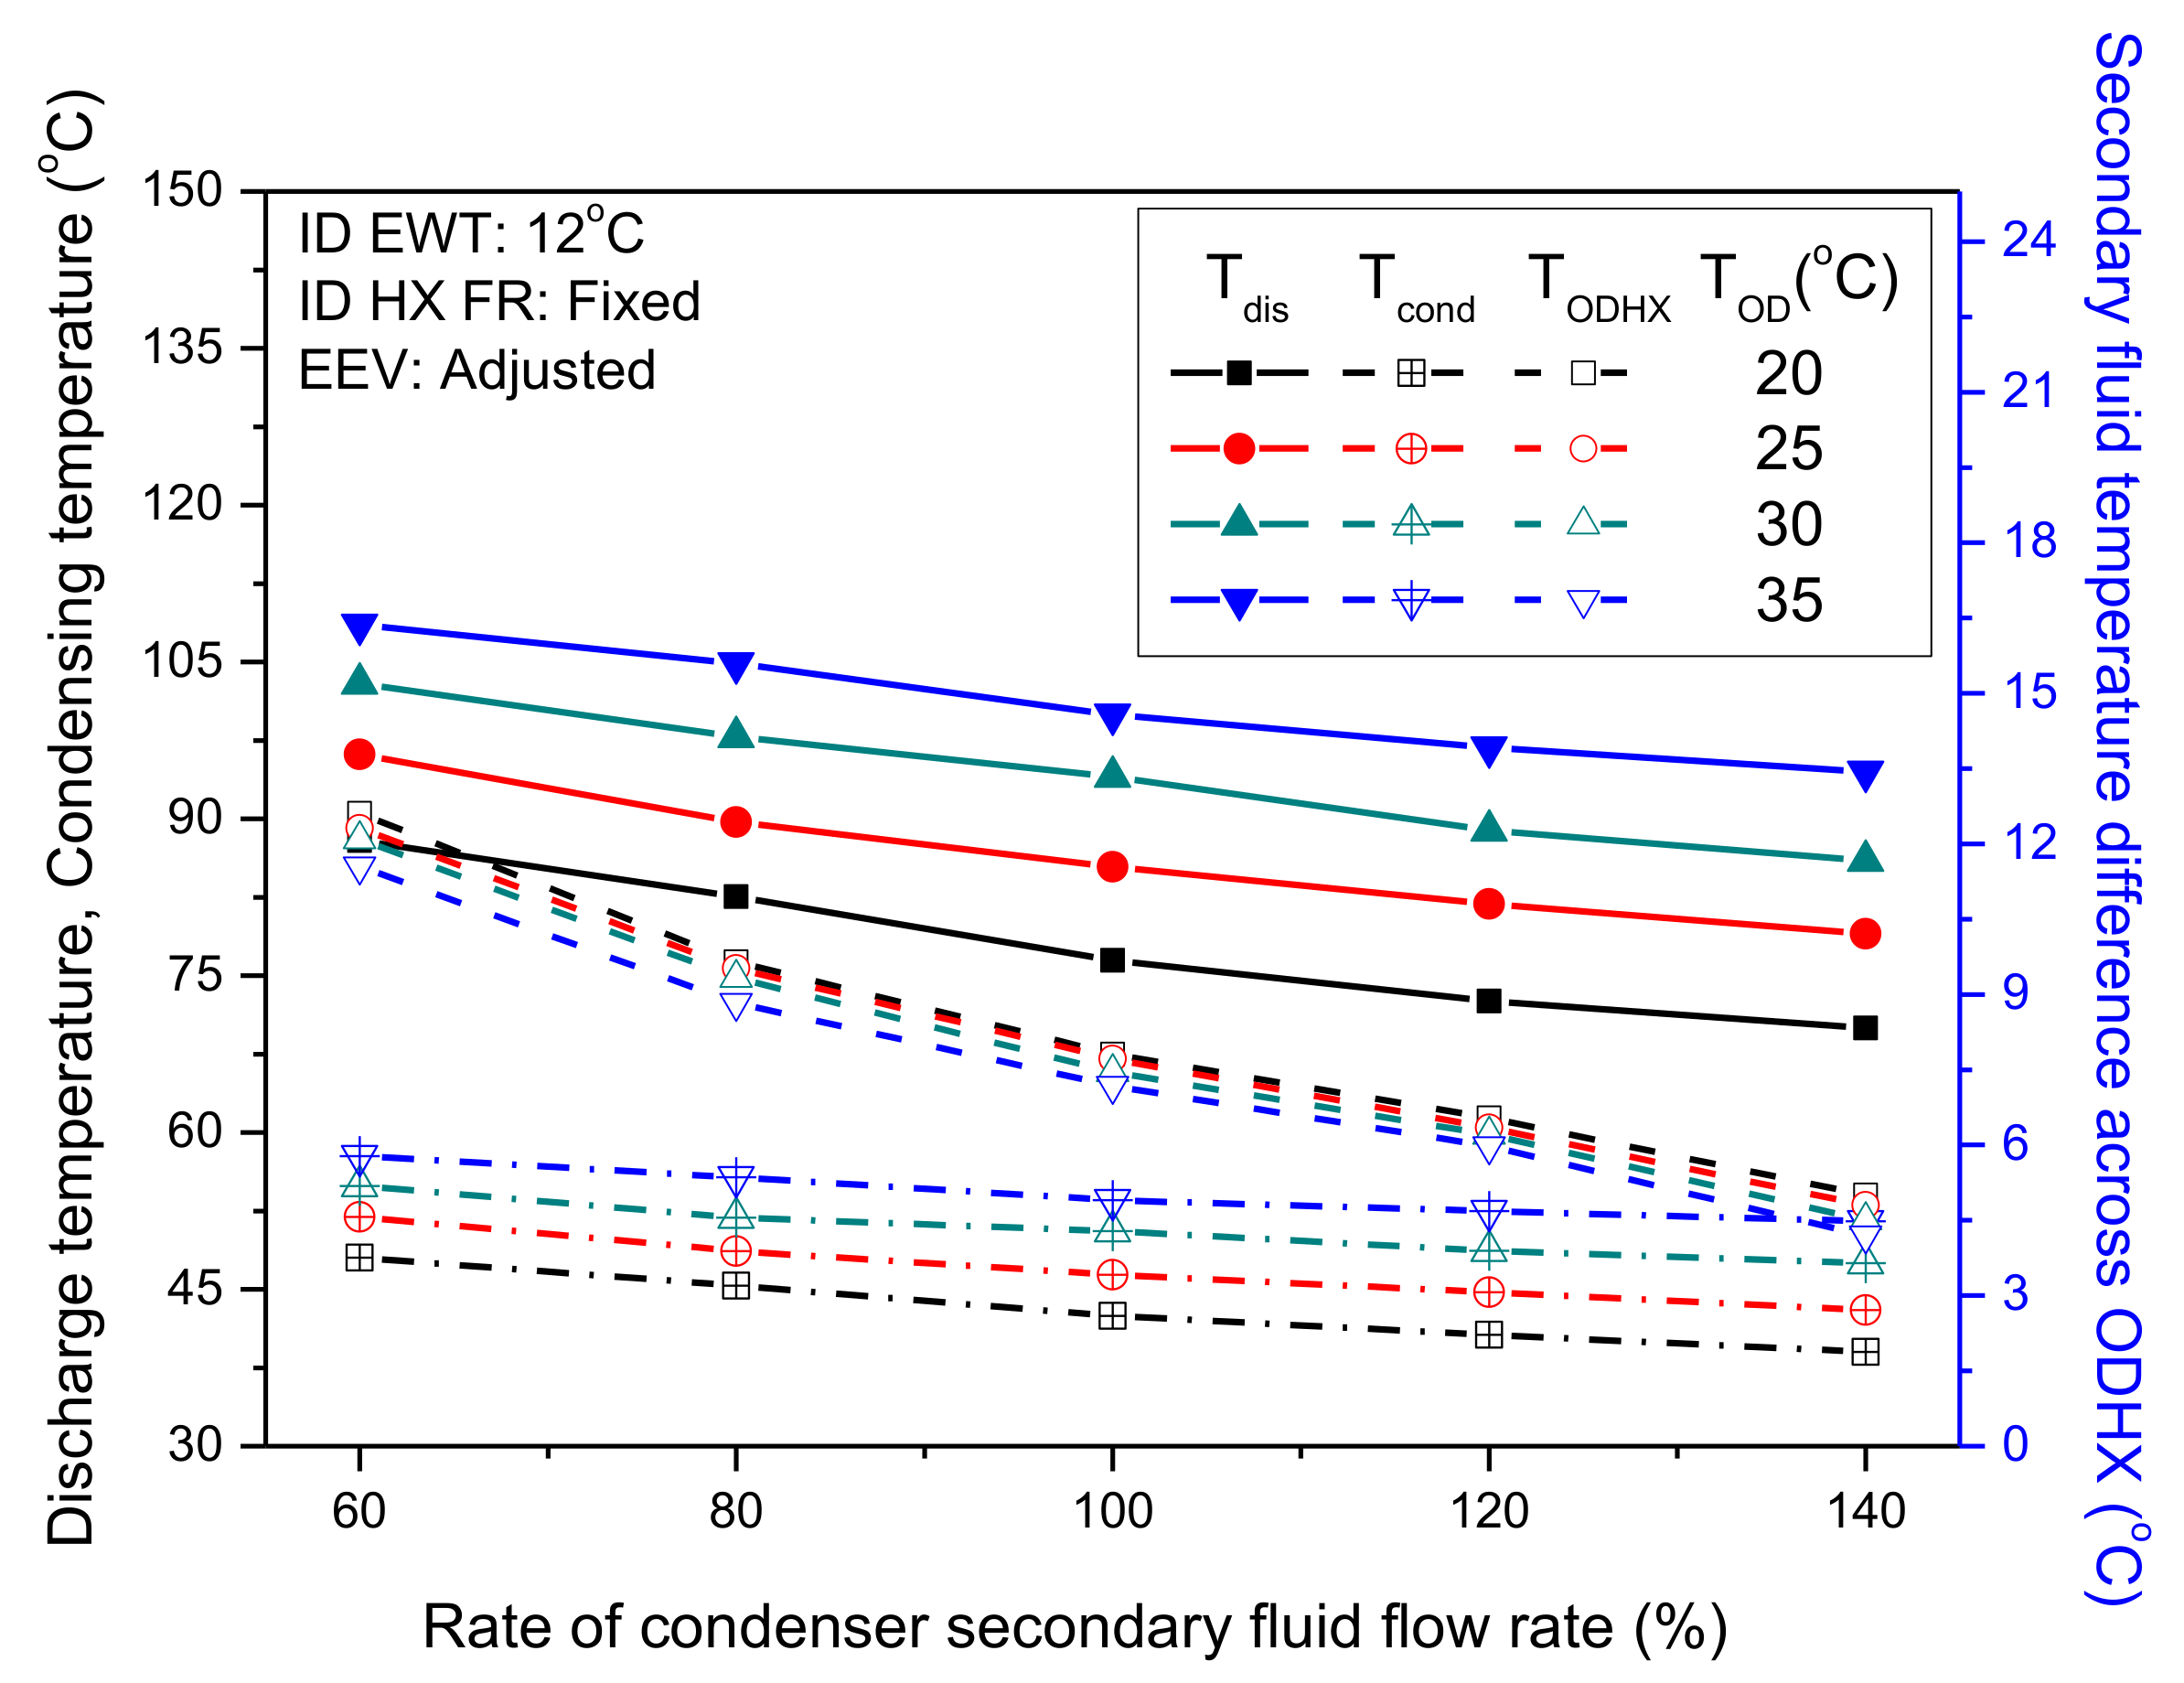
The compressor discharge temperature, condensing temperature, and brine temperature difference at the condenser increase at underflow conditions of the condenser secondary fluid flow rate and decrease at overflow conditions of the condenser secondary fluid flow rate at all outdoor temperature conditions, as shown in Figure 11. At condenser secondary fluid underflow conditions, the compressor discharge pressure increased to cause an increase in the compressor discharge temperature, while the heat transfer between the secondary fluid and refrigerant in the condenser increased to cause an increase in the condensing temperature and secondary fluid temperature difference at the inlet and outlet temperature of the condenser. Moreover, the compressor discharge temperature was greatly affected by variation in the outdoor entering water temperature followed by the condensing temperature. The temperature difference of the secondary fluid across the ODHX was not much affected by variation in the outdoor entering water temperature. Thus, the temperature difference of the secondary fluid across the ODHX can be a good parameter for detecting condenser secondary fluid flow rate faults. However, the three parameters were selected to model the condenser SFFR FDD correlations to determine which of them has the least error. The condenser secondary fluid FDD correlation was developed as a second order polynomial, as shown in Equation (6), where CFR is the condenser flow rate, represents the selected heat pump parameters, represents the condenser inlet water temperature, and a, b, c, d, e, f represent coefficients of the terms in the correlation, determined using multiple linear regression and shown in Table 3. The condenser flow rate correlation is applied by measuring the required operating parameter (compressor discharge temperature, condensing temperature, and the secondary fluid temperature difference across the ODHX) using sensors during the operation of the heat pump. The measured values are substituted into the correlation with their corresponding coefficients, as shown in Table 3, to predict the condenser flow rate.
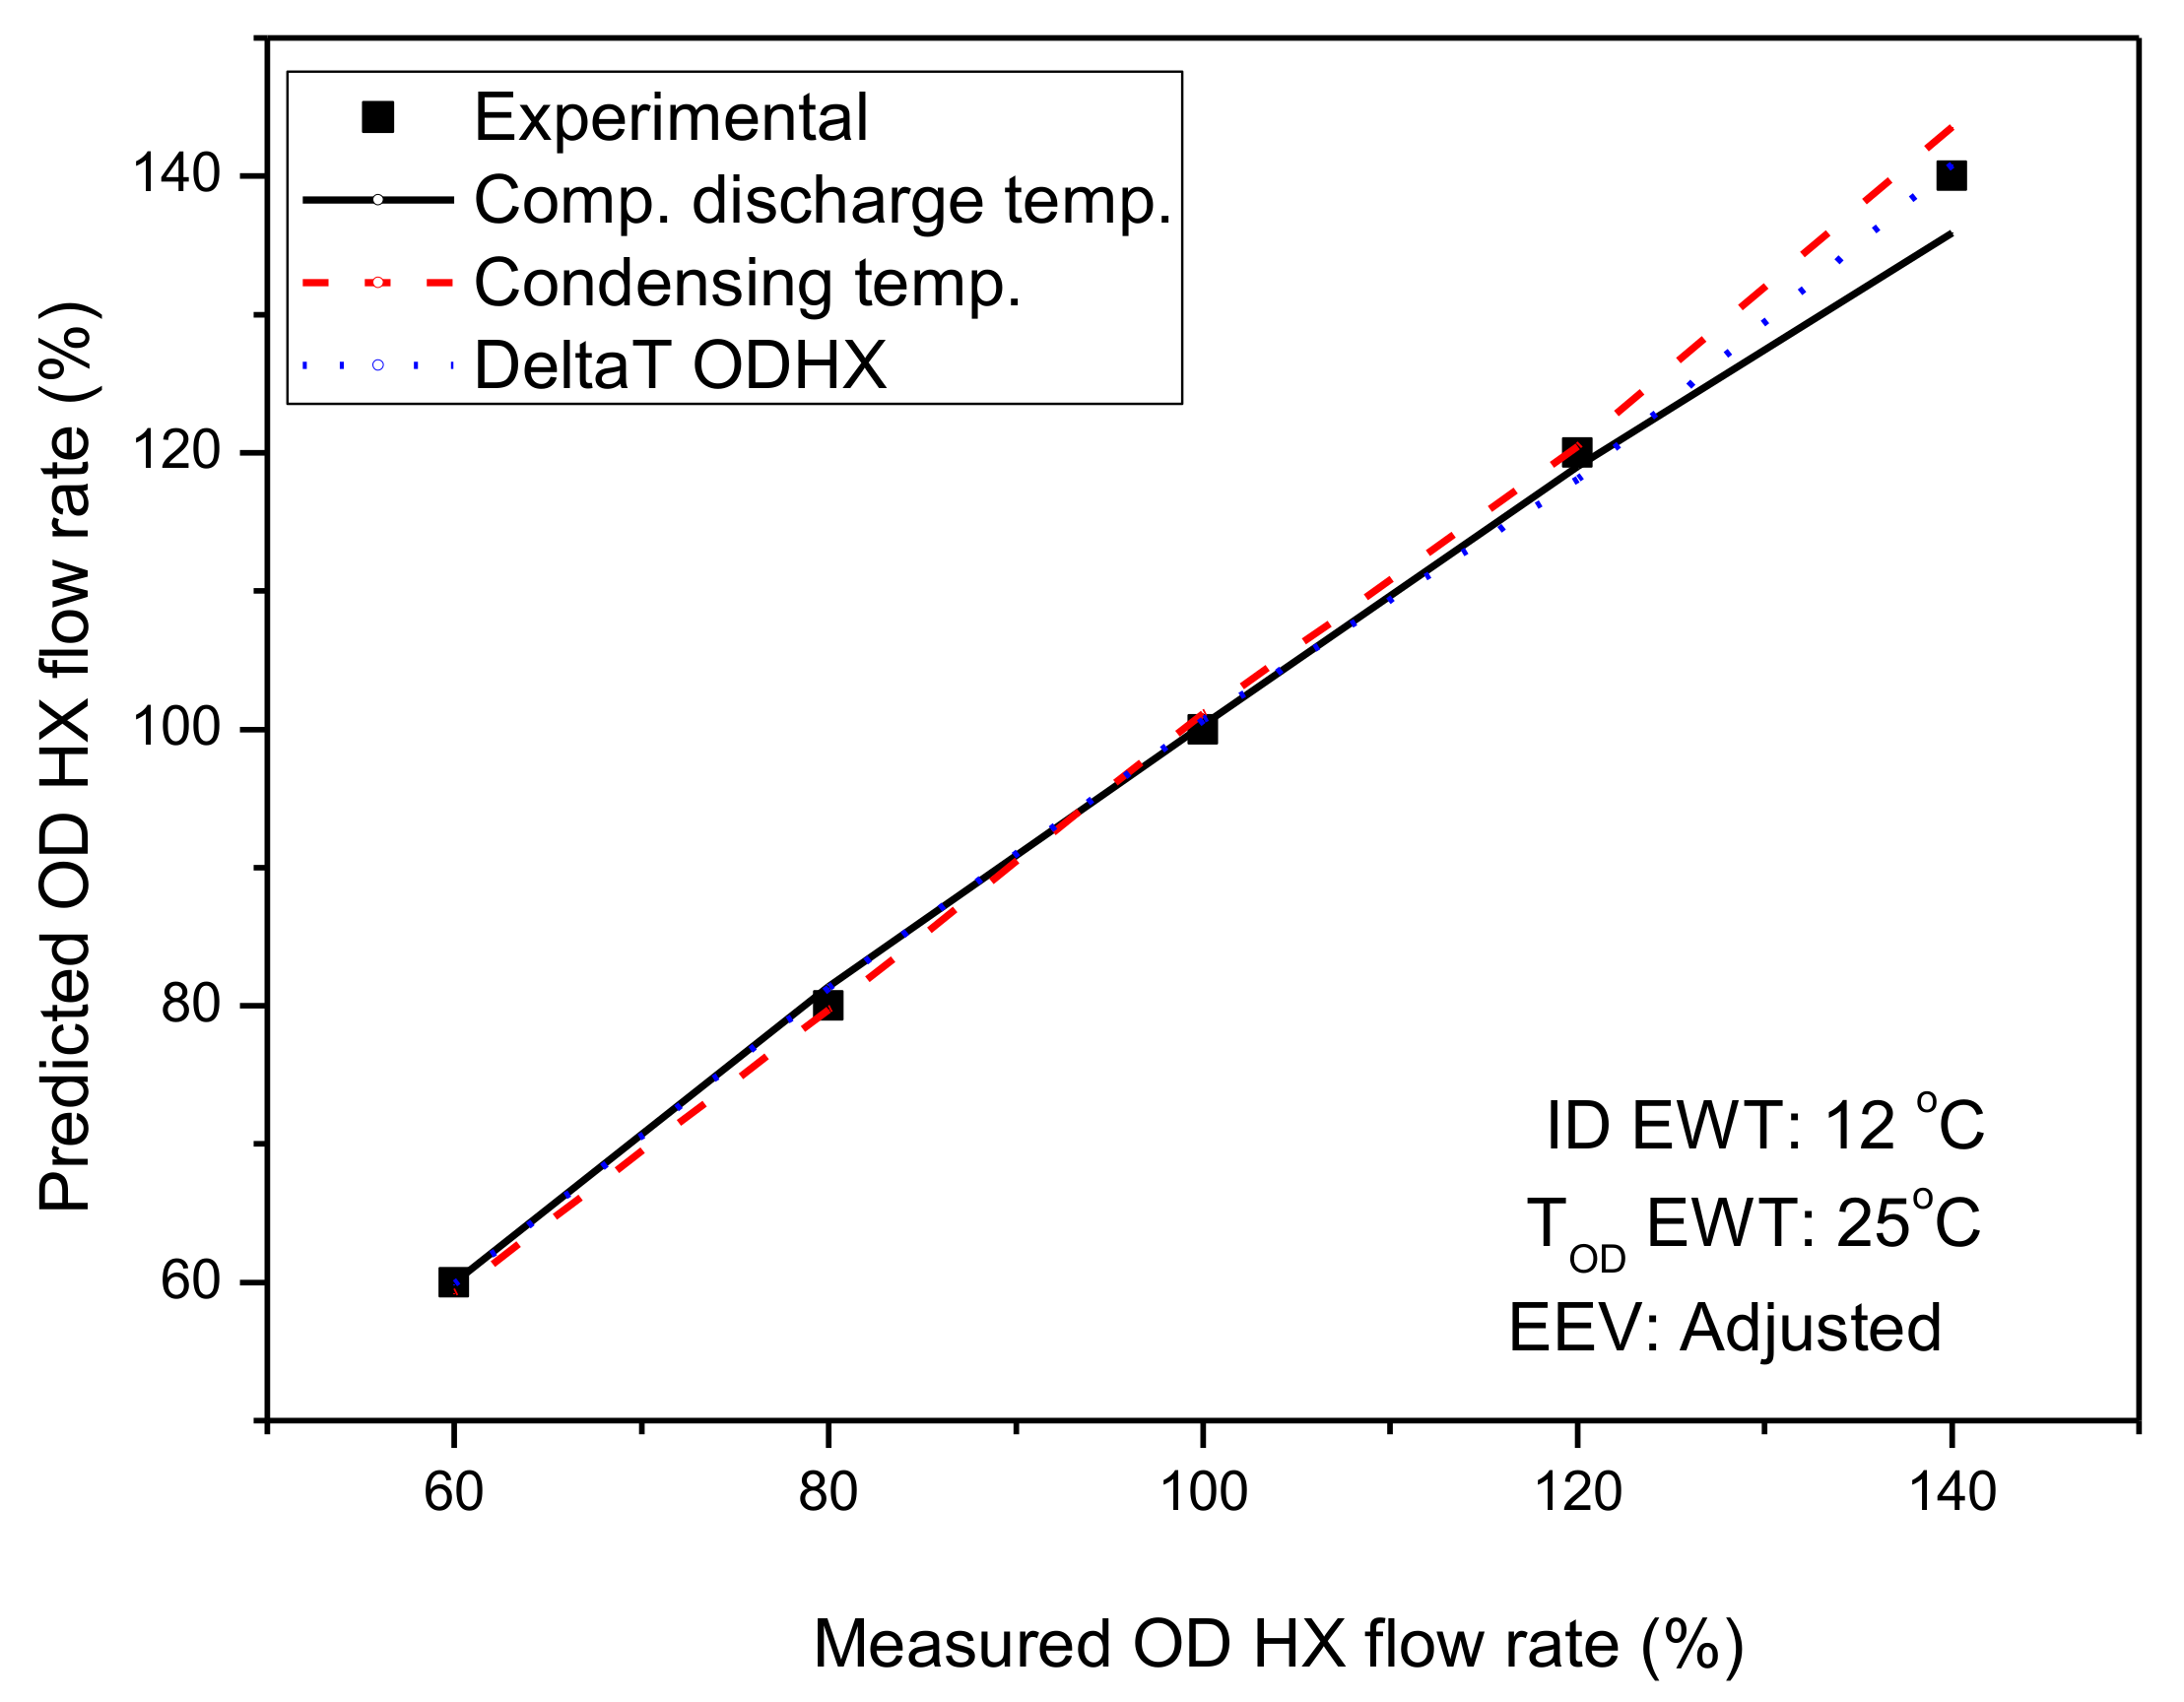
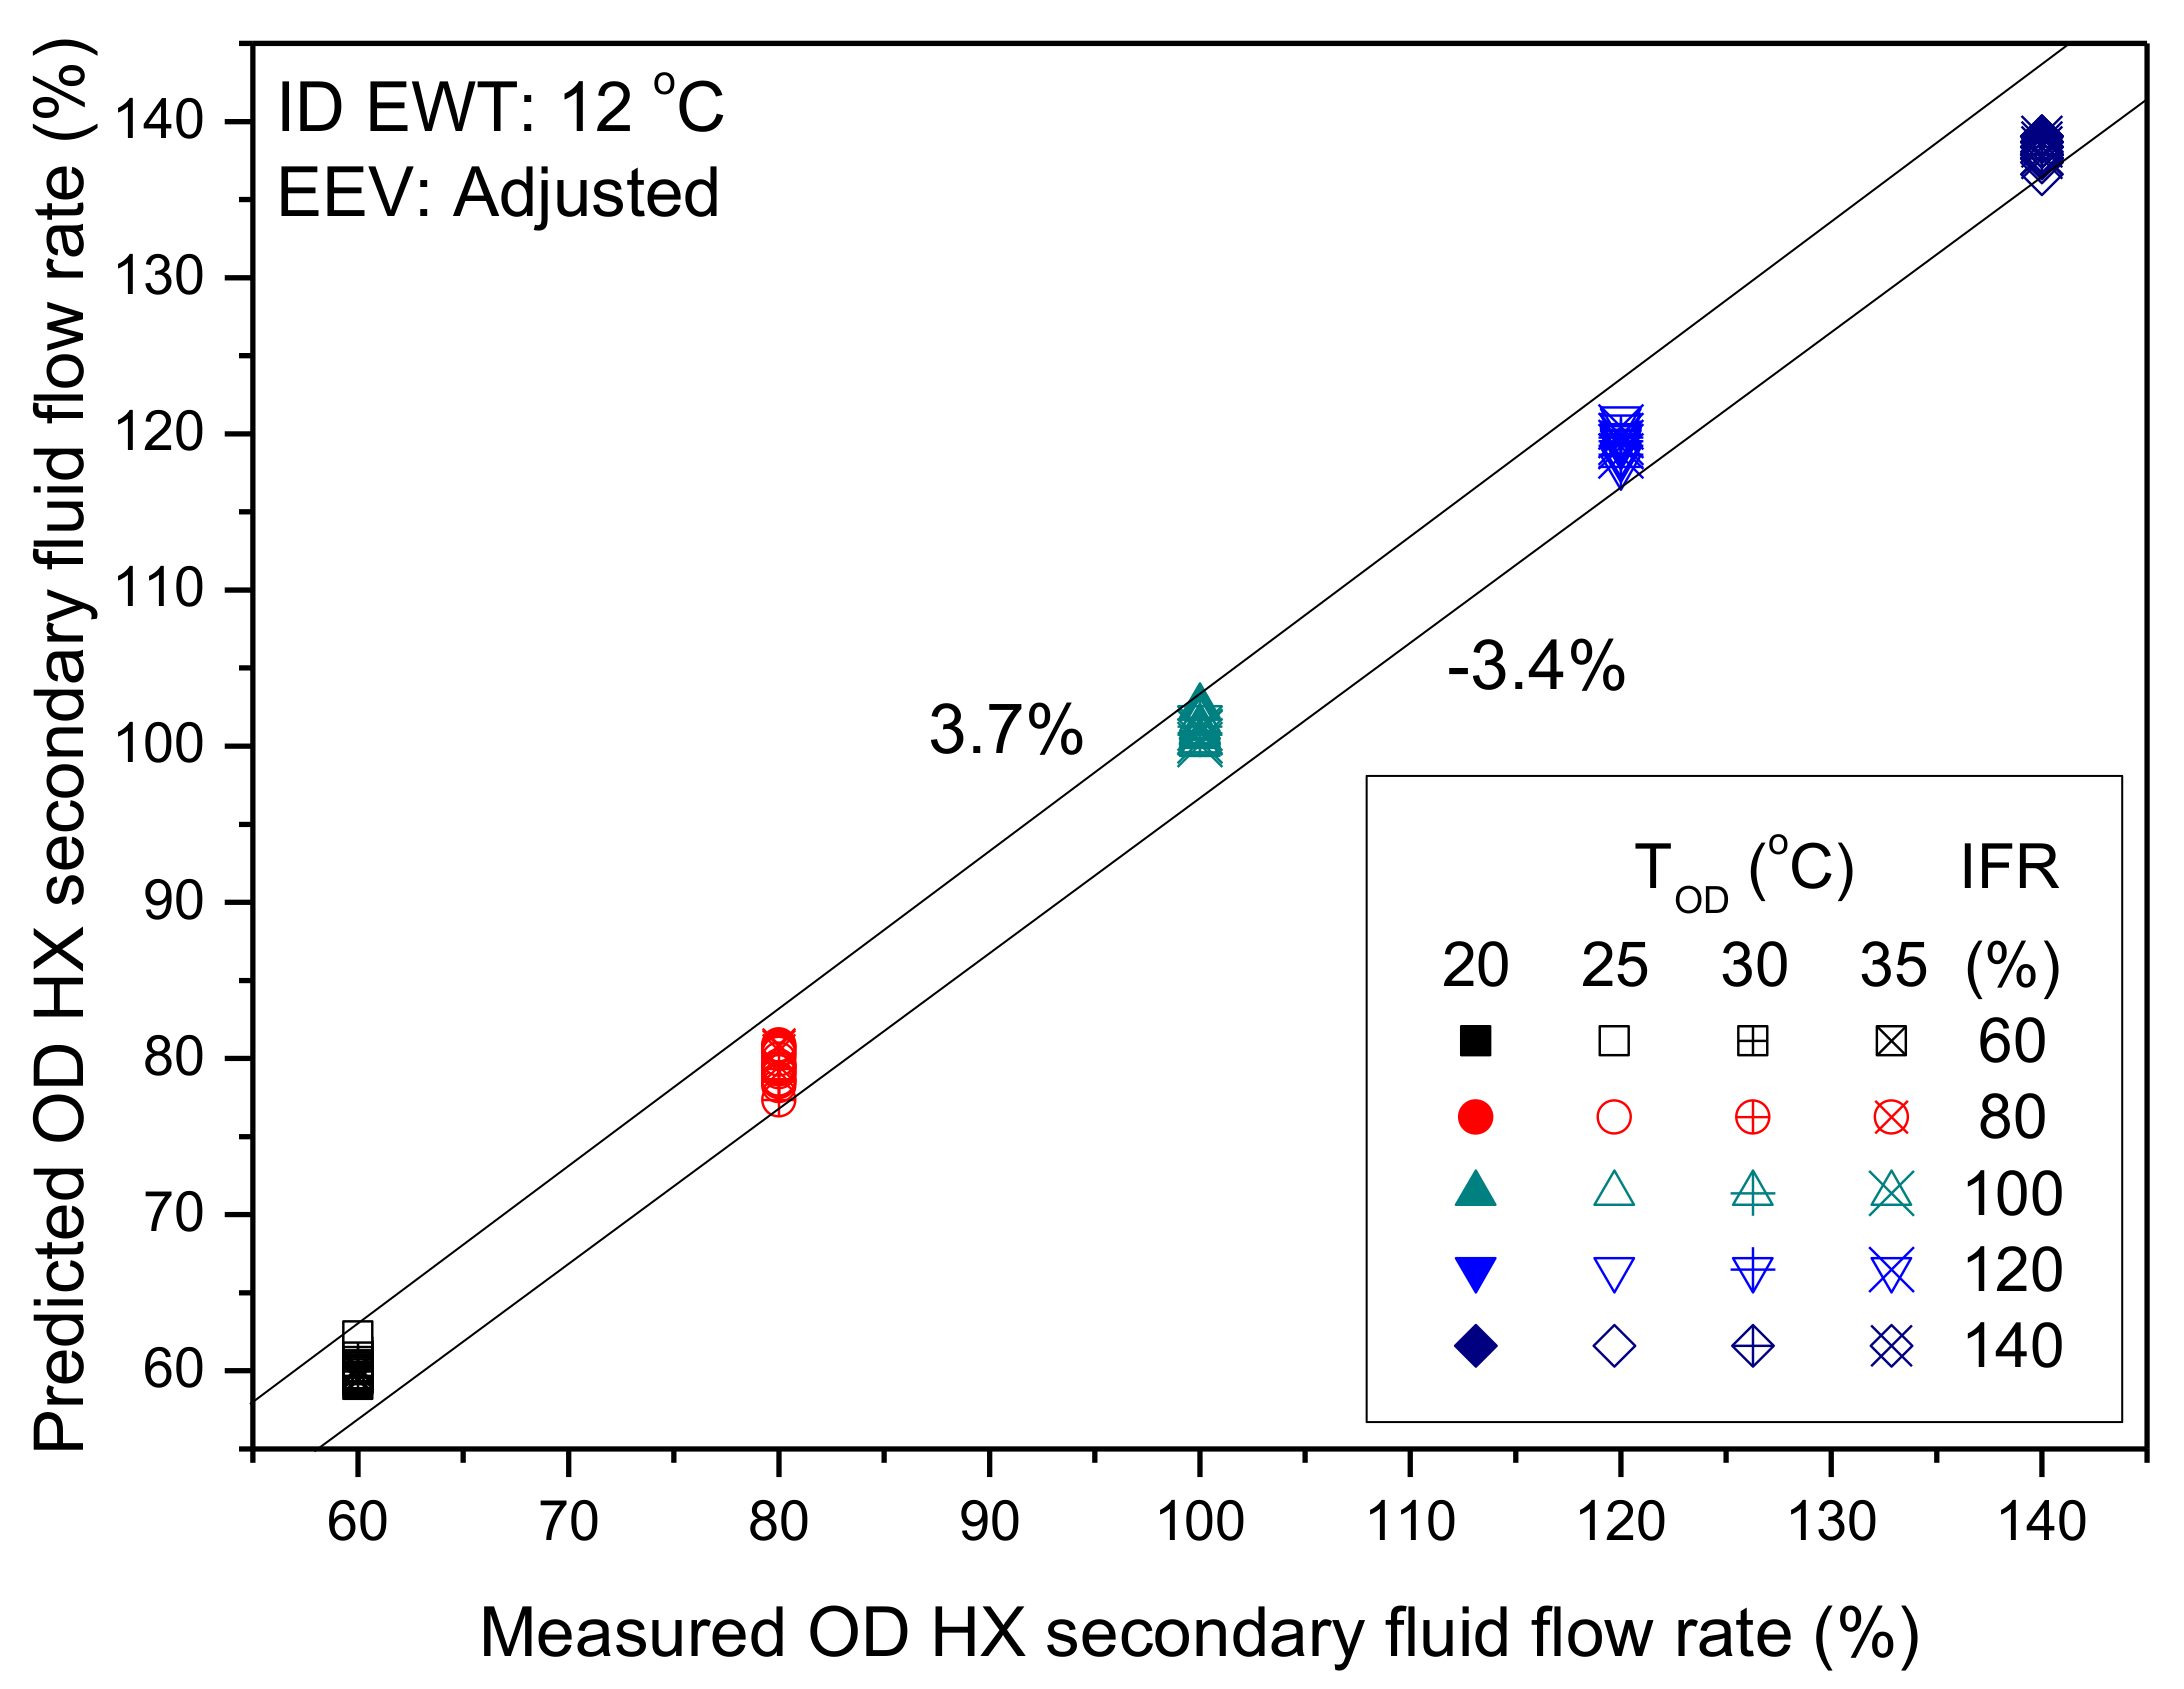
The condenser SFFR FDD is tested by using it to predict the experimental condenser SFFR used in this study. Figure 12 shows the predicted and experimental condenser SFFR at standard . The FDD correlation correctly predicted all experimental condenser SFFR within an error threshold of ±4.1%, ±4.2%, and ±1.6% when the compressor discharge temperature, condensing temperature, and secondary fluid temperature difference at the condenser were used as heat pump parameters in the FDD correlation respectively. The secondary fluid temperature difference at the condenser is therefore selected as the heat pump parameter for the condenser SFFR FDD correlation due to its lowest error threshold and because it is not significantly affected by .
5.3. Multiple-Simultaneous Secondary Fluid Flow Rate FDD Correlation
The secondary fluid temperature difference at the evaporator and the secondary fluid temperature difference at the condenser were selected to model the correlation for the MSSFF because they are greatly affected by the simultaneous evaporator and condenser faults and are easily measured by a temperature sensor in real systems. The was considered in the development of the SFFR FDD correlations due to its effect on the selected heat pump operating parameters. The MSSFF correlation was modeled as a second order polynomial according to the relationship between the temperature difference of secondary fluid in the evaporator and condenser and the SFFR faults, as shown in Figure 13. This is because the secondary fluid temperature difference at the outdoor heat exchanger has a linear trend according to variation of the condenser secondary fluid flow rate, while the secondary fluid temperature difference at the evaporator is not affected by the condenser secondary fluid flow rate. However, the secondary fluid temperature difference across the condenser and evaporator assumes a quadratic curve according to variation in the evaporator secondary fluid flow rate. The ODHX operated as a condenser while the IDHX operated as an evaporator in the study. Equation (7) presents the second order polynomial used for the MSSFF model, where and Q represent the brine temperature difference at the evaporator and condenser respectively, and is the condenser inlet water temperature with coefficients of the terms presented as a, b, c, d, e, f, g, h, i, j. The coefficient of the terms, presented in Table 4, were determined using multiple linear regression. The MSSFF correlation simultaneously predicts the evaporator SFFR and condenser SFFR. The correlation is applied by using temperature sensors to measure the condenser inlet temperature, the brine temperature difference across the condenser, and the brine temperature difference across the evaporator. The measured values are substituted into the correlation with evaporator SFFR coefficients and condenser SFFR coefficients, as shown in Table 4, to simultaneously predict the evaporator secondary fluid flow rate and condenser secondary fluid flow rate respectively.
The MSSFF correlation was validated by predicting the experimental evaporator SFFR and condenser SFFR simultaneously. Figure 14 and Figure 15 compare the predicted and experimental simultaneous evaporator and condenser SFFR respectively at various The MSSFF correlation correctly predicted the evaporator SFFR and condenser SFFR simultaneously within an error threshold of ±6.4% and ±3.7% respectively.
5.4. Secondary Fluid Flow Rate Fault Categorization Table
The heat pump parameter trends according to the experimental SFFR faults discussed in this study are used to develop the fault categorization table. Table 5 shows the fault categorization of the heat pump according to SFFR faults and . From the fault categorization table, ≡ means almost constant trend, ↓ means decreasing trend, ↑ represents an increasing trend, ↖ shows a slight increase, while ↘ shows a slight decrease in a parameter. In its application, a fault is detected using the developed correlations and diagnosed if the heat pump parameter trend agrees with that of the particular fault in the fault categorization table (Table 6). For instance, when an evaporator underflow fault is detected according to the evaporator flow rate fault correlation, the fault is confirmed by comparing the heat pump parameter trends with those shown in the fault categorization table relative to those at the no-fault state. Thus, cooling capacity, refrigerant mass flow rate, evaporating temperature, and degree of subcooling should be found to decrease significantly; condensing temperature, compressor discharge temperature, suction pressure, and temperature difference of secondary fluid across condenser should decrease slightly; temperature difference of secondary fluid across evaporator should increase significantly, while COP should remain constant.
6. Conclusions
Multi-simultaneous faults result largely in performance reduction and higher energy consumption of heat pumps. However, research on multiple-simultaneous secondary fluid faults is lacking in the open literature. This study discussed the performance characteristics of a water-to-water heat pump according to secondary fluid flow rate faults and developed FDD methodology for a single secondary fluid flow rate fault (SSFF) and multiple-simultaneous secondary fluid flow rate faults (MSSFF) occurring in the water-to-water heat pump unit at varying outdoor temperatures in cooling mode. The SSFF included IDHX underflow, IDHX overflow, ODHX underflow, and ODHX overflow faults, while the MSSFF included simultaneous IDHX underflow and ODHX underflow (SUUF), simultaneous IDHX underflow and ODHX overflow (SUOF), simultaneous IDHX overflow and ODHX underflow (SOUF) and simultaneous IDHX overflow and ODHX overflow (SOOF). The cooling capacity decreased at IDHX underflow, ODHX underflow, and all MSSFF conditions except SOOF. COP increased at IDHX overflow, ODHX overflow, SUOF, and SOOF conditions. However, COP was not affected by IDHX underflow conditions.
A FDD model was developed for the secondary fluid flow rate faults in the water-to-water heat pump unit using correlations and a fault categorization table. The correlations were developed using multiple linear regression for the SSFF and MSSFF. The evaporating temperature, condensing temperature, compressor discharge temperature, and secondary fluid temperature difference across the IDHX and ODHX were used as independent variables to model the secondary fluid flow rate fault correlations. Correlations using the secondary fluid temperature difference across the IDHX and ODHX had the lowest error thresholds and were therefore selected for the secondary fluid flow rate FDD methodology.
The developed FDD correlations were validated by using them to predict the experimentally imposed secondary fluid flow rate faults. For SSFF, correlation using the secondary fluid temperature difference across the IDHX predicted the IDHX secondary fluid flow rate fault within the lowest error threshold of ±1.6%. Correlation using the secondary fluid temperature difference across the ODHX as an independent variable predicted the ODHX secondary fluid flow rate fault within the lowest error threshold of ±2.2%. The MSSFF correlation used the secondary fluid temperature difference across the IDHX and ODHX to predict simultaneous IDHX and ODHX secondary fluid flow rate faults within an error threshold of ±6.4%.
The FDD correlations are developed for the water-to-water heat pump unit used in this study, which has specific component sizes and can therefore not be directly applied to all heat pumps. However, the methodology provides a guide for researchers to develop FDD correlations specific to their systems. Future studies will focus on developing FDD methodologies that can be generally applied in all ground source heat pumps.
Author Contributions
S.B. and J.M.C. conducted the data analysis and wrote this paper. K.M. executed tests. Y.N. checked the results and reviewed the paper. All authors have read and agreed to the published version of the manuscript.
Funding
This research was funded by the Korea government (MSIT) [No. 2019R1A2C2087157].
Acknowledgments
This work was supported by the National Research Foundation of Korea (NRF) grant funded by the Korean government (MSIT) (No. 2019R1A2C2087157, Artificial neural network-based optimized operating model of building HVAC systems control parameters for improved energy efficiency and reduced operating cost).
Conflicts of Interest
The authors declare no conflicts of interest.
Nomenclature
| Abbreviations | |
| EEV | Electronic expansion valve |
| EFR | Evaporator secondary fluid flow rate |
| EWT | Entering water temperature |
| FDD | Fault detection and diagnosis |
| GSHP | Ground source heat pump |
| IDHX | Indoor heat exchanger |
| LWT | Leaving water temperature |
| MSSFF | Multiple-simultaneous flow rate faults |
| ODHX | Outdoor heat exchanger |
| RTD | Resistance temperature detector |
| SOOF | Simultaneous evaporator overflow and condenser overflow |
| SOUF | Simultaneous evaporator overflow and condenser underflow |
| SFFR | Secondary fluid flow rate |
| SSFF | Single secondary fluid flow rate faults |
| SUOF | Simultaneous evaporator underflow and condenser overflow |
| SUUF | Simultaneous evaporator underflow and condenser underflow |
| Variables | |
| COP | Coefficient of performance |
| Specific heat capacity of water [kJ/kgK] | |
| Q | Cooling capacity [kW] |
| Evaporating temperature [] | |
| Brine temperature difference in evaporator [] | |
| Condenser inlet water temperature [] | |
| Brine temperature difference in condenser [] | |
| Compressor discharge temperature [] | |
| Condensing temperature [] | |
| U | Uncertainty |
| Volumetric flow rate [l/min] | |
| W | Power consumption [kW] |
| Nominal value of variable |
References
- Sarbu, I.; Sebarchievici, C. Using ground source heat pump systems for heating/cooling of buildings. In Advances in Geothermal Energy; InTechOpen: London, UK, 2016. [Google Scholar]
- Boahen, S.; Lee, K.H.; Choi, J.M. Refrigerant charge fault detection and diagnosis algorithm for water-to-water heat pump unit. Energies 2019, 12, 545. [Google Scholar] [CrossRef] [Green Version]
- Fernandez, N.E.; Katipamula, S.; Wang, W.; Xie, Y.; Zhao, M.; Corbin, C.D. Impacts of Commercial Building Controls on Energy Savings and Peak Load Reduction; Report No. PNNL-25985; Pacific Northwest National Lab (PNNL): Richland, WA, USA, 2017. [Google Scholar]
- Zhang, Z.; Dong, X.; Ren, Z.; Lai, T.; Hou, Y. Influence of refrigerant charge amount and EEV opening on the performance of a transcritical CO2 heat pump water heater. Energies 2017, 10, 1521. [Google Scholar] [CrossRef] [Green Version]
- Choi, H.; Cho, H.; Choi, J.M. Refrigerant amount detection algorithm for a ground source heat pump unit. Renew. Energy 2012, 42, 111–117. [Google Scholar] [CrossRef]
- Payne, W.V.; Heo, J.; Domanski, P.A. A data-clustering technique for fault detection and diagnostics in field-assembled air conditioners. Int. J. Air Cond. Refrig. 2018, 26, 1850015. [Google Scholar] [CrossRef]
- Gasche, J.L.; Andreotti, T.; Maia, C.R.M. A model to predict R134a refrigerant leakage through the radial clearance of rolling piston compressors. Int. J. Refrig. 2012, 35, 2223–2232. [Google Scholar] [CrossRef]
- Cho, J.M.; Heo, J.; Payne, W.V.; Domanski, P.A. Normalized performance parameters for a residential heat pump in the cooling mode with single faults imposed. Appl. Therm. Eng. 2014, 67, 1–15. [Google Scholar] [CrossRef]
- Yoo, J.W.; Hong, S.B.; Kim, M.S. Refrigerant leakage detection in an EEV installed residential air conditioner with limited sensor installations. Int. J. Refrig. 2017, 78, 157–165. [Google Scholar] [CrossRef]
- Wang, S.; Zhou, Q.; Xiao, F. A system-level fault detection and diagnosis strategy for HVAC systems involving sensor faults. Energy Build. 2010, 42, 477–490. [Google Scholar] [CrossRef]
- Casteleiro-Roca, J.L.; Quintián, H.; Calvo-Rolle, J.L.; Corchado, E.; Meizoso-López, M.D.C.; Piñón-Pazos, A. An intelligent fault detection system for a heat pump installation based on a geothermal heat exchanger. J. Appl. Log. 2016, 17, 36–47. [Google Scholar] [CrossRef] [Green Version]
- Saththasivam, J.; Tang, G.; Ng, K.C. Evaluation of the simple thermodynamic model (Gordon and NG universal chiller model) as a fault detection and diagnosis tool for on-site centrifugal chillers. Int. J. Air Cond. Refrig. 2010, 18, 55–60. [Google Scholar] [CrossRef]
- Sellami, A.; Aridhi, E.; Mzoughi, D.; Mami, A. Performance of the Bond Graph Approach for the detection and localization of faults of a refrigerator compartment containing an ice quantity. Int. J. Air Cond. Refrig. 2018, 26, 1850028. [Google Scholar] [CrossRef]
- Zhao, Y.; Wang, S.; Xiao, F. A statistical fault detection and diagnosis method for centrifugal chillers based on exponentially-weighted moving average control charts and support vector regression. Appl. Therm. Eng. 2013, 51, 560–572. [Google Scholar] [CrossRef]
- Noel, D.; Riviere, P.; Teuillieres, C.; Cauret, O.; Marchio, D. Experimental characterization of fault impacts on the functioning variables of an inverter driven heat pump. In Proceedings of the 10th International Conference on System Simulation in Buildings, Liège, Belgium, 10–12 December 2018. [Google Scholar]
- Zhao, X.; Yang, M.; Li, H. Field implementation and evaluation of a decoupling-based fault detection and diagnosis method for chillers. Energy Build. 2014, 72, 419–430. [Google Scholar] [CrossRef]
- Han, H.; Gu, B.; Hong, Y.; Kang, J. Automated FDD of multiple simultaneous faults (MSF) and the application to building chillers. Energy Build. 2011, 43, 2524–2532. [Google Scholar] [CrossRef]
- Du, Z.; Jin, X. Multiple faults diagnosis for sensors in air handling unit using Fisher discriminant analysis. Energy Convers. Manag. 2008, 49, 3654–3665. [Google Scholar] [CrossRef]
- Oughton, D.; Hodkinson, S.; Brailsford, R.M. Faber & Kell’s Heating and Air-Conditioning of Buildings, 11th ed.; CRC Press: Boca Raton, FL, USA, 2014; ISBN 9781136326462. [Google Scholar]
- International Standard. ISO 13256-2. Water-Source Heat Pumps—Testing and Rating for Performance Part 2 Water-to-Water and Brine-to-Water Heat Pumps; International Organization for Standardization: Geneva, Switzerland, 1998. [Google Scholar]
- ASHRAE. ASHRAE Guideline 2. Engineering Analysis of Experimental Data; ASHRAE: Atlanta, GA, USA, 2010. [Google Scholar]
Figure 1.
Schematic diagram of the heat pump unit.

Figure 2.
Picture of the experimental rig.

Figure 3.
Variation of cooling capacity with evaporator flow rate and condenser inlet water temperature ().
Figure 3.
Variation of cooling capacity with evaporator flow rate and condenser inlet water temperature ().

Figure 4.
COP variation with evaporator flow rate and .

Figure 5.
Variation of cooling capacity with condenser flow rate and .

Figure 6.
COP with the variation of condenser flow rate and .

Figure 7.
COP with combined evaporator SFFR and condenser SFFR faults.

Figure 8.
Variation of cooling capacity with combined evaporator SFFR and condenser SFFR faults.

Figure 9.
Relationship between evaporator SFFR and evaporating temperature.

Figure 10.
Comparison between predicted and measured evaporator SFFR at standard .

Figure 11.
Relationship between condenser SFFR, condensing temperature, and compressor discharge temperature.
Figure 11.
Relationship between condenser SFFR, condensing temperature, and compressor discharge temperature.

Figure 12.
Comparison between predicted and measured condenser SFFR at standard .

Figure 13.
Relationship between MSSFF and secondary fluid temperature difference across condenser and evaporator at standard .
Figure 13.
Relationship between MSSFF and secondary fluid temperature difference across condenser and evaporator at standard .

Figure 14.
Comparison between predicted and measured evaporator SFFR using MSSFF correlation.

Figure 15.
Comparison between predicted and measured condenser SFFR using MSSFF correlation.


Table 1.
Test conditions.
| Item | Unit | Reference Condition | Experimented Condition |
|---|---|---|---|
| Operating mode | - | Cooling | Cooling |
| Refrigerant | - | R410A | R410A |
| Optimum charge amount | g | 4700 | 4700 |
| Evaporator inlet water temperature | 12 | 12 | |
| 25 | 20, 25, 30, 35 | ||
| Condenser secondary fluid flow rate | LPM | 8 | 8 |
| Evaporator SFFR | LPM | 8 | 8 |
| Rate of evaporator SFFR | % | 100 | 60, 80, 100, 120, 140 |
| Rate of evaporator SFFR | % | 100 | 60, 80, 100, 120, 140 |
| EEV opening | % | Adjusted | Adjusted |
Table 2.
The cases of secondary fluid flow rate faults.
| Flow Rate Fault Cases | Secondary Fluid Flow Rate | |
|---|---|---|
| Evaporator | Condenser | |
| Single secondary fluid flow rate fault | Overflow | Rated flow rate |
| Underflow | Rated flow rate | |
| Rated flow rate | Overflow | |
| Rated flow rate | Underflow | |
| Multiple-simultaneous secondary fluid flow rate fault | Overflow | Overflow |
| Overflow | Underflow | |
| Underflow | Overflow | |
| Underflow | Underflow | |
Table 3.
Sensor accuracies.
| Sensor | Accuracy |
|---|---|
| T-type thermocouples | ±0.2 |
| Pressure transducer | ±0.06% |
| Mass flow meter | ±0.1% |
| Power meter | ±0.1% |
| Volumetric flowmeters | ±0.5% |
| Resistance temperature detector sensors | ±0.15 |
Table 4.
Coefficients of condenser SFFR correlations.
| P | a | b | c | d | e | f |
|---|---|---|---|---|---|---|
| Brine temperature difference across condenser | 241.2 | 0.0584 | −0.0181 | −23.21 | 0.6569 | 0.0479 |
| Condensing temperature | 623.8 | 35.41 | 0.4569 | −35.49 | 0.5574 | −1.075 |
| Compressor discharge temperature | 434.7 | 27.08 | 0.2689 | −13.2028 | 0.1046 | −0.3816 |
Table 5.
Coefficients of the MSSFF model.
| Coefficient | Evaporator SFFR | Condenser SFFR |
|---|---|---|
| a | 410.2 | 338.3 |
| b | −2.28 | −0.4819 |
| c | −0.007556 | −0.01927 |
| d | −75.15 | −8.539 |
| e | 3.98 | −0.04613 |
| f | −2.7872024 | −35.52 |
| g | −0.008643 | 1.127 |
| h | 0.2897 | 0.455 |
| i | 0.2789 | 0.01375 |
| j | −0.01765 | 0.08249 |
Table 6.
Secondary fluid flow rate fault categorization table.
| Heat Pump Parameter | Evaporator Underflow | Condenser Underflow | SUUF | SUOF | SOUF | Increased |
|---|---|---|---|---|---|---|
| Cooling capacity | ↓ | ↘ | ↓ | ↓ | ↓ | ↓ |
| COP | ≡ | ↓ | ↓ | ↑ | ↓ | ↓ |
| Refrigerant mass flow rate | ↓ | ≡ | ↓ | ↓ | ↑ | ↘ |
| Condensing temperature | ↘ | ↑ | ↑ | ↓ | ↑ | ↑ |
| Evaporating temperature | ↓ | ≡ | ↓ | ↓ | ↑ | ↑ |
| Compressor discharge temperature | ↘ | ↑ | ↑ | ↑ | ↑ | ↑ |
| Suction pressure | ↘ | ↖ | ↓ | ↖ | ≡ | ≡ |
| Subcooling | ↓ | ≡ | ↓ | ↓ | ↑ | ≡ |
| Brine temperature difference at the evaporator | ↑ | ↘ | ↑ | ↑ | ↓ | ↘ |
| Brine temperature difference at the condenser | ↘ | ↑ | ↑ | ↓ | ↑ | ↓ |
© 2020 by the authors. Licensee MDPI, Basel, Switzerland. This article is an open access article distributed under the terms and conditions of the Creative Commons Attribution (CC BY) license (http://creativecommons.org/licenses/by/4.0/).
Share and Cite
MDPI and ACS Style
Boahen, S.; Mensah, K.; Nam, Y.; Choi, J.M. Fault Detection Methodology for Secondary Fluid Flow Rate in a Heat Pump Unit. Energies 2020, 13, 2974. https://0-doi-org.brum.beds.ac.uk/10.3390/en13112974
AMA Style
Boahen S, Mensah K, Nam Y, Choi JM. Fault Detection Methodology for Secondary Fluid Flow Rate in a Heat Pump Unit. Energies. 2020; 13(11):2974. https://0-doi-org.brum.beds.ac.uk/10.3390/en13112974
Chicago/Turabian StyleBoahen, Samuel, Kwesi Mensah, Yujin Nam, and Jong Min Choi. 2020. "Fault Detection Methodology for Secondary Fluid Flow Rate in a Heat Pump Unit" Energies 13, no. 11: 2974. https://0-doi-org.brum.beds.ac.uk/10.3390/en13112974
Note that from the first issue of 2016, this journal uses article numbers instead of page numbers. See further details here.