Hedging Strategies of Green Assets against Dirty Energy Assets


1
Nonlinear Analysis and Applied Mathematics (NAAM)-Research Group, Department of Mathematics, Faculty of Science, King Abdulaziz University, Jeddah, Makkah 22254, Saudi Arabia
2
USEK Business School, Holy Spirit University of Kaslik, P.O. Box 446 Jounieh, Lebanon
3
Institute of Business Research, University of Economics Ho Chi Minh City, Ho Chi Minh City 70000, Vietnam
4
Institute of Business Research, University of Economics Ho Chi Minh City, Ho Chi Minh City 70000, Vietnam
*
Author to whom correspondence should be addressed.
Energies 2020, 13(12), 3141; https://0-doi-org.brum.beds.ac.uk/10.3390/en13123141
Submission received: 11 May 2020
/
Revised: 4 June 2020
/
Accepted: 9 June 2020
/
Published: 17 June 2020
(This article belongs to the Section C: Energy Economics and Policy)
Abstract
:Previous studies argue that the relationships between clean/green and dirty energy assets are time-varying, but there is a lack of evidence on the hedging ability of clean energy stocks and green bonds for dirty assets, such as crude oil and an energy stock index exchange traded fund (ETF), and the portfolio implications. Furthermore, potential drivers of the dynamics of the hedge portfolio returns are still unknown. To address these research gaps, the authors provide an extensive analysis of the hedging ability of clean/green assets against two dirty energy assets (crude oil prices and energy ETF) using daily data from 3 January 2012 to 29 November 2019. Using corrected dynamic conditional correlation models, the authors model correlation and then compute hedge ratios and hedging effectiveness, which all seem to vary with time. The results from hedging effectiveness indicate that investors should follow a dynamic hedging strategy and that clean energy stocks are more effective hedge than green bonds, especially for crude oil. The application of regression analyses shows that the implied volatilities of US equities and crude oil as well as US dollar index have a negative impact on the hedge portfolio returns, whereas gold prices and inflation have a positive impact.
Keywords:
clean energy stocks; green bonds; crude oil; energy ETF; dirty energy assets; hedge; determinants1. Introduction
The centrality of fossil fuels, such as crude oil, in both the global energy system and economic development of modern societies cannot be overestimated. However, crude oil represents a dirty source of energy; its burning emits various air pollutants and greenhouse gases that generally strengthen global warming. Motivated by such environmental concerns and the adoption of government policies to move toward clean energy, investments in renewable energy have flourished over the last decade [1,2]. Accordingly, large capital investment has shifted from the (dirty) fossil energy sector to clean energy-based enterprises, leading to the emergence of the shares of listed clean energy companies as an appealing investment destination for environmentally responsible investors. More recently, there has been a “green bond boom” in the bond market through the emergence of green bond finance in compliance with the climate and sustainability investment initiatives of the Paris Agreement [3,4].
The relationships between clean (green) and dirty energy assets affect portfolio choices, and hence, understanding the hedging effectiveness and the drivers of the hedge portfolio returns has portfolio implications for investors and portfolio managers. Further, knowledge about the time-varying relationships between clean (green) and dirty assets affects not only investment and risk management choices, but also financial and environmental sustainability. Actually, such knowledge affects the welfare of clean and green investments, given evidence on the utility of these renewable energy investments in mitigating the downside risk of their competent and counterpart dirty energy assets would make investments in green and clean energy assets more appealing to investors, which indirectly has positive implications regarding social and economic development.
Many studies consider the relationships between clean energy stocks and (energy) commodities [5,6,7,8,9,10,11,12,13] and some studies examine the diversification benefits arising from combining crude oil and clean energy stocks in the same portfolio during stress periods [14]. Reboredo [11] shows that green bonds are weakly related with conventional equities and energy commodities, suggesting some diversification benefits. However, no empirical evidence exists on the hedging abilities of green bonds (some studies consider green bonds, corporate performance, and corporate social responsibility or the efficiency of clean energy stock indices and clean energy stocks against the risk of dirty energy investments and the portfolio implications in term of hedge ratios, hedging effectiveness, and, importantly, on the drivers of the hedge portfolio returns.
In this paper, the authors contribute to the existing literature by: (1) examining the ability of two clean energy investments (clean energy stocks and green bonds) to hedge the risk of two dirty energy investments (crude oil prices and an energy stock index ETF (exchange traded fund)) and by (2) determining the drivers of the hedge portfolio returns. Our current paper differs from the related literature in various aspects. Firstly, to the best of our knowledge, this is the first empirical study that considers the hedging abilities of both clean energy stocks and green bonds for dirty energy investments, which adds to previous studies focusing on the interaction between oil prices and clean energy stocks only [5,8,13,15,16] and to previous studies examining the ability of only green bonds to diversify the risk of conventional equities and energy commodities [11]. Secondly, unlike previous studies [5,13,15], the current paper relies on the corrected dynamic conditional correlation-Generalized Autoregressive Conditional Heteroskedasticity (DCC-GARCH) model [17] that adjust the asymptotic bias in the estimator of the covariance matrix within the correlation evolution process of Engle’s dynamic conditional correlation (DCC) process [18]. While the academic literature has so far doesn’t present robust models to explain the relationship between green bonds and clean energy stock indices from one side and dirty energy investments from another side, it applies various empirical methodologies such as multivariate GARCH models, including the DCC-GARCH process [5,13], cointegration tests [6], and connectedness measures [15]. Thirdly, the current study conducts practical portfolio analyses through examining hedge ratios and hedging effectiveness [19] in a time-varying setting, which is very appreciated by academics and investors. Fourthly, the current study determines the drivers of the hedge portfolio returns [20], which has not so far been examined in the literature dealing with the hedging abilities of clean energy stocks or green bonds. By studying the effect of some economic and financial variables, the authors extend the limited understanding of the factors affecting uncertainty in the relationship between clean (green) and dirty energy assets [8,11,13,15,16]. Such a rich application nicely complements previous studies that generally rely on vector auto-regression (VAR)-based models and ignore the hedging analysis in a time-varying setting as well as the drivers of the returns of the hedge portfolio.
The rest of the paper continues as follows: Section 2 reviews the related literature. Section 3 offers the econometric models. Section 4 describes the dataset. Section 5 presents the empirical findings involving conditional volatility and correlation, dynamic portfolio management such as time-varying optimal portfolio weights, dynamic hedge ratio, and hedging effectiveness. Section 6 concludes.
2. Related Studies
There is a large literature on the relationships between dirty energy prices, especially crude oil prices, and stock market indices (see, among others [21,22,23]), with some evidence on the ability of crude oil prices to hedge the downside risk of stock market indices [20,24,25,26]. However, less evidence exists on the hedging abilities of green bonds and clean energy stocks against dirty energy investments and the portfolio implications in term of hedge ratios, hedging effectiveness, and the drivers of the hedge portfolio returns.
Previous studies examine the relationship between crude oil prices and clean energy stocks. Henriques and Sadorsky [27] use VAR models to show that crude oil prices drive the returns of clean energy stock indices. Sadorsky [13] applies various multivariate GARCH models to indicate that crude oil prices and clean energy stock prices are weakly interrelated but can offer diversification benefits even though their correlation increases after the global financial crisis (GFC). Kumar et al. [28] argue that higher fuel prices lead to an increase in the prices of clean energy stocks. Using conditional correlation-based models, Broadstock et al. [29] find that the impact of global oil prices on energy related stocks strengthens following the GFC. Quite similar results are shown by Managi and Okimoto [30] who indicate that crude oil prices and clean energy stock indices move in tandem, especially after the GFC. Using a cointegration approach, Bondia et al. [6] indicate the presence of a long-term relationship between crude oil prices and clean energy stock indices. Dutta [31] argues that the implied volatility of oil prices has the ability to drive the realized volatility of clean energy stock indices. Using wavelet methods, Reboredo et al. [12] report evidence of a weak dependence between global oil prices and clean energy stock prices in the short-term, whereas a strong dependence is shown in the long-term, especially after the GFC, which corroborates with Broadstock et al. [29] and Sadorsky [13]. Using connectedness measures, Ahmad [15] reports evidence that clean energy stocks transmit their return and volatility effects on the crude oil market. Further evidence suggests that combining clean energy stocks with crude oil provides a profitable hedging prospect. Ahmad et al. [5] apply multivariate GARCH models to examine how indices from the crude oil, gold, and US bonds markets are related to clean energy stocks. Unlike Ahmad 15], they also examine hedging effectiveness and show that the US implied volatility index as well as crude oil prices are effective hedges for clean energy stocks. Further evidence suggests that combining clean energy stocks with crude oil provides a profitable hedging prospect. Using time and frequency connectedness measures, Ferrer et al. [8] find evidence of short-run return and volatility spillovers among crude oil prices, US clean energy stock indices, and key financial variables. However, they show that clean energy stock returns in the short and long runs are not determined by crude oil returns, suggesting a decoupling of the clean energy stock sector from the crude oil market and thereby potential diversification benefits from combining clean and crude oil investments. Using a detrended cross-correlation analysis approach, Paiva et al. [16] find strong correlations between oil prices and renewable energies for large time intervals during the period 2008–2012. However, very weak correlations are observed before and after that period. Reboredo [11] reports evidence that green bonds are weakly related with equities and energy commodities, suggesting diversification benefits. Furthermore, the author finds that green bonds are slightly affected by return spillovers from equity and energy markets. Maghyereh et al. [32] use a wavelet-based approach and show that clean energy stocks can act as a diversifier against crude oil prices, especially in the short-run. Xia et al. [2] indicate a strong and time-varying interdependence in the network system of fossil energy and clean energy, which seems to be stronger in the network of positive returns than in the network of negative returns. Using a structural VAR model and a monthly dataset, Kyritsis and Serletis [1] find that oil price shocks and clean energy stock returns exhibit a symmetric relationship. In an interesting study, Kocaarslan and Soytas [9] examine the dynamic conditional correlations between crude oil prices and renewable energy stocks and report evidence of time-varying and asymmetric correlations. Furthermore, they apply an autoregressive distributed lag model to reveal the role of the US dollar in driving the dynamics of correlations.
3. Methodology
The pairwise conditional correlation between the clean energy stock index (green bond index) and each of the two dirty energy assets is measured via the application of the corrected DCC-GARCH model [18]. Then, dynamic portfolio implications are studied via examining time-varying hedge ratios [33] and hedging effectiveness [20,34]. Finally, the authors uncover the drivers of the hedge portfolio returns [20].
3.1. The Dynamic conditional correlation-Generalized Autoregressive Conditional Heteroskedasticity (DCC-GARCH)
In this section, the authors present the corrected DCC-GARCH model [18], through which the conditional variances and covariances are estimated and then used to compute the time-varying portfolio weights and hedge ratios between clean and dirty assets. The corrected DCC-GARCH has dual advantages. The first concerns the flexibility of a DCC-GARCH process through its ability to capture time-varying conditional correlations with fewer computational complications than other multivariate GARCH models (e.g., Cho and Parhizgari [35]). The second relates to the ability of the corrected DCC-GARCH model to correct the asymptotic bias in the estimator of the covariance matrix within the correlation evolution process of Engle’s DCC process.
The corrected DCC process of Aielli [18] is based on the DCC process of Engle [17]. From a bivariate perspective, the DCC process is given by:
where, refers to the matrix of conditional volatilities which is further decomposed as:
where rt is a 2 × 1 vector, including the return of the clean energy stocks (green bond) and that of the crude oil (energy ETF), and μt is the conditional mean vector of rt. The autoregressive term μt−1 accounts for potential serial correlation, indicates the noise term, and is a vector of innovations that follow a Student-t distribution. and are the conditional variances of the clean energy stocks (green bond) and the crude oil (energy ETF), respectively. is the diagonal matrix for the conditional standard deviations in which its elements are defined via a univariate process such as the standard GARCH (1,1) of Bollerslev [36] or the asymmetric GARCH (1,1) of Glosten et al. [37].
To ensure the positivity of , a proxy process is proposed as follows:
where denotes the unconditional variance of innovations . To ensure stationarity and positive definiteness of , is imposed.
However, Aielli [18] argues that the DCC process of Engle [17] incorporates an asymptotic bias in the estimator of the covariance matrix, proposing the corrected DCC process that adjusts the correlation evolution process as follows:
Notably, the dynamic conditional correlation for a pair of markets i and j at time t is given as:
3.2. Dynamic Portfolio Analysis
Given our focus on a dynamic portfolio analysis, the conditional variance and covariance estimates extracted from the above corrected DCC-GARCH model are used to compute dynamic hedge ratios and hedging effectiveness.
3.2.1. Hedge Ratios
Following Kroner and Sultan [33] the hedge ratio between asset i and j at time t is computed as:
where denotes the time-varying conditional covariance between the clean/green energy asset and the dirty asset (crude oil or energy ETF) at time t, is the time-varying conditional variance of the clean/green energy asset at time t. Both covariances and variances are obtained from the time-varying variance-covariance matrix that is extracted from the corrected DCC-GARCH process.
The hedge ratio helps determining the USD short position in asset j (clean energy stocks or green bonds) that should be taken to offset the risk of a 1 USD long position in the dirty energy asset i (crude oil or energy ETF).
3.2.2. Hedging Effectiveness
The time-varying effectiveness of the hedging is assessed using the measure of Dale [34] and Batten et al. [20] as follows:
where reflects the percentage reduction in variance achieved by the hedge position. A higher indicates a higher risk reduction. Accordingly, is equal to 1 in a perfect hedge scenario, whereas it is equal to 0 when there is no risk reduction.
3.3. Drivers of the Hedge Portfolio Returns
Following Batten et al. [20] the drivers of the hedge portfolio returns are studied as described below. First, the authors model the hedge portfolio return () as:
where denotes the return of the dirty energy asset (crude oil or energy ETF) at time t, and denotes the return of the clean energy stock (green bond) index at time t. is the time-varying optimal hedge ratio, as given in Equation (8).
Compared to the HE that captures the part of the variance eliminated by the hedge, the hedge portfolio return quantifies the difference between each of the dirty assets’ return and the clean energy stock (green bond) return times the hedge ratio. Accordingly, a positive value signifies that the hedged portfolio provides profits for the investor and vice versa.
Then, the hedge portfolio return () is regressed on a set of independent variables as:
where is a constant term, is an autoregressive term accounting for possible autocorrelation, ψ is a (8 × 1) vector representing eight explanatory variables, and is the residual term.
The eight explanatory variables include: (1) (DVIX) changes in the Chicago Board Options Exchange (CBOE) US equity market volatility index (VIX), (2) (DTYVIX) changes in the 10-year US Treasury Note Volatility Index (TYVIX), (3) (DOVX) changes in the CBOE Crude Oil ETF Volatility Index (OVX), (4) (DEPU) changes in the US Economic Policy Uncertainty (EPU), (5) (DDXY) changes in the US dollar index (DXY), (6) (D10Y-2Y) changes in the US term structure, (7) (DInflation) changes in US inflation expectations, and (8) (Rgold) log returns of gold spot prices. All related data are extracted from DataStream, except for the data of the US EPU that is downloaded from https://www.policyuncertainty.com.
- (1)
- The VIX reflects the market’s expectation of 30-day volatility of the S&P 500 index. Given the stock nature of clean energy stocks, increases in the level of VIX have larger impacts on the energy stock index than on the price of crude oil, which makes the hedge portfolio return to decrease. Thus, a negative sign is expected for the DVIX.
- (2)
- For the case of green bonds, the authors use the TYVIX, which measures the 30-day expected volatility of 10-year Treasury Note futures prices. The dynamics of the implied volatility of this interest rate-based indicator is important for the fixed income market. Specifically, the TYVIX increases when 10-year Treasury note and futures prices exhibit large (down)swings, which makes the TYVIX to exert larger impact on green bonds than dirty energy assets. Therefore, the authors expect a negative sign for the DTYVIX.
- (3)
- The OVX measures the market’s expectation of 30-day volatility of crude oil prices. Increases in the level of the OVX have a larger effect on oil prices (a s well as other dirty assets) than clean energy stocks (green bonds), which lead to a decrease in the level of the hedge portfolio return. Furthermore, there is empirical evidence on the negative association between the OVX and crude oil prices [38]. Thus, a negative sign is expected for the DOVX.
- (4)
- (5)
- The DXY measures the value of the US dollar relative to a basket of six major currencies (euro, Swiss Franc, Japanese Yen, Canadian dollar, British pound, and Swedish Krona). Increases (decreases) in the value of the US dollar makes stronger (weaker) the integration of the oil-stock portfolio relationship, which in turn leads to a decrease in the returns of the hedge portfolio. Furthermore, US dollar depreciations are inversely related to crude oil prices [42], and possibly but to a lesser extent to energy ETF given the energy intensive nature of this ETF. Therefore, a negative sign is expected for the DDXY.
- (6)
- The US term structure is measured by the spread between the 10-year and 2-year Treasury bond yields (D10Y-2Y). An increase in the level of this prospective growth indicator is beneficial for crude oil and stock returns, and vice versa. Therefore, a positive is expected for the Δ10Y-2Y, which might depend on which of crude oil or clean energy stock returns would increase more.
- (7)
- Inflation expectation is measured by the spread between 10-year Treasuries and 10-year Treasury Inflation-Protected Security (TIPS) yields. The authors opt for this measure because of the lack of daily data on the US Consumer Price Index. Generally, there is a positive association between the level of inflation and crude oil prices [43], which can translate into an increase in the returns of the hedge portfolio. The positive effect can be magnified by the interactions between the level of inflation and equity prices. In fact, increases in the level of inflation can lead to an increase to key interest rates by the Federal Open Market Committee (FOMC), which in turn might bring down (lift) equity prices (bond yields). Therefore, a positive sign is expected for the DInflation.
- (8)
- Gold is widely regarded as a safe haven asset in financial markets [24,44]. Specifically, both gold and crude oil prices are inversely related with clean energy stock indices [14]. This suggests a negative association between gold (crude oil) prices and clean energy stock indices and potentially a positive association or cointegration between gold and crude oil markets (among other authors, Narayan et al. [45] find evidence of cointegration between the gold and oil markets). It follows that increases in gold prices are positively associated with the hedge portfolio returns. Thus, a positive sign is expected for the RGold. This is relevant not only to the case when clean energy stocks are the safe haven asset but also to the other case (i.e., when green bonds are the hedge asset), because both gold and green (bonds) are often seen as hedges during crisis periods (see, among others Reboredo [11]).
4. Data and Stylized Facts
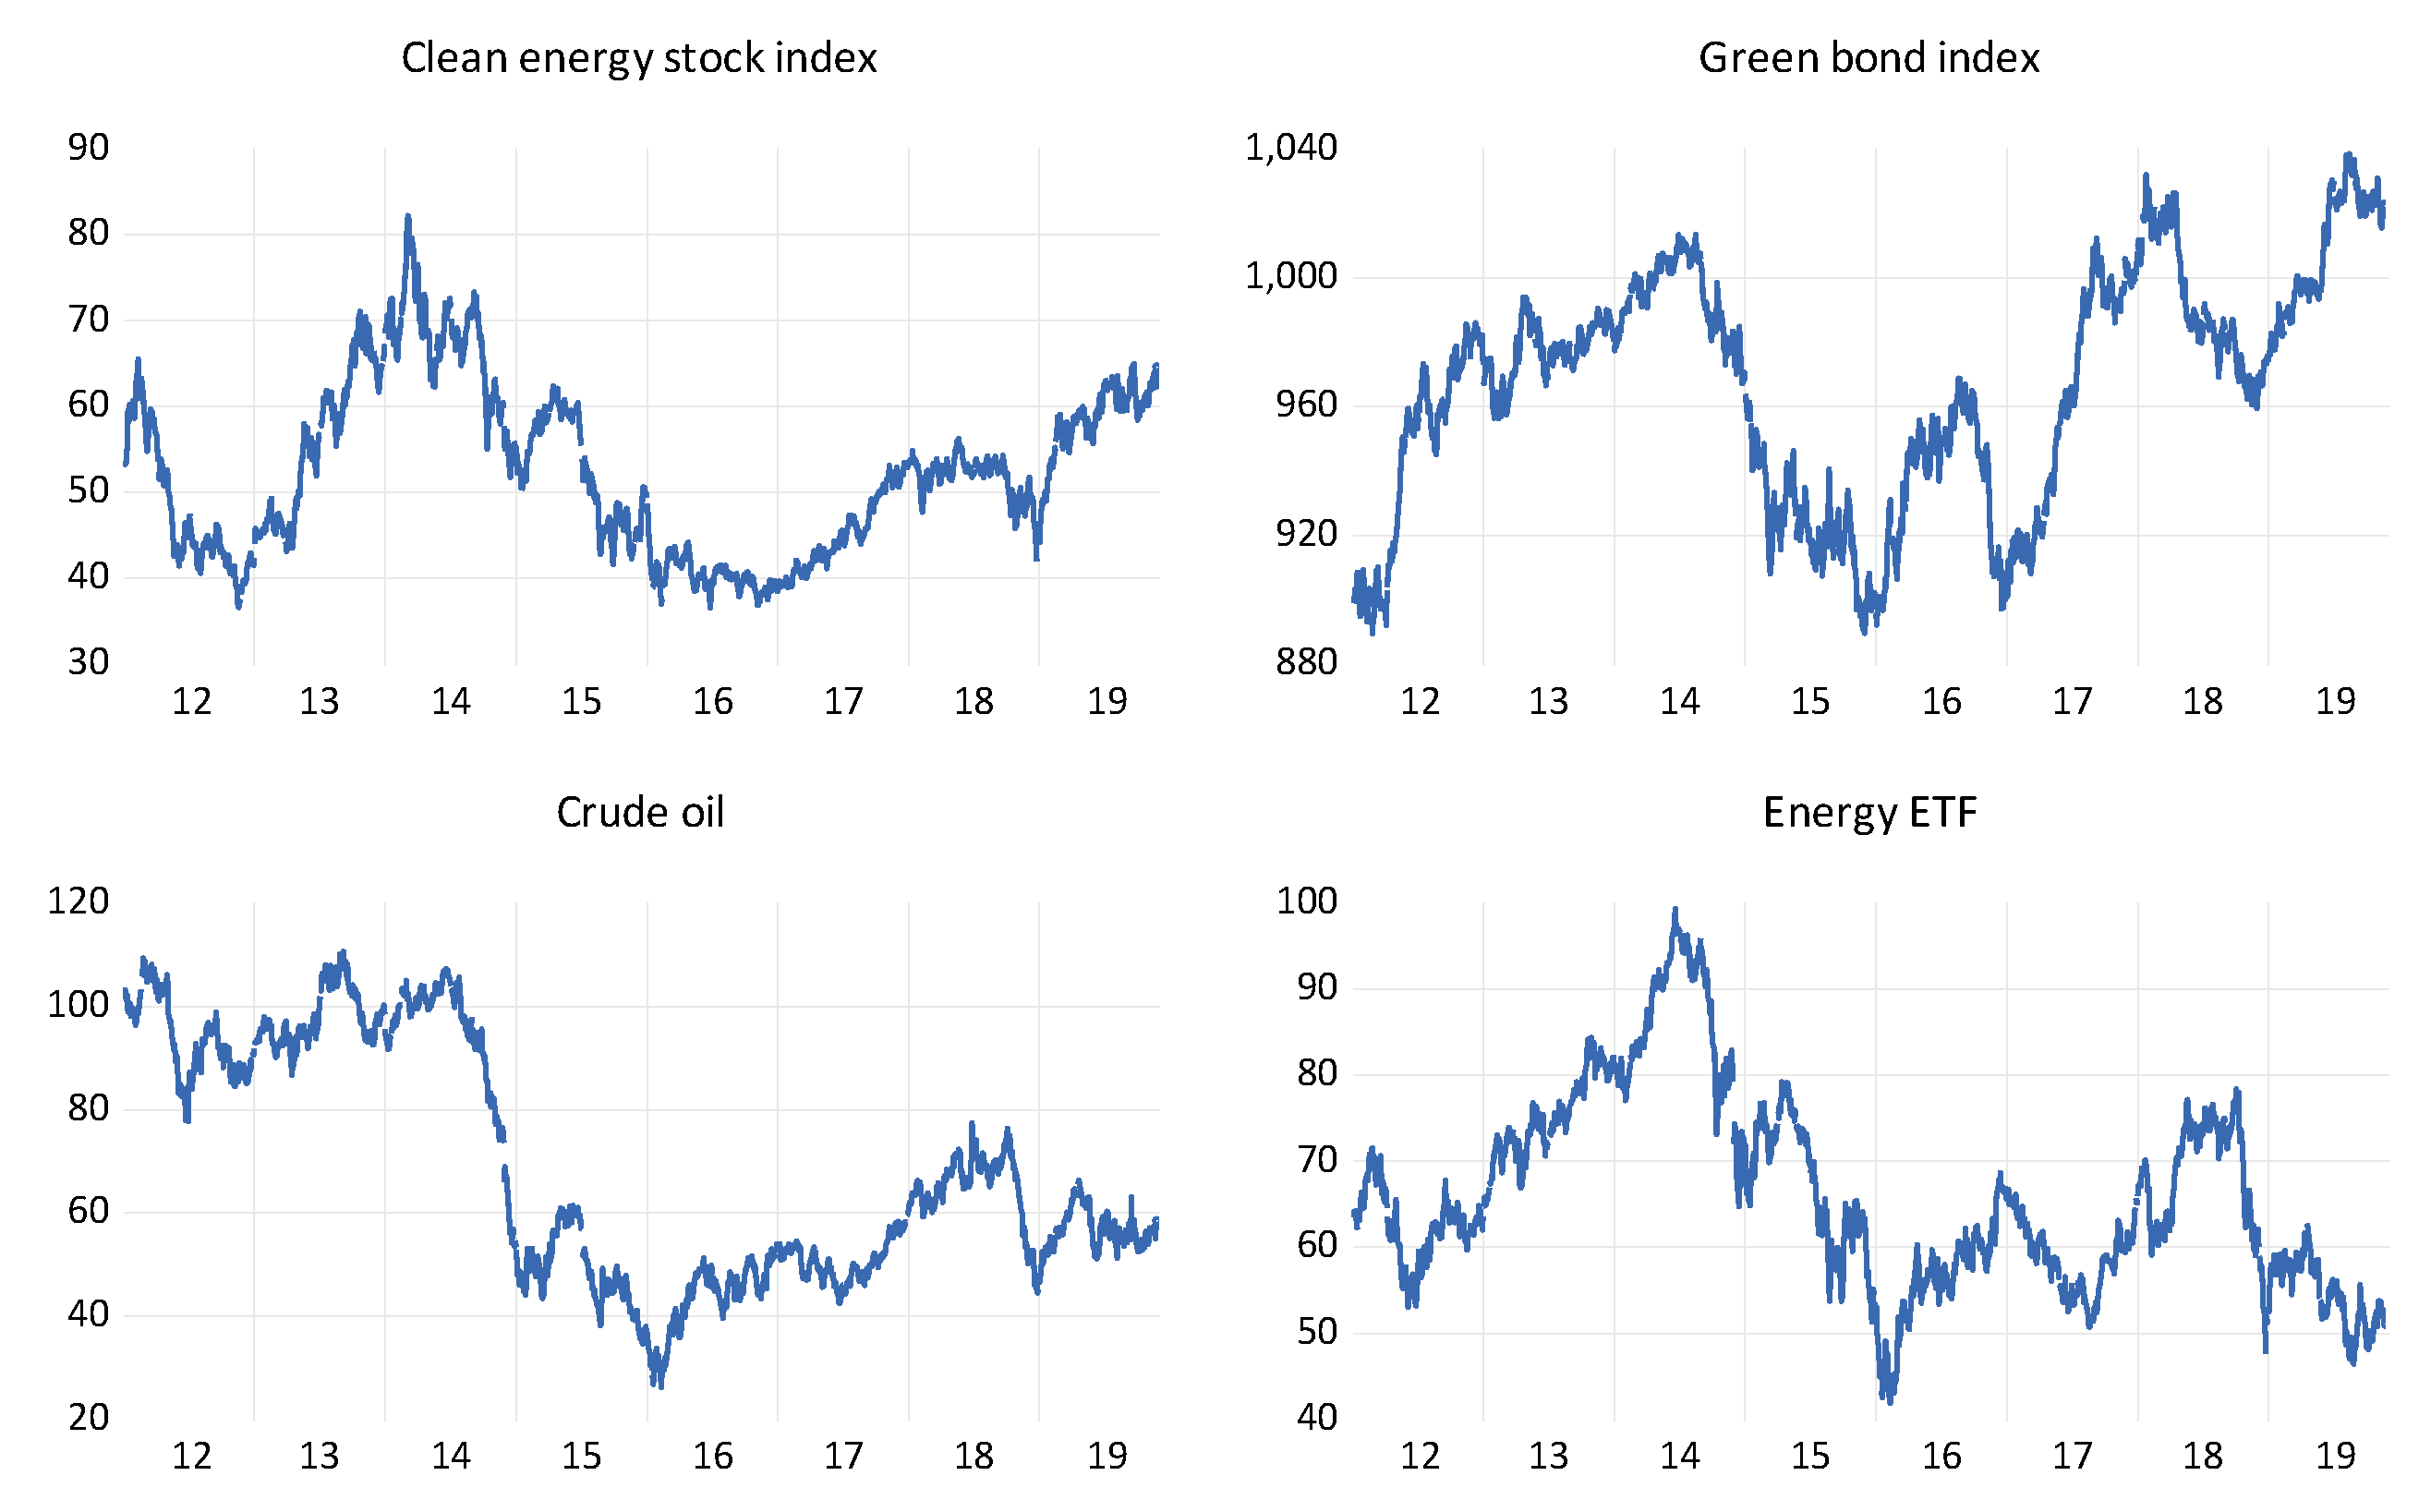
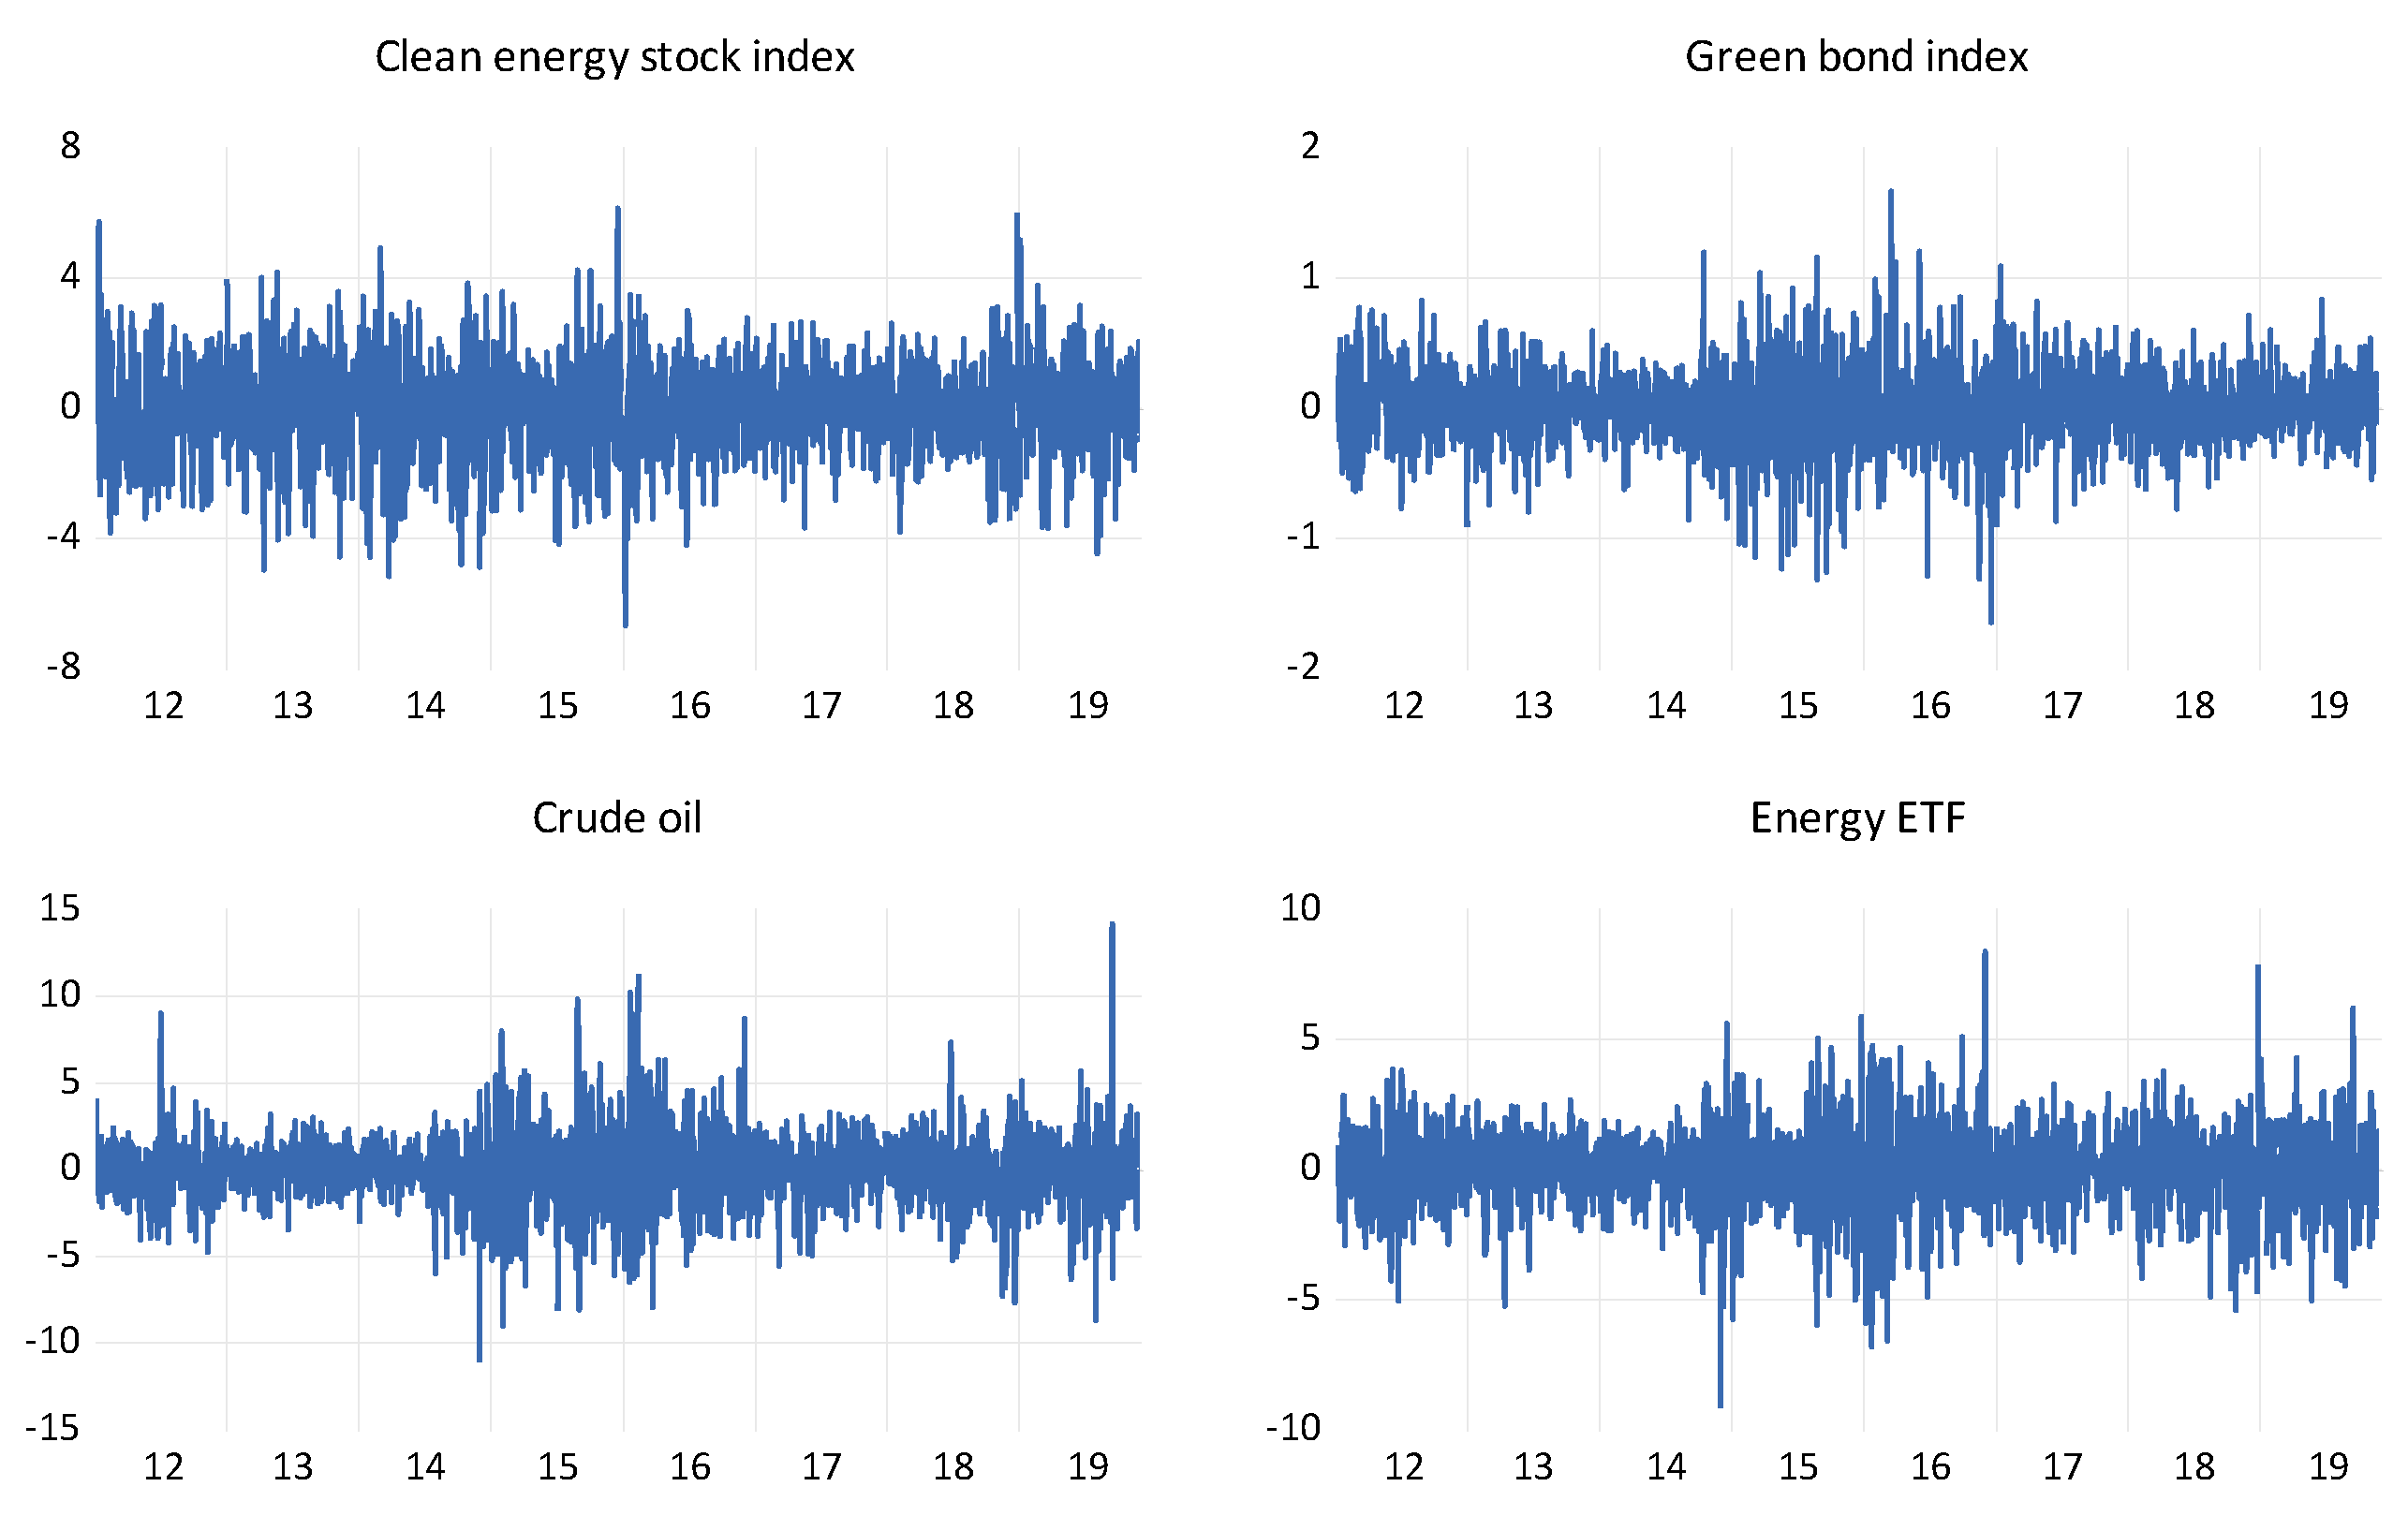
Daily data are extracted from DataStream. They include the WilderHill Clean Energy (ECO) and the Solactive Green Bond Index to represent clean/green energy assets. While other green bond indices are available (e.g., the Barclays MSCI Green Bond Index, the S&P Dow Jones Green Bond Index, and the Bank of America Merrill Lynch Green Bond Index), Reboredo and Ugolini [12] indicate the existence of a near-one correlation coefficient among various green bond indices. The WilderHill Clean Energy index is a pioneering benchmark for defining and tracking the stock performance of US clean energy companies [8,14,32]. It comprises companies operating in activities related to the use of cleaner and renewable sources of energy, such as solar power, wind power, hydrogen, and biofuels, as well as related technologies that facilitate cleaner and renewable energy. The Solactive Green Bond Index is designed to reflect the performance of the green bond market [11]. It applies stringent standards to include only bonds whose proceeds are utilized to finance ecological investment projects related to alternative energy, energy efficiency, pollution prevention and control, sustainable water, climate adaptation, green building, etc. For dirty energy assets, the authors use the spot prices of WT crude oil and the iShares U.S. Oil & Gas Exploration & Production ETF (IEO). The latter tracks the performance of US companies’ equities in the oil and gas exploration and production sector. All indices are in USD, covering the period 3 January 2012 and 29 November 2019 due to the data availability of the Solactive Green Bond Index. The Appendix A plots of the levels of the clean/green and dirty energy indices (Figure A1) as well the returns for the same indices (Figure A2).
Given the empirical analysis requires stationary variables, the authors use daily returns computed as the first difference of log prices over two consecutive days. Summary statistics, stationarity tests, and the correlation matrix of daily returns are provided in Table 1. Panel A shows that the average return is near zero. The lowest standard deviation is for green bond index, whereas the highest is for crude oil (these results indicate that clean energy stocks and green bonds are less risky (i.e., they have a lower standard deviation of returns) than the two dirty energy assets under study, which further motivates our decision to use them as hedging assets.). All return series are leptokurtic. The skewness value is negative, except for crude oil. The Jarque-Bera’s statistic points to non-normality of the return distribution. Augmented Dickey Fuller (ADF) and Phillips-Perron (PP) test statistic indicates that all return series are stationary. Results from the ARCH test show evidence of heteroskedasticity up to 10 lags. Panel B shows that the green bond index has lower correlations with dirty energy assets than the clean energy stock index. A negative correlation is reported between the green bond index and the energy ETF. Furthermore, the correlation between the clean stock index and the green bond index is negative, suggesting that the information sources influencing these two indices are rather different, which further motivates our decision to examine the potential dissimilarity in their hedging role for dirty energy assets.
5. Empirics
5.1. Results of Corrected Dynamic Conditional Correlations
The pairwise dynamic conditional correlations between the clean energy (green bond) index and crude oil prices and energy ETF are given in Table 2. Given our main focus is to extract the corrected DCC series based on Equation (7) and study their time-varying behavior and hedging implications, the authors do not report the estimated coefficients from the corrected DCC process. However, these results, along with various diagnostic tests that show all estimated corrected DCC models are well specified, are available from the authors upon request.
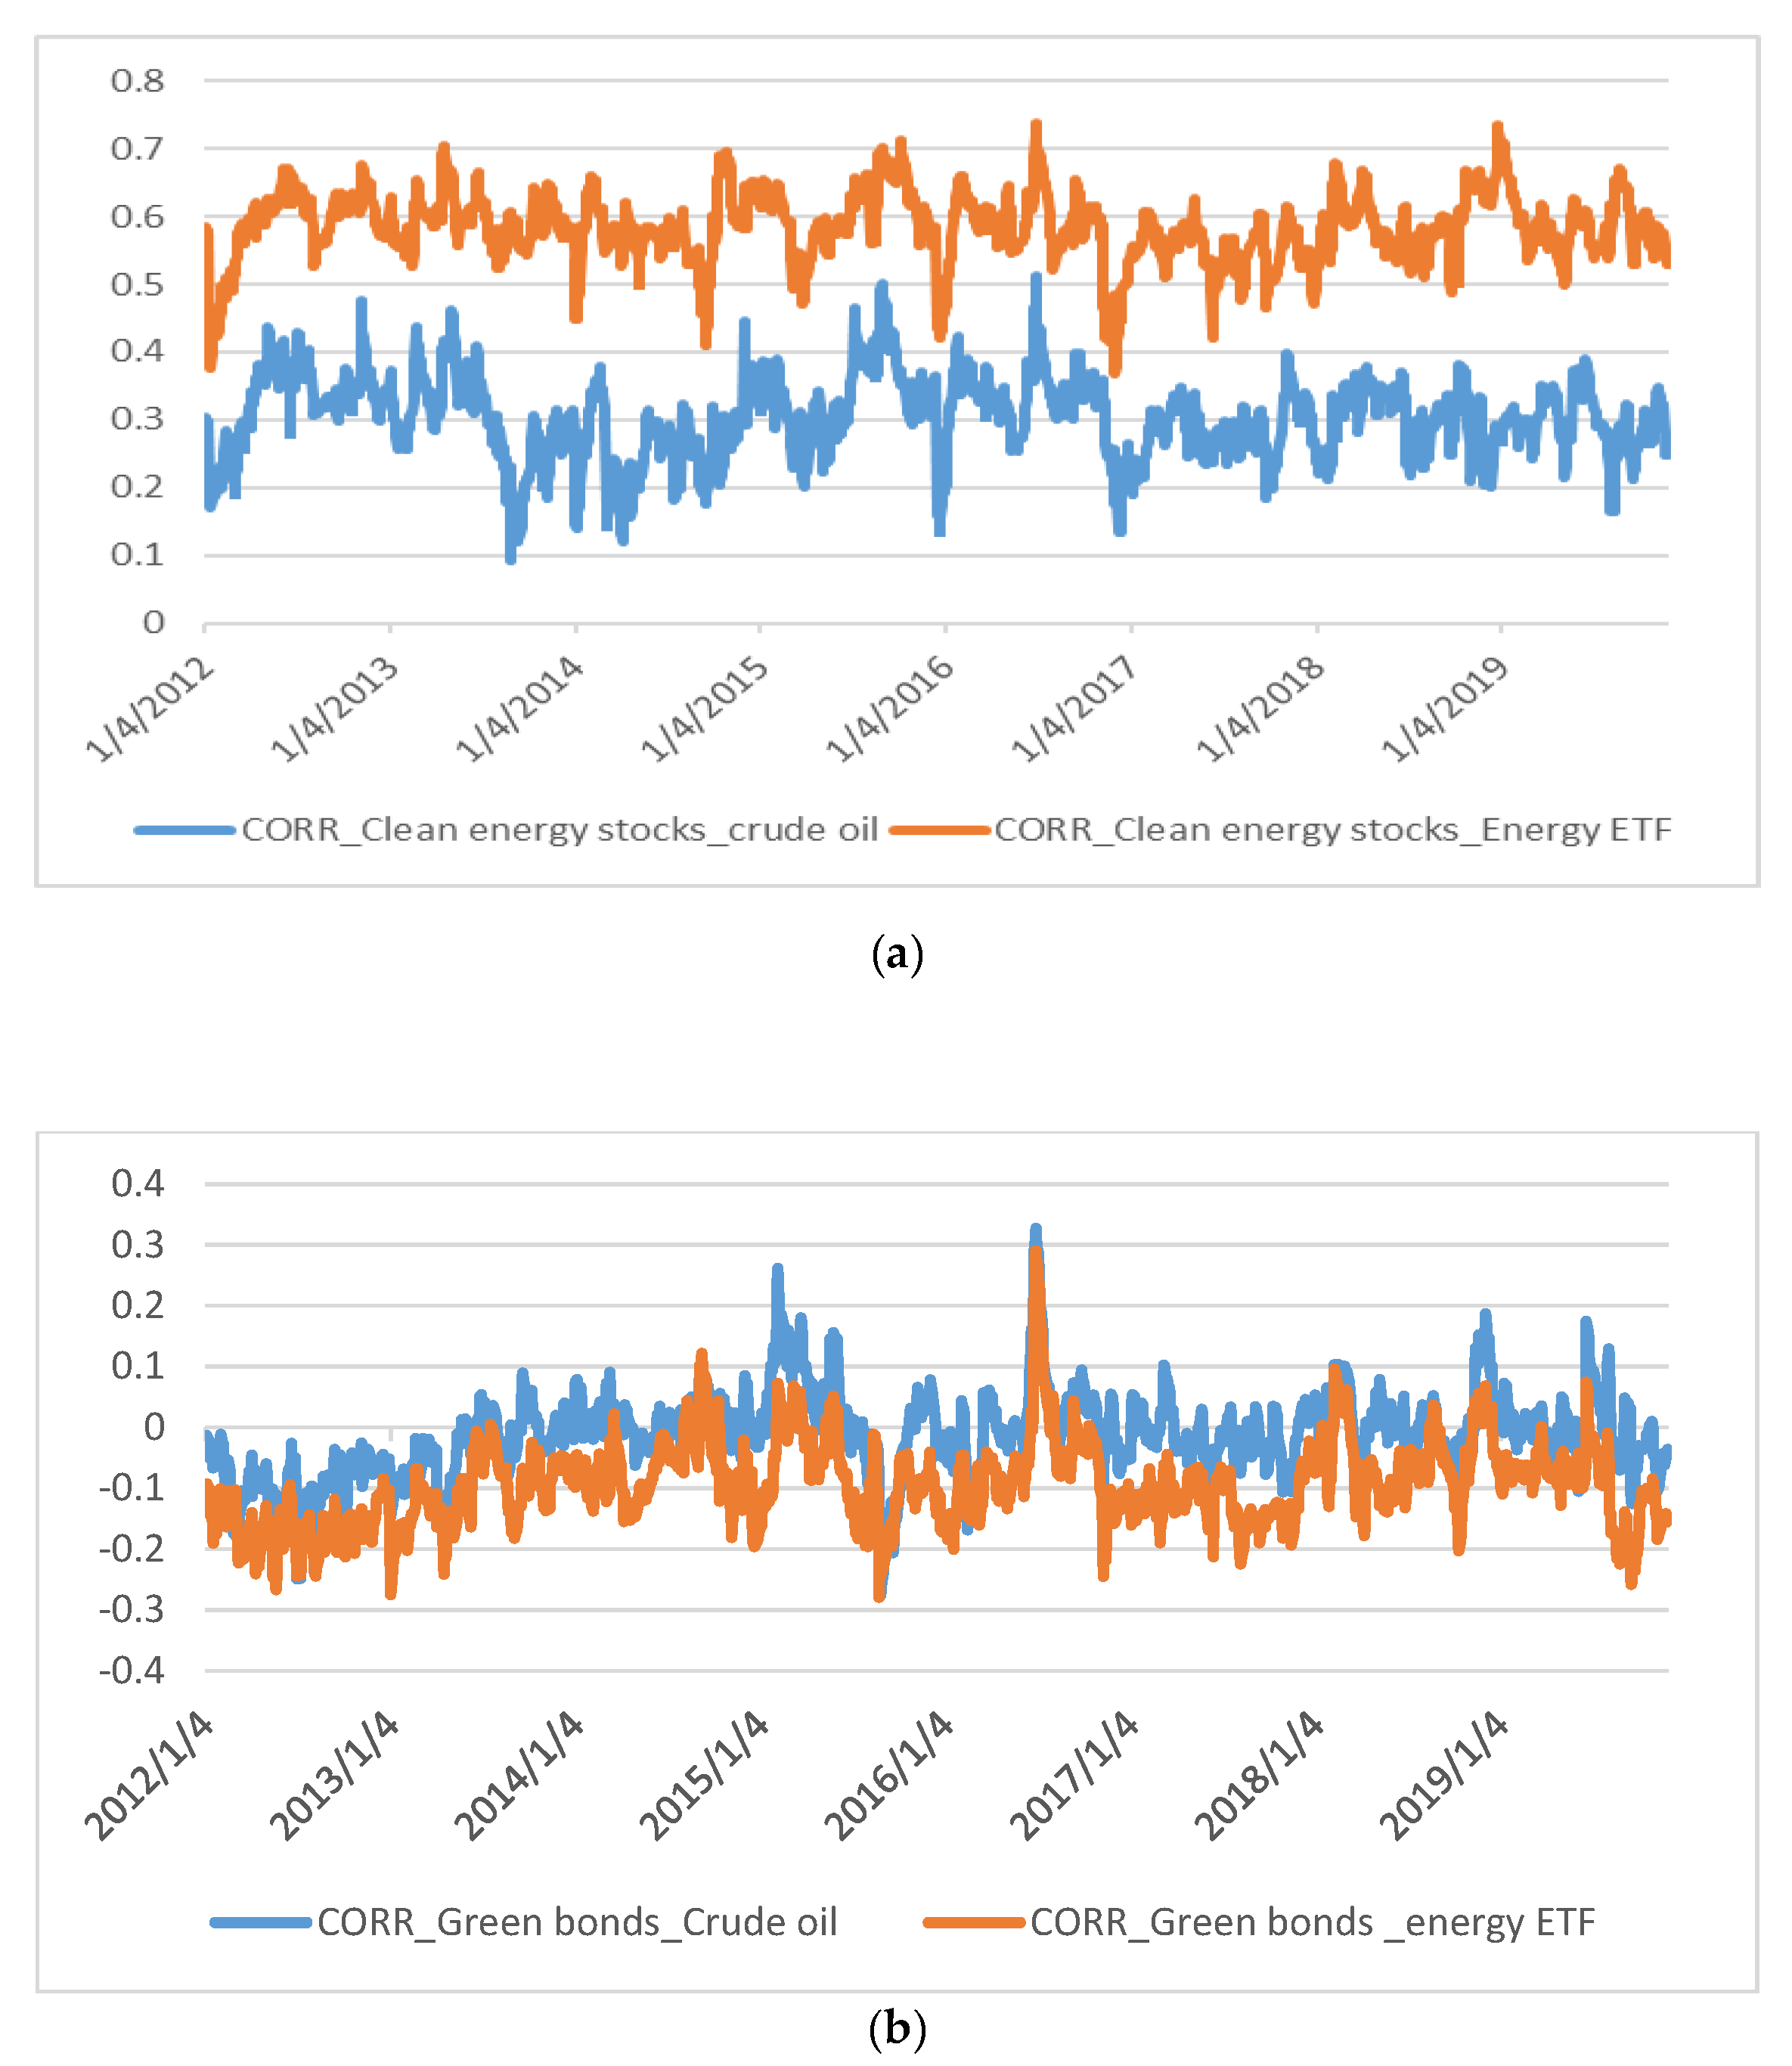
The mean value of the conditional correlation between clean stocks and each of crude oil (0.3030) and energy ETF (0.5837) is positive. However, the average dynamic conditional correlation between the green bond index and each of crude oil prices and energy ETF is negative. Specifically, the strongest negative correlation is between green bonds and energy ETF, suggesting more potential risk reduction when energy ETF is added to a portfolio of green bonds. Furthermore, Table 2 reports the pairwise dynamic correlation during stress periods, defined according to the 5% quantiles of the most negative returns in the clean energy stock (green bond) index. The last column of Table 2 shows that the 5% quantile correlation between each of the two dirty energy assets and the green bond index is much smaller than that involving each of the two dirty energy assets and clean energy stocks. Especially, the 5% quantile correlation between green bonds and energy ETF is negative, suggesting that the green bond index is a hedge for energy ETF during stress periods. However, for the case of clean energy stocks index, the same correlation is positive and relatively higher, suggesting that clean energy stocks represent a less valuable hedge asset than green bonds during stress periods.
While Table 2 provides the statistics of the mean value of the pairwise conditional correlations, Figure 1 shows that the conditional correlations between clean energy stocks and each of the two dirty assets vary over time (for the case of the correlation between clean energy stocks and crude oil, our results are comparable to Sadorsky [13] and Ahmad [15] who show quite stable correlations, especially after 2012). Notably, the highest correlation is for energy ETF while the lowest is for crude oil. Conversely, green bonds exhibit a weaker correlation with the two dirty assets (Figure 2). Notably, energy ETF is mostly negatively correlated with green bonds, suggesting potential hedging benefits. Figure 2 also shows that the correlation is also time-varying for all cases. Accordingly, the risk of crude oil can be more diversified if crude oil is combined with green bonds within the same portfolio than with clean energy stocks.
5.2. Results of Dynamic Optimal Hedge Ratios
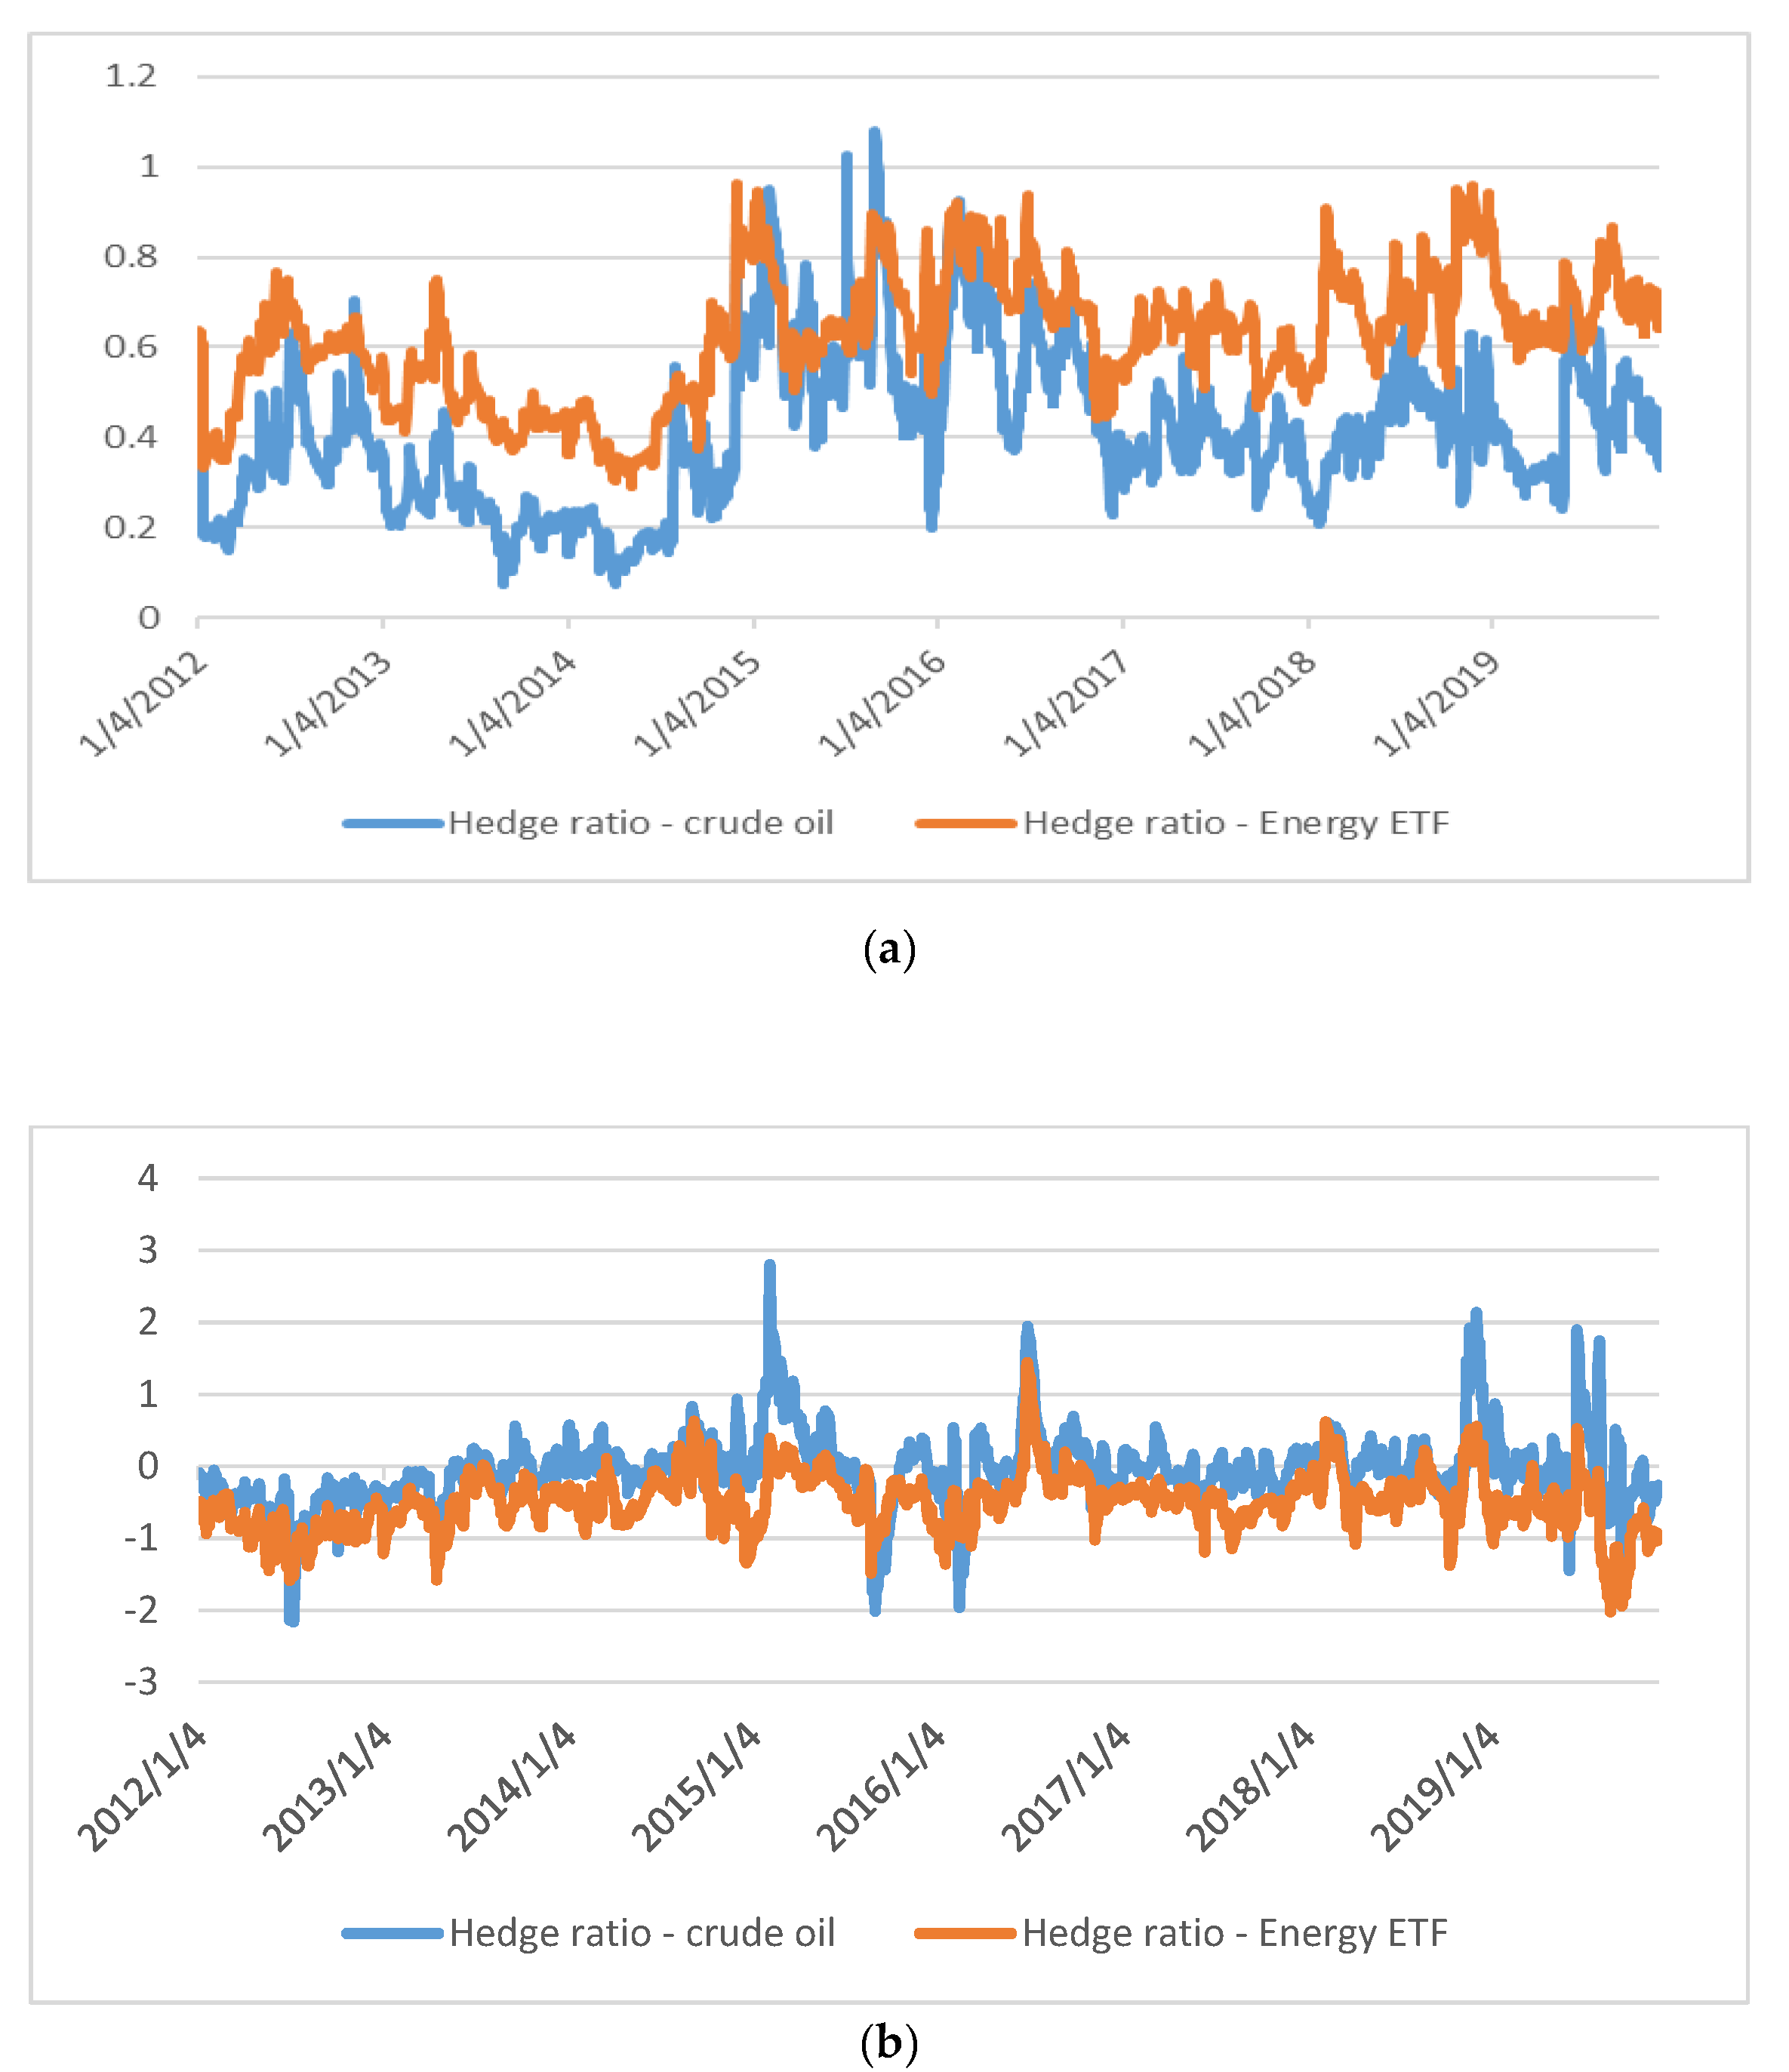
Using the conditional volatility estimates of the corrected DCC models, optimal hedge ratios are computed along the lines of Kroner and Sultan [33]. The risk-minimizing hedge ratio of clean energy stocks against each of crude oil and energy ETF is given in Figure 2a. For both cases, the hedge ratio slightly varies over time. For the two dirty assets, the hedge ratio is mostly positive, which suggests that a short position in clean energy stocks is needed to minimize the risk of a long position in each of crude oil and energy ETF. For the case of the green bond index, the hedge ratio for crude oil switches between positive and negative values, whereas hedge ratio is mostly negative for energy ETF (see Figure 2b). In fact, for the case of green bonds and energy ETF, the hedge ratio is negative, which is the opposite to that found for clean energy stocks and energy ETF. This finding suggests that a long position in green bonds is needed to minimize the risk of a long position in energy ETF.
Table 3 shows that the average value of the hedge ratio between clean energy stocks and crude oil is 0.4103, which is higher than that reported by Sadorsky [13]. This is most probably due to our reliance on corrected DCC models and a much different/updated sample period. However, the average value of the hedge ratio is negative (−0.0617) for green bonds and crude oil. Thus, a $100 long position in crude oil can be hedged for $41 with a short position in clean energy stocks, whereas the same $100 long position in crude oil can be hedged for $6.17 with a long position in green bonds. Similarly, a $100 long position in energy ETF can be hedged for $61.92 with a short position in clean energy stocks, whereas a $100 long position in energy ETF can be hedged for $50.22 with a long position in green bonds. Notably, the hedge ratios involving clean energy stocks exhibit maximum values below unity, which is not the case for the hedge ratios involving green bonds.
Taken together, the results show that green bonds have a strong hedging property, especially for energy ETF and crude oil given that their hedge ratios are more negative than the hedge ratios of clean energy stocks. Remarkably, the higher variability in the dynamics of the hedge ratio for the green bond index, especially for crude oil, suggests that investors should rebalance their green bonds positions more frequently to maintain a risk minimizing position, which generally implies a higher cost of hedging associated with the green bond index and crude oil prices.
5.3. Results of Dynamic Hedge Effectiveness
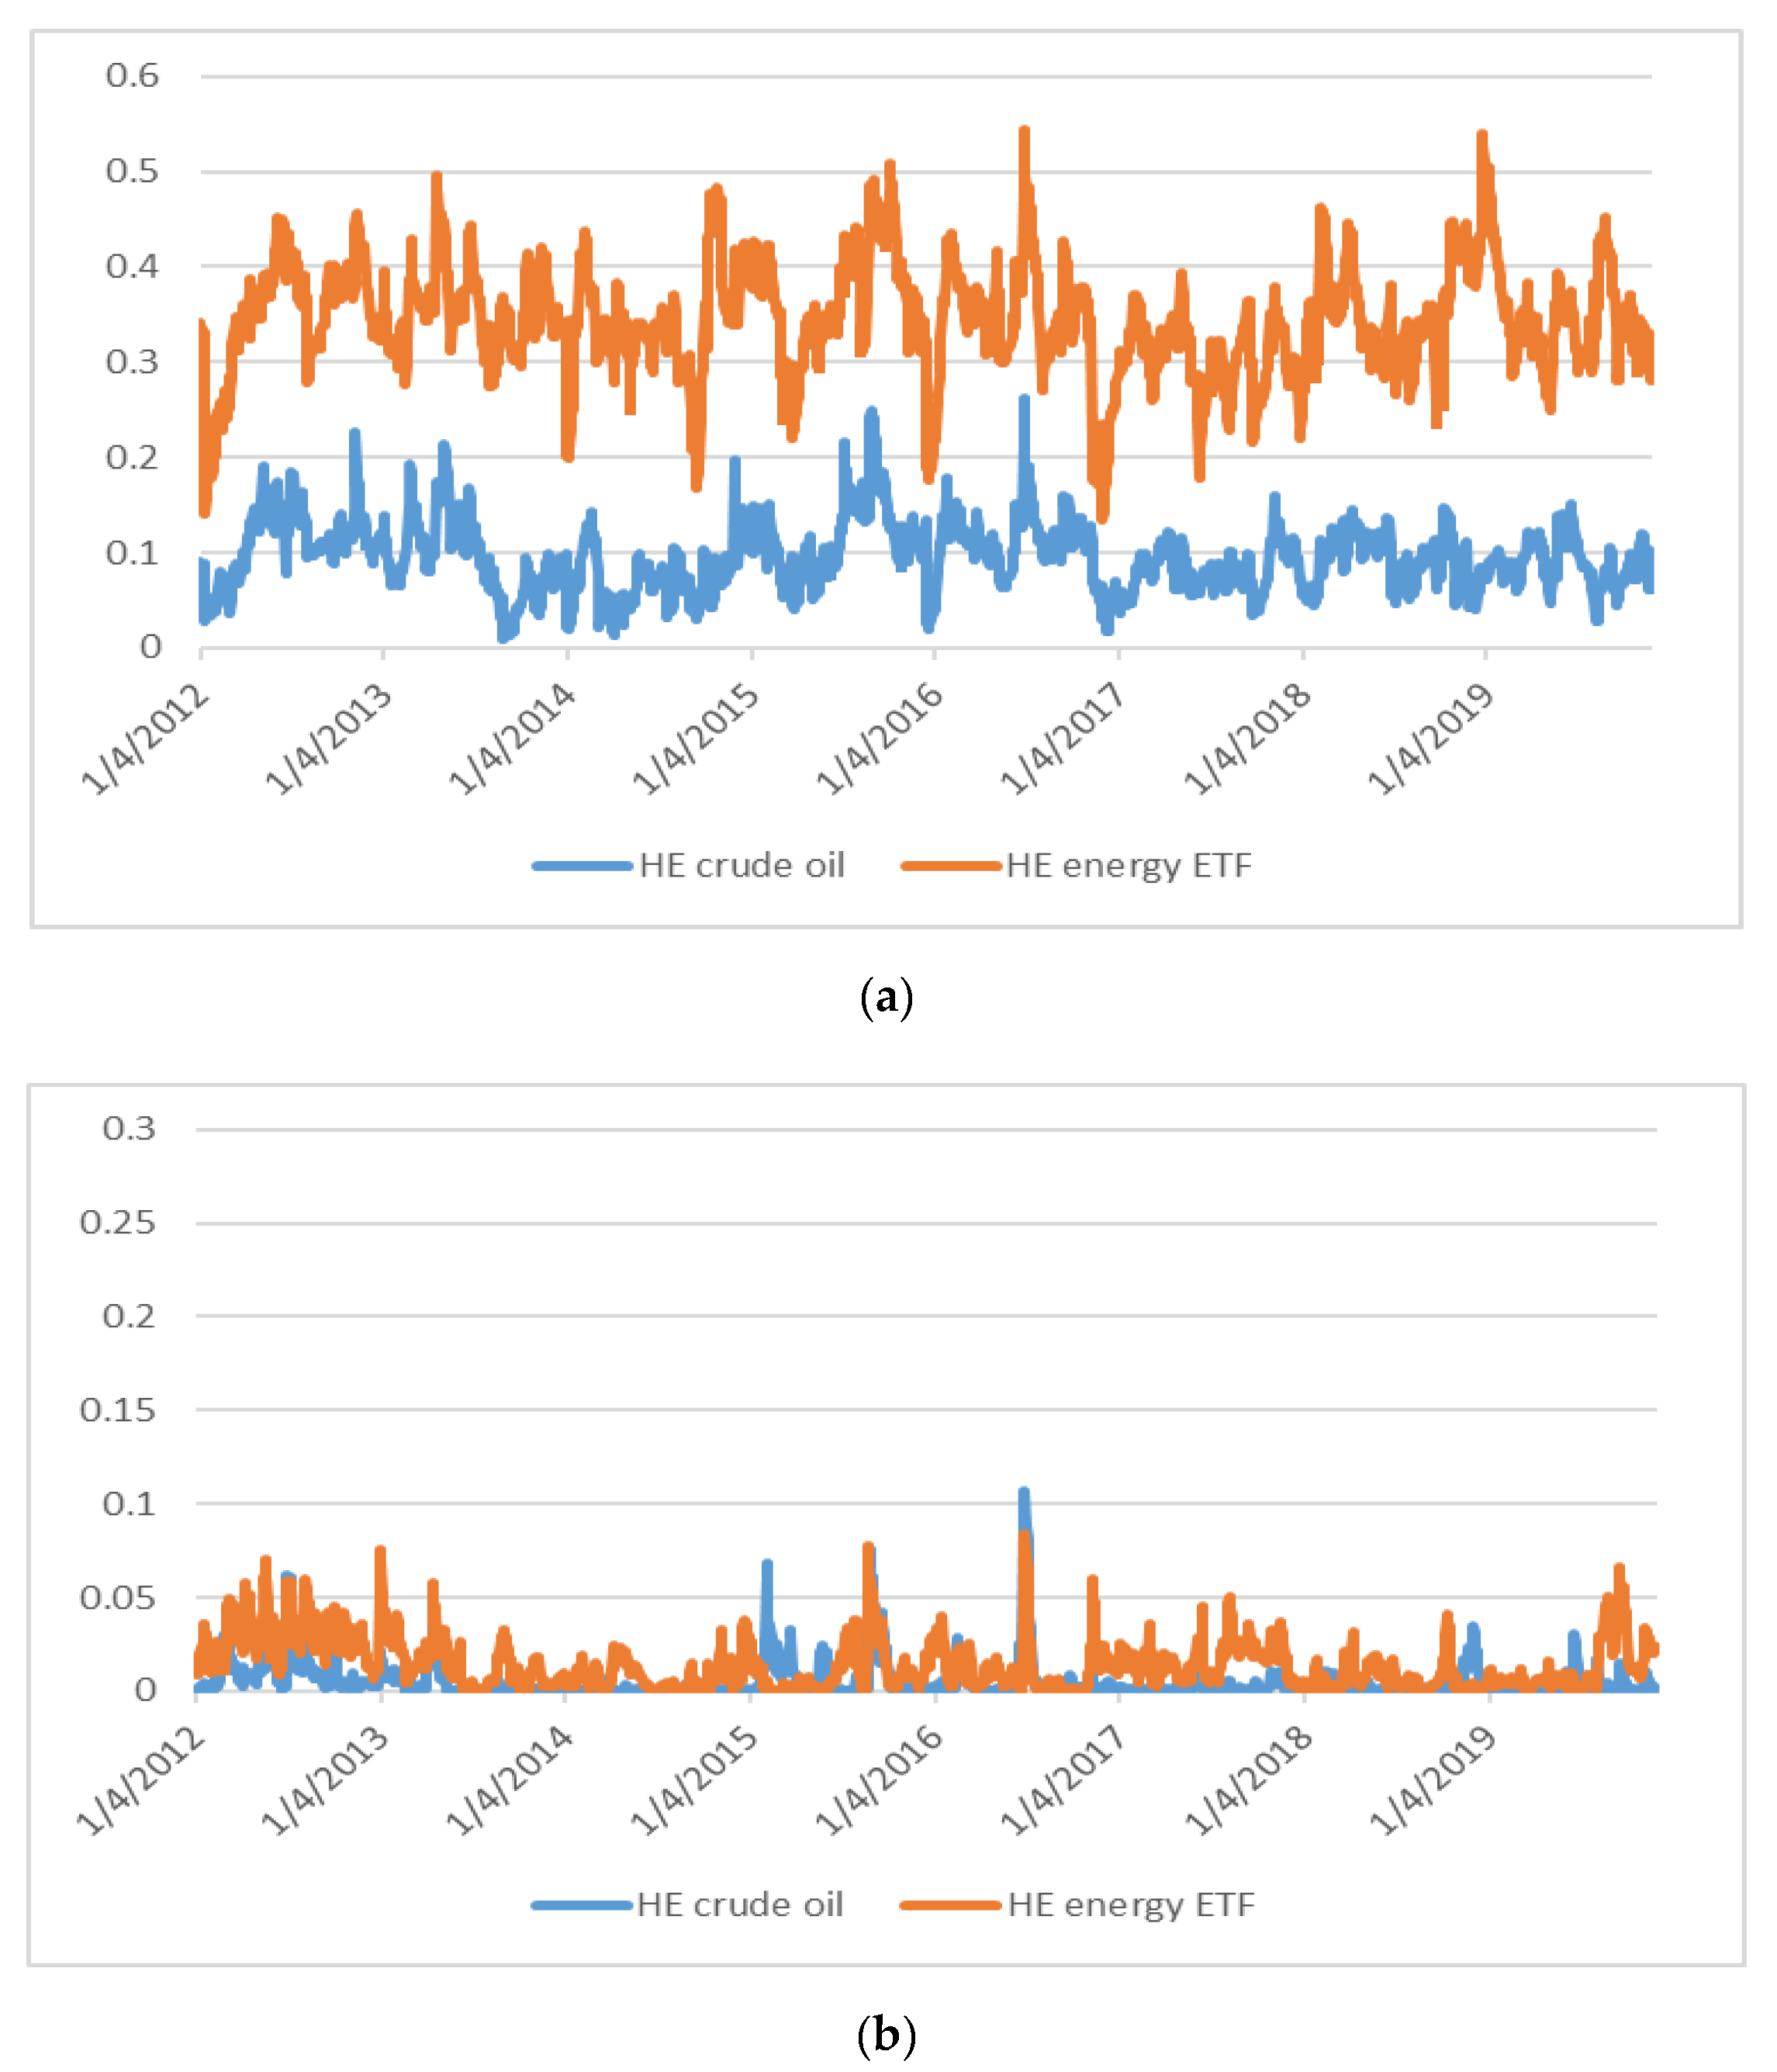
The time evolution of the hedge effectiveness is shown in Figure 3. It varies over time, especially for clean energy stocks and dirty assets (Figure 3a). Notably, the proportion of the variance reduced by hedging dirty assets with clean energy stocks is higher for energy ETF. In fact, the HE that involves clean energy stocks and energy ETF peaked around 54 in June 2016 and December 2018, which indicates that 54% of the clean energy stocks-energy ETF portfolio’s variance is eliminated by the hedge.
For the case of green bonds (Figure 3b), the picture is different; in fact, the proportion of the variance reduced by hedging crude oil and energy ETF with green bonds is much lower than that of clean energy stocks, suggesting that the clean energy stock index is a better hedge for the two dirty energy assets during most of the sample period under study.
Table 4 presents the summary statistics of the hedging effectiveness, which shows that clean energy stocks offer a higher HE for both dirty energy assets, especially crude oil, than green bonds. However, the value of the standard deviation is much higher for clean energy stocks & crude oil (0.0368) and clean energy stocks & energy ETF (0.0597) than for green bonds & crude oil (0.0096) and green bonds & energy ETF (0.0135). This suggests that the conditional mean of the HE of clean energy stocks for each of crude oil and energy ETF is not so stable but exhibits large changes over time. This is not the case when green bonds are the hedge asset, given relatively smaller values for the standard deviation.
Furthermore, the authors present in Table 5 the pairwise Pearson correlations of the hedging effectiveness, which are positive. Such a similar behaviour may be explained by the fact that the two dirty energy assets have a common feature of being energy-intensive suggesting that their driving factors are not so different.
5.4. Results of the Drivers of the Hedge Portfolio Returns
Prior to presenting the results of Equation (11), the authors present the summary statistics of the hedge portfolio returns in Table 6. Given Equation (10), a positive value for the hedge portfolio returns signifies that the hedged portfolio provides profits for the investor and vice versa. Table 6 shows that the hedge portfolio returns on average are positive and very close to zero for both crude oil and energy ETF. Remarkedly, crude oil has the highest standard deviation of the hedge portfolio returns, while energy ETF has lower standard deviation.
Now, the authors report in Table 7 the estimated results from Equation (11), through which the drivers of the hedge portfolio returns are uncovered. Specifically, estimated coefficients, Newey and West (1987) standard errors, and significance levels are reported. The F-statistics are highly significant for all cases. The highest model fit is for green bonds (Panel B), especially for energy ETF (Adjusted R2 = 36.90%). Crude oil is the dirty asset whose hedge portfolio returns show significant autocorrelation in both Panel A and Panel B.
Table 7 Panel A also shows that, for clean energy stocks, DVIX has a significant effect on the hedge portfolio returns; however, the sign is positive for crude oil and negative for energy ETF. DOVX is negatively related to the hedge portfolio returns for both crude oil and energy ETF. DDXY has a negative effect for the case of crude oil only. Gold returns and changes in inflation expectation have positive influences on the hedge portfolio returns for both crude oil and energy ETF. DEPU has no significant influence. Changes in the term spread have a positive influence on energy ETF only. Quite similar results are reported in Table 7 Panel B, when green bonds are the hedge asset; in fact, the results show the importance of DVIX, DOVX, DDXY, gold returns, and changes in inflation expectation in explaining the returns of the hedge portfolio involving crude oil or energy ETF. The only difference in the results, as compared to those reported in Panel A, resides in that the sign of DVIX is negative for crude oil, which is the expected sign as conjectured in Section 3.3.
Based on the above results, it seems that increases in the levels of the OVX make investors nervous, so they tend to reduce crude oil and energy ETF positions rather than clean energy stocks (green bonds) positions. Accordingly, the hedge portfolio returns decrease for both crude oil and energy ETF. For example, an increase of 1 % in the levels of the OVX leads to a decrease of 0.3431% (0.1406) in the return of the hedge portfolio containing crude oil (energy ETF) and clean energy stocks. However, the much stronger impact on crude oil as compared to energy ETF (more than the double) can be explained by the fact that the OVX is inversely related to crude oil prices, which is not necessarily the case for energy ETF. A quite similar explanation might be relevant regarding the general impact of the VIX. The results on the importance of implied volatility indices are somewhat in line with previous studies indicating that the implied volatility index of US equities can affect the risk of the hedge fund industry [46] and drive contagion in hedge fund returns [47]. Regarding the impact of the US dollar, it is in line with our argument in Section 3.3 and, as expected, its effect is much stronger on crude oil than energy ETF. Notably, changes in the US dollar index have generally a stronger impact on hedge portfolio returns than the VIX and OVX. In fact, the largest coefficient is for crude oil in both Panels (A and B). As expected, the impacts of gold returns and changes in inflation are positive. However, they are stronger than those associated with the other significant variables such as implied volatility indices and the US dollar index. The results showing the importance of gold returns and changes in inflation on the hedge portfolio returns are also documented in related studies dealing with the stock-oil nexus [20]. It could be that when economic condition deteriorates, investors tend to invest more in the US dollar and less in clean energy stocks and crude oil due to increased hedging demands in bad economic conditions [9].
To sum up, the main results show that green bonds are negatively correlated with dirty energy investments, which is not the case for clean energy stocks. This evidence points toward the particularity of the green bond market and its consistent inverse relationship with the two dirty energy assets under study. This finding nicely complements Reboredo [11] who indicates that green bonds are weakly linked to conventional equities and energy commodities. Regarding the hedging effectiveness, the results show that clean energy stocks are a more effective hedge than green bonds for dirty energy investments. This result arises from the larger ability of clean energy stocks to lessen the risk of the two dirty energy investments than green bonds. This finding is somewhat related to previous studies on the oil-clean energy nexus [5,8,13,15], which generally shows a weak interaction between oil prices and clean energy stocks, especially after 2012 [16]. As for the results on the drivers of the hedge portfolio returns, they show for the first time the importance of the implied volatilities of US equities and crude oil as well as US dollar index, gold prices, and inflation in driving the hedge portfolio returns related to the portfolio containing clean/green and dirty energy investments.
6. Discussion and Conclusions
The authors determine which of the clean energy stock index or the green bond index is a better hedge for the risk of two dirty energy assets (crude oil and energy ETF). Using the corrected DCC-GARCH and time-varying optimal hedge ratios and hedge effectiveness, the authors show that, unlike clean energy stocks, green bonds are negatively related to dirty energy assets, especially energy ETF. In fact, the particularity of green bonds, being driven by factors that are more different than those driving dirty energy investments or clean energy stocks, makes green bonds more inversely and consistently correlated with crude oil and energy ETF. This is a new result given that previous studies on green bonds do not consider the time-varying relationship between green bonds and dirty energy assets and compare it to that of clean energy stocks and dirty energy assets. Furthermore, previous studies do not estimate hedging effectiveness and overlook the comparative hedging role of green bonds to that of clean energy stocks. Interestingly, our main findings show evidence that the hedge ratios are time-varying, which implies that investors have to regularly monitor and adjust their hedged positions. Notably, the hedge effectiveness of clean energy stocks is superior to that of green bonds, especially for energy ETF. This result arises from the larger ability of clean energy stocks to lessen the risk of the two dirty energy investments than green bonds. The authors also make the current paper to further differ from previous studies by uncovering for the first time the main drivers of the hedge portfolio returns. Using regression models, the analyses underline the negative effects of the implied volatilities of US equities and crude oil as well as the US dollar index on the hedge portfolio returns. They also show that gold returns and inflation expectations have a positive effect on the hedge portfolio returns, whereas the effect of the term structure is marginal.
The above findings are useful to investors and portfolio managers who can build on them to make their investments in dirty energy assets more stable by taking hedging positions in green bonds or clean energy stocks. This would help market participants survive the environment of high risk inherent in the dirty energy investments such as crude oil and energy ETF. The fact that clean energy investments are a suitable hedge in both cases would help investors and portfolio managers in making investments in clean investments more appealing. This in turn would add demand for clean investments from those market participants, which would also be beneficial to policymakers who often promote for more local and foreign investments in the renewable energy sector. This is crucial given the wide environmental benefits of the clean/green energy sector and its contribution to social and economic development. As for the results on the drivers of the hedge portfolio returns, they should be useful to refine the models involving risk management and hedging strategies, which would ultimately enhance the profitability of hedging by giving a close look at specific economic and financial variables that include among others gold returns and inflation expectations. Put it differently, investors and portfolio managers are required to consider those drivers when adjusting their hedging strategies.
While the current study is useful for various economic actors, it is not free of limitations. In fact, the current study overlooks how the dynamics of correlations between clean/green and dirty energy assets would change when lower frequency data are used. In fact, some investors prefer to make decisions on longer periods, suggesting the need for empirical results based on weekly data. Future research can address this issue, probably while accounting for the heterogeneity of investors regarding their short-and long-term investment horizons via the application of wavelet-based models.
Author Contributions
Conceptualization, Validation, Writing—review & editing, T.S.; Data curation, Formal analysis, Methodology, Project administration, Writing—original draft, E.B.; Validation, Visualization, Writing—review & editing, X.V.V. All authors have read and agreed to the published version of the manuscript.
Funding
This research received no external funding.
Conflicts of Interest
Authors declare no conflict of interest.
Appendix A
Figure A1.
Plots of the levels of the clean/green and dirty energy indices.

Figure A2.
Plots of the returns of the clean/green and dirty energy indices.

References
- Kyritsis, E.; Serletis, A. Oil Prices and the Renewable Energy Sector. Energy J. 2019, 40. [Google Scholar] [CrossRef]
- Xia, T.; Ji, Q.; Zhang, D.; Han, J. Asymmetric and extreme influence of energy price changes on renewable energy stock performance. J. Clean. Prod. 2019, 241, 118338. [Google Scholar] [CrossRef]
- De Schryver, P.; De Mariz, F. What Future for the Green Bond Market? How Can Policymakers, Companies, and Investors Unlock the Potential of the Green Bond Market? J. Risk Finance Manag. 2020, 13, 61. [Google Scholar] [CrossRef] [Green Version]
- Zhou, X.; Cui, Y. Green Bonds, Corporate Performance, and Corporate Social Responsibility. Sustainability 2019, 11, 6881. [Google Scholar] [CrossRef] [Green Version]
- Ahmad, W.; Sadorsky, P.; Sharma, A. Optimal hedge ratios for clean energy equities. Econ. Model. 2018, 72, 278–295. [Google Scholar] [CrossRef]
- Bondia, R.; Ghosh, S.; Kanjilal, K. International crude oil prices and the stock prices of clean energy and technology companies: Evidence from non-linear cointegration tests with unknown structural breaks. Energy 2016, 101, 558–565. [Google Scholar] [CrossRef]
- Dutta, A. Oil price uncertainty and clean energy stock returns: New evidence from crude oil volatility index. J. Clean. Prod. 2017, 164, 1157–1166. [Google Scholar] [CrossRef]
- Ferrer, R.; Shahzad, S.J.H.; López, R.; Jareño, F. Time and frequency dynamics of connectedness between renewable energy stocks and crude oil prices. Energy Econ. 2018, 76, 1–20. [Google Scholar] [CrossRef]
- Kocaarslan, B.; Soytas, U. Dynamic correlations between oil prices and the stock prices of clean energy and technology firms: The role of reserve currency (US dollar). Energy Econ. 2019, 84, 104502. [Google Scholar] [CrossRef]
- Lee, D.; Baek, J. Stock Prices of Renewable Energy Firms: Are There Asymmetric Responses to Oil Price Changes? Economies 2018, 6, 59. [Google Scholar] [CrossRef] [Green Version]
- Reboredo, J.C. Green bond and financial markets: Co-movement, diversification and price spillover effects. Energy Econ. 2018, 74, 38–50. [Google Scholar] [CrossRef]
- Reboredo, J.C.; Rivera-Castro, M.A.; Ugolini, A. Wavelet-based test of co-movement and causality between oil and renewable energy stock prices. Energy Econ. 2017, 61, 241–252. [Google Scholar] [CrossRef]
- Sadorsky, P. Correlations and volatility spillovers between oil prices and the stock prices of clean energy and technology companies. Energy Econ. 2012, 34, 248–255. [Google Scholar] [CrossRef]
- Bouri, E.I.; Jalkh, N.; Dutta, A.; Uddin, G.S. Gold and crude oil as safe-haven assets for clean energy stock indices: Blended copulas approach. Energy 2019, 178, 544–553. [Google Scholar]
- Ahmad, W. On the dynamic dependence and investment performance of crude oil and clean energy stocks. Res. Int. Bus. Finance 2017, 42, 376–389. [Google Scholar] [CrossRef]
- Paiva, A.S.S.; Rivera-Castro, M.A.; Andrade, R.F.S.; Castro, M. DCCA analysis of renewable and conventional energy prices. Phys. A: Stat. Mech. Appl. 2018, 490, 1408–1414. [Google Scholar] [CrossRef]
- Aielli, G.P. Dynamic Conditional Correlation: On Properties and Estimation. J. Bus. Econ. Stat. 2013, 31, 282–299. [Google Scholar] [CrossRef]
- Engle, R.F. Dynamic Conditional Correlation—A Simple Class of Multivariate GARCH Models. SSRN Electron. J. 2000, 20, 339–350. [Google Scholar] [CrossRef] [Green Version]
- Batten, J.A.; Kinateder, H.; Szilagyi, P.G.; Wagner, N.F. Hedging stocks with oil. Energy Econ. 2019, 104422. [Google Scholar] [CrossRef]
- Wen, X.; Bouri, E.I.; Cheng, H. The Crude Oil–Stock Market Dependence and Its Determinants: Evidence from Emerging Economies. Emerg. Mark. Finance Trade 2019, 55, 2254–2274. [Google Scholar] [CrossRef]
- Uddin, G.S.; Rahman, L.; Hedström, A.; Ahmed, A. Cross-quantilogram-based correlation and dependence between renewable energy stock and other asset classes. Energy Econ. 2019, 80, 743–759. [Google Scholar] [CrossRef]
- Yu, L.; Zha, R.; Stafylas, D.; He, K.; Liu, J. Dependences and volatility spillovers between the oil and stock markets: New evidence from the copula and VAR-BEKK-GARCH models. Int. Rev. Financ. Anal. 2020, 68, 101280. [Google Scholar] [CrossRef]
- Ciner, C.; Gurdgiev, C.; Lucey, B.M. Hedges and safe havens: An examination of stocks, bonds, gold, oil and exchange rates. Int. Rev. Finance Anal. 2013, 29, 202–211. [Google Scholar] [CrossRef]
- Junttila, J.; Pesonen, J.; Raatikainen, J. Commodity market based hedging against stock market risk in times of financial crisis: The case of crude oil and gold. J. Int. Finance Mark. Inst. Money 2018, 56, 255–280. [Google Scholar] [CrossRef]
- Batten, J.A.; Kinateder, H.; Szilagyi, P.G.; Wagner, N. Can stock market investors hedge energy risk? Evidence from Asia. Energy Econ. 2017, 66, 559–570. [Google Scholar] [CrossRef]
- Henriques, I.; Sadorsky, P. Oil prices and the stock prices of alternative energy companies. Energy Econ. 2008, 30, 998–1010. [Google Scholar] [CrossRef]
- Kumar, S.; Managi, S.; Matsuda, A. Stock prices of clean energy firms, oil and carbon markets: A vector autoregressive analysis. Energy Econ. 2012, 34, 215–226. [Google Scholar] [CrossRef]
- Broadstock, D.C.; Cao, H.; Zhang, D. Oil shocks and their impact on energy related stocks in China. Energy Econ. 2012, 34, 1888–1895. [Google Scholar] [CrossRef] [Green Version]
- Managi, S.; Okimoto, T. Does the price of oil interact with clean energy prices in the stock market? Jpn. World Econ. 2013, 27, 1–9. [Google Scholar] [CrossRef] [Green Version]
- Dutta, A.; Bouri, E.I.; Das, D.; Roubaud, D. Assessment and optimization of clean energy equity risks and commodity price volatility indexes: Implications for sustainability. J. Clean. Prod. 2020, 243, 118669. [Google Scholar] [CrossRef]
- Maghyereh, A.; Awartani, B.; Abdoh, H. The co-movement between oil and clean energy stocks: A wavelet-based analysis of horizon associations. Energy 2019, 169, 895–913. [Google Scholar] [CrossRef]
- Kroner, K.F.; Sultan, J. Time-Varying Distributions and Dynamic Hedging with Foreign Currency Futures. J. Financ. Quant. Anal. 1993, 28, 535. [Google Scholar] [CrossRef]
- Dale, C. The hedging effectiveness of currency futures markets. J. Futur. Mark. 1981, 1, 77–88. [Google Scholar] [CrossRef] [Green Version]
- Cho, J.H.; Parhizgari, A.M. East Asian financial contagion under DCC-GARCH. Int. J. Bank. Finance 2008, 6, 17–30. [Google Scholar]
- Bollerslev, T. A Conditionally Heteroskedastic Time Series Model for Speculative Prices and Rates of Return. Rev. Econ. Stat. 1987, 69, 542. [Google Scholar] [CrossRef] [Green Version]
- Glosten, L.R.; Jagannathan, R.; Runkle, D.E. On the Relation Between the Expected Value and the Volatility of the Nominal Excess Return on Stocks. J. Finance 1993, 48, 1779–1801. [Google Scholar] [CrossRef]
- Ji, Q.; Fan, Y. Modelling the joint dynamics of oil prices and investor fear gauge. Res. Int. Bus. Finance 2016, 37, 242–251. [Google Scholar] [CrossRef]
- Baker, S.R.; Bloom, N.; Davis, S.J. Measuring Economic Policy Uncertainty. Q. J. Econ. 2016, 131, 1593–1636. [Google Scholar] [CrossRef]
- Aloui, R.; Gupta, R.; Miller, S.M. Uncertainty and crude oil returns. Energy Econ. 2016, 55, 92–100. [Google Scholar] [CrossRef] [Green Version]
- Brogaard, J.; Detzel, A. The Asset-Pricing Implications of Government Economic Policy Uncertainty. Manag. Sci. 2015, 61, 3–18. [Google Scholar] [CrossRef] [Green Version]
- Joy, M. Gold and the US dollar: Hedge or haven? Finance Res. Lett. 2011, 8, 120–131. [Google Scholar] [CrossRef]
- Choi, S.; Furceri, D.; Loungani, P.; Mishra, S.; Poplawski-Ribeiro, M. Oil prices and inflation dynamics: Evidence from advanced and developing economies. J. Int. Money Finance 2018, 82, 71–96. [Google Scholar] [CrossRef]
- Beckmann, J.; Berger, T.; Czudaj, R.L. Does gold act as a hedge or a safe haven for stocks? A smooth transition approach. Econ. Model. 2015, 48, 16–24. [Google Scholar] [CrossRef] [Green Version]
- Narayan, P.K.; Narayan, S.; Zheng, X. Gold and oil futures markets: Are markets efficient? Appl. Energy 2010, 87, 3299–3303. [Google Scholar] [CrossRef]
- Racicot, F.-É.; Théoret, R. Hedge fund return higher moments over the business cycle. Econ. Model. 2019, 78, 73–97. [Google Scholar] [CrossRef]
- Akay, O.O.; Senyuz, Z.; Yoldas, E. Hedge fund contagion and risk-adjusted returns: A Markov-switching dynamic factor approach. J. Empir. Finance 2013, 22, 16–29. [Google Scholar] [CrossRef] [Green Version]
- Shahzad, S.J.H.; Bouri, E.; Kayani, G.M.; Nasir, R.M.; Kristoufek, L. Are clean energy stocks efficient? An asymmetric multifractal scaling behavior. Phys. A Stat. Mech. Appl. 2020, 550, 124519. [Google Scholar] [CrossRef]
Figure 1.
(a)Time-varying condition correlation between clean energy stocks and each of the two dirty indices. Source: Authors’ calculation. (b) Time-varying condition correlation between green bonds and each of the two dirty indices. Source: Authors’ calculation.
Figure 1.
(a)Time-varying condition correlation between clean energy stocks and each of the two dirty indices. Source: Authors’ calculation. (b) Time-varying condition correlation between green bonds and each of the two dirty indices. Source: Authors’ calculation.

Figure 2.
(a) Dynamic hedge ratio between the clean energy stock index and each of the two dirty energy assets. Source: Authors’ calculation. (b) Dynamic hedge ratio between the green bond index and each of the two dirty energy assets. Source: Authors’ calculation.
Figure 2.
(a) Dynamic hedge ratio between the clean energy stock index and each of the two dirty energy assets. Source: Authors’ calculation. (b) Dynamic hedge ratio between the green bond index and each of the two dirty energy assets. Source: Authors’ calculation.

Figure 3.
Hedge effectiveness between green bonds and each of the two dirty energy assets. Source: Authors’ calculation. (a) clean energy stocks and dirty assets. (b) green bonds and dirty assets.
Figure 3.
Hedge effectiveness between green bonds and each of the two dirty energy assets. Source: Authors’ calculation. (a) clean energy stocks and dirty assets. (b) green bonds and dirty assets.


Table 1.
Descriptive statistics and correlation matrix.
| Panel A: Descriptive Statistics | ||||||||
|---|---|---|---|---|---|---|---|---|
| Variable | Mean | Std. Dev. | Skewness | Kurtosis | Jarque-Bera | ADF | PP | ARCH |
| Clean energy stocks | 0.0093 | 1.5000 | −0.2355 | 3.7205 | 61.4385 * | −41.0353 * | −41.0774 * | 9.0404 * |
| Green bonds | 0.0064 | 0.3080 | −0.1651 | 5.2616 | 433.1319 * | −46.3038 * | −46.3468 * | 6.8180 * |
| Crude oil | −0.0287 | 2.1231 | 0.1689 | 6.7709 | 1188.4810 * | −48.2513 * | −48.2457 * | 23.0860 * |
| Energy ETF | −0.0112 | 1.6320 | −0.1961 | 4.9273 | 320.7515 * | −45.2267 * | −45.2241 * | 15.8790 * |
| Panel B: Pearson correlation | ||||||||
| Clean Energy Stocks | Green Bonds | Crude Oil | Energy ETF | |||||
| Clean energy stocks | 1.0000 | |||||||
| Green bonds | −0.0803 | 1.0000 | ||||||
| Crude oil | 0.3020 | 0.0052 | 1.0000 | |||||
| Energy ETF | 0.5923 | −0.0865 | 0.6180 | 1.0000 | ||||
Notes: The sample is 3 January 2012 to 29 November 2019, leading to 1990 common daily return observations. The original price data are extracted from DataStream. The Jarque-Bera statistic is used to test the null hypothesis that the return series is normally distributed. ADF (PP) is the augmented Dickey-Fuller (Phillips and Perron) statistic that is used to test the null hypothesis that the return series has a unit root. ARCH is a Lagrange Multiplier test that is used to test the null hypothesis that the return series exhibits no autoregressive conditional heteroscedasticity up to 10 lags. * indicates statistical significance at the 1% level.
Table 2.
Summary statistics of dynamic conditional correlations.
| Variable | Mean | Min. | Max. | Std. Dev. | Skewness | Kurtosis | 5% Quantile |
|---|---|---|---|---|---|---|---|
| Clean energy stocks & crude oil | 0.3020 | 0.0925 | 0.5126 | 0.0611 | −0.1563 | 0.2405 | 0.3060 |
| Clean energy stocks & energy ETF | 0.5837 | 0.3678 | 0.7379 | 0.0522 | −0.5202 | 1.2458 | 0.5992 |
| Green bonds & crude oil | −0.0127 | −0.2754 | 0.3268 | 0.0690 | 0.2388 | 2.1365 | 0.0077 |
| Green bonds & energy ETF | −0.0948 | −0.2789 | 0.2901 | 0.0695 | 0.7030 | 2.2353 | −0.0826 |
Notes: This table presents the summary statistics for the dynamic conditional correlations between the clean energy stock (green bond) index and each of crude oil and energy ETF. The sample includes 1990 daily observations.
Table 3.
Summary statistics of hedge ratio.
| Variable | Mean | Min. | Max. | Std. Dev. | Skewness | Kurtosis |
|---|---|---|---|---|---|---|
| Clean energy stocks & crude oil | 0.4103 | 0.1689 | 0.0720 | 1.0817 | 0.6030 | 0.2610 |
| Clean energy stocks & energy ETF | 0.6192 | 0.1379 | 0.2894 | 0.9625 | −0.0686 | −0.4881 |
| Green bonds & crude oil | −0.0617 | −2.1594 | 2.7992 | 0.5132 | 0.4578 | 4.1269 |
| Green bonds & energy ETF | −0.5022 | −2.0208 | 1.4408 | 0.3967 | 0.0865 | 2.0925 |
Notes: This table presents the summary statistics for the hedge ratio between the clean energy stock (green bond) index and each of crude oil and energy ETF. The sample includes 1990 daily observations. Source: Authors’ calculation.
Table 4.
Summary statistics of hedge effectiveness.
| Variable | Mean | Min. | Max. | Std. Dev. |
|---|---|---|---|---|
| Clean energy stocks & crude oil | 0.0949 | 0.0086 | 0.2627 | 0.0368 |
| Clean energy stocks & energy ETF | 0.3435 | 0.1353 | 0.5444 | 0.0597 |
| Green bonds & crude oil | 0.0049 | 0.0000 | 0.1068 | 0.0096 |
| Green bonds & energy ETF | 0.0138 | 0.0000 | 0.0841 | 0.0135 |
Notes: This table presents the summary statistics of the hedge effectiveness (Equation (9)) between the clean energy stock (green bond) and each of the two dirty energy assets (crude oil and energy ETF). The sample is 3 January 2012–29 November 2019. Source: Authors’ calculation.
Table 5.
Correlation of hedging effectiveness.
| Variable | Panel A: Clean Energy Stocks | Panel B: Green Bonds | ||
|---|---|---|---|---|
| HE Crude Oil | HE Energy ETF | HE Crude Oil | HE Energy ETF | |
| HE energy ETF | 0.6073 | 1.0000 | 0.4581 | 1.0000 |
Notes: This table presents the pairwise unconditional correlations for the hedge effectiveness (Equation (9)) between the clean energy stock (green bond) and each of the two dirty energy assets (crude oil and energy ETF). The sample is 3 January 2012–29 November 2019. Source: Authors’ calculation.
Table 6.
Summary statistics of hedge portfolio returns.
| Variable | Mean | Min. | Max. | Std. Dev. |
|---|---|---|---|---|
| Clean energy stocks & crude oil | 0.0314 | −9.7815 | 13.8198 | 2.0027 |
| Clean energy stocks & energy ETF | 0.0217 | −6.6724 | 8.3494 | 1.2831 |
| Green bond & crude oil | 0.0272 | −11.2056 | 14.2486 | 2.1041 |
| Green bond & energy ETF | 0.0085 | −9.3586 | 8.2881 | 1.6146 |
Notes: This table presents the summary statistics of the hedge portfolio returns (Equation (10)) between the clean energy stock (green bond) and each of the two dirty energy assets (crude oil and energy ETF). The sample is 3 January 2012–29 November 2019. Source: Authors’ calculation.
Table 7.
Drivers of the hedge portfolio returns.
| Variable | Panel A: Clean Energy Stocks | Panel B: Green Bonds | ||
|---|---|---|---|---|
| Crude Oil | Energy ETF | Crude Oil | Energy ETF | |
| Constant | 0.0244 | 0.0142 | 0.0211 | 0.0011 |
| 0.0398 | 0.0280 | 0.0399 | 0.0272 | |
| AR(1) | 0.1059 *** | 0.0448 * | 0.0754 *** | 0.0123 |
| 0.0291 | 0.0256 | 0.0264 | 0.0236 | |
| DVIX | 0.1362 *** | −0.1009 *** | −0.0793 ** | −0.4539 *** |
| 0.0409 | 0.0234 | 0.0365 | 0.0526 | |
| DTYVIX | −0.0605 | 0.1194 | ||
| 0.2248 | 0.1680 | |||
| DOVX | −0.3431 *** | −0.1406 *** | −0.3896 *** | −0.2138 *** |
| 0.0691 | 0.0319 | 0.0736 | 0.0361 | |
| DEPU | 0.0005 | 0.0004 | 0.0005 | 0.0005 |
| 0.0008 | 0.0006 | 0.0009 | 0.0006 | |
| DDXY | −0.5076 *** | −0.1104 | −0.4387 *** | −0.3219 *** |
| 0.1357 | 0.0729 | 0.1346 | 0.0826 | |
| D10Y-2Y | 0.7690 | 2.0740 ** | 1.1970 | 1.8843 * |
| 1.6670 | 0.9511 | 1.6964 | 1.0385 | |
| DInflation | 14.1276 *** | 6.7681 *** | 16.6097 *** | 9.6058 *** |
| 2.3160 | 1.2228 | 2.4174 | 1.4677 | |
| Rgold | 14.6631 ** | 9.9668 *** | 16.3291 *** | 12.3658 *** |
| 6.3895 | 3.6982 | 6.2979 | 3.6571 | |
| Adjusted R2 | 0.1630 | 0.1243 | 0.2260 | 0.3690 |
| F-statistic | 48.8687 | 35.8931 | 64.8158 | 128.8176 |
| P-value | 0.0000 | 0.0000 | 0.0000 | 0.0000 |
Notes: This table presents the estimated coefficients from Equation (11). Standard errors are reported in bold; they are corrected for autocorrelation and heteroscedasticity using the Newey-West (1987) estimator. AR(1) is the first-order autocorrelation; DVIX, DOVX, and DTYVIX are changes in the CBOE 30-day volatility of the S&P 500 index, 30-day volatility of crude oil prices, and 30-day volatility of the 10-year US Treasury Note; DEPU are changes in the US Economic Policy Uncertainty; DDXY are changes in the US dollar index; Rgold are log returns of gold spot prices; D10Y-2Y are changes in the US term spread; DInflation are changes in US inflation expectations. Data on the independent variables are extracted from DataStream. Data on the US EPU are from https://www.policyuncertainty.com. ***, ** and * denote statistical significance at the 1, 5 and 10% significance levels, respectively. The sample is 3 January 2012–29 November 2019.
© 2020 by the authors. Licensee MDPI, Basel, Switzerland. This article is an open access article distributed under the terms and conditions of the Creative Commons Attribution (CC BY) license (http://creativecommons.org/licenses/by/4.0/).
Share and Cite
MDPI and ACS Style
Saeed, T.; Bouri, E.; Tran, D.K. Hedging Strategies of Green Assets against Dirty Energy Assets. Energies 2020, 13, 3141. https://0-doi-org.brum.beds.ac.uk/10.3390/en13123141
AMA Style
Saeed T, Bouri E, Tran DK. Hedging Strategies of Green Assets against Dirty Energy Assets. Energies. 2020; 13(12):3141. https://0-doi-org.brum.beds.ac.uk/10.3390/en13123141
Chicago/Turabian StyleSaeed, Tareq, Elie Bouri, and Dang Khoa Tran. 2020. "Hedging Strategies of Green Assets against Dirty Energy Assets" Energies 13, no. 12: 3141. https://0-doi-org.brum.beds.ac.uk/10.3390/en13123141
Note that from the first issue of 2016, this journal uses article numbers instead of page numbers. See further details here.