International Energy Security Risk Index—Analysis of the Methodological Settings

1
Department of Organization and Management, Faculty of Organizational Sciences, University of Maribor, 4000 Kranj, Slovenia
2
Department for Simulations and Distance Learning, University of Defense in Belgrade, 11000 Belgrade, Serbia
3
Department of Energy Security, Faculty of Security Studies, Educons University, 21208 Sremska Kamenica, Serbia
4
Department for Economic Theory and Analysis, Faculty of Business, Singidunum University, 11000 Belgrade, Serbia
*
Author to whom correspondence should be addressed.
Energies 2020, 13(12), 3234; https://0-doi-org.brum.beds.ac.uk/10.3390/en13123234
Submission received: 4 May 2020
/
Revised: 14 June 2020
/
Accepted: 18 June 2020
/
Published: 22 June 2020
(This article belongs to the Special Issue Selected Papers from SDEWES 2019 conferences on Sustainable Development of Energy, Water and Environment Systems)
Abstract
:The main objective of this paper is to analyze model settings of the International Energy Security Risk Index developed by the U.S. Chamber of Commerce. The study was performed using stepwise regression, principal component analysis, and Promax oblique rotation. The conclusion of the regression analysis shows that Crude Oil Price and Global Coal Reserves are sufficient to explain 90% of the variance of the Index. However, if a model that explains 100% of the variance of the Index is chosen and other variables are added, Global Coal Reserves loses importance due to the presence of other parameters in which it is contained. Regardless of the chosen model of analysis, it is evident that there is room for revising the Index and removing variables that do not contribute to its precision. The research showed that the main disadvantage of the variables that make up the Index rests with the fact that the variables are of different degrees of generality, that is, one parameter is contained in other parameters (unclear which other). The research covers data for 25 countries over a 26-year period, with the first year of the research being 1980 and the last 2016 (the latest available report).
1. Introduction
Energy policy is one of the most complex processes and challenges faced by the modern world, and energy security, as one of the essential prerequisites for sustainable development, is an objective pursued by all countries in the world [1]. Management in this area is extremely complex. It has a significant impact on global geopolitical developments and security as a whole, which is why the analysis of the situation, forecasting, and decision-making in this area is the subject of numerous studies and different approaches [2,3]. Furthermore, there is a possibility of manipulating the data and/or the interpretation of the results. Measured values of energy security can serve as basis for making important decisions, therefore, reliability of measurement must be subject of additional studies [4]. All decisions in the field of energy security have certain consequences that can be positive, negative, or neutral (depending on the system they are related to). In terms of coverage, they can be simple or extremely complex (emerging from the sphere of the energy sector), with implications at national, regional, or global level [5]. The consequences can also be extremely complex, including tensions in relations between certain countries, crises in some regions and, in extreme cases, they can also affect the emergence, duration, and specificities of military and paramilitary conflicts and terrorist activities [6].
Analyzing and defining the situation in all areas can be a somewhat complex process as it is most often associated with a large number of ambiguities. The methods and ways in which assessments and decisions are made can be different: from subjective assessment to multi attribute decision making, integrating subjective and objective. As a rule, only an objective interpretation of well-selected and tested data can provide the best possible support in the analysis and decision-making processes [7].
Generally speaking, analysis and modeling are based on the hybrid principle; on the one hand, only clearly defined, measurable, and exact variables are used in the process and, on the other hand, there are a number of variables that are alterable, inexact, and often questionable in terms of their structure [8]. Data processing methods are diverse, their adequacy may be questionable, the reliability of the selected data processing method is sometimes at the lower limit of acceptability, and the method of interpreting the results can be ambiguous. However, the need to develop more precise decision-making tools is becoming increasingly evident, especially in the energy sector, with endeavors to adapt the tools to global efforts to make the decisions acceptable, feasible, and sustainable [9].
Analyzing the situation and making decisions that affect energy security is further complicated by the fact that there are no basic prior methodological assumptions. First of all, there has not been a clearly established and generally accepted definition of energy security so far [10]; moreover, a consensus has developed over the years that it is not possible to clearly define energy security. Consequently, without a clear definition of energy security it is not possible to use the regular methodological approach, that is, to select the indicators to be used to measure energy security. Furthermore, the manner in which the selected data are processed is not clearly defined. There is no single formula for determining energy security but, since measurements are necessary, diverse and somewhat complex approaches are used. In addition, there are methodologies for determining energy security that are not publicly available. Their analysis is therefore difficult but still possible and very necessary, especially since energy security is coupled with a high degree of risk, uncertainty, and ambiguity [11].
Furthermore, the analysis of energy security measurement is also aggravated by energy security split into long-term and short-term ones, whereby certain improvement in short-term energy security may have a negative impact on long-term energy security or on some of its indicators. In this regard, it should be noted that there is no clearly defined number of years used to define short-term or long-term nature of energy security [12].
In general, there are three initial approaches indicating the sole understanding of the essence of energy security: (1) an approach that takes into account only the technical and technological parameters, that is, technical stability and resilience of the energy system; (2) an approach that takes into account solely the question whether and how much energy a country imports (shown through the Energy Dependence Index); and (3) a complex approach that takes into account a number of variables (technical, market, economic, environmental, etc.) to assess and forecast energy security. Based on the third approach, a number of energy security indexes have been developed by various organizations and individuals. One of them is the International Energy Security Risk Index, developed by the U.S. Chamber of Commerce. The index is set for 25 OECD countries and the report thereof is published at two-year intervals [13] and used as a support to assessment of the situation and identification of changes and trends, in both the field of energy security and in many other fields and different policies (economic, environmental, social, domestic, foreign, security, military, and the like) at both global and regional levels [14].
The International Energy Security Risk Index is a complex index, aggregated on the basis of 29 individual variables divided into eight groups. The selection of type, number, and structure of each individual variable is certainly always questionable [15,16,17,18]. The fact that a perfect energy security index does not exist, but that there are different understandings of the very essence of energy security, should be accepted [19]. In such a situation, collecting and processing data (various variables) can be considered an acceptable option for assessments and forecasts. What should be the subject of the research is to primarily assess accuracy and reliability of already defined energy security indexes, to assess the capacity of variables that make up the indexes to show the most important characteristics of the system under observation, to define and evaluate interrelationship of individual variables that make up the selected index, and to assess their individual (or combined) capacity to influence, to a greater or lesser (or variable) extent, the final outcome—the value of the final index showing the degree of energy security [20].
The main objective of this paper is to analyze the methodological setting of the International Energy Security Risk Index, i.e., of its structure and of the certain reliability indicators. In this way, the obtained results will represent additional objectives of this paper. First of all, the realization of the research will provide exact indicators of the reliability of the Index, which can be taken into consideration when it comes to the practical application of this Index for various purposes (and above all, in the decision-making process). Furthermore, the aim of the research is of a theoretical nature as well, because it points to specific issues in the very methodology used for conceiving this Index and, in accordance with that, proposes certain improvements for the research.
The contribution to the extant literature is reflected primarily in the fact that there is no significant coverage of the papers presenting the results of research of this kind. Therefore, this paper provides information that can be further analyzed and expanded using additional methods, whereby somewhat opposite opinions could certainly be expected. Specifically, all research related to the assessment of the structure of certain measurement parameters (especially when it comes to parameters consisting of a number of variables usually different in nature), as well as research related to the application of data and their processing, contributes to the corpus of literature in a specific field of study: development of analysis of the existing methodologies and development of new methodologies for quantification of tools to support the decision-making process in the field of energy security. The paper is structured in five Sections. In Section 1, the authors present the main goal of the research, an overview of the results of previous research in the field of assessment of the International Energy Security Risk Index, as well as other methods for quantifying energy security for which there are adequate sources. The research methodology is presented in Section 2: subject of the research, statistical methods applied in the research model which is applied in this paper. Section 3 presents the research results and Section 4 gives the discussion of the obtained results and comparison with the results from similar research, based on which the recommendations are given. Finally, Section 5 presents a summary review of the paper and gives suggestion for further research. At the end of the paper, references are presented.
2. Materials and Methods
The research into the model on which the International Energy Security Risk Index is conceived was based on a sample of 25 OECD countries that are large energy producers and/or consumers with a major impact on all developments that affect or may affect energy security in the world. These are Australia, Brazil, Canada, China, Denmark, France, Germany, India, Indonesia, Italy, Japan, Mexico, Netherlands, New Zealand, Norway, Poland, Russian Federation, South Africa, South Korea, Spain, Thailand, Turkey, Ukraine, United Kingdom, and United States of America [21].
Data pertaining to the period 1980–2016 were used for processing. The index is essentially composite, made up of 29 individual indicators:
- Global fuels: Global oil reserves, Global oil production, Global gas reserves, Global gas production, Global coal reserves, and Global coal production.
- Fuel imports: Oil import exposure, Gas import exposure, Coal import exposure, Total energy import exposure, and Fossil fuel import expenditure per GDP.
- Energy expenditures: Energy expenditure intensity, Energy expenditure per capita, Retail electricity prices, and Crude oil prices.
- Price and market volatility: Crude oil price volatility, Energy expenditure volatility, World oil refinery usage, and GDP per capita.
- Energy use intensity: Energy consumption per capita, Energy intensity, and Petroleum intensity.
- Electric power sector: Electricity diversity and Non-carbon generation.
- Transportation sector: Transport energy per capita and Transport energy intensity.
- Environmental: CO2 emission trend, CO2 per capita, and CO2 GDP intensity.
Based on the methodology presented through annual energy security reports [22], the International Energy Security Risk Index is generally developed as the sum of the values of variables (criteria) that are first normalized to be correlated and then multiplied by weighting factors to highlight the importance of individual variables on an annual basis (Equation (1)):
where: IIESRy represents the annual International Energy Security Risk Index for a specific country, fnor is a normalization function, Kn is a specific variable (criterion), and wn is a weighting factor for that variable. For the sake of transparency, when publishing the International Energy Security Risk Index the U.S. Chamber of Commerce presents also the methodology used in terms of the description of variables used and their weighting factors. Due to the lack of scientific basis for introducing new and/or changing the existing variables, the need to include factors that reflect not only energy security, but also environmental protection, market, traffic, and the like, is the publisher’s argument for a change in weighting factors. From the additional analysis of the methodology used by the U.S. EIA (Energy Information Administration) through NEMS (National Energy Modeling System) it can be concluded that, according to the number of variables and processing stages, a selected system of mathematical models was used both for calculating the current values of the International Energy Security Risk Index, and for predicting the trend of the International Energy Security Risk Index over many decades [23].
For the foregoing reasons, in order to avoid the complexity trap within which not all the variables can be controlled nor their interdependencies determined, and in order to obtain relevant data on the impact of individual criteria on the values of the International Energy Security Risk Index based on available data, the following methods were used:
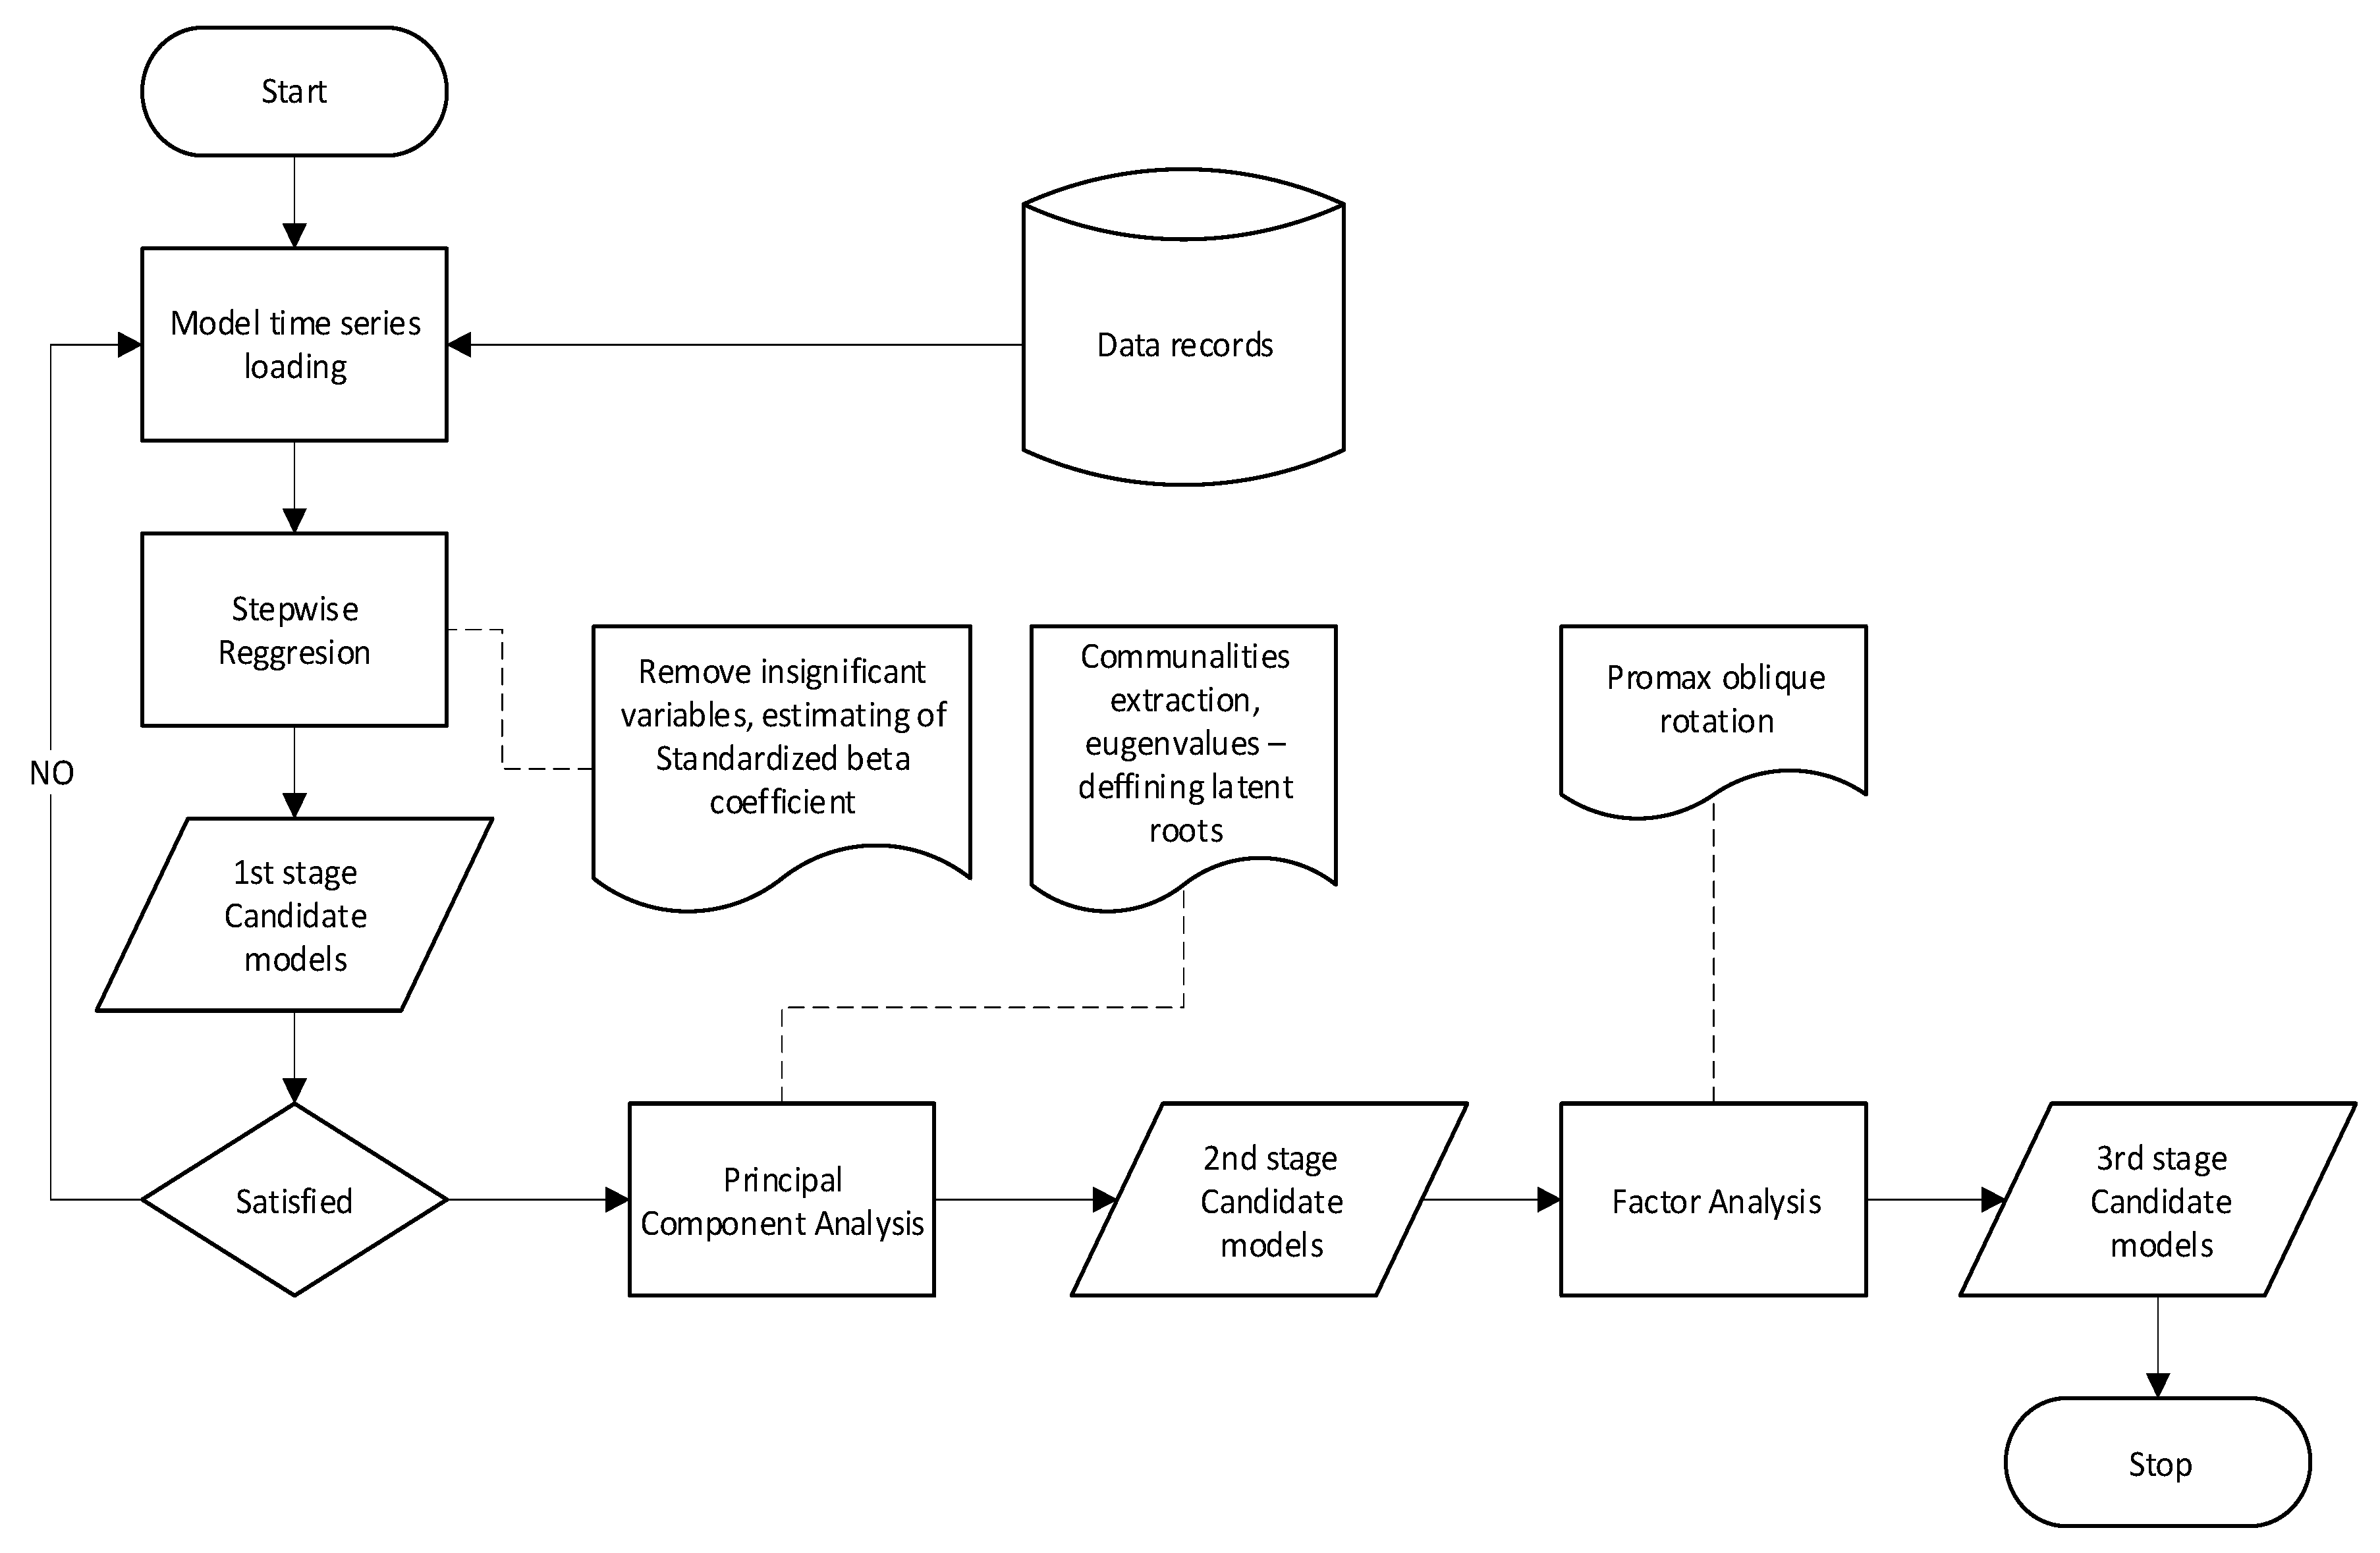
Stepwise regression analysis. The basic aim of this method is to analyze the selection of variables that make up a particular set, especially when it comes to a set of multiple variables whose relationship is complex or insufficiently known, i.e., when theoretical and practical instructions are neither clear nor unequivocally proven in this respect [24], as is the case with the International Energy Security Risk Index, which is the subject of this study. In this case, the method was chosen to indicate a set of independent variables with the most significant impact on the independent variable (the value of the average OECD International Energy Security Risk Index). The stepwise regression method can be conducted in two basic ways [25]:
- (a)
- Forward selection starts with no variables in the model, but each variable is subsequently added and its significance tested, thus retaining the variables that show the highest degree of significance; or
- (b)
- The analysis starts with a set of all variables and moves backwards; each variable is individually deleted, and it is checked whether this deletion has a significant impact on the final result.
Principal component analysis (PCA). The main reason for the selection of this method rests with the very essence of the index that is the subject of analysis, as well as with the set goal of the research. International Energy Security Risk Index is a composite indicator, and the data set used for the research is relatively large (29 different variables with data for 37 years.) This method is applied for dimensionality reduction and data interpretation where the major components explain the variability of data in the most concise way, showing some hidden data correlations and interrelationships [26]. The main objectives of this method are reduction and analysis of the linear relationship of a number of mutually correlated variables, distributed in a multivariate manner, in order to obtain fewer components and new variables mutually non-correlated, with minimal loss of information. The PCA allows one to determine the extent to which individual indicators are related, which is particularly necessary in the case of the International Energy Security Risk Index as it consists of 29 indicators that can be assumed to be highly related. In some cases, indicators are contained in each other, which is a methodological shortcoming. Since the main goal of the paper is to analyze the methodological setting, the selection of PCA can be considered an adequate method that, in combination with other applied methods, can give a certain picture of the concept of the Index, based on which recommendations for improvements can be proposed [27].
Promax oblique rotation is a method that represents non-orthogonal rotation and examines the correlation of variables in a set. By using this method, the orthogonality constraints are relaxed, and the space is opened for variables to show their correlation more clearly [28]. This analysis was selected as additional, because the model allows rotation of the axes to fit the actual data points better, which facilitates and improves interpretation of the results. It was selected precisely with the aim of providing a more precise picture of the ratio of variables previously determined by applying the PCA. The selection of this method is also based on the essence of the International Energy Security Risk Index, which consists of 29 variables, and is compliant with the research goal: determining the association of variables.
The model applied in the research is shown in Figure 1.
In short, by using stepwise regression the regression model was first adjusted to extract the most relevant variables that affect the values of the calculated International Energy Security Risk Index. After the variables were extracted, their processing was performed by using the principal component analysis to verify the significance of the extracted variables.
3. Results
3.1. Stepwise Regression Analysis
In order to examine the structure and coherence of the International Energy Security Risk Index, i.e., the variables that make up the Index, a regression analysis was first performed. Stepwise regression was used as the method of regression analysis to answer the following questions: which weighting coefficients were assigned to the variables when determining the Index? Which model contains the smallest prediction error? Is there a room for changing the selected variables? The results of the model analysis applied to determine the International Energy Security Risk Index are shown in Table 1.
Stepwise regression analysis in the first iteration provides a model in which Crude Oil Prices is a variable accounting for 67.7% of the International Energy Security Risk Index. In addition to determining the two most important variables that explain 90% of the variance of the overall Index (Crude Oil Prices and Global Coal Reserves), the stepwise analysis provided ranking of the remaining 15 (out of 17) models, in which variables from 1 to 13 participate (Table 1). Since the difference in values of R square (coefficient of determination) and adjusted R square (adjusted coefficient of determination) is insignificant—in the interval [0–1 × 10⁻³], the remaining variables that are involved in the establishment of these models should not be neglected. For this reason, the model analysis explaining 100% of the variance of the Index was made by adding to the model eight additional variables (Crude Oil Price Volatility, Oil Import Exposure, Non-carbon generation, Energy Expenditure Volatility, Fossil Fuel Import Expenditure per GDP, Energy Consumption per capita, Coal Import Exposure, Global Gas production) that reported lower significance in the first step.
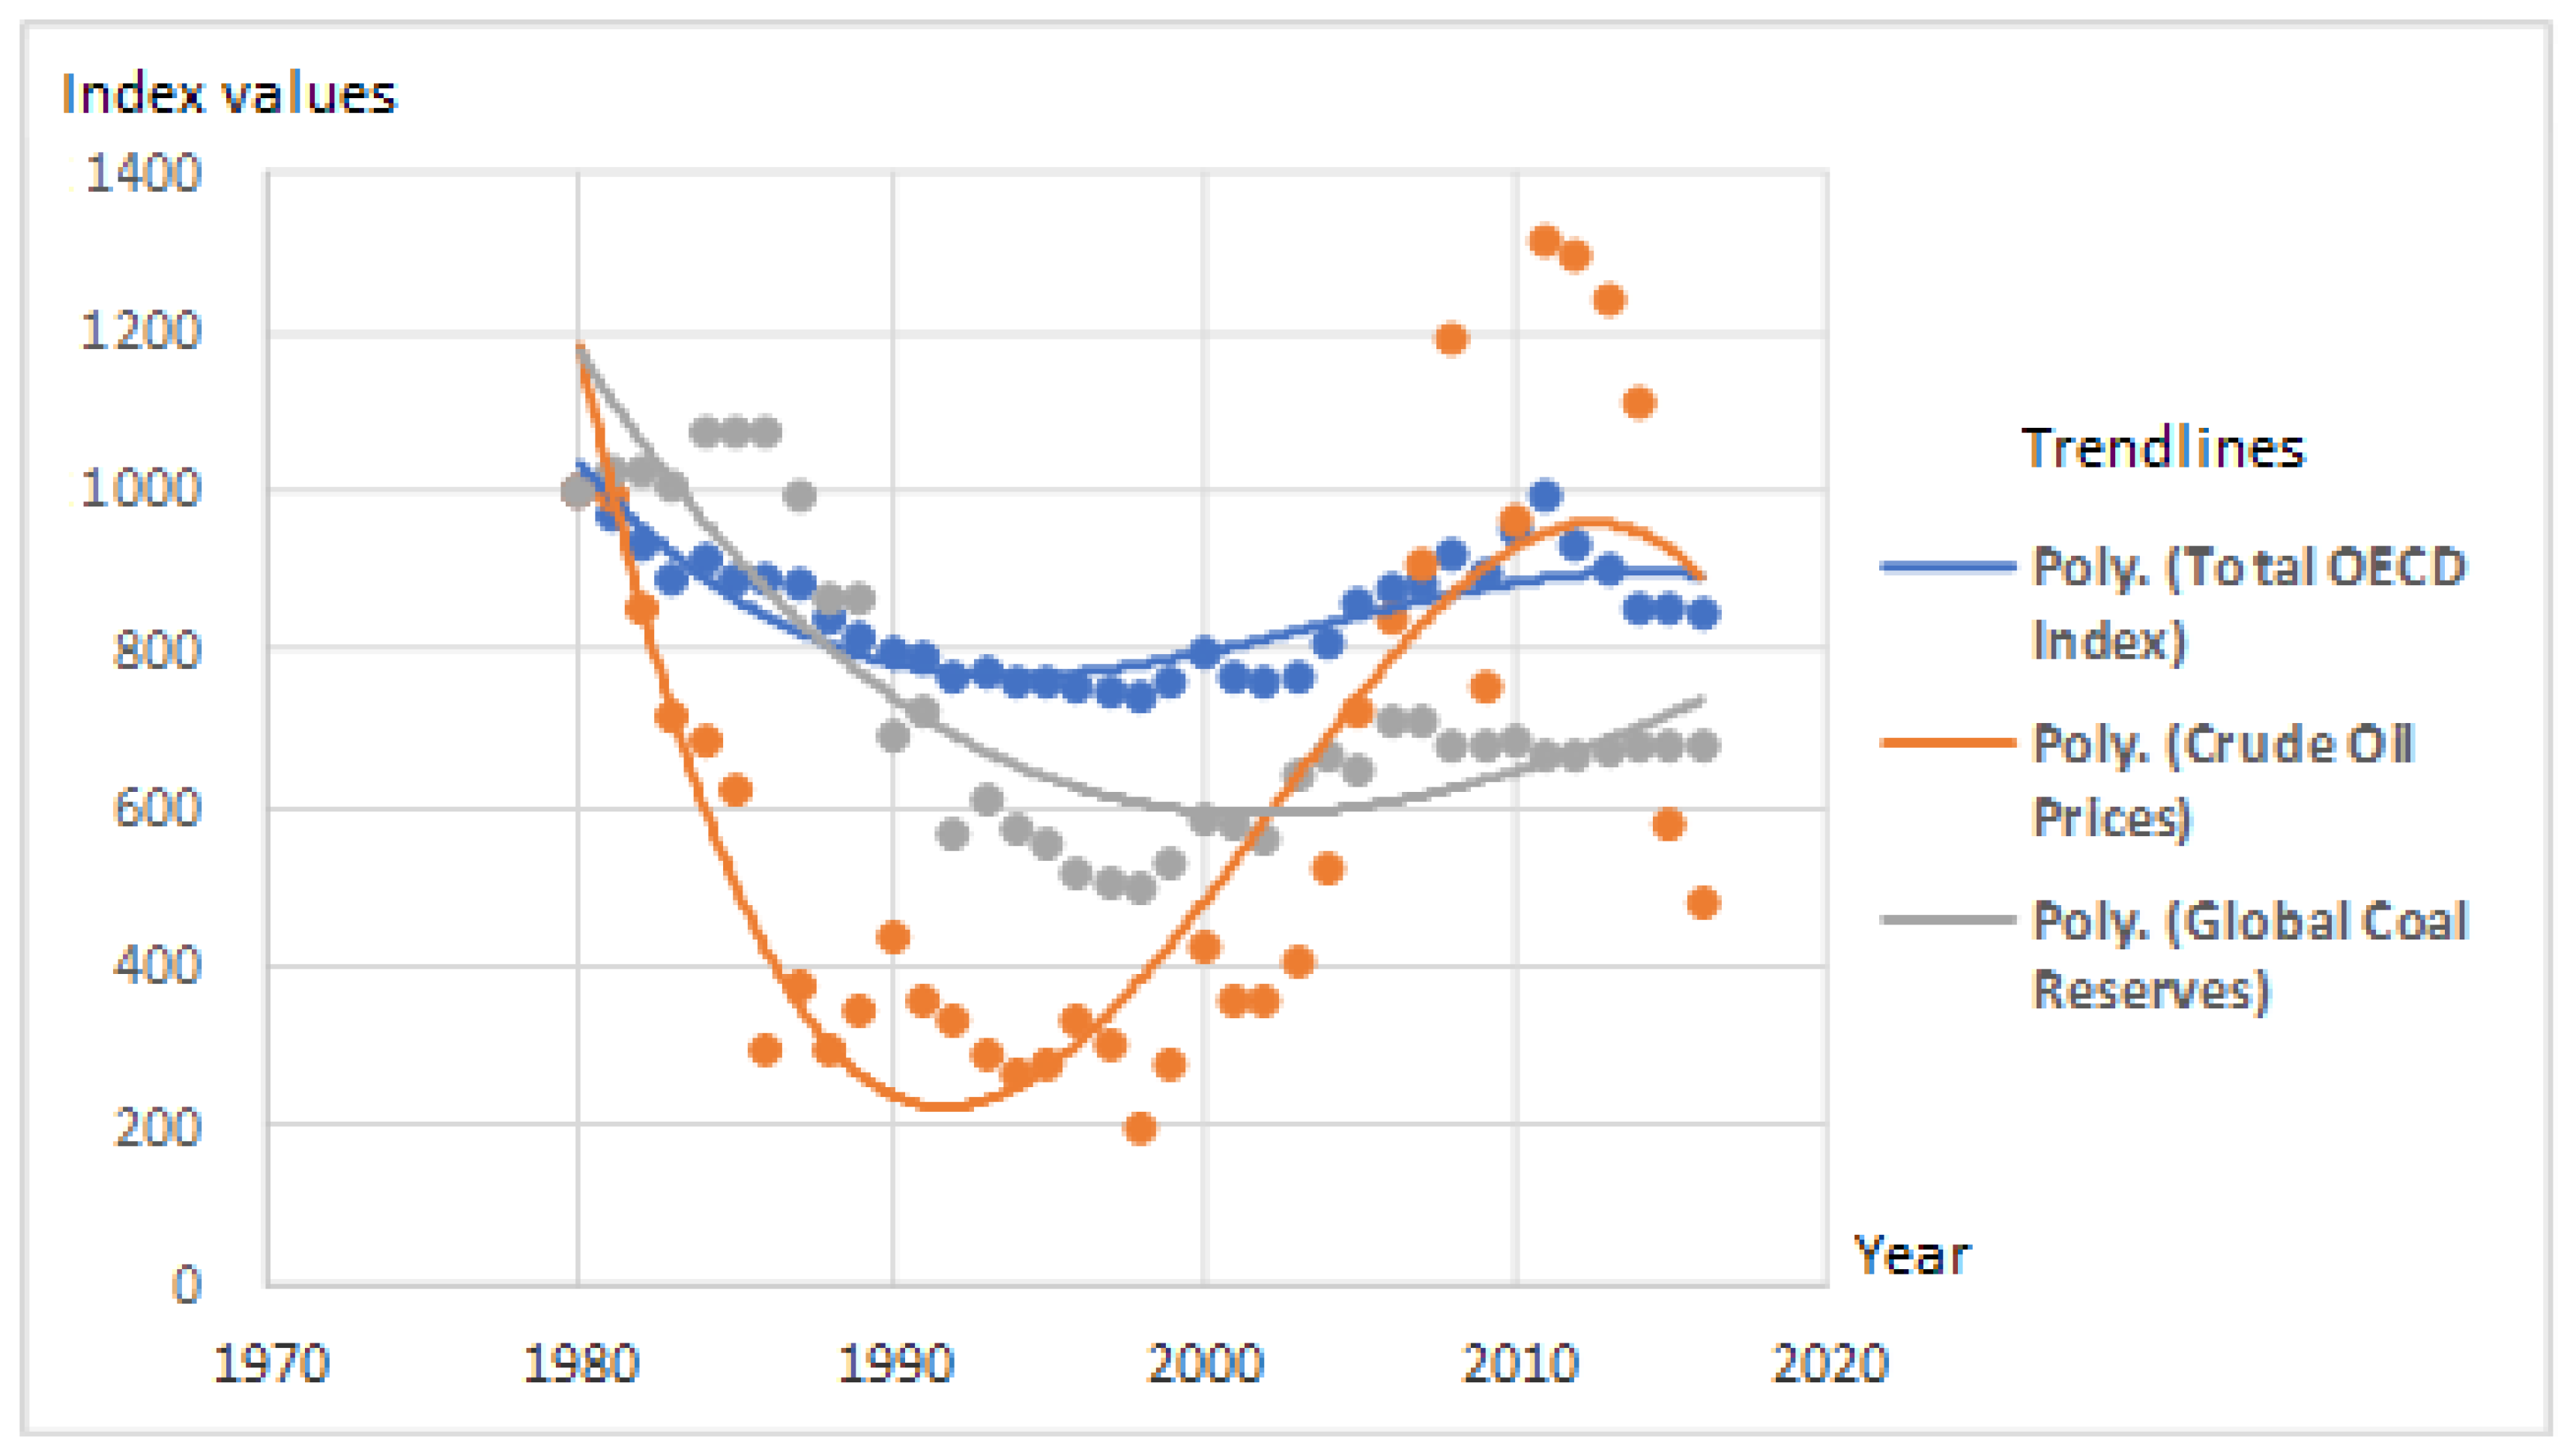
In the second step, the Global Coal Reserves variable was added to the model as the second most influential variable that contributes to the Index with an additional 22.1%. The review of two variables that affect almost 90% of the variance in the International Energy Security Risk Index is given in Figure 2.
Since Crude Oil Price Volatility, Oil Import Exposure, Non-carbon generation, Energy Expenditure Volatility, Fossil Fuel Import Expenditure per GDP, Energy Consumption per capita, Coal Import Exposure, Global Gas production are the variables of a completely different nature (in terms of the phenomena they describe, the ranges of values and units of measurement), the next step included calculation of a standardized beta coefficient that allows the variables to be compared in order to establish relative importance of the variable. The results that explain 100% of the model variance are shown in Table 2.
3.2. Principal Component Analysis
Principal component analysis (PCA) was used to verify the significance of the variables (criteria) extracted in stepwise regression analysis. Since this is also a correlation analysis, the unit value (1.0) is taken as the initial value for communalities for all variables. The iterative PCA procedure resulted in values for variables of significance (Extraction column). If the value is closer to 1, the variable is more relevant. The results of the analysis are presented in Table 3.
All 18 items in Table 3 are variables of significance for the International Energy Security Risk Index, which means that they can be used to determine the Index itself, but their combination is questionable at the moment. Out of the 18 variables tested, eight variables show a value greater than 0.900, approaching the value of 1, and are defined as very significant. These are Global Oil Production, Global Gas Production, Global Coal Production, Global Coal Reserves, Coal Import Exposure, Fossil Fuel Import Expenditure per GDP, Energy Expenditure Intensity, and Energy Expenditures per Capita. It is noticeable that the greatest significance is given to the group of variables referring to energy resources (oil, gas, and coal), as well as to the group of indicators showing energy expenditure. The highest individual degree of significance is recorded in the case of Fossil Fuel Import Expenditure per GDP (0.978). The lowest degree of significance is recorded by Retail Electricity Prices (0.495). It is important to note that the above results are an assessment of the need to use the variables in the Index itself, and not an assessment of their impact on the variance of the Index itself or an assessment of their interrelationship, which is the subject of further analysis.
In the next step of the principal component analysis, eigenvalues were calculated to check if there was a tendency for parameter grouping and to define the required number of factors for factor analysis. The results are shown in Table 4.
The proportion of variation explained by each eigenvalue is given for each variable (from 1 to 18). For the first variable, value 44.950 means that 44.950% of total variation is explained by this first eigenvalue.
In conducting the analysis shown in Table 4, a three-factor analysis was selected in accordance with the specifics of eigenvectors and their function in the analysis. Specifically, elements of eigenvectors are the weights of each variable observed, and the stated values are factor loadings. The largest eigenvalue associated with each of the eigenvectors provides a single indicator of the substantive importance of each variate (or component). The basic idea is to retain factors with relatively large eigenvalues and to ignore those with relatively small eigenvalues. A three-factor solution was selected in this particular case, because it is noticed that the decrease in the value of eigenvalues is the largest after the third one. It is also evident that 83% of total variance is explained by the three retained variables.
Finally, due to the assumption that there are some overlaps and that certain variables are contained in others (methodological error in this case), an analysis was performed of the relationship between standard macroeconomic indicator GDP per capita and seven selected indicators assumed to be significantly correlated (Crude_Oil_Prices, Crude Oil_Price_Volatility, Energy Expenditure Intensity, Energy_Expenditures_per_Capita, Energy Expenditure Volatility, Retail Electricity Prices, and World Oil Refinery Usage). The results are shown in Table 5.
Based on the results from Table 5 showing the relationship between the selected economic parameters, it is noticeable that GDP achieves statistically significant correlations with Crude_Oil_Prices, Crude Oil_Price_Volatility, World Oil Refinery Usage, Energy Expenditure Intensity, Energy Expenditure Volatility, Retail Electricity Prices. Moreover, positive direction of correlation indicates that countries with higher degree of Energy Expenditure Intensity, Energy Expenditure Volatility, and Retail Electricity Prices have higher GDP per capita, while the direction of correlation with World Oil Refinery Usage is negative (lower GDP per Capita is correlated with higher values of World Oil Refinery Usage). The abovementioned points to the need for revising the use of GDP and GDP-related indicators in this Index.
From the methodological point of view, or when observed through the need to use GDP per capita in the construction of the observed Index, it is evident that GDP per capita can be comprehensively explained by other economic parameters. This is also supported by the fact that the percentage of explained variance of GDP per capita against other mentioned factors is 99%.
3.3. Promax Oblique Rotation
In order to obtain a simpler data structure that the vector of 18 variables extracted by principal component analysis, factor analysis was performed according to Promax oblique rotation that provides more uniform distribution of variability and better understanding of the interdependence of variables. The structure of the results is shown in Table 6.
4. Discussion
The most significant regression finding is that the Crude Oil Prices explains 67.7% of the total variance of the Index tested. In other words, the stepwise method identified this parameter as crucial when creating the International Energy Security Risk Index. When it stands alone in the model, the multiple regression coefficient is R = 0.823, p = 0.000. In the next step of stepwise regression, the Global Coal Reserves variable was added to this most important parameter, thus obtaining the coefficient of determination R2 = 89.9%. Therefore, the Global Coal Reserves variable contributed with 22.1% to Index explanation, while the multiple regression coefficient stood at R = 0.948, p = 0.000. It follows from the above that two variables (Crude Oil Prices and Global Coal Reserves) explain 90% of the Index. Simply put, when establishing the Index, the Crude Oil Prices has by far the highest weighting coefficient and is followed by the Global Coal Reserves. This is also evident through their beta weights, that is, standardized weighting coefficients of 0.0711 and 0.483 in the model with both parameters.
The entire model, or explanation of the Index variance that stands at 100%, is obtained when the following is added to the two variables: Crude Oil Price Volatility, Oil Import Exposure, Non-carbon generation, Energy Expenditure volatility, Fossil Fuel Import Expenditure per GDP, Energy Consumption per capita, Coal Import Exposure, Global Gas production. When all these parameters are present in the analysis, a different distribution of weighting coefficients is observed. Crude Oil Prices retains the highest beta weight, that is, a standardized weighting ratio that reflects its importance. It is followed by Fossil Fuel Import Expenditure per GDP, Crude Oil Price Volatility and Global Gas production. As for this model, it is also observed that the Global Coal Reserves variable has almost insignificant beta weight (0.040). This leads to a complete loss of its importance which can be explained by the presence of other variables in which this indicator is contained.
In further processing of the stepwise regression analysis results the principal component analysis was performed to see if there was a tendency of variables to group. The principal component analysis showed that 17 out of the 29 parameters can be further considered. Communalities, obtained by using this method show high values (close to 1.0), which indicates that the extracted components represent the Index properly. Based on the obtained eigenvalues, the principal component analysis shows that 82.7% of the models are explained by three over-factors. These over-factors were used as three components in the Promax oblique rotation to confirm the validity of the process used to extract variables.
There are not a large number of studies aimed at comparison with the results presented in this paper, because a complete comparison would require the research to be conducted in the same sample of countries and in the same time period in order to assess the methodological setting of the Index.
Nevertheless, very important conclusions can be drawn from a comprehensive study that includes 63 energy security indices and presents an analysis of the number of indicators, data treatment, statistical coherence, uncertainty, sensitivity, and robustness analysis. When it comes to the number of observed variables, in the majority of research analyzed in this study (52%) the number of indicators is between 5 and 20, whereby the number of variables in this research is 29. In addition, in the analysis of statistical coherence the author points out that “only rarely is a multivariate analysis studied or at least reported. If a multivariate analysis is performed, then it usually is an assessment of the correlation and covariance values between indicators” [29]. Multivariate analysis was performed in only 10 studies, 10 of which were conducted in OECD countries (which is the subject of this study), but none of them were set so as to be fully compared with the results of this research, whether regarding the research goal, time frame, geographical coverage, and/or selection of variables.
However, the following results can be mentioned as indirect indicators of comparison between the results of this and similar research. They observe energy security as a combination of certain dimensions and, which is much more important for comparison with the results of this research, show whether and to what extent the said dimensions are related.
Edgard Gnansounou proposed a composite index of energy demand/supply weaknesses as a proxy of energy vulnerability [30]. The proposed index is based on the application of six individual indicators (energy intensity, oil and gas import dependency, CO2 content of primary energy supply, electricity supply weaknesses, and non-diversity in transport fuels), for which PCA was performed in order to establish the degree of significance of the selected variables. The results of this research show, in the given combination, that there is no adequate degree of significance of any of the selected indicators and that they do not significantly describe the given system, because all the obtained values are below 0.2. In a study that was conducted in the paper presenting an analysis of the International Energy Security Risk Index, eight variables show a value greater than 0.9, which indicates a high degree of their relevance and the need to include them in the Index itself. Regardless of the differences resulting from these two studies it is important to note that there are a large number of variables that can be used to assess energy security, and that further work is necessary to select them and to assess their combinations.
Similar research includes analysis of Energy Trilemma Index, developed by World Energy Council [31]. This Index consists of four basic dimensions: Country context, Energy equity, Energy sustainability, and Energy security. The results of the PCA analysis show, in this case, similarities with the results obtained from the analysis conducted in this paper. Specifically, the analysis of the Energy Trilemma Index shows, basically, that the four indicators making up this Index are relevant for use, but that they do not contribute equally to the consistency of the Index. Problems in the structure of the Index itself are evident in both papers. In the case of the Energy Trilemma Index, which consists of four variables, two of the variables have a high percentage of participation in variance; Country context (59.62%) and Energy equity (22.71%). In the case of the International Energy Security Risk Index, which consists of 29 variables, an almost identical result is obtained in terms of participation in variance. Specifically, in this case as well, two variables have very similar participation in variance: Crude Oil Prices (44.95%) and Global Coal Reserves (25.26%). From the above, it can be concluded that the selection of the number of variables is an important factor in conceiving any index for the quantification of energy security. In the case of the Index with four variables, as well as in the case of the index with 29 variables, only two variables explain 67.7% and 70.2% of the index variance, respectively.
In the research conducted for Japan, South Korea, Singapore, and Taiwan, three dimensions of energy security were used: Vulnerability, Efficiency, and Sustainability. The PCA results show that all variables are relevant for this index, and that individual variables have different degrees of significance in individual countries. Thus, Vulnerability is most significant in the case of Singapore (0.66), Efficiency in the case of Taiwan (0.650), and Sustainability in South Korea (0.880), which is also the highest registered correlation value [32].
A study conducted in 22 OECD member countries observes energy security through combination of four dimensions, with the results obtained. First of all, 21% of the variance is explained through the Environmental stewardship variable. It is followed by Supply availability (with high weights on oil and natural gas import dependence, as well as on-road fuel intensity), Energy and economic efficiency (with the largest factor loading on energy intensity and electricity use per capita), and Affordability (with high loadings on electricity and gasoline prices) [33]. A difference is noticeable in the case of the International Energy Security Risk Index analysis, because the two indicators (Crude oil prices and Global coal reserves) explain 90% of the Index variance, which is significantly greater than 21% explained through the Environmental stewardship. These are groups of indicators that are completely opposed (environment-related and oil-related). That is not saying much about reliability of the research, precisely because of the different selection of indicators. The question of the selection of indicators and their relationship here as well stands out as a question of particular importance for further research.
Finally, the above is followed by the results of research in Indonesia, defining energy security through five dimensions: Availability, Affordability, Accessibility, Acceptability, and Efficiency [34]. The Availability dimension explains 54% of the index variance. If taking into account that this indicator refers to the availability of energy resources, it can be said that the result is similar to result obtained in the International Energy Security Risk Index study, because oil- and coal-related variables contribute to the greatest extent to explanation of the index variance. The comparison is indirect, but it speaks in favor of the fact that indicators of the availability of energy resources are certainly the indicators of high importance.
Based on the results of this and similar research, recommendations can be defined to improve the methodology of development of indices for measuring energy security, as well as for their application in practice. First of all, more profound methodological verification of parameters making up the index is needed, primarily in terms of their essence and reliability. The number of indicators cannot be precisely determined, so their detailed assessment, and especially the assessment of the degree of their correlation, is much more desirable. It is further necessary to verify whether and to what extent individual indicators have an impact on the final result, independently or in certain combinations. Specifically, it is necessary to define indicators that are already contained in other indicators and to determine the ones that will be excluded from the index. It is certainly necessary to conduct more profound methodological verification and observation of the index by country, because it is possible that problems with overlapping variables occur only in some countries, and perhaps only in certain periods of time (geopolitical and other impacts). In addition, it is necessary to analyze the change in weight coefficients assigned to individual indicators and to solve the problem of multicollinearity.
Theoretically, it would be essential to develop a precise framework to define the phenomenon being measured (in this case, it is energy security). The problem here rests with impossibility to provide a unique definition of energy security. Therefore, it can be recommended to develop different approaches to energy security in certain countries, regions, and in certain periods of time, due to changing circumstances and priorities. Regardless of whether there will be a unique definition of energy security or several definitions, it is necessary to establish parameters based on which it can be measured, in order to assess the situation, predict future trends, and plan certain activities.
Since there is a problem of missing data in the data set in practice, it is necessary to emphasize this fact and to include the data in an adequate way, because the unresolved nature of this problem may give rise to misleading results. The selection of weight coefficients for individual indicators is another problem, which is approached differently (from assigning equal weight coefficients, to a completely subjective assessment). Reconsideration of weights is a complex task that requires a number of inputs, but it can be done. Certainly, the possibility that weight coefficients can and should be changed depending on the country for which they are determined, as well as depending on the specifics of a certain period of time, should not be dismissed.
Lastly, but most importantly, uncertainty, robustness, and sensitivity analyses need to be conducted to a greater extent, as these analyses greatly influence the assessment of reliability and build confidence of decision-makers and the general public in the accuracy of a particular index.
5. Conclusions
The main objective of this paper was to analyze models for quantification of energy security. The importance of energy security from the point of view of security and the development of every national economy and the global economy at large is indisputable. Energy security is coupled with interaction among a wide variety of factors that act differently at different times and in different places. In addition, the nature of certain factors is such that their significance changes over time and depends largely on the priorities of the national economy to which it refers at a given time. In order to achieve energy security, a number of countries are developing certain energy policies which they are implementing together with many other policies.
The fact that very few countries have energy resources and that energy consumption is constantly rising further complicates the already complex geopolitical relations, along with the introduction of sanctions and the existence of tensions of varying intensity, including armed conflicts.
Achieving energy security is largely the reason of and justification for making certain decisions, most of which have long-term consequences that are by no means limited to the energy sector. When making decisions, it is certainly advisable to use certain tools and techniques to support decision-making. Several methods for quantifying energy security have been developed so far and they are certainly useful for analysis or forecasting. However, they must be subject to methodological assessment in order to determine the reliability of these methods and to indicate the possibilities for their improvement.
The subject of this paper was the analysis of the model used to conceptualize the International Energy Security Risk Index, developed by the U.S. Chamber of Commerce. The analysis was conducted on the basis of a set of 29 input variables, in a sample of 25 OECD member countries, for the period 1980–2016. The basic stepwise regression results show that only two variables explain 90% of the variance of the Index: Crude Oil Prices and Global Coal Reserves. If 100% of the variance of the Index is explained, the Global Coal Reserves variable completely loses significance, which is an important indication that this variable is contained in other variables. It means that the variables used are of a general type and often contained in each other, which is methodologically unacceptable.
In addition, the analysis showed that 18 (out of 29) variables show a satisfactory degree of grouping, which is not the case for the remaining 12 variables: World Oil Refinery Usage, GDP per Capita, Energy Consumption per Capita, Energy Intensity, Petroleum Intensity, Electricity Diversity, Non-Carbon Generation, Transport Energy per Capita, Transport Energy Intensity, CO2 Emissions Trend, CO2 per Capita, and CO2 GDP Intensity. Thus, it can be said that the participation of these variables in the Index is questionable. It is noticeable that this set includes GDP and GDP-related variables, as well as variables related to transportation, electricity, and environmental issues. Based on all of the above, it can be highlighted that a revision of the International Energy Security Risk Index is necessary and highly recommended. In addition, research findings can be used in modeling the systems for forecasting energy security and energy policy in general.
Author Contributions
Conceptualization, I.P., G.Š., M.R., S.F. and P.Š.; methodology, M.R., G.Š. and S.F.; validation, I.P., G.Š., M.R., S.F. and P.Š.; formal analysis, G.Š.; investigation, I.P., M.R., S.F. and P.Š.; resources, I.P.; data curation, G.Š., M.R. and S.F.; writing—original draft preparation, I.P., G.Š., M.R., S.F. and P.Š.; writing—review and editing, I.P., G.Š., M.R., S.F. and P.Š.; supervision, M.R. and P.Š.; All authors have read and agreed to the published version of the manuscript.
Funding
This research received no external funding.
Acknowledgments
The second author was partially supported by Ministry of Science, Technological Development and Education Republic of Serbia (grant No. MTR 44007 III). The third author was partially supported by EU ERASMUS, Project reference: 599491-EPP-1-2018-1-RU-EPPJMO-PROJECT.
Conflicts of Interest
The authors declare no conflict of interest. The funders had no role in the design of the study; in the collection, analyses, or interpretation of data; in the writing of the manuscript, or in the decision to publish the results.
References
- Cherp, A.; Jewell, J. The concept of energy security: Beyond the four As. Energy Policy 2014, 75, 415–421. [Google Scholar] [CrossRef] [Green Version]
- Li, J.; Wang, L.; Li, T.; Zhu, S. Energy Security Pattern Spatiotemporal Evolution and Strategic Analysis of G20 Countries. Sustainability 2019, 11, 1629. [Google Scholar] [CrossRef] [Green Version]
- Sovacool, B.K.; Brown, M.A. Competing Dimensions of Energy Security: An International Perspective. Annu. Rev. Environ. Resour. 2010, 35, 77–108. [Google Scholar] [CrossRef] [Green Version]
- Siksnelyte, I.; Zavadskas, E.K.; Streimikiene, D.; Sharma, D. An Overview of Multi-Criteria Decision-Making Methods in Dealing with Sustainable Energy Development Issues. Energies 2018, 11, 2754. [Google Scholar] [CrossRef] [Green Version]
- Filipović, S.; Radovanović, M.; Golušin, V. Macroeconomic and political aspects of energy security. Renew. Sustain. Energy Rev. 2018, 97, 428–435. [Google Scholar] [CrossRef]
- Radovanović, M.; Filipović, S.; Golušin, V. Geo-economic approach to energy security measurement—Principal component analysis. Renew. Sustain. Energy Rev. 2018, 82, 1691–1700. [Google Scholar] [CrossRef]
- Zhang, Q.; Chen, J.C.H.; He, Y.Q.; Ma, J.; Zhou, D.N. Multiple attribute decision making: Approach integrating subjective and objective information. Int. J. Manuf. Technol. Manag. 2003, 5, 338–361. [Google Scholar] [CrossRef]
- Feng, X.; Feng, Q.; Li, S.; Hou, X.; Liu, S. A Deep-Learning-Based Oil-Well-Testing Stage Interpretation Model Integrating Multi-Feature Extraction Methods. Energies 2020, 13, 2042. [Google Scholar] [CrossRef] [Green Version]
- Zeng, S.; Garg, H.; Munir, M.; Mahmood, T.; Hussain, A. A Multi-Attribute Decision Making Process with Immediate Probabilistic Interactive Averaging Aggregation Operators of T-Spherical Fuzzy Sets and Its Application in the Selection of Solar Cells. Energies 2019, 12, 4436. [Google Scholar] [CrossRef] [Green Version]
- Sa, A.; Thollander, P.; Rafiee, M. Industrial Energy Management Systems and Energy-Related Decision-Making. Energies 2018, 11, 2784. [Google Scholar] [CrossRef] [Green Version]
- Azzuni, A.; Breyer, C. Definitions and dimensions of energy security: A literature review. Wires Energy Environ. 2018, 7, e268. [Google Scholar] [CrossRef]
- Gaudard, L.; Romerio, F. A Conceptual Framework to Classify and Manage Risk, Uncertainty and Ambiguity: An Application to Energy Policy. Energies 2020, 13, 1422. [Google Scholar] [CrossRef] [Green Version]
- Månsson, A.; Johansson, B.; Nilsson, L.J. Assessing energy security: An overview of commonly used methodologies. Energy 2014, 73, 1–14. [Google Scholar] [CrossRef] [Green Version]
- Global Energy Institute. US Chamber of Commerce, Washington DC. USA. Available online: https://www.globalenergyinstitute.org/ (accessed on 17 February 2020).
- Issues Monitor 2019, Global and Regional Perspectives; World Energy Council: London, UK, 2018.
- Dyer, H.; Trombetta, M.J. International Handbook of Energy Security; Edward Elgar Publishing: Cheltenham, UK, 2013. [Google Scholar]
- Ang, B.W.; Choong, W.L.; Ng, T.S. Energy security: Definitions, dimensions and indexes. Renew. Sustain. Energy Rev. 2015, 42, 1077–1093. [Google Scholar] [CrossRef]
- Sovacool, B.K. An international assessment of energy security performance. Ecol. Econ. 2013, 88, 148–158. [Google Scholar] [CrossRef]
- Szulecki, K. The Multiple Faces of Energy Security: An Introduction. In Energy Security in Europe: Divergent Perceptions and Policy Challenges; Szulecki, K., Ed.; Palgrave Macmillan: London, UK, 2017; pp. 1–14. Available online: https://0-link-springer-com.brum.beds.ac.uk/chapter/10.1007%2F978-3-319-64964-1_1 (accessed on 13 May 2020).
- Lobova, S.V.; Ragulina, J.V.; Bogoviz, A.V.; Alekseev, A.N. Energy security performance: A dataset on the member countries of the Commonwealth of Independent States, 2000–2014. Data Brief. 2019, 26, 104450. [Google Scholar] [CrossRef] [PubMed]
- International Index of Energy Security Risk, 2018 Edition. US Chamber of Commerce. Available online: https://www.globalenergyinstitute.org/sites/default/files/energyrisk_intl_2018.pdf (accessed on 4 April 2019).
- Index of U.S. Energy Security Risk, 2019 Edition. US Chamber of Commerce. Available online: https://www.globalenergyinstitute.org/sites/default/files/2019-12/023819_gei_us-esri-2019.pdf (accessed on 25 April 2020).
- US Energy International Energy Module of the National Energy Modeling System: Model Documentation 2018. US Energy Information Administration, June 2018. Available online: https://www.eia.gov/outlooks/aeo/nems/documentation/international/pdf/m071(2018).pdf (accessed on 22 April 2018).
- Zhang, Z. Variable selection with stepwise and best subset approaches. Ann. Transl. Med. 2016, 4, 136. [Google Scholar] [CrossRef] [Green Version]
- Desboulets, L.D.D. A Review on Variable Selection in Regression Analysis. Econometrics 2018, 6, 45. [Google Scholar] [CrossRef] [Green Version]
- Lever, J.; Krzywinski, M.; Altman, N. Points of significance: Principal component analysis. Nat. Methods 2017, 14, 641–642. [Google Scholar] [CrossRef] [Green Version]
- Jolliffee, I.T.; Cadima, J. Principal component analysis: A review and recent developments. Philos. Trans. Math. Phys. Eng. Sci. 2016, 374, 20150202. [Google Scholar] [CrossRef]
- Dien, J.; Khoe, W.; Mangun, G.R. Evaluation of PCA and ICA of Simulated ERPs: Promax vs. Infomax Rotations. Hum. Brain Mapp. 2007, 28, 742–763. [Google Scholar] [CrossRef] [PubMed]
- Gasser, P. A review on energy security indices to compare country performances. Energy Policy 2020, 139, 111339. [Google Scholar] [CrossRef]
- Gnansounou, E. Assessing the energy vulnerability: Case of industrialised countries. Energy Policy 2008, 36, 3734–3744. [Google Scholar] [CrossRef]
- Šprajc, P.; Bjegović, M.; Vasić, B. Energy security in decision making and governance—Methodological analysis of energy trilemma index. Renew. Sustain. Energy Rev. 2019, 114, 109341. [Google Scholar] [CrossRef]
- Li, Y.; Shi, X.; Yao, L. Evaluating energy security of resource-poor economies: A modified principle component analysis approach. Energy Econ. 2016, 58, 211–221. [Google Scholar] [CrossRef]
- Brown, M.A.; Wang, Y.; Sovacool, B.K.; D’Agostino, A.L. Forty years of energy security trends: A comparative assessment of 22 industrialized countries. Energy Res. Soc. Sci. 2014, 4, 64–77. [Google Scholar] [CrossRef]
- Erahman, Q.F.; Purwanto, W.W.; Sudibandriyo, M.; Hidayatno, A. An assessment of Indonesia’s energy security index and comparison with seventy countries. Energy 2016, 111, 364–376. [Google Scholar] [CrossRef]
Figure 1.
Model applied in the research.

Figure 2.
Average values for OECD International Energy Security Risk Index, Global Coal Reserves, and Crude Oil Prices (1980–2016).
Figure 2.
Average values for OECD International Energy Security Risk Index, Global Coal Reserves, and Crude Oil Prices (1980–2016).


Table 1.
International Energy Security Risk Index—stepwise regression analysis (90% of model variance).
Table 1.
International Energy Security Risk Index—stepwise regression analysis (90% of model variance).
| Model | R | R Square | Adjusted R Square | Std. Error of the Estimate | Change Statistics | ||||
|---|---|---|---|---|---|---|---|---|---|
| R Square Change | F Change | df1 | df2 | Sig. F Change | |||||
| 1 | 0.823 a | 0.677 | 0.668 | 43.66791 | 0.677 | 73.498 | 1 | 35 | 0.000 |
| 2 | 0.948 b | 0.899 | 0.893 | 24.82582 | 0.221 | 74.289 | 1 | 34 | 0.000 |
| 3 | 0.986 c | 0.972 | 0.970 | 13.14913 | 0.074 | 88.197 | 1 | 33 | 0.000 |
| 4 | 0.996 d | 0.992 | 0.991 | 7.15074 | 0.020 | 79.585 | 1 | 32 | 0.000 |
| 5 | 0.997 e | 0.993 | 0.992 | 6.71278 | 0.001 | 5.312 | 1 | 31 | 0.028 |
| 6 | 0.997 f | 0.995 | 0.994 | 6.03990 | 0.001 | 8.292 | 1 | 30 | 0.007 |
| 7 | 0.998 g | 0.996 | 0.995 | 5.52016 | 0.001 | 6.915 | 1 | 29 | 0.014 |
| 8 | 0.998 h | 0.997 | 0.996 | 4.87854 | 0.001 | 9.130 | 1 | 28 | 0.005 |
| 9 | 0.999 i | 0.998 | 0.997 | 4.28414 | 0.001 | 9.309 | 1 | 27 | 0.005 |
| 10 | 0.999 j | 0.999 | 0.998 | 3.04324 | 0.001 | 27.508 | 1 | 26 | 0.000 |
| 11 | 0.999 k | 0.999 | 0.998 | 3.00801 | 0.000 | 0.378 | 1 | 26 | 0.544 |
| 12 | 1.000 l | 0.999 | 0.999 | 2.71145 | 0.000 | 7.229 | 1 | 26 | 0.012 |
| 13 | 1.000 m | 1.000 | 0.999 | 1.85113 | 0.001 | 30.783 | 1 | 25 | 0.000 |
| 14 | 1.000 n | 1.000 | 1.000 | 1.64169 | 0.000 | 7.785 | 1 | 24 | 0.010 |
| 15 | 1.000 o | 1.000 | 1.000 | 1.51024 | 0.000 | 5.360 | 1 | 23 | 0.030 |
| 16 | 1.000 p | 1.000 | 1.000 | 1.48003 | 0.000 | 0.049 | 1 | 23 | 0.826 |
| 17 | 1.000 q | 1.000 | 1.000 | 1.46420 | 0.000 | 0.468 | 1 | 24 | 0.500 |
Different combinations of variables were used in the analysis: a. Predictors: (Constant), Crude_Oil_Prices; b. Predictors: (Constant), Crude_Oil_Prices, Global_Coal_Reserves; c. Predictors: (Constant), Crude_Oil_Prices, Global_Coal_Reserves, Crude_Oil_Price_Volatility; d. Predictors: (Constant), Crude_Oil_Prices, Global_Coal_Reserves, Crude_Oil_Price_Volatility, Oil_Import_Exposure; e. Predictors: (Constant), Crude_Oil_Prices, Global_Coal_Reserves, Crude_Oil_Price_Volatility, Oil_Import_Exposure, Non_Carbon_Generation; f. Predictors: (Constant), Crude_Oil_Prices, Global_Coal_Reserves, Crude_Oil_Price_Volatility, Oil_Import_Exposure, Non_Carbon_Generation, Energy_Expenditure_Volatility; g. Predictors: (Constant), Crude_Oil_Prices, Global_Coal_Reserves, Crude_Oil_Price_Volatility, Oil_Import_Exposure, Non_Carbon_Generation, Energy_Expenditure_Volatility, Fossil_Fuel_Import_Expenditure_per_GDP; h. Predictors: (Constant), Crude_Oil_Prices, Global_Coal_Reserves, Crude_Oil_Price_Volatility, Oil_Import_Exposure, Non_Carbon_Generation, Energy_Expenditure_Volatility, Fossil_Fuel_Import_Expenditure_per_GDP, Energy_Consumption_per_Capita.; i. Predictors: (Constant), Crude_Oil_Prices, Global_Coal_Reserves, Crude_Oil_Price_Volatility, Oil_Import_Exposure, Non_Carbon_Generation, Energy_Expenditure_Volatility, Fossil_Fuel_Import_Expenditure_per_GDP, Energy_Consumption_per_Capita, Coal_Import_Exposure; j. Predictors: (Constant), Crude_Oil_Prices, Global_Coal_Reserves, Crude_Oil_Price_Volatility, Oil_Import_Exposure, Non_Carbon_Generation, Energy_Expenditure_Volatility, Fossil_Fuel_Import_Expenditure_per_GDP, Energy_Consumption_per_Capita, Coal_Import_Exposure, Global_Gas_Production; k. Predictors: (Constant), Crude_Oil_Prices, Crude_Oil_Price_Volatility, Oil_Import_Exposure, Non_Carbon_Generation, Energy_Expenditure_Volatility, Fossil_Fuel_Import_Expenditure_per_GDP, Energy_Consumption_per_Capita, Coal_Import_Exposure, Global_Gas_Production; l. Predictors: (Constant), Crude_Oil_Prices, Crude_Oil_Price_Volatility, Oil_Import_Exposure, Non_Carbon_Generation, Energy_Expenditure_Volatility, Fossil_Fuel_Import_Expenditure_per_GDP, Energy_Consumption_per_Capita, Coal_Import_Exposure, Global_Gas_Production, Transport_Energy_Intensity; m. Predictors: (Constant), Crude_Oil_Prices, Crude_Oil_Price_Volatility, Oil_Import_Exposure, Non_Carbon_Generation, Energy_Expenditure_Volatility, Fossil_Fuel_Import_Expenditure_per_GDP, Energy_Consumption_per_Capita, Coal_Import_Exposure, Global_Gas_Production, Transport_Energy_Intensity, Gas_Import_Exposure; n. Predictors: (Constant), Crude_Oil_Prices, Crude_Oil_Price_Volatility, Oil_Import_Exposure, Non_Carbon_Generation, Energy_Expenditure_Volatility, Fossil_Fuel_Import_Expenditure_per_GDP, Energy_Consumption_per_Capita, Coal_Import_Exposure, Global_Gas_Production, Transport_Energy_Intensity, Gas_Import_Exposure, Energy_Expenditures_per_Capita; o. Predictors: (Constant), Crude_Oil_Prices, Crude_Oil_Price_Volatility, Oil_Import_Exposure, Non_Carbon_Generation, Energy_Expenditure_Volatility, Fossil_Fuel_Import_Expenditure_per_GDP, Energy_Consumption_per_Capita, Coal_Import_Exposure, Global_Gas_Production, Transport_Energy_Intensity, Gas_Import_Exposure, Energy_Expenditures_per_Capita, Transport_Energy_per_Capita; p. Predictors: (Constant), Crude_Oil_Prices, Crude_Oil_Price_Volatility, Oil_Import_Exposure, Energy_Expenditure_Volatility, Fossil_Fuel_Import_Expenditure_per_GDP, Energy_Consumption_per_Capita, Coal_Import_Exposure, Global_Gas_Production, Transport_Energy_Intensity, Gas_Import_Exposure, Energy_Expenditures_per_Capita, Transport_Energy_per_Capita; q. Predictors: (Constant), Crude_Oil_Prices, Crude_Oil_Price_Volatility, Oil_Import_Exposure, Energy_Expenditure_Volatility, Energy_Consumption_per_Capita, Coal_Import_Exposure, Global_Gas_Production, Transport_Energy_Intensity, Gas_Import_Exposure, Energy_Expenditures_per_Capita, Transport_Energy_per_Capita.
Table 2.
International Energy Security Risk Index—standardized beta coefficient (100% of model variance).
Table 2.
International Energy Security Risk Index—standardized beta coefficient (100% of model variance).
| Variables | Standardized Coefficients |
|---|---|
| Beta | |
| Crude_Oil_Prices | 0.319 |
| Global_Coal_Reserves | 0.040 |
| Crude_Oil_Price_Volatility | 0.251 |
| Oil_Import_Exposure | 0.109 |
| Non_Carbon_Generation | −0.080 |
| Energy_Expenditure_Volatility | 0.152 |
| Fossil_Fuel_Import_Expenditure_per_GDP | 0.299 |
| Energy_Consumption_per_Capita | 0.093 |
| Coal_Import_Exposure | 0.148 |
| Global_Gas_Production | 0.248 |
Table 3.
International Energy Security Risk Index—communalities.
| Variables | Initial | Extraction |
|---|---|---|
| Global_Oil_Reserves | 1.000 | 0.730 |
| Global_Oil_Production | 1.000 | 0.926 |
| Global_Gas_Reserves | 1.000 | 0.756 |
| Global_Gas_Production | 1.000 | 0.907 |
| Global_Coal_Reserves | 1.000 | 0.934 |
| Global_Coal_Production | 1.000 | 0.957 |
| Oil_Import_Exposure | 1.000 | 0.834 |
| Gas_Import_Exposure | 1.000 | 0.760 |
| Coal_Import_Exposure | 1.000 | 0.934 |
| Total_Energy_Import_Exposure | 1.000 | 0.766 |
| Fossil_Fuel_Import_Expenditure_per_GDP | 1.000 | 0.978 |
| Energy_Expenditure_Intensity | 1.000 | 0.956 |
| Energy_Expenditures_per_Capita | 1.000 | 0.929 |
| Retail_Electricity_Prices | 1.000 | 0.495 |
| Crude_Oil_Prices | 1.000 | 0.887 |
| Crude_Oil_Price_Volatility | 1.000 | 0.642 |
| Energy_Expenditure_Volatility | 1.000 | 0.621 |
| World_Oil_Refinery_Usage | 1.000 | 0.865 |
Extraction method: principal component analysis.
Table 4.
International Energy Security Risk Index—eigenvalues and loadings manipulation.
| Component | Initial Eigenvalues | Extraction Sums of Squared Loadings | Rotation Sums of Squared Loadings | ||||
|---|---|---|---|---|---|---|---|
| Total | % of Variance | Cumulative % | Total | % of Variance | Cumulative % | Total | |
| 1 | 8.091 | 44.950 | 44.950 | 8.091 | 44.950 | 44.950 | 6.429 |
| 2 | 4.546 | 25.256 | 70.206 | 4.546 | 25.256 | 70.206 | 5.213 |
| 3 | 2.241 | 12.452 | 82.659 | 2.241 | 12.452 | 82.659 | 6.286 |
| 4 | 1.341 | 7.449 | 90.108 | ||||
| 5 | 0.666 | 3.700 | 93.808 | ||||
| 6 | 0.490 | 2.725 | 96.532 | ||||
| 7 | 0.210 | 1.165 | 97.698 | ||||
| 8 | 0.175 | 0.975 | 98.672 | ||||
| 9 | 0.103 | 0.573 | 99.246 | ||||
| 10 | 0.064 | 0.356 | 99.601 | ||||
| 11 | 0.035 | 0.195 | 99.796 | ||||
| 12 | 0.014 | 0.080 | 99.876 | ||||
| 13 | 0.009 | 0.050 | 99.926 | ||||
| 14 | 0.005 | 0.027 | 99.952 | ||||
| 15 | 0.004 | 0.023 | 99.976 | ||||
| 16 | 0.002 | 0.013 | 99.988 | ||||
| 17 | 0.002 | 0.010 | 99.999 | ||||
| 18 | 0.000 | 0.001 | 100.000 | ||||
Extraction method: principal component analysis. When components are correlated, sums of squared loadings cannot be added to obtain a total variance.
Table 5.
Correlation between GDP per capita and selected variables.
| Model | R | R Square | Adjusted R Square | Std. Error of the Estimate |
|---|---|---|---|---|
| 1 | 0.994 a | 0.989 | 0.986 | 9.65230 |
a. Predictors: (Constant): Crude_Oil_Prices, Crude Oil_Price_Volatility, Energy Expenditure Intensity, Energy_Expenditures_per_Capita, Energy Expenditure Volatility, Retail Electricity Prices, and World Oil Refinery Usage.
Table 6.
International Energy Security Risk Index—Promax oblique rotation.
| Variable | Component | ||
|---|---|---|---|
| 1 | 2 | 3 | |
| Global_Gas_Production | 0.988 | ||
| Total_Energy_Import_Exposure | −0.961 | ||
| Global_Gas_Reserves | 0.911 | ||
| Global_Coal_Reserves | 0.781 | 0.310 | |
| Global_Oil_Production | 0.713 | 0.375 | |
| World_Oil_Refinery_Usage | −0.615 | −0.473 | |
| Retail_Electricity_Prices | 0.442 | 0.309 | |
| Coal_Import_Exposure | 0.320 | 0.928 | |
| Global_Coal_Production | −0.316 | 0.919 | |
| Energy_Expenditures_per_Capita | 0.824 | 0.453 | |
| Gas_Import_Exposure | 0.800 | −0.549 | |
| Crude_Oil_Prices | 0.788 | 0.465 | |
| Global_Oil_Reserves | −0.765 | ||
| Crude_Oil_Price_Volatility | 0.743 | ||
| Fossil_Fuel_Import_Expenditure_per_GDP | 1.050 | ||
| Oil_Import_Exposure | 0.947 | ||
| Energy_Expenditure_Intensity | 0.838 | ||
| Energy_Expenditure_Volatility | 0.553 | ||
© 2020 by the authors. Licensee MDPI, Basel, Switzerland. This article is an open access article distributed under the terms and conditions of the Creative Commons Attribution (CC BY) license (http://creativecommons.org/licenses/by/4.0/).
Share and Cite
MDPI and ACS Style
Podbregar, I.; Šimić, G.; Radovanović, M.; Filipović, S.; Šprajc, P. International Energy Security Risk Index—Analysis of the Methodological Settings. Energies 2020, 13, 3234. https://0-doi-org.brum.beds.ac.uk/10.3390/en13123234
AMA Style
Podbregar I, Šimić G, Radovanović M, Filipović S, Šprajc P. International Energy Security Risk Index—Analysis of the Methodological Settings. Energies. 2020; 13(12):3234. https://0-doi-org.brum.beds.ac.uk/10.3390/en13123234
Chicago/Turabian StylePodbregar, Iztok, Goran Šimić, Mirjana Radovanović, Sanja Filipović, and Polona Šprajc. 2020. "International Energy Security Risk Index—Analysis of the Methodological Settings" Energies 13, no. 12: 3234. https://0-doi-org.brum.beds.ac.uk/10.3390/en13123234
Note that from the first issue of 2016, this journal uses article numbers instead of page numbers. See further details here.