1. Introduction
Operational losses are involved in all three major blocks (generations, transmission, and distribution) of the power system [
1]. Unlike the generation side, where the losses are technically defined, the losses at the Transmission and Distribution (T&D) side of the power system cannot be calculated precisely [
2]. This is because of the reason that the T&D involves several non-technical energy losses in addition to the technical ones. Technical losses account for power dissipation in various power system elements like transmission lines, transformers, electrical appliances, switches and many other power system components. These losses can be easily calculated by measuring only two parameters; the total load on the grid and the total bill of the consumed energy [
3]. On the other hand, the non-technical losses account for billing errors, low quality of infrastructure, malfunctioning of equipment, supply without the metering device and illegal activities of consumers like theft, corruption and organized crime [
4]. As compared to the technical losses, the non-technical losses are very difficult to predict and hence their minimization is one of the major concerns for any Power Distribution Company (PDC). The problem is so severe that in most extreme cases, almost half of the total electrical power generated is converted into NTLs; thus, causing billions of dollars in loss per year [
5]. On average, the utility companies around the world lost 25 billion dollars per annum due to theft of electricity [
6]. The mentioned problem is present in almost all the countries; however, its effects are more damaging in under-developed countries than that of the same in developed ones. For example, for the utilities in Pakistan, the T&D losses were recorded as 17.5% for the year 2017–2018 which are causing huge damage to the feeble economy of the country and are much higher than other Asian countries as in China and Korea T&D losses were record as 8% and 3.6% respectively. It is estimated that 33% of the total T&D losses in the electrical system of the country accounts for NTL losses [
7].
Generally, for detecting the NTLs, the PDCs used to undertake an inspection of metering devices based on the observations obtained from the random assessment of consumers billing profiles. Since the behavior of the consumers’ consumption pattern is not taken into consideration during the detection process, the success rate of such random inspections is very low. Furthermore, the randomized nature of the mentioned process makes it ineffective and inefficient method of theft detection as only random bills are being selected for checking purpose while many are left as unobserved. Another major drawback of this method is that it is very costly and time-consuming [
8]. This is due to the fact that the distribution feeders in developing countries supply a huge number of consumers and are generally very long in length. Most recently, the smart meters with dedicated communication links have emerged as one of the most viable solutions for the effective detection of NTLs. However, their installation and operating cost involve billions of dollars, which makes it an unfeasible choice for many developing nations like Pakistan [
9]. Despite being one of the major threats to the economy of the country, there is not any significant research work on NTL detection in PDCs of Pakistan, thus becomes the core motivation of the current research work.
This paper proposes an AI-based method called Boosted C5.0 DT for energy theft detection. For the very first time in literature as per the best of authors’ knowledge, a novel feature extraction and feature selection-based process for providing insightful information about the energy usage behavior of the customers is adopted. The mentioned process helps to classify the healthy and fraudster consumers effectively and hence enhance the detection rate, which in turn saves the inspection time, effort and expenses.
The proposed feature-based Boosted C5.0 classification approach uses the energy consumption data from the MEPCO Multan, Pakistan, to classify the fraudster and honest customer. Although, as explained previously, multiple factors add to NTLs, unlike the previous research works, which consider the sudden deviation in energy consumption as the only indication of fraud, this research work considers the feature-based analysis, which provides superior and realistic results as validated by the outcomes of this study. At the final stage of the proposed method, the shortlisted fraudster consumers need to be inspected on-site to catch the perpetrators effectively. The record of possible fraudulent customers generated will be used afterward for the physical inspection. The proposed scheme is expected to considerably enhance the NTL detection rate for Power utilities and will reduce their operational expense by preventing frequent on-site physical inspections.
The rest of the paper is divided into five main sections;
Section 2 provides the basics and the recent development in the studied area of research. The methodology for carrying out the current NTL detection using the proposed method is detailly discussed in
Section 3.
Section 4 presents the outcomes of the study, while
Section 5 provides the conclusion of the same.
2. Related Work in Literature
NTL detection has been one of the major concerns for the DSOs. Considerable research has been carried out in literature in order to avoid its adverse effects on the economy and sustainability of the power utilities. The existing solutions for NTL detection can be generally classified into hardware and non-hardware-based solutions [
10]. The former technique mainly utilizes special metering equipment like smart meter for electricity theft detection. The main drawback of these hardware-based solutions is that the capital involved in installing this smart metering equipment is quite high. Furthermore, the maintenance of such devices is complex and hence requires skilled staff to accomplish the mentioned job. As such this research work proposes a non-hardware-based solution for NTL detection; therefore, in current research work, the latest developments regarding the mentioned NTL detection technique have been thoroughly reviewed and presented to highlight the importance of the current study.
Jokar et al. [
11] proposed a model in which the energy consumption of every customer is calculated in the neighborhood by the transformer meter. Later, the SVM model is trained using the historical consumption of every consumer to differentiate between the honest and the fraudster customer. Nagi et al. [
12] trained the SVM model by utilizing features like monthly consumption data and creditworthiness rating to classify fraudulent and honest customers. A Fuzzy Inference System (FIS) was used along with SVM to increase the detection rate in the previous work [
13]. Nizar et al. [
14] used the Online Sequential Extreme Learning Machine (OS-ELM) for identifying NTL activities. Costa et al. [
15] used Artificial Neural Networks (ANN) for NTL detection. The authors utilized the customer’s energy consumption data to form a database and then utilized an ANN-based scheme to classify the customers as honest or fraudsters. Glauner et al. [
16] used Boolean rules, SVM and fuzzy logic to identify the NTL behavior. The authors used 12 months of energy consumption data for training the algorithm. They further improved the performance of the proposed classifier by adding features like geographic location and inspection notes to compute the NTL in the neighborhood. Guerrero et al. [
8] used two coordinate modules to improve the detection rate. Text mining and ANN were utilized in the first module for customer filtering, while Classification and Regression (C&R) trees and Self-Organizing Map (SOM) neural networks were used in the second module. Leite et al. [
17] proposed a multivariate control chart to identify the NTL caused by different types of cyber-attacks. Furthermore, the Star algorithm was used at the later stage to trace the fraudster consumer’s location.
Buzau et al. [
18] proposed the XGBoost algorithm that uses auxiliary databases along with the smart meter dataset to detect NTL. Tariq et al. [
4] proposed a Stochastic Petri net formalism to identify the location of NTL in grid-tied microgrids. The disturbance in the value of the resistance above a certain threshold triggers the arc and consequently, the Meter Data Management System (MDMS) detects the fraud using data obtained from the tempered meter. In reference [
19], the authors proposed a Gradient Boosting Theft Detector (GBTD) method based on three different boosting classifiers i.e., Light Gradient Boosting (LGBoost), Categorical Boosting (CatBoost) and Extreme Gradient Boosting (XGBoost). Weckx et al. [
20] proposed a linear model for NTL detection using voltage and power measurements. Zheng et al. [
21] proposed a wide and deep convolutional neural network model to analyze the NTL in the smart grids. The proposed technique was shown to outperform other existing methods like SVM, Linear Regression (LR), RF and ANN. In reference [
22], the authors proposed a novel correlation analysis-based scheme to tackle the NTL problem. The main advantage of the proposed scheme is that it does not require labelled data for training of the model. Halabi et al. [
23] developed a cost-effective NTL detection method that can identify the energy stealers in real-time without any time delay. The proposed scheme preserves the privacy of energy consumers by removing the high-resolution data of instantaneous power.
Kim et al. [
24] proposed an intermediate monitor meter-based model to identify NTL by analyzing the power flow. Gao et al. [
25] developed a physically inspired data-driven model that relied on the energy usage and voltage data obtained from smart meters. The proposed scheme detects NTL behavior by developing a linear relationship between the voltage magnitude and power consumption. In reference [
26], the authors proposed a suspicion assessment-based inspection algorithm to avoid unnecessary inspections. The energy behavior of the users is completely analyzed by accessing the difference between the predicted and the reported consumption. In another study, Messinis et al. [
27] developed a model that uses voltage sensitivity, power system optimization and SVM for accurately identifying NTL in the distribution grid. Massaferro et al. [
28] proposed RF for NTL detection. The experimental results of the proposed scheme showed that machine learning algorithms can drastically improve the economic returns. In another study, Nabil et al. [
29] proposed a privacy-preserving energy theft detection method for Advanced Metering Infrastructure (AMI) network. The scheme utilizes a secret sharing method to allow the energy costumers to send the masked reading to system operators for monitoring and billing purpose.
Compared to previous methods, our work differentiates itself by:
Exploring a state-of-the-art methodology for NTL detection using C5.0 DT.
The boosting technique has been utilized to substantially enhances the classifying capability of the proposed NTL detection model as validated by the outcomes of this study.
Pearson’s Chi-square algorithm-based feature selection method has been adopted to select the most relevant features; thus, reducing the complexity of the proposed theft detection model.
The current research work utilizes all the known performance metrics to thoroughly assess the performance of the proposed classifier and its comparison with the other state-of-the-art machine learning algorithms.
The experimental results show that our proposed methodology outperforms all state-of-the-art machine learning algorithms in term of classification Accuracy, Sensitivity, Specificity, Precision, F1 score, and AUC.
Furthermore, to the best of our knowledge, this is the first-ever methodological study that uses the conventional meters dataset from DSOs of Pakistan. Thus, the current research work is expected to be very beneficial for NTL detection in all the conventional meter scenarios.
3. Methodology and Detection Framework
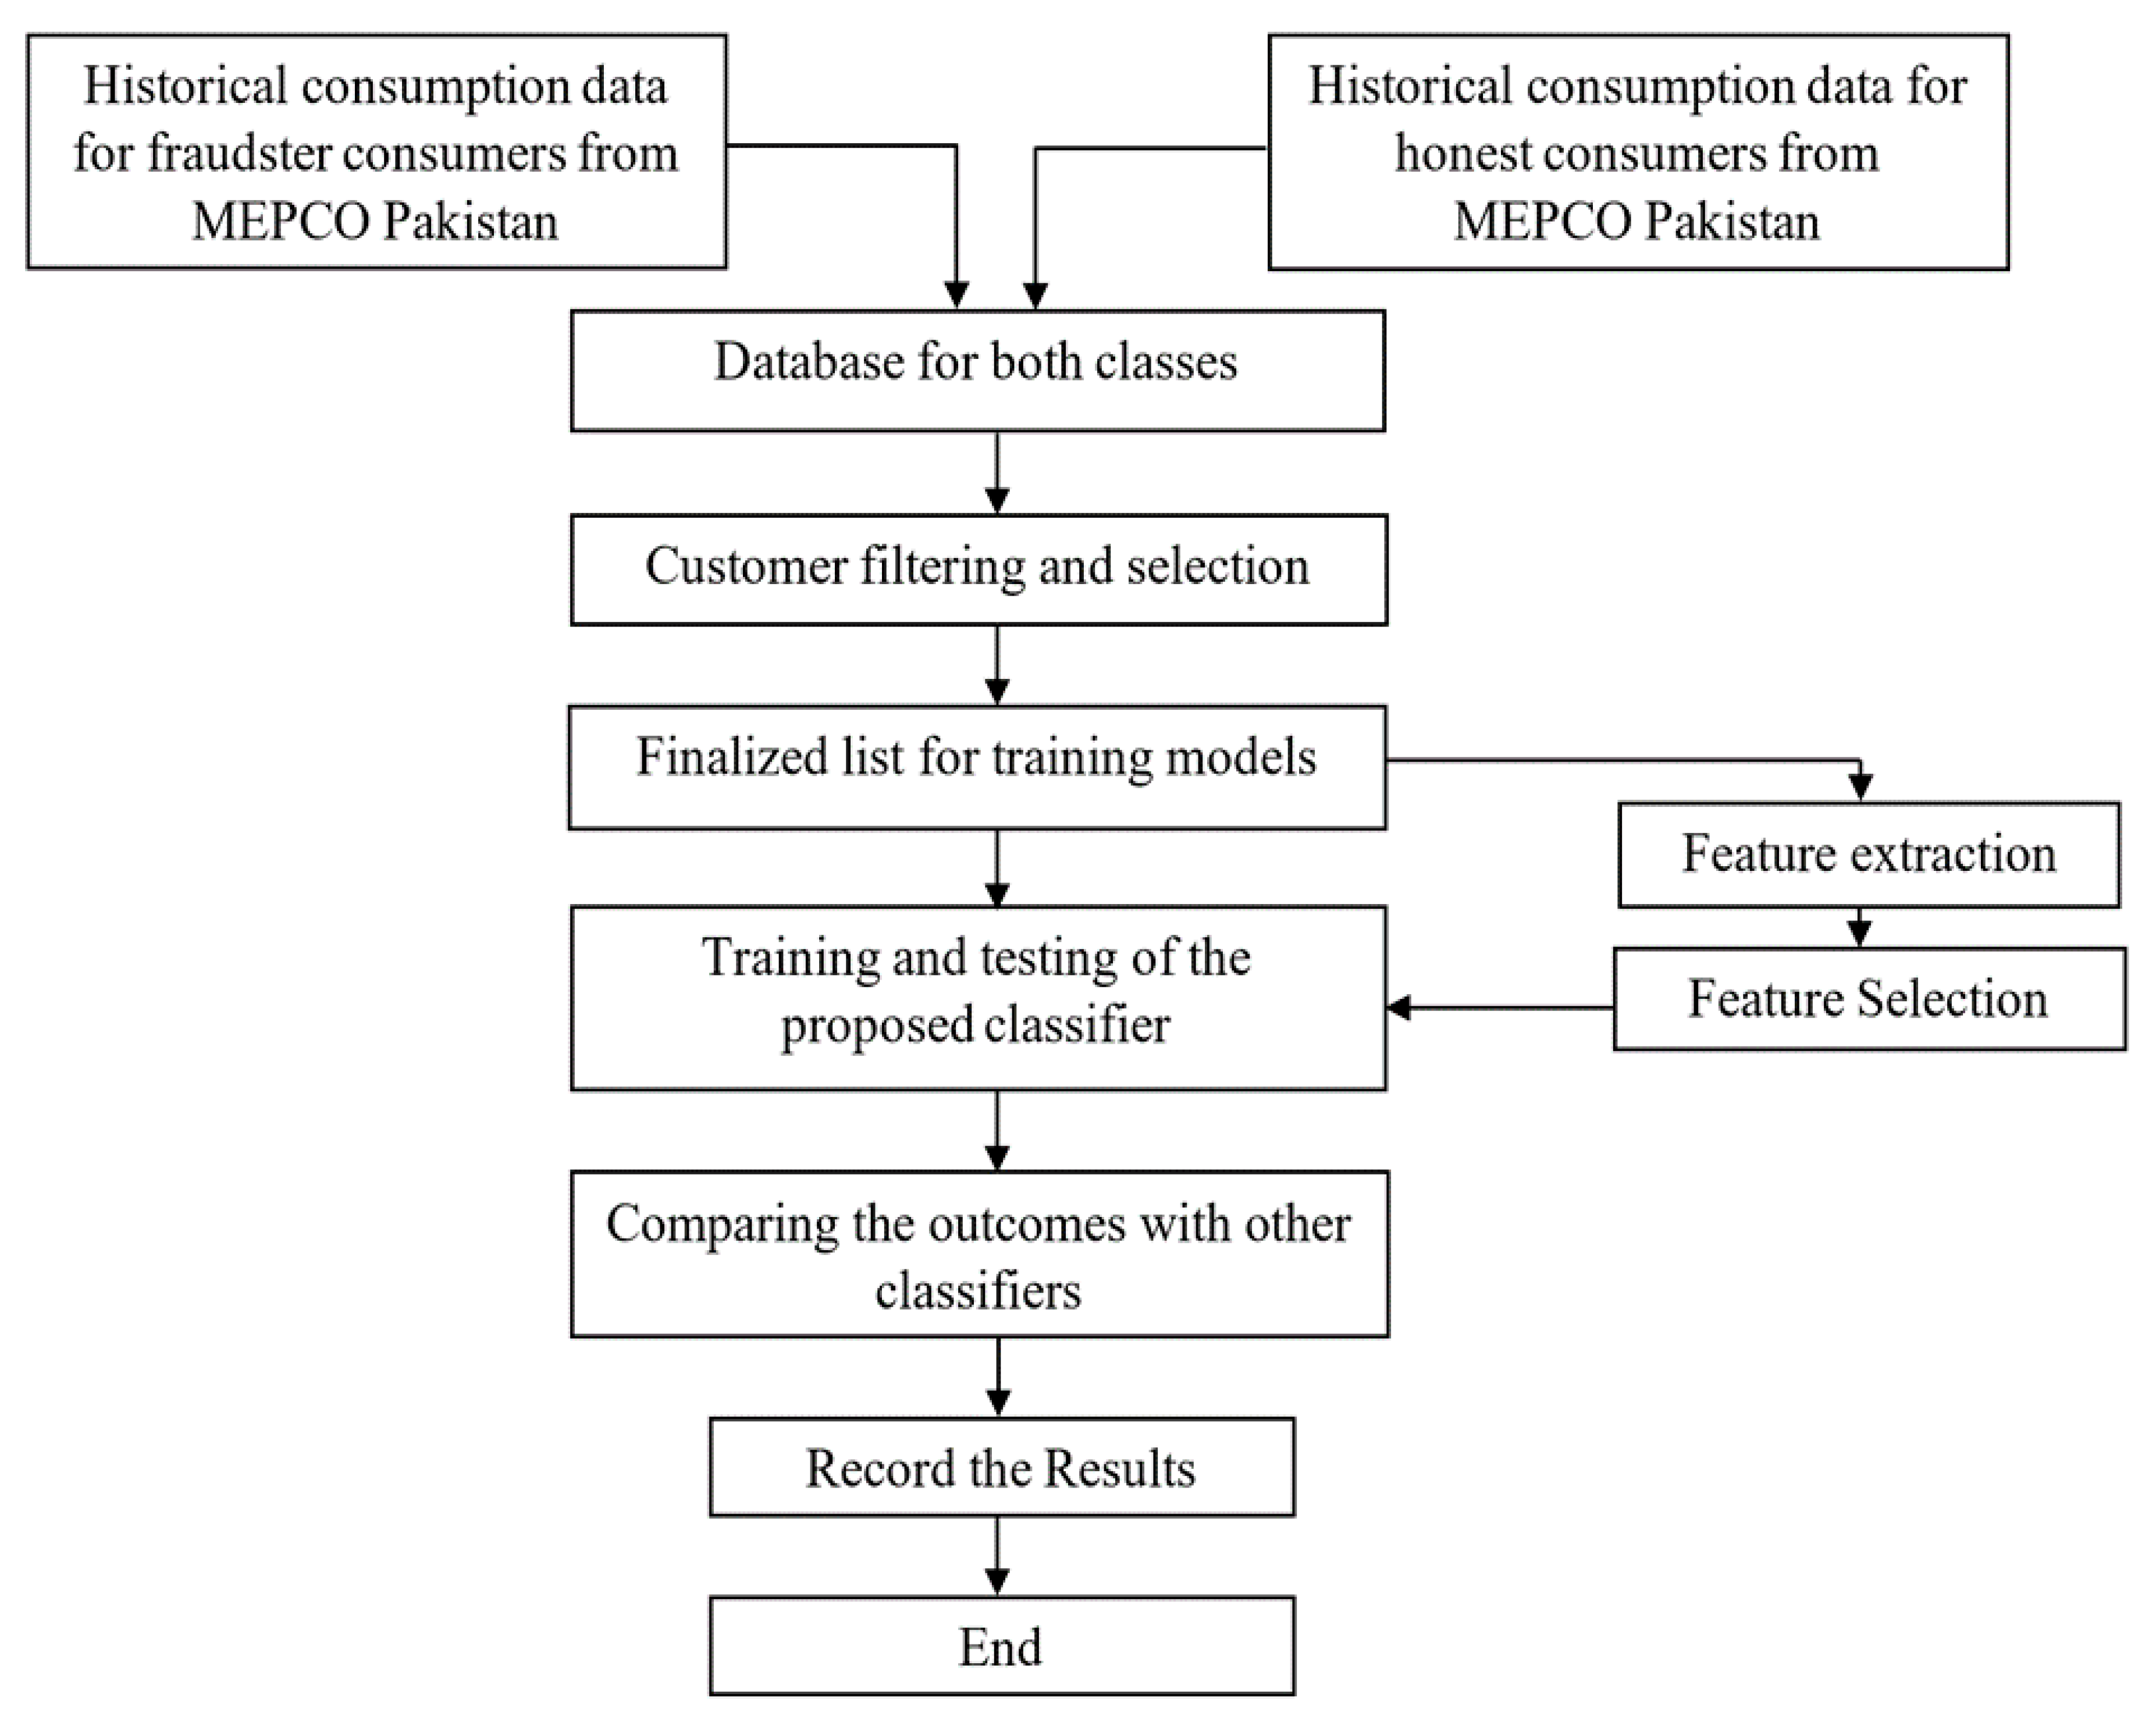
The current research work utilizes one of the recently introduced DT algorithms called C5.0 DT for NTL detection. As discussed earlier, the mentioned algorithm is an advanced version of the C4.5 DT algorithm with boosting capability which enhances its performance and makes it a suitable choice for NTL detection. For data processing and training of the models in current study, the Rapid Miner and IBM-SPSS Modeller software are utilized respectively. The complete methodology for implementing the boosted C5.0 algorithm for solving the NTL detection problem is depicted in
Figure 1.
Each of the stages used for NTL detection using the mentioned algorithm is described in the following subsections.
3.1. Data Collection
The electricity consumption data in the current study have been acquired from the Multan Electric Power Company (MEPCO). MEPCO is amongst the largest power utility in Pakistan, with around 6 million customers. MEPCO is split into eight circles, with a Multan circle being the largest one having more than 1 million consumers.
Table 1 shows the total number of consumers in the Multan circle.
As can be seen from
Table 1 that the maximum number of consumers belongs to the domestic and commercial tariff, hence they are primarily focused on this research study. Furthermore, since smart meters are only installed in the industrial and agricultural sectors, so they are not considered for classification in current work. The data for all the registered theft cases for two years period, i.e., 2015–2016 and 2016–2017, was obtained from Meter and Testing (M&T) laboratory Multan circle. To declare a consumer as dishonest, M&T must issue a report after checking the status of the meter thoroughly. The total fraud cases registered in 2 years period were recorded as 1913. Furthermore, the obtained data contains three years of kWh consumption from May 2015 to April 2018 along with parameters like meter reading value, meter reading date, connected load, sanctioned load, inspection date and discrepancies, if any.
3.2. Customer Filtering and Selection
Since the energy consumption data collected from MEPCO contained several anomalies that provide misleading information; therefore, the data filtration has been carried out to eliminate the consumers with incomplete information. Following consumers were removed during the mentioned process;
- (1)
Customers whose kWh consumption data for the complete duration was not available, i.e., the connection got disconnected due to nonpayment or change of residence, etc.
- (2)
All those customers who were registered after the month of May 2015.
- (3)
All those costumers whose metering apparatus became faulty during the mentioned period.
- (4)
All the customers who were charged average units due to the unavailability of the meter reading or any other valid reason.
After removing all the enlisted outliers, the finalized data consist of 3564 customers with 2117 honest and 1447 fraudulent customers. Although many customers were removed after the filtration procedure, yet the remaining data was enough for the training of models.
3.3. Boosted C5.0 Decision Tree
There are two main types of Decision Trees in supervised machine learning algorithms, i.e., Regression Trees and Classification Trees [
30]. The C5.0 DT belongs to the classification tree category [
31]. It is an advanced version of the C4.5 classifier with superior performance. The main advantage of the C5.0 DT algorithm over its predecessors is that it supports “Boosting” technology [
32]. Furthermore, the C5.0 DT has the capability of producing accurate rules and has better performance in terms of memory. A C5.0 DT algorithm functions by splitting the samples based on the feature with the highest Information Gain (IG). Based on the subsequent IG feature, every subsample as specified by the primary split is further split again and again until the subsamples became indivisible. Lastly, the lowest level splits are reviewed and the splits that do not contribute substantially to the model are Pruned [
33].
3.3.1. Pseudocode for C5.0
INPUT: Chosen features from the MEPCO consumption pattern dataset.
OUTPUT: Predict the class to which energy consumer belongs.
Step 1: Examine the features of MEPCO consumer data.
Step 2: Let
C be the consumer labelling of required set S with n number of items in the class
C1,
C2, …,
Cr. Let
Pi be the likelihood of an item to be in
S and in-class
Ci. The Entropy of set
S can be expressed by:
Step 3: For every available feature
A, consider the set
V(A) of expected values of
A and for
v ∈ V (A),
Sv be the set containing every component of
S with value
v for the feature
A. The IG of feature
A concerning
S is denoted by | S | and is expressed as:
Step 4: Calculate the Gain Ratio by utilizing IG and entropy by:
The pseudocode of the proposed C5.0 DT classifier for differentiating between honest and fraudster customers has a drawback that is, it results in the production of a very large number of leaf nodes which consequently results in the formation of a large tree. To avoid the mentioned drawback of the DT, a pruning technique is used to decreases the tree size, which in turn makes the classification process simpler. The value of pruning is generally set between 75 and 80, while the same has been set as 80 in the current research study.
3.3.2. Boosting Technique
Compared to C4.5 DT, Boosting is one of the main developments in the C5.0 DT algorithm [
34]. It assigns a weight to every sample to show its impact. Higher the weight, greater will be its influence on the DT. For the first trial, an identical weight is assigned to each sample. In the subsequent trials, the weight is allocated to each sample based on the prior trial outcomes. The samples which are not correctly classified during the last trial are given more weight and hence their influence on the DT is subsequently improved in forthcoming trials. The Boosting technique builds multiple DTs during this whole training process. The number of DTs built (represented by
T) is always equal to the total number of executed trails. The function indicator of the proposed classifier is given in Equation (4).
The working mechanism of the Boosting algorithm can be explained by the following steps.
Step 1: Initialize the variables: set a value to number T (usually is 10). Set t = 1, = 1/n.
Step 2: Calculate = /, where = 1.
Step 3: Assign to each sample’s weight and construct Ct according to this distribution.
Step 4: Compute the error rate of Ct as εt = )
Step 5: if εt < 0.5 the iterations are stopped then set T = t + 1; else if εt = 0 and the trails are terminated, then set T = t; else if 0 < εt < 0.5 go on to the next step.
Step 6: Calculate βt = εt/1 − εt.
Step 7: Regulate the weight corresponding to the error rate, that is = βt, the sample is not classified correctly. , the sample is rightly classified.
Step 8 if t = T the trails are terminated. Else, set t = T + 1 and go to step 2 to begin the next trail.
In the above discussion, the Ct represents the number of DTs during trails t, C* represents the finalized DT formed by combining the T number of DTs, is the weight of sample i in trail t (i = 1, 2,..., N; t = 1, 2,..., T), is the normalized factor of and βt is the factor that adjusts weight.
A similar procedure is repeated for computing the normalized weights in the forthcoming iterations. For the current research work, ten DTs are constructed during the complete boosting process and the final classification results are obtained through the voting process.
3.4. Feature Extraction
The feature extraction helps in creating a summarized set of features that convey complete information of the entire dataset [
19]. Feature extraction does not only create a new set of features but also removes the irrelevant features that consequently result in increasing the classification accuracy and speed of the overall process. For the current study, the following set of features were extracted from the kWh consumption data of MEPCO’s consumer dataset.
3.4.1. Standard Deviation
The standard deviation denoted by
σ and is measured by the amount of deviation from the set of estimated values. A high value of standard deviation signifies that the values are far from the mean. In contrast, the low value of standard deviation indicates that it is close to the mean (also known as the expected value). The standard deviation of the sample can be computed by Equation (5).
where (
x1,
x2,
x3….,
xi) are the estimated values of the sample,
is the mean of these observed values and
N is the total number of observations in each sample.
3.4.2. Skewness
Skewness refers to the measure of distortion or asymmetry in a normal distribution of a dataset. It is used for computing the amount of symmetry in the data distribution. Data that are symmetrically distributed will have a skewness of zero. Negatively skewed data will have a tail on the left side while the tail for the positively skewed data is on the right side. Mathematically, the skewness of any data can be calculated by using Equation (6).
where
= ith Random variable.
= Mean of the distribution.
= number of variables in the distribution.
= Standard deviation.
3.4.3. Kurtosis
Like the Skewness, Kurtosis also defines the shape of a probability distribution. The Kurtosis value of every univariate normal distribution is 3. Distribution with kurtosis greater than three is called Leptokurtic while the same with a value less than 3 is called Platykurtic. A data that has Kurtosis less than 3 produces fewer extreme outliers than those of the normal distribution. The Kurtosis of any dataset can be calculated by:
3.4.4. Z-Score
The Z-score is used to find the total number of standard deviations from the mean of a dataset. Technically it is used to calculate total standard deviations that are below or above the mean in a population. It is also regarded as the standard score. The Z-score value varies from +3 standard deviation which means the data point fall to the very right of the normal distribution curve or -3 which states that it belongs to the extreme left of the normal distribution curve (The Empirical Rule). For the current study, the Z-score of every month is calculated by using the following Equation (8).
where
μ is the mean value,
σ represents the population standard deviation and
denote the monthly consumption for which Z-score is being calculated.
3.4.5. Other Useful Features
Other features that were extracted from the consumption data of consumers for the current classification includes; (i) First quartile consumption (ii) Median (iii) Third quartile consumption (iv) Mean (v) Maximum consumption (vi) Minimum Consumption (vii) Difference between seasonal consumption for the first year (viii) Difference between seasonal consumption for the second year (ix) Difference between seasonal consumption for the third year (x) Null consumption (xi) Less than 50 units (xii) Monthly kWh consumption greater than 700 (xiii) Difference between first quartile consumption and the second quartile consumption (xiv) Difference between first quartile and the third quartile consumption and (xv) Difference between the second quartile and the third quartile consumption.
3.5. Feature Selection Using Pearson’s Chi-Square
The biggest problem with data mining is the involvement of hundreds or even thousands of features that can be utilized as the inputs. To avoid the mentioned problem, there is a dire need to select the relevant features from the dataset and skip the less significant ones. The feature selection process gives importance to the features that matter largely and can find a key relationship with the data that otherwise might be overlooked. The feature selection helps to obtain accurate, simple and easily explainable models [
35]. One of the most efficient feature selection methods in machine learning field is Pearson’s chi-square (
) test. The statistical procedures of Pearson’s chi-square tests are assessed by the reference to Chi-squared distribution. The initial step in the test is to compute the chi-square probability according to the following Equation (9).
where
= Observed frequency, and
= Expected frequency stated by the null hypothesis.
The main goal of using this feature selection procedure is to remove all the irrelevant features that do not contribute to the classification process. The feature selection procedure is applied to each feature individually until the most relevant features are selected. Furthermore, it is important to note that the mention feature selection approach not only considers the relation between the features but also considers the impact of every feature on each class label. Thus, it contributes to improving the classification results as can be seen in the results of this study.
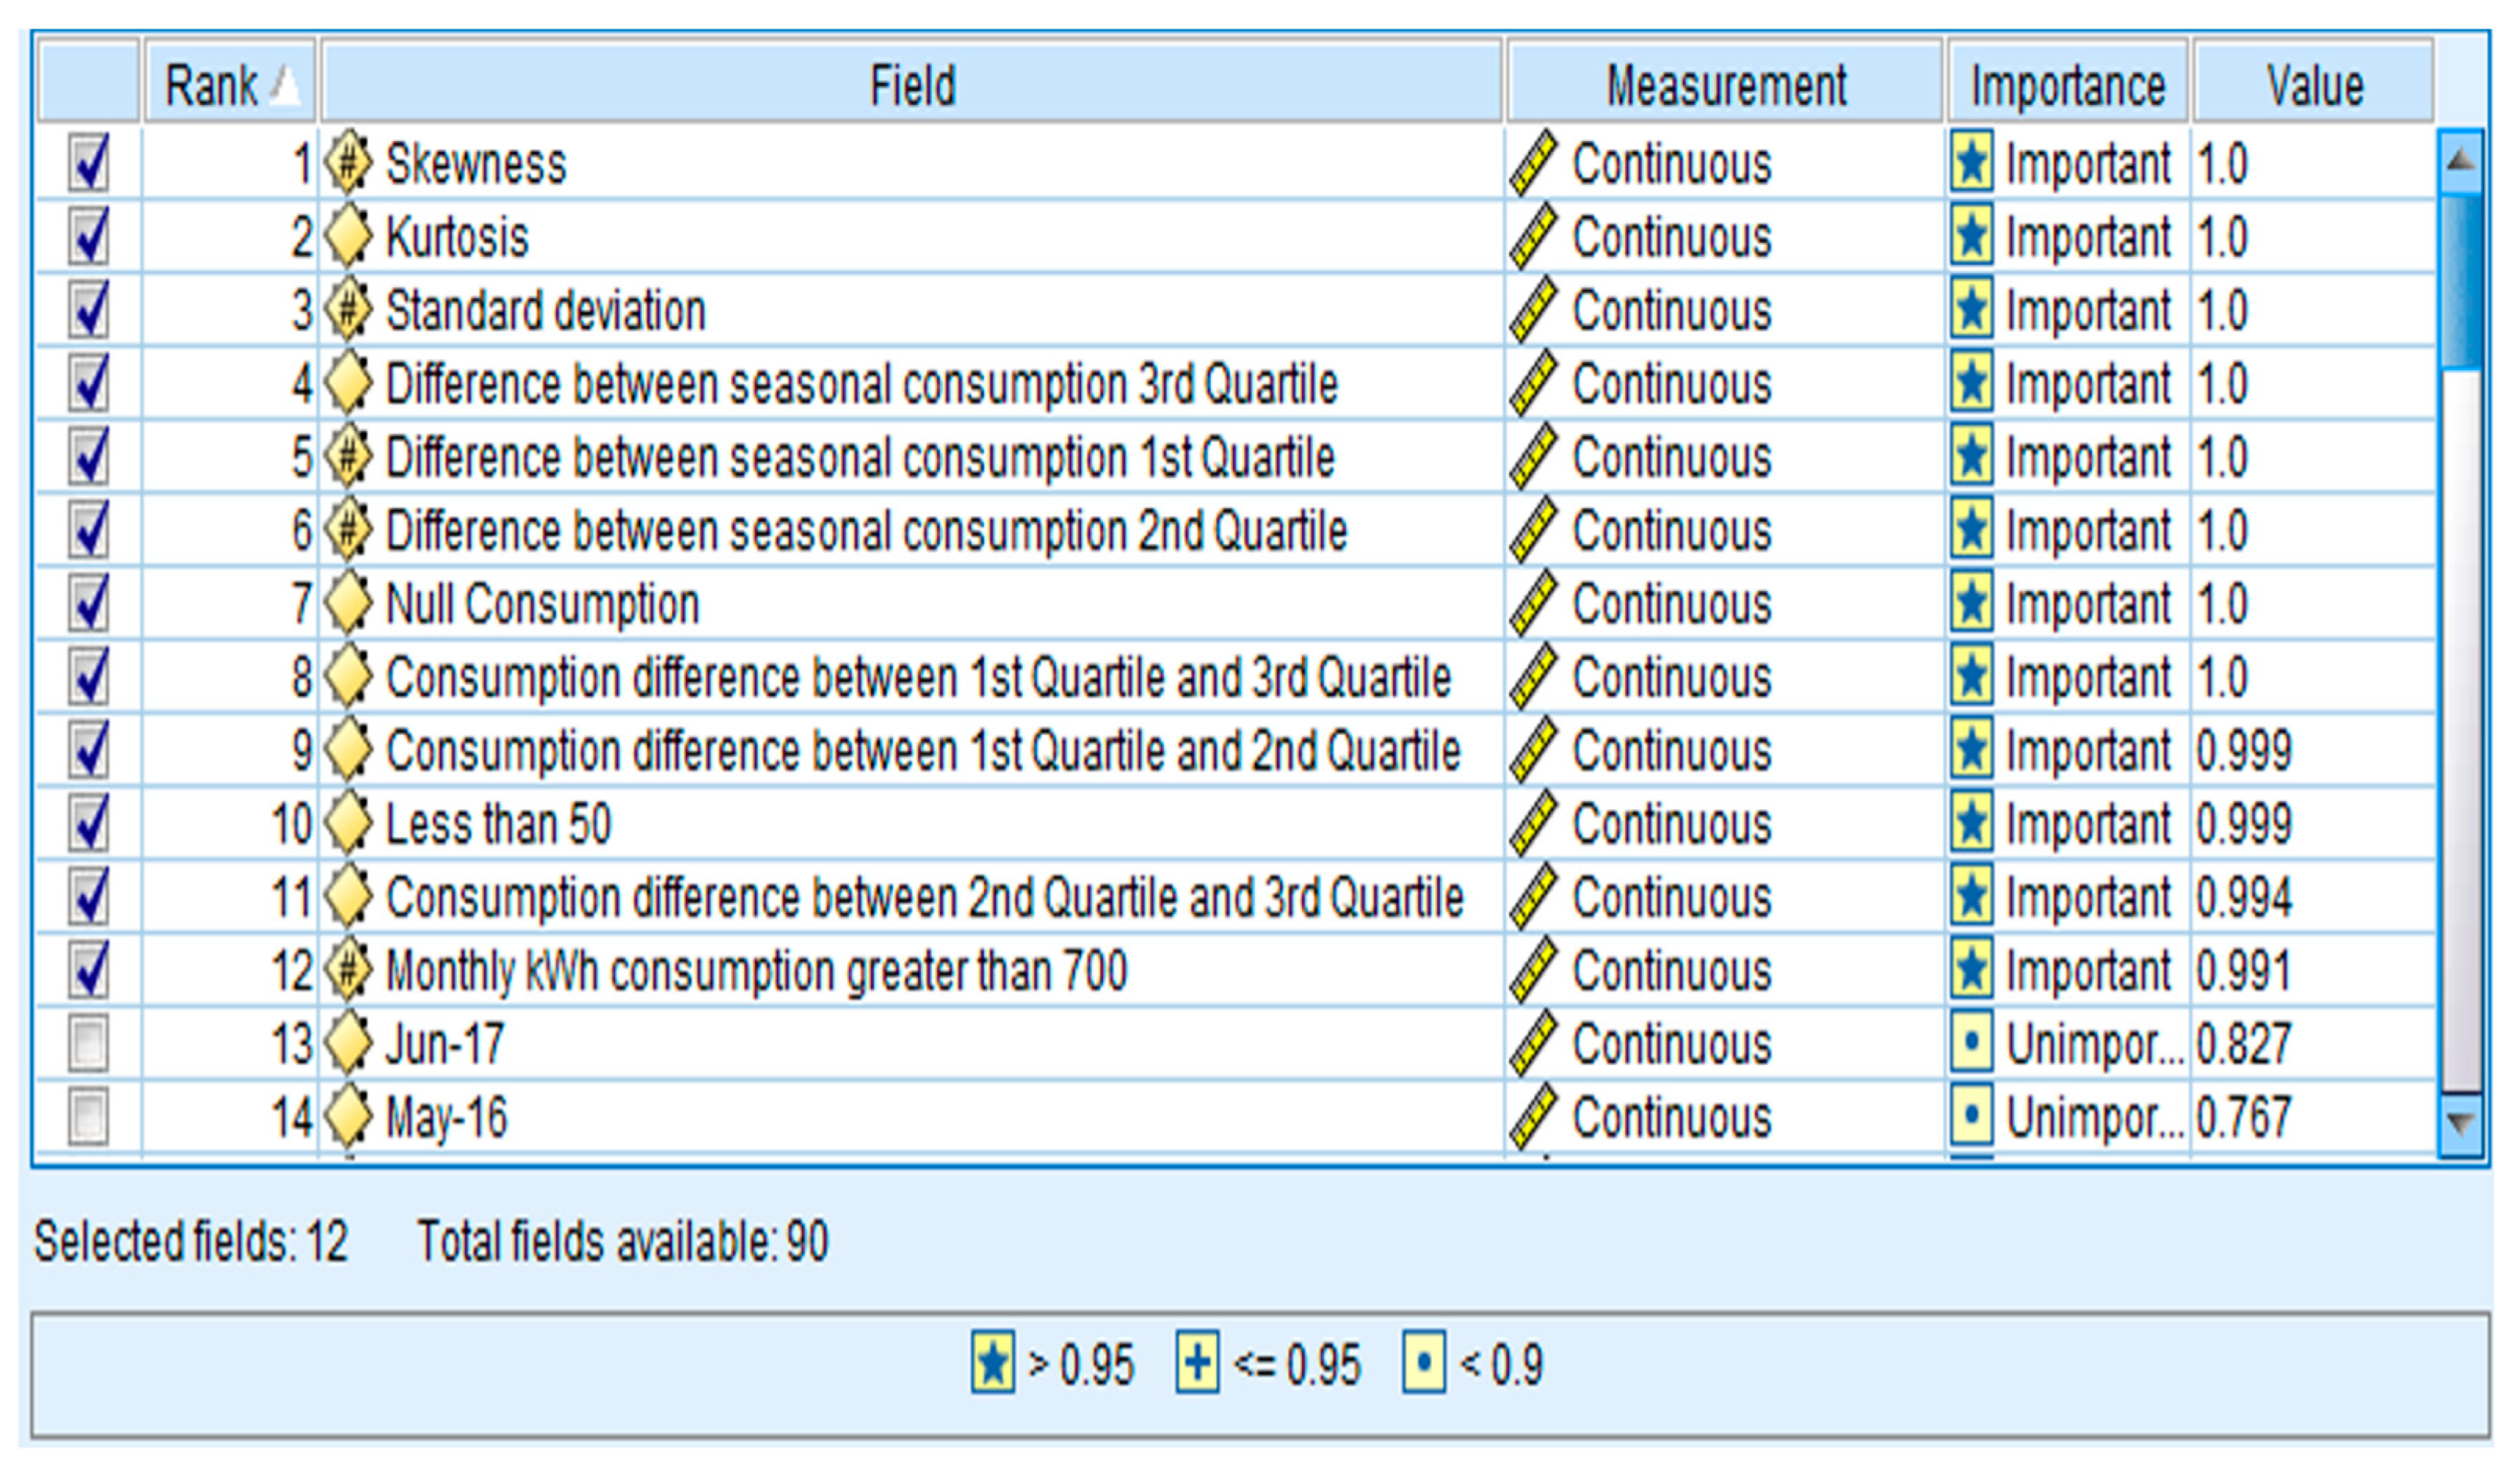
Figure 2 shows the features that were selected after applying the Pearson’s chi-square algorithm.
It is worthwhile to mention here that the consumption patterns of the honest consumer follow a symmetrical pattern. Their consumption increases during the summer season (due to very high temperature), while it falls in the winter as the temperature in the MEPCO region, falls to the normal range. Unlike honest consumers, there is a sudden rise and fall in the consumption behavior of the fraudulent consumer which provides the first-hand information about their illegal activities. In order to conveniently classify the honest and the fraudulent consumers, the value for the prementioned set of features was calculated and are presented in
Figure 2. It may be noted that for identifying the fraudster consumers using a conventional technique only monthly consumption data is utilized which is not feasible when the data is quite huge as in the case of power utilities. Therefore, the current study proposes a method of reducing the number of features in order to avoid the complexity of data processing for NTL detection. Hence the amount of information needed for a classifier can be significantly reduced by using the current feature-based study. For example, for classifying a consumer based on its three years consumption data requires at least 36 features (monthly energy consumption) while the same consumer can be classified with the help of proposed feature extraction and feature selection based approach by using 12 features only with increased accuracy and detection rate as validated by the outcomes of the current study. It is worthwhile to mention here that the total number of features that were extracted from the available dataset were counted as 90. However, after applying the proposed feature selection method, the top 12 features were adopted for the model training as depicted in
Figure 2.
3.6. Studied Classification Methods
In order to compare the performance of the proposed classification approach, its performance has been compared with few state-of-the-art machine learning algorithms. The reason behind selecting these algorithms for the validation purpose is their wide applicability, state of the art nature, good classification ability and good performance. Hence a fair comparison has been made among most widely used algorithms to achieve the broader objectives of the study. Following are few of the classifiers that were selected based on above mentioned criteria for the training and validating the performance of the proposed classifier.
3.6.1. Support Vector Machine (SVM)
An SVM is a supervised machine learning algorithm that is used for dealing with regression and classification problems. Normally, single or multiple hyperplanes are built by SVM for classifying non-separable classes in a higher-dimensional space. A kernel trick is used to separate non-separable classes by transforming them into a higher dimensional space from a lower-dimensional space. SVM has been used several times in the NTL detection problem [
12,
36]. One of the major shortcomings of using SVM is that its parameter tuning requires a huge amount of time for building the model. Therefore, it is mostly combined with DTs, metaheuristic optimization algorithms, Fuzzy Logic (FL) and Genetic Algorithm (GA) to enhance the classification performance of the models as can be observed in references [
13,
37,
38,
39]. The
Table 2 shows the hyperparameter used during the grid search in this study.
3.6.2. Random Forest
The Random Forest (RF) is the supervised machine learning algorithm and is utilized for both regression and classification purposes. It has been used for NTL detection in references [
40,
41]. The RF is made up of a large number of individual DT’s that function as an ensemble. Every DT in the RF provides the class prediction and the class with the majority votes comes out as a decision.
Table 3 shows the hyperparameters used during the grid search for the RF algorithm.
3.6.3. Artificial Neural Network (ANN)
ANN is a computational model that is normally applied in situations where the information provided is not enough for carrying out the classification task. ANN’s has three layers that are interconnected. The primary layer is comprised of input neurons which send the data to the second layer and consequently to the 3rd layer successively. ANN has been used several times in the NTL detection problem and two of the most prominent works can be found in references [
15,
42].
Table 4 shows the parameters of ANN used for carrying out current work.
3.6.4. XGBoost Tree
Extreme Gradient Boosting (XGboost) is a DT based ensemble algorithm that utilizes the framework of gradient boosting algorithm. It combines the predictions of many weak learners to build an additive model. XGboost is highly efficient and robust algorithm that can handle classification, ranking and regression issues. It works by using a special parameter, reserved for providing a value other than the normal values, during its search for the missing value. XGBoost has also been utilized several times for addressing the NTL detection issue [
19,
43]. The
Table 5 shows the hyperparameters for the XGBoost algorithm during the grid search in current study.
4. Results and Discussions
This section presents the outcomes of the proposed NTL detection method along with a detailed comparative analysis with a few of the well-known machine learning algorithms recently studied for NTL detection. The performance evaluation of the classification algorithms is generally carried out by using a confusion matrix that provides “True” for all the rightly classified data and “False” for all the wrongly classified datasets [
44]. The term True Positive (TP) used in the confusion matrix refers to all the fraudster costumers that are correctly classified as fraudsters while the term True Negative (TN) refers to all the honest costumers that are rightly classified as honest. Similarly, False Positive (FP) refers to all those costumers which are honest but wrongly classified as fraudsters and False Negative (FN) represent fraudster costumers which are wrongly classified as honest. The Accuracy (Acc) of a classifier can be calculated by using the following Equation (10).
As in this research study, the number of consumers belonging to both classes is not the same. Therefore, additional performance measures are needed to accurately evaluate the performance of the classifiers. For example, any classifier with 1000 costumers accurately classifies the 990 honest costumes and does not classify any fraudster costumer will have an accuracy of 99% which does not convey the true picture of the performance of the classifier. Contrary to the previous studies, this study has considered all the evaluation measures to provide a true picture of the classifiers’ performance. Furthermore, Sensitivity or True Positive Rate (TPR) is another very important evaluation parameter that is used to measure the percentage of fraudsters costumers that are rightly classified. The TPR of any classifier can be computed by utilizing the following Equation (11).
In addition, True Negative Rate (TNR) or Specificity is utilized for calculating the actual ratio of honest consumers (True Negatives) which are rightly classified as honest and is calculated by using Equation (12).
Another important parameter to be evaluated for any classifier is the Precision or Positive Predictive Values (PPV) that is used to determine the cost of FP. Power utilities may not be able to identify fraudster costumers if the mentioned parameter’s value is too low. The precision of the classifier can be calculated by using Equation (13).
Additionally, F1 Score is calculated for assessing the performance of the classifier by measuring the balance between precision and recall and can be computed by utilizing Equation (14).
Average precision (AP) is another important metric that combines the result of precision and recall. The AP is the calculated by computing the mean of the precision scores after each response. As the values of recall and precision are between 0 and 1, therefore, AP also ranges between 0 and 1. The AP is calculated by using Equation (15).
where
Rn and
Pn are the recall and precision at the nth threshold.
To evaluate the performance of the proposed classifier before the feature extraction and feature selection process, all the above-mentioned classifying performance metrics are calculated and are presented in tabular form in
Table 6 while those after the feature extraction and feature selection process are depicted in
Table 7.
In this research study, 10-fold Cross-Validation (CV) is utilized for evaluating the performance of the classifier. In 10-fold CV the data is split into 10 equal-sized folds. Nine of the ten folds are used for training of the classifier, and one of them is used for validation, and the process is repeated ten times until all the folds are used for training and validating. To validate the superiority of the proposed algorithm, its performance is compared with that of a few well-known classifying algorithms for solving the NTL detection problem with the identical dataset. It can be seen from the results presented in
Table 5 and
Table 6 that all classifiers’ performance shows a major improvement after the proposed feature extraction and feature selection process. Furthermore, it is obvious from the outcomes of the study that the proposed Boosted C5.0 algorithm outperforms all the conventional machine learning algorithms in terms of all the performance measuring indices. It provides the highest values for the accuracy, sensitivity, specificity, precision, F1 score and Area Under Curve (AUC) and hence validates the superior performance of the proposed method.
Table 8 shows the relative percentage increment after applying the Boosting technique to C5.0 DT while
Table 9 provides the information about the same parameter for the Boosted C5.0 algorithm after applying the proposed feature extraction and selection process.
As can be observed from the
Table 8, the proposed Boosted C5.0 DT algorithm provides an increment of 2.50%, 3.99%, 1.97%, 8.50%, 5.73% and 8.05% in classification Accuracy, Sensitivity, Specificity, Precision, F1 score and AUC, respectively, as compared to its original version. Furthermore, a significant percentage of increment has also been observed for all the above-mentioned metrics after employing the proposed feature extraction and feature selection method along with the Boosted C.50 DT algorithm. A pictorial view of the DT for the C5.0 algorithm is shown in
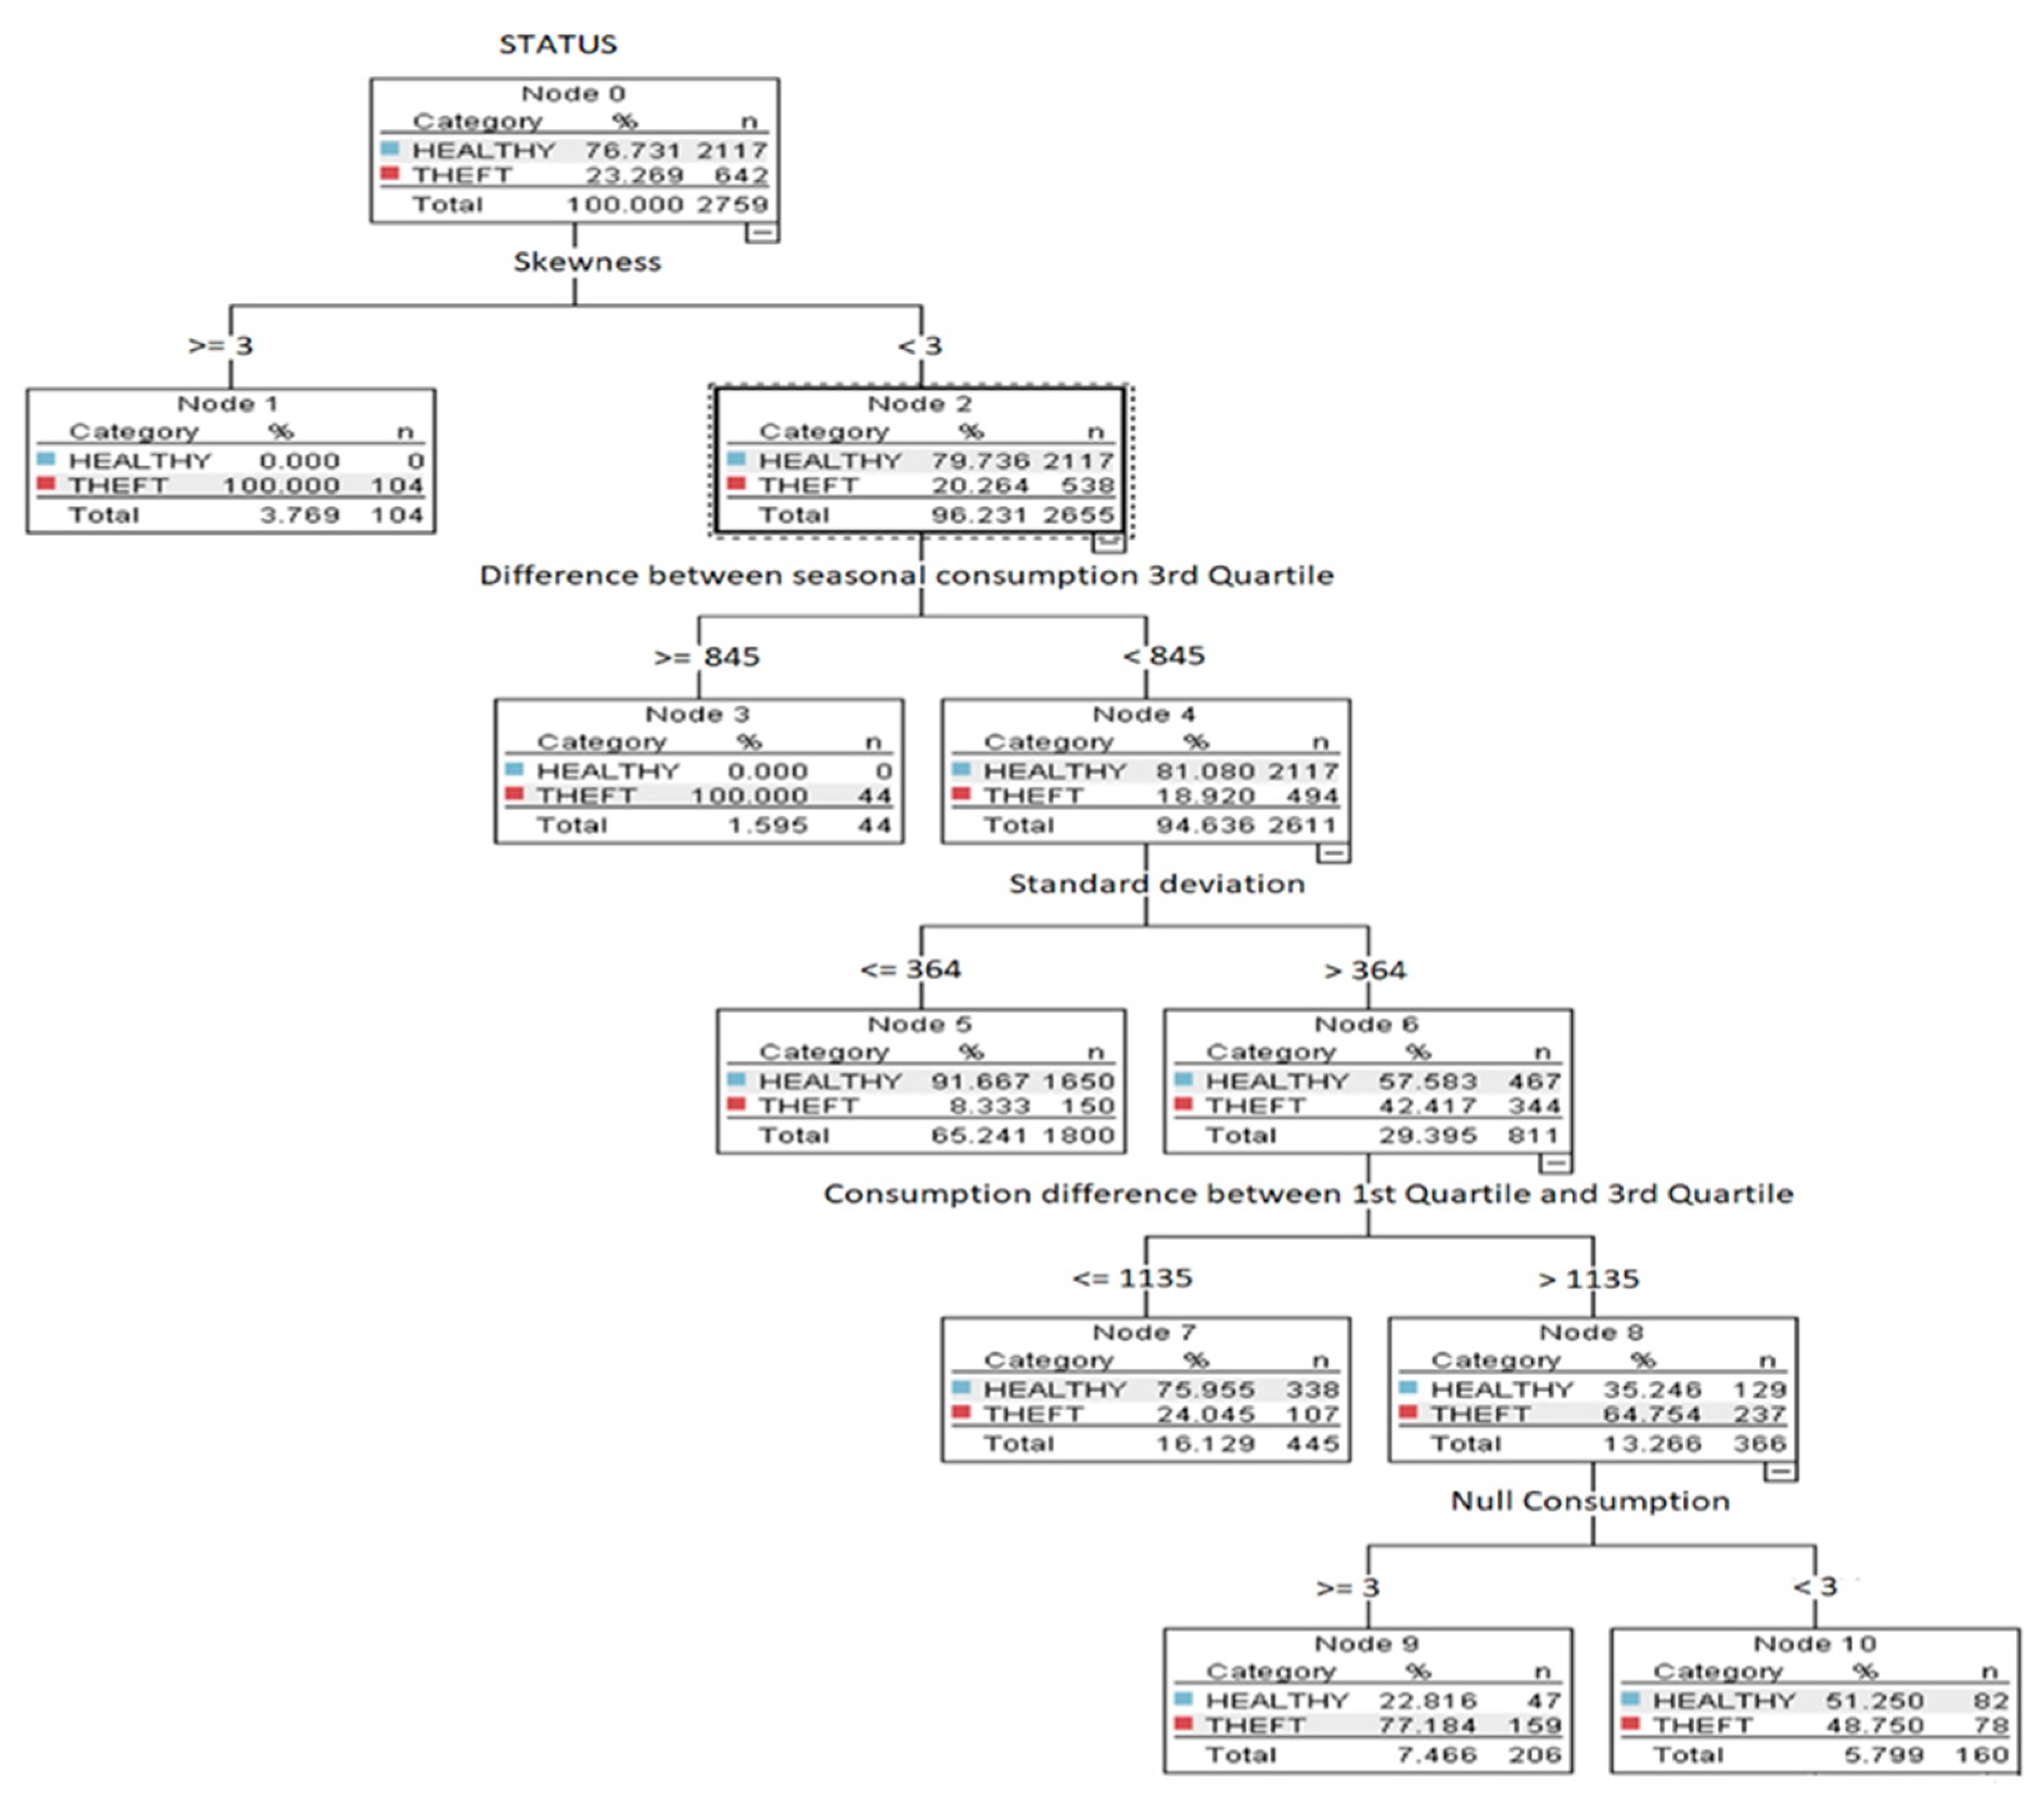
Figure 3.
Figure 3 shows the C5.0 DT until node 5. It is evident from the figure that all the 104 customers with skewness greater than or equal to 3 are involved in the theft. In the 2nd node for the remaining 2611 customers with skewness, less than 3 but seasonal consumption difference for the last year (3rd year) higher than 845 than the consumer is involved in fraudulent activity. So, this shows how C5.0 DT performs classification between honest and fraudulent consumers based on that feature extraction.
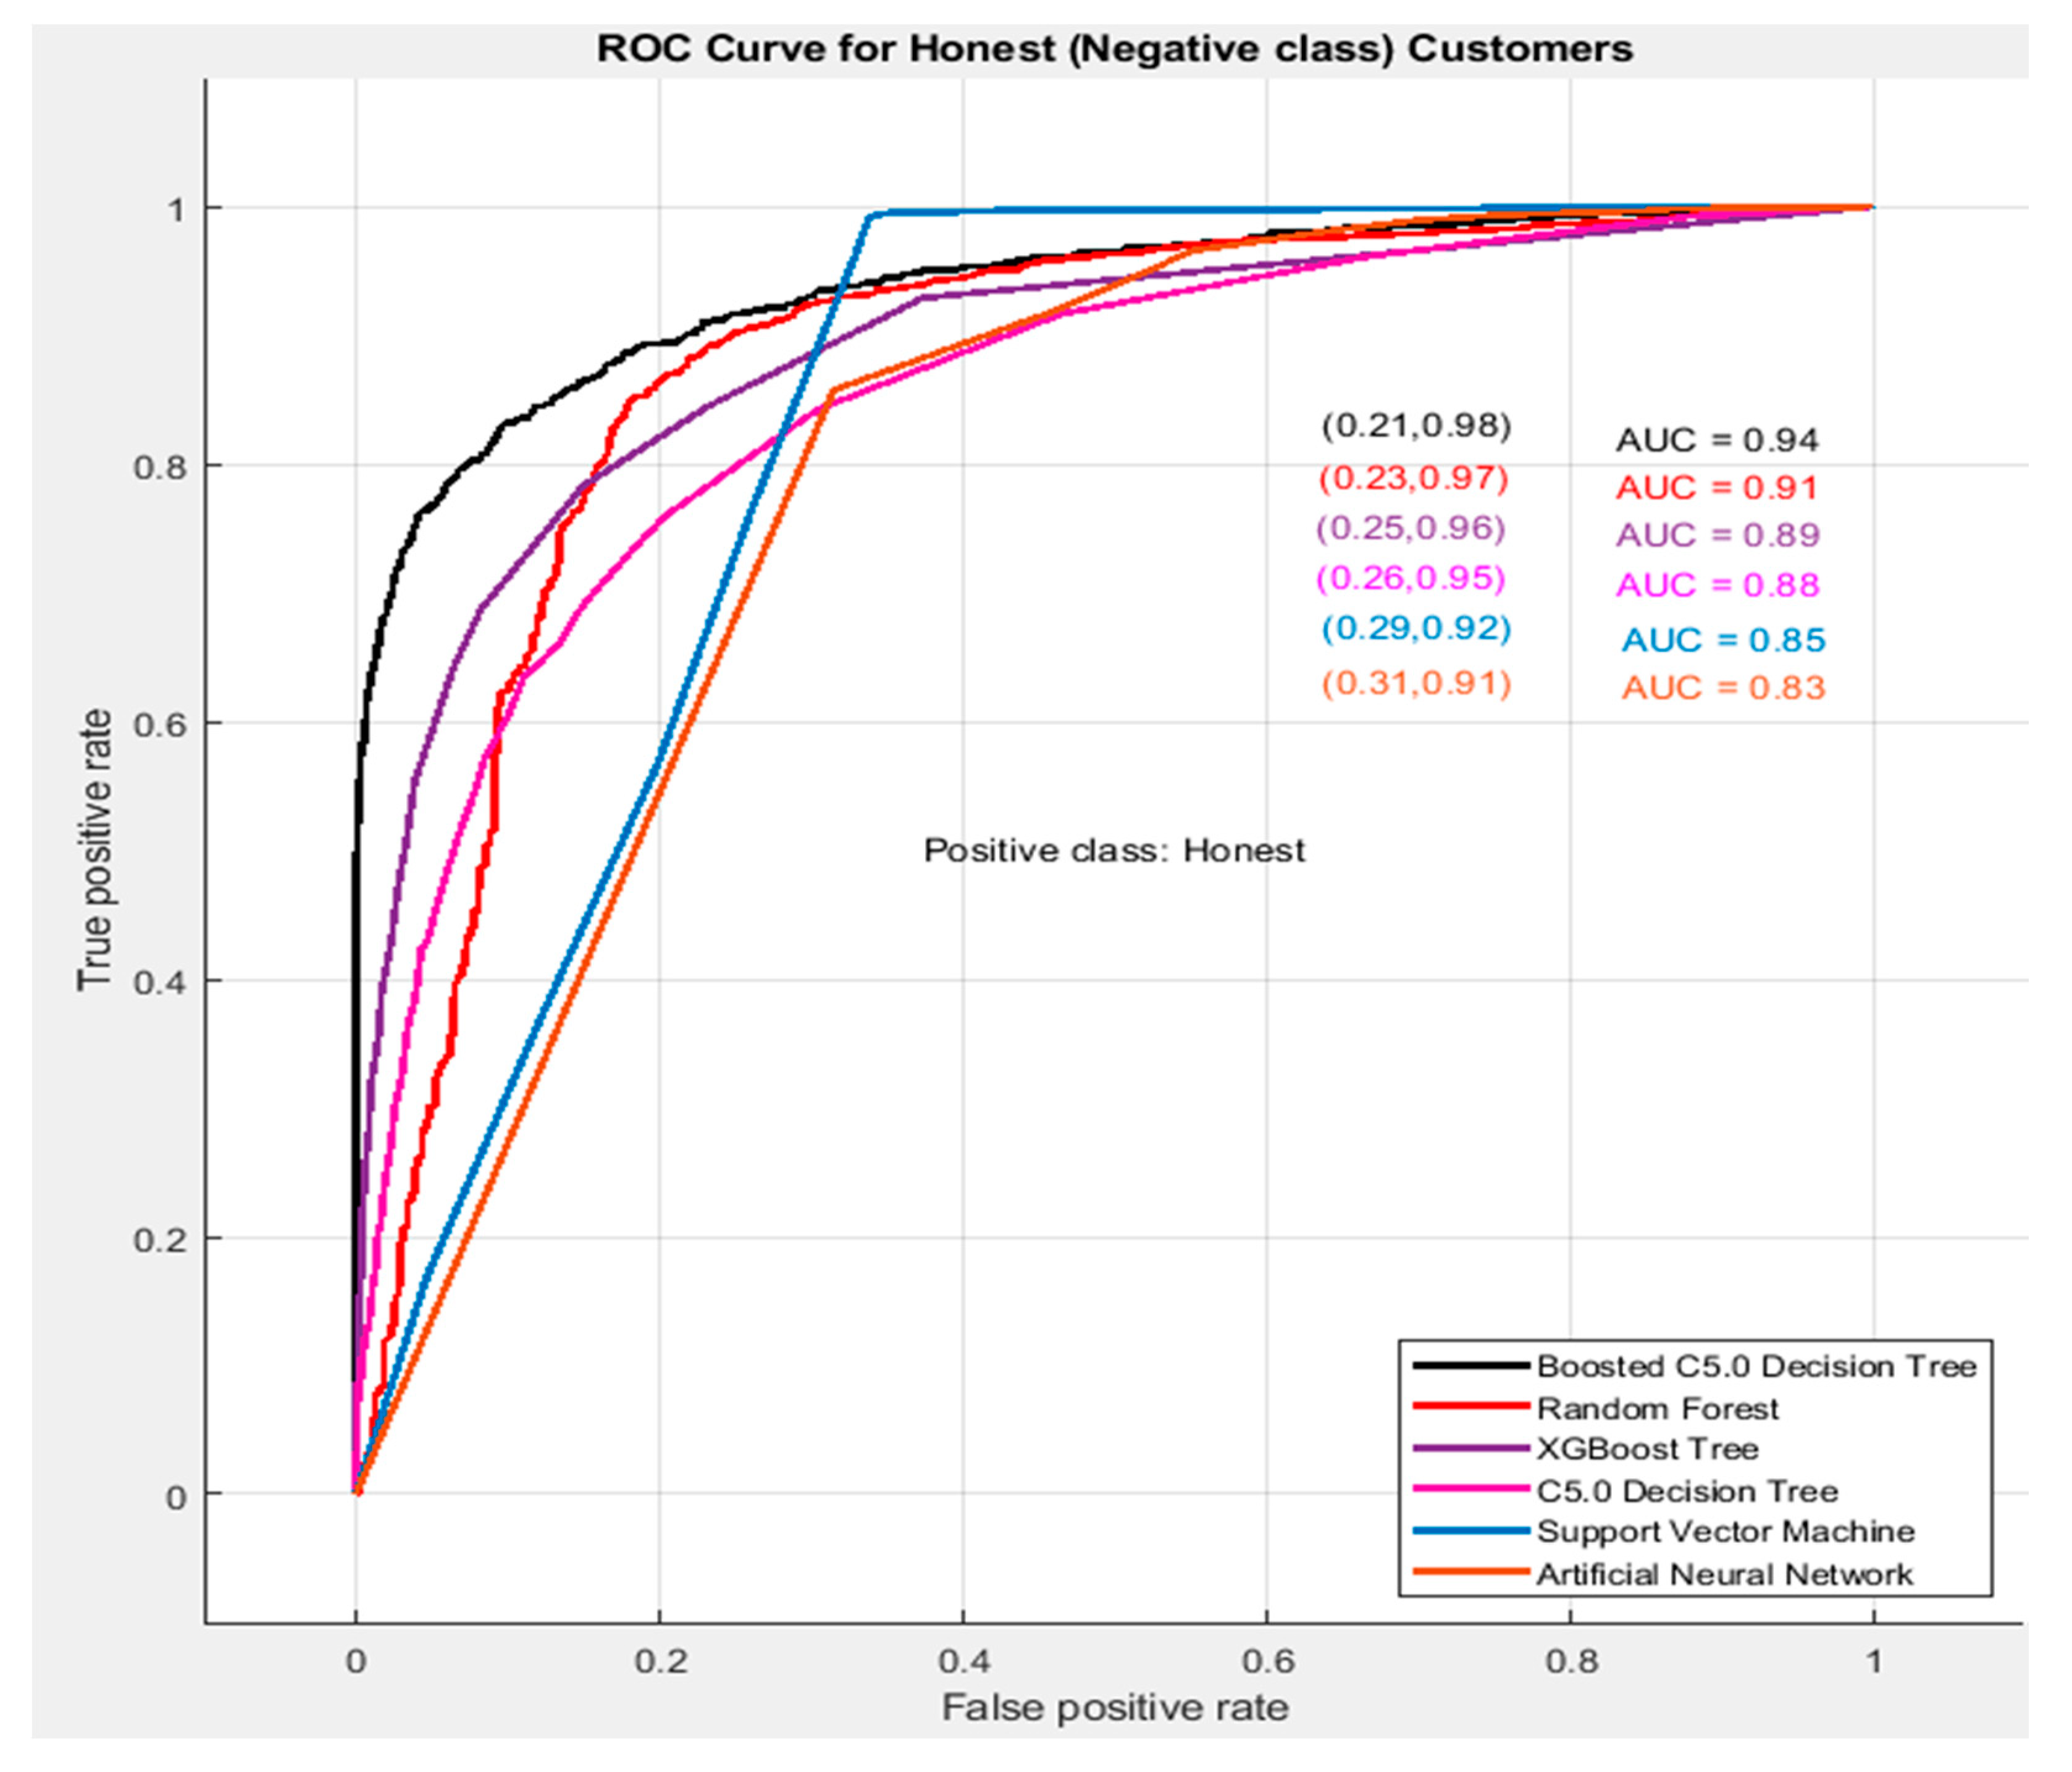
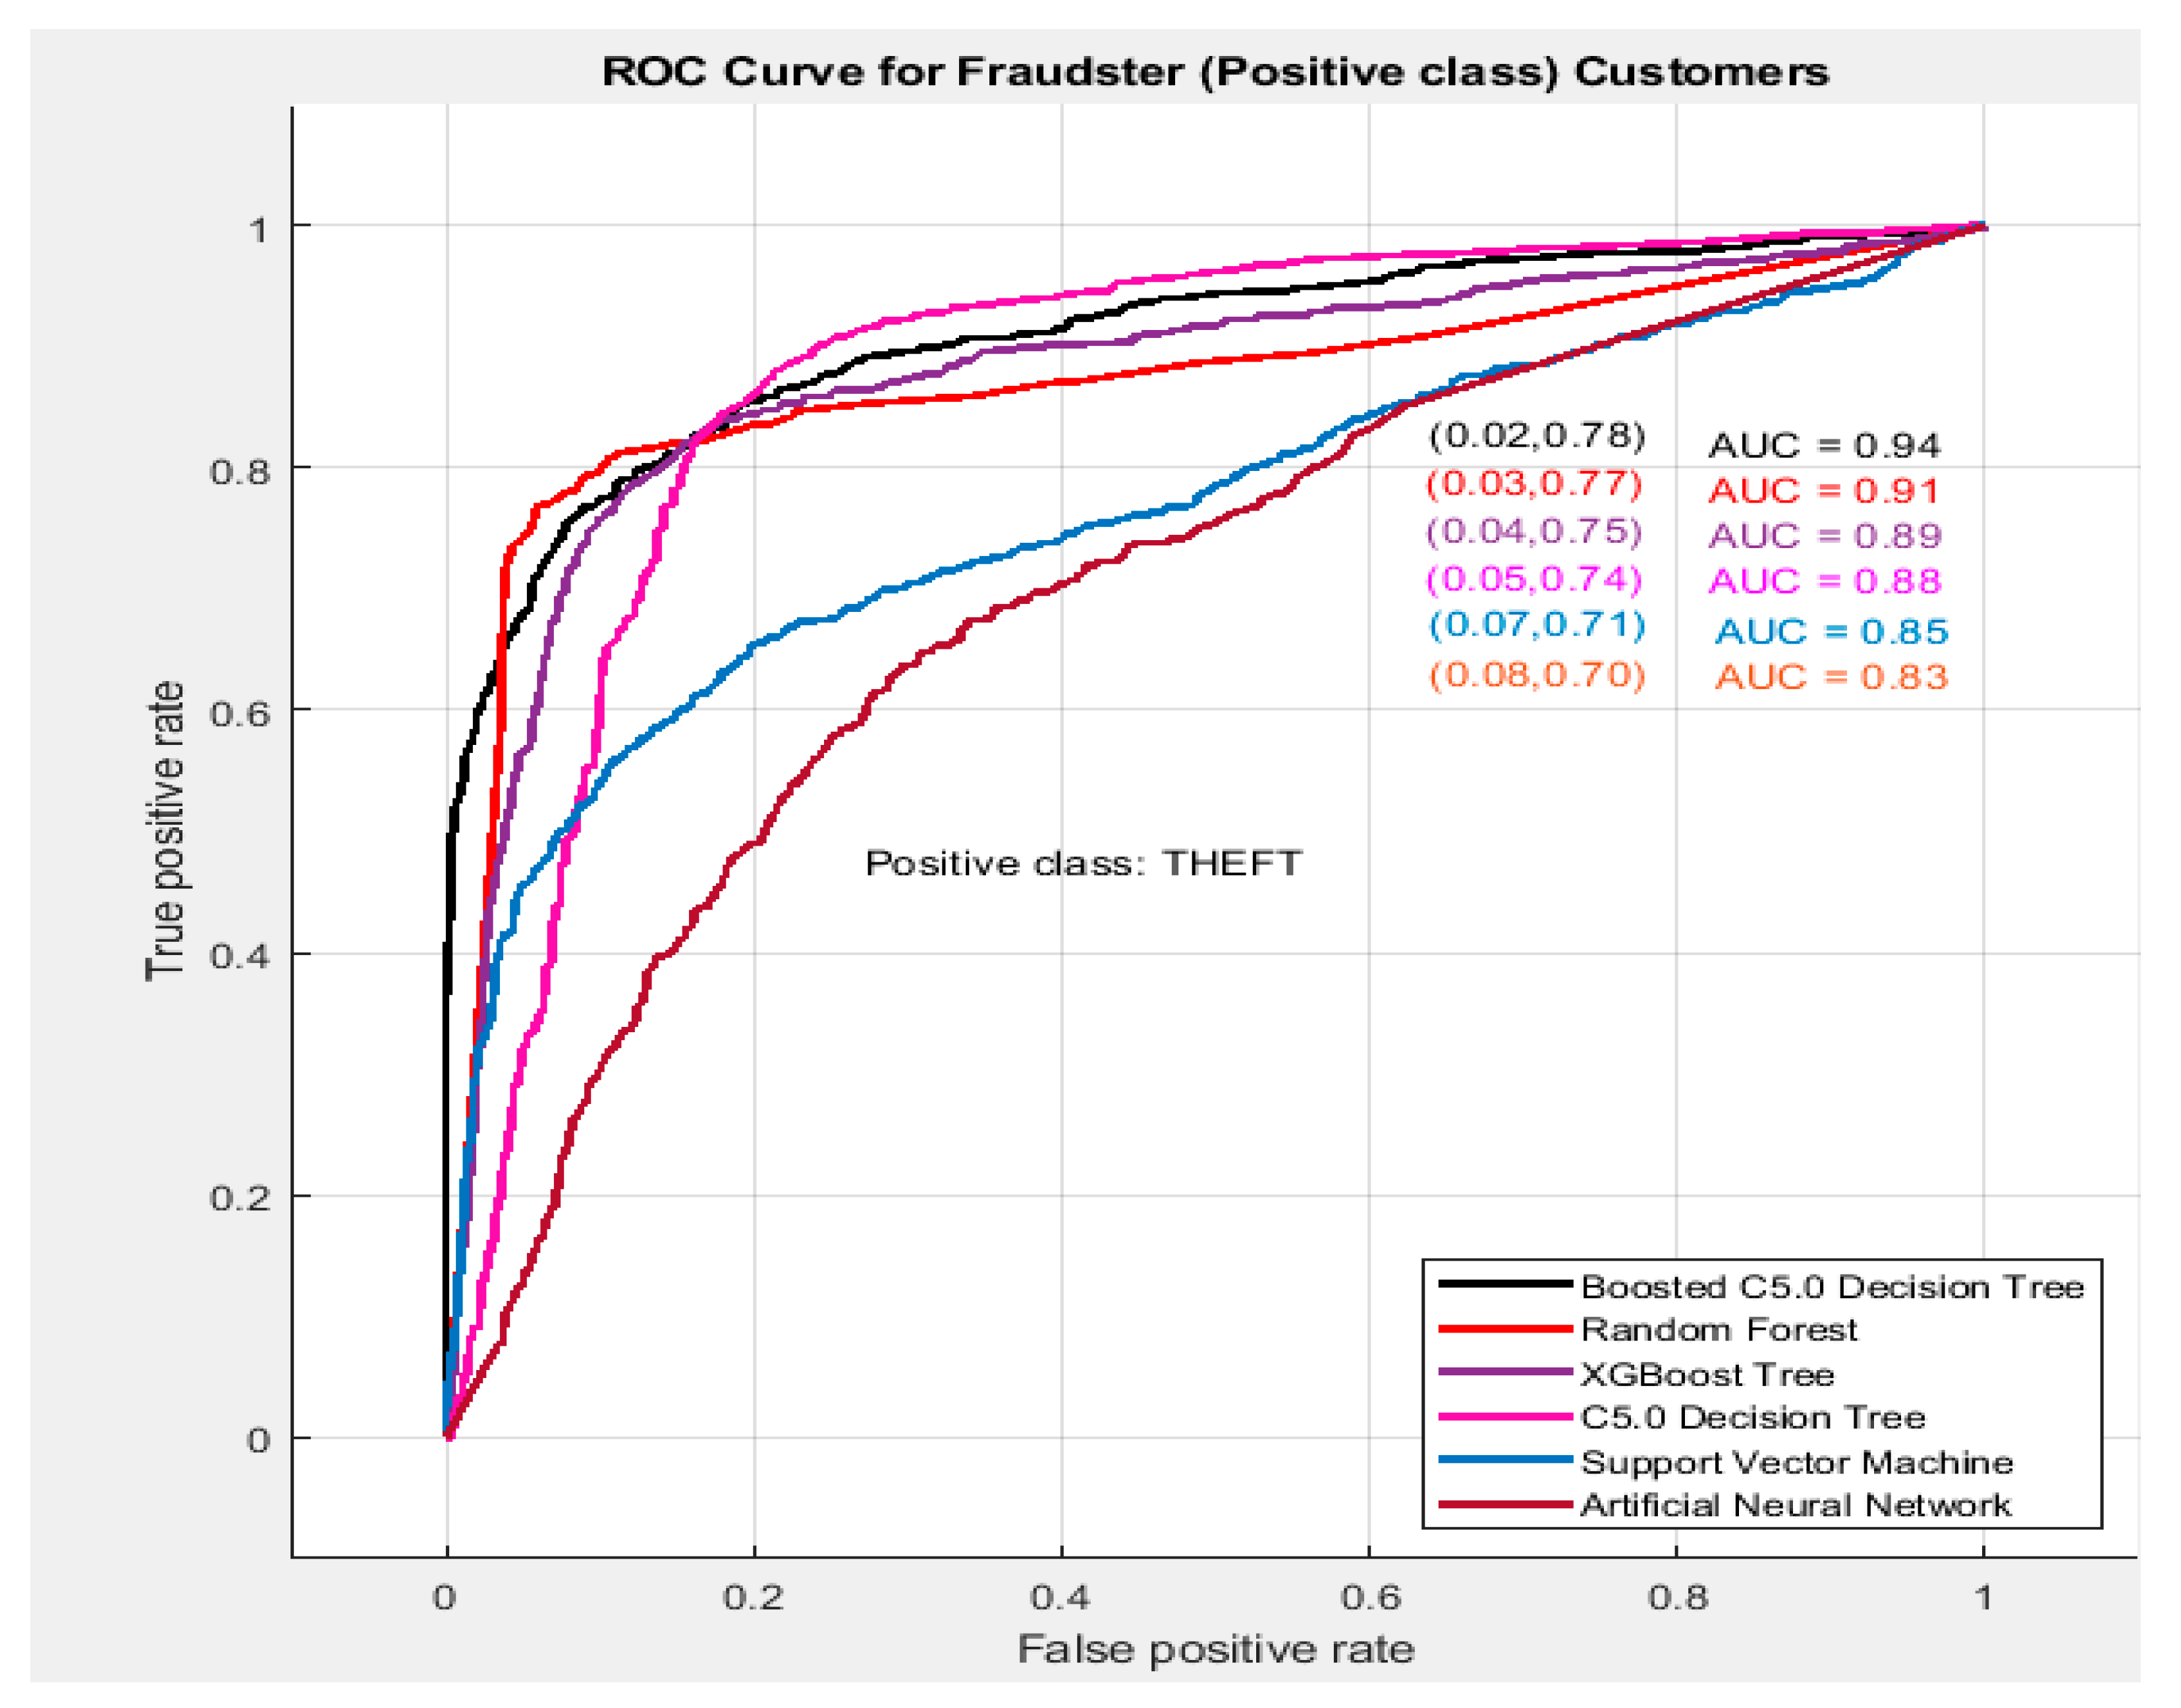
Receiver Operating Characteristic Curve of Studied Classifying Methods
Another important performance evaluator of the classifiers is the Receiver Operating Characteristic Curve (ROC) Curve [
16]. It assesses the true performance of the classifier by plotting the FPR against the TPR and is not dependent on the variation of class distribution. The area covered by the AUROC is a measure between 1 and 0. The classifier having the AUC value more than 0.5 performs better than the random prediction. Whereas, the AUC value of 0.5 indicates that the model cannot differentiate between the classes at all. The higher the value of AUC, the better will be the performance of the classifier.
Figure 4 and
Figure 5 show the AUC for theft and honest class, respectively, for all the studied classification methods.
It can be seen from
Figure 4 and
Figure 5 that the proposed Boosted C5.0 DT has the AUC of 0.94, which is much higher than all other studied machine learning algorithms. Furthermore, the outcomes show that the proposed method classifies 78% of fraudulent consumers accurately, while 0.02% of fraudster costumers were wrongly classified as honest. Similarly, the AUC for honest consumers shows that the proposed algorithm classifies 98% of the honest consumers correctly, while 21% of the fraudsters were wrongly classified as honest. Hence the classifier is able to classify 98% of the honest and 78% of fraudster customers accurately, which validates the superior performance of the proposed classifier over its competitors available in the literature.
5. Conclusions
An NTL detection model has been developed for efficiently identifying the fraudster customers in PDCs using the Boosted C5.0 algorithm. A feature extraction approach, along with the Pearson’s chi-square feature selection method, has been adopted for selecting the best features to train the Boosted C5.0 DT algorithm. To validate the classification superiority of the proposed method, its performance has been compared with few of the state-of-the-art artificial intelligence technologies (machine learning algorithms) for the identical dataset. As per the outcomes of the study, the proposed Boosted C5.0 DT classifier outperforms its competitor machine learning algorithms in terms of classification Accuracy, Sensitivity, Specificity, Precision, F1 score, and AUC. It classifies 98% of the honest and 78% of the fraudster customers accurately and hence validates its effectiveness in the current NTL detection problem. The study in its core provides in-depth information and a technical tool for power utility companies in their campaign against electric power theft which is one of the fundamental issues in under-developed countries.

 ,
, 


