Applied Research of the Hygrothermal Behaviour of an Internally Insulated Historic Wall without Vapour Barrier: In Situ Measurements and Dynamic Simulations

 , ,
, ,
Abstract
:1. Introduction
2. Case Study and Methods
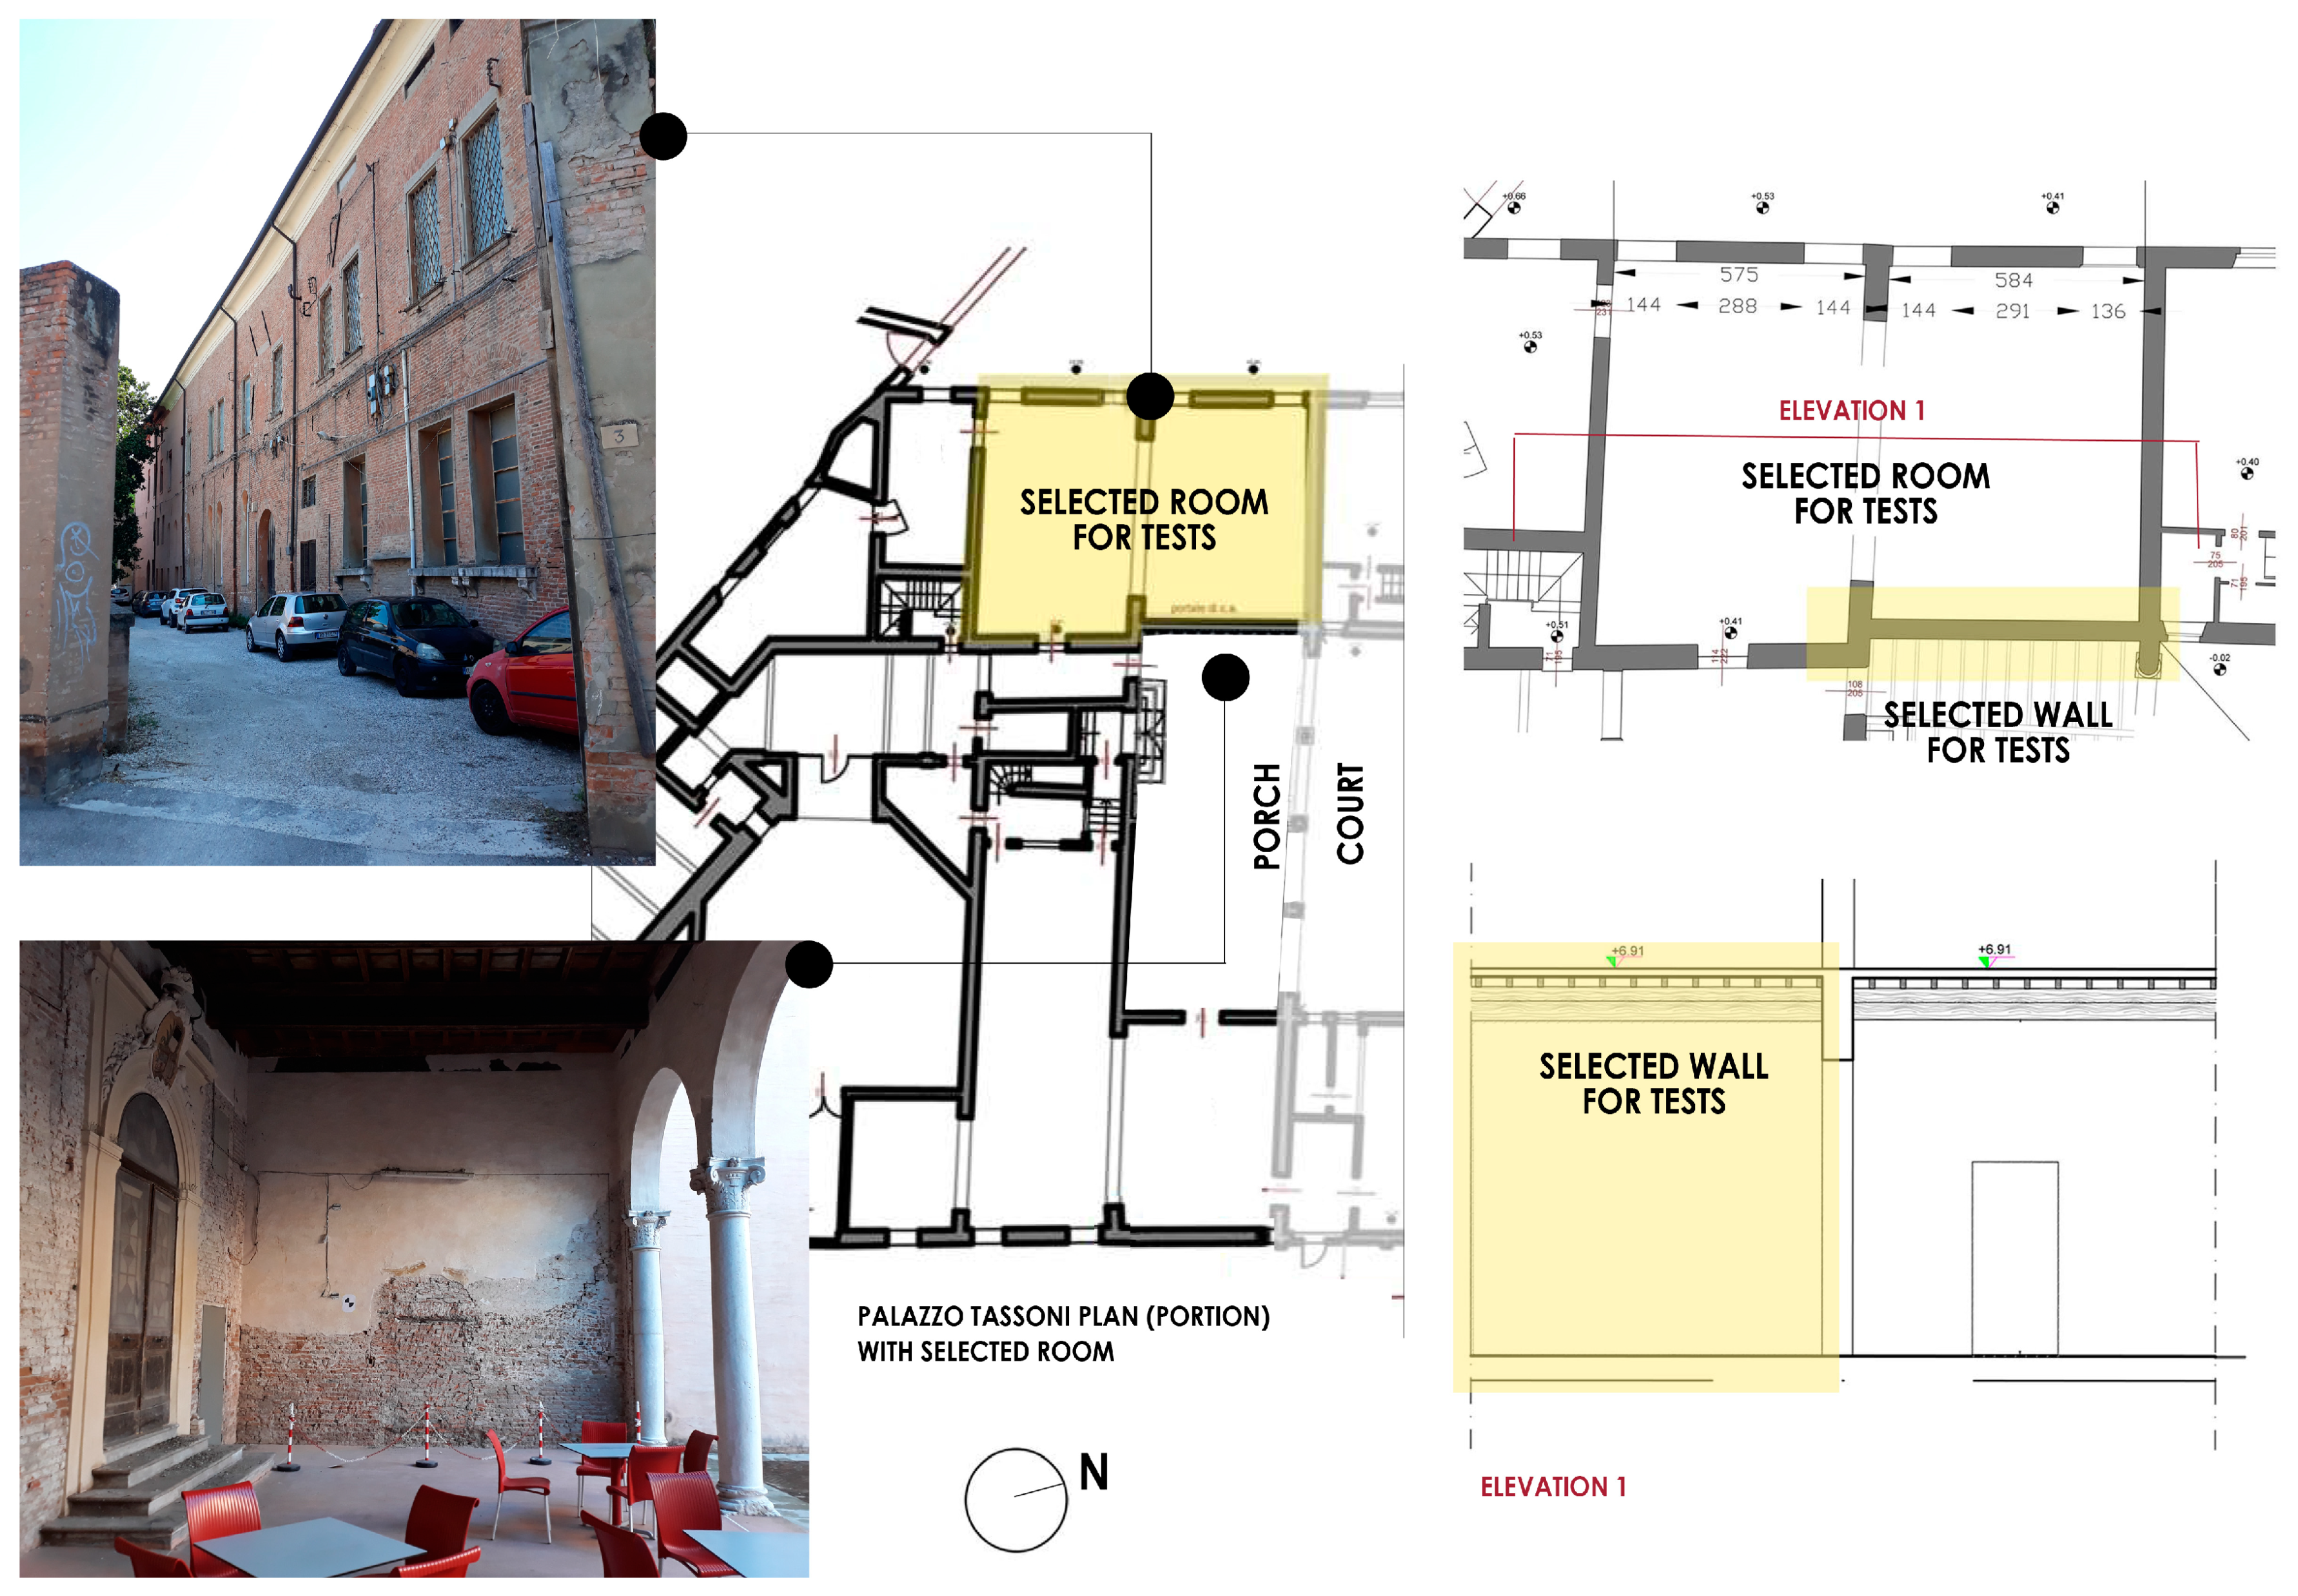
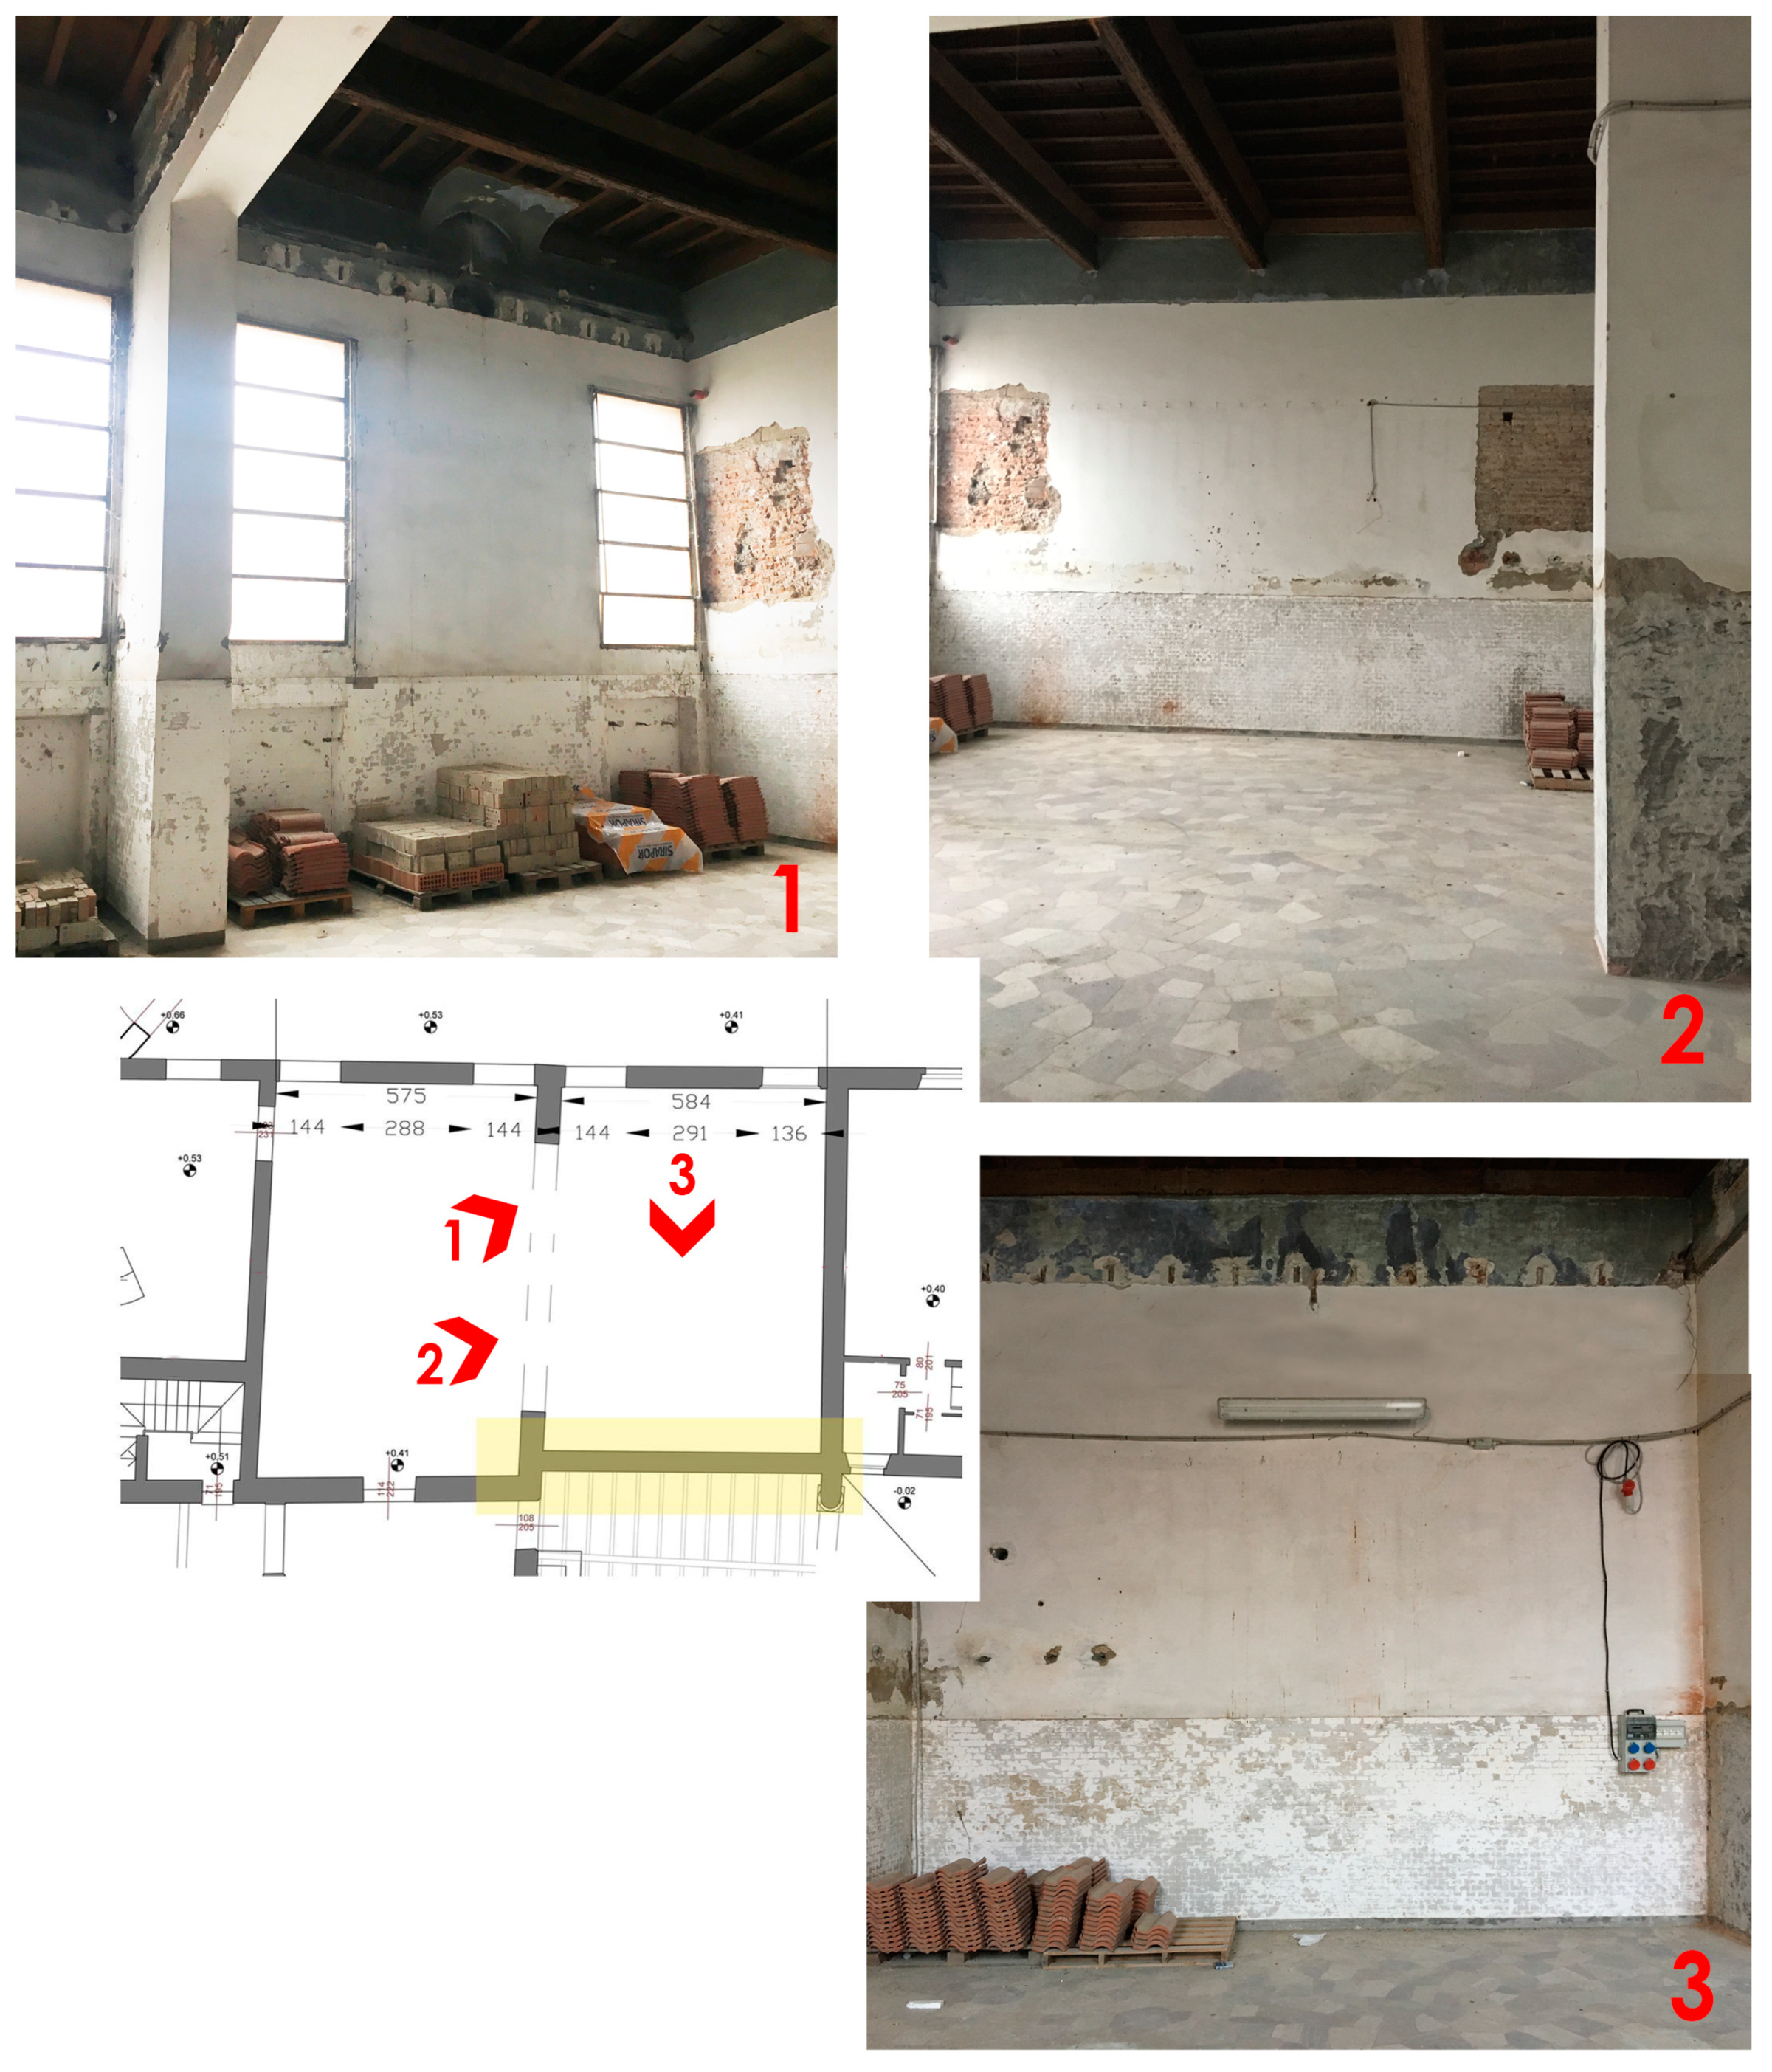
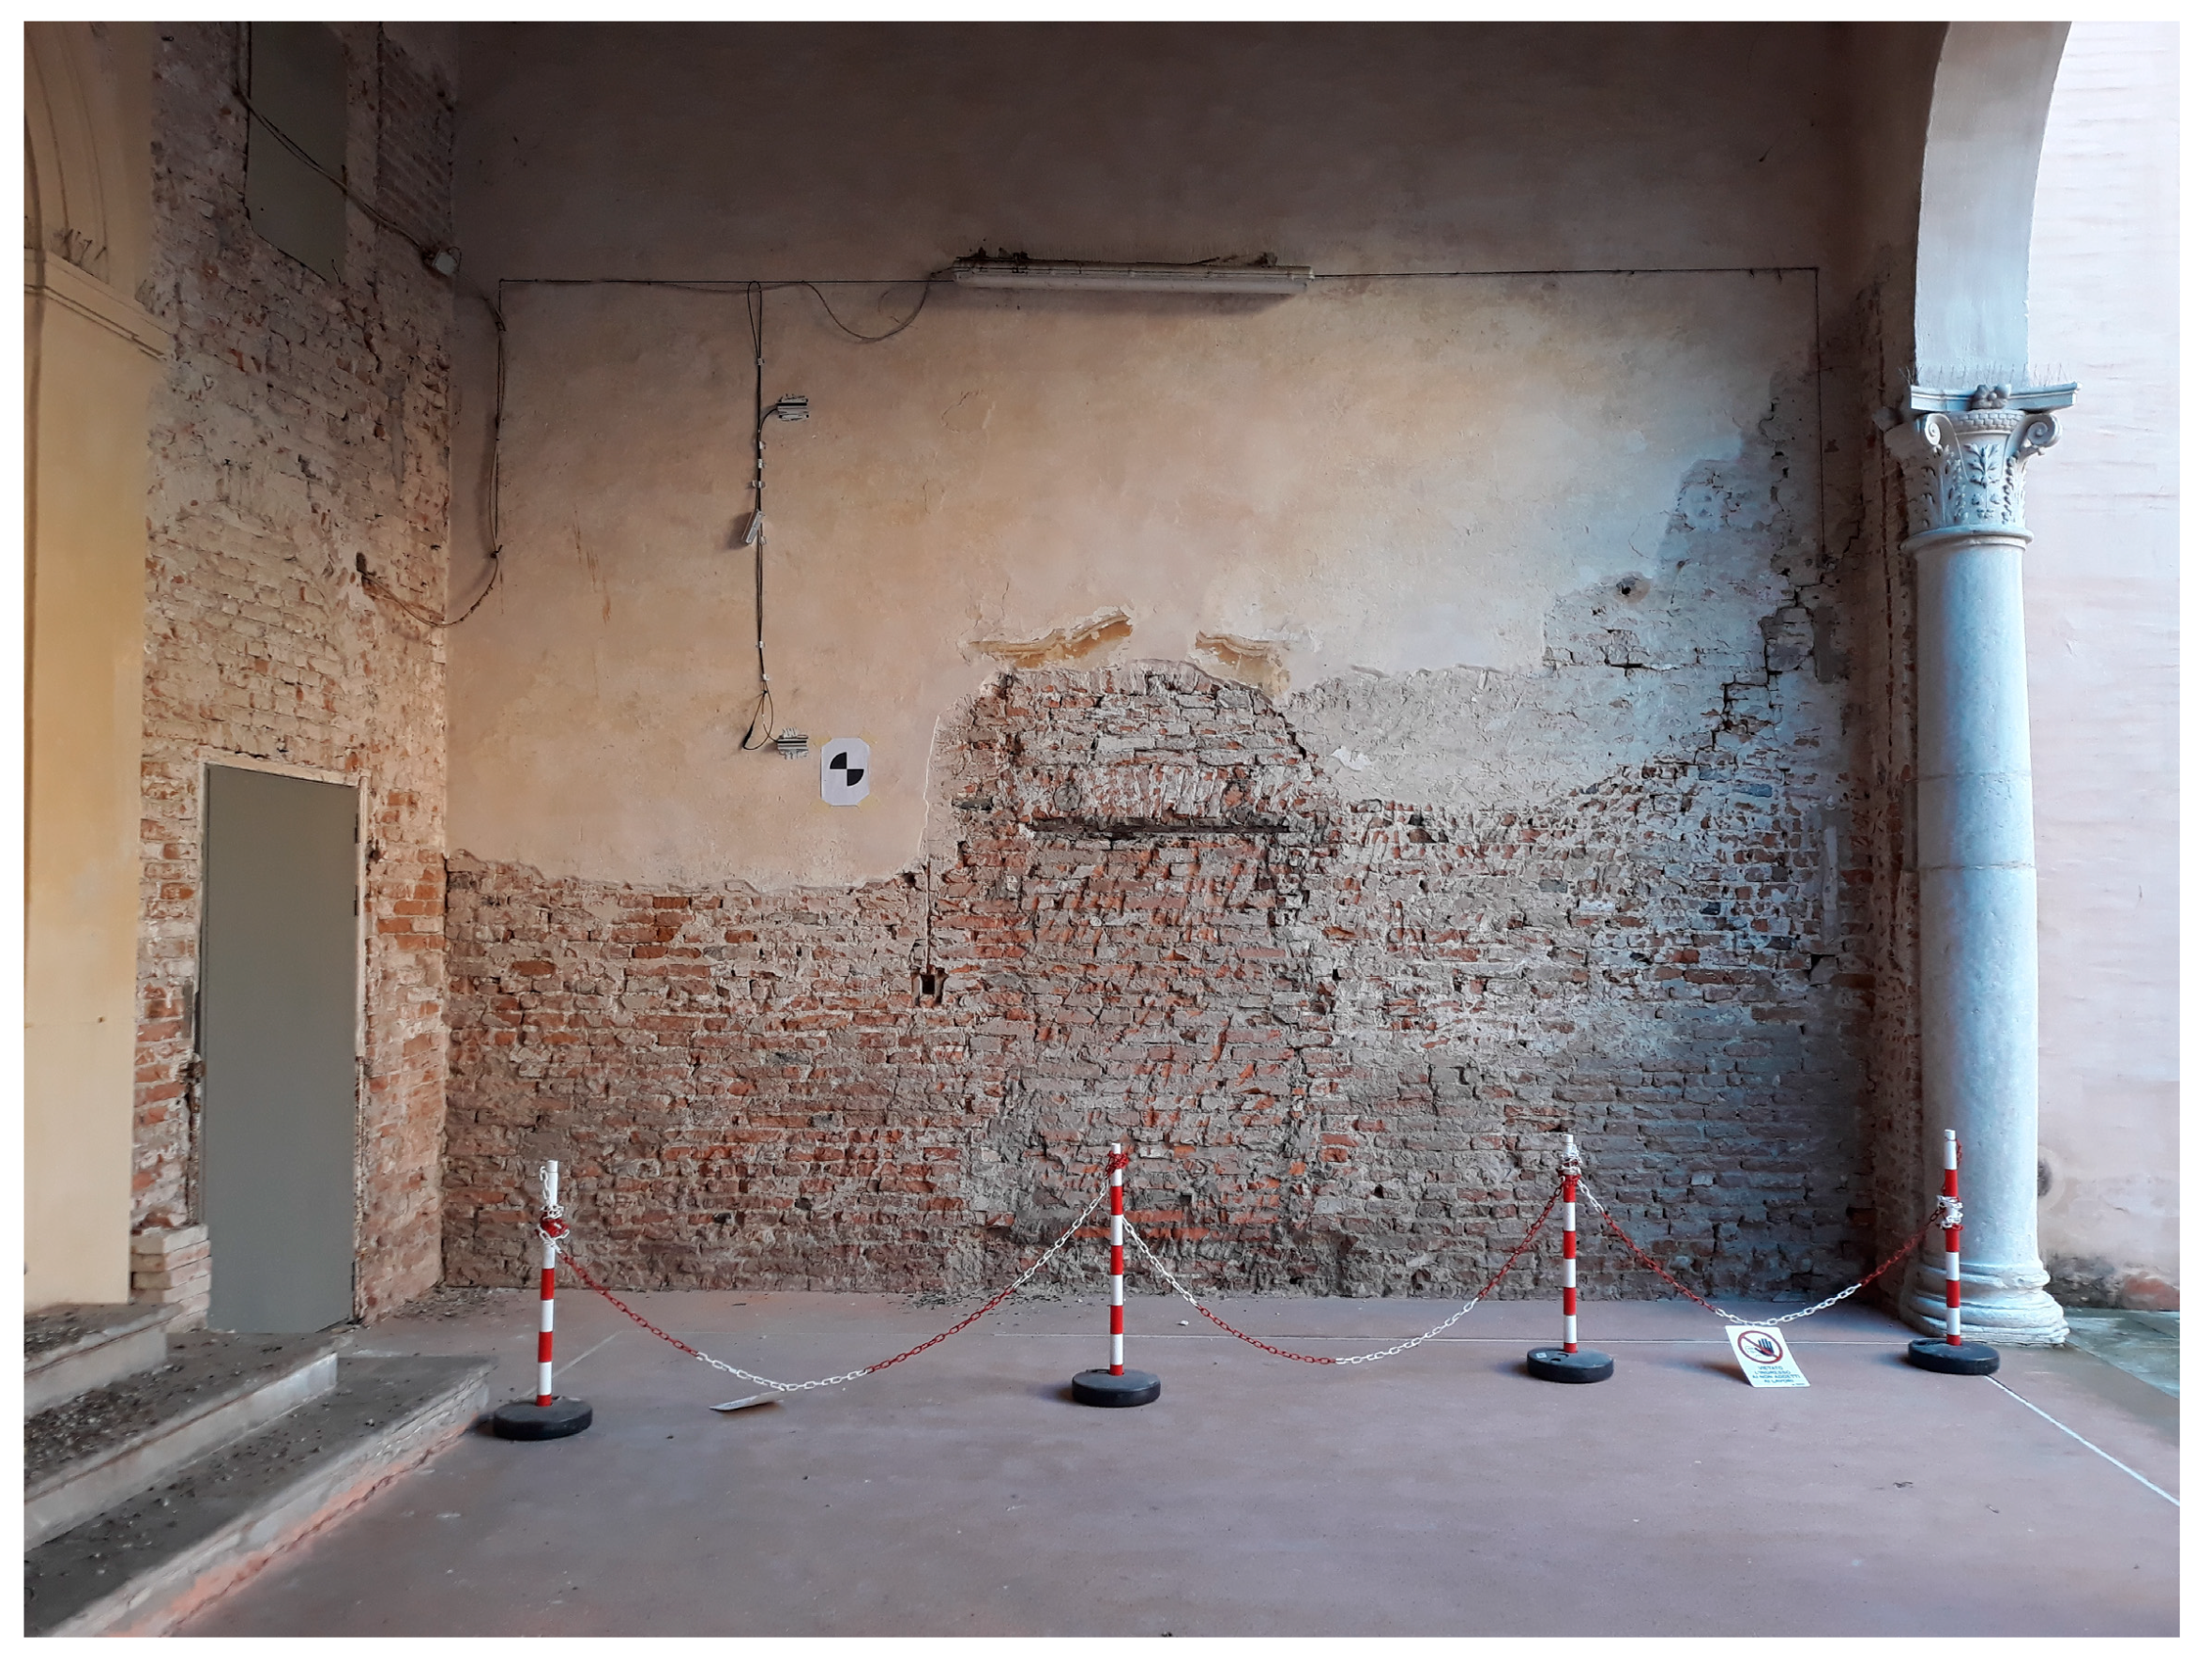
2.1. Case Study Presentation
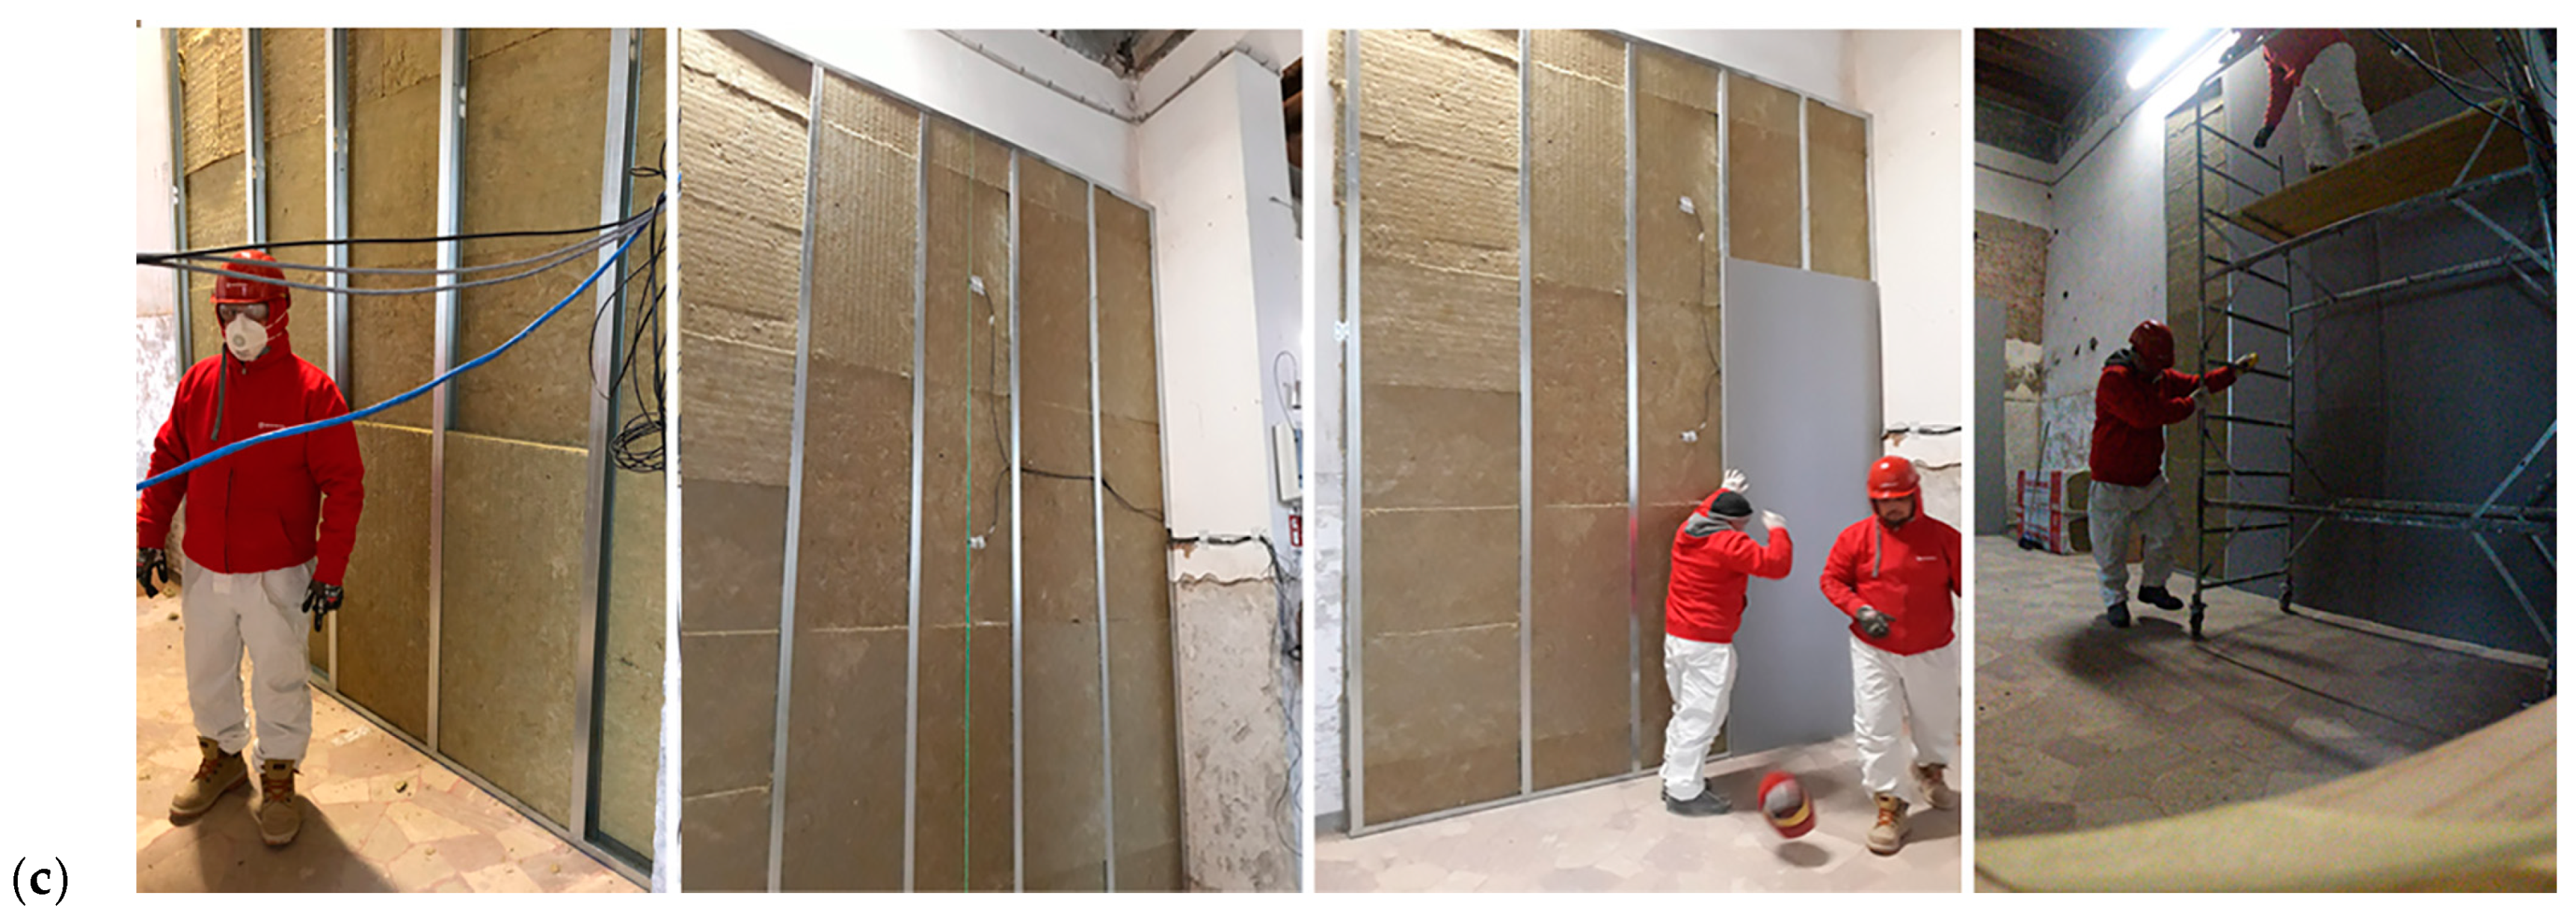
2.2. Technical Worktable and Selection of the Insulation Technologies
- Conservation aspects, referred to the elements to preserve (i.e., decorations, finishing), to the aesthetical aspect of the finishing (e.g., proportions, materials, colours, textures), and to the reversibility (i.e., fastening system, and assembly and installation method);
- Energy efficiency referred to the final thickness, laying of the materials and U-value which justify the intervention—balance between thermal performance improvement and conservation aspects);
- Hygrothermal aspects, referred to the use of the vapour barrier. One of the innovative aspects of the HeLLo project is to verify the use of common insulation technologies without vapour barrier, differently from market suggestions for intervention in existing or new buildings, just to “stress” the performance of the tested stratigraphy and to keep the original vapour transport (i.e., low vapour resistance or vapour open materials), typical of HB materials [41]. This option enables summer drying potential of the historic envelope or the potential existing humidity in the wall (e.g., rising damp).
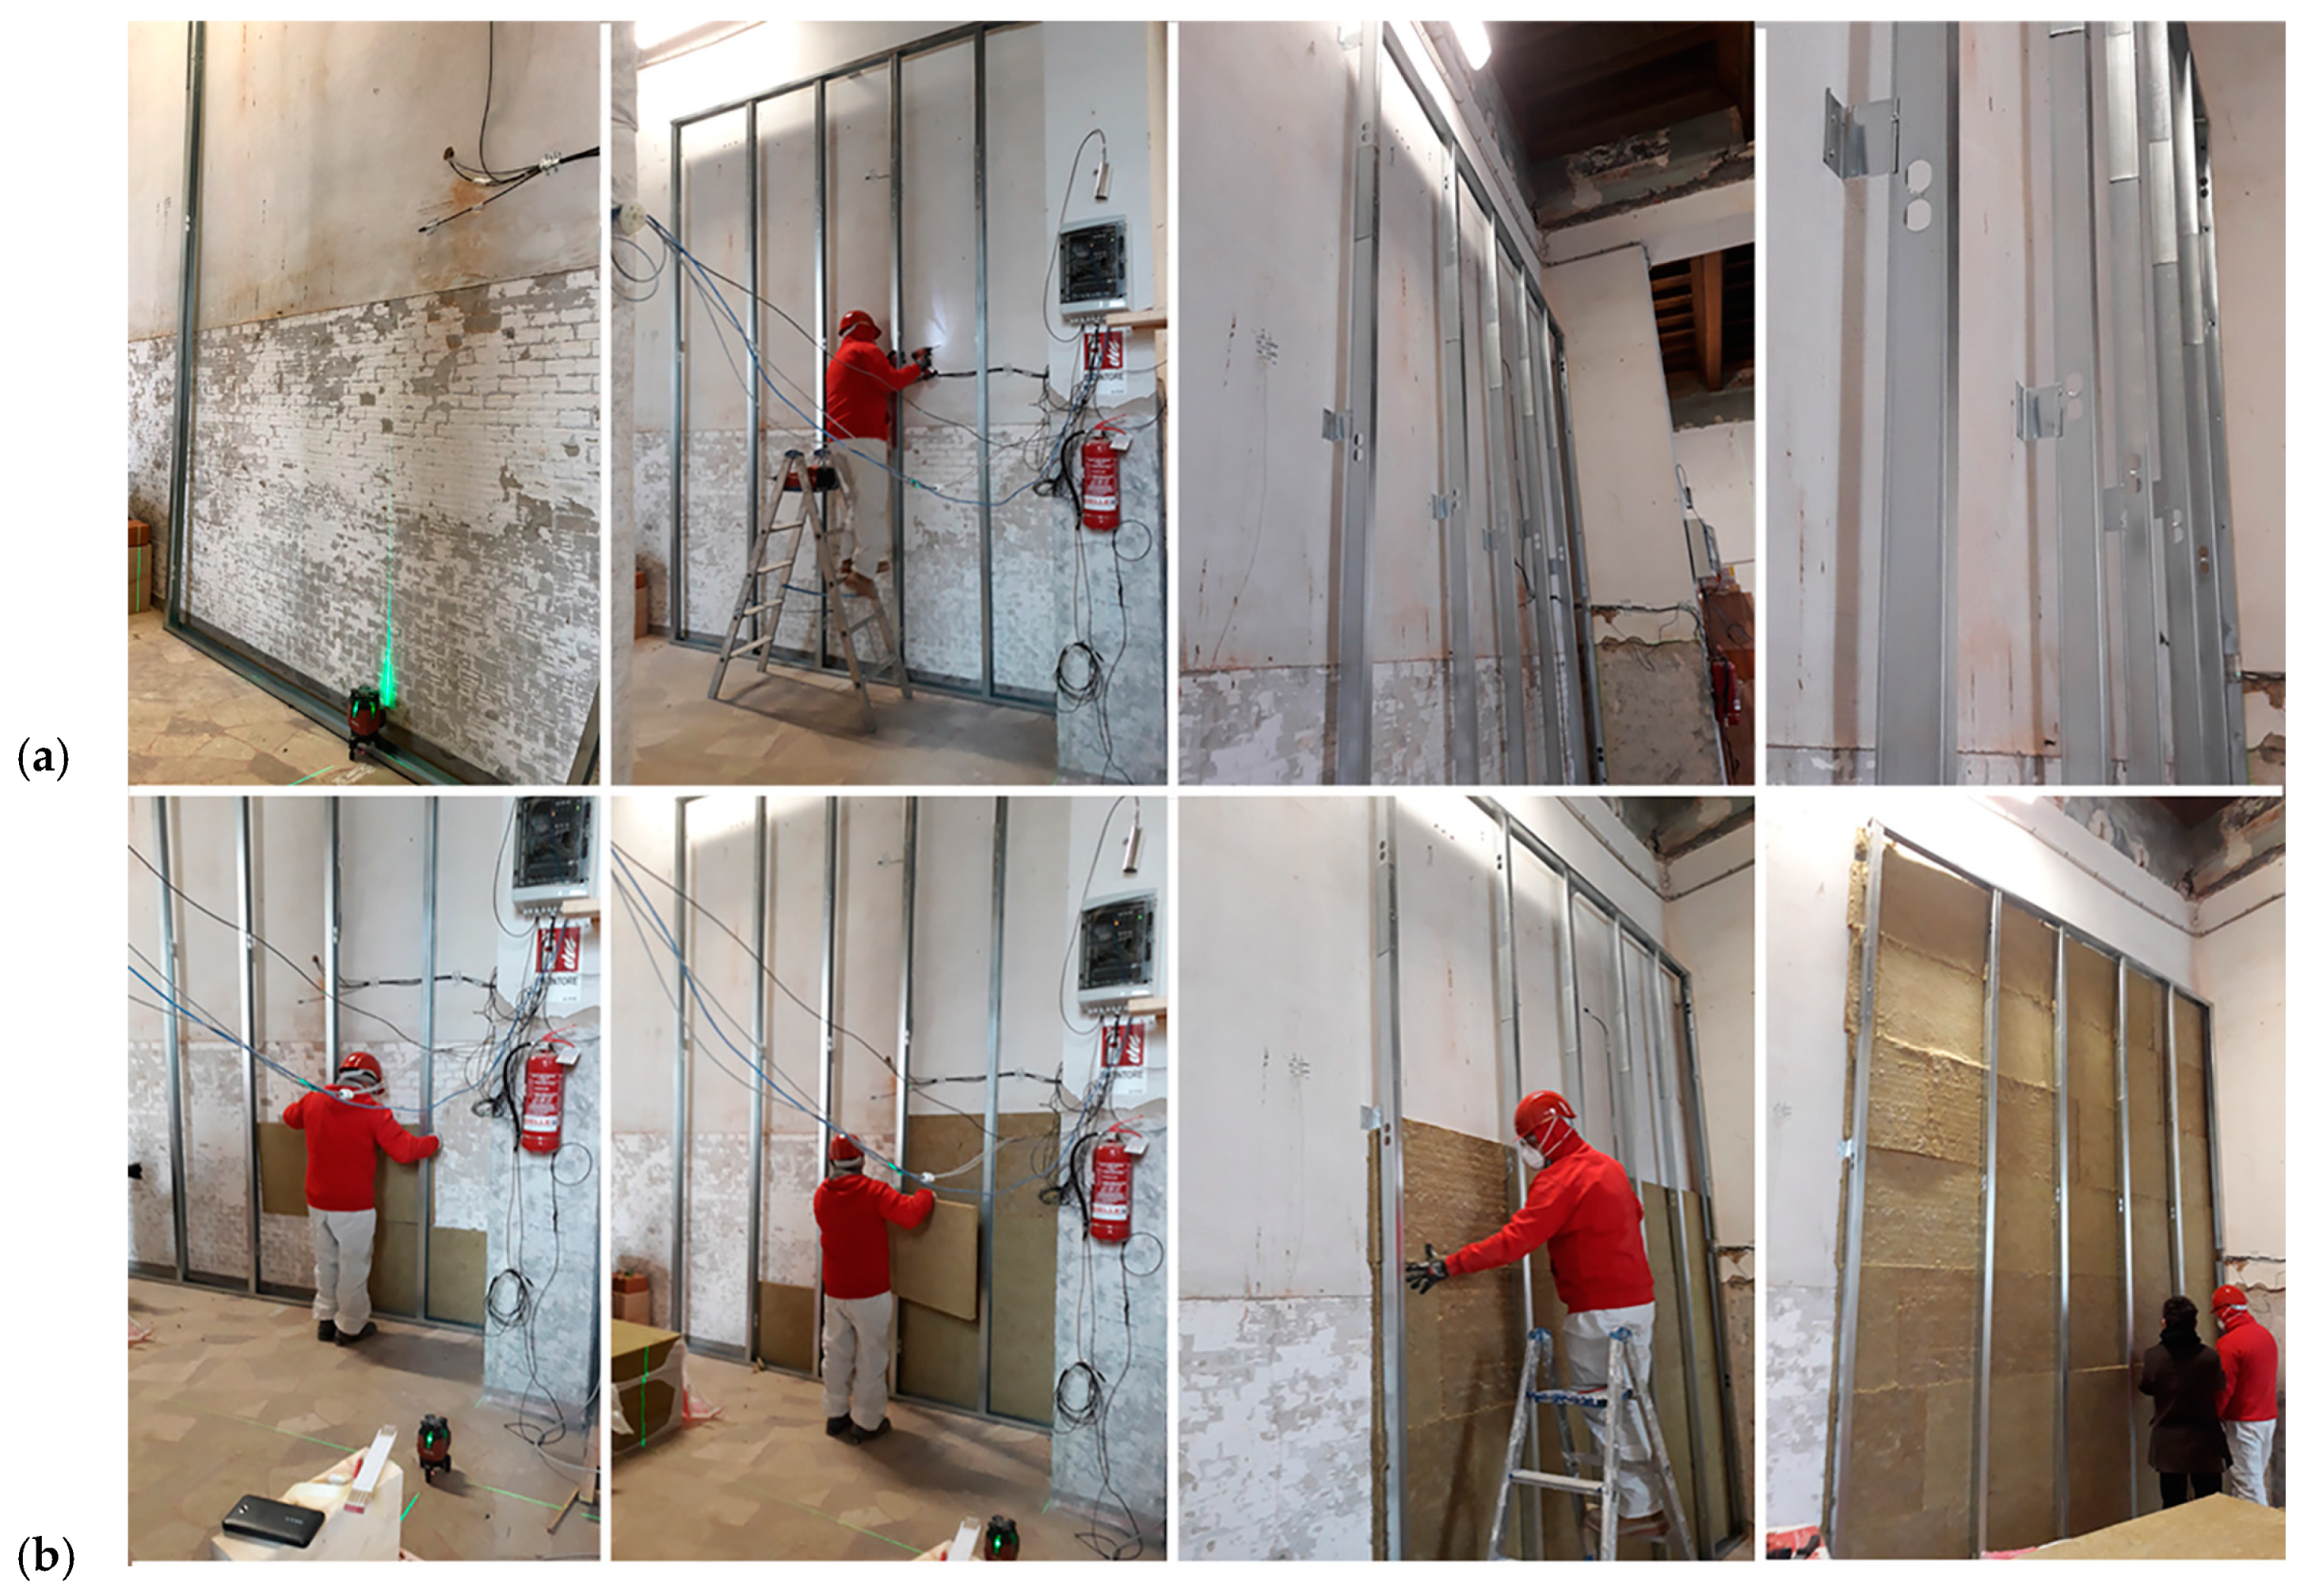
- Stone wool boards: 40 + 60 mm thickness panels supported by their own steel frame and finished with gypsum boards (12.5 mm).
- Cork boards: 50 mm thickness panels supported by their own timber structure, punctually fixed to the historic wall (very few anchor points) and finishing provided by gypsum fibre boards (12.5 mm);
- Calcium silicate panels: 100 mm thickness panels glued, thanks to a mortar adhesive 8 mm thick, to the historic wall and given a 10 mm finishing mortar layer;
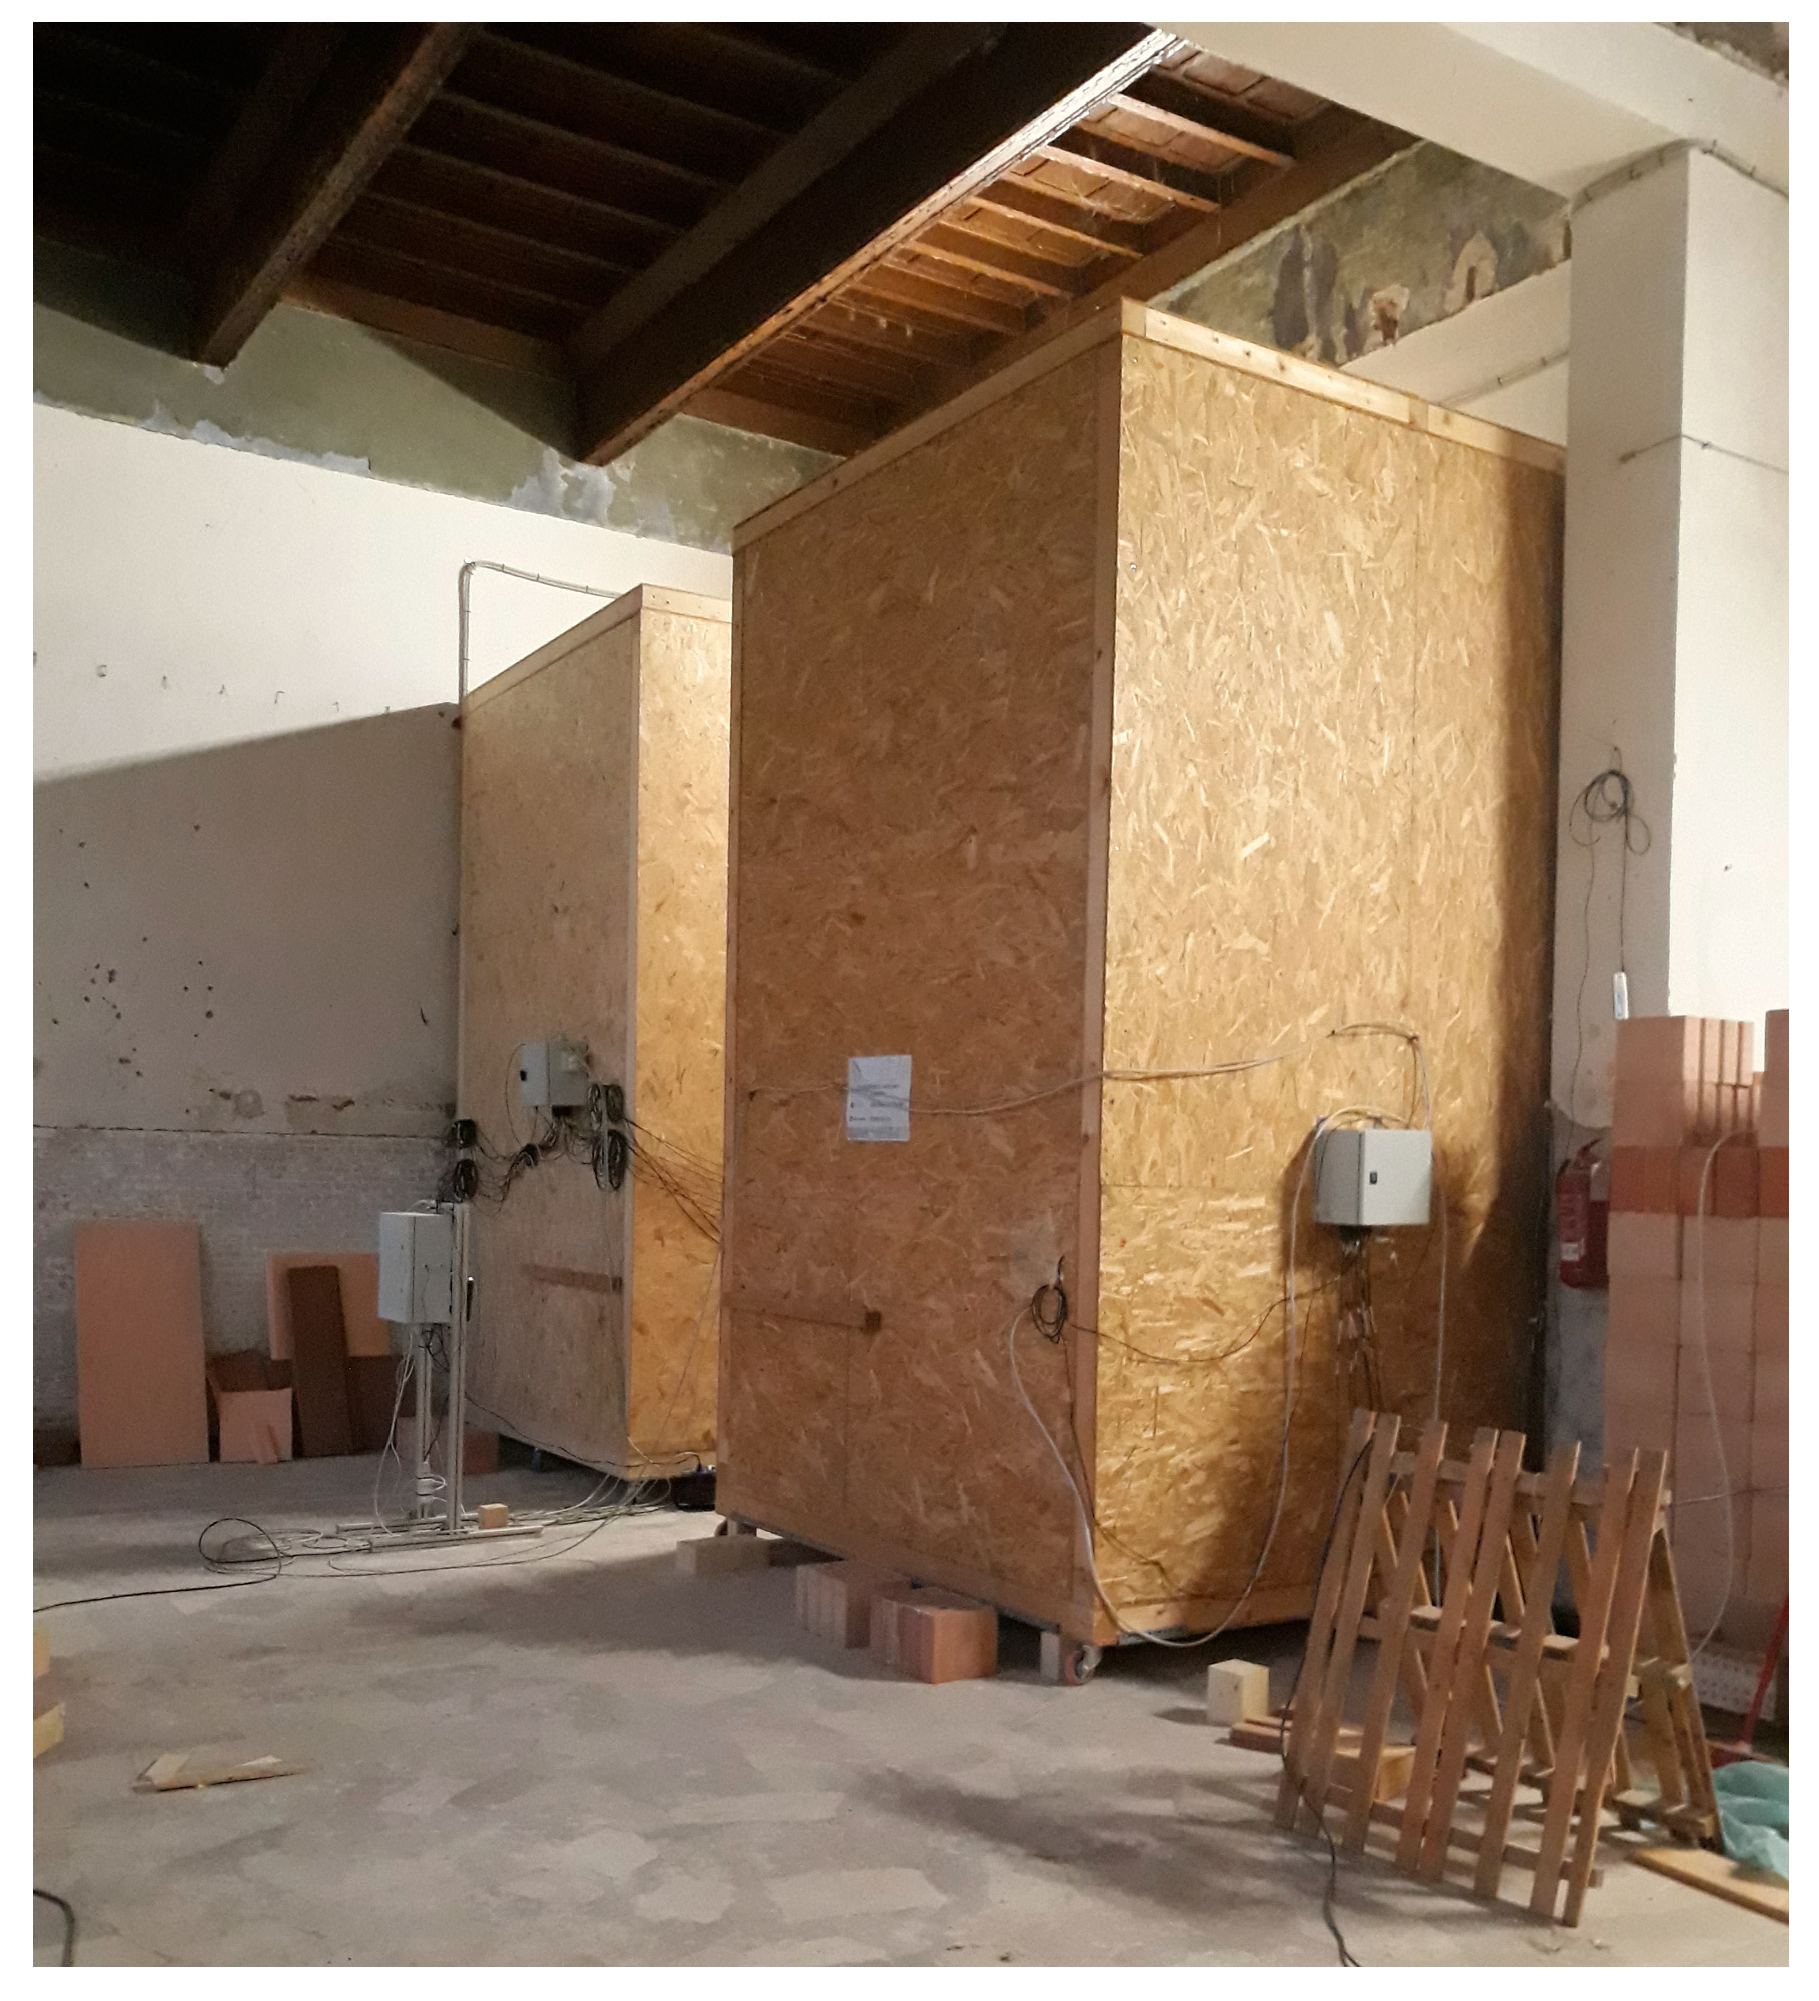
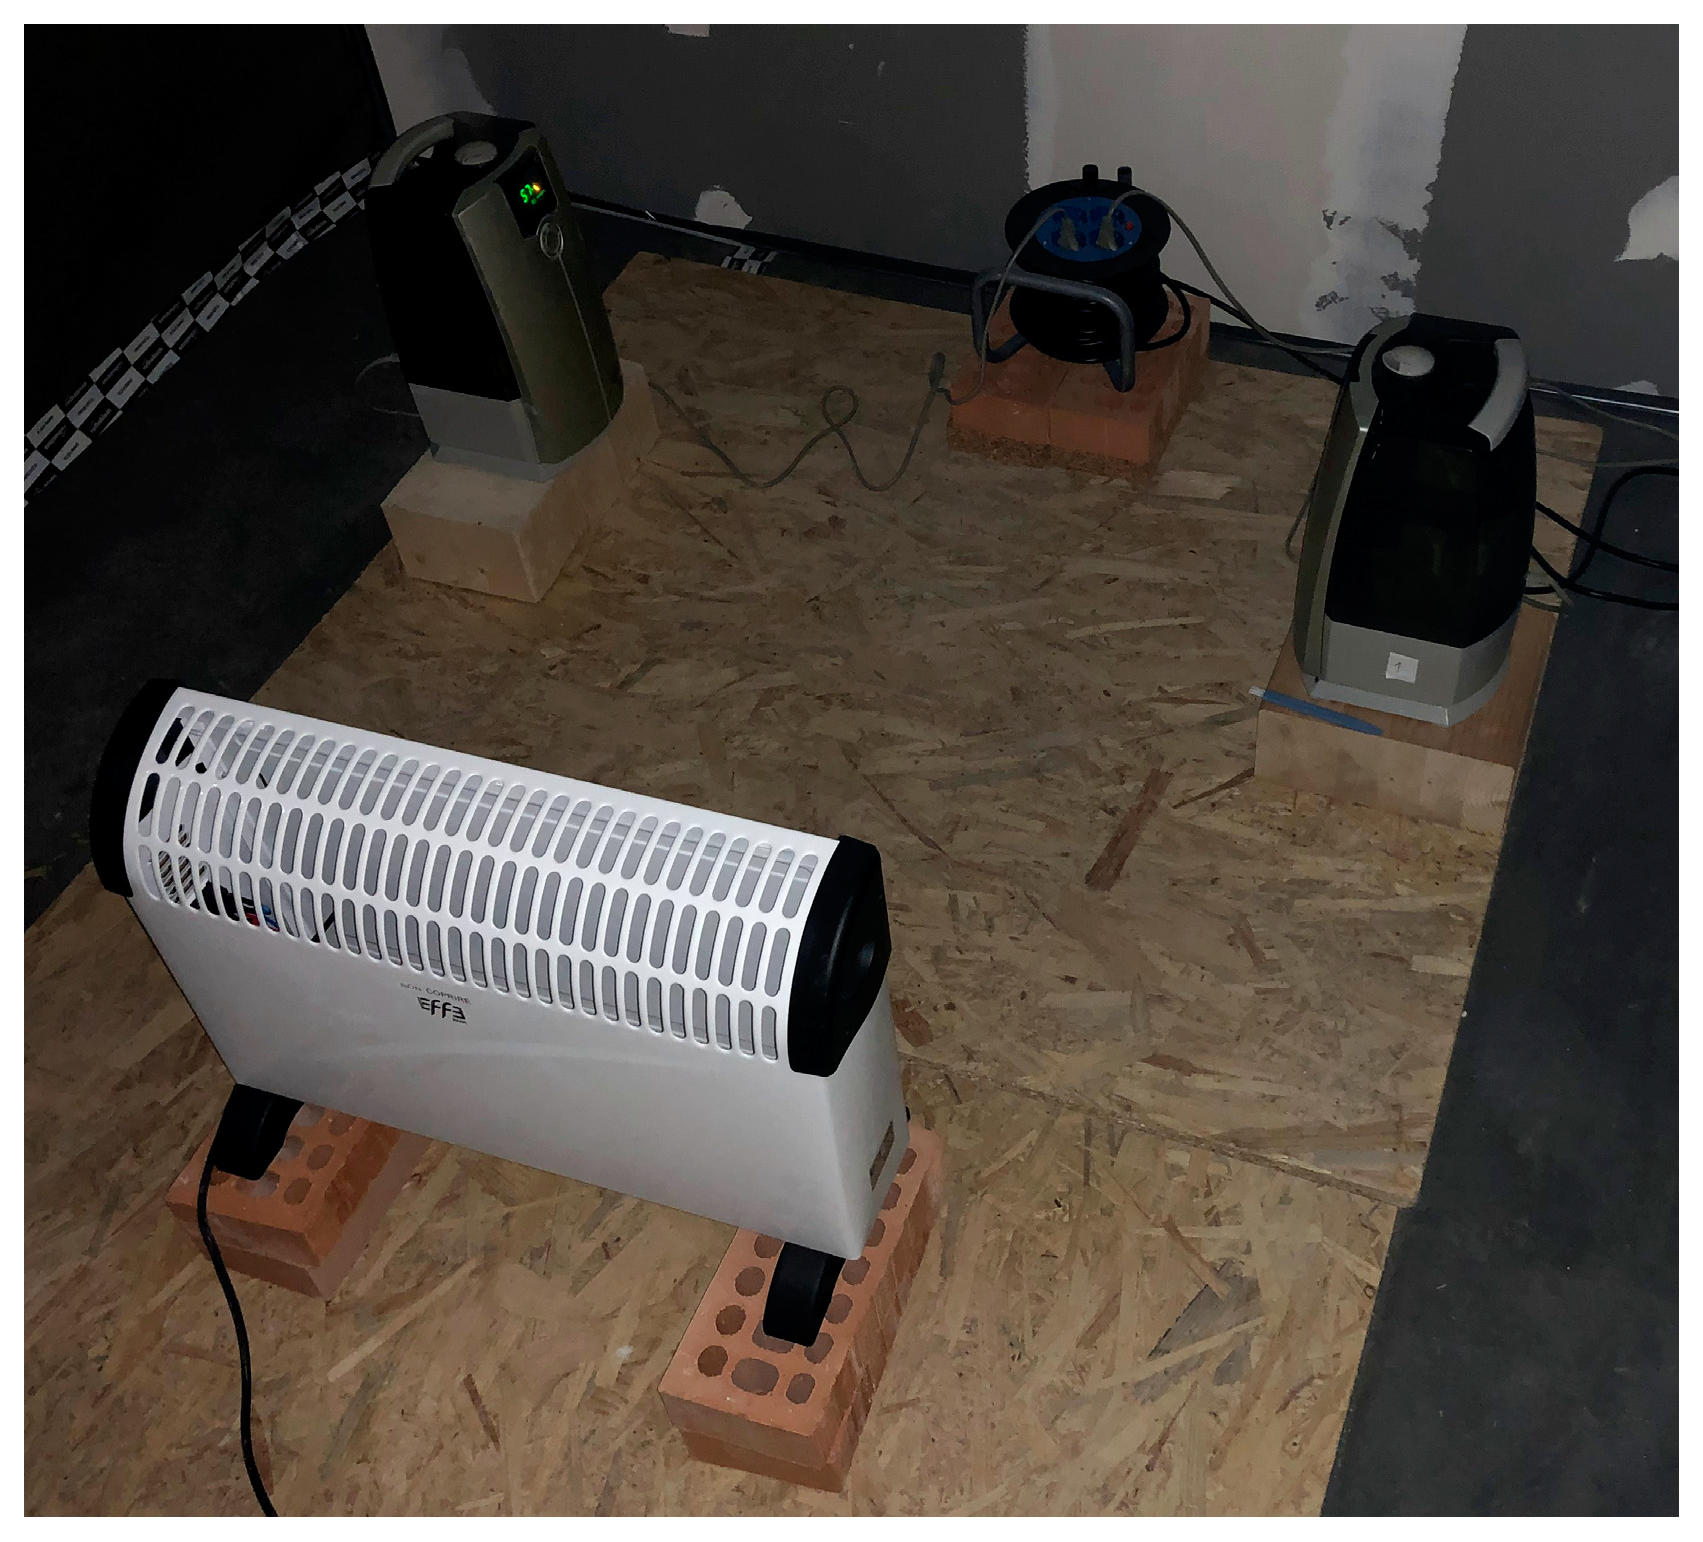
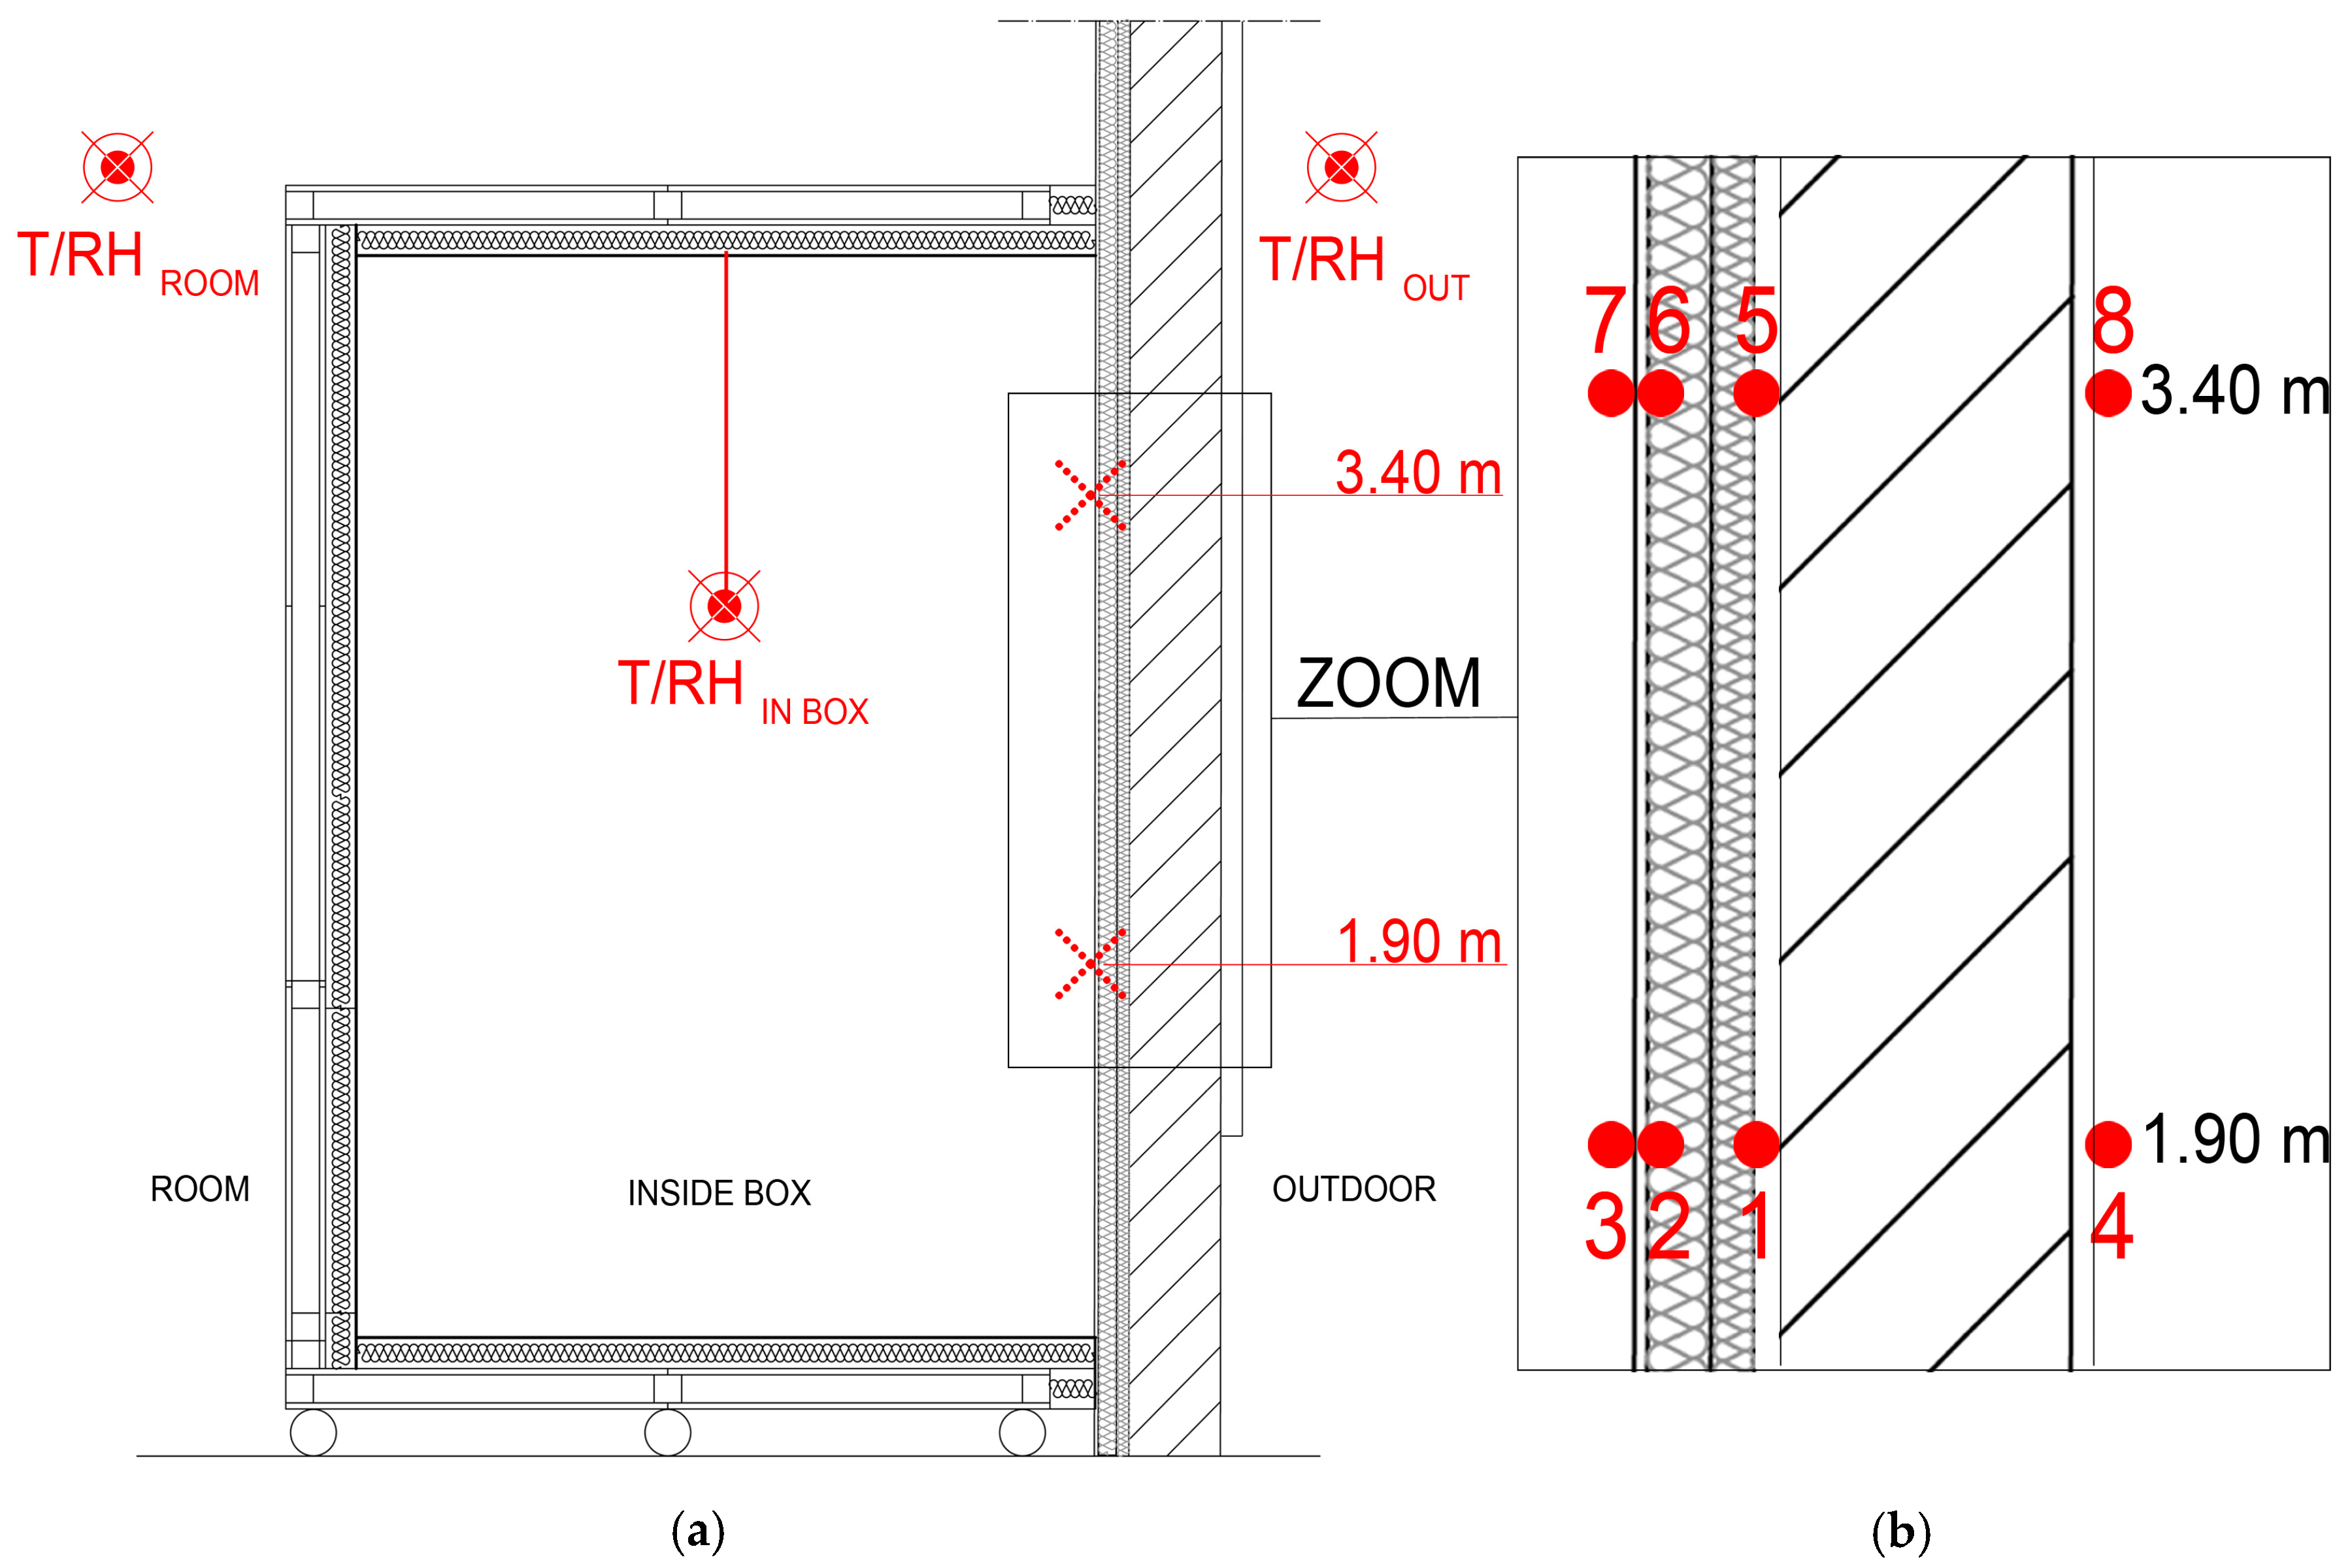
2.3. Monitoring System: New Metering Box and Hygrothermal Control Devices
3. Monitoring System and Period Campaign
4. Hygrothermal Simulation Set-Up
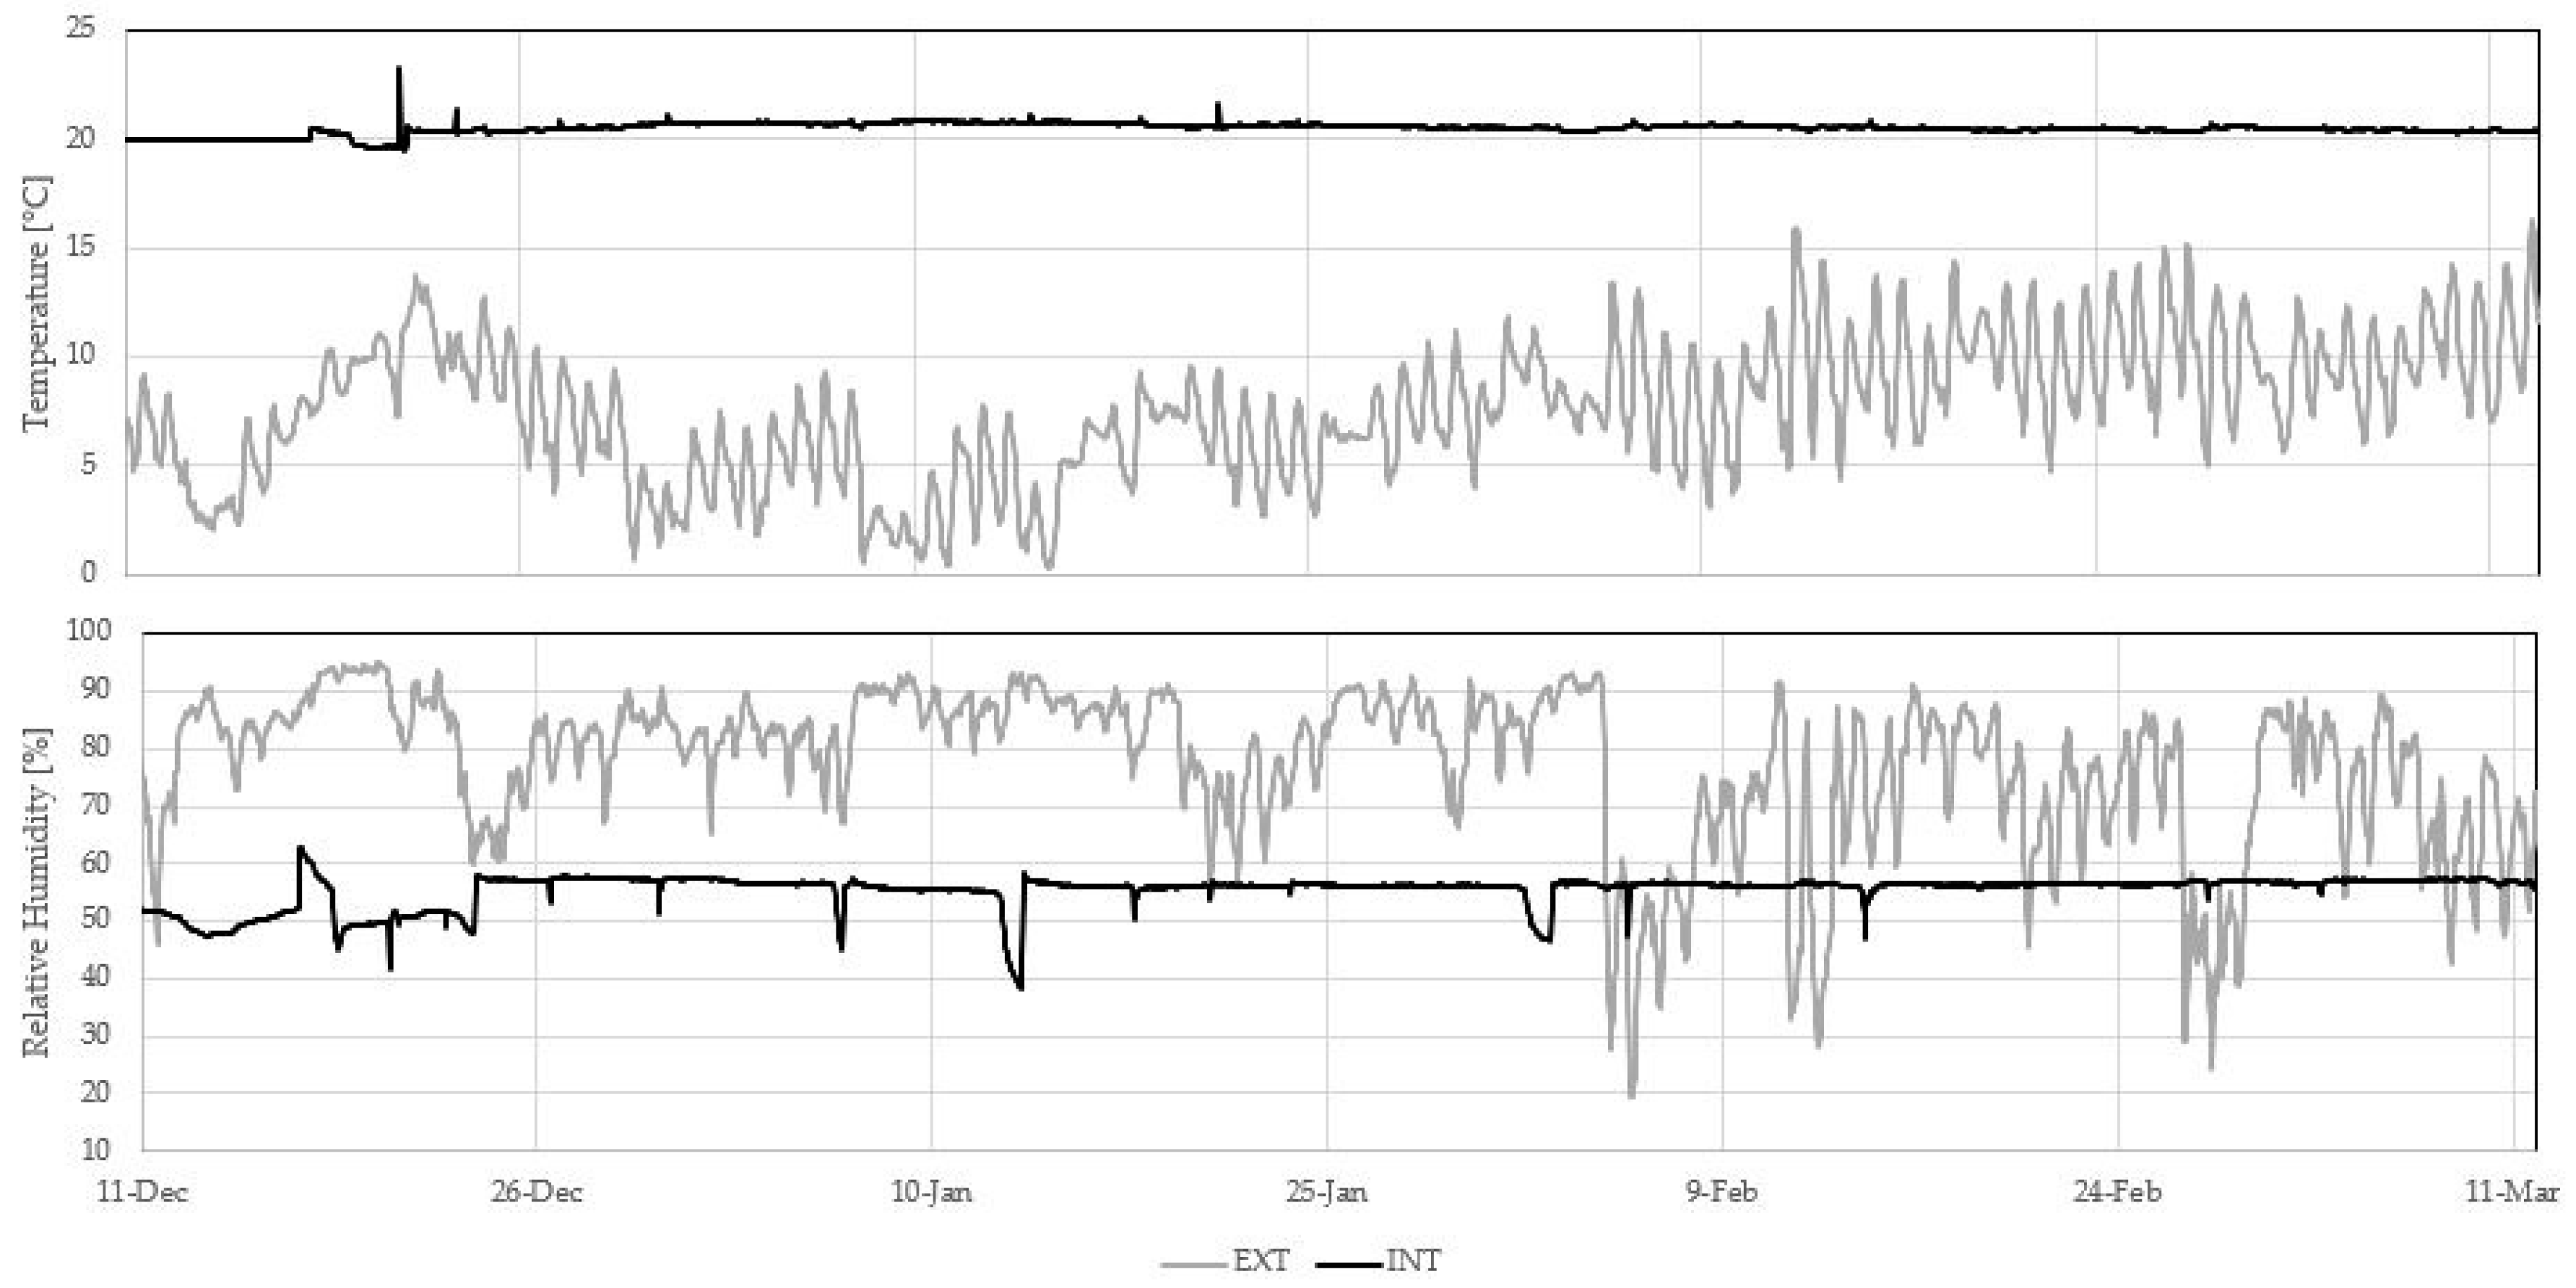
4.1. Boundary Conditions
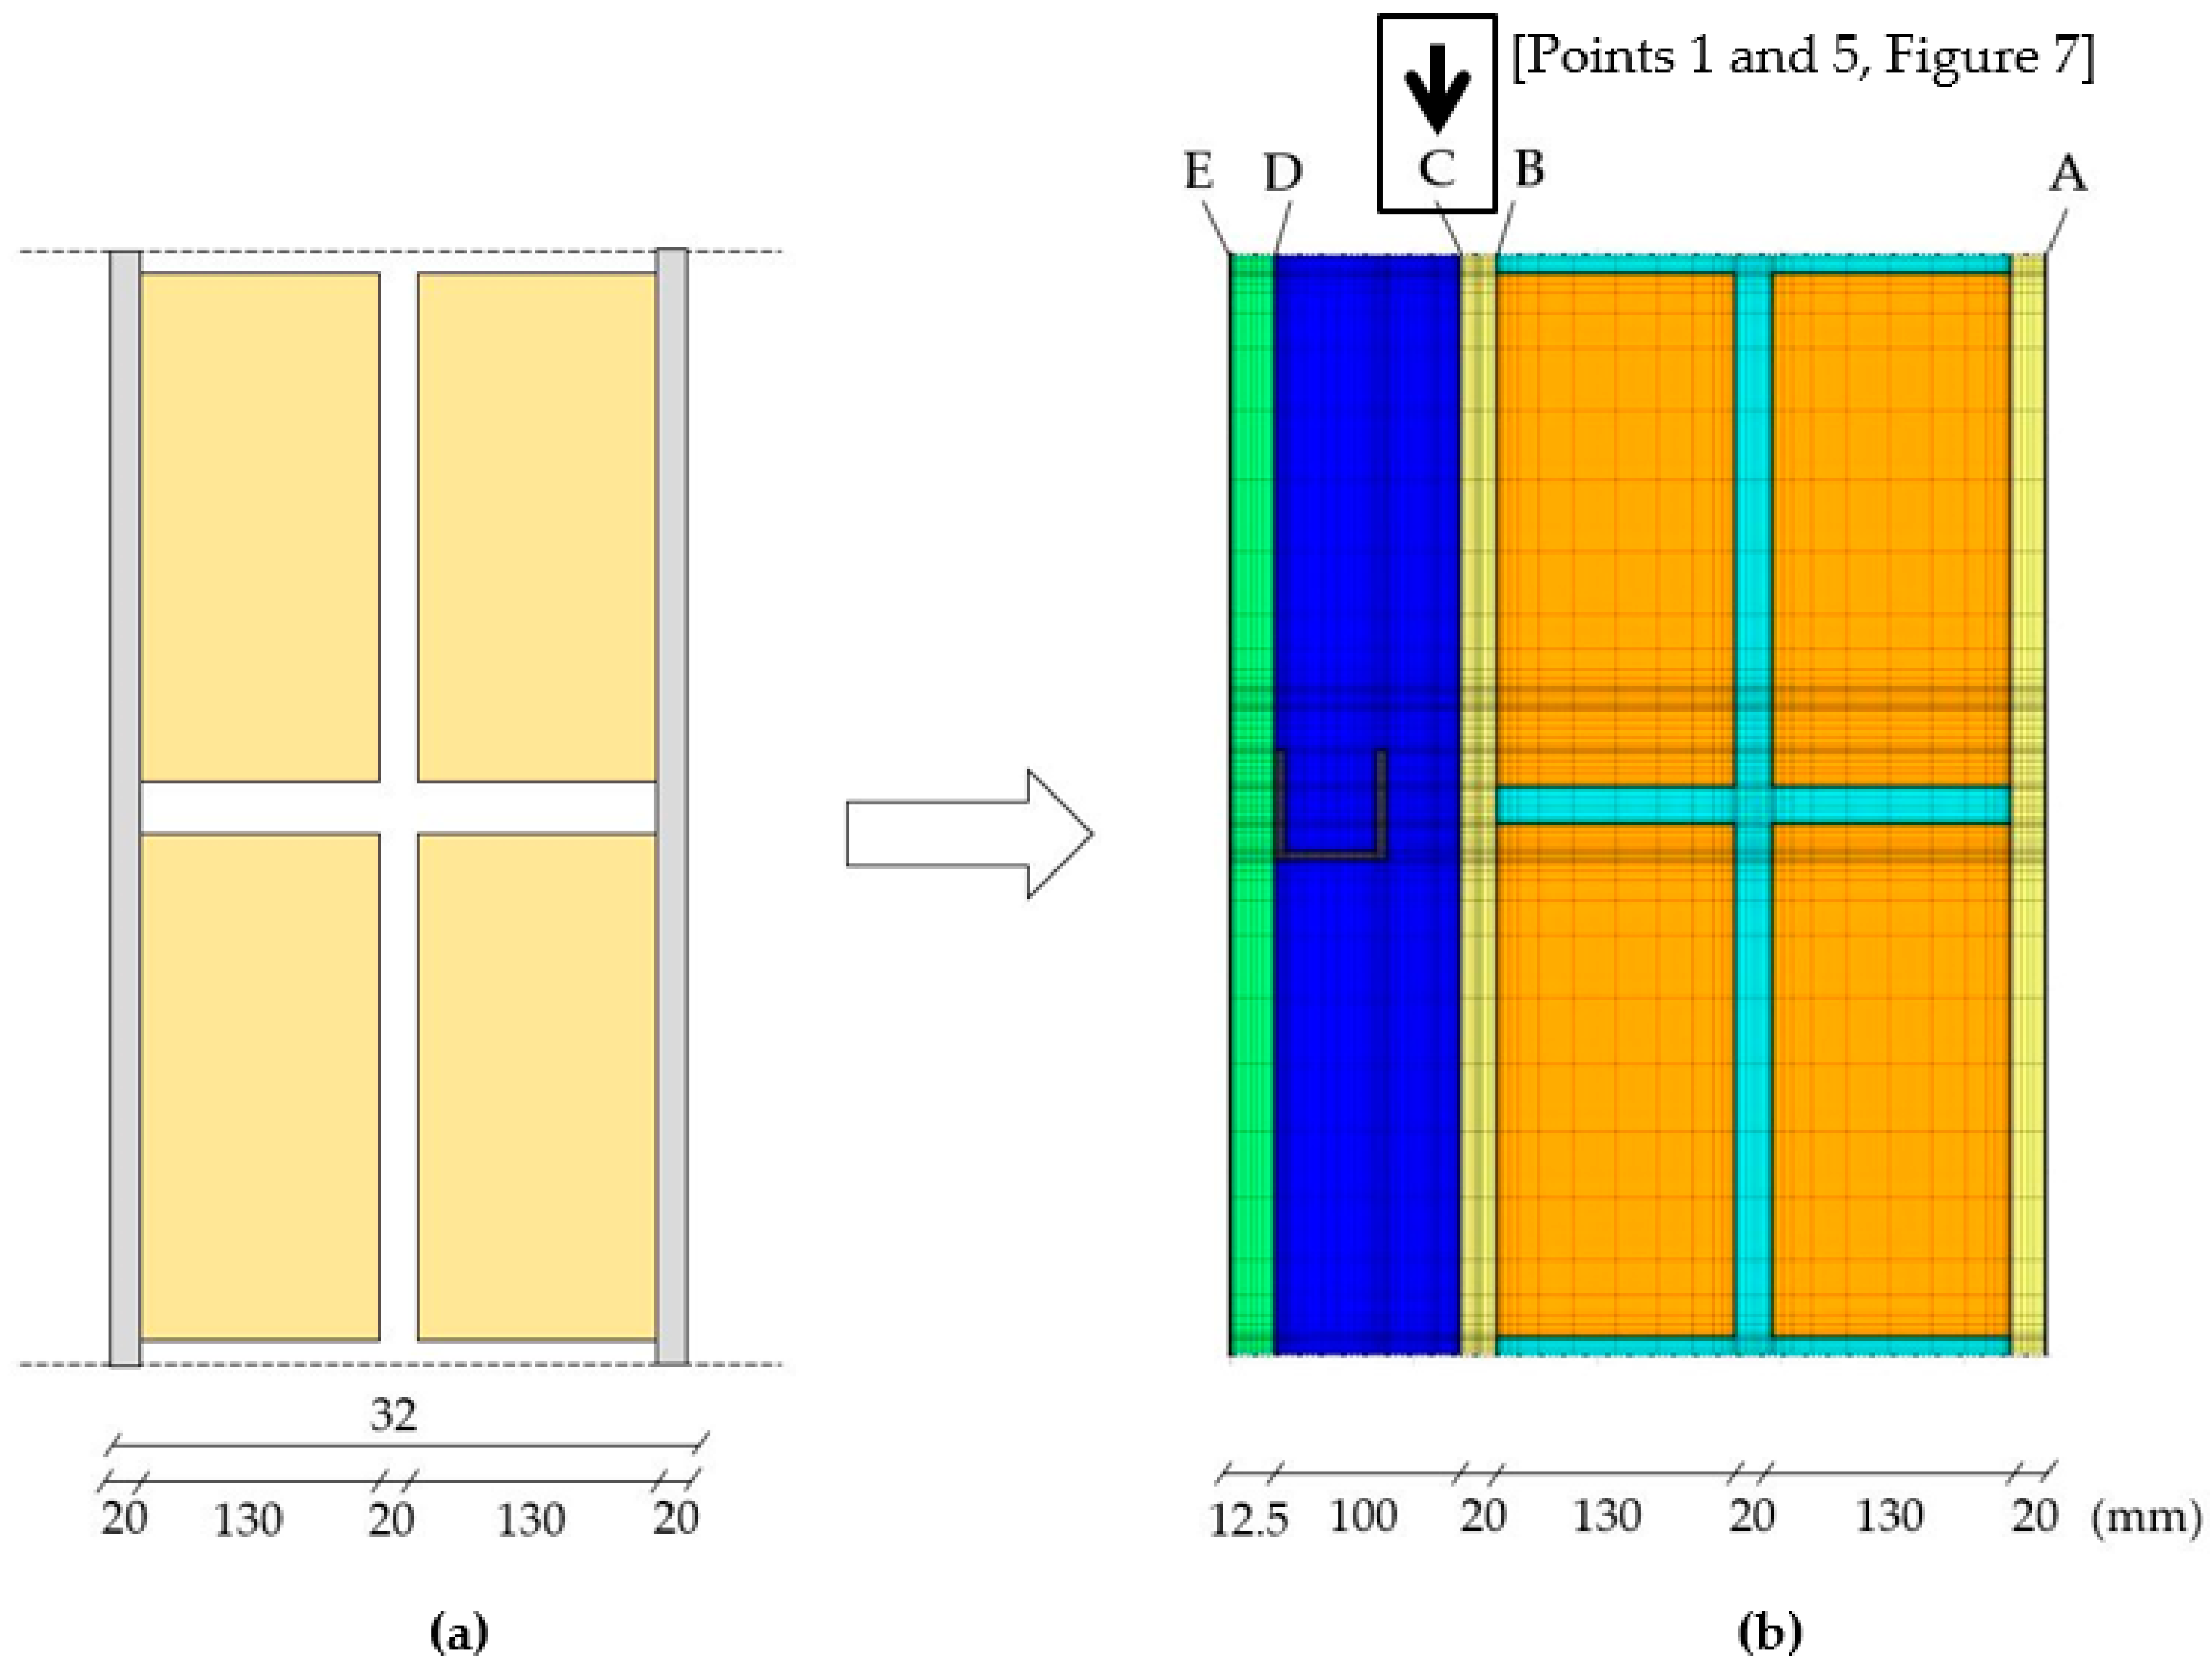
4.2. Two-Dimensional Model
4.3. Selection of Outputs
5. Results
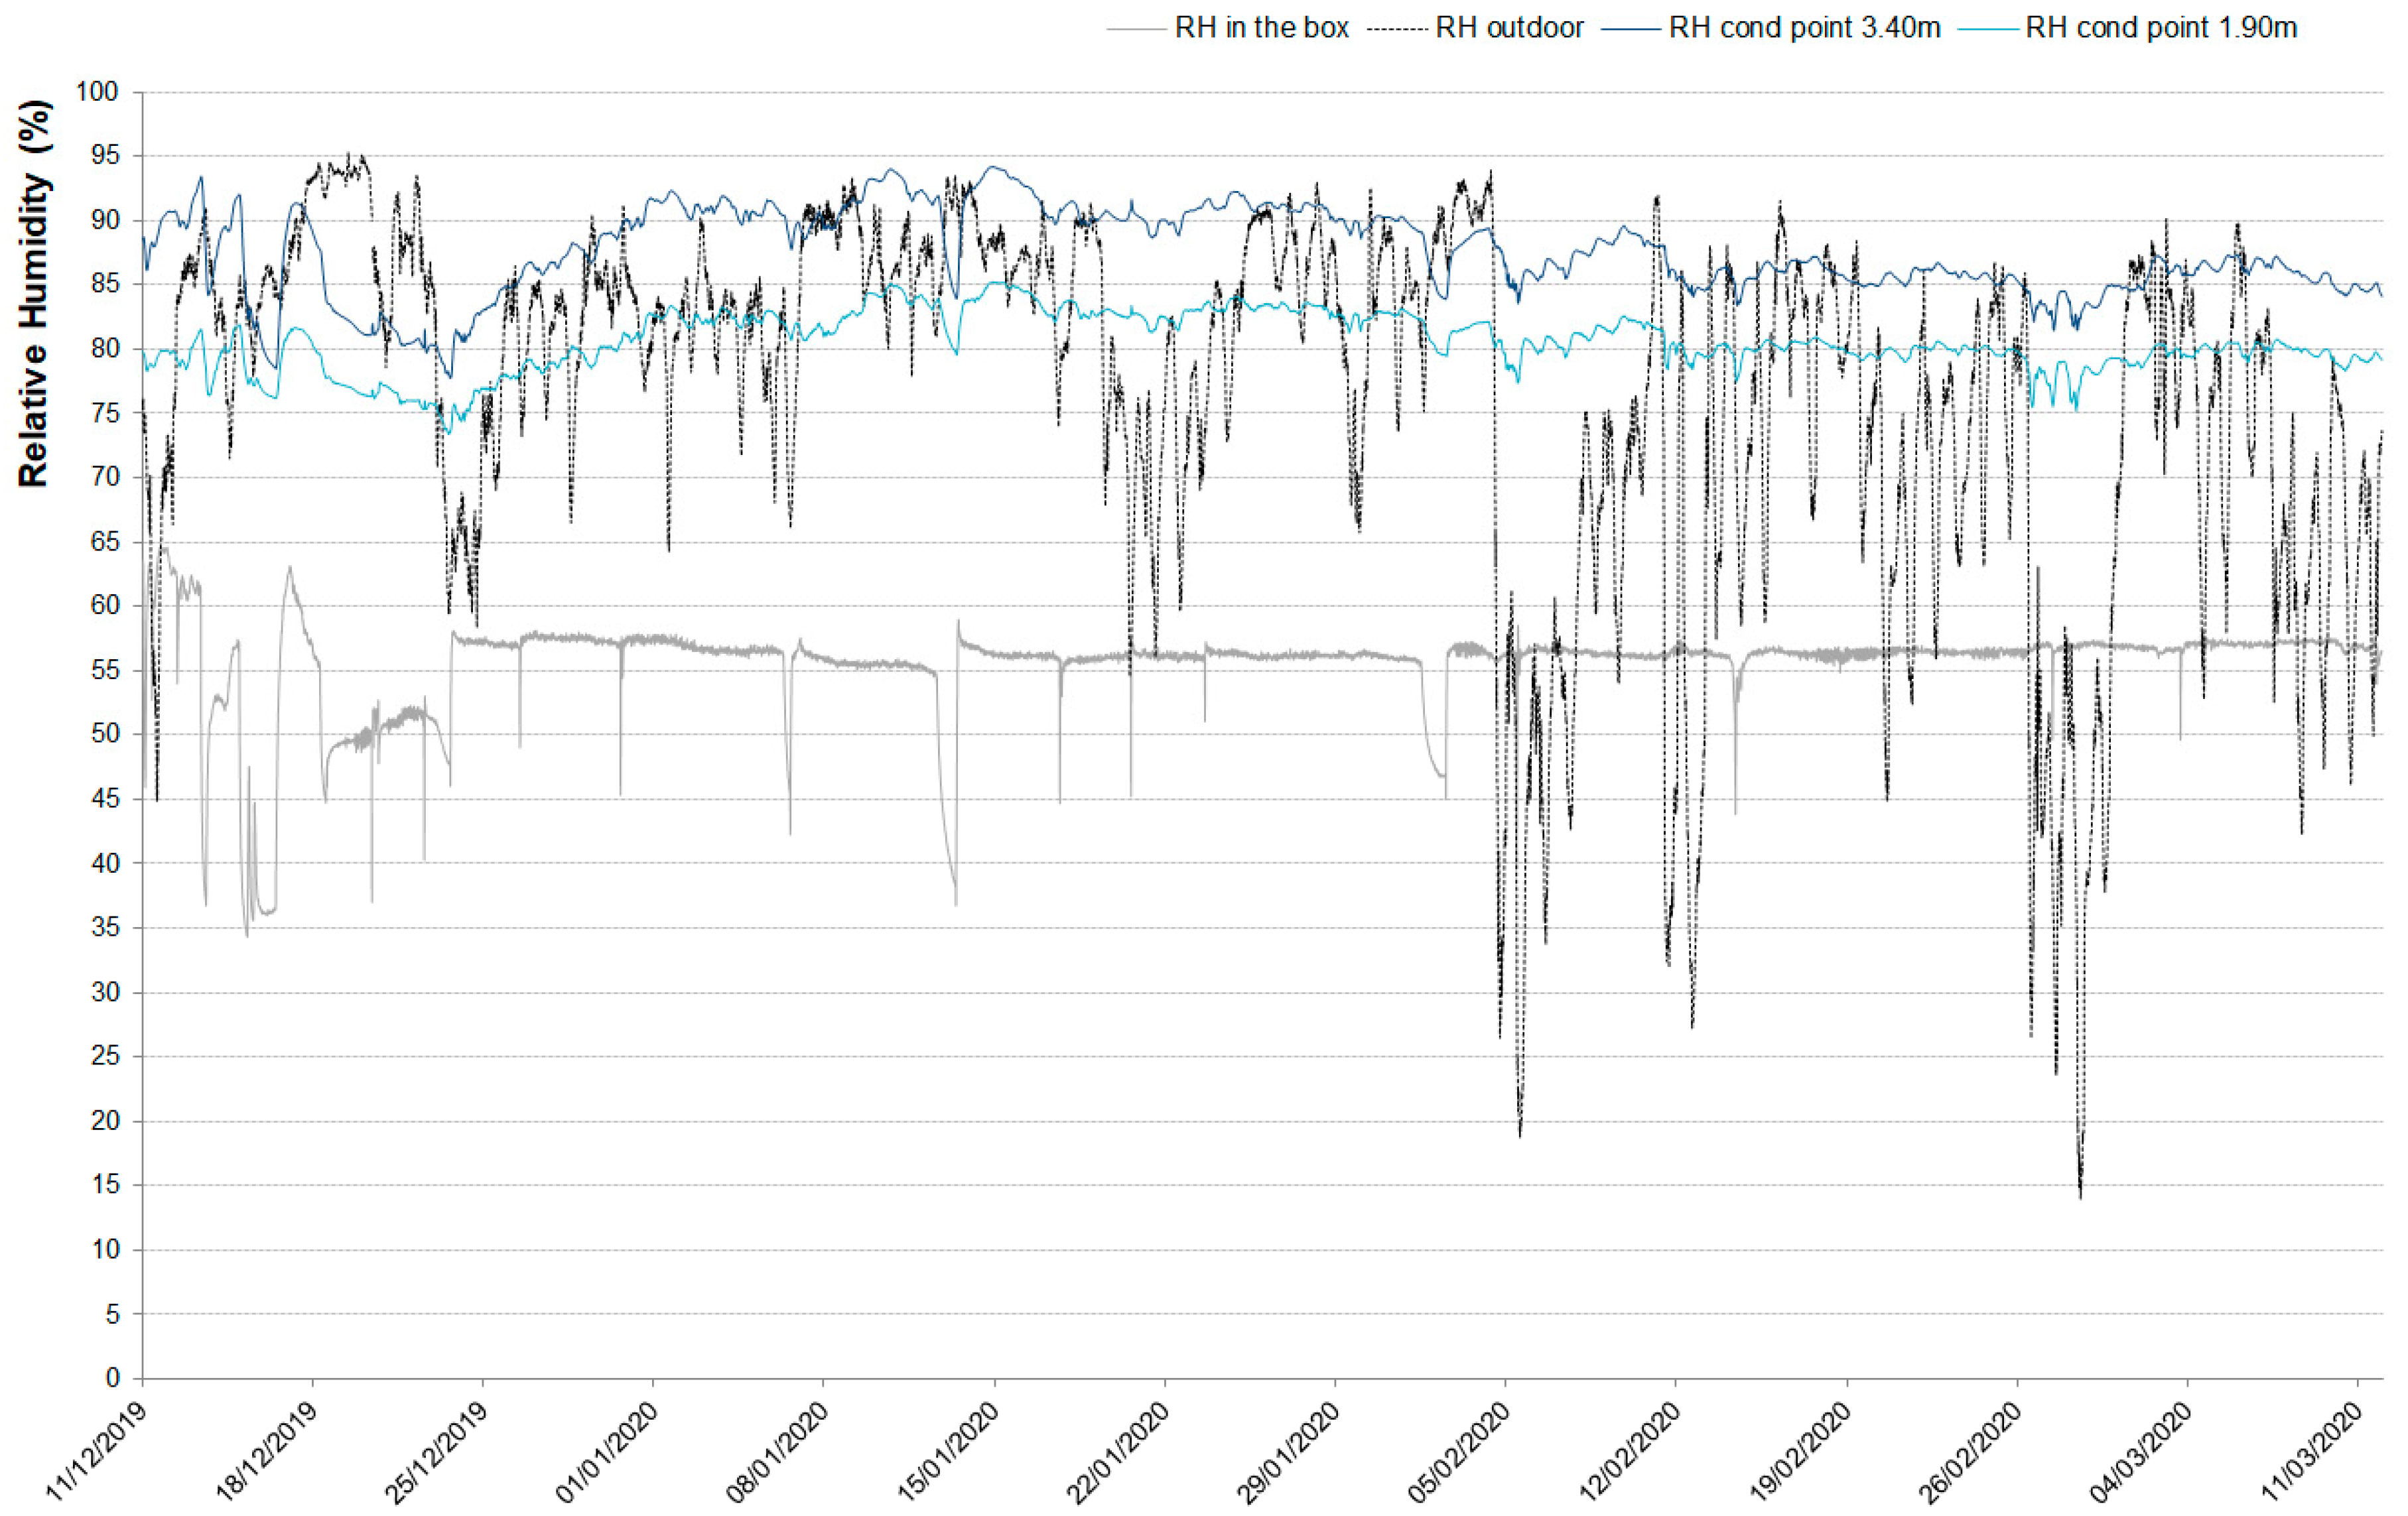
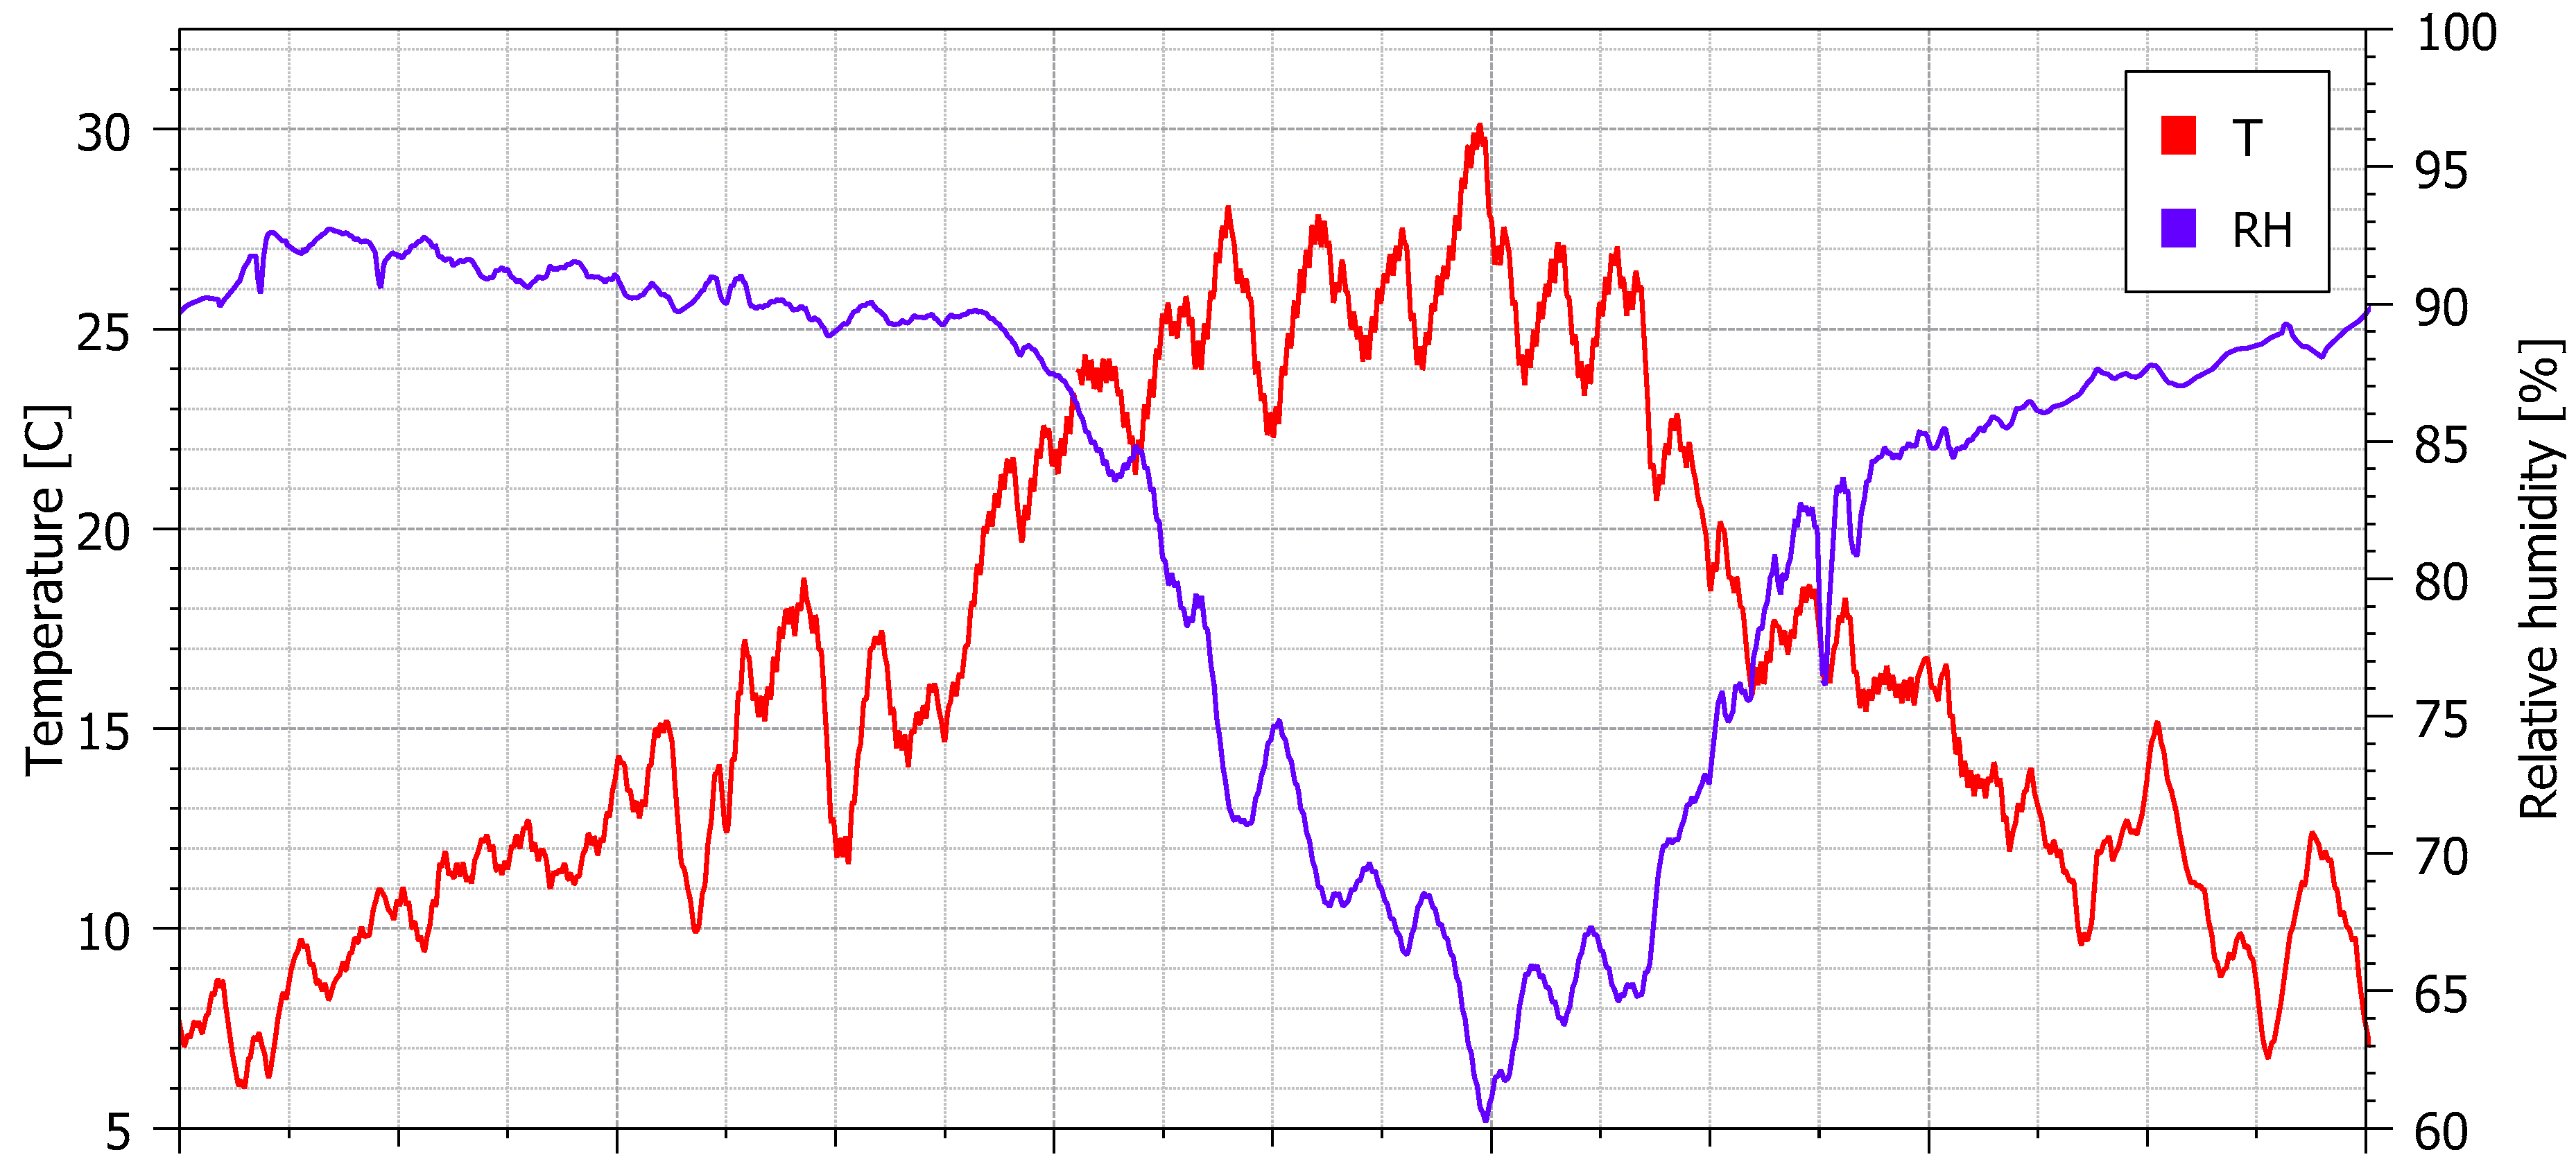
5.1. In Situ Monitoring
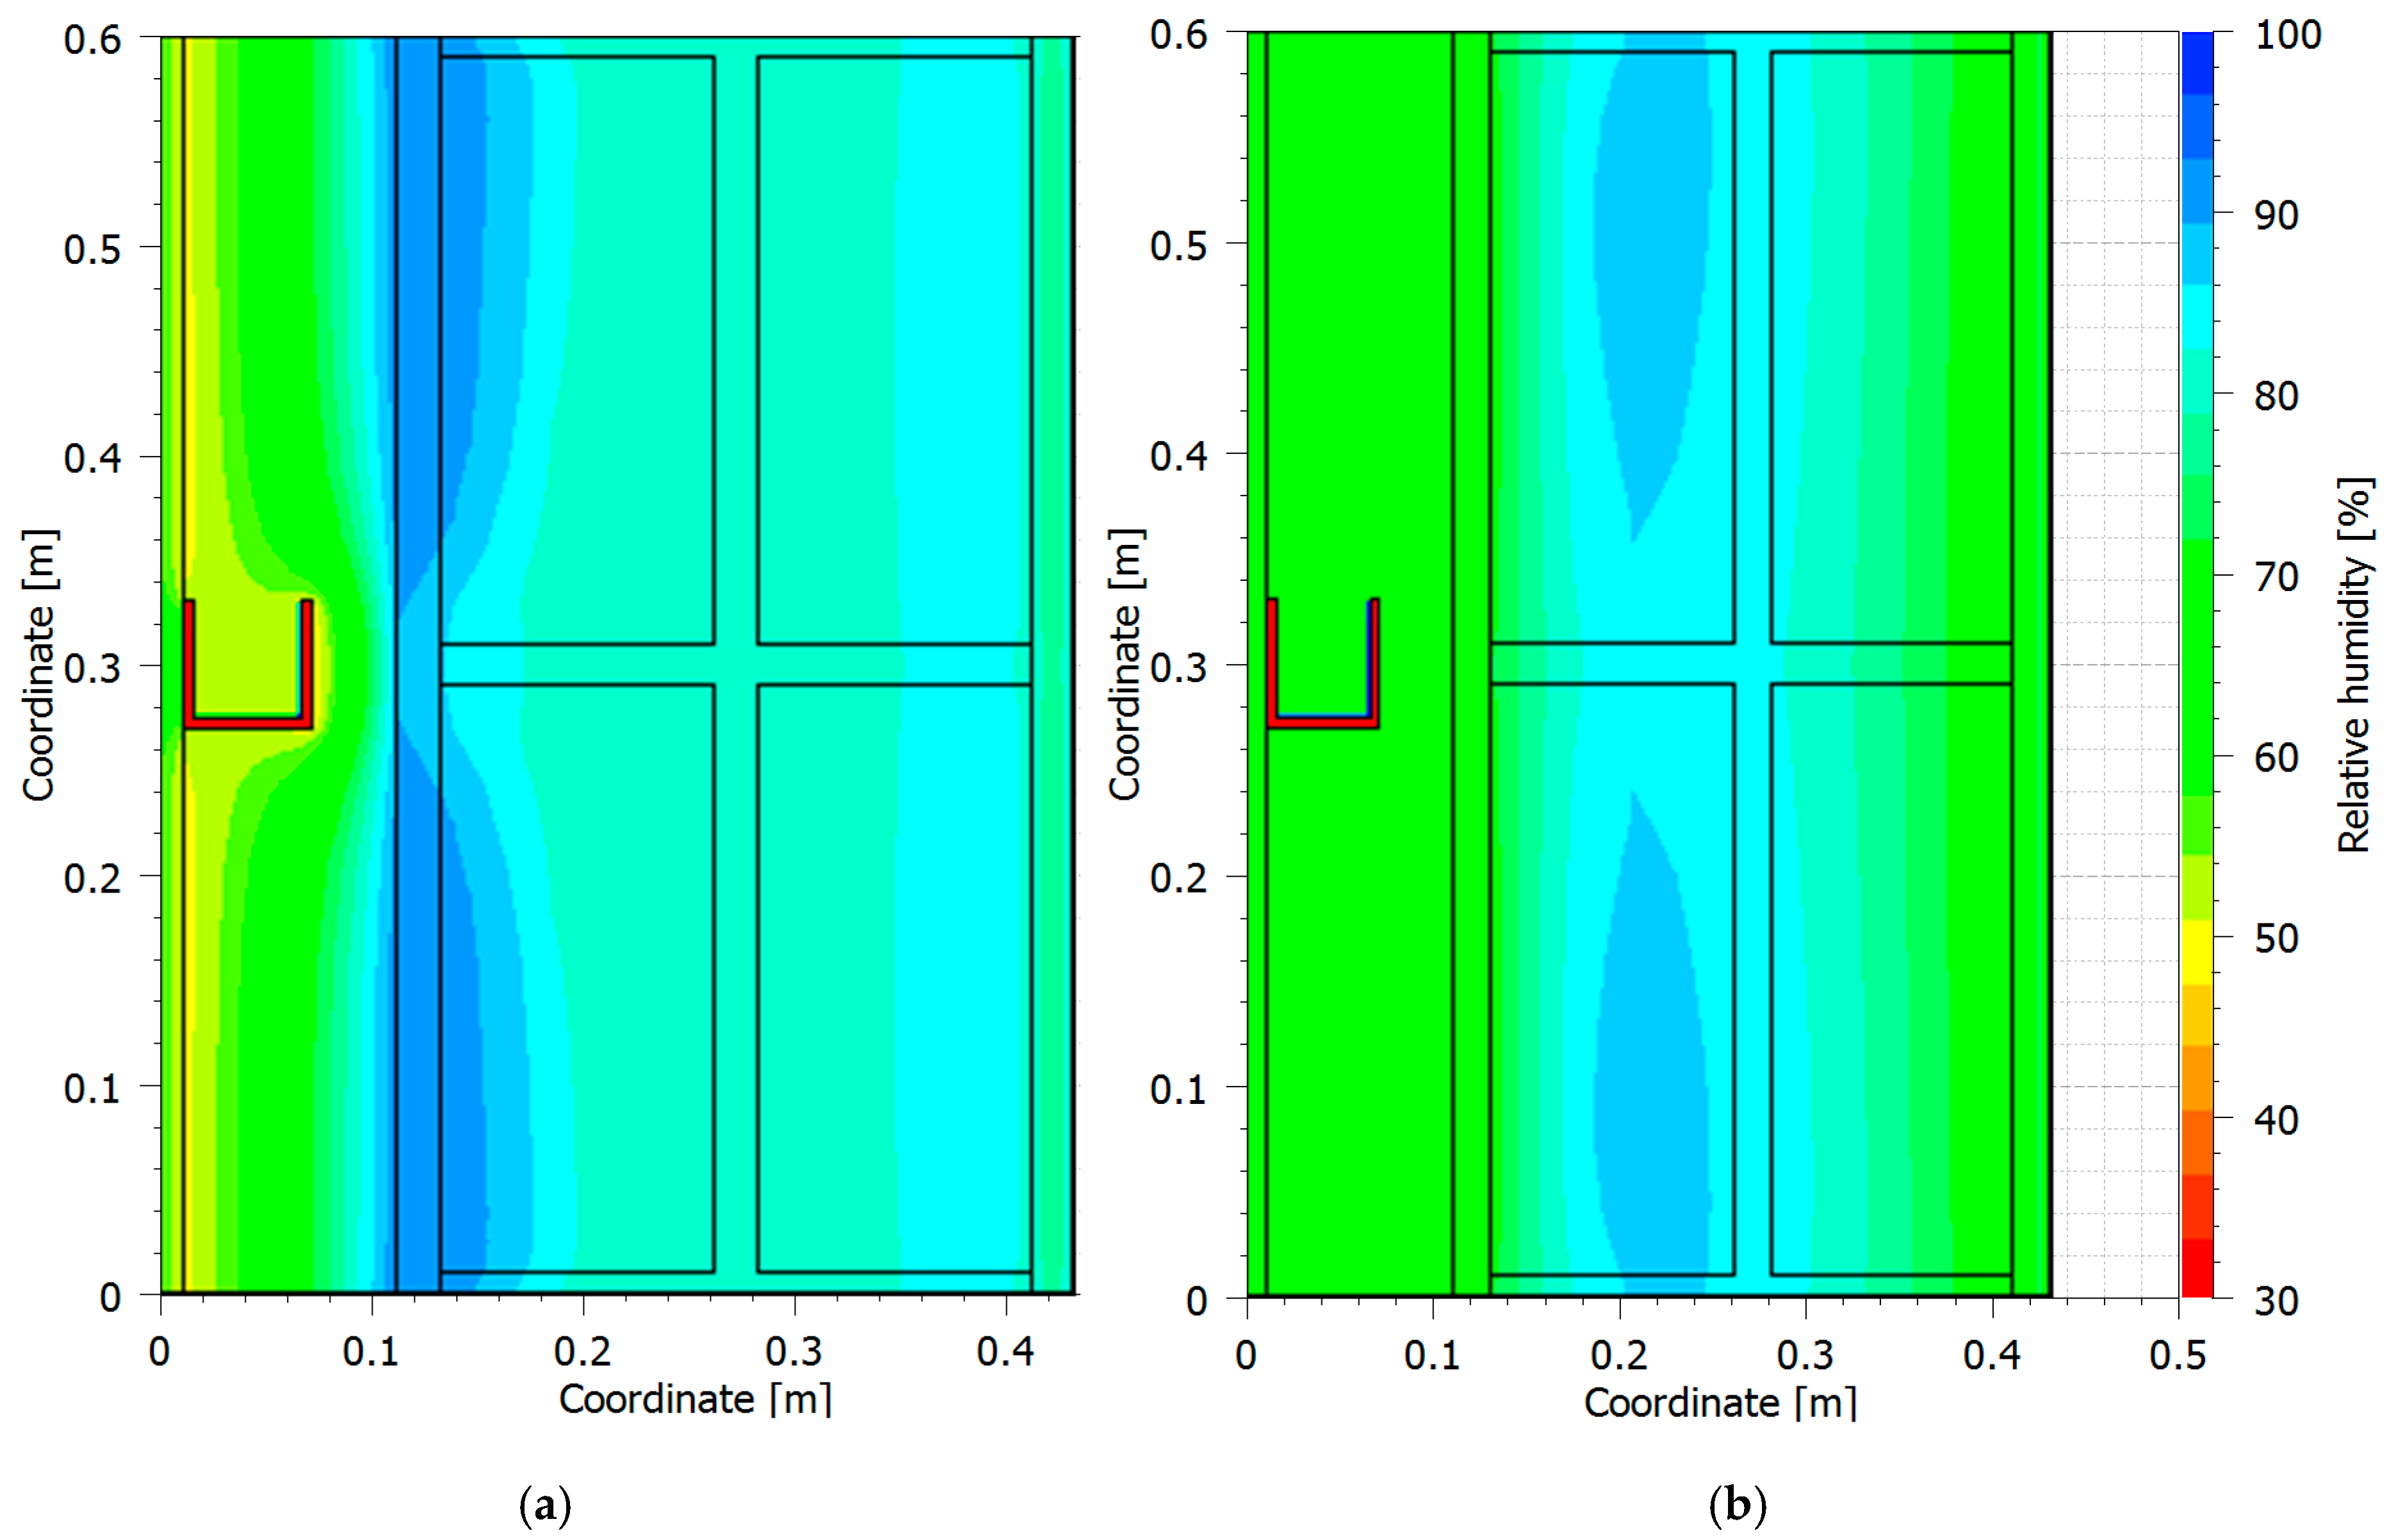
5.2. Hygrothermal Simulation
6. Discussion
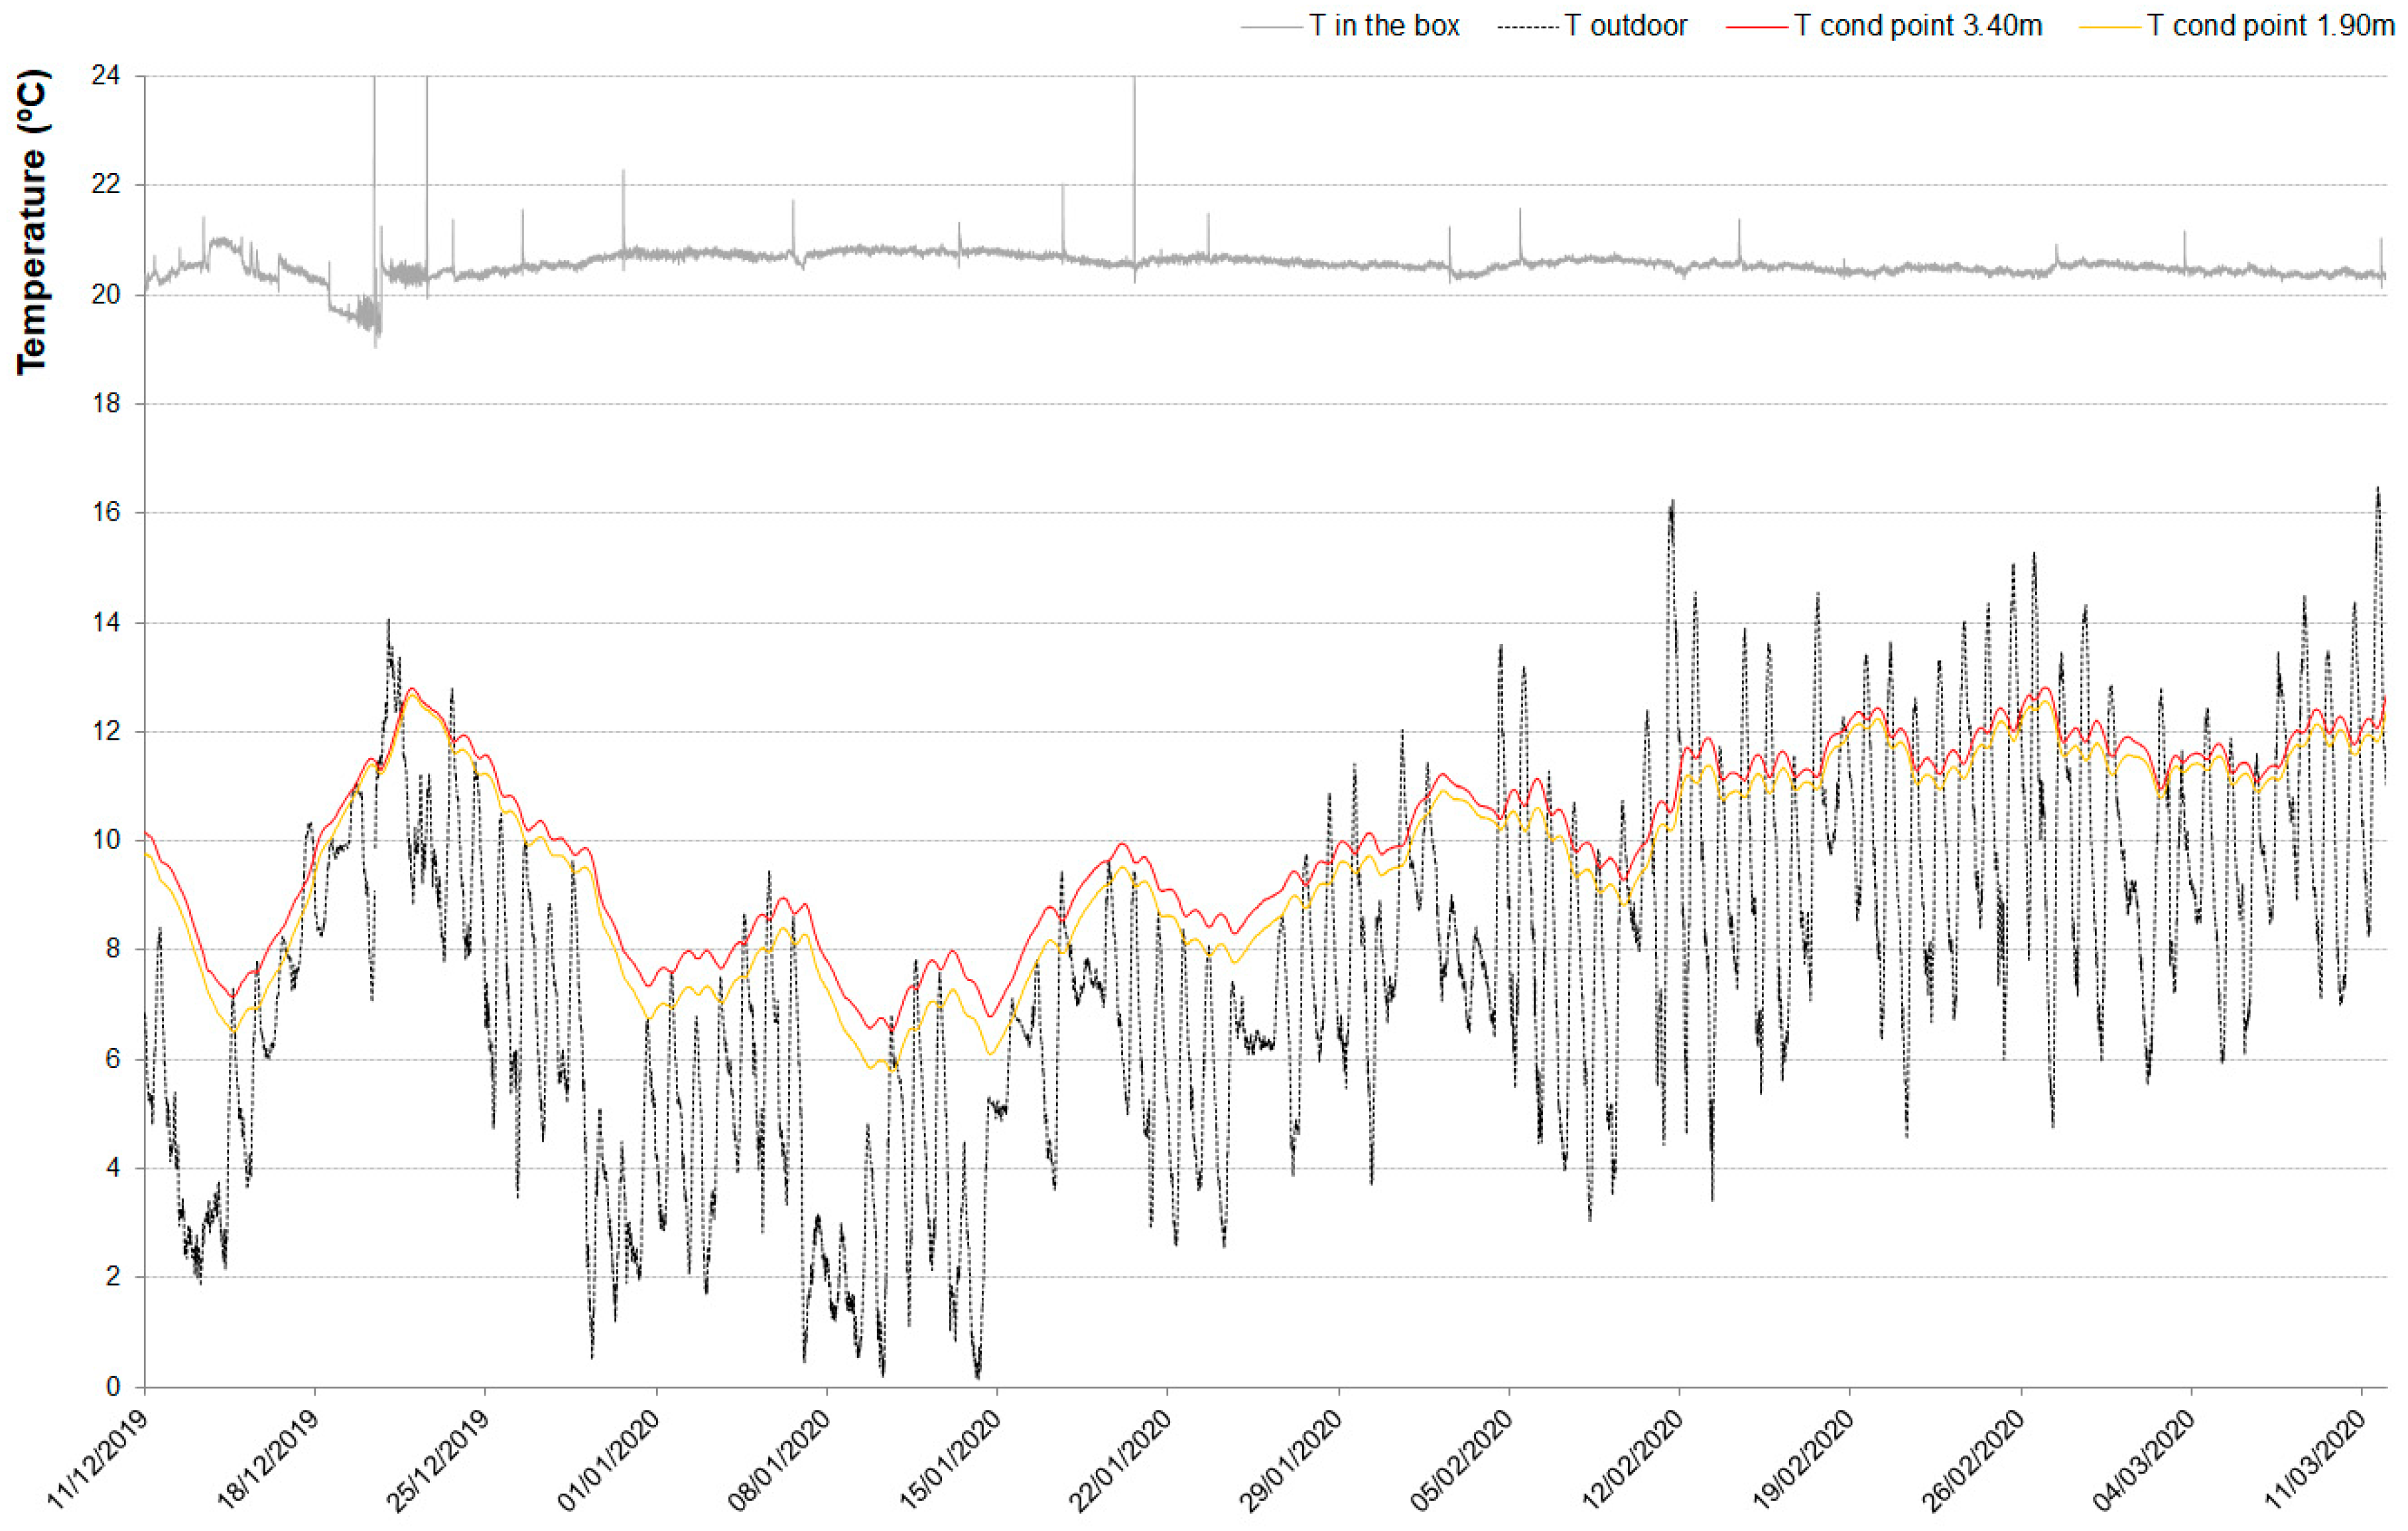
6.1. Comparison of Monitored and Simulated Results
- The average temperature values do practically coincide. Average T simul = 9.9 °C, while average Tmonit = [9.7–10.1] °C. Considering the accuracy of the sensors, it can be declared that averaged T simul = Tmonit;
- Both monitored and simulated values pointed to lowest T (°C) value > 5 °C, i.e., the risk of frost damage was not evidenced;
- Concerning RH, data must be observed more carefully, as monitored RH values at 3.40 m and 1.90 m differed more expressively than T. average monitored RH values varied between 80.6–87.6%, at 1.90 m and 3.40 m respectively, while average RHsimul = 90.8%. Bearing in mind the accuracy of the sensors, it can be stated that the average simulated values fit the average RH values measured at 3.40 m. The similarity of the simulated and monitored values is further reinforced by other statistical data: at 3.40 m, only 25% of data (Q3) was above 90.4%. The difference of monitored values between sensors at 1.90 m and 3.40 m, currently attributed to the possible presence of cracks, i.e., wall inhomogeneity, does not allow a fair comparison between RH at 1.90 m with the simulated data;
- These comments are also grounded on the synthesis presented on Table 3;
- Grounded on the aforementioned data, the authors considered that the simulation model was validated.
6.2. Variation of the Simulation
6.2.1. New Models and Additional Outputs
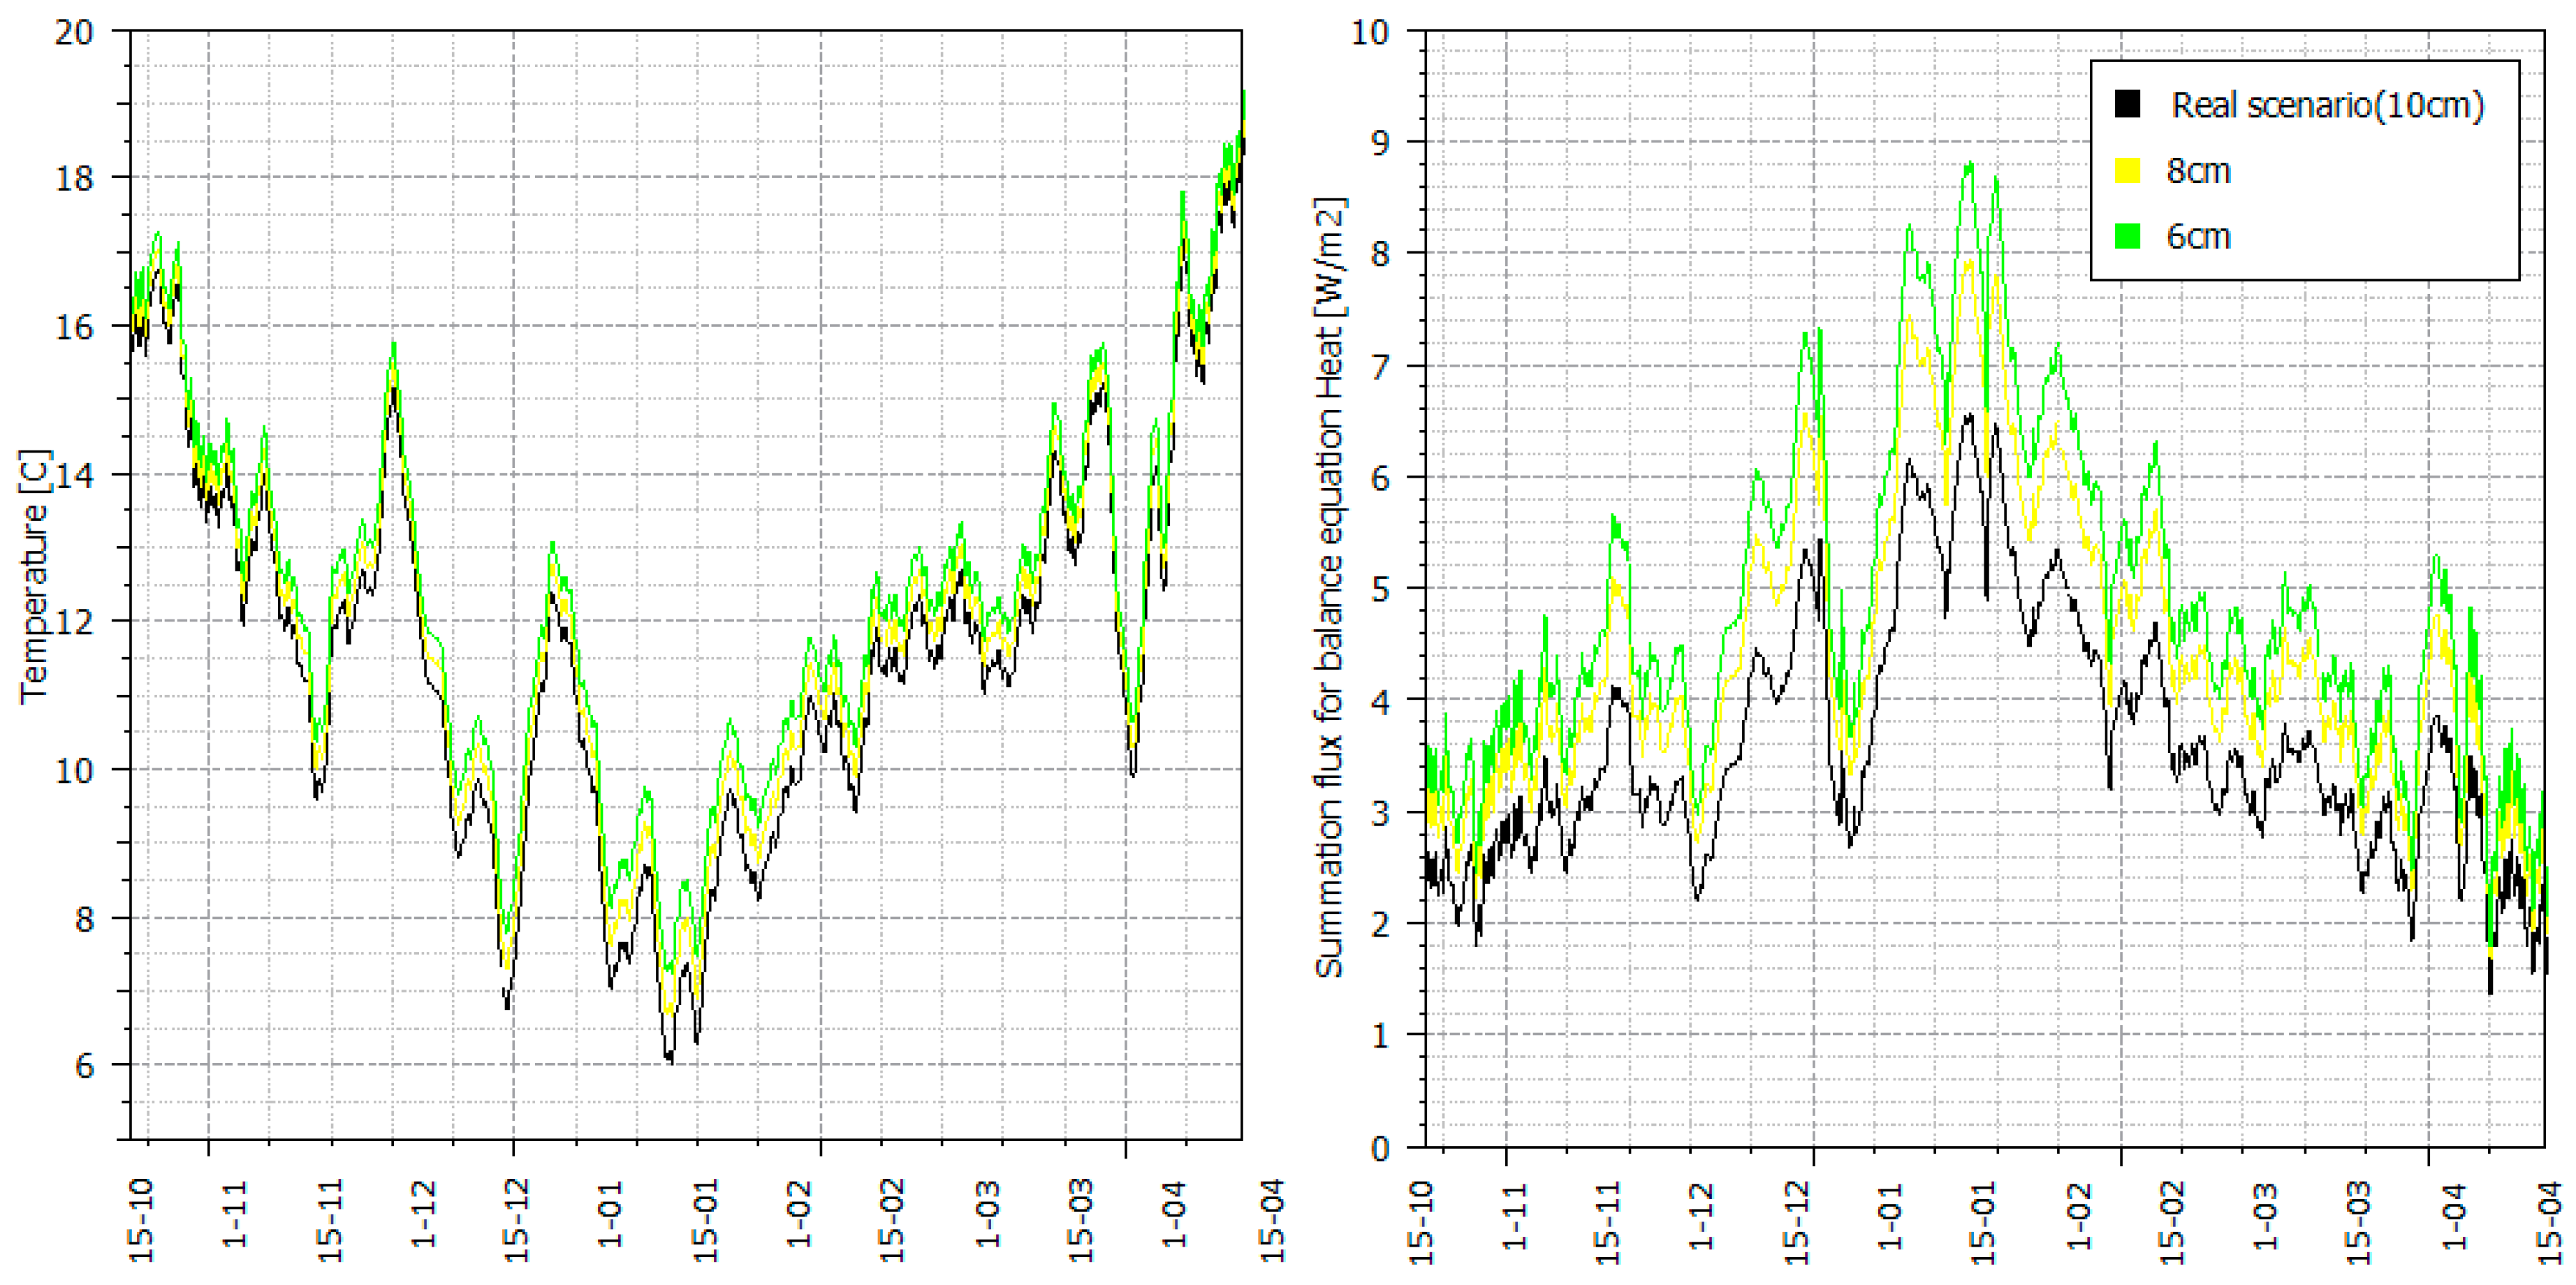
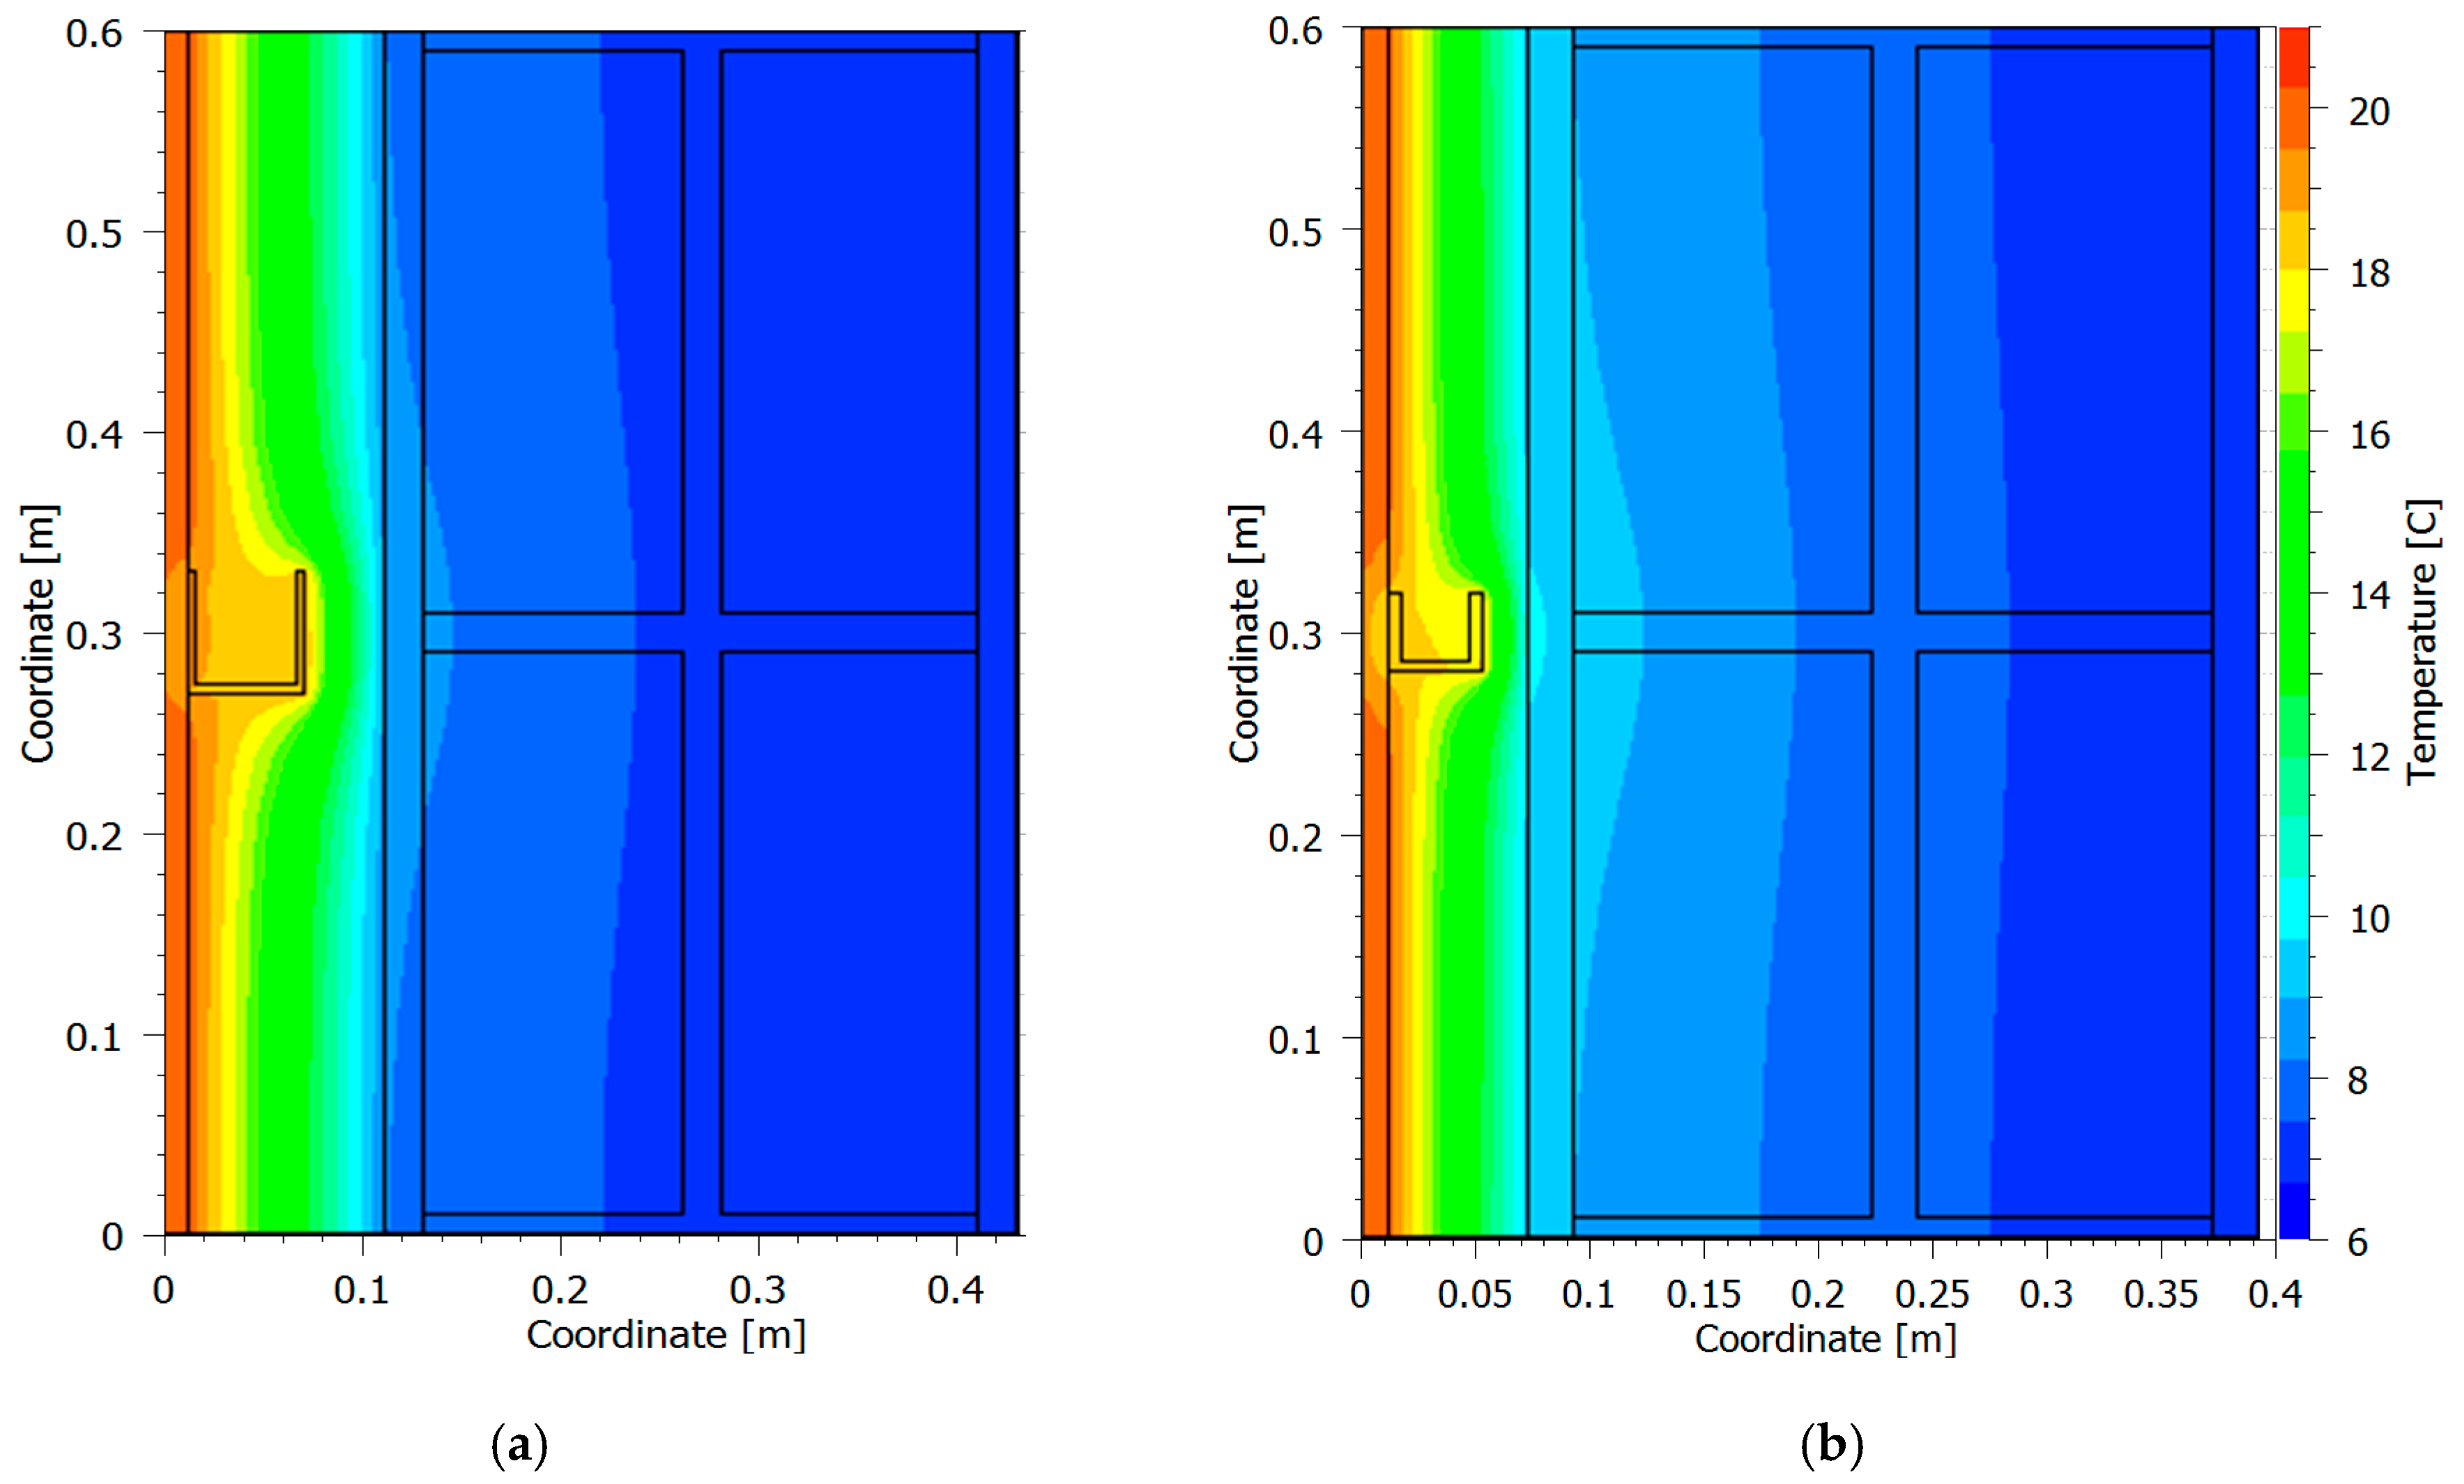
6.2.2. Thermal Simulation
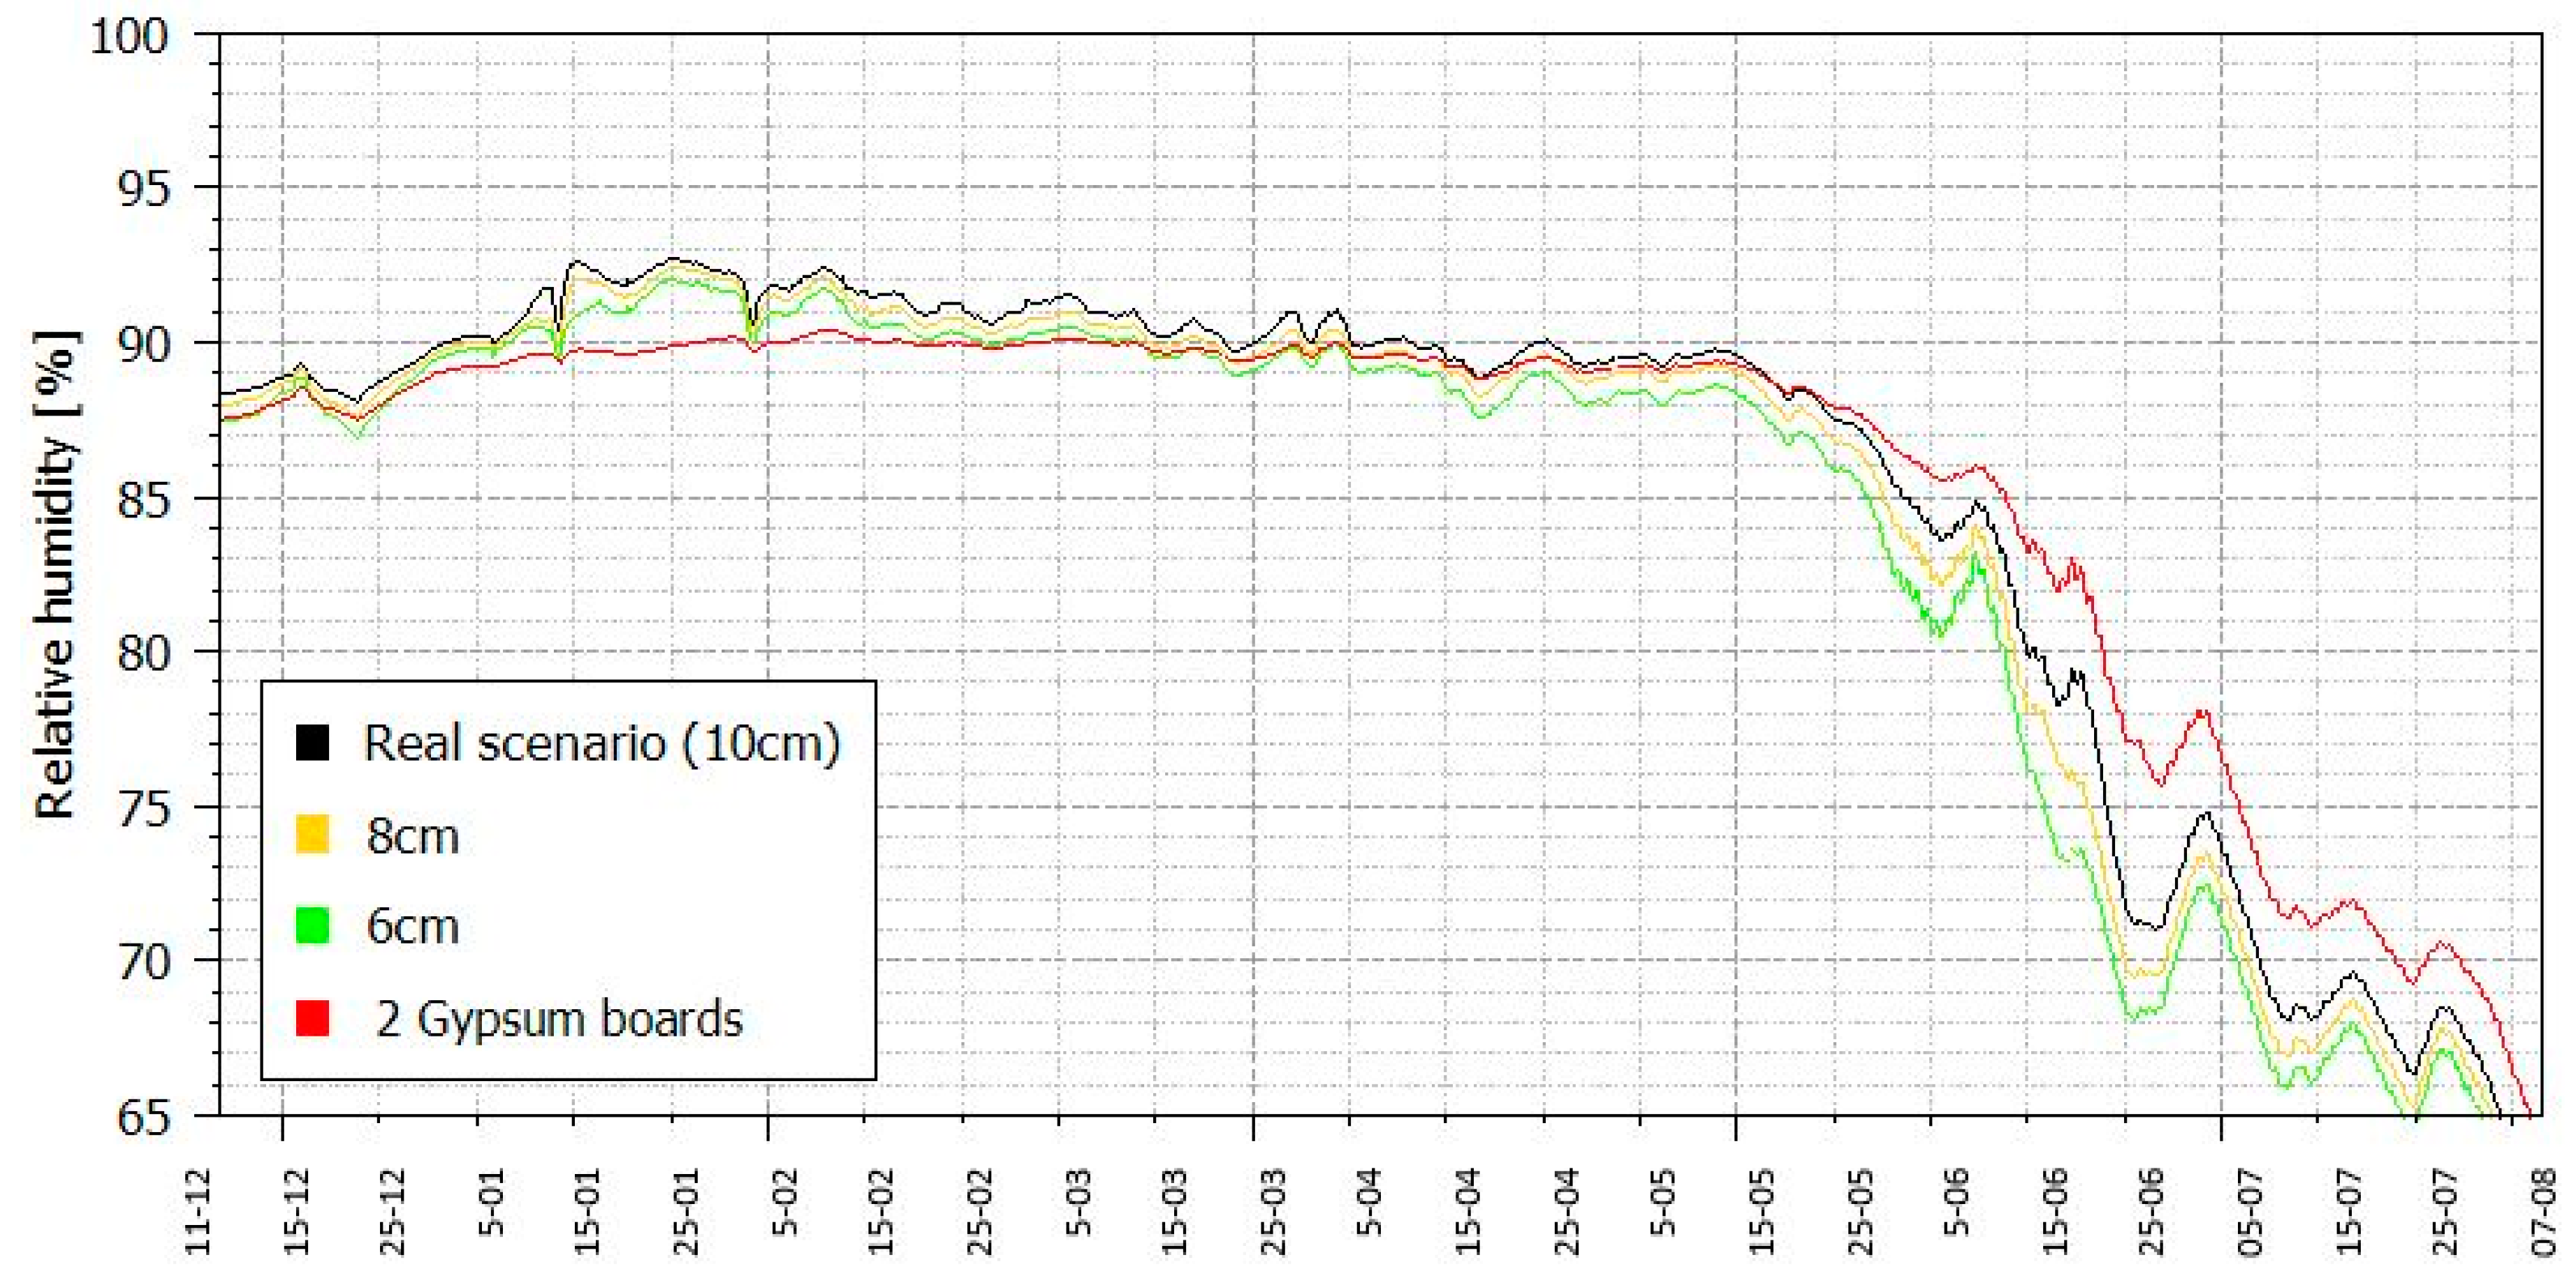
6.2.3. Moisture Accumulation Analysis
6.2.4. Discussion of the Various Simulation Outputs
7. Conclusions
Author Contributions
Funding
Acknowledgments
Conflicts of Interest
References and Note
- European Commission, EU Research. Cultural Heritage; European Commission: Brussels, Belgium, 2013. [Google Scholar] [CrossRef]
- Akande, O.K.; Odeleye, D.; Coday, A. Energy Efficiency For Sustainable Reuse Of Public Heritage Buildings: The Case For Research. Int. J. Sustain. Dev. Plan. 2014, 9, 237–250. [Google Scholar] [CrossRef] [Green Version]
- European Commission. Commission Staff Working Document—European Framework for Action on Cultural Heritage, Brussels. 2018. Available online: https://ec.europa.eu/culture/library/commission-swd-european-framework-action-cultural-heritage_en (accessed on 6 January 2020).
- Phoenix, T. Lessons learned: ASHRAE’s approach in the refurbishment of historic and existing buildings. Energy Build. 2015, 95, 13–14. [Google Scholar] [CrossRef]
- Vereecken, E.; Van Gelder, L.; Janssen, H.; Roels, S. Interior insulation for wall retrofitting—A probabilistic analysis of energy savings and hygrothermal risks. Energy Build. 2015, 89, 231–244. [Google Scholar] [CrossRef] [Green Version]
- Calzolari, M.; Davoli, P.; Pereira, L.D. Analysis of the risks related to the energy retrofit interventions of historic buildings. Recuper. Conserv. 2019, 154, 88–95. (In Italian) [Google Scholar]
- Galatioto, A.; Ciulla, G.; Ricciu, R. An overview of energy retrofit actions feasibility on Italian historical buildings. Energy 2017, 137, 991–1000. [Google Scholar] [CrossRef]
- Güleroğlu, S.K.; Karagüler, M.E.; Kahraman, İ.; Umdu, E.S. Methodological approach for performance assessment of historical buildings based on seismic, energy and cost performance: A Mediterranean case. J. Build. Eng. 2020, 31, 101372. [Google Scholar] [CrossRef]
- Akkurt, G.G.; Aste, N.; Borderon, J.; Buda, A.; Calzolari, M.; Chung, D.; Costanzo, V.; Del Pero, C.; Evola, G.; Huerto-Cardenas, H.E.; et al. Dynamic thermal and hygrometric simulation of historical buildings: Critical factors and possible solutions. Renew. Sustain. Energy Rev. 2020, 118. [Google Scholar] [CrossRef]
- Asdrubali, F.; Baldinelli, G. Thermal transmittance measurements with the hot box method: Calibration, experimental procedures, and uncertainty analyses of three different approaches. Energy Build. 2011, 43, 1618–1626. [Google Scholar] [CrossRef]
- Wakili, K.G.; Tanner, C. U-value of a dried wall made of perforated porous clay bricks Hot box measurement versus numerical analysis. Energy Build. 2003, 35, 675–680. [Google Scholar] [CrossRef]
- Soares, N.; Martins, C.; Gonçalves, M.; Santos, P.; da Silva, L.S.; Costa, J.J. Laboratory and in-situ non-destructive methods to evaluate the thermal transmittance and behaviour of walls, windows, and construction elements with innovative materials: A review. Energy Build. 2019, 182, 88–110. [Google Scholar] [CrossRef]
- Bienvenido-Huertas, D.; Moyano, J.; Marín, D.; Fresco-Contreras, R. Review of in situ methods for assessing the thermal transmittance of walls. Renew. Sustain. Energy Rev. 2019, 102, 356–371. [Google Scholar] [CrossRef]
- 3ENCULT. 3ENCULT Efficient Energy for EU Cultural Heritage (n.d.). Available online: http://www.3encult.eu/en/project/welcome/default.html (accessed on 19 June 2016).
- Co2olBricks. Co2olBricks—Climate Change, Cultural Heritage & Energy Efficient Monuments (2013). Available online: http://www.co2olbricks.eu/ (accessed on 28 August 2019).
- EFFESUS. EFFESUS—Energy Efficiency for EU Historic Districts’ Sustainability (2013). Available online: https://www.effesus.eu/ (accessed on 6 January 2020).
- Troi, A.; Zeno, B. Energy Efficiency Solutions for Historic Buildings: A Handbook; Birkhäuser: Berlin, Germany; Basel, Switzerland, 2014. [Google Scholar] [CrossRef]
- Zagorskas, J.; Kazimieras, E.; Turskis, Z.; Burinskien, M. Thermal insulation alternatives of historic brick buildings in Baltic Sea Region. Energy Build. 2014, 78, 35–42. [Google Scholar] [CrossRef]
- Lucchi, E.; Becherini, F.; Concetta, M.; Tuccio, D.; Troi, A.; Frick, J.; Roberti, F.; Hermann, C.; Fairnington, I.; Mezzasalma, G.; et al. Thermal performance evaluation and comfort assessment of advanced aerogel as blown-in insulation for historic buildings. Build. Environ. 2017, 122, 258–268. [Google Scholar] [CrossRef]
- Lucchi, E.; Roberti, F.; Alexandra, T. Definition of an experimental procedure with the hot box method for the thermal performance evaluation of inhomogeneous walls. Energy Build. 2018, 179, 99–111. [Google Scholar] [CrossRef]
- Roque, E.; Vicente, R.; Almeida, R.M.S.F.; da Silva, J.M.; Ferreira, A.V. Thermal characterisation of traditional wall solution of built heritage using the simple hot box-heat flow meter method: In situ measurements and numerical simulation. Appl. Therm. Eng. 2020, 169, 114935. [Google Scholar] [CrossRef]
- Adhikari, R.S.; Lucchi, E.; Pracchi, V. Energy modelling of historic buildings: Applicability, problems and compared results. In Proceedings of the 3rd European Workshop on Cultural Heritage and Preservation, Bolzano, Italy, 15–17 September 2013; pp. 119–125. [Google Scholar]
- Calzolari, M. Prestazione Energetica Delle Architetture Storiche: Sfide e Soluzioni. Analisi dei Metodi di Calcolo per la Definizione del Comportamento Energetico; Franco Angelli: Milano, Italy, 2016; ISBN 9788891740885. [Google Scholar]
- Belpoliti, V.; Bizzarri, G.; Boarin, P.; Calzolari, M.; Davoli, P. A parametric method to assess the energy performance of historical urban settlements. Evaluation of the current energy performance and simulation of retrofit strategies for an Italian case study. J. Cult. Herit. 2018, 30, 155–167. [Google Scholar] [CrossRef]
- Webb, A.L. Energy retrofits in historic and traditional buildings: A review of problems and methods. Renew. Sustain. Energy Rev. 2017, 77, 748–759. [Google Scholar] [CrossRef]
- Bienvenido-Huertas, D.; Rubio-Bellido, C.; Pérez-Ordóñez, J.L.; Oliveira, M.J. Automation and optimization of in-situ assessment of wall thermal transmittance using a Random Forest algorithm. Build. Environ. 2020, 168, 106479. [Google Scholar] [CrossRef]
- Bellia, L.; Alfano, F.R.D.; Giordano, J.; Ianniello, E.; Riccio, G. Energy requalification of a historical building: A case study. Energy Build. 2015, 95, 184–189. [Google Scholar] [CrossRef]
- Ficco, G.; Iannetta, F.; Ianniello, E.; Romana, F.; Dell, M. U-value in situ measurement for energy diagnosis of existing buildings. Energy Build. 2015, 104, 108–121. [Google Scholar] [CrossRef]
- Dell’Isola, M.; D’Ambrosio Alfano, F.R.; Giovinco, G.; Ianniello, E. Experimental analysis of thermal conductivity for building materials depending on moisture content. Int. J. Thermophys. 2012, 33, 1674–1685. [Google Scholar] [CrossRef]
- Litti, G.; Khoshdel, S.; Audenaert, A.; Braet, J. Hygrothermal performance evaluation of traditional brick masonry in historic buildings. Energy Build. 2015, 105, 393–411. [Google Scholar] [CrossRef]
- Kloseiko, P.; Arumagi, E.; Kalamees, T. Hygrothermal performance of internally insulated brick wall in cold climate: A case study in a historical school building. J. Build. Phys. 2015, 38, 444–464. [Google Scholar] [CrossRef]
- Hansen, T.K.; Bjarløv, S.P.; Peuhkuri, R.H.; Harrestrup, M. Long term in situ measurements of hygrothermal conditions at critical points in four cases of internally insulated historic solid masonry walls. Energy Build. 2018, 172, 235–248. [Google Scholar] [CrossRef]
- HeLLo. EU H2020 MSCA-IF-ES HeLLo Project (2019). Available online: https://cordis.europa.eu/project/rcn/215475/factsheet/en (accessed on 7 April 2019).
- Sontag, L.; Nicolai, A.; Vogelsang, S. Validierung der Solverimplementierung des Hygrothermischen Simulationsprogramms Delphin; Technical report; Technische Universität Dresden: Dresden, Germany, 2013. [Google Scholar]
- UNESCO. Ferrara, City of the Renaissance, and its Po Delta (1995). Available online: http://whc.unesco.org/en/list/733 (accessed on 9 January 2019).
- Davoli, P. Complexity, information surplus and interdisciplinarity management. The Rehabilitation of Tassoni Estense Palace in Ferrara. In Conserving Architecture; Jain, K., Ed.; AADI CENTRE: Ahmedabad, India, 2017; pp. 124–145. ISBN 978-81-908528-2-1. [Google Scholar]
- Calzolari, M.; Davoli, P.; Pereira, L.D. From the dynamic simulations assessment of the hygrothermal behavior of internal insulation systems for historic buildings towards the HeLLo project. Int. J. Environ. Sci. Dev. 2020, 11, 278–285. [Google Scholar] [CrossRef]
- Andreotti, M.; Calzolari, M.; Davoli, P.; Pereira, L.D.; Lucchi, E.; Malaguti, R. Design and construction of a new metering hot box for the in situ hygrothermal measurement in dynamic conditions of historic masonries. Energies 2020, 13, 2950. [Google Scholar] [CrossRef]
- HeLLo. HeLLo Team Has Set-Up the Technical Worktables! 2019. Available online: https://hellomscaproject.eu/hello-team-has-set-up-the-technical-worktables/ (accessed on 15 January 2020).
- STBA—Sustainable Traditional Buildings Alliance. Responsible Retrofit Guidance Wheel. Available online: http://responsible-retrofit.org/greenwheel/en (accessed on 6 January 2020).
- English Heritage, Energy Efficiency and Historic Buildings: Application of part L of the Building Regulations to historic and traditionally constructed buildings. Energy Effic. Hist. Build. 2010, 1–72.
- International Organization for Standardization (ISO). Ergonomics of the Thermal Environment—Analytical Determination and Interpretation of Thermal Comfort Using Calculation of the PMV and PPD Indices and Local Thermal Comfort Criteria; ISO 7730:2005; ISO: Geneva, Switzerland, 2005. [Google Scholar]
- Ente Italiano di Normazione (UNI). Prestazione Igrotermica dei Componenti e Degli Elementi per Edilizia—Temperatura Superficiale Interna per Evitare L’umidita’ Superficiale Critica e la Condensazione Interstiziale—Metodi di Calcolo; UNI EN ISO 13788; UNI: Milano, Italy, 2013. [Google Scholar]
- International Organization for Standardization (ISO). Energy Performance of Buildings—Indoor Environmental Quality—Part 1: Indoor Environmental Input Parameters for the Design and Assessment of Energy Performance of Buildings; ISO 17772-1:2017; ISO: Geneva, Switzerland, 2017. [Google Scholar]
- Lucchi, E.; Dias Pereira, L.; Andreotti, M.; Malaguti, R.; Cennamo, D.; Calzolari, M.; Frighi, V. Development of a Compatible, Low Cost and High Accurate Conservation Remote Sensing Technology for the Hygrothermal Assessment of Historic Walls. Electronics 2019, 8, 643. [Google Scholar] [CrossRef] [Green Version]
- Ente Italiano di Normazione (UNI). Prestazione Termoigrometrica dei Componenti e Degli Elementi di Edificio—Valutazione del Trasferimento di Umidità Mediante una Simulazione Numerica; UNI EN 15026; UNI: Milano, Italy, 2008. [Google Scholar]
- WTA 6.2 Leaflet—Simulation of Heat and Moisture Transfer; WTA Publications: München, Germany, 2014; Volume 30.
- TU Dresden, Institut fur Bauklimatik. Delphin 6.0.20. Material Database.
- Fraunhofer IBP (Fraunhofer Institute for Building Physics). WUFI Pro-6.2 [Computer Software]; Fraunhofer IBP: Stuttgart, Germany, 2014. [Google Scholar]
- WTA 6.5 Leaflet—Interior Insulation; WTA Publications: München, Germany, 2014.
- Häupl, P.; Grunewald, J.; Fechner, H.; Stopp, H. Coupled heat air and moisture transfer in building structures. Int. J. Heat Mass. Transf. 1997, 40. [Google Scholar] [CrossRef]
- Energieeinsparverordnung (EnEV). Verordnung über Energiesparenden Warmeschutz und Energiesparende Anlagentechnik bei Gebauden. Bundesgesetzblatt. 2007. Available online: https://www.enev-profi.de/wp-content/uploads/EnEV-2014-Lesefassung.pdf (accessed on 6 January 2020).


| Quantity | Value | Unit | |
|---|---|---|---|
| external | Heat transfer coefficient (exterior surface), | 12 | [W/m2K] |
| Vapour diffusion coefficient (exterior surface) | 7.5 × 10⁻⁸ | [s/m] | |
| internal | Temperature range for interior climate | 20–25 | [°C] |
| Relative humidity range for interior climate (normal moisture load) | 35–65 | [%] | |
| Heat transfer coefficient (interior surface), | 8 | [W/m2K] | |
| Vapour diffusion coefficient (interior surface) | 3 × 10⁻⁸ | [s/m] |
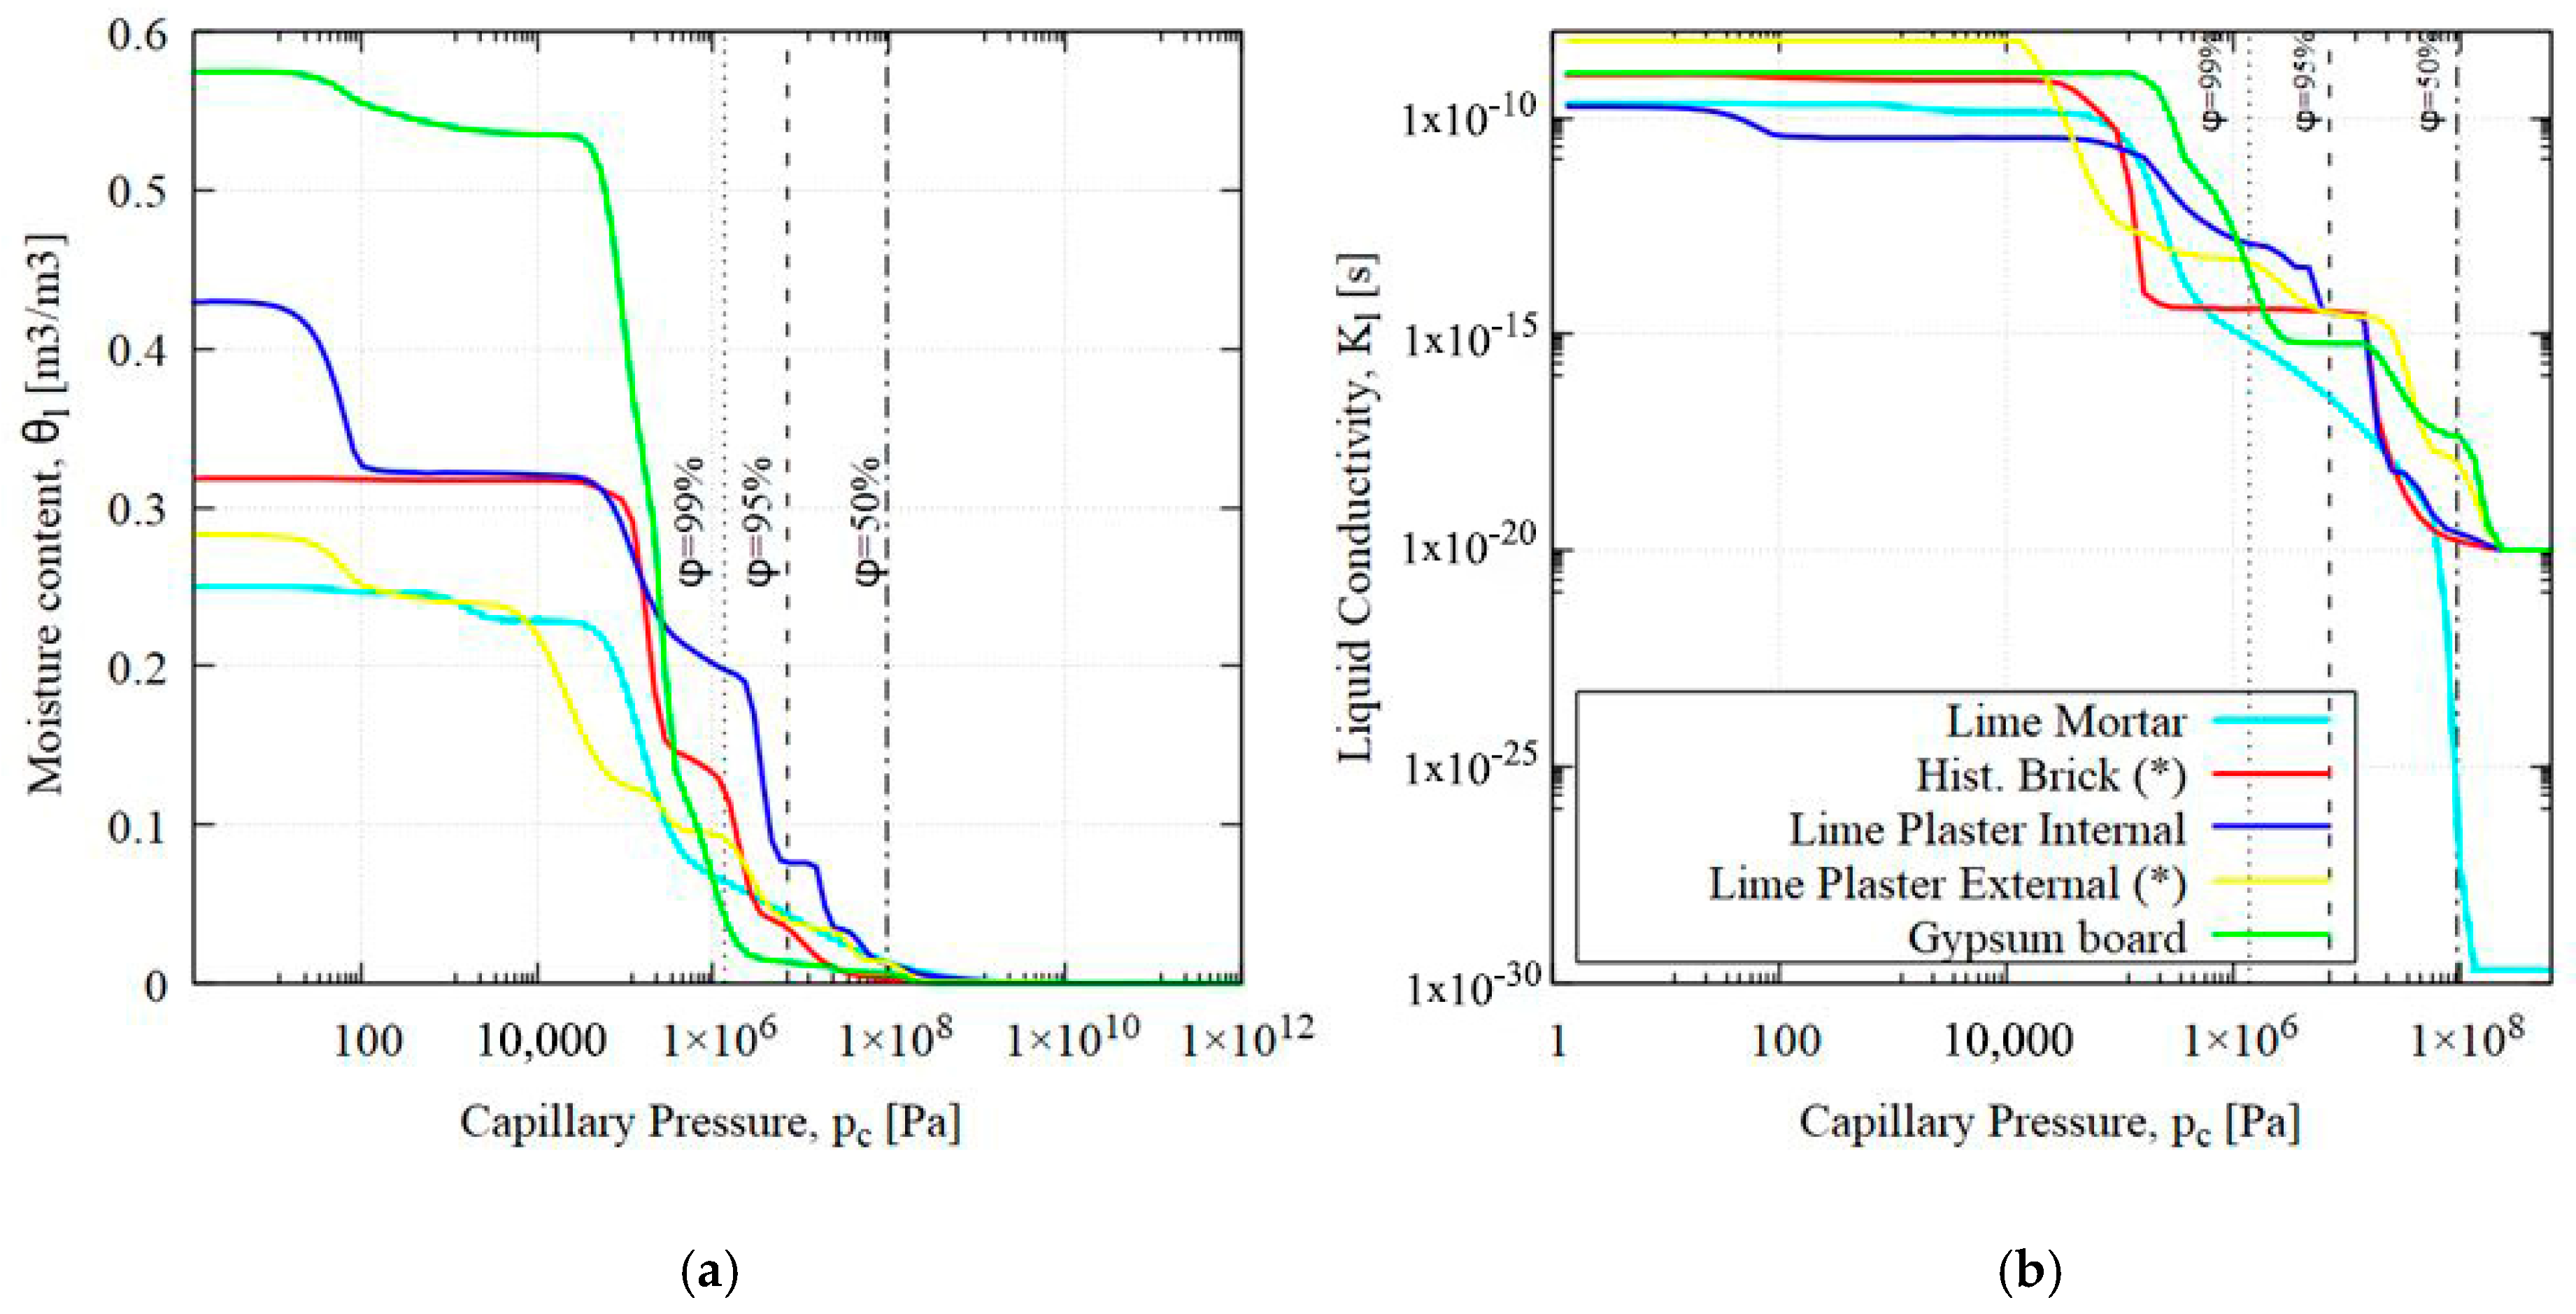
| Material | ID Delphin DB | [kg/m3] | Cp [J/KgK] | [m3/m3] | [W/mK] | [-] | Aw [kg/m2s05] |
|---|---|---|---|---|---|---|---|
| Lime Mortar | 143 | 1570 | 1000 | 0.408 | 0.7 | 11.0 | 0.176 |
| Historical Brick (*) | 532 | 1759 | 1092 | 0.336 | 0.624 | 24.5 | 0.184 |
| Lime plaster External (*) | 520 | 1604 | 869 | 0.395 | 0.69 | 19 | 0.179 |
| Lime plaster Internal | 629 | 1498 | 802 | 0.435 | 0.412 | 9.3 | 0.018 |
| Stone wool | - | 70 | 1030 | 0.950 | 0.033 | 1 | - |
| Steel | 238 | 7800 | 470 | - | 47 | - | - |
| Gypsum board | 599 | 745 | 1826 | 0.719 | 0.177 | 11 | 0.179 |
| Title | Simulation | Monitoring at 3.40 m | Monitoring at 1.90 m |
|---|---|---|---|
| RH (%) 1 | 90.8 | 87.6 | 80.6 |
| T (°C) 2 | 9.9 | 10.1 | 9.7 |
© 2020 by the authors. Licensee MDPI, Basel, Switzerland. This article is an open access article distributed under the terms and conditions of the Creative Commons Attribution (CC BY) license (http://creativecommons.org/licenses/by/4.0/).
Share and Cite
Andreotti, M.; Bottino-Leone, D.; Calzolari, M.; Davoli, P.; Dias Pereira, L.; Lucchi, E.; Troi, A. Applied Research of the Hygrothermal Behaviour of an Internally Insulated Historic Wall without Vapour Barrier: In Situ Measurements and Dynamic Simulations. Energies 2020, 13, 3362. https://0-doi-org.brum.beds.ac.uk/10.3390/en13133362
Andreotti M, Bottino-Leone D, Calzolari M, Davoli P, Dias Pereira L, Lucchi E, Troi A. Applied Research of the Hygrothermal Behaviour of an Internally Insulated Historic Wall without Vapour Barrier: In Situ Measurements and Dynamic Simulations. Energies. 2020; 13(13):3362. https://0-doi-org.brum.beds.ac.uk/10.3390/en13133362
Chicago/Turabian StyleAndreotti, Mirco, Dario Bottino-Leone, Marta Calzolari, Pietromaria Davoli, Luisa Dias Pereira, Elena Lucchi, and Alexandra Troi. 2020. "Applied Research of the Hygrothermal Behaviour of an Internally Insulated Historic Wall without Vapour Barrier: In Situ Measurements and Dynamic Simulations" Energies 13, no. 13: 3362. https://0-doi-org.brum.beds.ac.uk/10.3390/en13133362