Modeling of Electric Energy Consumption during Dairy Wastewater Treatment Plant Operation


1
Bielmlek Cooperative, 52 Wojska Polskiego St., 17-100 Bielsk Podlaski, Poland
2
Faculty of Civil Engineering and Environmental Science, Bialystok University of Technology, 45E Wiejska St., 15-351 Bialystok, Poland
3
Department of Statistics and Medical Informatics, Medical University of Bialystok, 37 Szpitalna St., 15-295 Bialystok, Poland
4
Faculty of Building Services, Hydro and Environmental Engineering, Warsaw University of Technology, 20 Nowowiejska St., 00-653 Warsaw, Poland
*
Author to whom correspondence should be addressed.
Energies 2020, 13(15), 3769; https://0-doi-org.brum.beds.ac.uk/10.3390/en13153769
Submission received: 1 June 2020
/
Revised: 9 July 2020
/
Accepted: 14 July 2020
/
Published: 22 July 2020
(This article belongs to the Special Issue Wastewater Treatment and Biogas Production)
Abstract
:The intensification of biological wastewater treatment requires the high usage of electric energy, mainly for aeration processes. Publications on energy consumption have been mostly related to municipal wastewater treatment plants (WWTPs). The aim of the research was to elaborate on models for the estimation of energy consumption during dairy WWTP operation. These models can be used for the optimization of electric energy consumption. The research was conducted in a dairy WWTP, operating with dissolved air flotation (DAF) and an activated sludge system. Energy consumption was measured with the help of three-phase network parameter transducers and a supervisory control and data acquisition (SCADA) system. The obtained models provided accurate predictions of DAF, biological treatment, and the overall WWTP energy consumption using chemical oxygen demand (COD), sewage flow, and air temperature. Using the energy consumption of the biological treatment as an independent variable, as well as air temperature, it is possible to estimate the variability of the total electric energy consumption. During the summer period, an increase in the organic load (expressed as COD) discharged into the biological treatment causes higher electric energy consumption in the whole dairy WWTP. Hence, it is recommended to increase the efficiency of the removal of organic pollutants in the DAF process. An application for the estimation of energy consumption was created.
1. Introduction
Sewage and sludge treatment processes are inextricably linked to electric energy consumption. The intensification of biological wastewater treatment has a positive impact on the natural environment, but requires the high usage of electric energy, mainly for aeration processes. The increased production in dairy plants, observed since Poland’s accession to the European Union, has resulted in an increase in the quantity of dairy sewage and pollutant load. A steady increase in the volume of processed milk has also been observed. Between 2000 and 2016, annual milk production increased from 11,552 hm3 to 12,867 hm3, while the global amount of sewage from the dairy sector reached 28.1 hm3 in 2016 [1].
The characteristics of dairy sewage differ significantly from typical municipal wastewater. The values of pollution indicators, measured by biochemical oxygen demand (BOD5) and chemical oxygen demand (COD), range from 4 to as much as 10 times higher than in municipal wastewater [2,3]. Dairy wastewater is also characterized by a high concentration of phosphorus. Due to the high concentration of pollutants and strict requirements regarding the quality of treated wastewater, the amount of energy used is much higher in comparison with municipal sewage. Energy consumption is also influenced by the high variability of sewage composition and quantity over time [4,5]. Both the volume flow rate and the pollutant load from dairy wastewater treatment plants (WWTPs) depend on the production profile, which may often change daily [6]. About 90% of organic contaminants in dairy wastewater come from residual products washed out during the operation of cleaning-in-place (CIP) stations [7].
In Polish dairy WWTPs, the dominant method of biological wastewater treatment is the aerobic process with activated sludge. The technology of anaerobic treatment is rarely used, however, many food industries use this process for wastewater pre-treatment, before discharging it into municipal WWTPs [8]. According to Dębowski et al. [9], the most commonly used anaerobic reactors are upflow anaerobic sludge blankets (UASBs) and expanded granular sludge beds (EGSBs). Their advantage is the possibility of obtaining biogas and producing heat and electricity. However, the investment costs are high, and maintenance requires highly qualified staff. These technologies are cost-efficient for large WWTPs. Most dairy WWTPs in Poland, including the one analyzed, operate with aerobic systems.
Previous research by the authors has confirmed that the consumption of electric energy in dairy WWTPs is mainly caused by the aeration processes in activated sludge chambers, averaging tanks, and excess sludge stabilization chambers [10,11]. The same is observed in municipal WWTPs [12,13]. Publications on the energy intensity of wastewater treatment are mostly related to municipal WWTPs [14,15]. The given indicators concern entire WWTPs, without division into individual processes. The amount of energy per unit of wastewater volume is the most common indicator given as a result of analysis [16]. Large differences in energy consumption are caused by applying technologically different facilities, hydraulics, and pollutant loads. There is a clear downward trend in unit energy consumption as the capacity of the WWTPs increases. The highest values are characterized by objects operating with classical activated sludge technology, with intensive aeration. Municipal WWTPs in most cases consume less than 1 kWh per m3 of treated wastewater [17].
It is important to state that although there are many publications describing energy consumption, only a few of them go so far as to state the actual equations for energy usage, based on online measurement [18,19,20,21]. Yu et al. [18] modeled the energy intensity of municipal WWTPs, using semi-parametric quantum regression in Bayesian terms. The data were used to develop a model of electric energy consumption and to formulate conclusions allowing for optimization. It was shown that electric energy consumption, in relation to the unit of removed load, is closely correlated to sewage temperature. Models proposed by [13,22] require online measurements of COD and air temperature to obtain predicted values of energy consumption.
Analyzing the state of the art, it was found that it is necessary to use advanced real-time electric energy measuring systems to determine and improve energy efficiency. There is a lack of uniform and widely accepted procedures for determining the energy efficiency of municipal and industrial WWTPs. The need to optimize the electric energy consumption in dairy WWTPs has become a prerequisite for carrying out research and modeling processes.
The aim of the research was to elaborate on models for energy consumption estimation during the operation of dairy WWTPs, which could then be used by operators and designers for the optimization of electric energy consumption during particular processes.
2. Materials and Methods
2.1. Study Site
The Bielmlek dairy WWTP (52.756199 N, 23.173387 E) has applied sequence batch reactors (SBRs) during biological treatment since 2012. The project parameters were an average sewage flow of 750 m3d−1 and a 11,500 person equivalent (PE). The average daily flow during the research period was 653 m3d−1 (301 ÷ 1154 m3d−1). The value of BOD5 changed from 1067 to 2240 mgO2 dm−3, while that of COD varied from 1429 to 2945 mg O2 dm−3. The concentration of total nitrogen (Ntot) fluctuated within the range of 32 ÷ 64 mg N dm−3, while the concentration of total phosphorus (Ptot) was from 5 to 24 mg P dm−3.
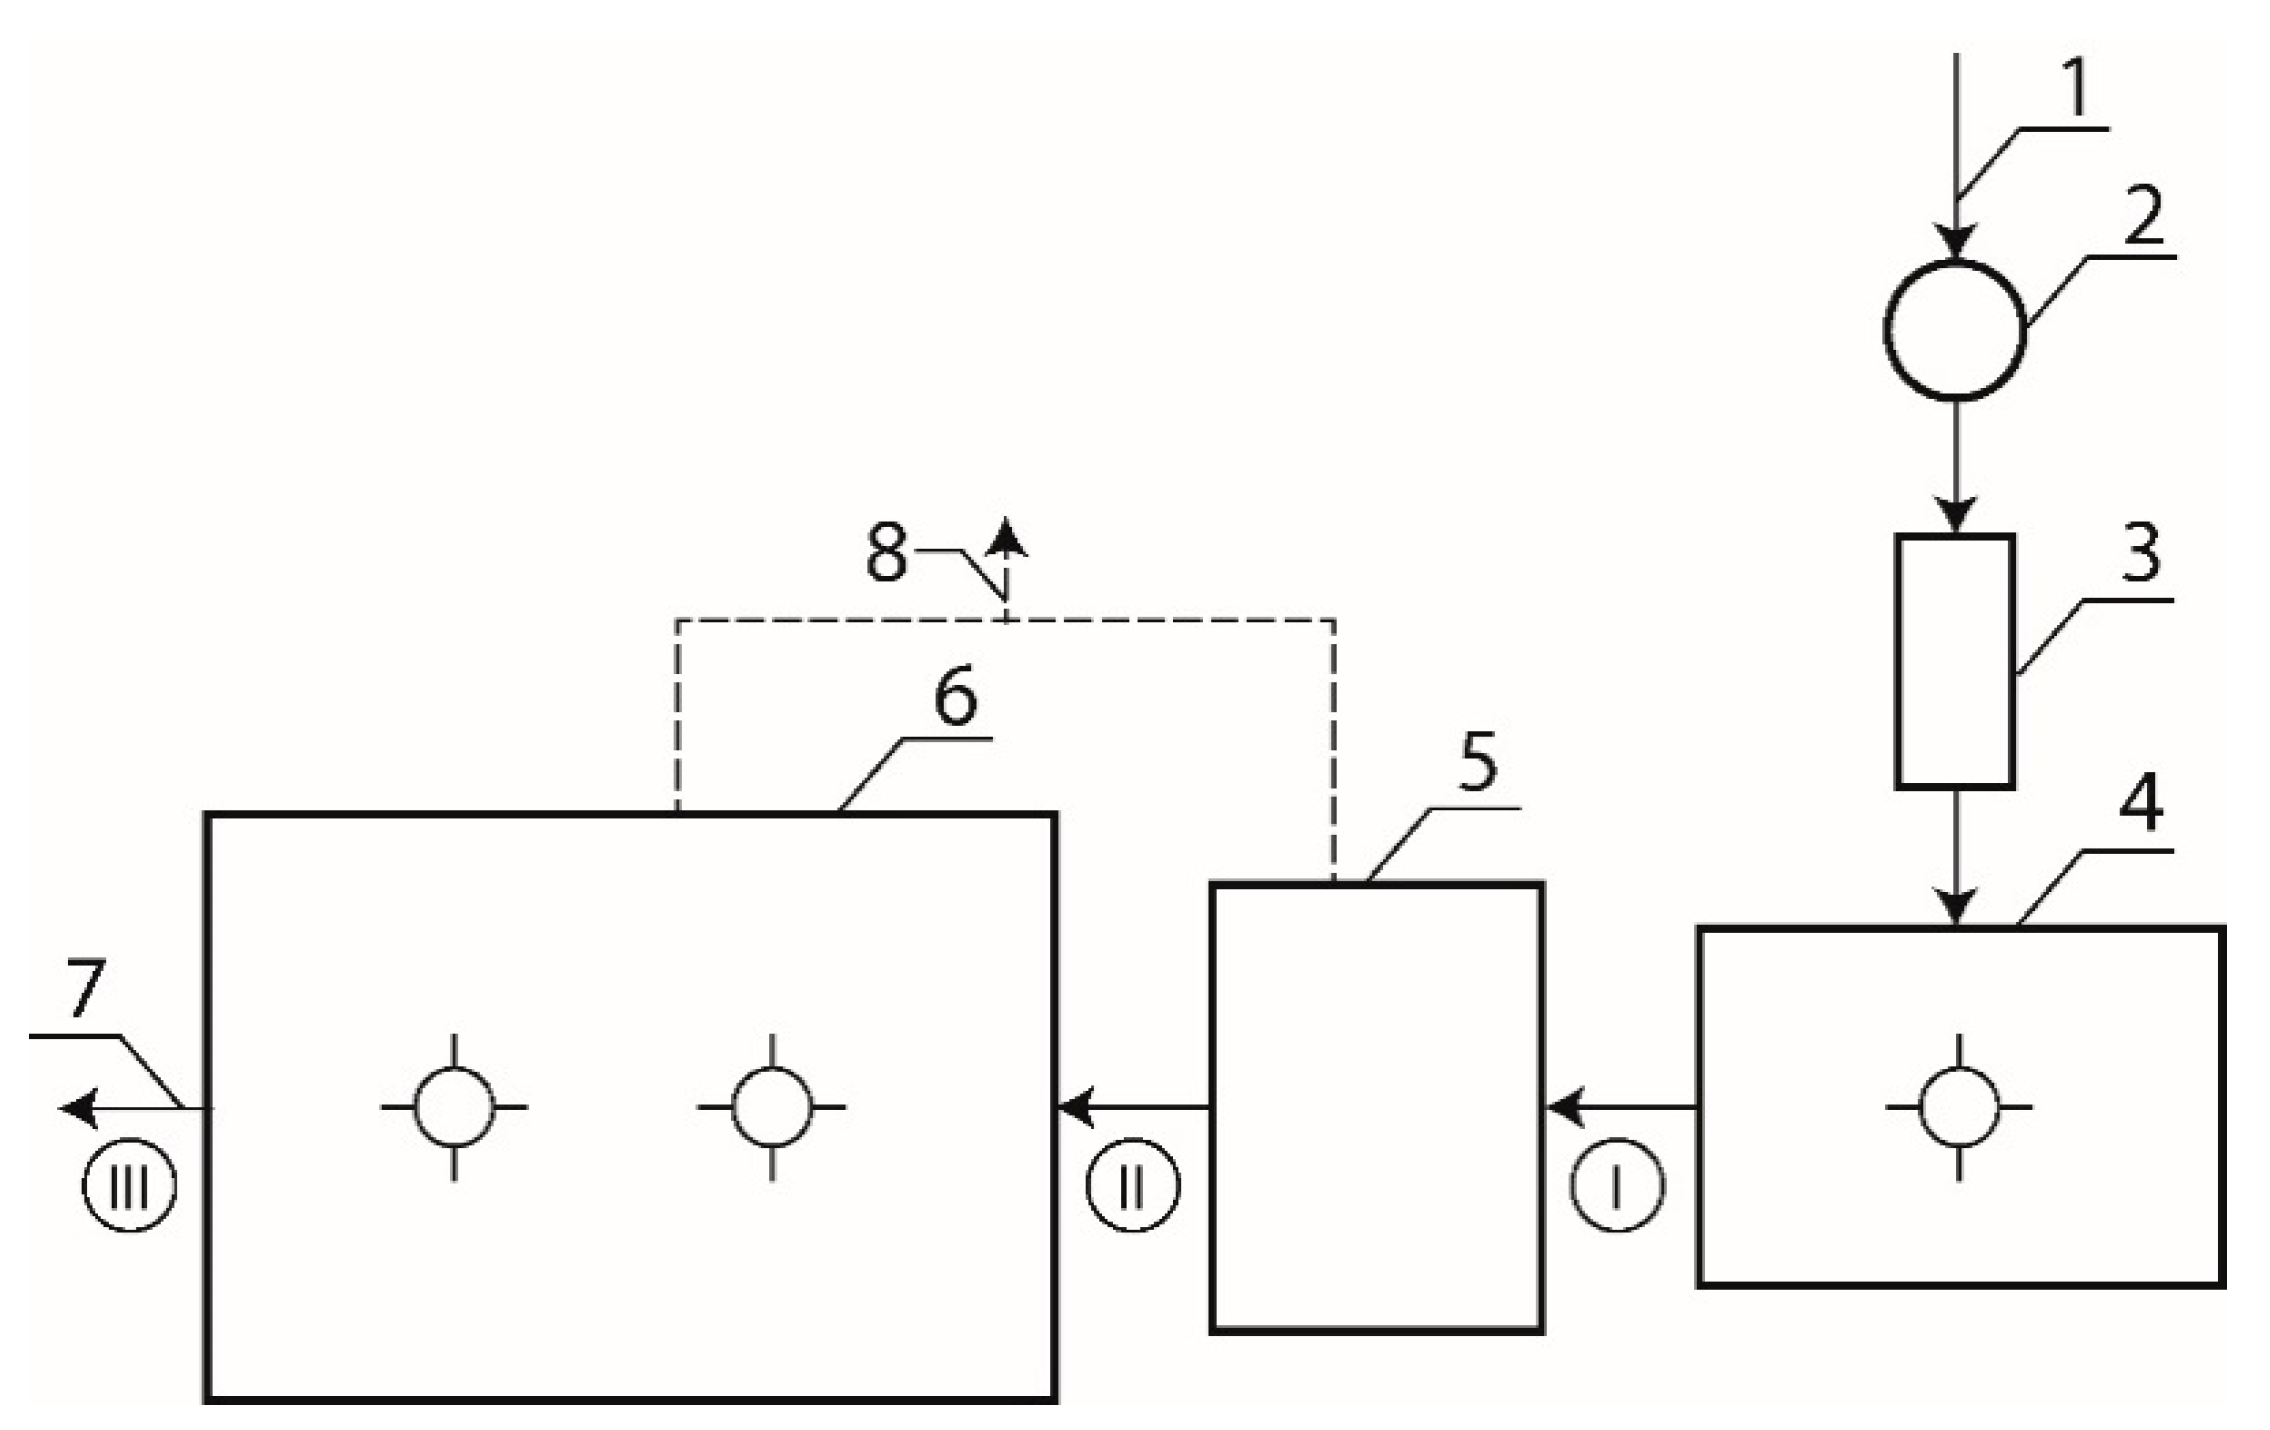
The sewage treatment process has two phases: physical and biological. After the sieve and grit chamber, wastewater is discharged into an averaging tank. The next step is dissolved air flotation (DAF), supported by adding coagulants and flocculant. After biological treatment with two SBRs, sewage is discharged into the Biała river. Excess sewage sludge generated in the process is subjected to aerobic stabilization and mechanical dewatering and is finally used as fertilizer. The total installed power of the dairy WWTP is 234.7 kW while the DAF treatment is 19.3 kW and the biological treatment is 104.5 kW. Figure 1 shows a diagram of the Bielmlek dairy WWTP and sampling points.
2.2. Electric Energy Measuring Methods
Three-phase network parameter transducers installed within the plant were used to measure energy consumption. The current transformers sent signals, which were then received by the transducers. Precise measurement was possible thanks to current transformers connected to every single electric device within the plant. A supervisory control and data acquisition system (SCADA) collected the information from the current transformers and showed the results online; it also archived and processed the data.
2.3. Sampling of Sewage and Analytical Procedures
Measurements of 95 series were performed. Each series included measurements of sewage parameters from sampling points I, II, and III (Figure 1). The measurements were taken over 30 months. The following basic parameters of wastewater were monitored: BOD5, COD, Ntot, and Ptot. Sewage quantity and meteorological conditions were also monitored. The performed analysis allowed for the creation of a database containing the following parameters:
- —air temperature,
- , , , —pollutant (BOD5, COD, Ntot, and Ptot) loads after the averaging tank (point I),
- , , , —pollutant loads after DAF treatment (point II),
- , , , —pollutant loads after biological treatment in SBRs (point III).
2.4. Modeling of Electric Energy Consumption
It was found that the total electric energy consumption () was significantly affected by the electric energy consumption during biological treatment ), and the electric energy consumption during the DAF process (.
Statistical inference, regarding energy consumption during various treatment stages, was based on regression methods. For all modeling procedures, residual analysis was performed to confirm the validity of linear fits. The inference was conducted according to the following scheme (the selected method of analysis is given in brackets):
- modeling of was carried out based on and (the least squares linear regression);
- a qualitative analysis of , , , and was carried out. was used as an independent variable (quantile and quantile segmented regression methods);
- modeling of was carried out based on the and (the least squares linear regression method);
- a qualitative analysis of was carried out based on (quantile regression and segmented quantile regression methods);
- modeling of was carried out based on (the least squares linear regression method).
The qualitative analysis was performed using quantile regression [25]. This method is recommended for the analysis of data from biological systems with complex interactions [26]. Based on nonlinear quantile regression [27], a segmented quantile regression was performed to better fit the data:
where —dependent variable;—independent variable; —intercept;—slope; —slope modifier; and —value of , where slope changes by the modifier.
A nonlinear model of the form (1) can be rewritten for different values of an independent variable:
Numerical analysis was performed in the R environment [28], version 3.5.2. The following additional packages were used in the analysis besides the basic ones supplied with the environment: quantreg version 5.38 for quantile regression [29]; RColorBrewer version 1.1.2 for graphical presentation of the obtained models [30]; and lattice version 0.20.38 for graphical presentation of the obtained models [31].
3. Results
3.1. Total Electric Energy Consumption
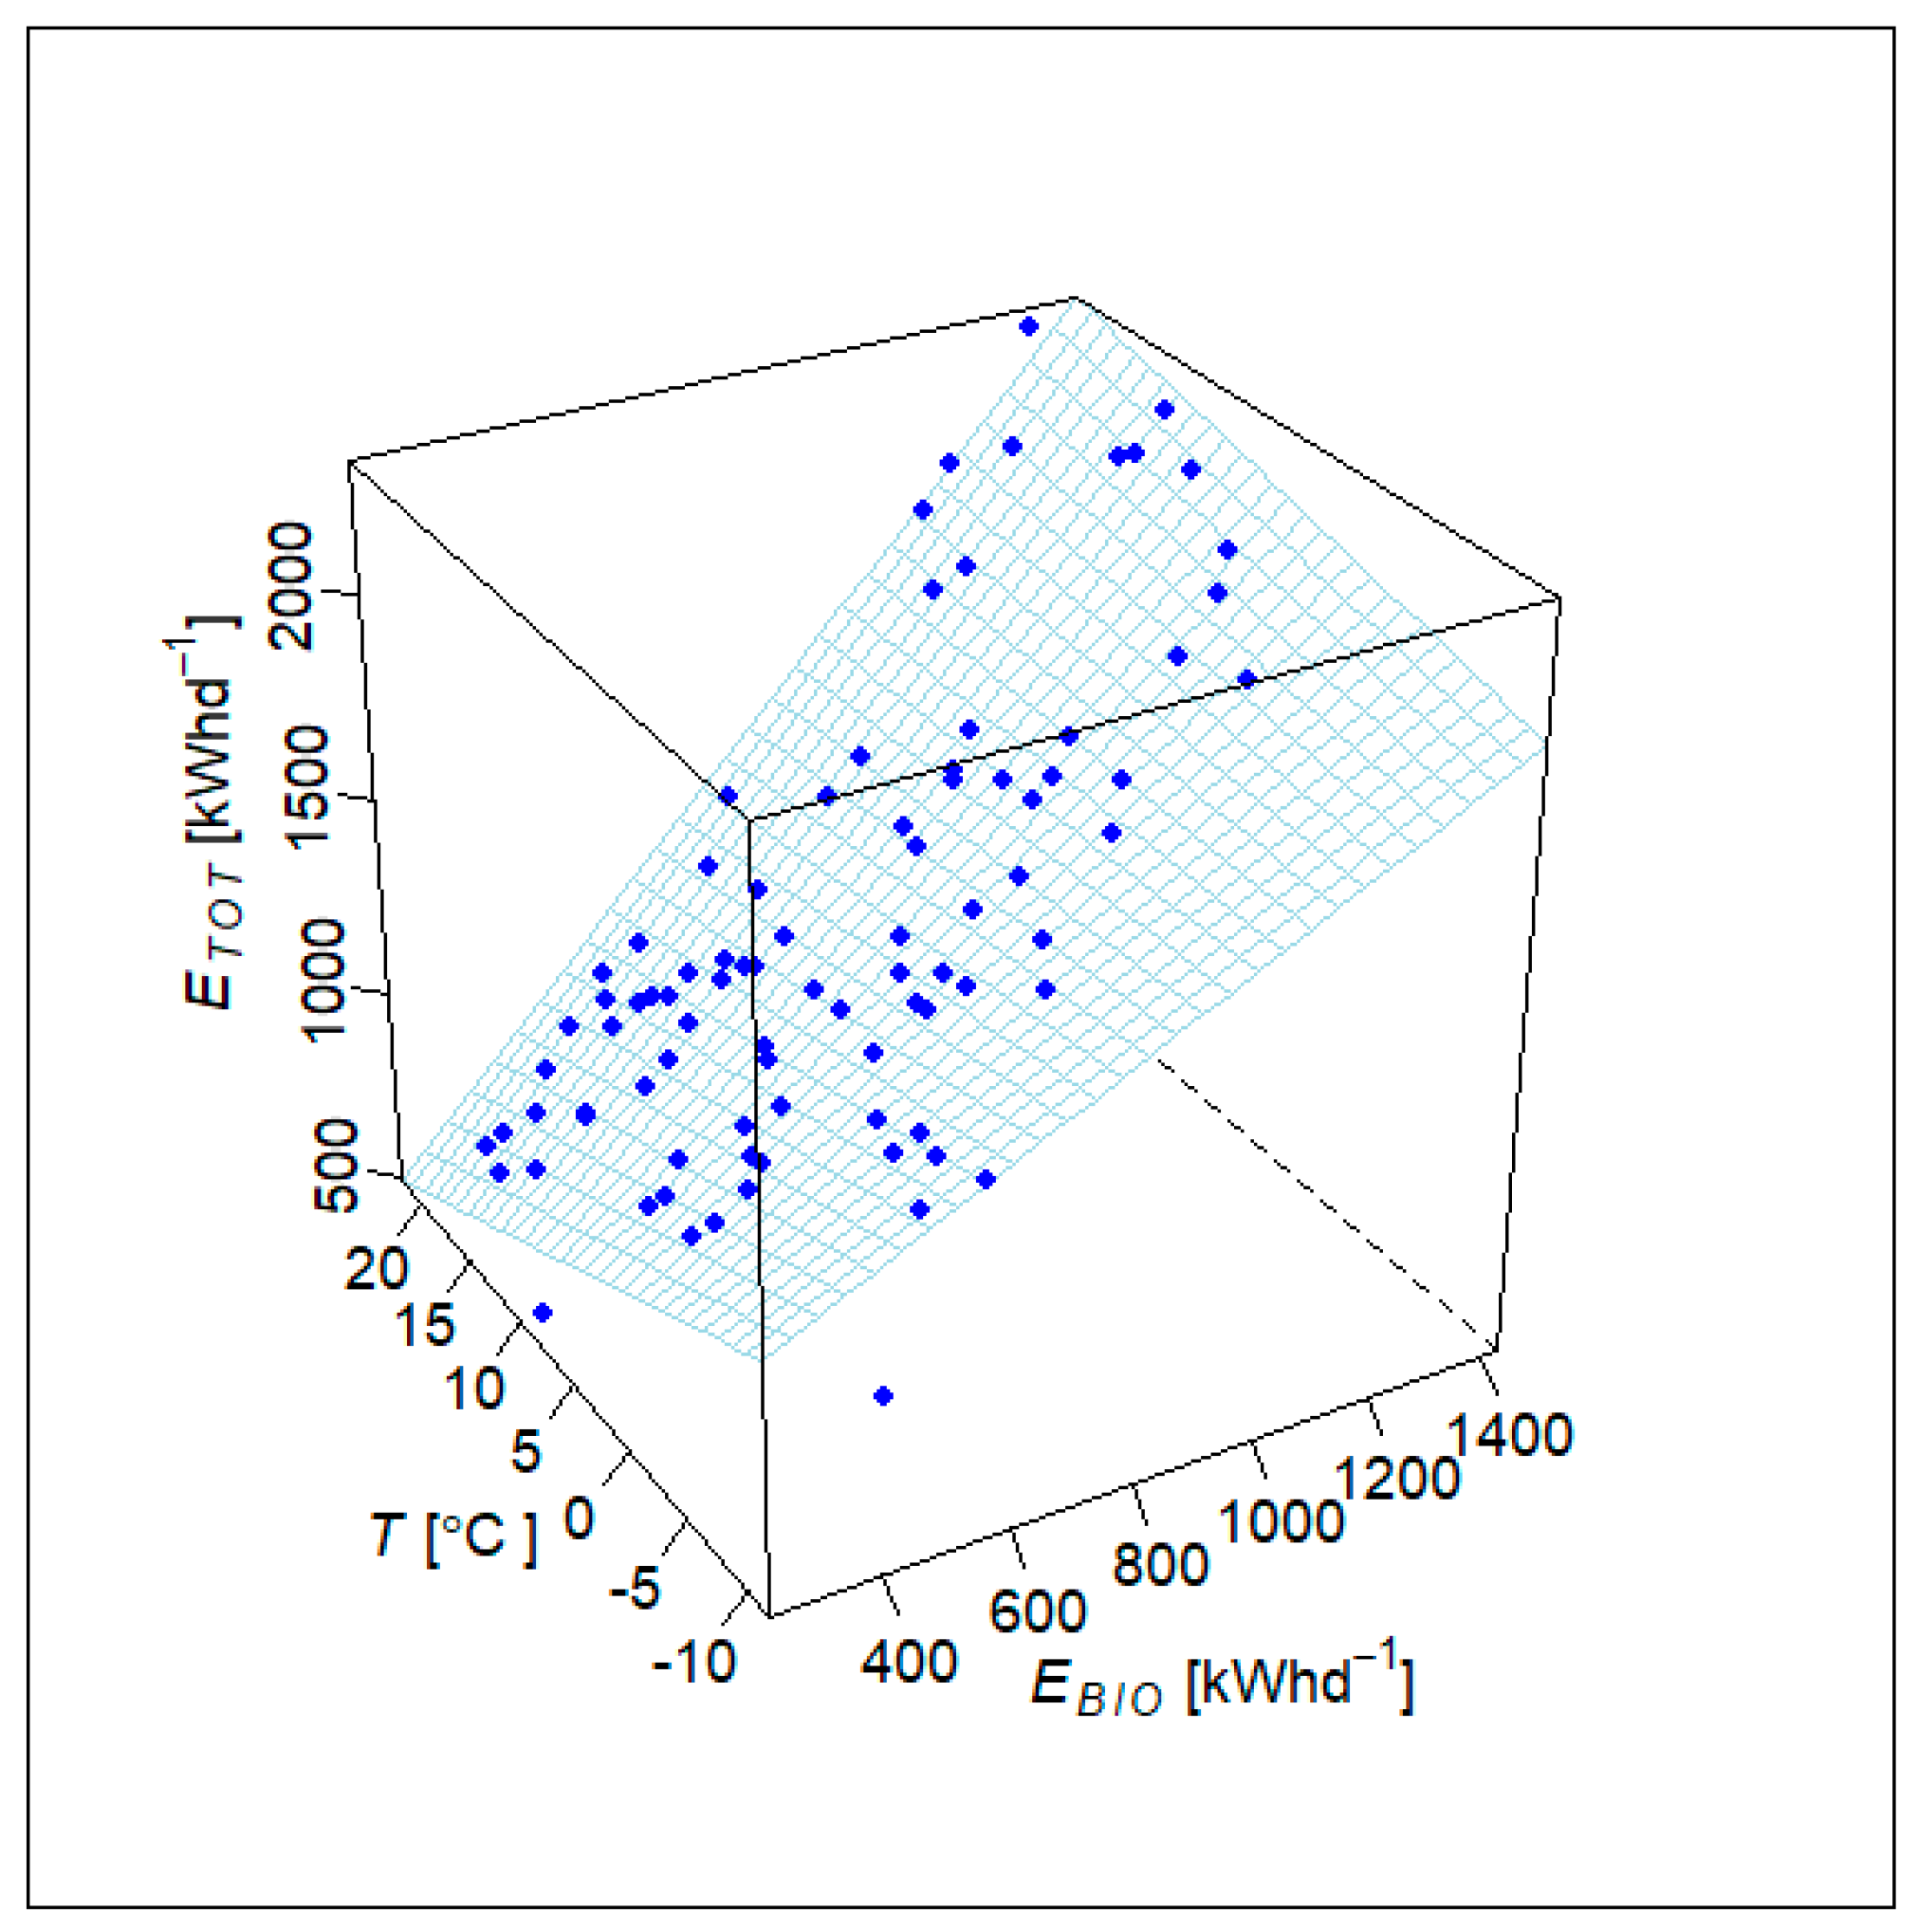
depends on and . The standard least squares regression analysis revealed the following model:
A graphical representation of model (3) is presented in Figure 2.
The obtained model, presented in Figure 2 as a surface in three dimensions, is characterized by: a very good linear fit with a high coefficient of determination (adjusted for multiplicity) , a proper residual structure (no significant deviation from normality and homoscedasticity), overall statistical significance (), and statistically significant coefficients (). A characteristic element of the model (3) is the interaction term , which can be interpreted as an element changing the ratio of depending on and . This interpretation is presented in Equations (4) and (5).
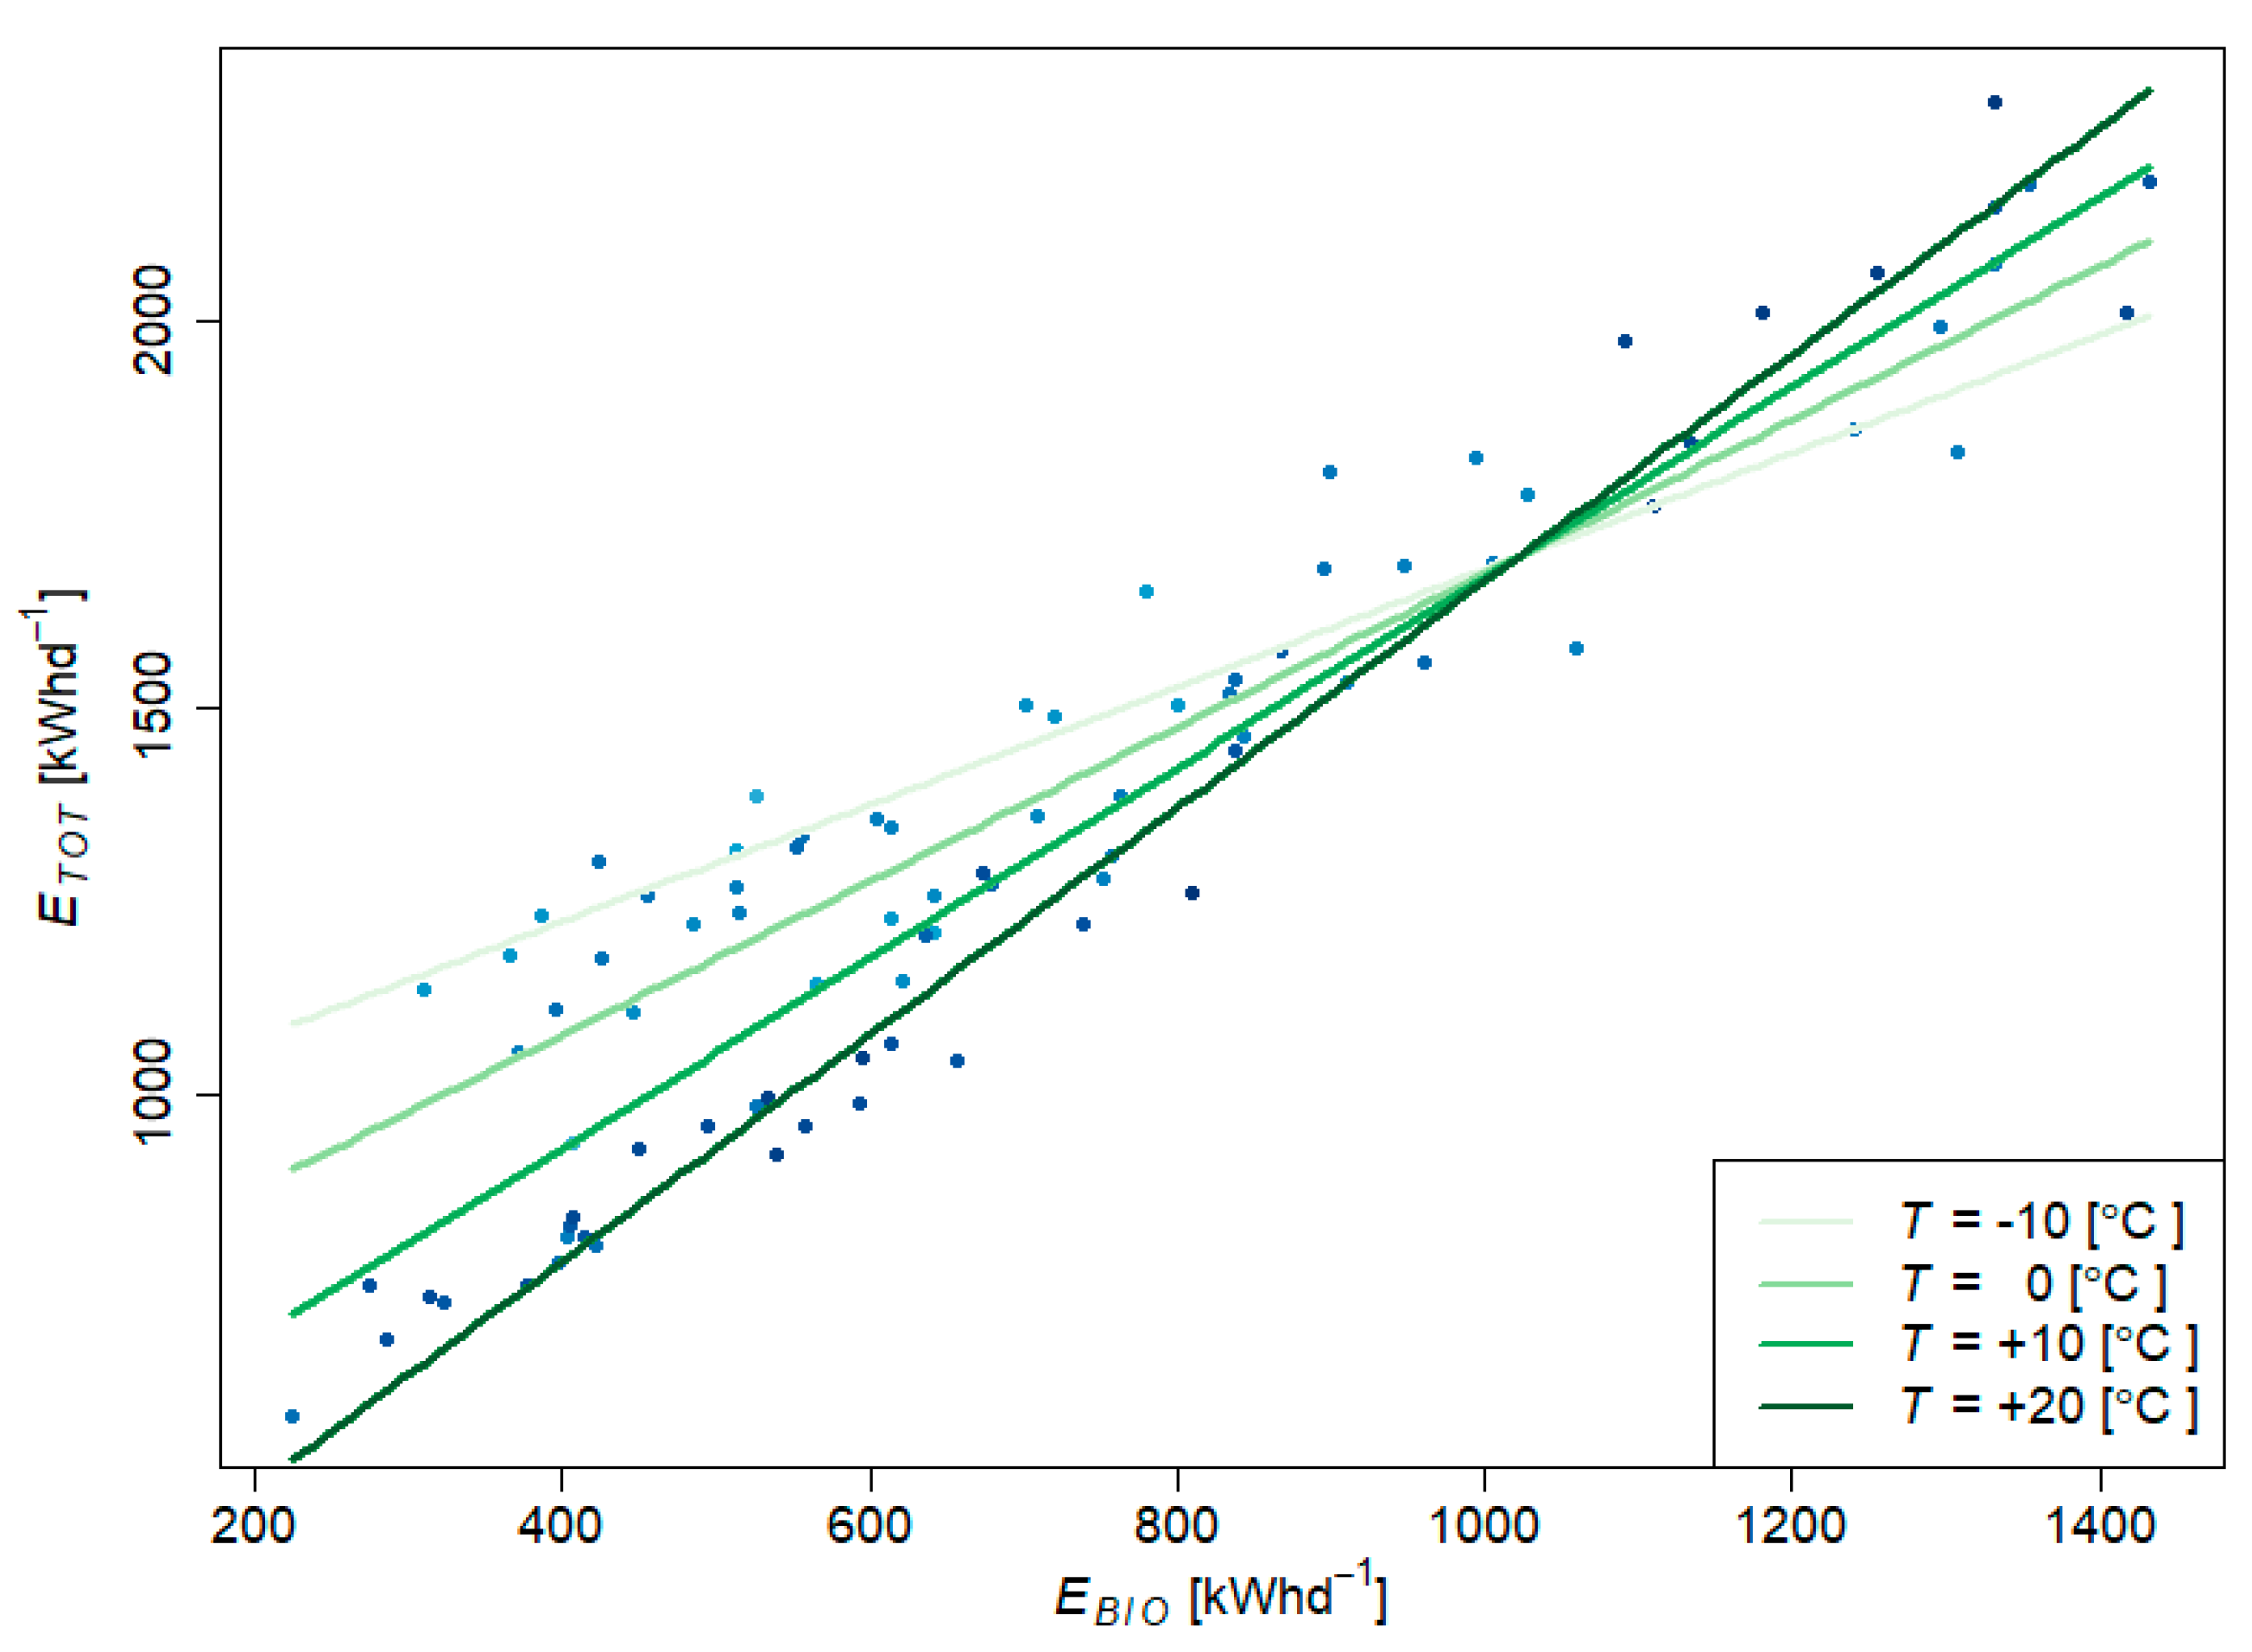
A graphical representation of model (4) is presented in Figure 3.
Figure 3 is a two-dimensional representation of the three-dimensional Figure 2, so it does not show temperature fluctuations. The green lines were obtained by inserting the value of into the Equation (3). The points and lines should follow themselves in order to follow the plane in Figure 2. The energy consumption was measured at a variable outside temperature, which slightly distorted Figure 3. The plane shown in Figure 3 is twisted as coded in the Equation (3). Temperature lines intersect at . This specific value presents the value of , which, for this twisted plane, is parallel to the temperature axis. It means that is constant there. If we skip the temperature axis, like in Figure 3, then this point presents the intersection of temperature lines.
The model clearly shows that as the temperature increased, the share of the biological part () in total electric energy consumption ( rose. This was due to a decrease in oxygen solubility in wastewater as the air temperature increases. During the summer months, while a reduction in oxygen solubility can be observed, the energy requirement for wastewater aeration is higher when compared with . After exceeding the limit amount of energy taken for biological treatment (), the opposite phenomenon occurs. The same conclusion can be drawn directly from Figure 2. The twisting of the plane representing Equation (3) means that if the temperature increases, so does the linear coefficient of , and total energy usage is more sensitive to changes in .
3.2. Electric Energy Consumption during Biological Treatment
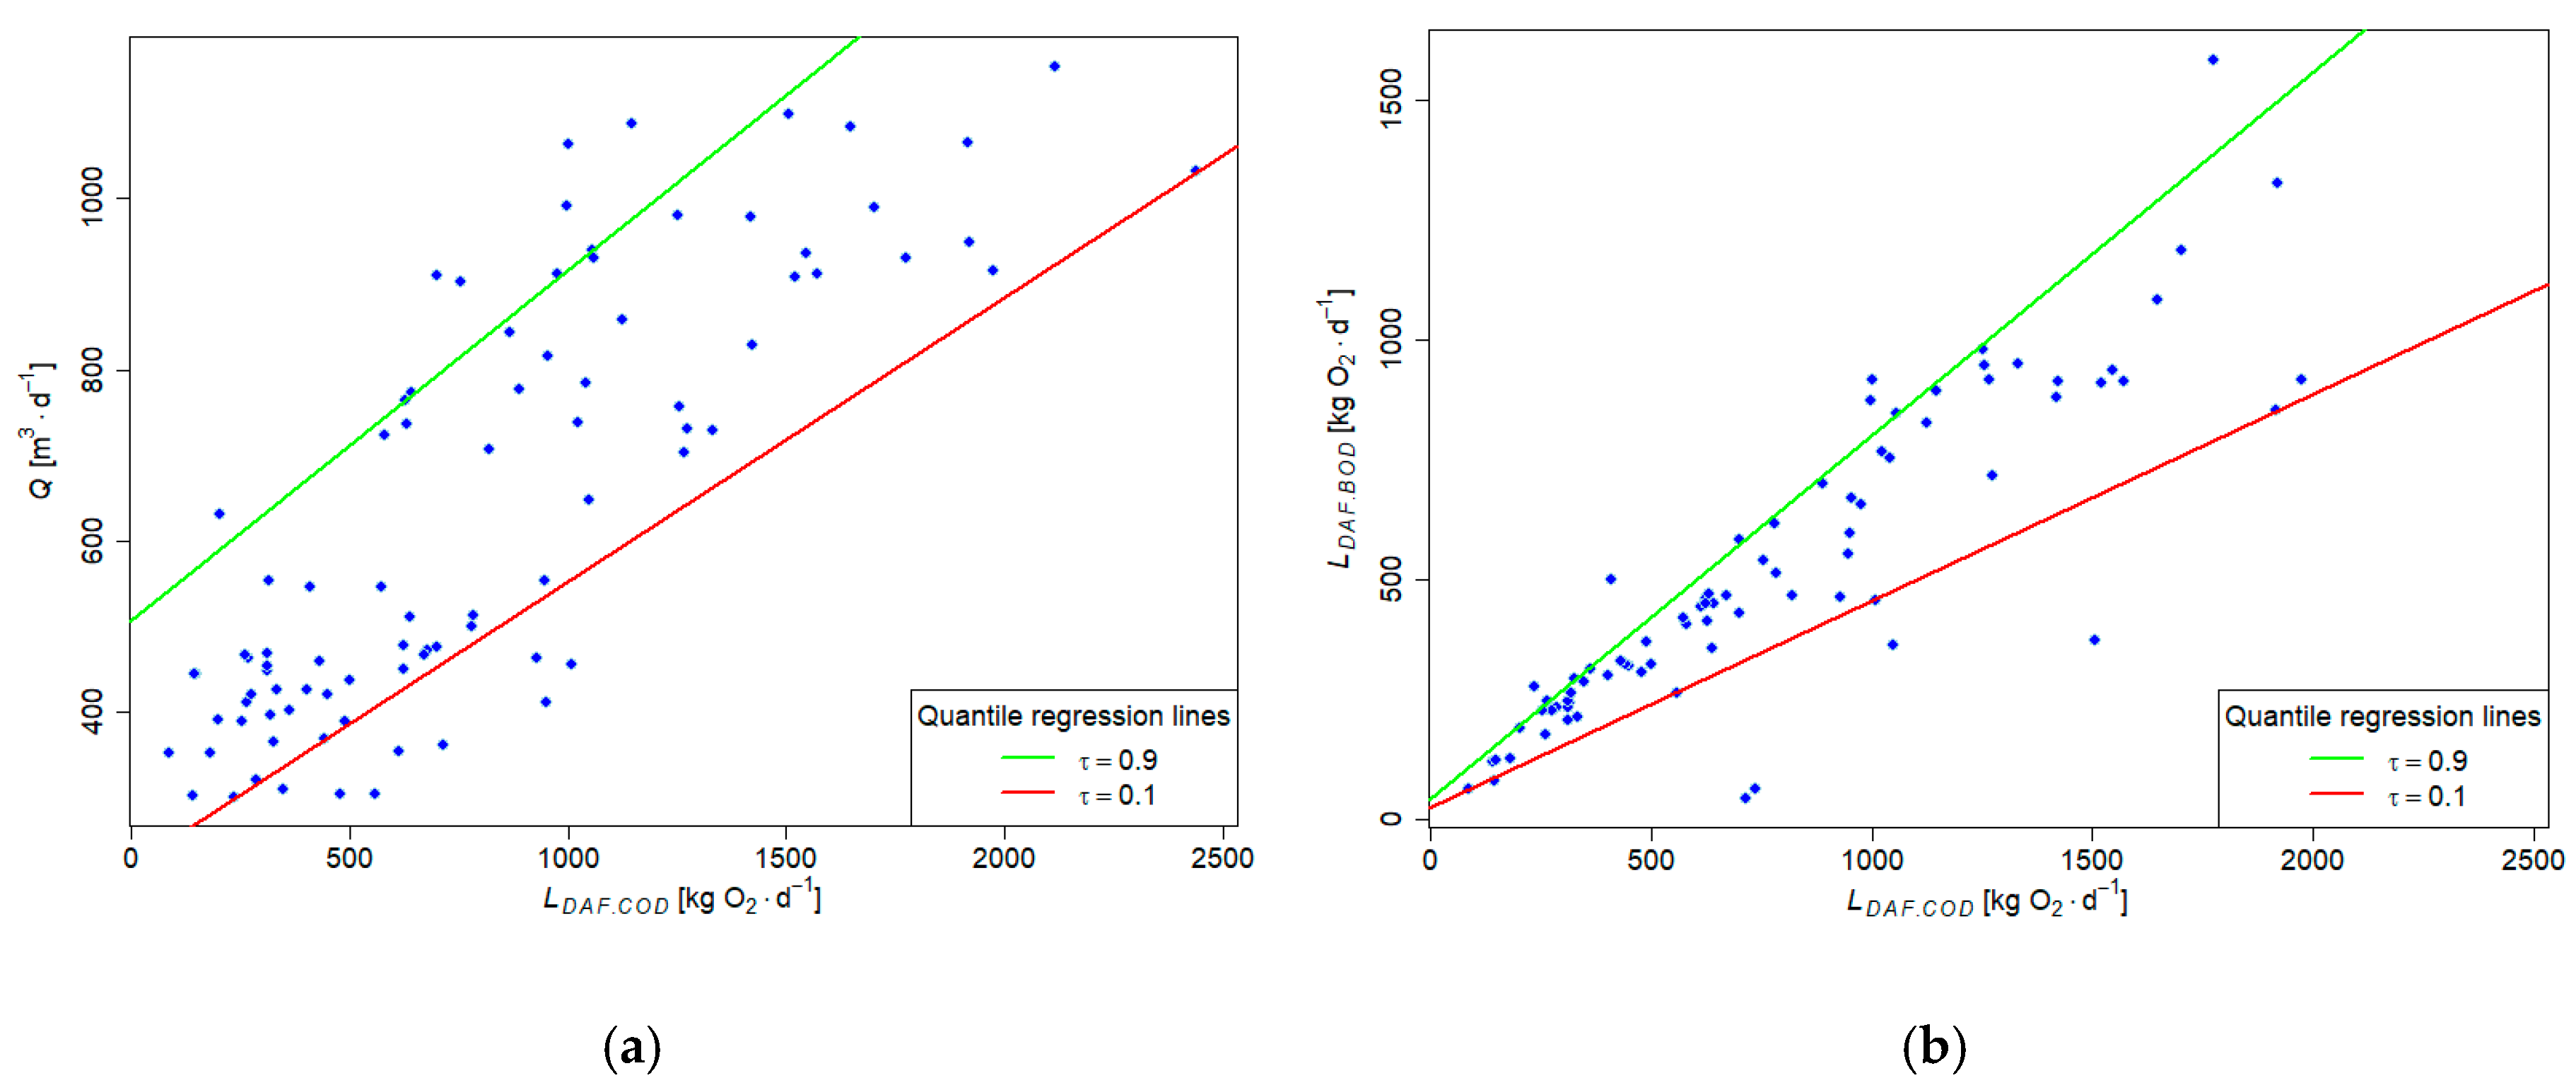
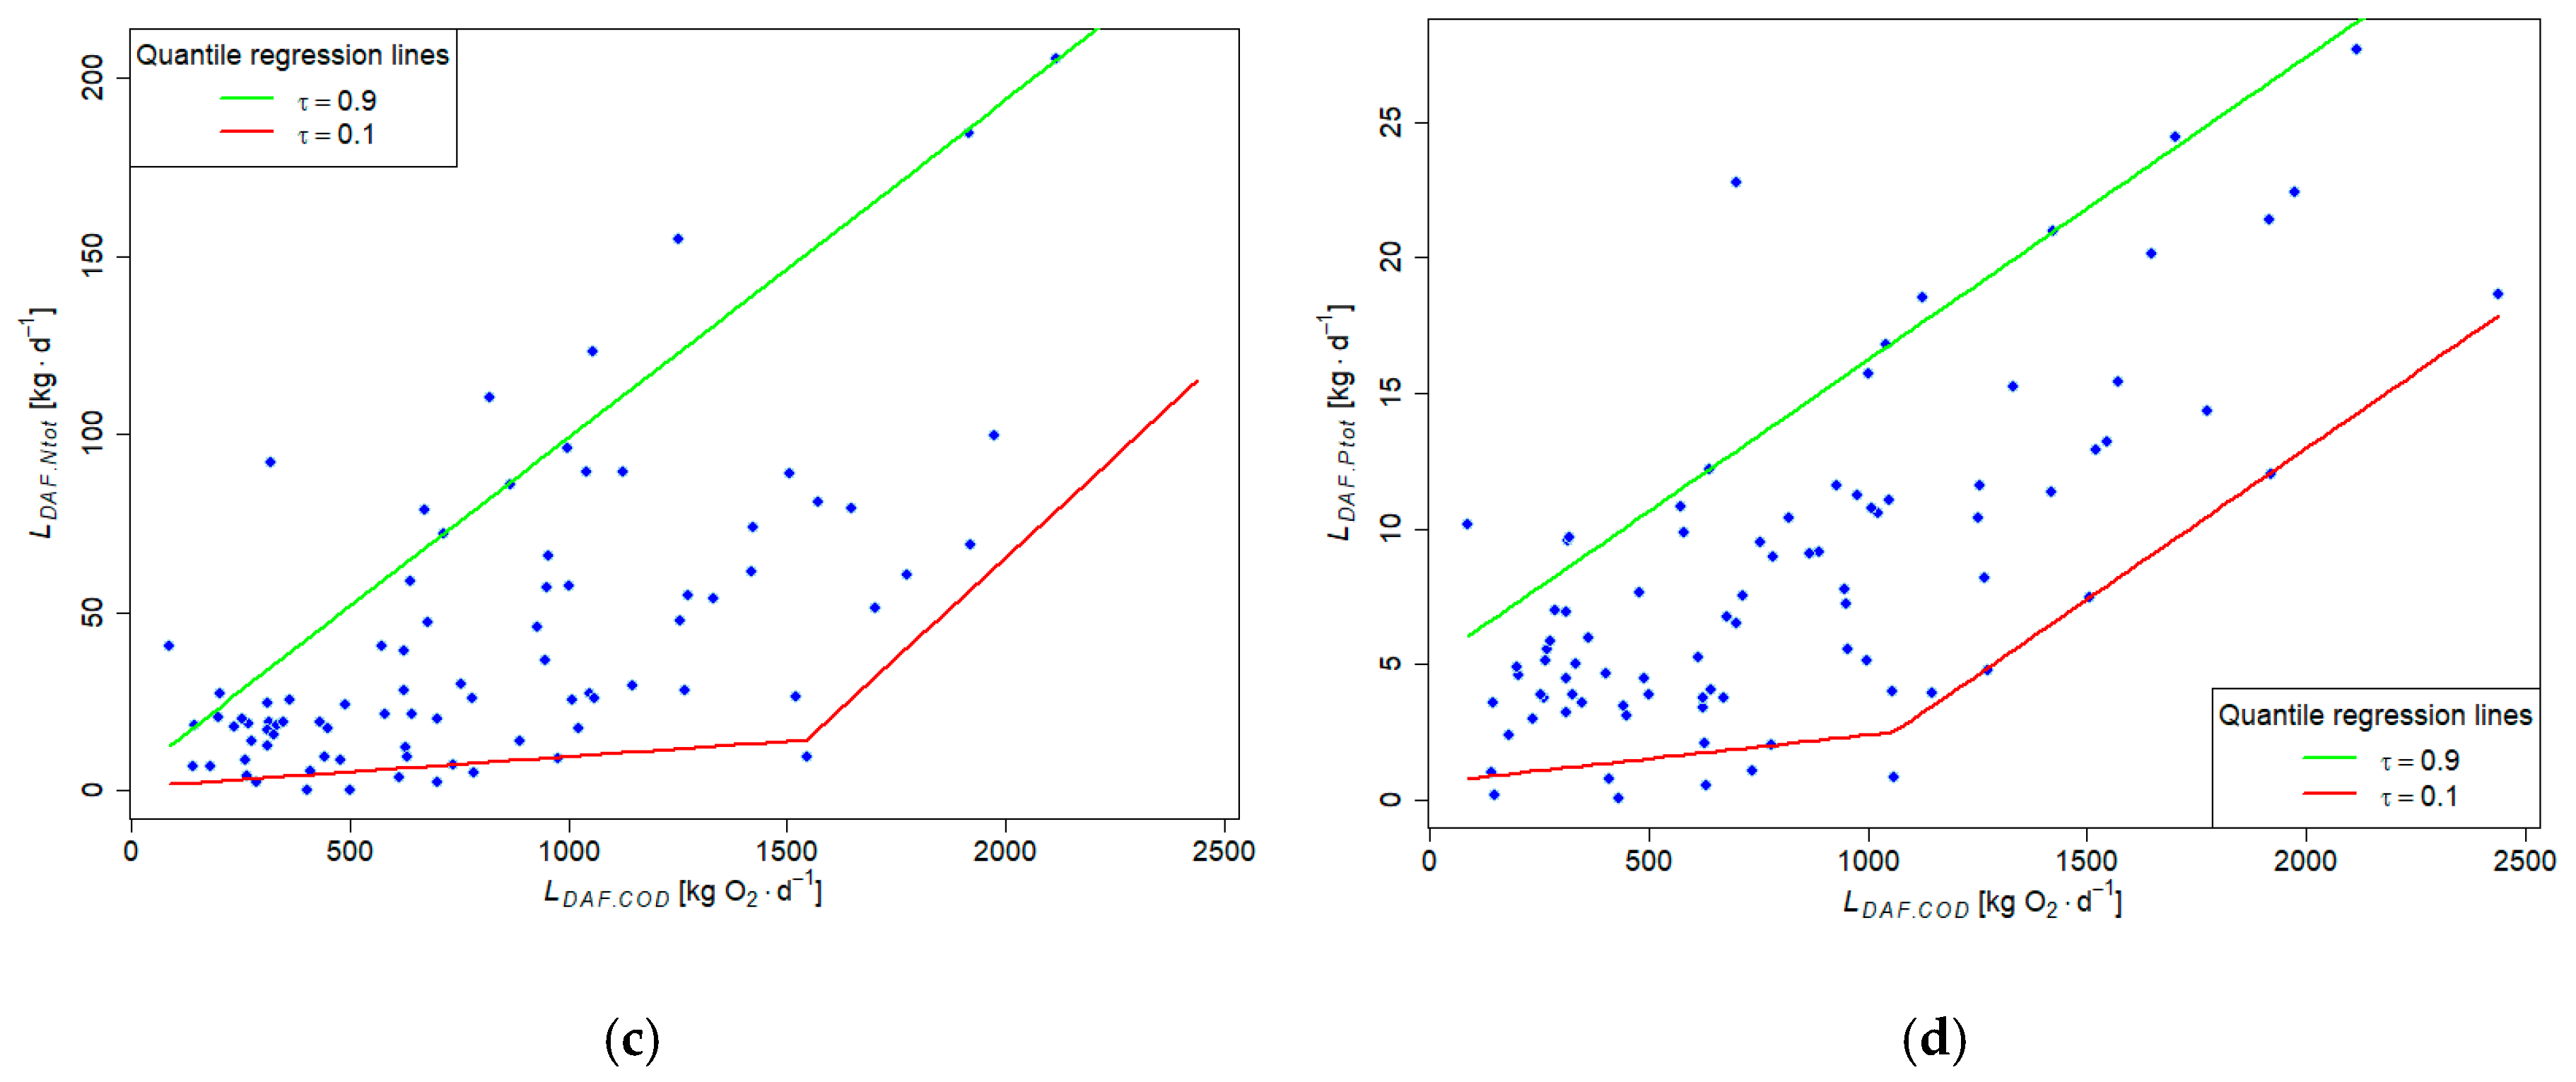
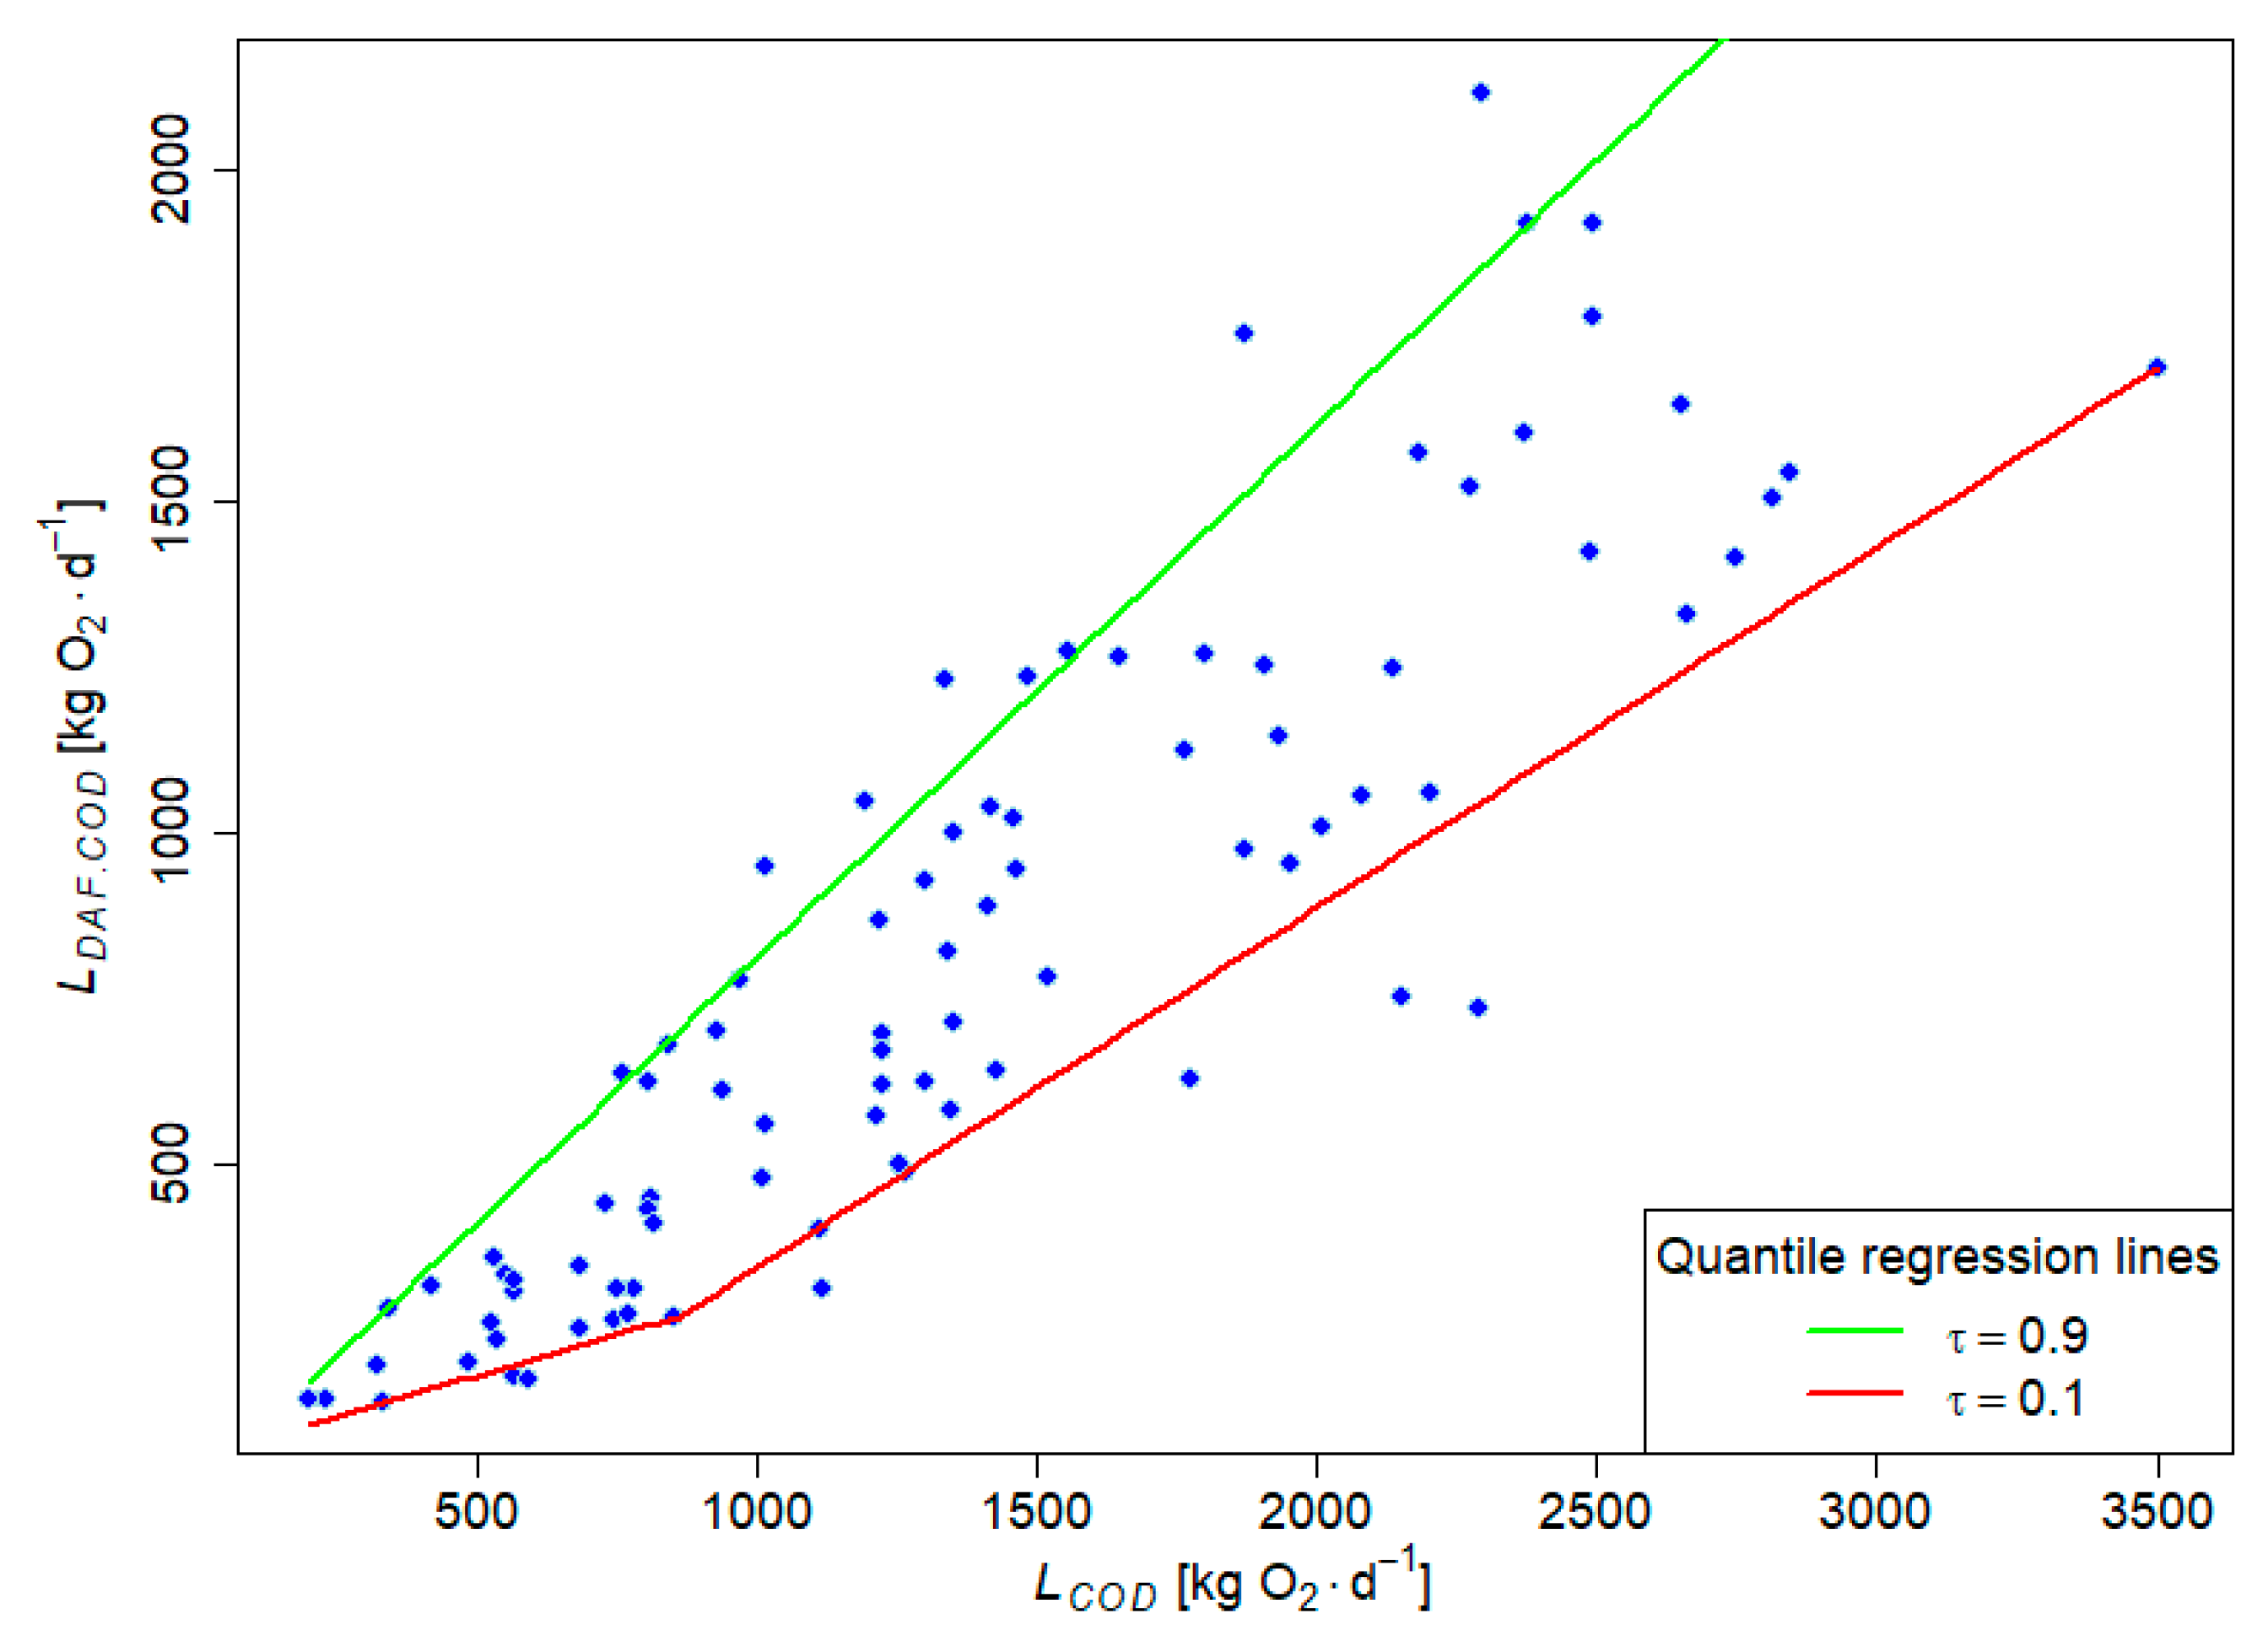
The amount of energy used in the process of biological treatment with activated sludge should be dependent on the input of pollutant loads and the air temperature T. However, when examining the relationships between these parameters, only T and are completely independent of each other. This can be explained by the operation of the averaging tank and DAF process. It results in the averaging of sewage parameters discharged for biological treatment. Using quantile regression, a description of the sewage parameters correlation was made in the form of appropriate models for the quantiles and . was the independent variable in all models. This variable was chosen because of measurement simplicity. To ensure that every dependent variable was greater than 0, the segmented model for was used. The obtained models are presented in Figure 4.
The equations describing the obtained models are presented in Table 1.
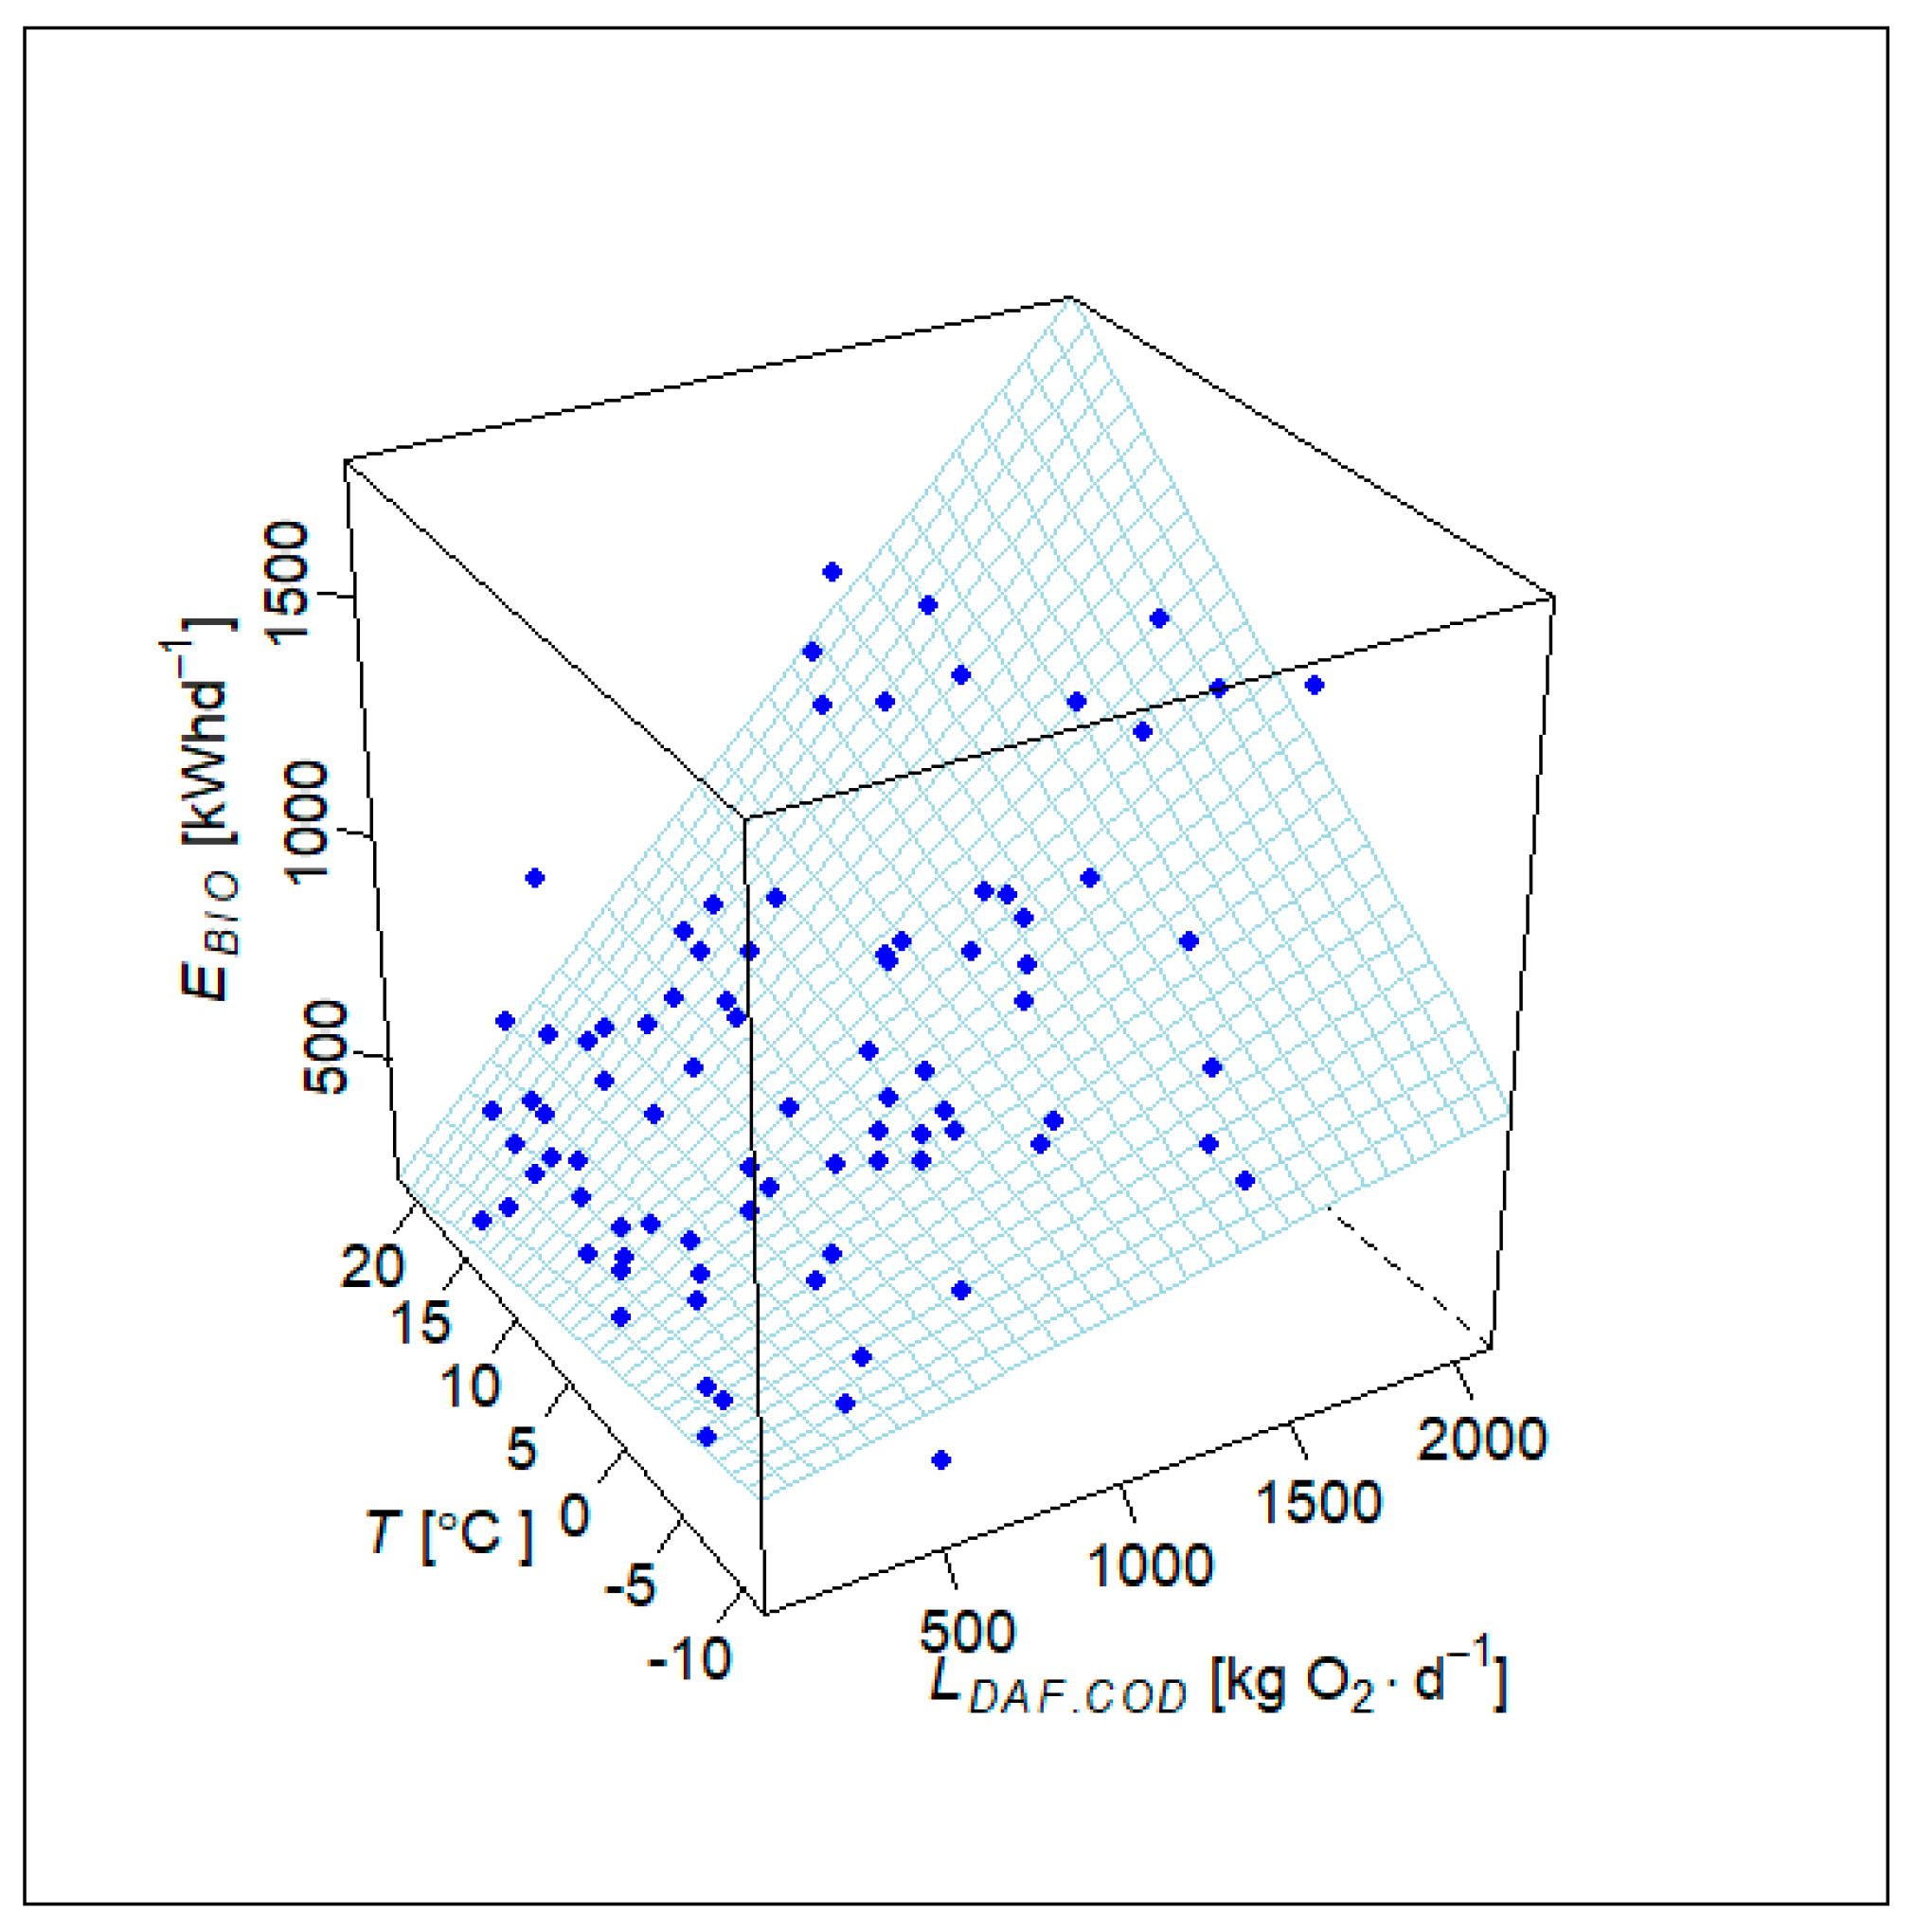
should depend on sewage parameters and . Taking into account the information presented in Table 1, and were the independent parameters used for describing . The following model was estimated by a linear least squares analysis:
Equation (6) is presented in Figure 5.
The obtained model, presented graphically as a surface in three-dimensions in Figure 5, is characterized by: a good linear fit, with an acceptable coefficient of determination (adjusted for multiplicity) a proper residual structure (no significant deviation from normality and homoscedasticity); overall statistical significance (); and statistically significant coefficients (), except the one for (), which is at the border of significance. The coefficient was retained in the model due to the presence and significance of the interaction term . Using the interaction term, as temperature-based change of COD, we obtained the load coefficient Equation (7).
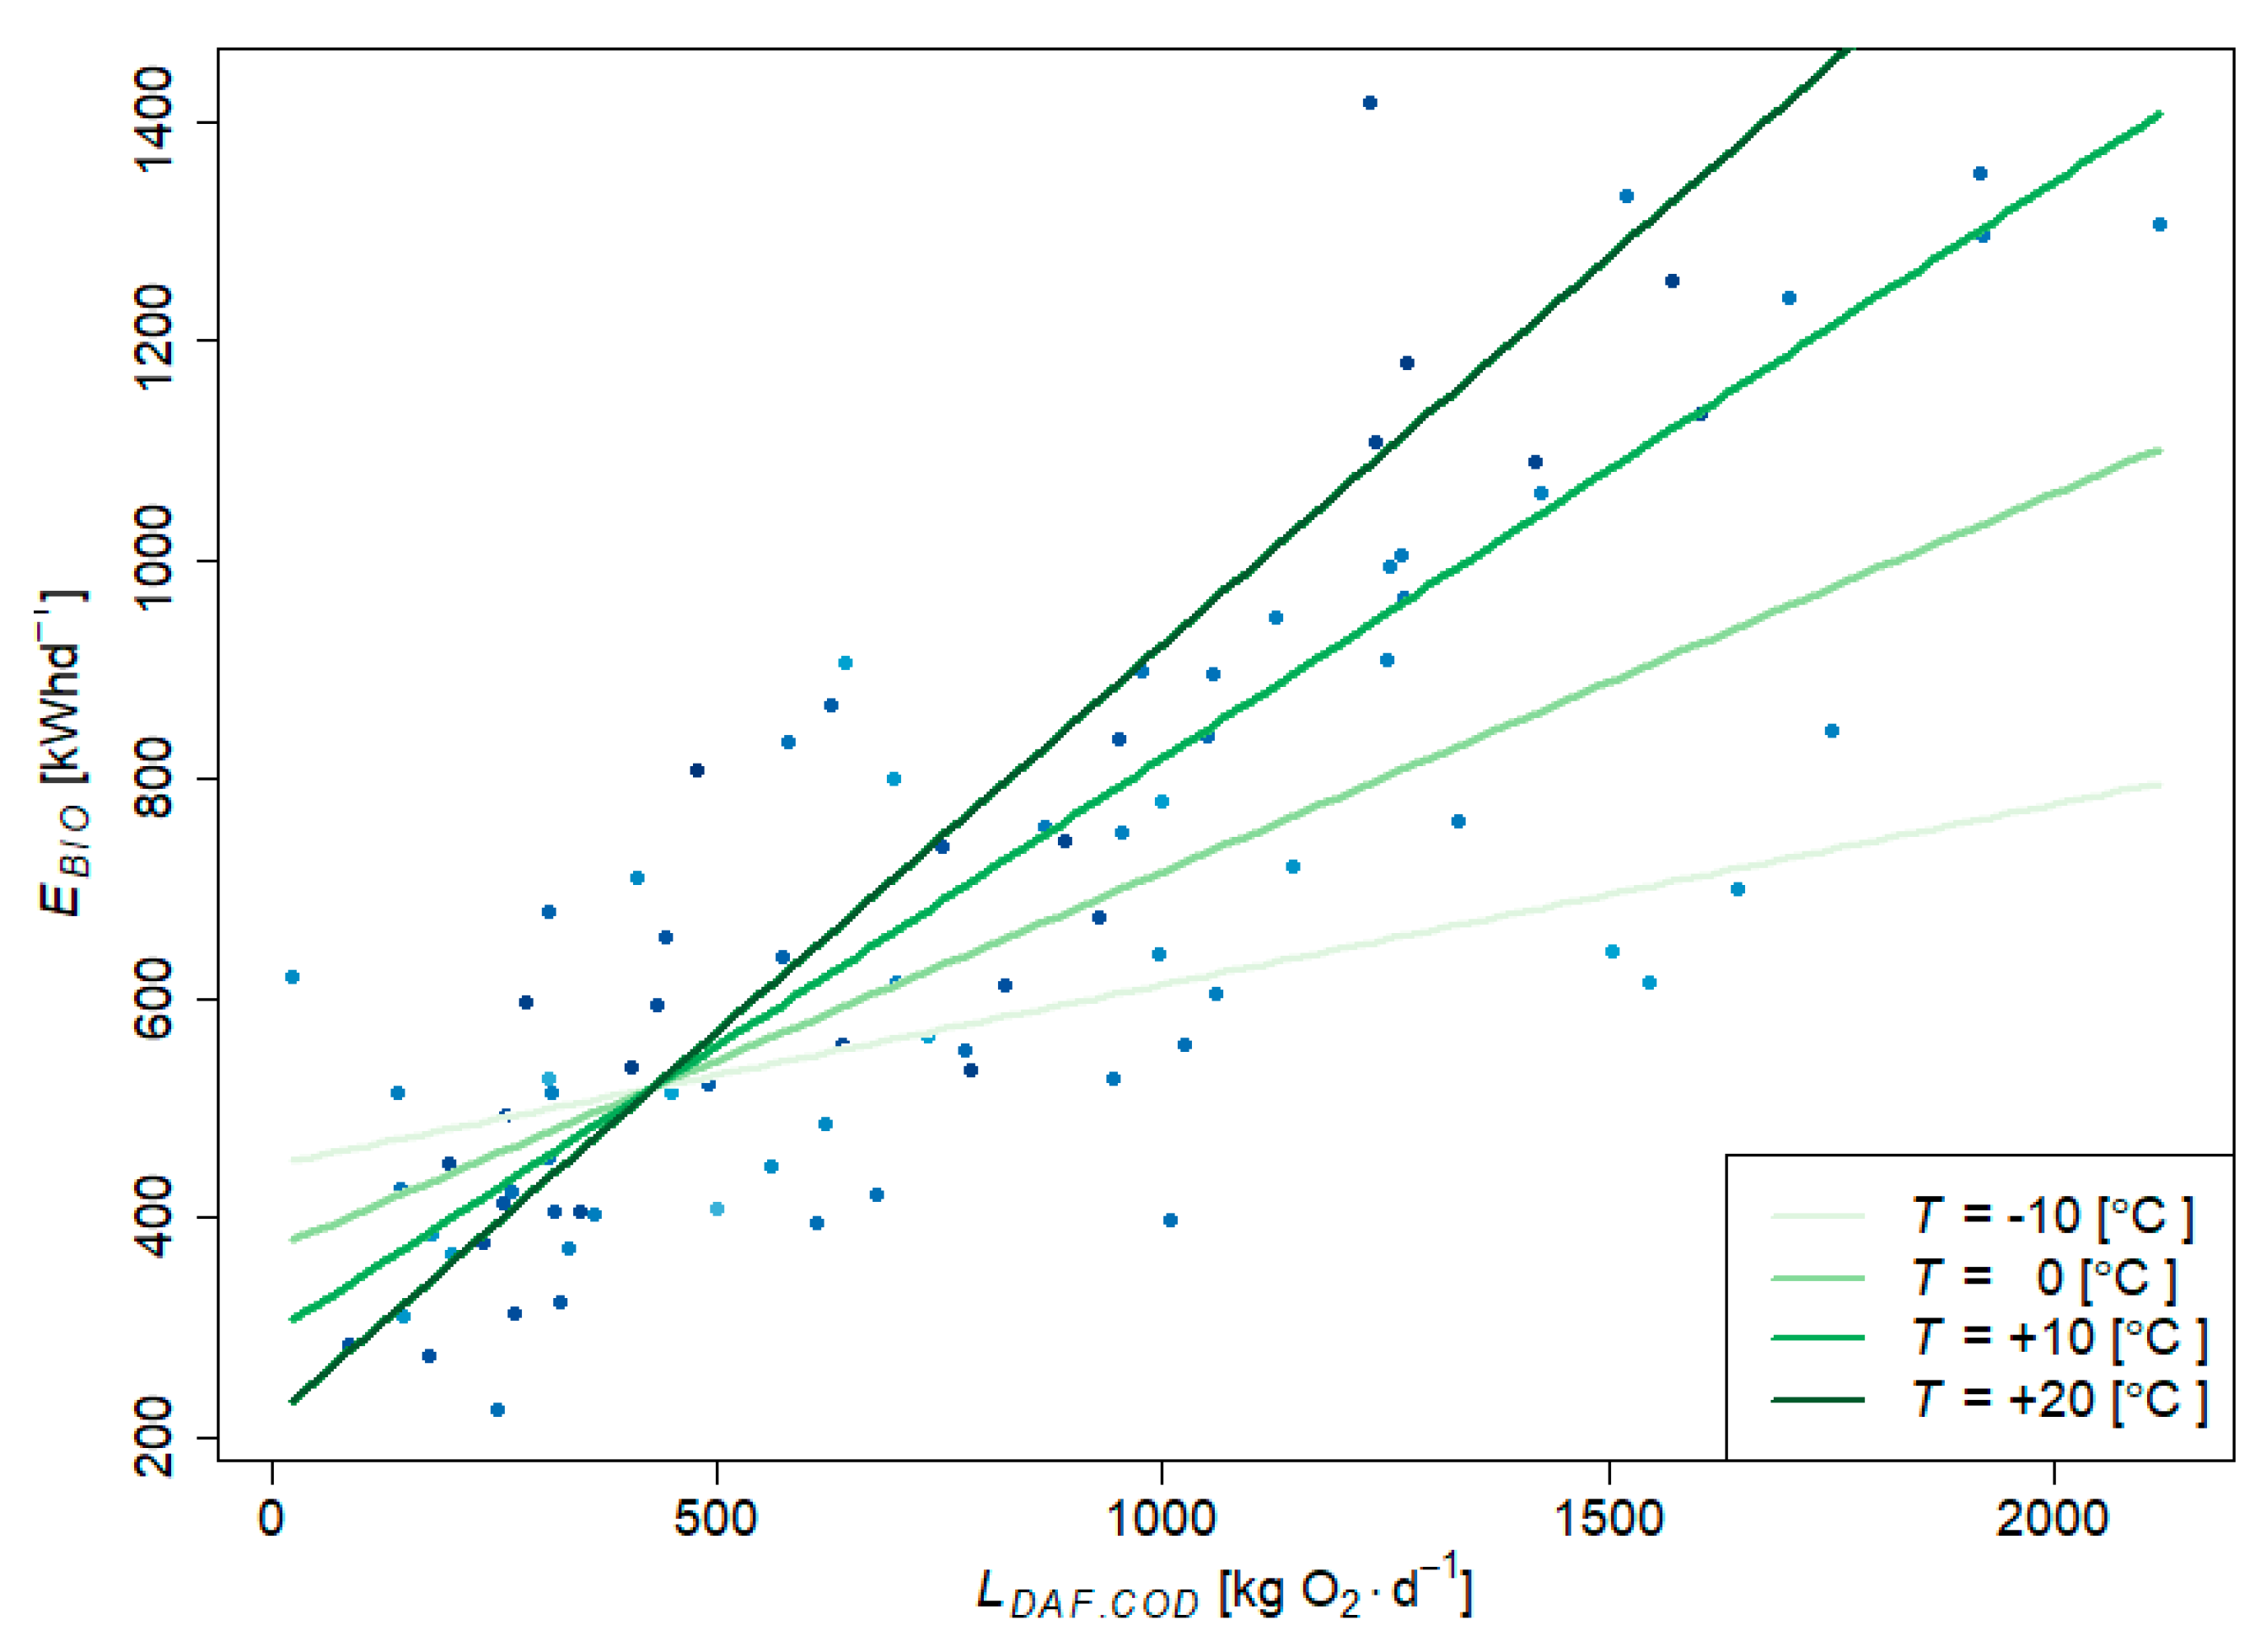
Equation (7) is presented in Figure 6.
Figure 6 is a two-dimensional representation of the three-dimensional Figure 5, so it does not show temperature fluctuations (as Figure 2 and Figure 3 do). Temperature lines intersect at . For this specific load value, is constant and does not vary with temperature. Changing around this value changes the nature of sensitivity of to temperature variations.
As T increases, the impact of on the electric energy consumption of the biological part () in a treatment plant increases. Exceeding the load value, kgd−1, results in a reversal of the nature of ’s dependence on in relation to T. For loads smaller than kgd−1, a decreasing temperature results in an increase in electric energy consumption; for larger loads, it results in a reduction of electric energy consumption.
should depend on . Using the quantile regression, a description of this dependence was made in the form of appropriate models for the quantiles and . The obtained models are presented in a set of Equations (8).
Equation (8) is presented in Figure 7.
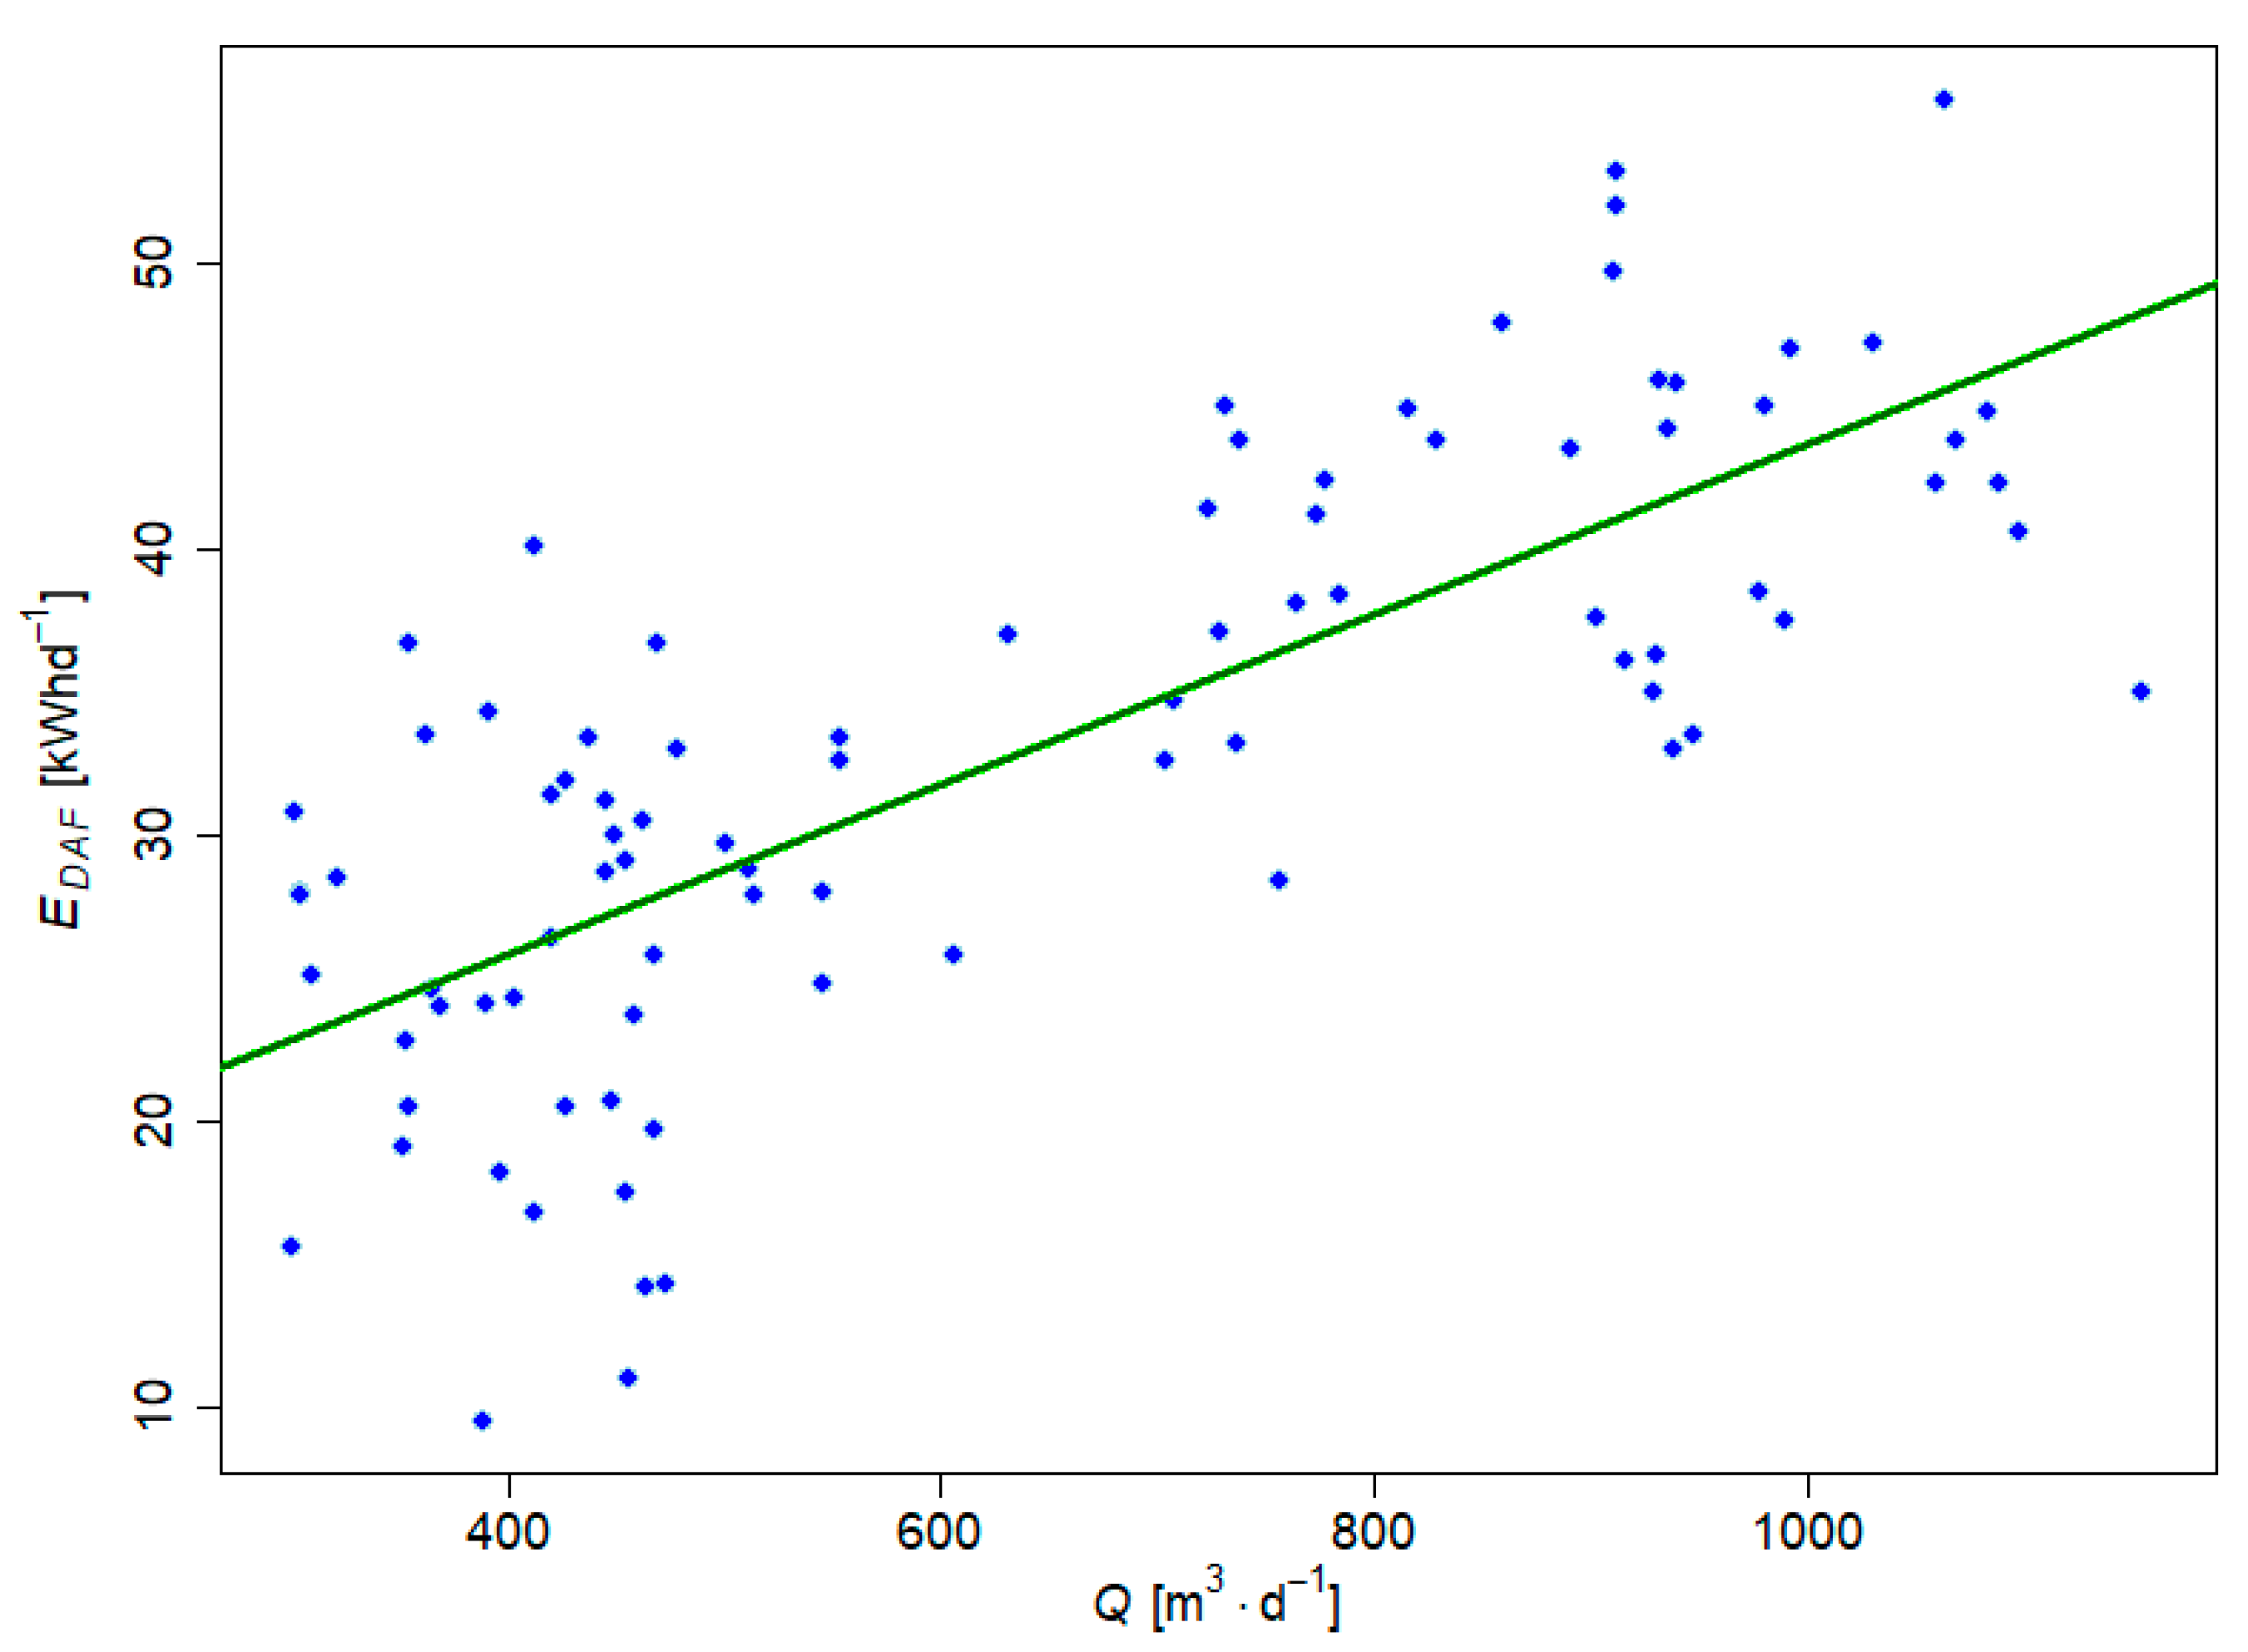
Energy consumption during the DAF process depends on sewage flow . The standard least squares regression analysis revealed the following model (9):
The obtained model, presented graphically in Figure 8, is characterized by: a relatively good linear fit with a coefficient of determination (adjusted for multiplicity) a proper residual structure; no significant deviation from normality and homoscedasticity; overall statistical significance (); and statistically significant coefficients (). Equation (9) is presented in Figure 8.
4. Final Modeling Scheme and Discussion
The obtained database made it possible to present energy consumption models during the DAF process and biological treatment. Despite the fact that biological treatment is only one part of the entire wastewater treatment process, it was possible to describe the variability of the total electric energy consumption on its basis. This is due to the fact that the activated sludge technology generates the highest energy consumption [17]. According to Bisak et al. [32] and Panaitescu et al. [33], the share of aeration systems in total electric energy consumption in sewage treatment plants ranges from 46 to 69 percent. In the case of industrial WWTPs, this share is even higher [17].
The obtained models describe the variability of energy consumption, in selected steps of dairy WWTP operation, depending on chosen parameters (, , and ). The influence of these parameters on unit energy consumption has been confirmed by Longo et al. [12]. A clear downward trend in unit energy consumption has been observed with an increase in the plant capacity [34]. is the parameter most reflecting energy consumption, as it contains information on wastewater flow and pollutant concentration. The values of this parameter are comparable in WWTPs with different capacities and design parameters. Yu et al. [18] have shown that the electric energy consumption per unit of removed substance is strongly correlated to the sewage temperature. It was shown that with an increasing content of organic substances, expressed as COD, in raw sewage, the unit energy consumption of the process decreases.
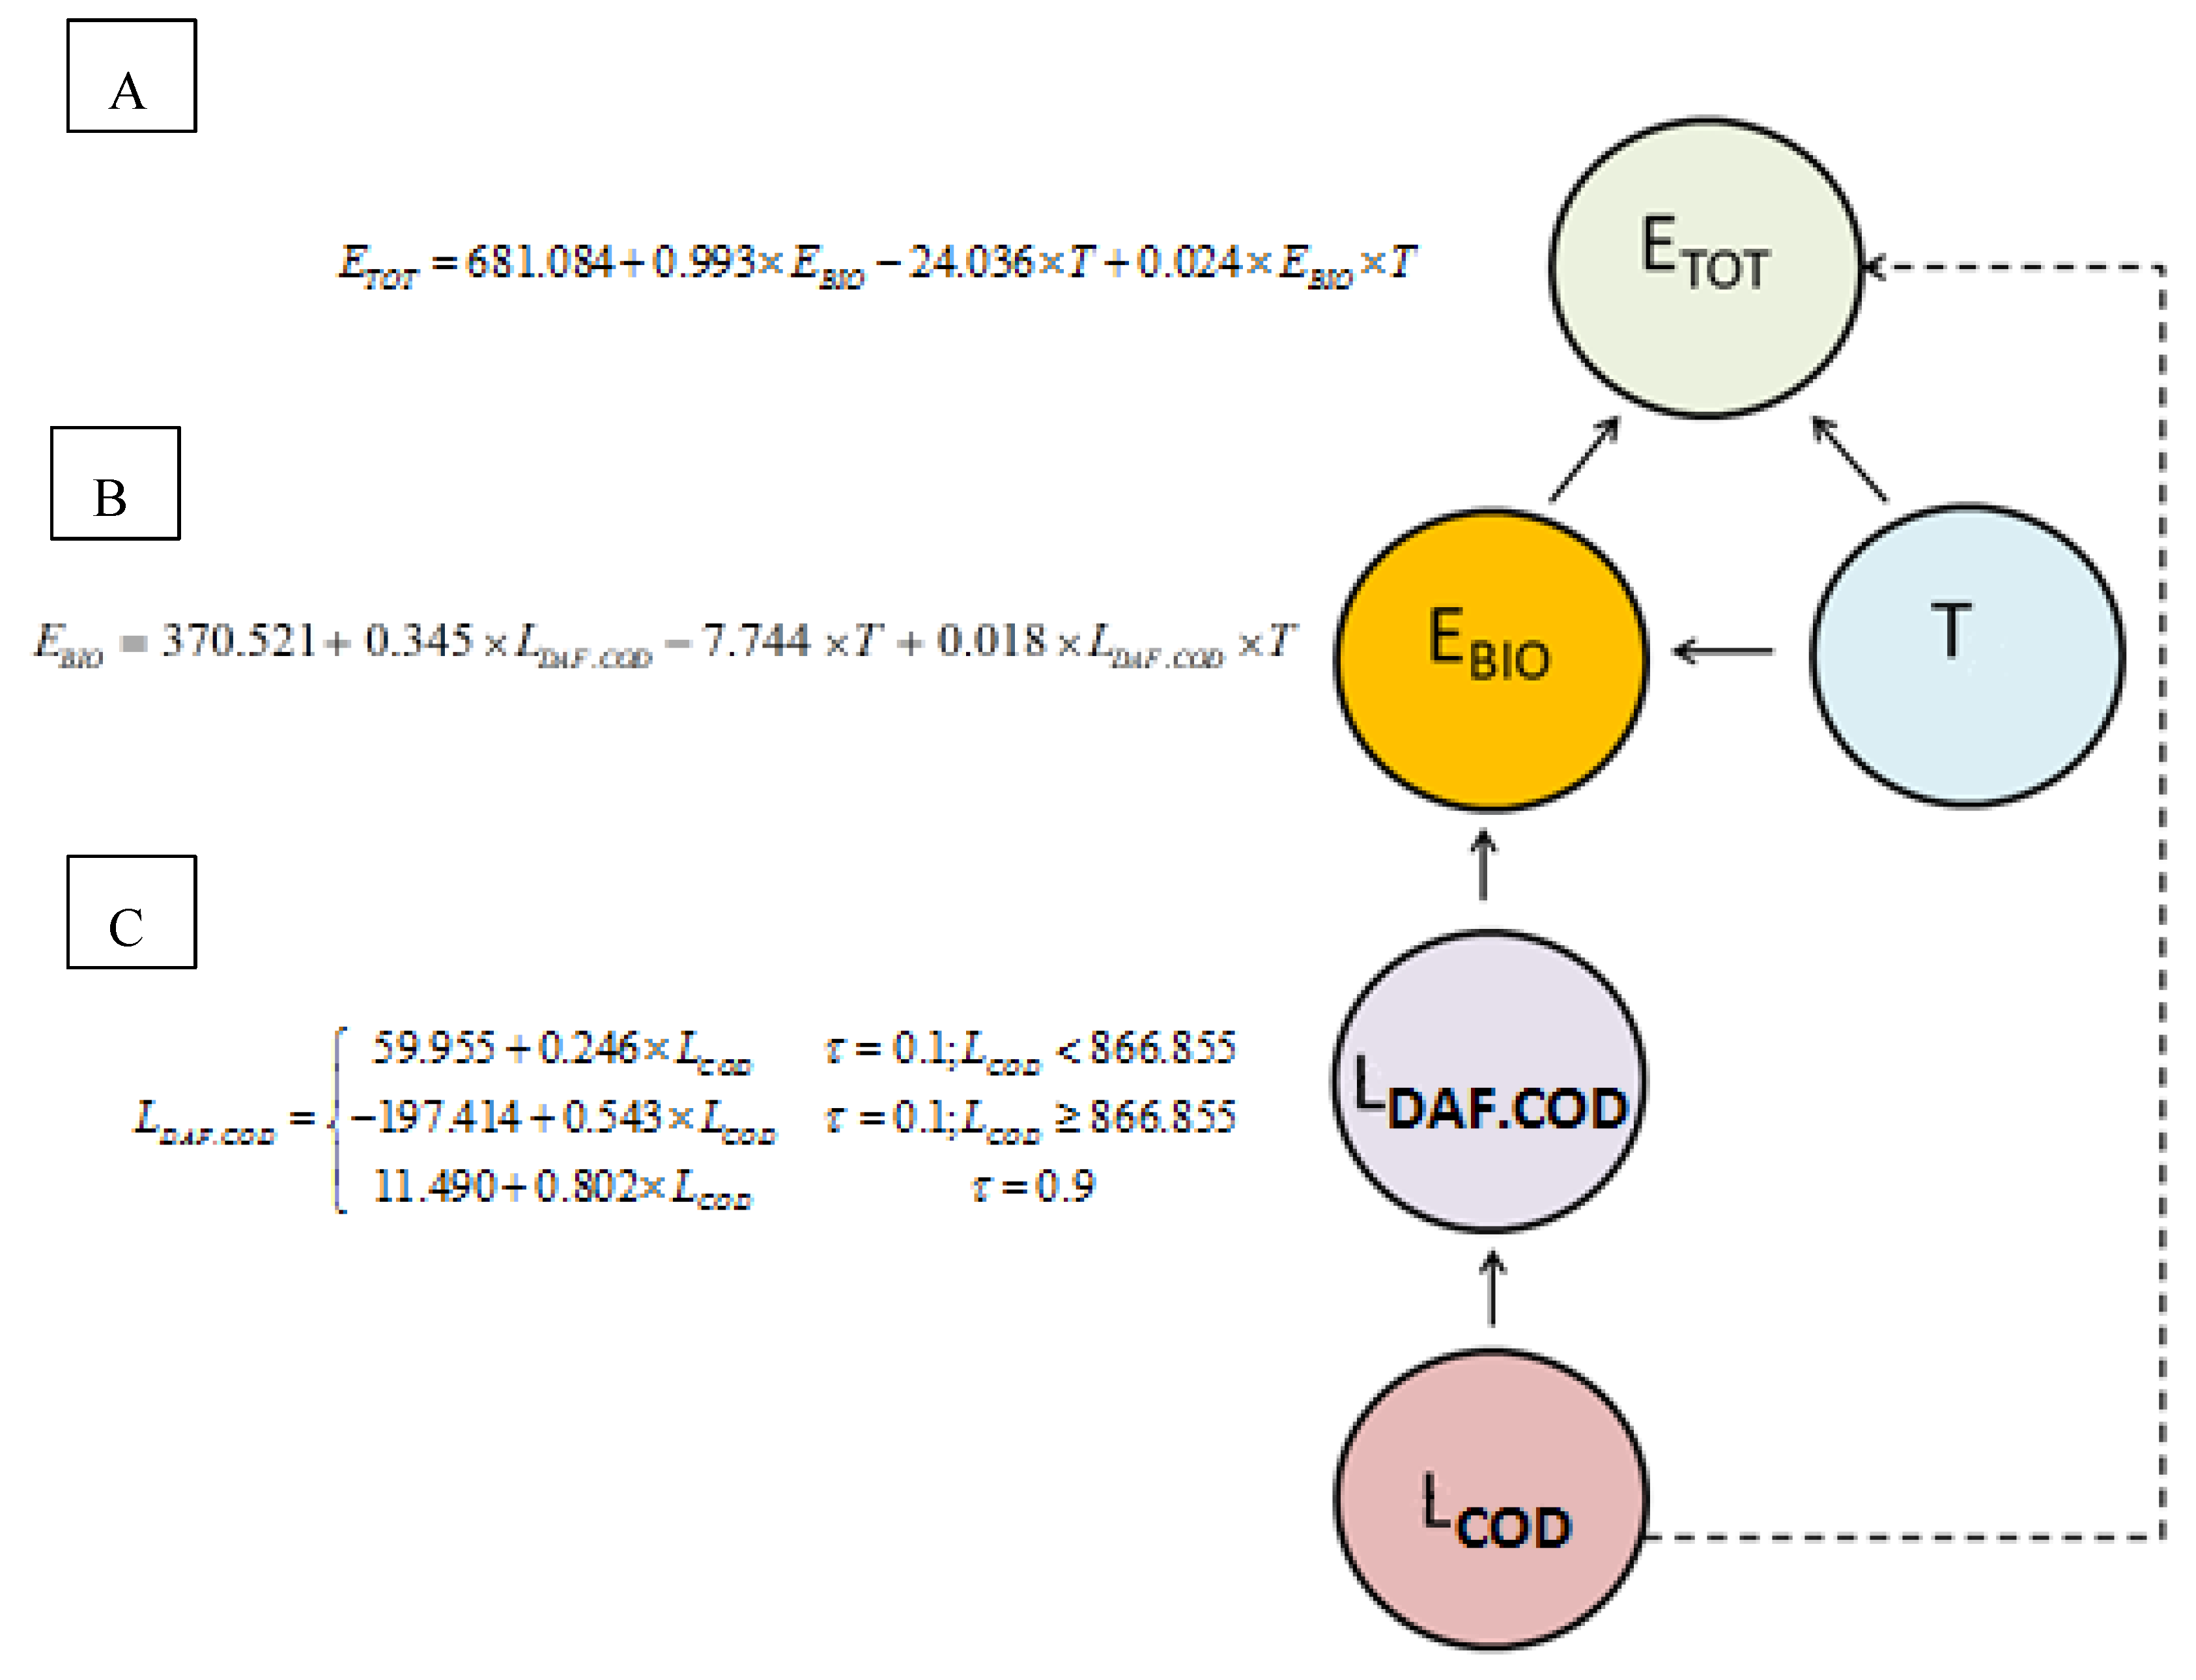
The main modeling scheme based on the obtained results is presented in Figure 9.
The interpretation of the results presented in Figure 9A–C leads to the following conclusions:
- The increased electric energy consumption in the biological treatment process causes a decrease in the temperature dependence of the total electric energy consumption. After exceeding the value of , the reverse dependence can be observed, i.e., with increasing temperature, total energy consumption grows. Mamais et al. [19] have also reported an increase in the electric energy consumption during summer periods. This is due to an increase of endogenous respiration when the temperature rises.
- Quantile regression models confirm the interdependence of wastewater parameters after the DAF process. Due to the ease of measurement, can be used to qualitatively describe other wastewater parameters. Along with the increase in , the influence of on electric energy consumption during biological treatment increases. When exceeding the load , the relationship between and with respect to temperature reverses. Lowering the air temperature increases energy consumption for smaller loads, and decreases electric energy consumption for larger pollutant loads. According to Niu et. al. [20], in order to reduce electric energy consumption, the pollutant load in the wastewater discharged into biological treatment should be increased. The authors point out that a properly loaded WWTP is characterized by lower energy consumption than an underloaded one. Therefore, it is important to control the pollutant load discharged into the biological treatment, depending on the air temperature. This can be realized by controlling the flotation efficiency.
- The results of the qualitative analysis make it possible to predict the range of variability of the by measuring the COD parameter in the wastewater before the DAF process. Parameters such as and can be easily monitored during all of the treatment processes. The COD parameter in raw sewage was also mentioned by Huang et al. [21] as being important to the modeling of electric energy consumption. It is used to predict not only the electric energy consumption but also the parameters of treated wastewater.
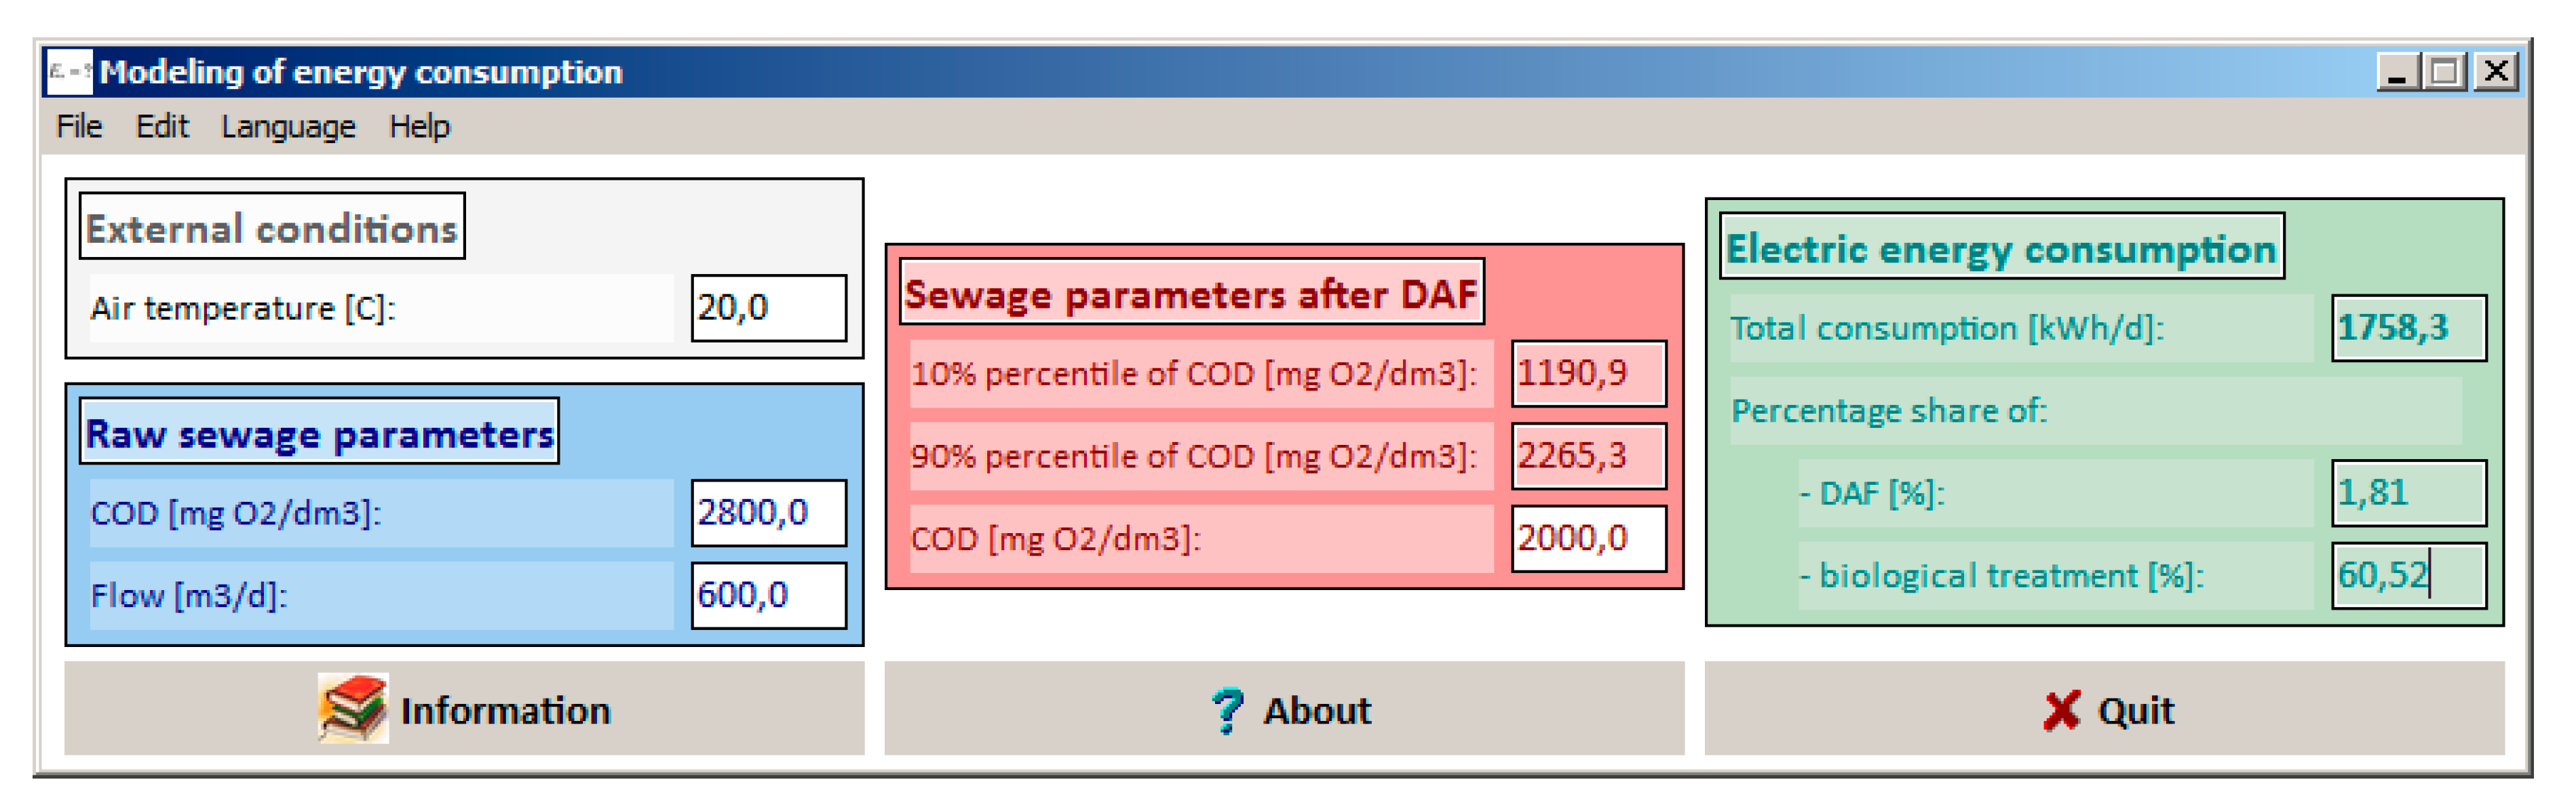
An application for simulation of electric energy consumption during dairy sewage treatment was prepared on the basis of the presented modeling scheme (Figure 10).
The initial parameters are COD in raw sewage, , and . The application calculates , and the share of and for the example’s data. The personal computer (PC) application can be used for other dairy WWTPs applying DAF and activated sludge systems. However, the obtained results would be less precise than in the case of the original object [35].
5. Conclusions
On the basis of the obtained research results, mathematical models have been developed. They can be used to optimize electric energy consumption during dairy WWTP operation. The obtained models describe the variability of electric energy consumption of a WWTP with high accuracy. The main parameter determining the consumption of electric energy in the analyzed dairy WWTP is the load of organic substances expressed as COD. The significant influence of air temperature was observed. Using the parameter of electric energy consumption in the biological treatment as an independent variable, together with air temperature, it is possible to estimate the variability of the total electric energy consumption. During summer periods, an increase in the load of organic substances expressed as COD, during biological treatment, causes higher electric energy consumption in the whole dairy WWTP. It is recommended to increase the efficiency of the removal of organic pollutants in the DAF process, which will reduce the total electric energy consumption.
Author Contributions
Conceptualization, W.D., R.Ż., B.K., and P.M.; Formal analysis, W.D., R.Ż., B.K., and P.M.; Investigation, R.Z; Methodology, R.Z, W.D., and P.M.; Resources, R.Z, W.D., P.M., and B.K.; Software, P.M.; Supervision, W.D.; Validation, P.M.; Writing—original draft, R.Ż.; Writing—review & editing, W.D., B.K, and P.M. All authors have read and agreed to the published version of the manuscript.
Funding
This research received no external funding.
Acknowledgments
The study was conducted as a research project S/WBiIŚ/3/2014 and Z/WBiIS/8/2019 in the Faculty of Civil Engineering and Environmental Science of BUT and financed by the Ministry of Science and Higher Education of Poland.
Conflicts of Interest
The authors declare no conflicts of interest.
References
- Central Statistical Office. Statistical Yearbook of Agriculture; Statistical Publishing Establishment: Warsaw, Poland, 2017. [Google Scholar]
- Ahmad, T.; Aadil, M.R.; Ahmed, H.; Rahmasn, U.; Soares, B.; Souza, S.; Pimentel, T.; Scudino, H.; Guimares, J.; Esmerino, E.A.; et al. Treatment and utilization of dairy industrial waste: A review. Trends Food Sci. Technol. 2019, 88, 361–372. [Google Scholar] [CrossRef]
- Struk-Sokołowska, J.; Mielcarek, A.; Wiater, J.; Rodziewicz, J. Impacts of dairy wastewater and pre-aeration on the performance of SBR treating municipal sewage. Desalin. Water Treat. 2018, 105, 41–50. [Google Scholar] [CrossRef]
- Kushwaha, J.P.; Srivastava, V.C.; Mall, I.D. Sequential batch reactor for dairy wastewater treatment: Parametric optimization; kinetics and waste sludge disposal. J. Environ. Chem. Eng. 2013, 1, 1036–1043. [Google Scholar] [CrossRef]
- Martín-Rilo, S.; Coimbra, R.N.; Martín-Villacorta, J.; Otero, M. Treatment of dairy industry wastewater by oxygen injection: Performance and outlay parameters from the full scale implementation. J. Clean. Prod. 2015, 86, 15–23. [Google Scholar] [CrossRef]
- Struk-Sokołowska, J.; Rodziewicz, J.; Mielcarek, A. Effect of dairy wastewater on changes in COD fractions in technical-scale SBR type reactors. Wat. Sci. Technol. 2017, 1, 156–169. [Google Scholar] [CrossRef] [PubMed]
- Memisi, N.; Moracanin, S.V.; Milijasevic, M.; Babic, J.; Djukic, D. CIP cleaning processes in the dairy industry. Procedia. Food Sci. 2015, 5, 184–186. [Google Scholar] [CrossRef] [Green Version]
- Umiejewska, K. Biological Anaerobic-Aerobic Treatment of Dairy Wastewater. In Proceedings of the 15th International Conference on Environmental Science and Technology, Rhodes, Greece, 31 August–2 September 2017. [Google Scholar]
- Dębowski, M.; Zieliński, M.; Kisielewska, M.; Kazimierowicz, J. Evaluation of Anaerobic Digestion of Dairy Wastewater in an Innovative Multi-Section Horizontal Flow Reactor. Energies 2020, 13, 2392. [Google Scholar] [CrossRef]
- Dąbrowski, W.; Żyłka, R.; Rynkiewicz, M. Evaluation of energy consumption in agro-industrial wastewater treatment plant. J. Ecol. Eng. 2016, 17, 73–78. [Google Scholar] [CrossRef] [Green Version]
- Dąbrowski, W.; Żyłka, R.; Malinowski, P. Evaluation of energy consumption during aerobic sewage sludge treatment in dairy wastewater treatment plant. Environ. Res 2017, 153, 135–139. [Google Scholar] [CrossRef]
- Longo, S.; D’Antoni, B.M.; Bongards, M.; Chaparro, A.; Cronrath, A.; Fatone, F.; Lema, J.M.; Mauricio-Iglesias, M.; Soares, A.; Hospido, A. Monitoring and diagnosis of energy consumption in wastewater treatment plants. A state of the art and proposals for improvement. Appl. Energy 2016, 179, 1251–1268. [Google Scholar] [CrossRef]
- De Gussem, K.; Fenu, A.; Wambecq, T.; Weemaes, M. Energy saving on wastewater treatment plants through improved online control: Case study wastewater treatment plant Antwerp-South. Water Sci. Technol. 2014, 69, 1074–1079. [Google Scholar] [CrossRef] [PubMed]
- Mizuta, K.; Shimada, M. Benchmarking energy consumption in municipal wastewater treatment plant. Water Sci. Technol. 2010, 62, 2256–2262. [Google Scholar] [CrossRef] [PubMed]
- Venkatesh, G.; Brattebo, H. Energy consumption, costs and environmental impacts for urban water cycle services: Case study of Oslo (Norway). Energy 2011, 36, 792–800. [Google Scholar] [CrossRef]
- Singh, P.; Carliell-Marquet, C.; Kansal, A. Energy pattern analysis of a wastewater treatment plant. Appl. Water Sci. 2012, 2, 221–226. [Google Scholar] [CrossRef] [Green Version]
- Di Fraia, S.; Massarottia, N.; Vanolia, L. A novel energy assessment of urban wastewater treatment plants. Energy Convers. Manag. 2018, 163, 304–313. [Google Scholar] [CrossRef]
- Yu, Y.; Zou, Z.; Wang, S. Statistical regression modeling for energy consumption in wastewater treatment. J. Environ. Sci. (China) 2019, 17, 201–208. [Google Scholar] [CrossRef] [PubMed]
- Mamais, D.; Noutsopoulos, C.; Dimopoulou, A.; Stasinakis, A.; Lekkas, T.D. Wastewater treatment process impact on energy savings and greenhouse gas emissions. Water Sci. Technol. 2015, 71, 303–308. [Google Scholar] [CrossRef] [PubMed]
- Niu, K.; Wu, J.; Qi, L.; Niu, Q. Energy intensity of wastewater treatment plants and influencing factors in China. Sci. Total. Environ. 2019, 670, 961–970. [Google Scholar] [CrossRef]
- Huang, X.; Han, H.; Qiao, J. Energy consumption model for wastewater treatment process control. Water Sci. Technol. 2013, 67, 667–674. [Google Scholar] [CrossRef] [Green Version]
- Fenu, A.; Roles, J.; Wambecq, T.; De Gussem, K.; Thoeye, C.; De Gueldre, G.; Van De Steene, B. Energy audit of a full scale MBR system. Desalination 2010, 262, 121–128. [Google Scholar] [CrossRef]
- Journal of Laws of the Republic of Poland. Regulations of the Maritime Economy and Inland Navigation Minister from 12nd of July 2019 on Substances that are Particularly Harmful to the Aquatic Environment and Conditions to be Met When Introducing Sewage into Water or Soil and When Discharging Rainwater or Snowmelt to Water or to Aquatic Facilities—item 1311; Journal of Laws of the Republic of Poland: Warsaw, Poland, 2019. Available online: http://isap.sejm.gov.pl/isap.nsf/DocDetails.xsp?id=WDU20190001311 (accessed on 10 May 2020). (In Polish)
- American Public Health Association (APHA). Standard Methods for Examination of Water and Wastewater, 21st ed.; American Public Health Association: Washington, DC, USA, 2005. [Google Scholar]
- Koenker, R. Quantile Regression; Cambridge University Press: Cambrige, UK, 2005; ISBN 978-0-521-60827-5. [Google Scholar]
- Cade, B.S.; Noon, B.R. A gentle introduction to quantile regression for ecologists. Front. Ecol. Environ. 2003, 1, 412–420. [Google Scholar] [CrossRef]
- Koenker, R.; Park, B.J. An Interior Point Algorithm for Nonlinear Quantile Regression. J. Econ. 1994, 71, 265–283. [Google Scholar] [CrossRef] [Green Version]
- R Core Team. R: A Language and Environment for Statistical Computing; R Foundation for Statistical Computing: Vienna, Austria, 2018; Available online: https://www.R-project.org/ (accessed on 4 December 2018).
- Koenker, R. Quantreg: Quantile Regression; R package version 5.38: London, UK, 2018; Available online: https://CRAN.R-project.org/package=quantreg (accessed on 14 December 2018).
- Neuwirth, E. RColorBrewer: ColorBrewer Palettes; R package version 1.1.2: Vienna, Austria, 2014; Available online: https://CRAN.R-project.org/package=RColorBrewer (accessed on 17 December 2018).
- Deepayan, S. Lattice: Multivariate Data Visualization; Springer: New York, NY, USA, 2008; ISBN 978-0-387-75968-5. [Google Scholar]
- Bisak, A.; Cyganecka-Wilkoszewska, A.; Raszkiewicz, D. Efektywność energetyczna warszawskich oczyszczalni ścieków, Gaz. Woda i Tech. Sanit. 2017, 9, 372–381. (In Polish) [Google Scholar]
- Panaitescu, I.; Panaitescu, F.; Panaitescu, M. Solutions to optimize energy consumption of airblowers by monitoring oxygen levels in the bioreactor. In Proceedings of the 16th International Conference on Harmonics and Quality of Power (ICHQP), Bucharest, Romania, 25–28 May 2014; pp. 895–898. [Google Scholar]
- Silva, C.; Saldanha-Matos, J.; Rosa, M.J. A comprehensive approach for diagnosing opportunities for improving the performance of a WWTP. Wat. Sci. Technol. 2016, 74, 2935–2945. [Google Scholar] [CrossRef] [Green Version]
- Amerlinck, Y.; De Keyser, W.; Urchegui, G.; Nopens, I. A realistic dynamic blower energy consumption model for wastewater applications. Wat. Sci. Technol. 2016, 74, 1561–1576. [Google Scholar] [CrossRef]
Figure 1.
Scheme of the dairy wastewater treatment plant (WWTP) (facilities and sampling points): 1—raw sewage, 2—screen and pumping station, 3—sand trap, 4—averaging tank, 5—dissolved air flotation (DAF), 6—sequence batch reactors (SBRs), 7—treated sewage; 8—excess and flotation sludge for treatment; I, II, III—sampling points.

Figure 2.
Graphical representation of model (3)—.

Figure 3.
Dependency of in terms of for different temperatures.

Figure 4.
Analysis of sewage parameters after DAF: (a) flow, (b) BOD5, (c) total nitrogen, (d) total phosphorus.
Figure 4.
Analysis of sewage parameters after DAF: (a) flow, (b) BOD5, (c) total nitrogen, (d) total phosphorus.


Figure 5.
Graphical representation of model (6)—.

Figure 6.
Dependency of in terms of for different temperatures.

Figure 7.
Dependency of and .

Figure 8.
Graphical representation of model (9)—.

Figure 9.
The main modeling scheme: (A)—model for , (B)—model for , (C)—model for .

Figure 10.
The personal computer (PC) application “Modeling of energy consumption”.


Table 1.
The obtained models.
| Parameter | Equations | Conditions |
|---|---|---|
© 2020 by the authors. Licensee MDPI, Basel, Switzerland. This article is an open access article distributed under the terms and conditions of the Creative Commons Attribution (CC BY) license (http://creativecommons.org/licenses/by/4.0/).
Share and Cite
MDPI and ACS Style
Żyłka, R.; Dąbrowski, W.; Malinowski, P.; Karolinczak, B. Modeling of Electric Energy Consumption during Dairy Wastewater Treatment Plant Operation. Energies 2020, 13, 3769. https://0-doi-org.brum.beds.ac.uk/10.3390/en13153769
AMA Style
Żyłka R, Dąbrowski W, Malinowski P, Karolinczak B. Modeling of Electric Energy Consumption during Dairy Wastewater Treatment Plant Operation. Energies. 2020; 13(15):3769. https://0-doi-org.brum.beds.ac.uk/10.3390/en13153769
Chicago/Turabian StyleŻyłka, Radosław, Wojciech Dąbrowski, Paweł Malinowski, and Beata Karolinczak. 2020. "Modeling of Electric Energy Consumption during Dairy Wastewater Treatment Plant Operation" Energies 13, no. 15: 3769. https://0-doi-org.brum.beds.ac.uk/10.3390/en13153769
Note that from the first issue of 2016, this journal uses article numbers instead of page numbers. See further details here.