The Potential of Photovoltaics to Power the Railway System in China


1
China Institute of Energy and Transportation Integrated Development, North China Electric Power University, Beijing 102206, China
2
State Key Laboratory of Alternate Electrical Power System with Renewable Energy Sources, North China Electric Power University, Beijing 102206, China
3
State Key Laboratory of Rail Traffic Control and Safety, Beijing Jiaotong University, Beijing 100044, China
*
Author to whom correspondence should be addressed.
Energies 2020, 13(15), 3844; https://0-doi-org.brum.beds.ac.uk/10.3390/en13153844
Submission received: 9 July 2020
/
Revised: 21 July 2020
/
Accepted: 23 July 2020
/
Published: 27 July 2020
(This article belongs to the Section A2: Solar Energy and Photovoltaic Systems)
Abstract
:According to the International Energy Agency (IEA)’s forecast, China will fully electrify its railway system by 2050. However, the development of electrified railways is limited in the weak areas of China’s power grid. To surpass these limitations, we turn our attention to new railway energy sources, among which the most suitable is photovoltaic power generation. To evaluate the feasibility of integrating railway systems and photovoltaic power generation in China, this paper analyzes the geographical conditions and railway layout of China, gives a potential method for evaluating railway asset energy transformation measures and asset energy transformations that are suitable for China’s national conditions, and proposes an application of railway system energy transformation on this basis. Then, this method is used to evaluate the potential of a substation section of the Lanxin high-speed railway in China for reference. The results show that the green energy potential and scheduling potential of China’s railway assets are great and can effectively alleviate the energy anxiety of China’s railway system.
1. Introduction
With the continuous development of China’s economic construction and the growth of energy demand, the relative shortage of energy and its contrast with economic growth have become increasingly prominent. By 2010, transportation’s greenhouse gas emissions (GHG) accounted for 14%, and this percentage is expected to double by 2050 [1,2]. From the perspective of energy and emissions, railways are the most energy-efficient and lowest-emission transport type. In addition, railways are also the most electrified transportation sector: three-quarters of passenger transportation and half of freight transportation rely on electricity provided by the power grid [3]. The benefits of electrified railways are obvious. The International Energy Agency (IEA) expects that China will enter the era of fully electrified railways by 2050. However, the distribution of China’s power grid will limit this development. As the train speed increases, so do the train power requirements. As a load with high impact and regional dispersion [4,5,6,7], electrified railways pose severe challenges to the power quality and stability of the power grid. Apart from that, developing electrified railways is difficult in areas with weak grids. Nevertheless, China’s geographical environment and railway layout have inspired new methods for the development of electrified railways, that is, the combination of railway systems and the photovoltaic (PV) industry. China’s nonelectrified railways are concentrated in western regions where the grid is weak but PVs are effective. As a mobile load, railways can absorb sufficient PV resources and reduce the burden of local weak grids. This approach solves the problems of new energy consumption and the fact that weak grid areas cannot bear the load of electrified railways. Furthermore, demand for renewables is expected to sharply increase because of low operating costs and preferential access to many power systems, especially due to the impacts of the Covid-19 crisis on global energy demand and CO2 emissions [8]. Therefore, the plan to integrate the railway system and PVs is adaptive to current trends. In the railway system, transportation energy consumption accounts for the largest proportion, accounting for approximately 80% of the total railway energy consumption. Among the factors contributing to transportation energy consumption, traction energy consumption accounts for 60–70% of the total. Therefore, how to evaluate the PV output potential of the railway system and how to combine this output with the railway traction system and the power grid is the basis for integrating the railway system and the PV system.
In terms of the PV output potential of the railway system, Dr. K.S. Alam proposed a new environmentally friendly solar-piezoelectric hybrid power plant model, which uses only renewable energy to generate electricity, can be applied in railway stations and is representative of typical railway stations in the Kamlapur railway station in Bangladesh [9]. Sorensen used a GIS system to draw solar resource maps based on satellite data and matched them with demand models (population density, energy demand intensity) based on habitats to carry out solar PV application research [10]. Reference [11] discusses the application potential, characteristics and development prospects of solar power generation on the roofs of railway station platforms. That article analyzes the impact of building shadows around the station on PV power generation, but the data sources are relatively approximate, and the algorithm is relatively vague. By analyzing the conversion efficiency of monocrystalline silicon modules under different irradiances in Shanghai, Wang Lizhen calculated the spatial distribution of national PV theoretical annual power generation and considered the influence of temperature on the efficiency of PV modules. That estimation is relatively accurate [12]. Reference [13] considers factors such as the environment, terrain, location, climate, and humanity and uses GIS to locate PV power stations on expressways and calculate their characteristics. In that study, PVSYST(A photovoltaic simulation software) simulation was used to calculate and take into account factors such as the PV panel structure type, mounting angle, and sunlight incidence angle, but the quantitative standard for calculating the feasibility was too limited. Reference [14] established a railway passenger car model with PV panels on the top, fitted some influencing factors and the output regression equation through six days of data, and considered dynamic and static train situations. However, the data sample involved only six days, with a large contingency and no universality.
To evaluate how the PV output can be integrated with the railway system and the power grid, Reference [15] designed a 110 kWp independent rooftop solar PV system and used software from related fields to perform a very comprehensive calculation including economic aspects. However, the source of the illumination data was inaccurate, and the results of the calculations varied greatly depending on the software used. Moreover, an independent PV system off the grid was measured, so this approach is not suitable for railway PV systems and the grid. Reference [16] used data on CO2 emission reduction to evaluate the potential of solar energy applications in Indian ships and listed the advantages and disadvantages. However, the data source was rough, only a single application method was used, with no promotion value. In general, most scholars have studied using PV power supplies for train lighting systems or service facilities in the railway system rather than the energy required for the traction load of the train. Reference [17] introduced a way to install a PV panel on the roof of the Istanbul Airport M1 Light Metro Line to power the train lighting facilities. Reference [18] introduced the PV power generation mode of Tokyo Station, which involved mounting PV modules on the roof and evaluating the influence of surrounding building shadows on the power generation efficiency. Reference [19] introduced two applications of solar power generation in Shanghai, China: the PV output on the top of the station is directly connected to the 0.4 kV lighting system through a step-up transformer or sent to the user-side power grid after being boosted to 35 kV.
In general, the current railway PV output calculation model is basically feasible only in specific areas; most are installed with PV modules on the top of the train or the station, and the output is limited. Such approaches cannot achieve system-level integration of the railway system and the PV industry. In the past 10 years, the cost of PV modules and PV systems in China has rapidly reduced, and the rapid development of Internet energy technology has provided convenient conditions for the integrated development of railway PV systems and power grids. The “self-use power generation, surplus electricity access to the grid” mode of industrial and commercial application projects is in full operation and has made great progress in recent years.
In this paper, after analyzing the cross layout of China’s railway network and solar energy resource, we propose a method for evaluating the energization potential of the railway system suitable for China’s national conditions and for integrating the railway system and the PV industry. Finally, an example is used to verify that the proposed method is adapted to Chinese local conditions, grid conditions, and railway load conditions.
2. System Description for the Energization of Railway System Assets in China
2.1. Cross Layout of China’s Railway Network and Solar Energy Resource Network
Among its many renewable energy sources, China has abundant solar energy storage. As an environmentally friendly and clean renewable energy source, solar energy also has the advantages of being sufficient, long-lived, widely distributed, and safe. It is estimated that the average annual solar energy obtained in China is approximately 1 × 10¹⁶ kWh, which is equivalent to the energy of 1.2 × 10¹² tons of standard coal [20].
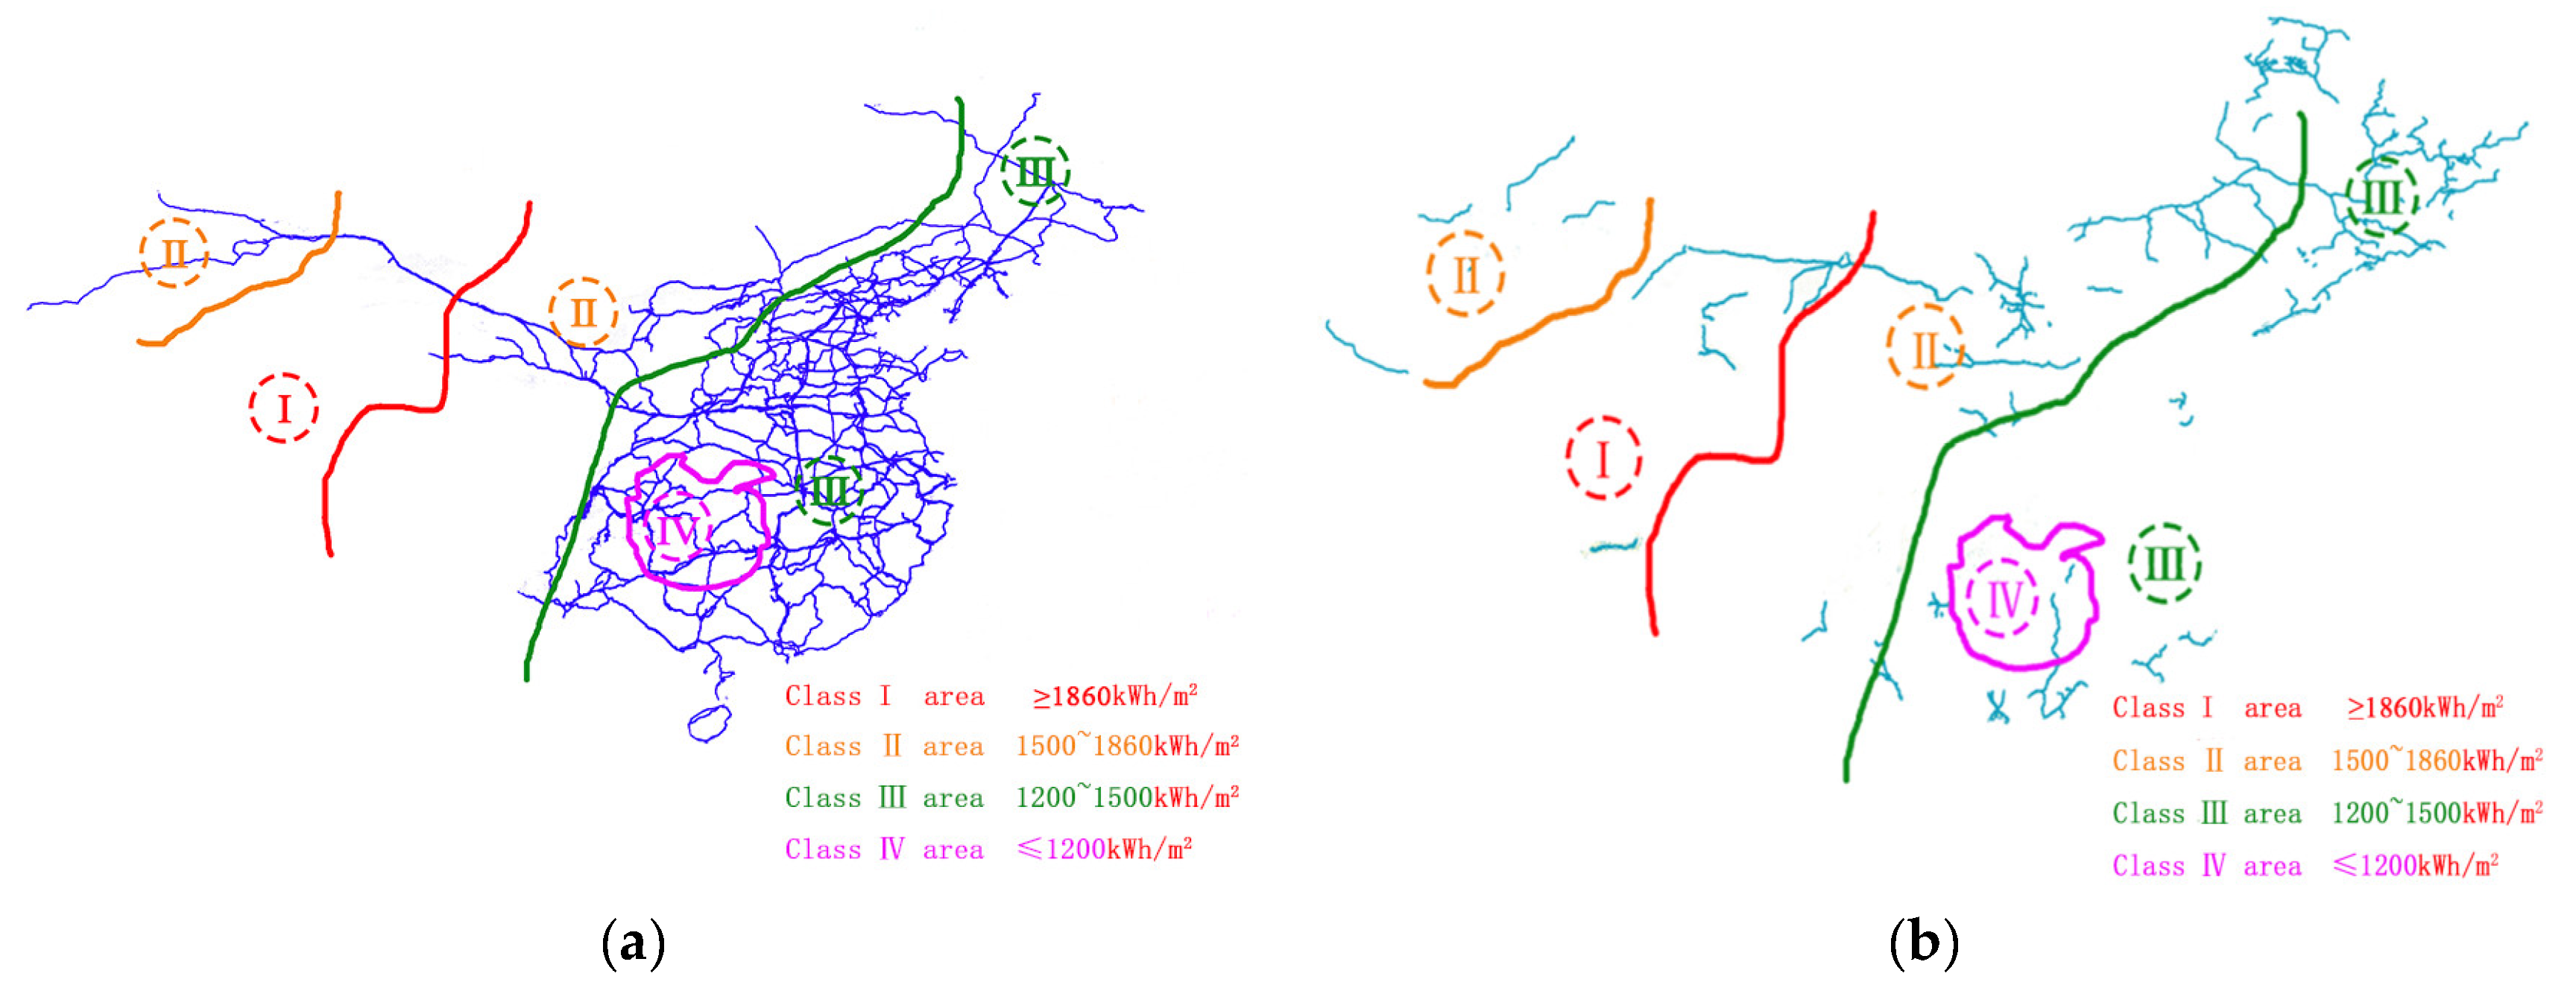
Every year, China’s land receives approximately 5 × 10¹⁶ MJ/m2 of solar radiation energy. According to the differences in the latitude, longitude, and climate of various regions, China’s solar energy resources can be divided into four types of regions. The annual radiation of the Class I area is more than 1860 kWh/m2. In the Class Ⅱ area, the annual radiation is 1500–1860 kWh/m2, the annual radiation of the Class Ⅲ area is 1200–1500 kWh/m2, and that of the Class IV area is below 1200 kWh/m2.
In summary, the main characteristics of the solar energy resource distribution in China are as follows: the annual total radiation amount in the western region is higher than that in the eastern region; except for the Tibet and Xinjiang autonomous regions, the radiation amount in the south is generally lower than that in the north; and the radiation amount reaches the highest value in the Qinghai-Tibet Plateau and the lowest value in the Sichuan Basin. In addition, due to the higher number of cloudy and rainy days in most southern regions, the distribution of solar energy in the region of the 30°–40° north latitude increases with increasing latitude, in contrast to the general rule.
By the end of 2018, China’s railway operation length reached 131,000 km. The total railway network length of the five provinces in North China is 27,000 km, and the road network density is 174 km/10,000 km2; the corresponding values for the northeastern provinces are 17,000 km and 210 km/10,000 km2; for the six provinces in East China, 19,000 km and 298 km/10,000 km2; for the seven provinces in central and southern China, 29,000 km and 243 km/10,000 km2; and for the northwest and southwest 10 provinces, 33,000 km and 61 km/10,000 km2. The railway network structure in eastern China has been gradually optimized, the scale of the railway network in the central region has gradually increased, and the coverage of the railway network in the western region has gradually improved.
Figure 1 shows the cross-distribution layout of railway lines and solar energy resources in China according to traffic data from Peking University’s geographic data platform. The length of electrified and nonelectrified railway lines in four solar energy resource region in China are shown in Table 1.
It can be seen from Figure 1 and Table 1 that electrified railways are mainly concentrated in areas III and IV, which are coupled with the layout of the power grid. For areas I and II in regions with weak power grids, the unique advantage of developing electrified railways is the abundant solar energy resources in these two areas [21].
2.2. New Attributes of Railway Systems after Energization
The IEA predicts that, in the next 30 years, China’s railway transportation structure will gradually change from the current coexistence of nonelectrification and electrification to full electrification, and the source of railway energy consumption will come entirely from electricity. In the border areas where nonelectrified railways are concentrated, the power grid is sparse and weak. To build transportation in the border areas and to comply with the development trend of railway electrification, regions with a high proportion of nonelectrified railways must make full use of the local rich renewable resources and use renewable resources to supply train energy. Solar PV generation is concentrated in the daytime period, matching the railway load, so it is appropriate to introduce solar PV generation into the railway’s energy supply system (IEA,2019). Therefore, a series of railway system transformations are needed to fully exploit this advantage. The railway transformation is mainly divided into three parts: “vehicle carrier, infrastructure, and service facilities”. The specific measures applied for transformation will be described in Section 3. Next, we will analyze the properties of the transformed railway system that are different from the previous ones.
After the transformation is completed, the railway system has the “power” attribute. The electrical energy generated by the PV components and the power grid complement each other and jointly supply energy to the railway system. At this point, how to transmit and efficiently use this electrical energy becomes a challenge to the railway system.
Section 2.1 shows that the grids in regions with abundant solar resources in China are relatively weak. It is difficult for trains in this region to obtain electrical energy from the grid or surplus electricity to connect to the grid. Because of the power quality requirements of the power system, solar PV power generation cannot be connected to the grid on a large scale. Therefore, the railway system should be developed to incorporate new energy microgrids. The unique traction lines and traction substations form a unique linear micronetwork group distributed along the track. Each traction substation can interact with the traction substations on both sides to realize the interaction of information flow and energy flow. This is the “grid” attribute of the railway system. In addition, the “load” attribute of the railway system has also been changed:
- Due to the seasonality of PV power generation, the amount of power generated in each season is different. The railway load can be regarded as essentially unchanged throughout the year. Therefore, the energy supplied by the power grid to the railway system is also seasonal;
- Spatial decentralization: the railway load is no longer powered by an interconnected large power grid but is distributed to a large number of distributed microgrids, showing decentralized characteristics;
- A weak impact and intermittent impact load of the railway is transferred to each energy storage device to avoid a direct impact on the power grid.
Due to the instability of solar PV power generation and the stability of the load, the railway system also needs to add energy storage elements to provide stable energy for the load. Therefore, the railway system also requires the “storage” attribute.
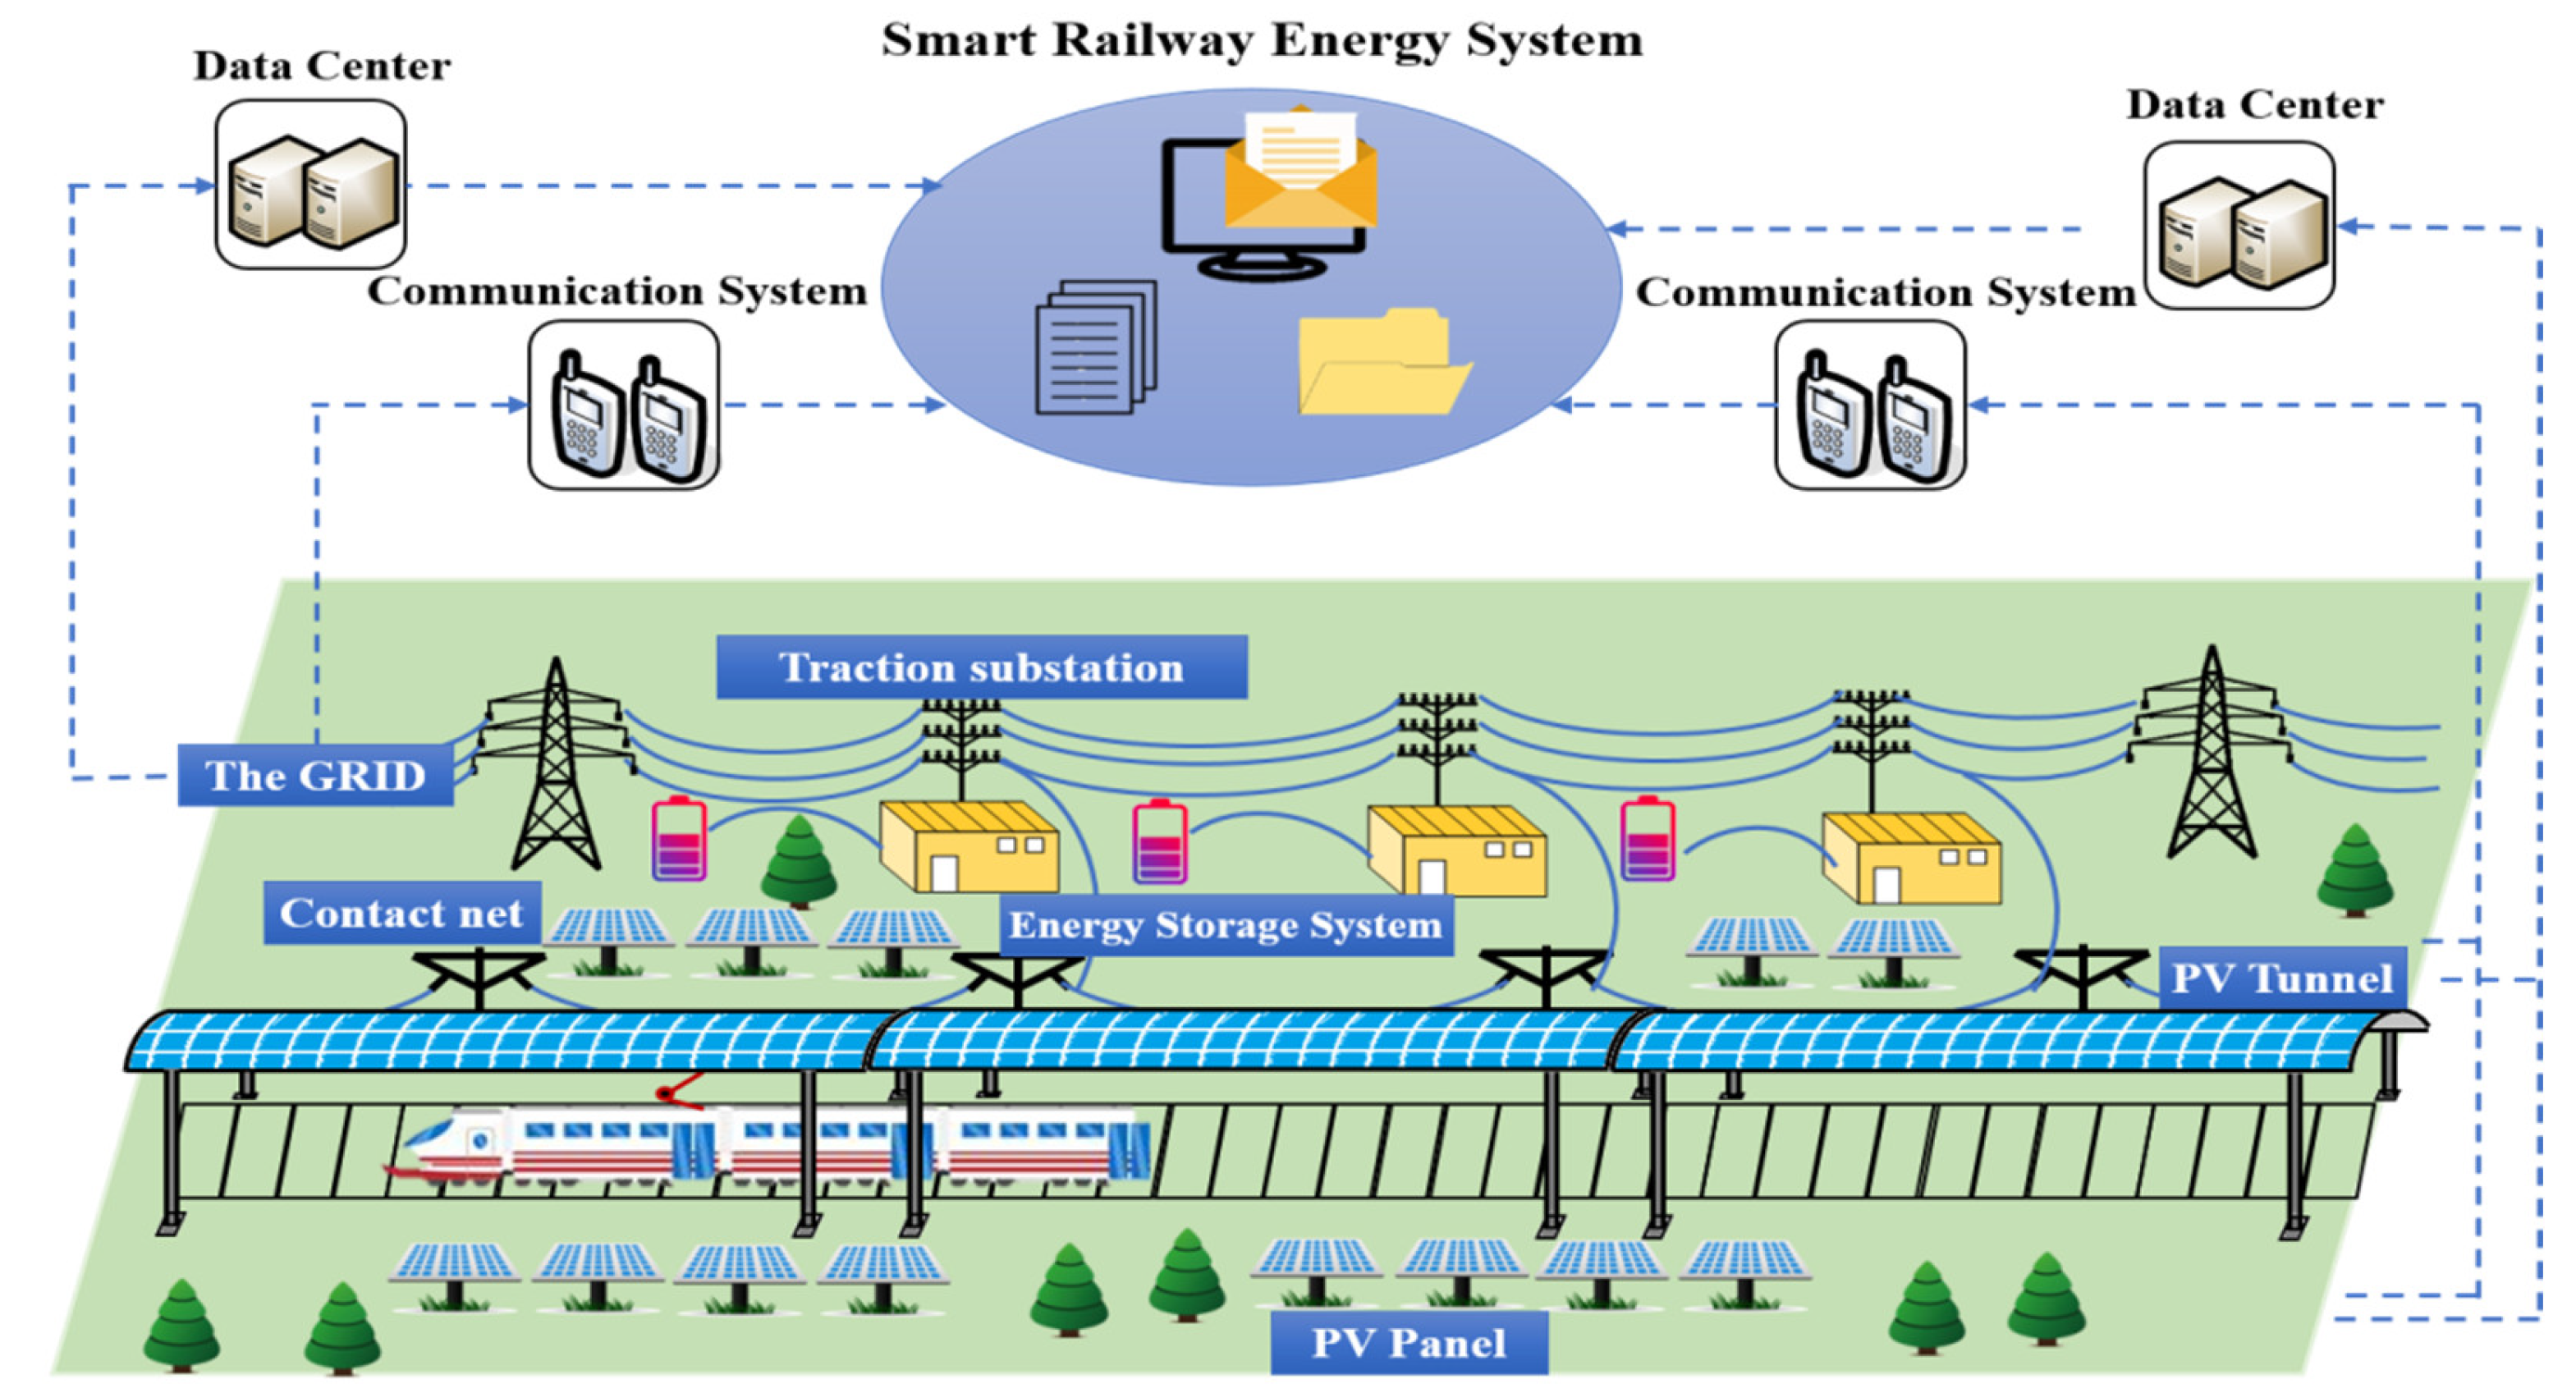
In summary, the main application of the railway system after energy is self-use power generation and surplus electricity access to the grid. The railway system should combine the four attributes of energy creation, energy transmission, energy storage, and energy use. Figure 2 shows the integration model of the PV and China’s railway systems. The photovoltaic tunnel on the roof and the photovoltaic panels on both sides of the car convert solar energy into electric energy and send it to the energy storage elements of the traction substation. The traction substation is connected to the power grid, and together they supply energy for the railway through the catenary of the railway system.
2.3. Factors Influencing Railway Solar PV Power Production
To effectively use the PV output potential of the railway system, an energy storage system is needed to form an integrated railway energy Internet system. Thus, factors affecting the railway PV module performance will mainly include the following:
Conversion efficiency depends on the module temperature and irradiance levels.
- The output calculation of solar PV generation by integration with the railway system.
- The configuration strategy of the storage system.
- Losses in cables and interconnections.
With the advancement of solar PV generation technology and the expansion of the market scale, the cost of solar PV generation has continued to decline. In the past 10 years, the cost of PV modules and PV systems in China has decreased from 30,000 yuan/kW and 50,000 yuan/kW to the current 1800 yuan/kW and 4500 yuan/kW, respectively, both of which having fallen by more than 90%. In addition, the Chinese government actively promotes the development of new energy and subsidizes the grid connection of solar PV generation in various resource areas [22].
Changes in the PV module efficiency are due to the variable spectrum of the sunlight, which in turn depends on the sun height and meteorological conditions. Changes in the module performance with long-term exposure to outdoor conditions (normally degradations) in turn affects the overall lifetime energy output (aging effects).
Losses in cables and interconnections in this system mainly care about the cable loss due to the power flow between each traction substation.
3. Methodology
To make the railway system better couple with PV resources, the railway system needs to be transformed. In addition, the potential of energization in the transformed area must be evaluated. The following will give specific measures for the energization of the railway system and specific methods for assessing the potential of energization.
3.1. Energization Method of Railway Systems
- For the carriers of the railway system, nonelectrified locomotives can be reconfigured with PV modules on top. Considering the high speed of the train during operation, an inclined configuration would bring potential safety hazards, so a flat layout is adopted. Due to the limited area of the top of the locomotive, the onboard PV power supply can supply only a small part of the energy of the train, so the current research worldwide is aimed at getting PVs to meet the energy requirements of auxiliary devices [14,15].
- The speed of electrified locomotives is fast, so mounting PV modules on the body would increase the running resistance and unsafe factors. Mounting a traction network above the locomotive and placing PV modules on the roof would cause the temperature of the train to rise, accelerate insulation aging, and affect safety. Therefore, we consider mounting PV modules directly on electrified locomotives.
- For the service facilities of the railway system, the service facilities occupy a large and concentrated area that is very conducive to the construction of centralized solar PV power stations. The electricity generated by the station generally adopts the principle of “self-use power generation, surplus electricity access to the grid,” and the remaining electricity is boosted to the distribution network voltage after being converged and connected to the power grid. There have been some studies on this topic [12,13,14]. For example, the domestic Qingdao railway station adopts a wind and rain canopy integrated method, with a PV system power generation area of 2200 m2 and an annual power generation of approximately 67 MWh; Hangzhou East Railway Station uses a building roof and wind and rain canopy integrated method, with an installation area of 79,000 m2 and an annual power generation capacity of approximately 10 GWh; and Shanghai Hongqiao Station covers an area of 61,000 m2, with an estimated annual power generation of 6.3 million kWh.
- Energization method of railway system infrastructure:
There are two parts of the infrastructure of the railway system associated with PV modules.
- PV Tunnel: Constructing PV tunnels above the tracks of electrified railways.
- PV Panel: Mounting PV modules in the railway line safety protection zone.
PV tunnels are built above the electrified railways; that is, PV modules are arranged above the rails of electrified railways according to different railway directions and local latitude. According to Reference [23], the basic roadbed width of a single-track railway is 8.6 m, the basic roadbed width of a double-track railway is 13.6 m, and the minimum distance across various buildings of electrified railways and live parts is not less than 0.5 m. For railway lines with different directions, the PV modules have different layouts, but they all use the best inclination angles for the local locations.
PV panels are PV modules that are mounted in the safety protection zones on both sides of various railway lines. Railway line safety protection zones shall be established on both sides of the railway line. The actual mounting length can be determined according to the local geographical environment, and the mounting angle is arranged according to the local best inclination in References [23,24].
3.2. Calculation Method of the Total Photovoltaic Output
The total PV output is directly related to the solar radiation per unit area, PV panel area, PV panel conversion efficiency and PV panel angle. Currently, solar radiation data are all horizontal data, and the installation of PV modules will be at a certain angle. Therefore, the horizontal data should be converted. When the array voltage is fixed, the output power of the PV tunnel can be expressed as follows [25]:
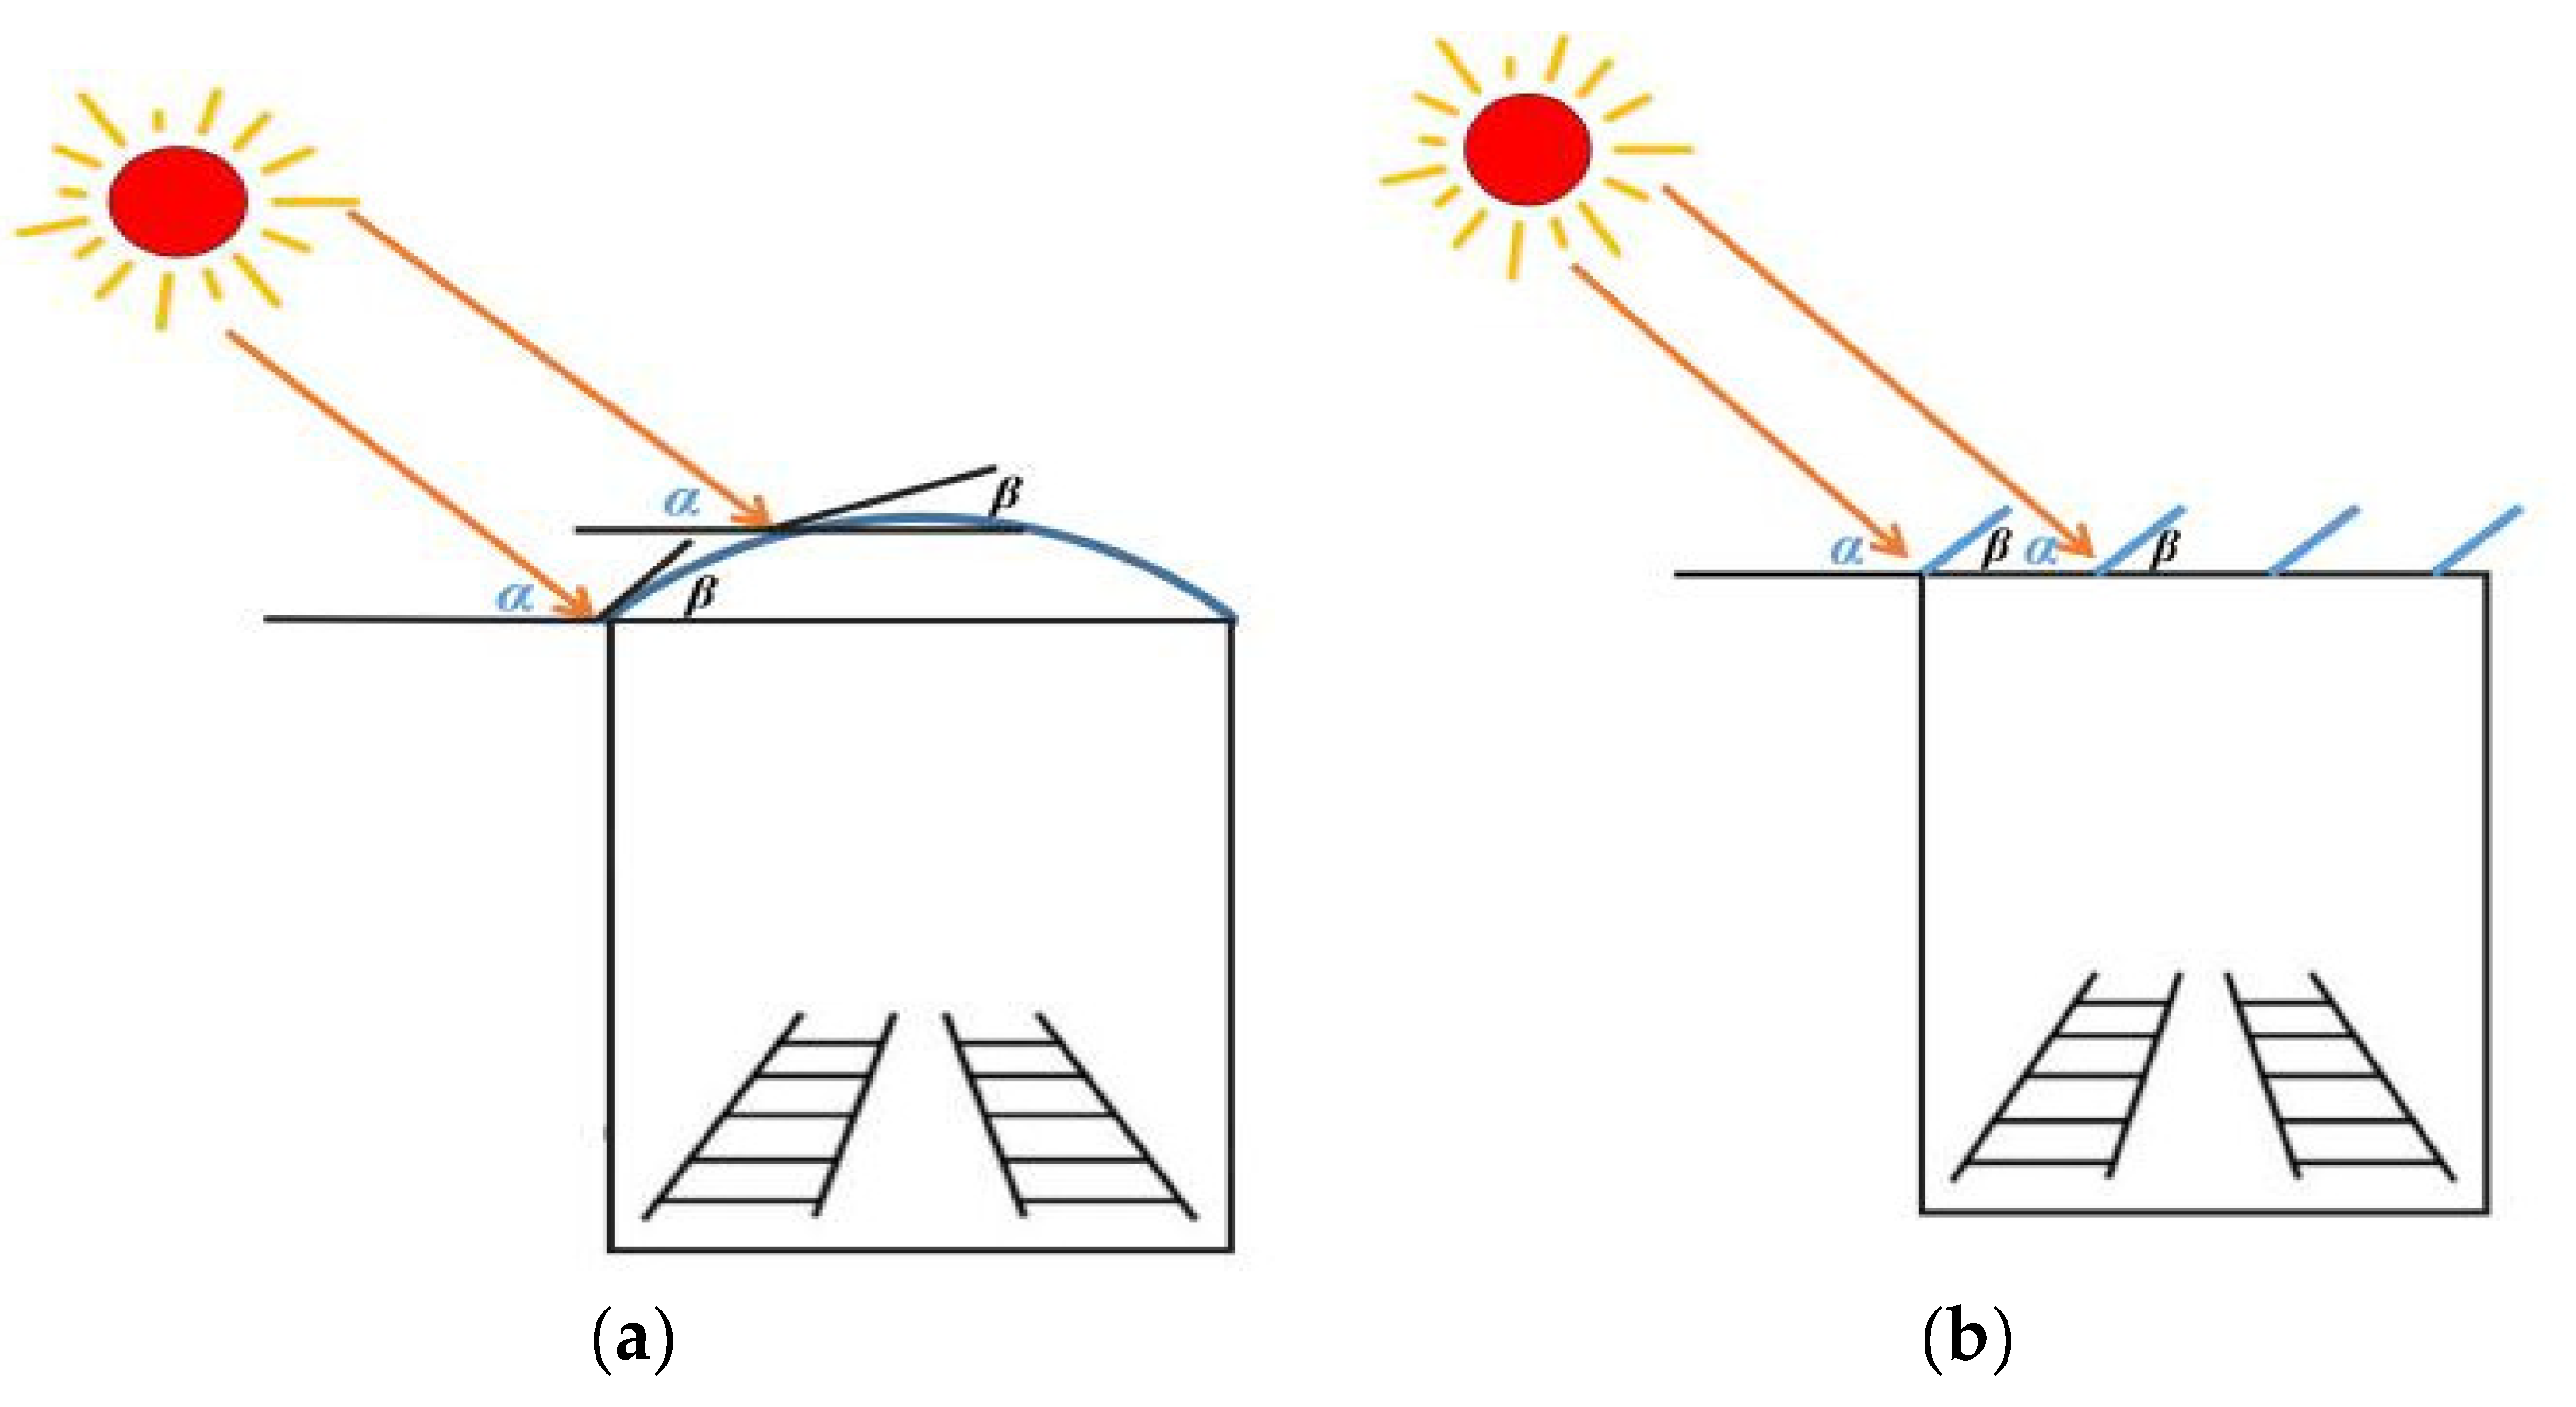
where SPV1 is the energy output of the PV tunnel, GHI is the average solar radiation per unit area, S is the PV module area, t is the lighting time, η is the conversion efficiency of the module, β is the tilt angle of the module, and α is the solar height angle at noon, as shown in Figure 3.
The output power of PV panels can be expressed as follows:
where SPV2 is the energy output of the PV panel; cpv is the equivalent width of the PV panel, LPV is the equivalent length of the PV panel on both sides, and pn is the coverage corporation of the PV panel.
3.3. Method for Calculating the Power Output of PV Modules
The conversion rates of different types of PV modules are not the same, and depending on the capacity of the manufacturer, the conversion rate of even the same type of PV modules may be different. In terms of the conversion rate, the conversion rate of a monocrystalline silicon module is relatively high, ranging from 17.5% to 20%, with an average value of approximately 18.4%, which is approximately 8.2% higher than that of a polycrystalline silicon module [26]. In addition to the innate conditions determined by the materials, the conversion efficiency of PV modules is also affected by the environment and life span. Generally, the life span of a PV module is approximately 20–25 years [27]. Therefore, the formula used to calculate the PV module efficiency is:
where η is the conversion efficiency of the PV module in use, η0 is the conversion efficiency of a standard PV module, λt is the influence coefficient of the environment (for example, a lower temperature corresponds to a higher conversion efficiency) on the module, and μ is the conversion coefficient of the module life cycle.
To protect the energy storage element from overcharging, a charge controller must be installed to detect when the energy storage element is fully charged and to stop or reduce the energy flow of the PV module to the battery. In addition, the energy storage element will lose electrical energy during charging and discharging. To extend the life of the energy storage element, there are certain requirements for the depth of discharge of the energy storage element. After the energy storage element passes through the inverter, it is converted from DC to AC, which can be used by the load [28]. Therefore, the conversion efficiency of the inverter needs to be considered, so the actual output of the PV module to the load is calculated as follows:
SS is the energy output of the PV module, SPV is the energy output of the PV module, ηCC is the charge and discharge efficiency of the charge controller, λES is the conversion factor that affects the output of the energy storage element, and ηI is the efficiency of the inverter.
3.4. Energy Storage Configuration Method
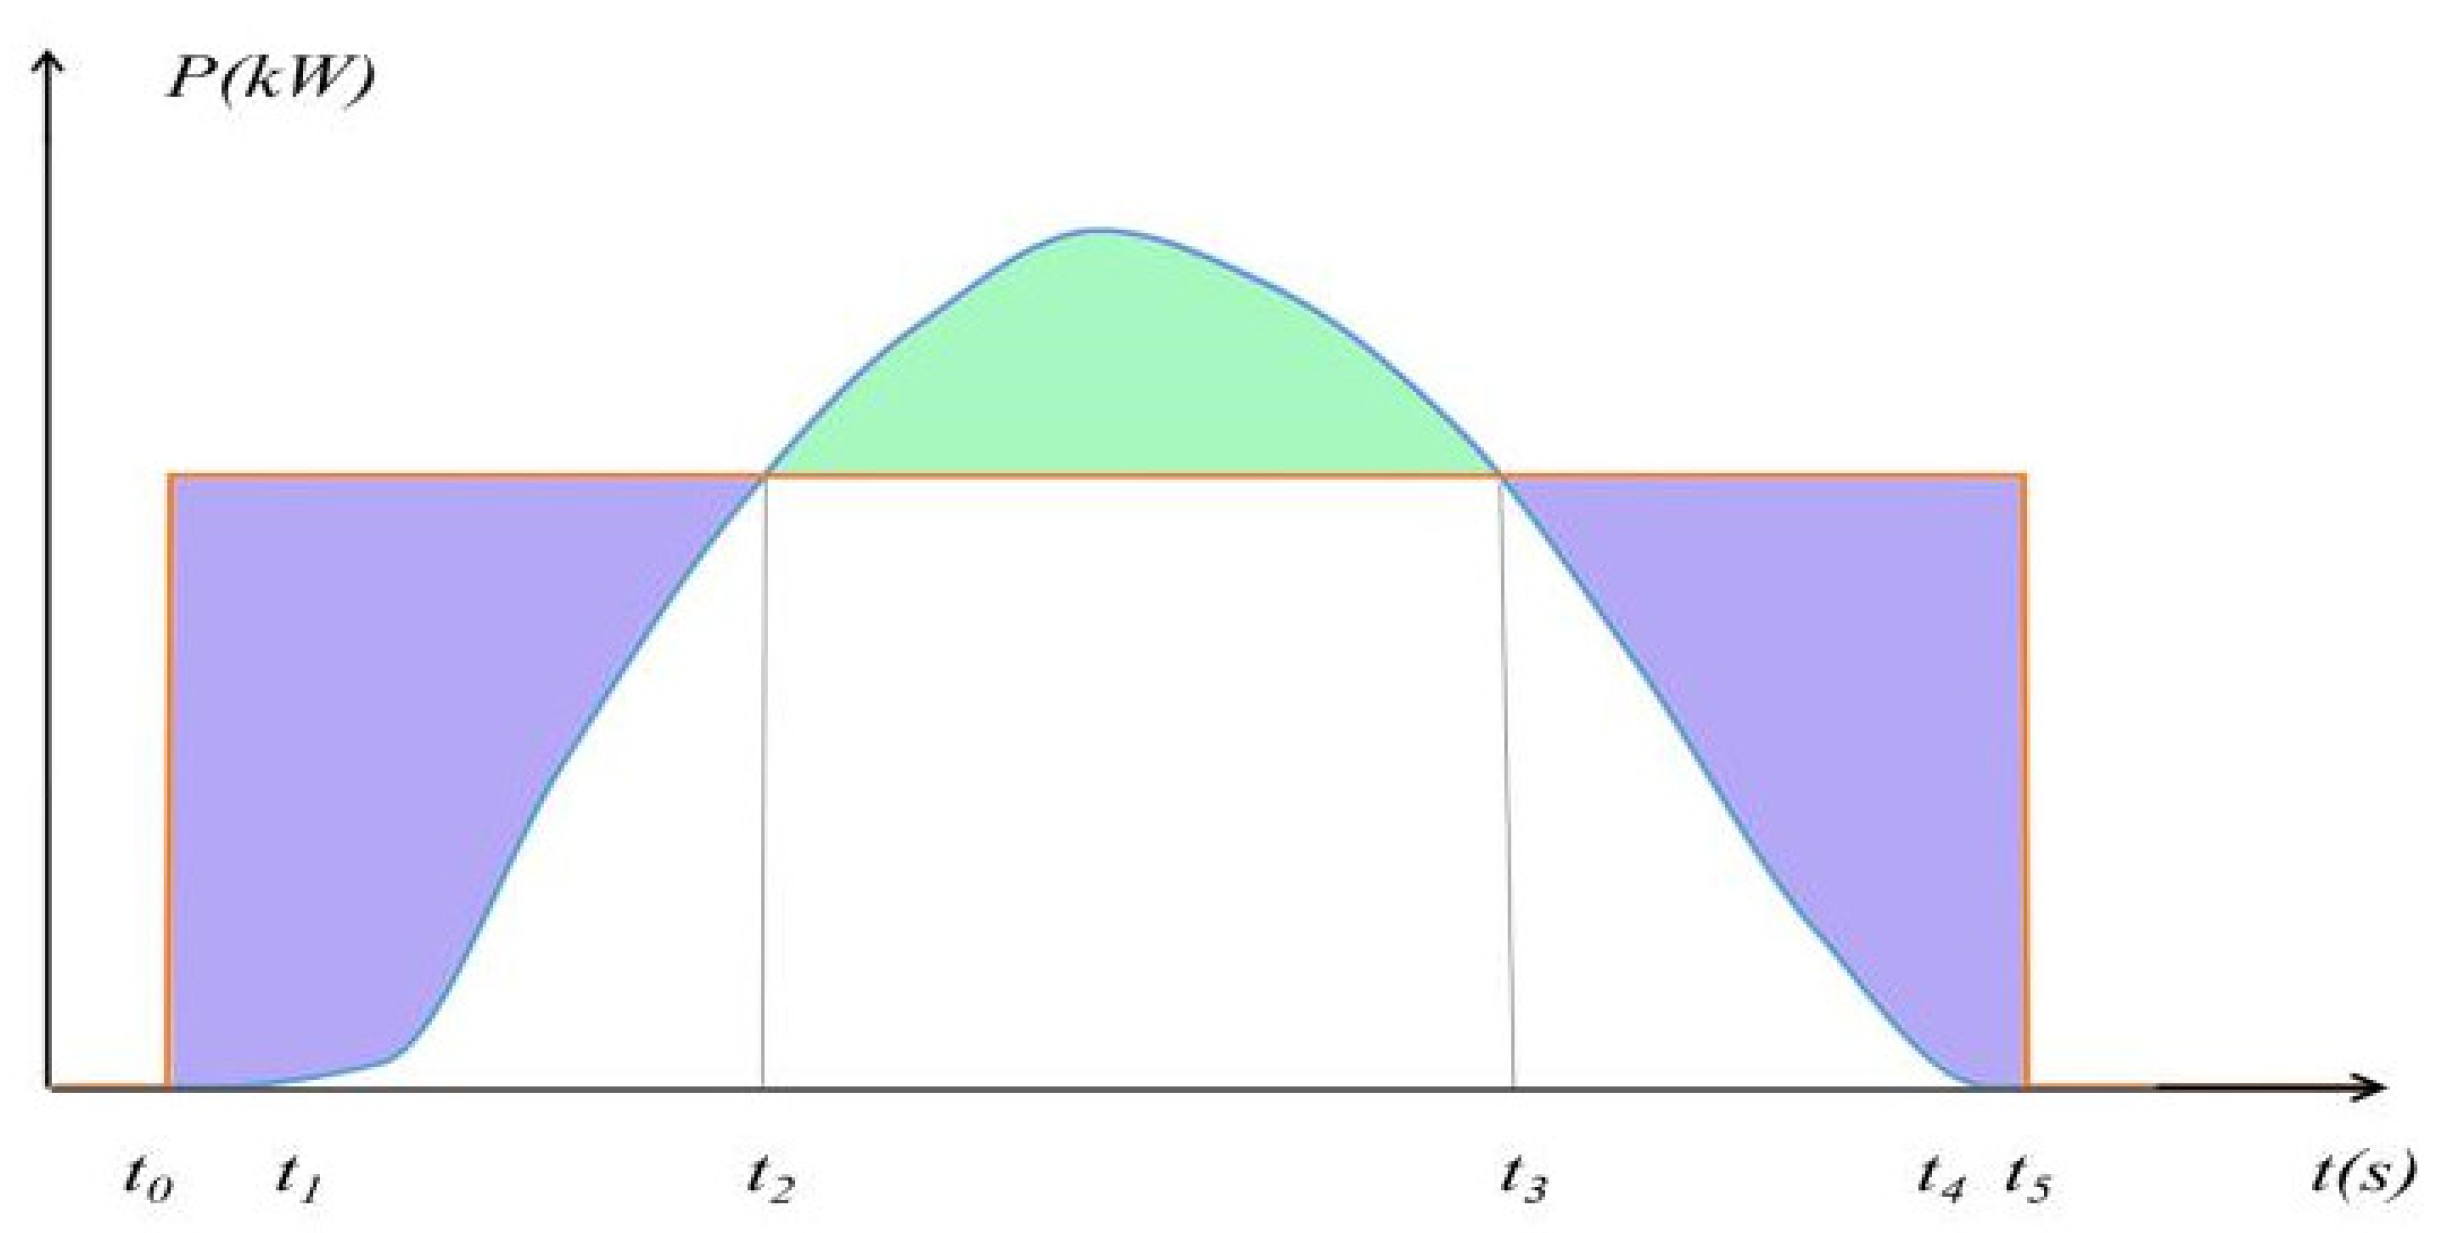
The traction load of the train during exercise can be regarded as constant. Due to the unstable PV output, energy storage elements must be installed to help the energy supply: when the PV output is greater than the load, the excess energy is sent to energy storage, which can reduce the waste of PV resources and smoothly supply energy to the load. The energy storage configuration strategy is as shown in Figure 4. The function similar to the sine function in the figure is the power function of photovoltaic output, and the constant function is the load power function.
For regions with sufficient PV resources, the maximum value of the cumulative energy required by the daily load instantaneous power exceeding the PV output is taken as the energy storage capacity of the entire system, which is the purple part in Figure 4.
where ES is the capacity of the energy storage element, t is the moment, Pneed is the power demand of the load, and PS(t) is the power function of the PV output with respect to t.
For areas with moderate PV resources, the method used to calculate the energy storage capacity is as follows: the maximum value of the cumulative energy required by the daily load instantaneous power exceeding the PV output is compared with the maximum value of the cumulative energy required by the daily PV instantaneous power exceeding the load, and the maximum value is the capacity of the energy storage system. That is, the green part and the purple part in Figure 4 are compared, and the maximum value is taken.
For PV resource-poor areas, the maximum value of the accumulated energy required for the PV instantaneous power exceeding the load per day throughout the year is taken as the energy storage capacity, which is the green part in Figure 4.
3.5. Microgrid Dispatching Strategy to Minimize Power Purchase Cost Considering Power Transmission Loss
As mentioned in Section 2, the reconstructed railway system has formed a linear microgrid group, “self-use power generation, surplus electricity access to the grid”, in terms of the energy use. By exploiting the microgrid, energy storage can minimize wasted capacity to efficiently use PV resources. This paper proposes a microgrid scheduling strategy that minimizes the cost of electricity purchase considering the microgrid scheduling losses.
Assuming that there are N substations in total, the objective function is:
where C1 is the cost of electricity purchased by the railway system, SG is the amount of electricity purchased, PE is the price of electricity purchased, SGn(t) is the amount of electricity purchased at the nth substation at t, t is the time, and T is the length of time for the microgrid dispatch.
According to the law of conservation of energy, for the nth traction substation, the power gap between the load and the substation is made up by the power grid and other traction substations:
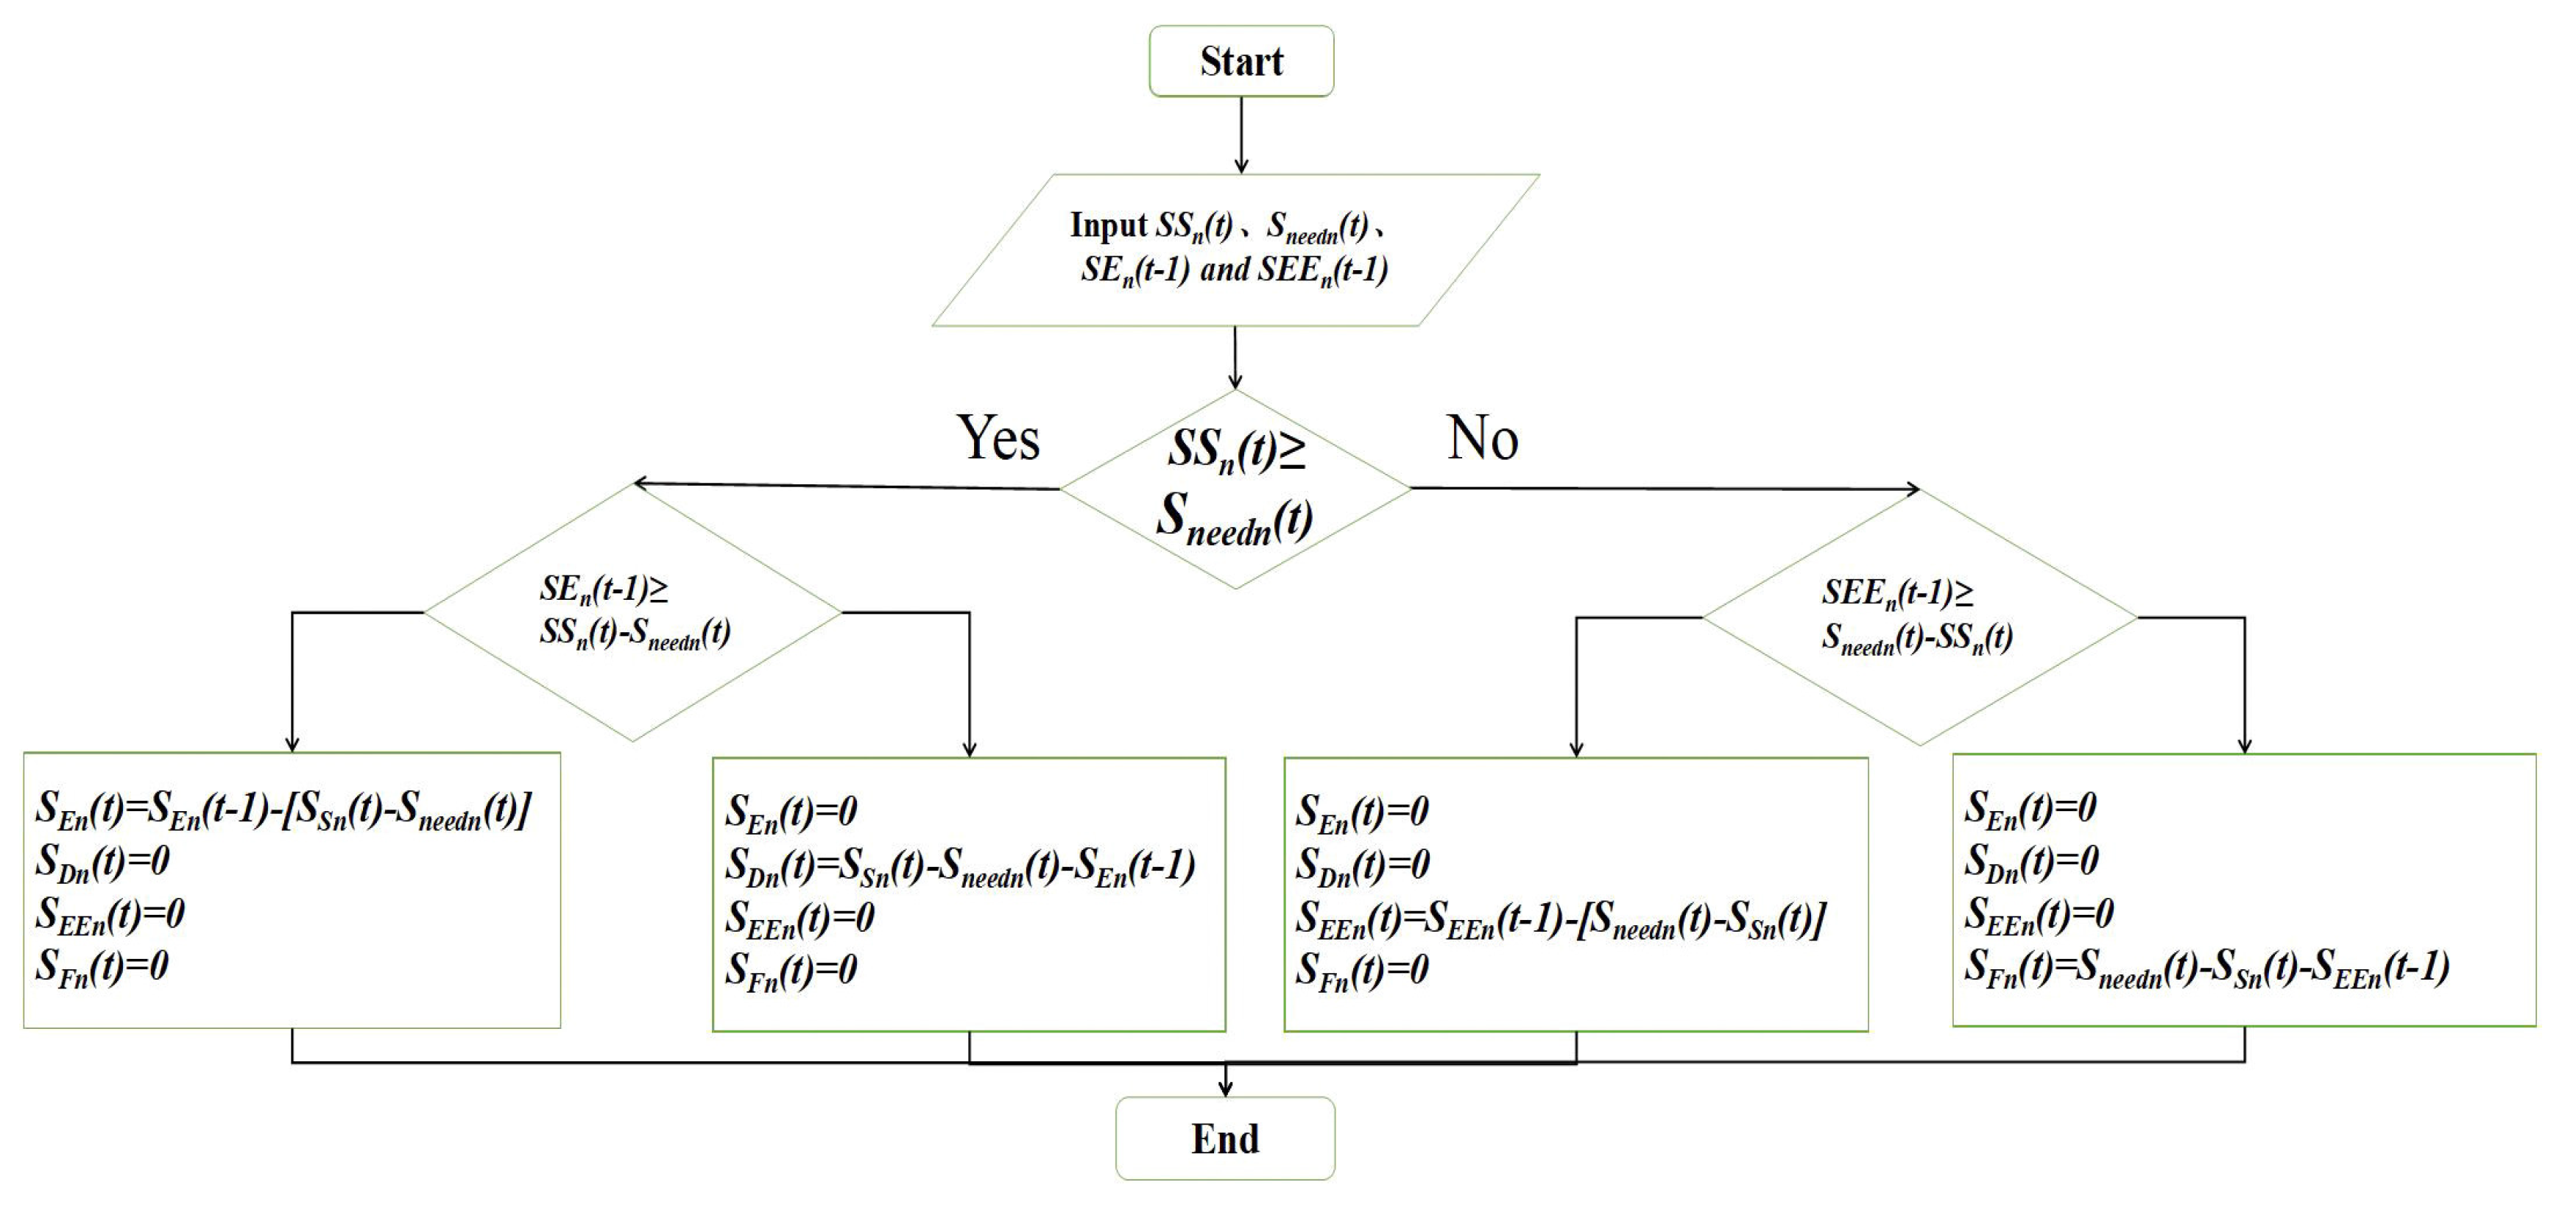
Among them, SFn(t) is the energy shortage of the nth substation at t, and SCn(t) is the energy sent into the nth substation by the microgrid system at t. The energy storage calculation process is shown in Figure 5.
3.5.1. Calculation Method of System Energy Shortage
After using the method mentioned above to obtain the PV output SSn(t) of the substation, first compare it with the energy needs of the substation (Sneedn(t)).
When SSn(t) > Sneedn(t), further compare the current energy storage capacity SEn(t − 1) and the size of SSn(t) − Sneedn(t); when SEn(t − 1) > SSn(t) − Sneedn(t), the energy storage internal capacity becomes SEn(t) = SEn(t − 1) − [SSn(t) − Sneedn(t)], substation output power SDn(t) = 0; on the contrary, the internal capacity of the energy storage is SEn(t) = 0, and the delivered power SDn(t) = SSn(t) − Sneedn(t) − SEn(t − 1).
When SSn(t) < Sneedn(t), further compare the current energy storage energy SEEn(t − 1) with Sneedn(t) − SSn(t), when SEEn(t − 1) > Sneedn(t) − SSn(t), the internal residual energy of energy storage is SEEn(t) = SEEn(t − 1) − [Sneedn(t) − SSn(t)], and the power deficit is SFn(t) = 0; on the contrary, the internal residual energy of energy storage is SEEn(t) = 0, and the power deficit is SFn(t) = Sneedn(t) − SSn(t) − SEEn(t − 1).
3.5.2. Constraints of Equality and Inequality of SCn(t) Considering Energy Transmission Loss
Among them, SBn(t) is the energy of the nth traction substation participating in dispatching, SCn(t) is the energy sent into the nth substation by other substations in the system, ηi is the line transmission efficiency from the nth substation to the ith substation, and ηl is the line transmission efficiency between adjacent substations.
For SBn(t), it must be less than the dispatchable energy of the substation:
3.5.3. Calculation Method of Electricity Sales
For a traction substation, the energy that should be sent at time t minus the energy that the substation participates in dispatching at time t is the electricity sold to the grid at time t.
Among them, Ssold(t) is the electricity sales volume of the railway microgrid system to the power grid at time t, and Ssoldn(t) is the electricity sales power of the nth traction substation to the power grid at time t.
3.6. Evaluation Index of the Railway System Energization Potential
This article uses the self-consistent rate as an indicator to assess the railway system energization potential. The self-consistent rate is the ratio of the annual total PV output to the total energy consumption of the load, and the calculation method is as follows:
SCRS is the self-consistent rate, PPV is the energy supplied by PV modules to the railway, and Eneed is the energy demand of the railway.
4. Case Analysis
4.1. Definitions and Instructions
According to the potential assessment method obtained, as abovementioned, this section makes specific data calculations. First, we provide some definitions and instructions.
The development scenario is the ratio of the total PV development volume to the total PV development potential. In this report, 10% of development intensity is defined as a conservative scenario, 20% is a basic scenario, and 30% is a positive scenario.
For PV modules of railway system vehicles, we select single-crystal silicon modules with higher conversion rates; for railway infrastructure PV modules, we select lower-cost single-crystal silicon modules. Since the conversion rate of the module is greatly affected by the manufacturer, in the subsequent calculations, for the sake of conservativeness, the conversion rate of both PV module types is taken as 16%.
4.2. Potential Evaluation of the Energy Output in the Urumqi-Hami Section of the Lanxin Railway Line
Urumqi is the capital of Xinjiang Uygur Autonomous Region in China. The Urumqi-Hami section of the Lanxin Line is located in eastern Xinjiang, with an average annual light intensity of approximately 1600 kWh/m2, and belongs to the second-class resource area of China. The Urumqi Power Grid is connected to the eastern part of China through the 750 kV line of Wubei Substation, which belongs to the terminal area of the power grid, and the strength of the power grid is relatively fragile.
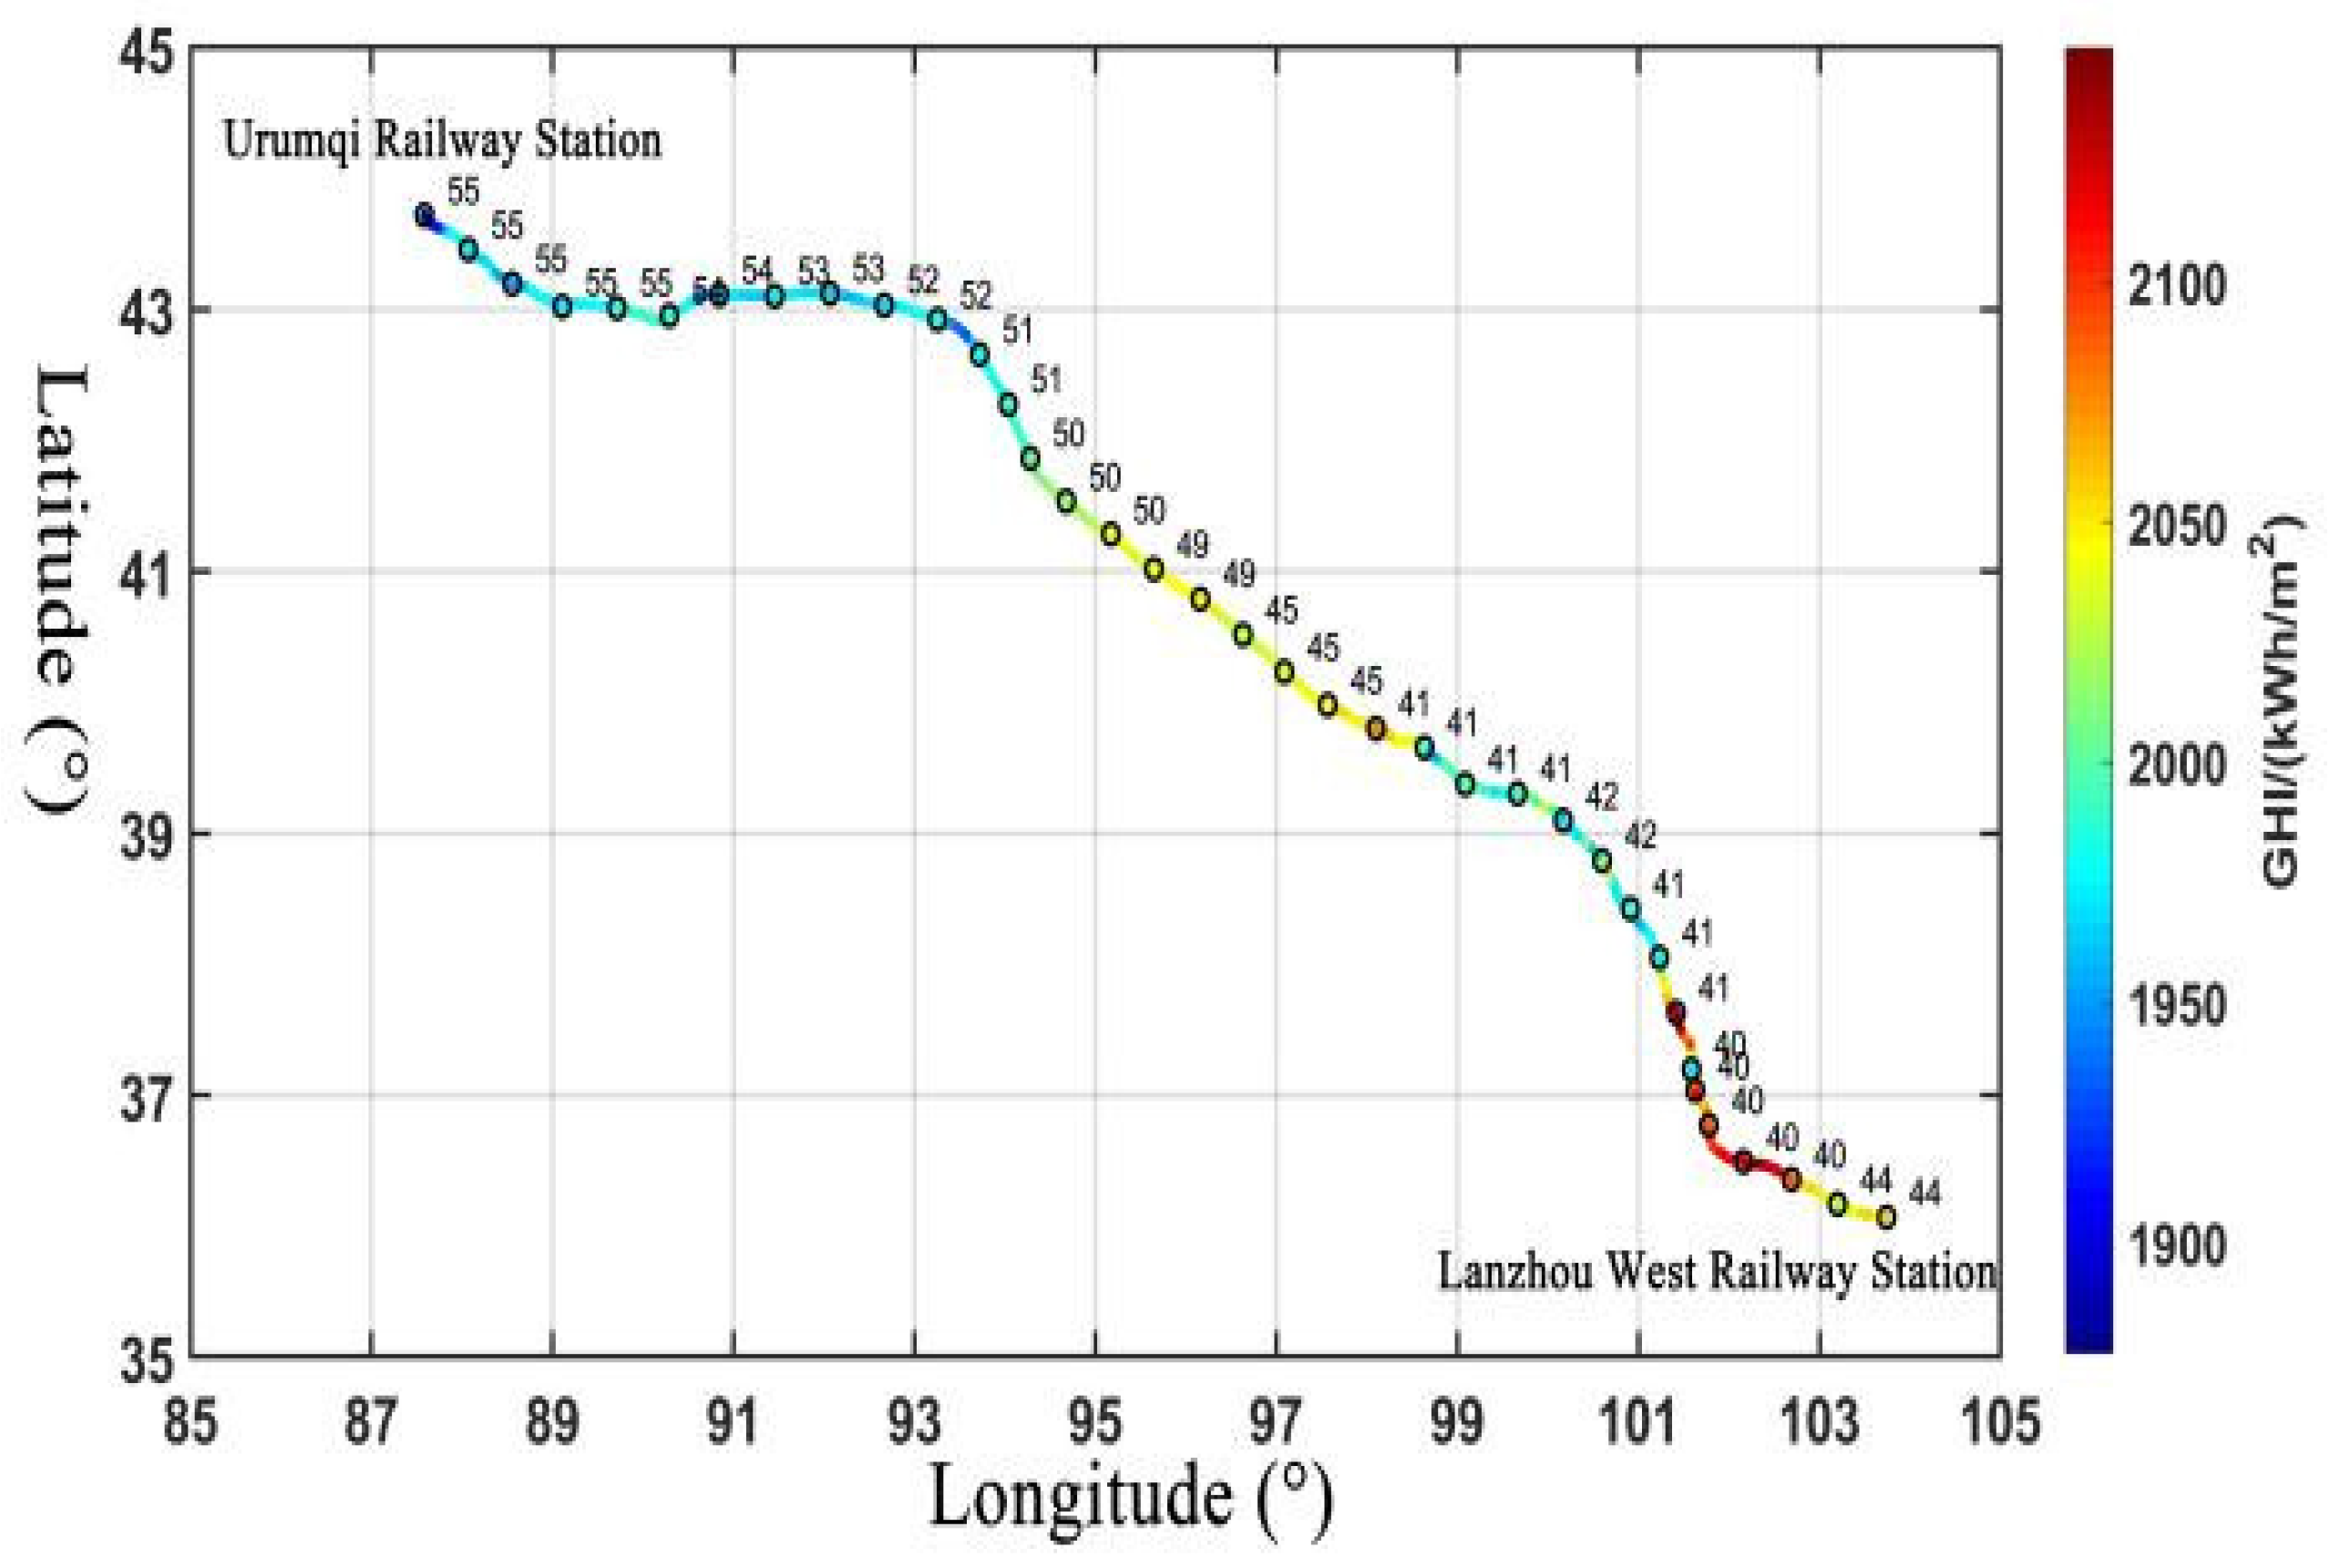
The trains running on this line are electrified locomotives, so the energization method includes building a PV tunnel above the line and building PV panels on both sides of the line. The PV module supplies power to the energy storage device located in the train traction substation through the charge controller, and the energy storage device supplies power to the locomotive through the inverter. The optimal inclination of the traction substation and the average light intensity along this railway line are shown in Figure 6.
Taking the first, second, and third traction substation intervals of the Urumqi-Hami section of the Lanxin Line as an example, we use the method in Section 3 to calculate and compare the results of the two modes of independent operation and microgrid scheduling. The length of the Urumqi-Hami section is 547.4 km. According to Reference [29], the distance between the traction substations is generally controlled at approximately 50 km; therefore, the number of traction variables in this section is 11, and the interval is 49.8 m.
Since the PV panels in this paper are arranged above the traction line of the high-speed railway line and on both sides of the track, the space is relatively compact. Therefore, this paper uses a fixed inclination PV panel layout mode, and the inclination angle is the local latitude. The inclination angle of the PV module is 58°.
The Wuha section is a two-way railway. According to the data information of the “Railway 12306” platform, this section sees 124 trains pass daily, and the daily railway load of this section can be calculated as 45,619.2 kWh.
According to Section 2, another energization method in electrified railway systems is to add a PV module along both sides of the railway line. Considering the width of the PC tunnel is 13 m, and the width of the PV module on both sides is 1 m, the total width is 15 m. For coverage rates of 10%, 20%, and 30%, using Equation (2), the area of the PV modules installed in each traction substation shall be 43,000 m2, 85,000 m2, and 128,000 m2.
On the Global Solar Atlas platform, we used the method of obtaining the illumination data in Section 4 paragraph A, sampled along the section of the railway, and used Hermite interpolation to obtain the monthly average GHI of the section of railway, as shown in Figure 7.
In this case, the MPPT charge controller is used. For conservative reasons, the efficiency is 96%. The discharge depth of the battery is 10–90%, and the efficiency of the inverter is 95%.
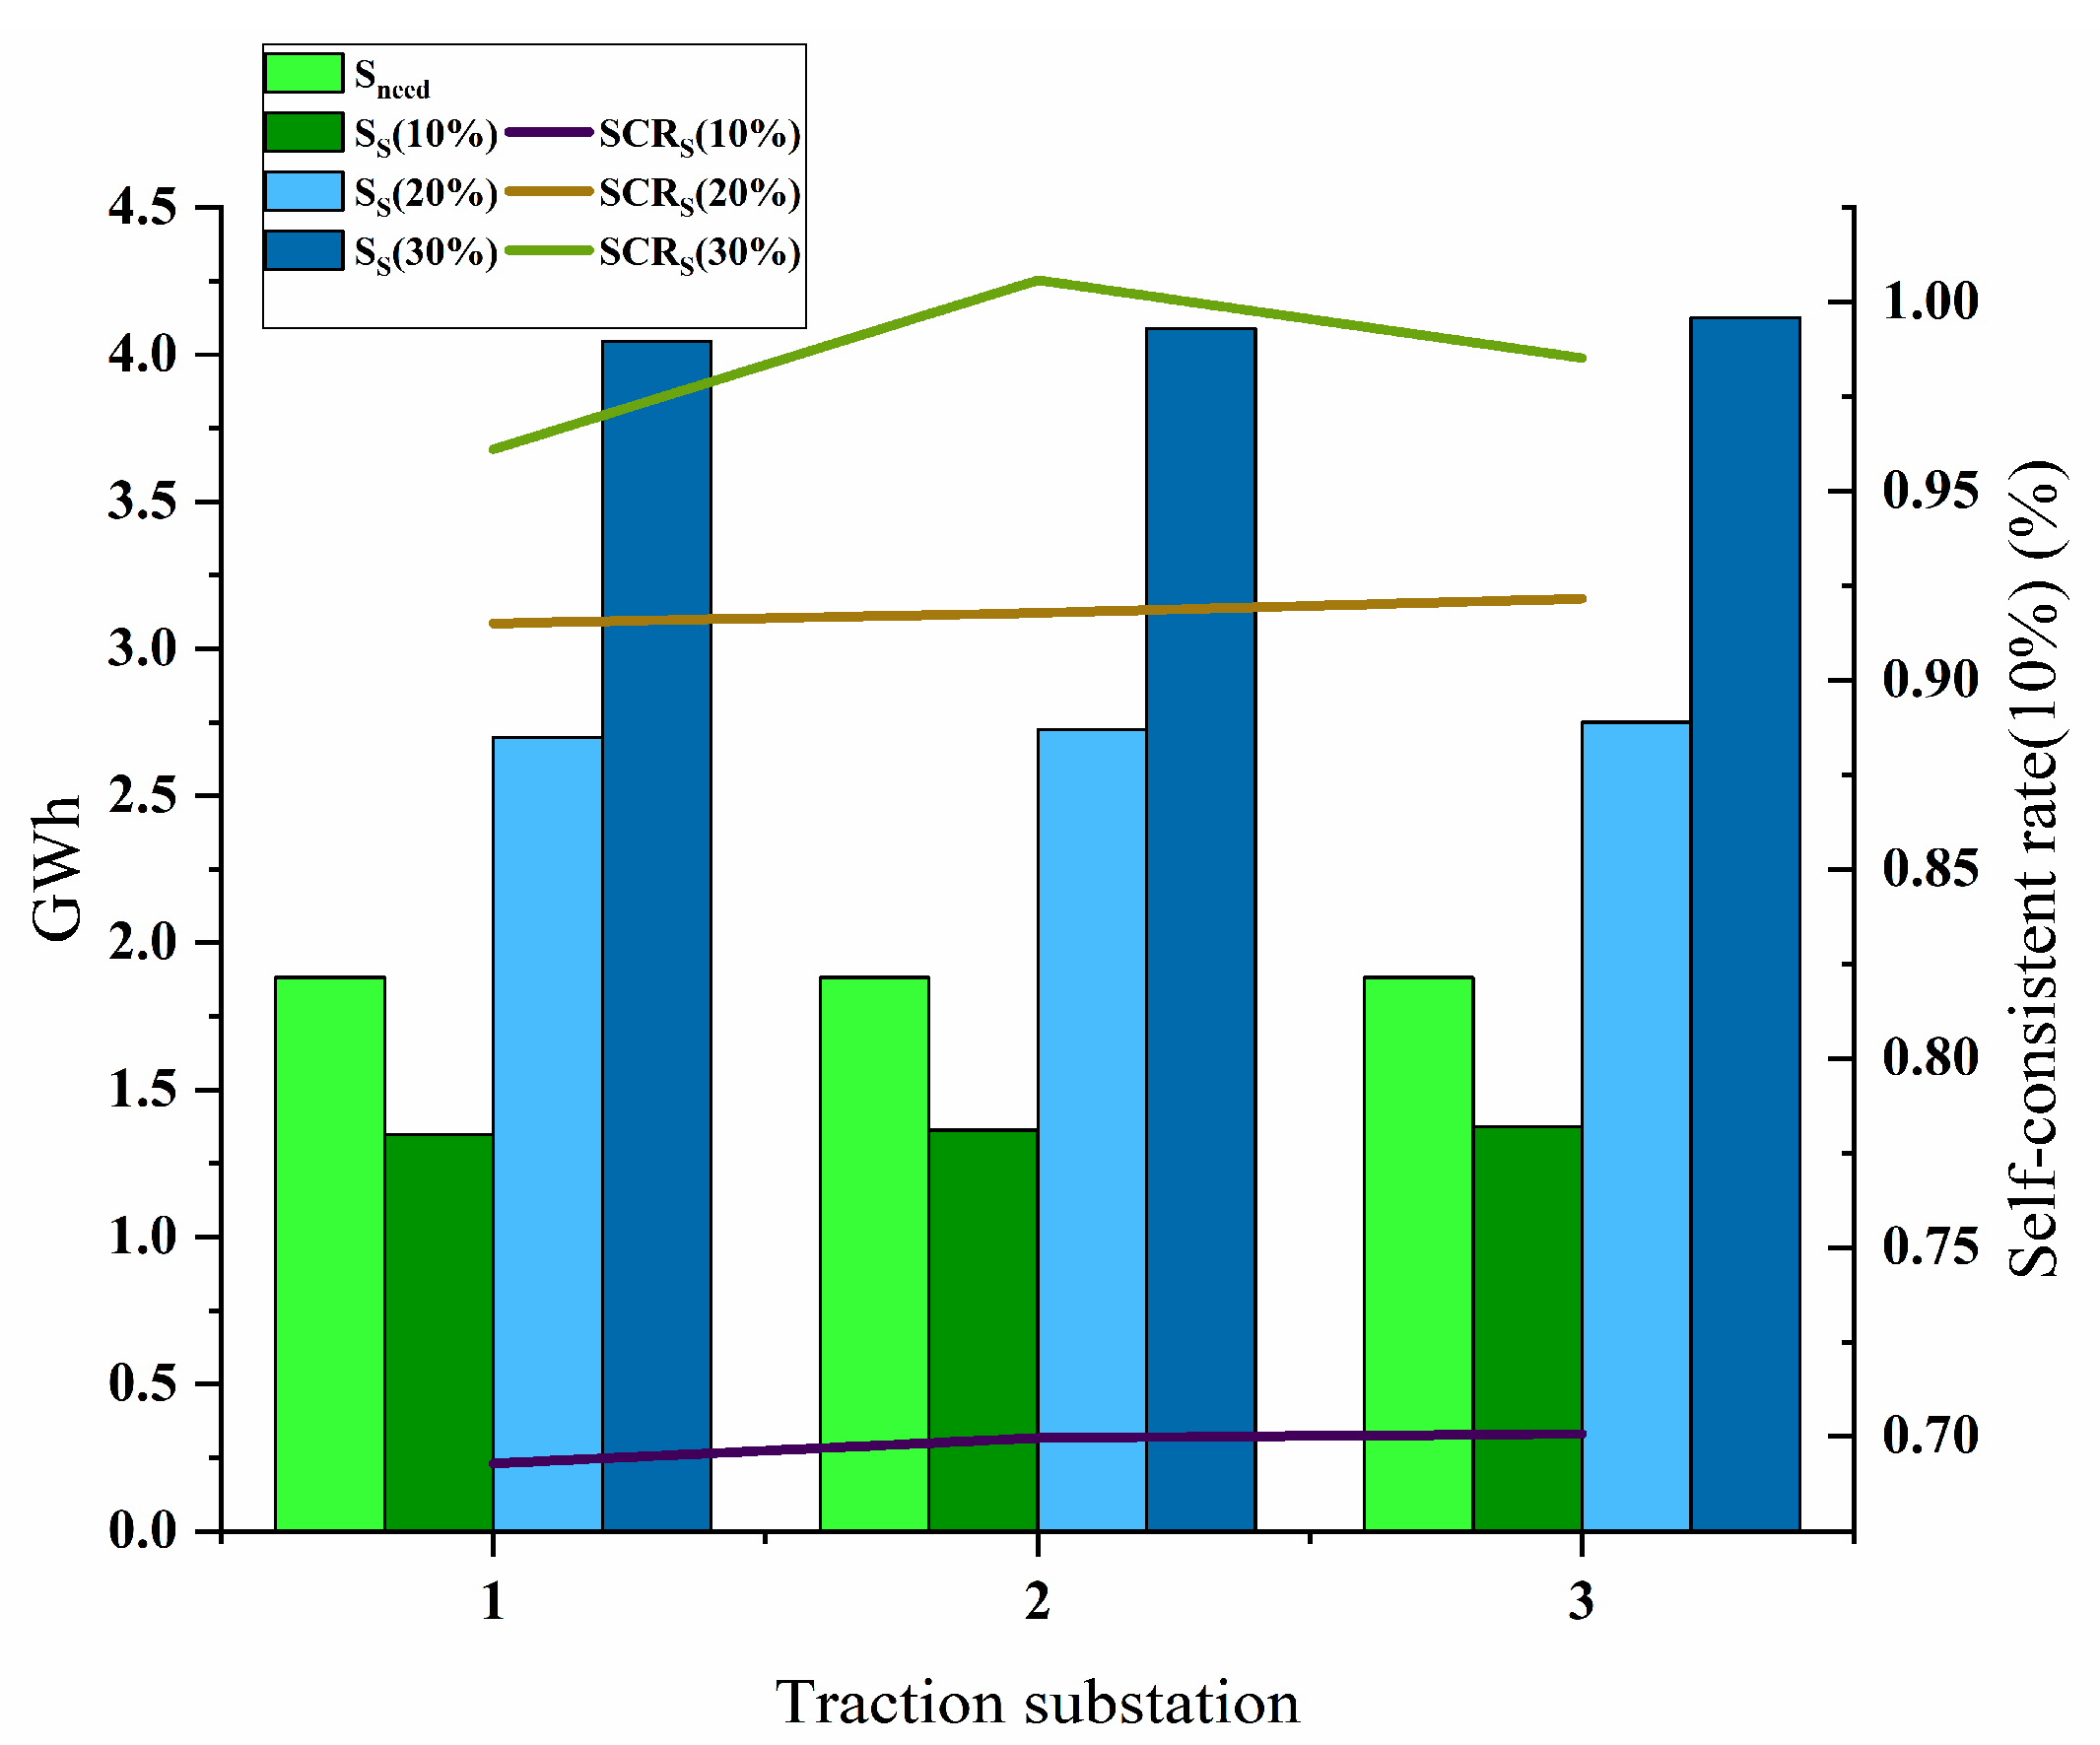
After the data was collected, we calculated the actual PV output of the three traction substations using Equations (1), (3) and (4), determined the area of the PV module by Equation (2), and used Equations (5)–(7) to determine the energy storage capacity. Finally, Equations (8)–(13) were used to calculate the self-consistent rate, electricity purchase cost and electricity sales revenue of the microgrid during operation.
In the case of a 10% development intensity, the PV module area of the three traction substations is 43,000 m2, and the energy storage capacity is 17.8 GWh, 24.5 GWh, and 17.9 GWh; at a 20% development intensity, the PV module area is 85,000 m2, and the energy storage capacity is 21.07 GWh, 25.5 GWh, 21.16 GWh; at a 30% development intensity, the PV module area is 128,000 m2, and the energy storage capacity is 22.58 GWh, 26.8 GWh, 22.6 GWh.
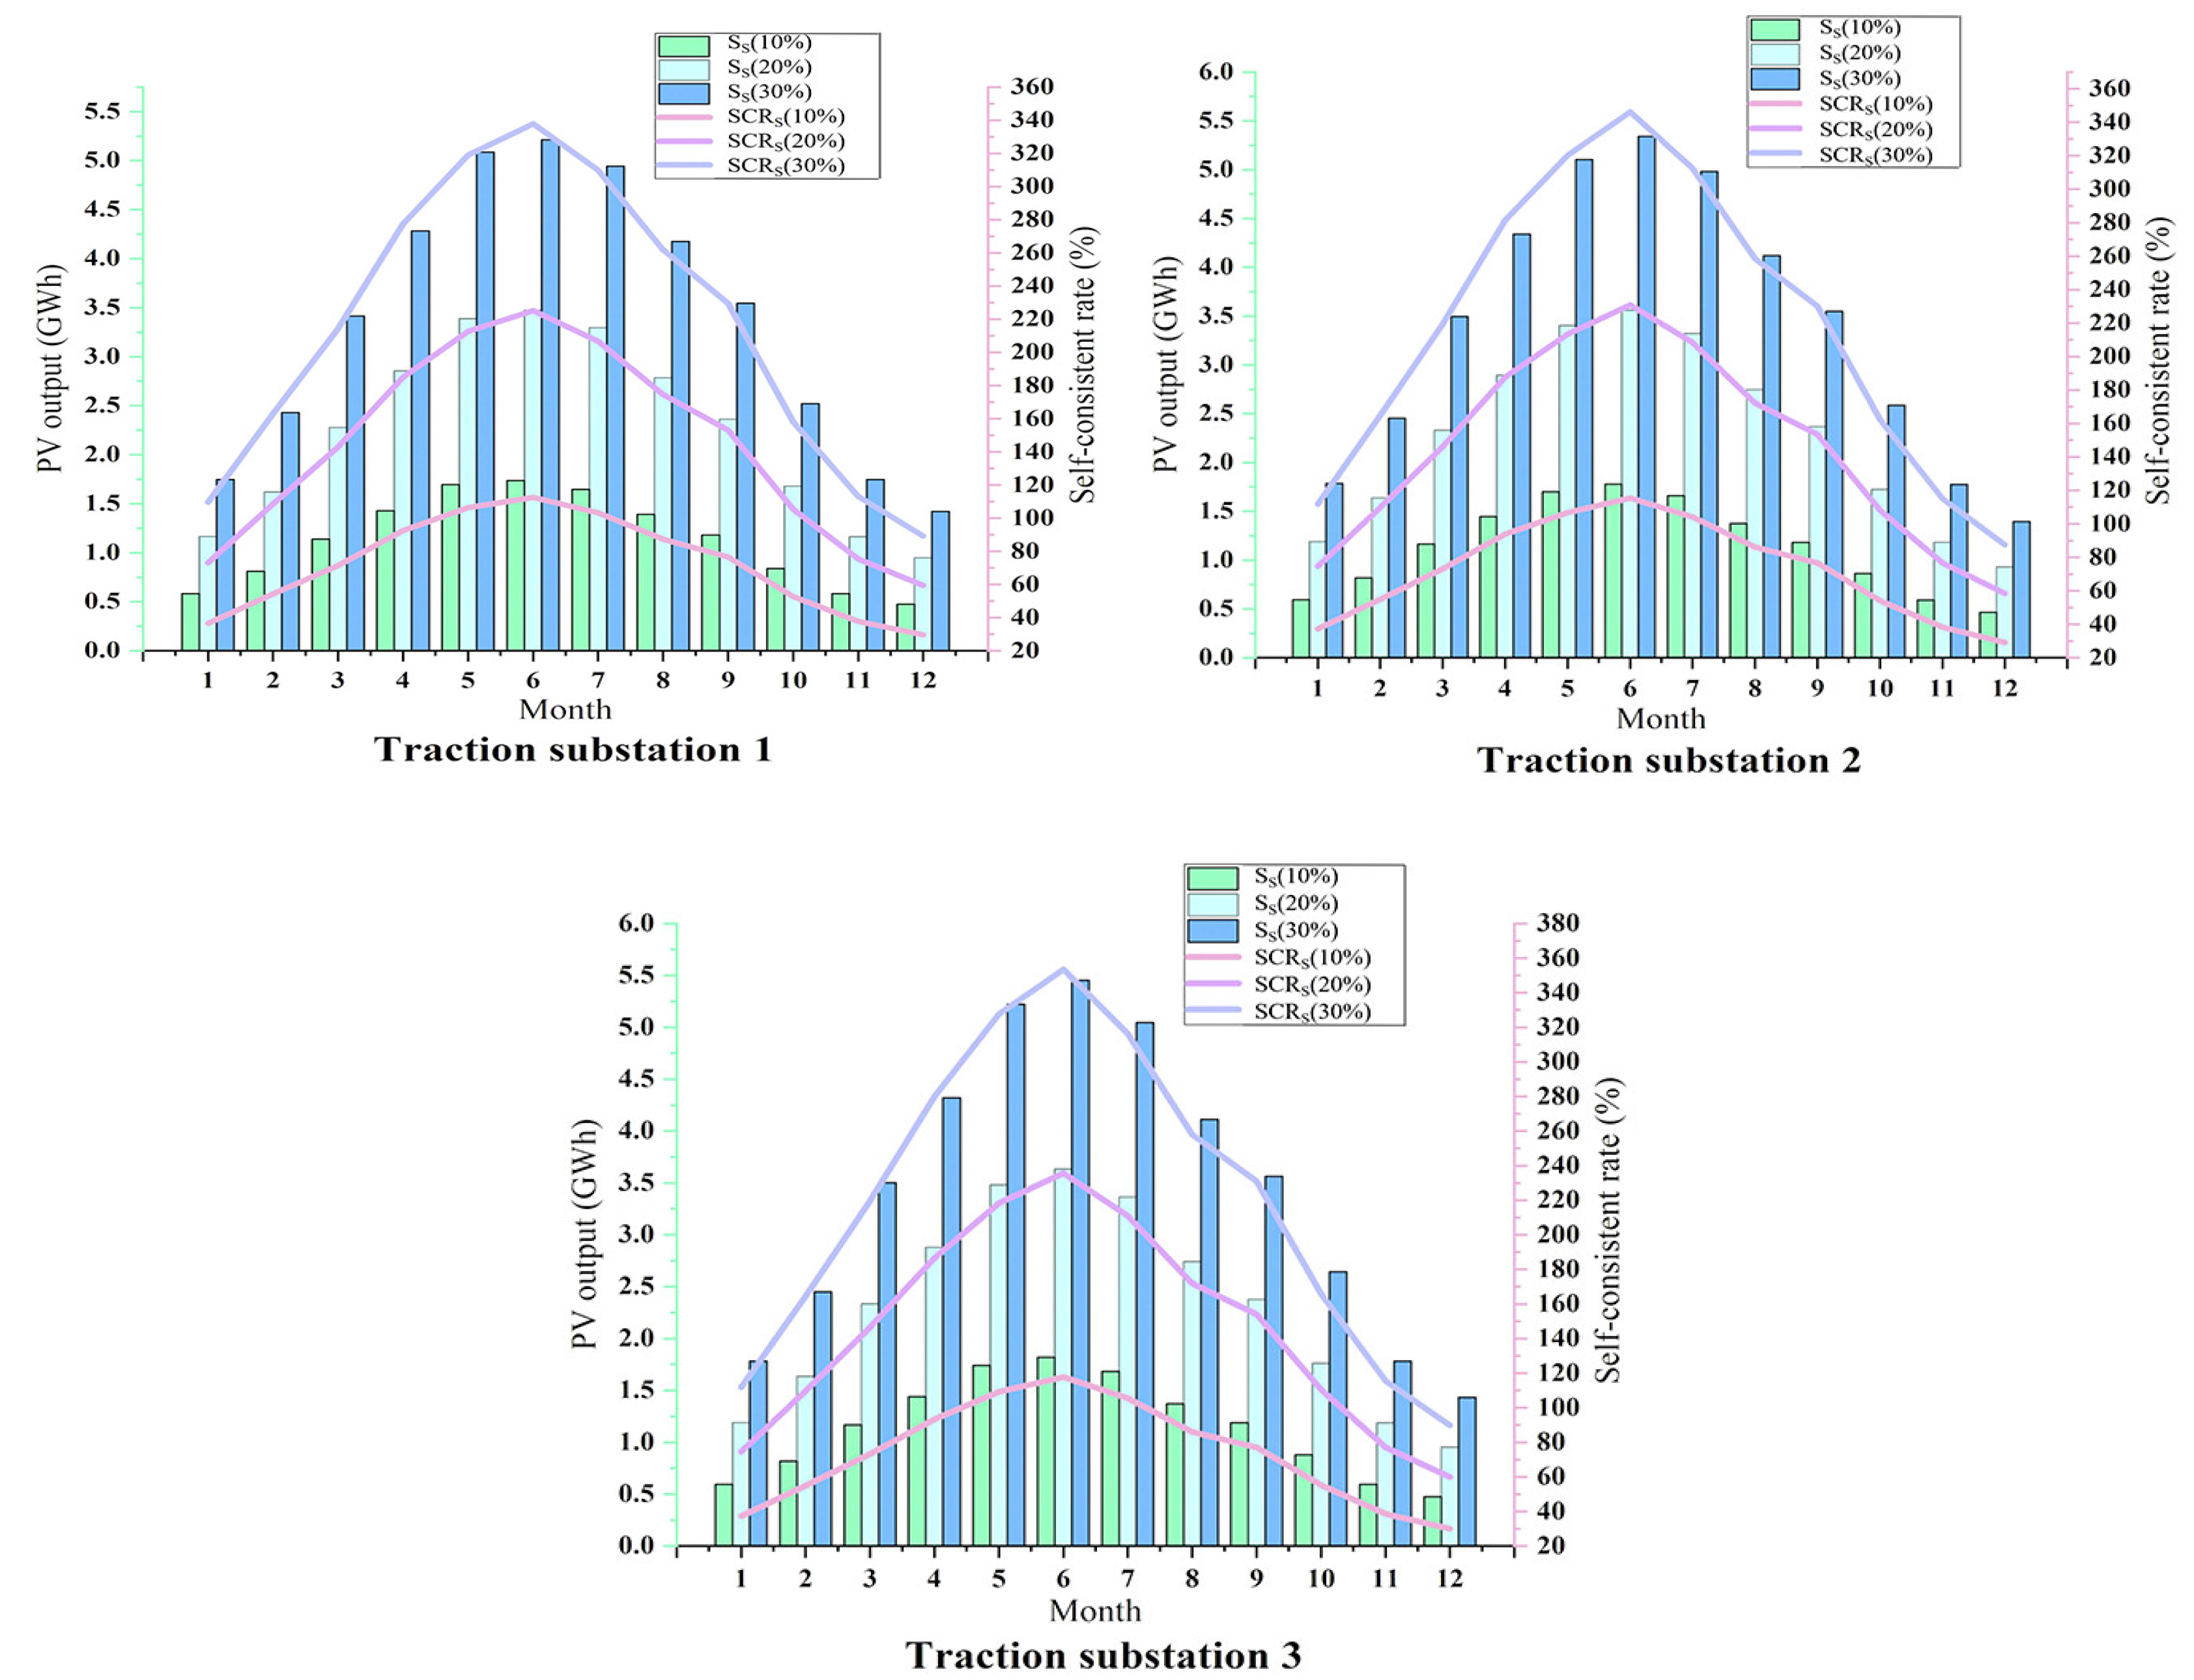
The annual results of the calculation are shown in Figure 7, and the monthly results are shown in Figure 8 and the specific data are shown in Table 2.
The PV output and self-consistency rate of a region reflect the energy potential of the railway system in the region. Figure 8 shows that when the development intensity is 10%, the self-consistency rate of each traction substation exceeds 100% in May, June and July; when the development intensity is 20%, except for January, November and December, and each traction substation can reach self-sufficiency; when the development intensity is 30%, their self-consistent rate can reach more than 300% in June.
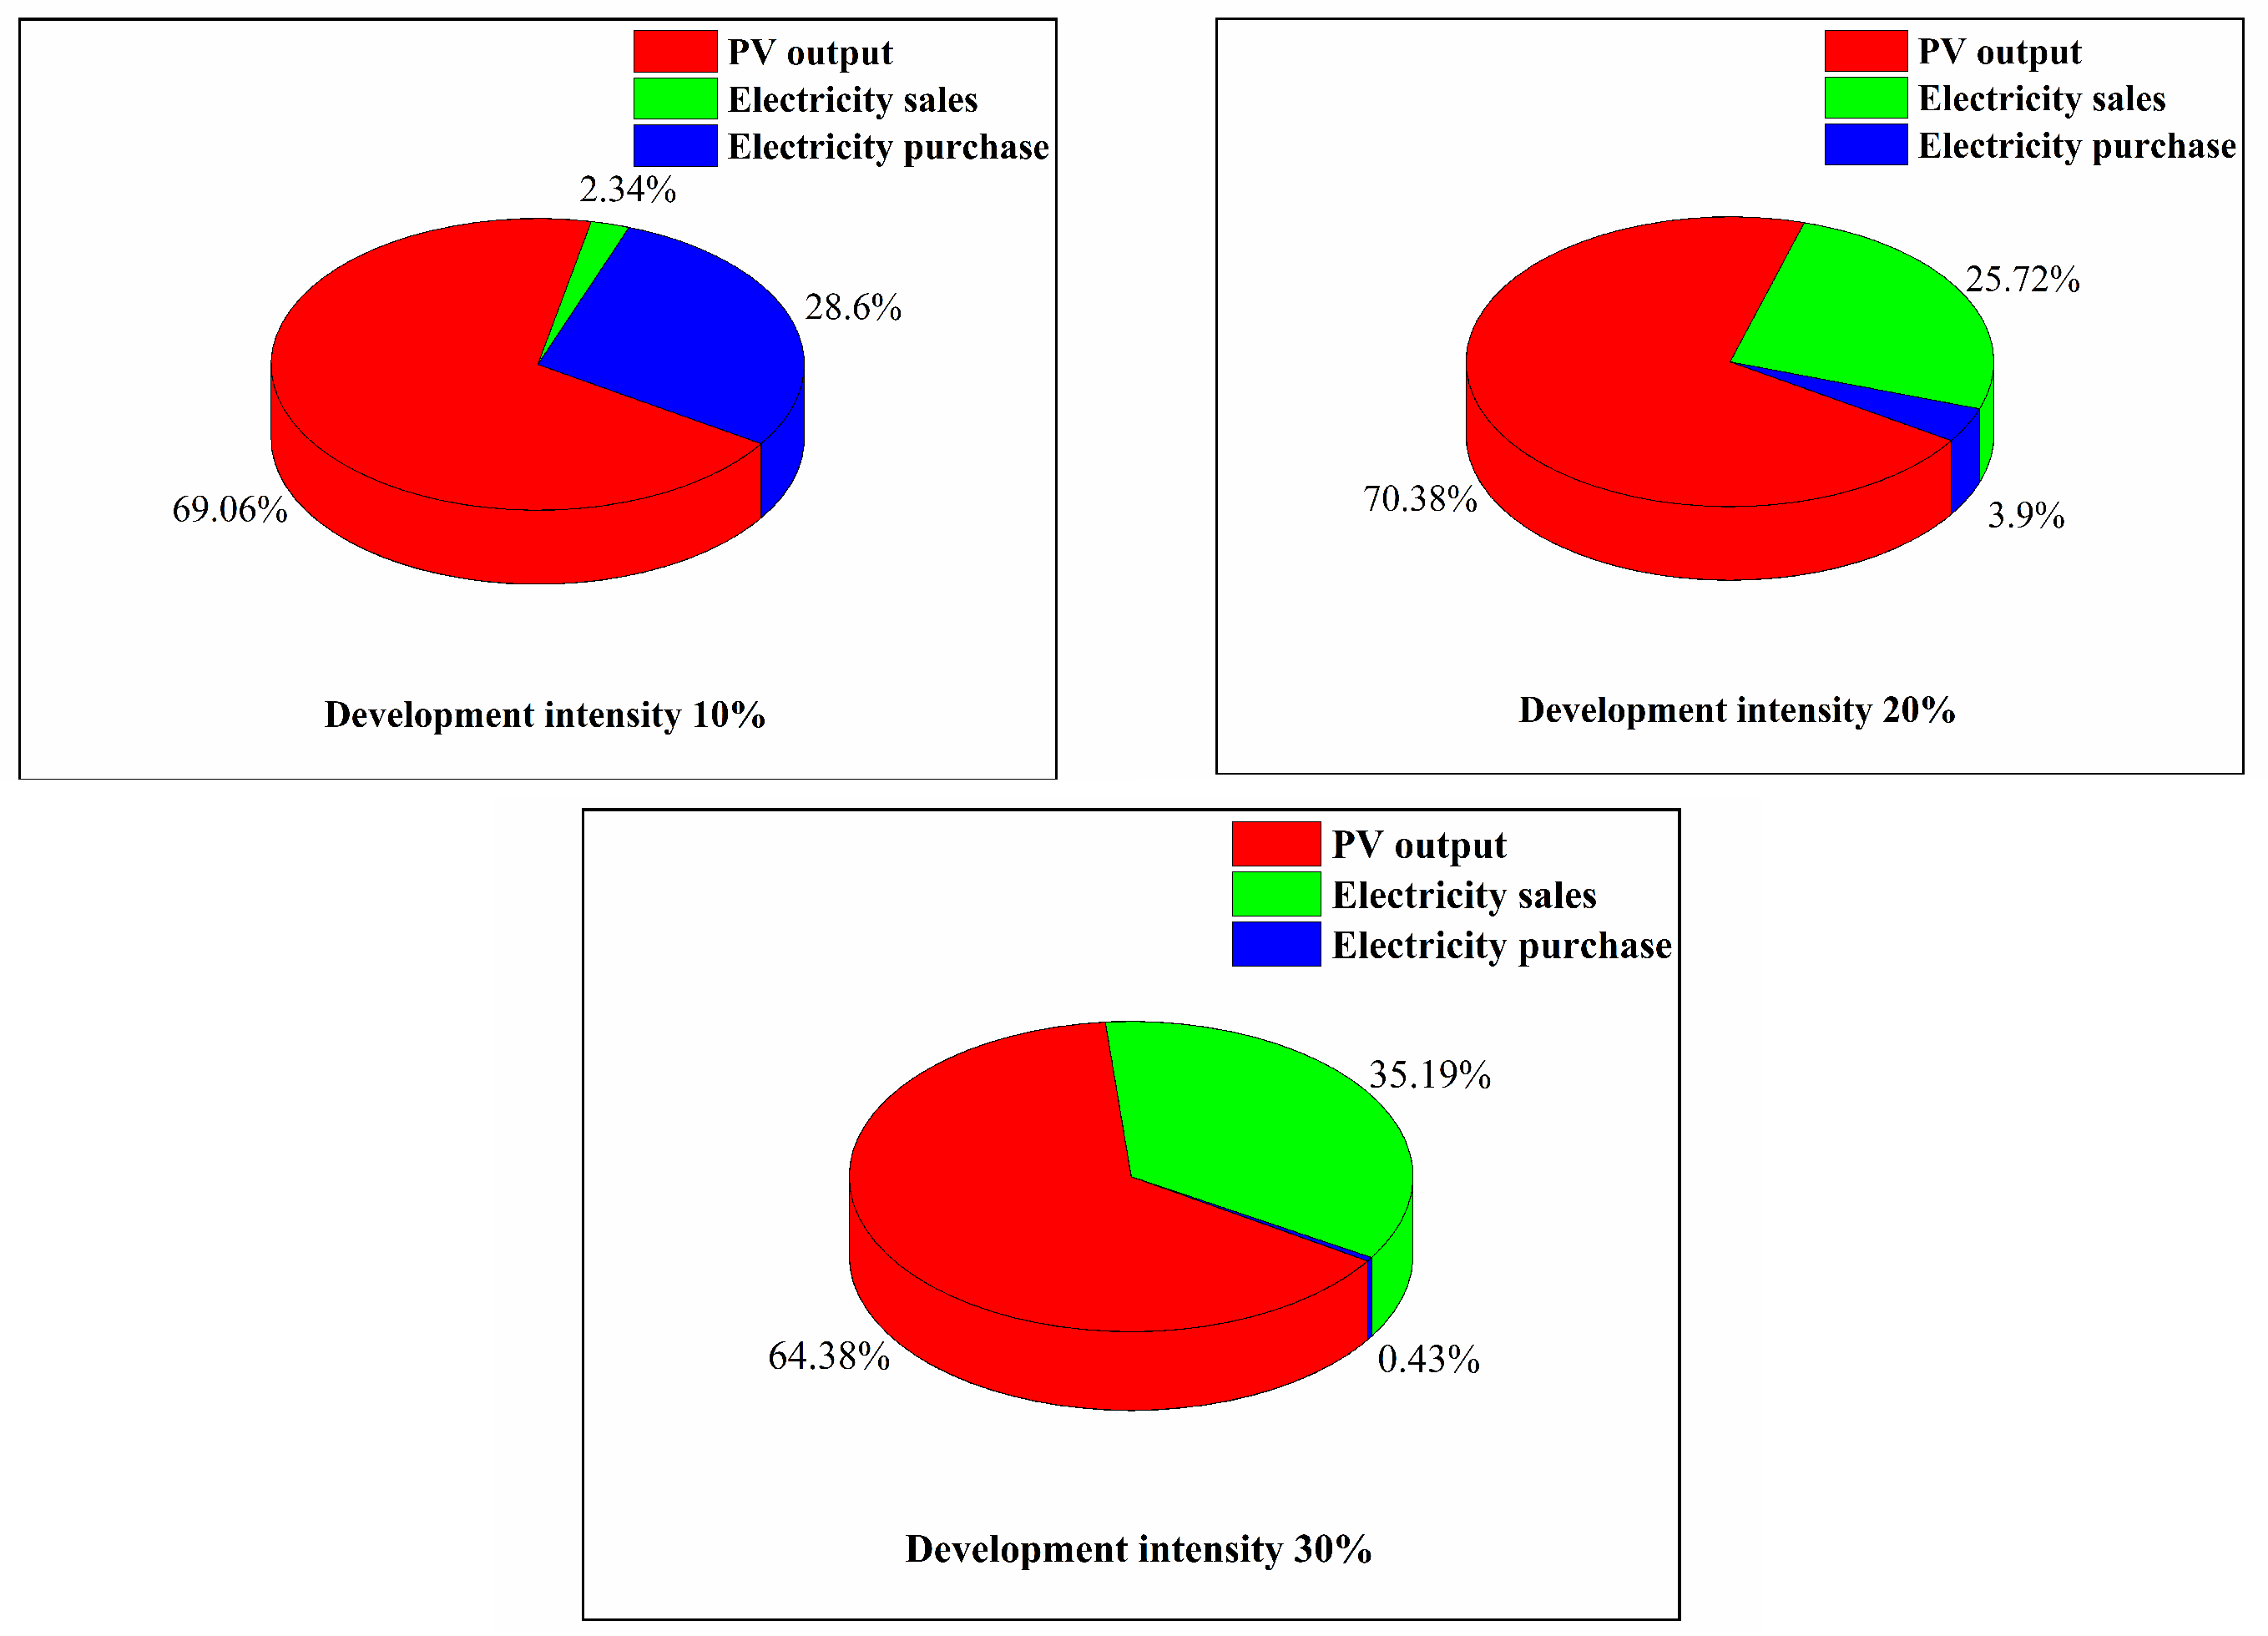
Figure 9 shows more intuitively that, as the development intensity increases, the energy structure of the railway system is constantly changing: the proportion of electricity purchases gets smaller, and the proportion of electricity sales gets larger.
5. Discussion
In addition to calculating the self-consistent rate of the railway system, we have performed calculations economically in terms of achieving energy savings and reducing emissions, including the annual electricity purchase, annual electricity sales, and annual emission reduction of the railway system under three different development intensities, as shown in Figure 10.
Figure 10 shows that the electricity purchased by the railway system in the 10% mode far exceeds the electricity sold, and the reverse is observed in the 20% mode. According to the policy issued by China in 2020, the unit price of selling electricity to the grid is 2.5 kWh/yuan, and the average price of electricity purchased from the grid is approximately 1 kWh/yuan. Therefore, the income from on-line electricity sales under three circumstances can be calculated as 505,000 yuan, 11.94 million yuan and 26.8 million yuan, and the electricity purchase cost is 16.926 million yuan, 4.53 million yuan, and 820,000 yuan.
In addition, we also compared the economic differences between PV power generation in the traditional sense and the microgrid model proposed in this paper. Under the three development intensities, the electricity cost savings of the microgrid mode is 75,000 yuan, 160,000 yuan, and 280,000 yuan. When the number of traction substations participating in dispatching increases, applying the microgrid and its dispatching strategy to the railway system has a significant economic effect.
6. Conclusions
Based on the actual situation in China, this paper determines the feasibility of railway system energization and then provides the new attributes of the railway system after transformation and the external factors influencing the PV system transformation of the railway system. In Section 3, we provide specific methods and potential methods for assessing the energization of the railway system. By combining the new attributes of the railway system with those previously analyzed, a linear microgrid group scheduling method is proposed. In Section 4, we took the first three tractions of the Hami section of the Urumqi high-speed rail of the Lanxin Line as an example and conducted a potential assessment. The results show that the PV potential in this area is large. In Section 5, we analyzed the economics and environmental protection of the case and showed the superiority of our proposed scheduling strategy by comparing with traditional methods.
The specific measures proposed in this paper for the energization of railway assets are particularly useful for the Midwest, where China is rich in solar energy resources. This provides a novel idea for solving China’s large energy demands as well as a feasible solution for the future electrification of railways. This method may also be relevant to other countries and regions that want to develop new energy transportation. The potential assessment method of railway asset energization proposed in this paper is based on the actual situation in China and considers the entire process, from PV output to load power consumption, providing a reference for similar research in the future.
Author Contributions
L.J. (Li Ji): conceptualization, project administration, formal analysis, methodology, visualization, writing—original draft, writing—review and editing. Z.Y.: investigation, data curation, resources, software, validation, writing—review and editing. J.M.: conceptualization, investigation, methodology, formal analysis, funding acquisition. L.J. (Limin Jia): investigation, methodology. F.N.: data curation and validation. All authors have read and agreed to the published version of the manuscript.
Funding
This research was funded by the “National Natural Science Foundation of China Project”, grant No. 51807188.
Acknowledgments
Authors are gratefully acknowledging the support by the “National Natural Science Foundation of China Project” (Grant No. 51807188).
Conflicts of Interest
The authors declare no conflict of interest.
References
- Devabhaktuni, V.; Alam, M.; Depuru, S.S.S.R.; Green, R.; Nims, D.; Near, C. Solar energy: Trends and enabling technologies. Renew. Sustain. Energy Rev. 2013, 19, 555–564. [Google Scholar] [CrossRef]
- Change 2014: Mitigation of Climate Change. Contribution of Working Group III to the Fifth Assessment Report of the Intergovernmental Panel on Climate Change; Report Intergovernmental Panel on Climate Change; Cambridge University Press: New York, NY, USA, 2014.
- The Future of Rail-Opportunities for Energy and the Environment; Report IEA; IEA: Paris, France, 2019.
- Cao, J. Electrified Railway Power Supply System; China Railway Press: Beijing, China, 1983. [Google Scholar]
- Power System Design Manual; Electric Power Planning Institute of the Ministry of Electric Power Industry: Beijing, China, 1998.
- Electrified Railway Design Manual: Traction Power Supply System; Electrification Survey and Design Institute of Electrification Engineering Bureau of Ministry of Railways: Beijing, China, 1998.
- Zhang, L.; Wenjie, L.; Lijun, X. Adverse effects of the traction load on electrified railways and treatment schemes. Power Syst. Technol. 2006, 196–198. [Google Scholar] [CrossRef]
- Global Energy Review 2020. The Impacts of the Covid-19 Crisis on Global Energy Demand and CO2 Emissionst; Report IEA; IEA: Paris, France, 2020.
- Alam, K.S.; Khan, T.A.; Azad, A.N.; Munasib, S.; Arif, K.N.H.; Hasan, A.; Kabir, A. Modeling and Computation of a Solar-Piezoelectric Hybrid Power Plant for Railway Stations. In Proceedings of the 2012 International Conference on Informatics, Electronics & Vision (ICIEV), Dhaka, Bangladesh, 18–19 May 2012; pp. 155–159. [Google Scholar]
- Sørensen, B. GIS management of solar resource data. Sol. Energy Mater. Sol. Cells 2001, 67, 503–509. [Google Scholar] [CrossRef]
- Hayashiya, H.; Itagaki, H.; Morita, Y.; Mitoma, Y.; Furukawa, T.; Kuraoka, T.; Fukasawa, Y.; Oikawa, T.; Furukawa, T.; Morita, Y.; et al. Potentials, peculiarities and prospects of solar power generation on the railway premises. In Proceedings of the 2012 International Conference on Renewable Energy Research and Applications (ICRERA), Nagasaki, Japan, 11–14 November 2012; pp. 1–6. [Google Scholar]
- Wang, L.; Hongwei, T.; Zhi, Z. Research on China’s solar photovoltaic power generation potential based on GIS platform. J. Shanghai Univ. Technol. 2014, 491–496. [Google Scholar] [CrossRef]
- Kim, S.; Lee, Y.; Moon, H.-R. Siting criteria and feasibility analysis for PV power generation projects using road facilities. Renew. Sustain. Energy Rev. 2018, 81, 3061–3069. [Google Scholar] [CrossRef]
- Vasisht, M.S.; Vashista, G.; Srinivasan, J.; Ramasesha, S.K. Rail coaches with rooftop solar photovoltaic systems: A feasibility study. Energy 2017, 118, 684–691. [Google Scholar] [CrossRef]
- Shukla, A.K.; Sudhakar, K.; Baredar, P. Design, simulation and economic analysis of standalone roof top solar PV system in India. Sol. Energy 2016, 136, 437–449. [Google Scholar] [CrossRef]
- Sharma, A.K.; Kothari, D.P. Solar PV potential for passenger ferry boats in India’s National Waterways. In Proceedings of the 2018 2nd International Conference on Inventive Systems and Control (ICISC), Coimbatore, India, 19–20 January 2018; pp. 120–130. [Google Scholar]
- Kilic, B.; Dursun, E. Integration of innovative photovoltaic technology to the railway trains: A case study for Istanbul airport-M1 light metro line. In Proceedings of the IEEE EUROCON 2017—17th International Conference on Smart Technologies, Ohrid, North Macedonia, 6–8 July 2017; pp. 336–340. [Google Scholar]
- Morita, Y.; Honda, M.; Kuraoka, T.; Fukasawa, Y.; Mitoma, Y.; Yoshizumi, H.; Hayashiya, H.; Morita, Y.; Honda, M. Analysis of local smoothing effect on the PV on Tokyo station. In Proceedings of the 2012 International Conference on Renewable Energy Research and Applications (ICRERA), Nagasaki, Japan, 11–14 November 2012; pp. 1–6. [Google Scholar]
- Jian, L.; Min, C. Application of Solar PV Grid-Connected Power Generation System in Shanghai Rail Transit. In Proceedings of the 2018 China International Conference on Electricity Distribution (CICED), Tianjin, China, 17–19 September 2018; pp. 110–113. [Google Scholar]
- Lv, T.; Dai, Y. China’s PV resource utilization evaluation and zoning development method research. Sci. Technol. Manag. Res. 2018, 38, 70–77. [Google Scholar]
- China Railway Yearbook; China National Railway Group Co., Ltd.: Beijing, China, 2018.
- China Photovoltaic Power Industry Development Report; China Economic Publishing House: Beijing, China, 2019.
- Railway Technical Management Regulations; China State Railway Group Co., Ltd.: Beijing, China, 2006.
- Yang, J. Solar Photovoltaic Technology and Application; Electronic Industry Press: Beijing, China, 2013. [Google Scholar]
- Qizhi, Z. Discussion on the application of solar photovoltaic technology in expressway. West. Transp. Sci. Technol. 2006, 50–53. [Google Scholar] [CrossRef]
- Manna, T.K.; Mahajan, S.M. Nanotechnology in the Development of Photovoltaic Cells. In Proceedings of the 2007 International Conference on Clean Electrical Power, Capri, Italy, 21–23 May 2007; pp. 379–386. [Google Scholar]
- Fan, J.; Zheng, Q.; Jingyi, W. Research on power attenuation and service life of PV modules based on damp heat test. Comput. Meas. Control 2019, 249–253. [Google Scholar] [CrossRef]
- Raval, R.; Choubey, S. Calculation and modeling of hybrid power generation system using solar energy. In Proceedings of the 2017 International Conference on Intelligent Sustainable Systems (ICISS), Palladam, India, 7–8 December 2017; pp. 767–772. [Google Scholar]
- Song, W.; Feng, X. Electric Traction AC Drive Control and Modulation Technology; Science Press: Beijing, China, 2014. [Google Scholar]
Figure 1.
Cross-distribution layout of railway lines and solar energy resources in China: (a) electrified railway and (b) nonelectrified railway.
Figure 1.
Cross-distribution layout of railway lines and solar energy resources in China: (a) electrified railway and (b) nonelectrified railway.

Figure 2.
General architecture of photovoltaics (PV) energization method of China’s railway systems.
Figure 2.
General architecture of photovoltaics (PV) energization method of China’s railway systems.

Figure 3.
Equivalent figure of PV arrangement for different railway directions: (a) north–south railway arrangement; (b) east–west railway arrangement.
Figure 3.
Equivalent figure of PV arrangement for different railway directions: (a) north–south railway arrangement; (b) east–west railway arrangement.

Figure 4.
Schematic diagram of energy storage configuration.

Figure 5.
Flow chart of power deficit calculation.

Figure 6.
The optimal inclination of the traction substation and the average light intensity along the railway.
Figure 6.
The optimal inclination of the traction substation and the average light intensity along the railway.

Figure 7.
Annual calculation results in different traction substation.

Figure 8.
Monthly measurement results in different traction substation.

Figure 9.
Comparison of PV output, electricity sales, and electricity purchase in different.

Figure 10.
Electricity purchase, electricity sales and emission reduction under three development intensity.
Figure 10.
Electricity purchase, electricity sales and emission reduction under three development intensity.


Table 1.
The length of electrified and nonelectrified railway lines in the four solar energy resource regions in China.
Table 1.
The length of electrified and nonelectrified railway lines in the four solar energy resource regions in China.
| Solar Energy Resource Region | Electrified Railway (km) | Nonelectrified Railway (km) |
|---|---|---|
| I | 1075 | 1894 |
| II | 31,489 | 12,814 |
| III | 57,182 | 20,179 |
| IV | 12,331 | 1860 |
Table 2.
Annual load, photovoltaic output, and self-consistency rate of the measured traction substation.
Table 2.
Annual load, photovoltaic output, and self-consistency rate of the measured traction substation.
| Energy Requirement (GWh) | PV Output (GWh) | Self-Consistent Rate (%) | |||||||
|---|---|---|---|---|---|---|---|---|---|
| Development Intensity | Development Intensity | Development Intensity | |||||||
| Traction Substation | 10% | 20% | 30% | 10% | 20% | 30% | 10% | 20% | 30% |
| 1 | 18.82155 | 18.82155 | 18.82155 | 13.48748813 | 26.97497626 | 40.46246439 | 69.9177117 | 91.8514192 | 98.4436697 |
| 2 | 18.82155 | 18.82155 | 18.82155 | 13.62435336 | 27.24870672 | 40.87306007 | |||
| 3 | 18.82155 | 18.82155 | 18.82155 | 13.75044969 | 27.50089937 | 41.25134906 | |||
© 2020 by the authors. Licensee MDPI, Basel, Switzerland. This article is an open access article distributed under the terms and conditions of the Creative Commons Attribution (CC BY) license (http://creativecommons.org/licenses/by/4.0/).
Share and Cite
MDPI and ACS Style
Ji, L.; Yu, Z.; Ma, J.; Jia, L.; Ning, F. The Potential of Photovoltaics to Power the Railway System in China. Energies 2020, 13, 3844. https://0-doi-org.brum.beds.ac.uk/10.3390/en13153844
AMA Style
Ji L, Yu Z, Ma J, Jia L, Ning F. The Potential of Photovoltaics to Power the Railway System in China. Energies. 2020; 13(15):3844. https://0-doi-org.brum.beds.ac.uk/10.3390/en13153844
Chicago/Turabian StyleJi, Li, Zhenwei Yu, Jing Ma, Limin Jia, and Fuwei Ning. 2020. "The Potential of Photovoltaics to Power the Railway System in China" Energies 13, no. 15: 3844. https://0-doi-org.brum.beds.ac.uk/10.3390/en13153844
Note that from the first issue of 2016, this journal uses article numbers instead of page numbers. See further details here.