1. Introduction
The world needs energy. During the next 15 years, the demand for electricity will grow by at least 20% [
1]. In this context, the problem is in which way to produce it, since there are different ways, with different environmental consequences.
Coal is perceived as the worst energy carrier, due to the large emissions of carbon dioxide, the most important gas contributing to the greenhouse effect. However, it represents 38.3% of the world’s gross electricity production (all non-renewables account for 64.5%). Second place is renewable sources of energy, at 26.5%. Third place is nuclear power, at 10.2% [
2]. Importantly, while fossil fuels and nuclear energy markets are shrinking, renewable sources of energy are gaining popularity.
Clean renewable energy is already a huge part of the market, which means it provides jobs for millions of people. According to the UNDP, the renewable energy sector in 2017 employed as many as 10.3 million people [
3].
Renewables are also very strongly supported by the United Nations. Among 17 Sustainable Development Goals, introduced by the UN in 2015, one is especially important, Goal No. 7 (“Affordable and Clean Energy”), which means not only better energy efficiency but also using as much renewables as possible [
3]. It is in compliance with the European Union legislation. By 2030, as much as 32% of energy of the member states is supposed to be produced from renewables [
4], which is further supported by the “European Green Deal Investment Plan” providing 1 trillion Euro for investments in renewable energy [
5].
One of the most important renewable sources of energy is solar power. In 2017, it was delivering 219 GW of energy [
6], but the potential is much bigger.
Apart of the biggest projects, such as The Tengger Solar Park in China with output of 1547 MW [
6], small installations also matter [
7]. Small scale solar installations are important from the perspective of energy security. They are producing electricity on the local level, thus—in association with battery energy storage systems—are immune to damages which may occur to long range power lines (for example, as a consequence of natural disasters, such as hurricanes). Moreover, as prosumers, people may produce electricity for their own purposes, independent of the official network. They also fulfill other requirements of energy security, introduced by the Word Bank in 2005, according to which energy may be produced from renewables “at reasonable cost in order to: facilitate economic growth and, though this, poverty reduction and directly improve the quality of peoples’ lives by broadening access to modern energy services” [
8].
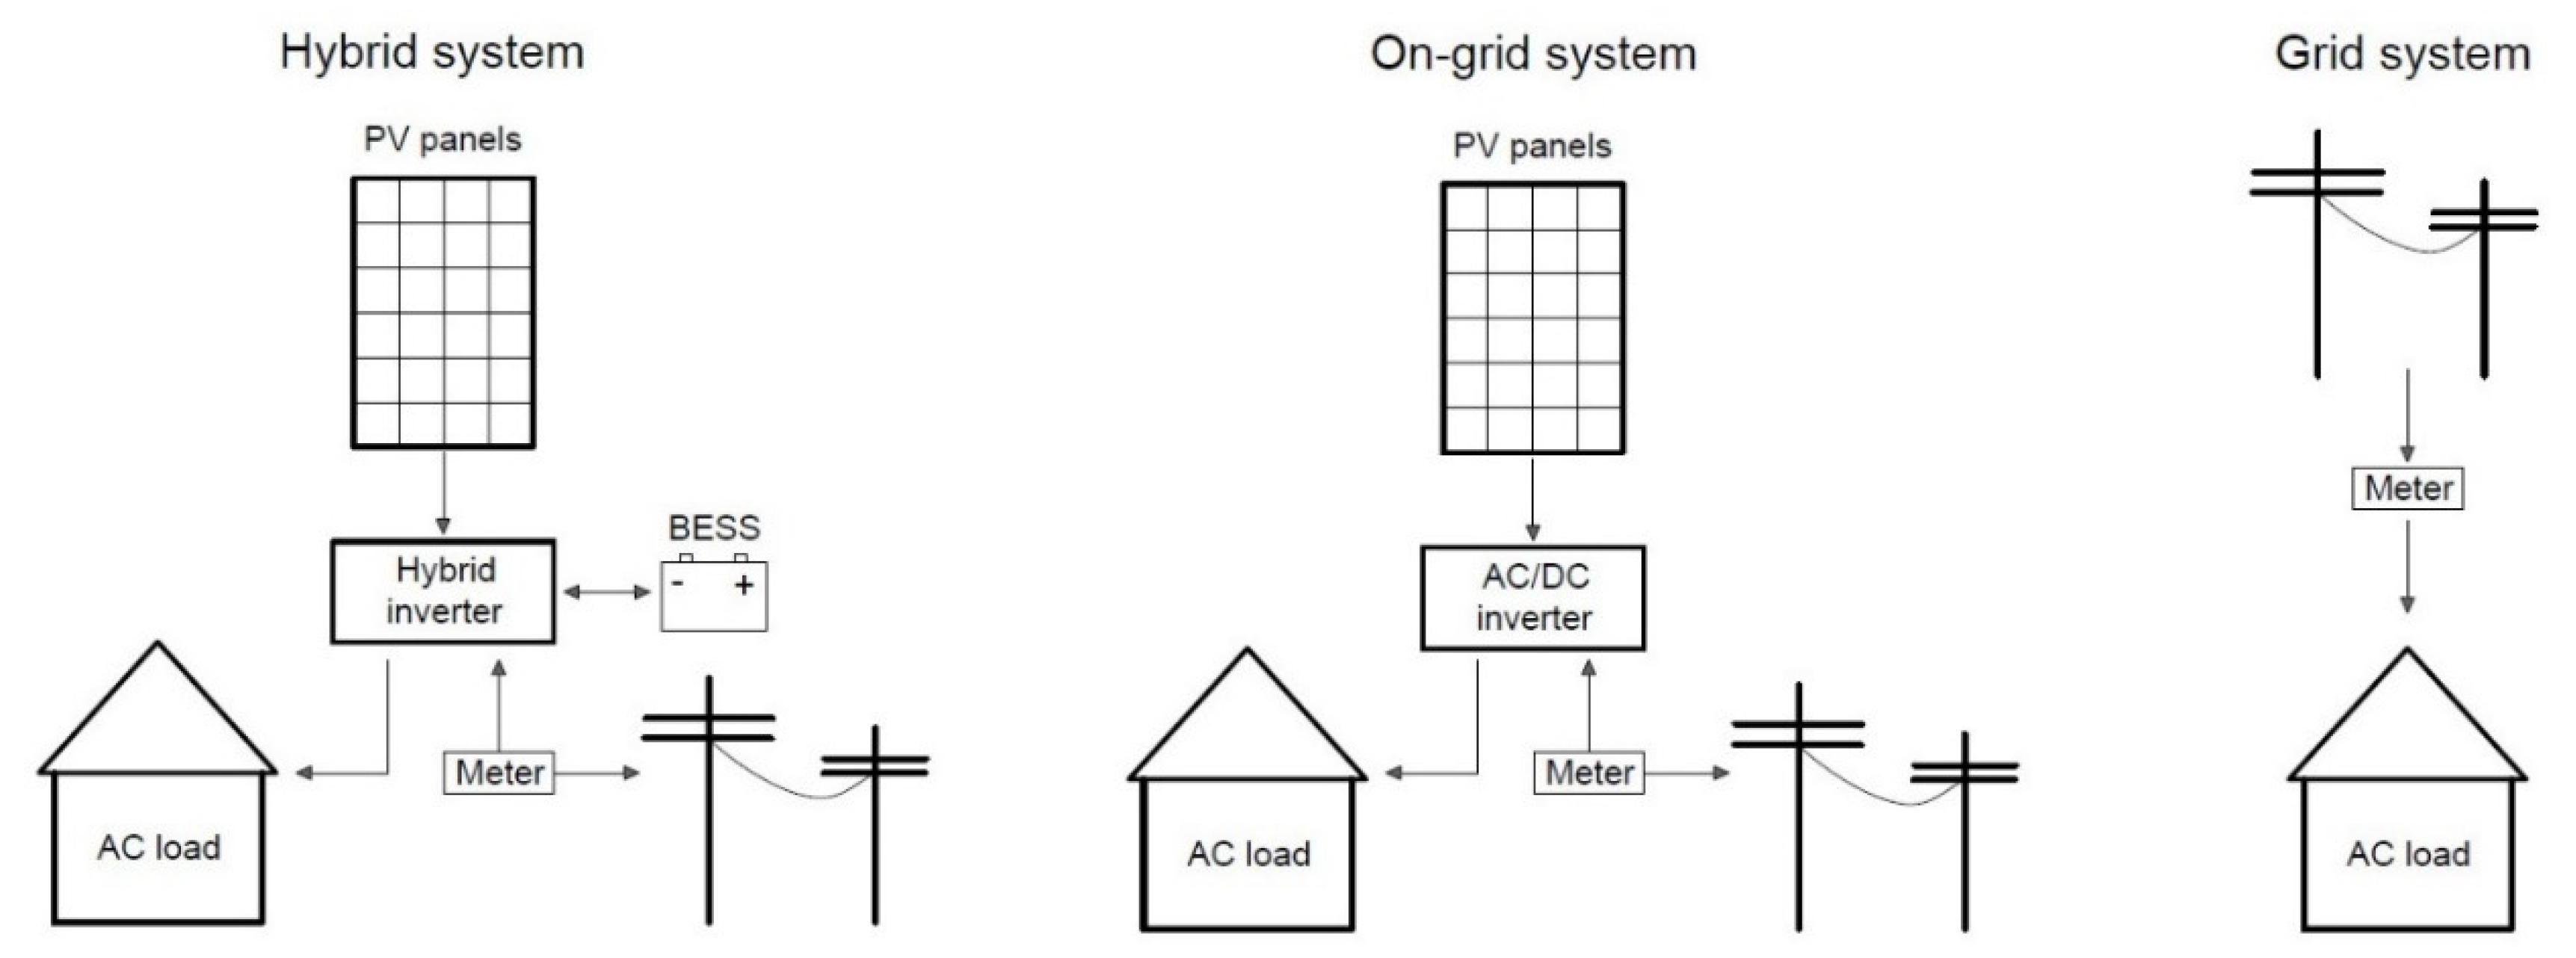
The most common photovoltaic systems used by individual users and businesses are the installations connected to the public electricity grid (on-grid). The systems not connected to the grid (off-grid), containing batteries, are deployed mainly in remote areas where there is no access to the electricity grid. Hybrid systems combine both solutions as they are based on the on-grid installation but they also take advantage of battery storage and can thus provide electric energy, e.g., at night or during a blackout.
The most used energy storage devices for photovoltaic off-grid or hybrid systems are lead acid batteries, which are the oldest technology of this type, invented in mid-19th century, and lithium-ion batteries, commercially available from 1991.
Lead acid batteries are classified into wet flooded (FLA) and outperforming them valve regulated VRLA devices which either use gelled electrolyte (GEL) or glass microfiber separator AGM. The lead acid batteries consist of Pb and PbO
2 plates and H
2SO
4 electrolyte. Their affordable cost of 200–300
$/kWh (approximately 180–270 €/kWh), mature production technology and recyclability over 95% influence their popularity in the market [
9,
10]. However, the disadvantages of this electrochemical technology are low useable capacity (30–50% of the nominal capacity), lifetime between 3 and maximum 10 years, low number of lifecycles of 300–500 at 80% depth of discharge, low specific energy of 30–50 Wh/kg, 85% charge/discharge efficiency and ageing factor of 0.1 per year [
9,
11,
12].
Lithium-ion batteries differ in construction compared to lead acid devices and can have a variety of electrode materials. Exemplary batteries in which the anode is made from graphite have different names depending on the cathode material e.g., lithium manganese oxide (LMO) and lithium nickel cobalt aluminium oxide (NCA). The performance of Li-ion batteries is much better than for lead acid batteries, especially in terms of lifetime (15–25 years), lifecycle (1000–20,000) depending on electrode material at 100% of depth of discharge and specific energy (100–250 Wh/kg). The advantages also include charge/discharge efficiency of 91–97% and annual ageing factor of 0.04–0.07 [
11,
13,
14].
Lithium-ion batteries are promising substitutes for lead acid energy storage devices. The limitation is the price, up to 600
$/kWh (530 €/kWh) depending on electrode material [
9]. However, a drop of 85% has been observed since 2010, reaching 200
$/kWh (180 €/kWh) in 2019 and a further decline in manufacturing cost up to 100
$/kWh (90 €/kWh) by 2030 is expected [
15,
16].
In general, to extend the lifespan of batteries and use them safely, proper mounting and sometimes technical services are required. A charge controller is necessary to monitor the state of the battery and prevent from operating under or over safe values of parameters such as current, voltage and temperature. Technical assistance is not needed for lead acid GEL, AGM and Li-ion batteries since they are considered as maintenance-free during normal operation.
Common uses of batteries, not only in PV systems, imply the demand for various materials that compose electrodes, electrolytes, current collectors and separators. Lead, which is the key material in lead acid batteries, occurs naturally in relatively abundant minerals and can also be recovered from spent batteries. Secondary lead production exhibits an increasing trend and in 2018 accounted for 60% of total lead production [
17]. However, both extraction and recycling of lead have negative impact on people and environment for the high toxicity of this element. Even though secondary production is effective, improvements in recycling plants are necessary to limit harmful emissions [
18].
Lithium-ion batteries contain less hazardous materials than other energy storage devices. There is no shortage of lithium and it is relatively cheap, similarly, the graphite that serves as anode material is highly abundant. The most expensive element used in batteries of this type is cobalt, the mining of which also arises ethical issues. In recent years, recycling technology of Li-ion batteries has been driven and developed mainly by boom in the electric vehicles and portable electronics. The introduction of green chemistry methods is expected to contribute in recovering of 9% of total lithium supplied for batteries in 2025 [
19], almost 20% of cobalt and some other valued battery components such as manganese, aluminum and the organic solvents of the electrolyte. Additionally, application of new technologies will enable lowering the recycling cost.
Although battery energy storage systems are quite expensive, hybrid installations occur in the market because of the selected criteria. First, they ensure the reliability of energy supply and may be used for securing its continuity. Furthermore, they may contribute to managing customer load, reducing the connection power and stabilizing the grid parameters [
20].
The purpose of the research presented in this paper is to determine the broad characteristic of environmental, economic and technical aspects connected with the lifecycle-focused perspective of utilization of hybrid PV system. The article focuses on an on-grid 3.05 kW PV system model with energy storage (hybrid system, HS) and without energy storage (on-grid system, OGS), compared to grid electricity (GS). In the executed analysis, the main technical, environmental and economic issues are discussed to determine the technological areas of competitiveness of grid-connected PV system with battery energy storage.
2. Materials and Methods
In the following section, the assumptions for modeling as well as methods used for calculation of indicators used as criteria of assessment are characterized. The included options of energy supply systems are presented in
Figure 1.
2.1. PV Systems
Two basic options of photovoltaic system were designed to be applied in the considered consumption models. For both options, 10 single-crystalline PV modules with the efficiency of 18.6% and peak power equal to 305 W (LG305N1C-G4, LG Electronics Inc., South Korea) were used. In on-grid system (OGS), standard Fronius Symo 3.0-3-S inverter (Fronius International, Austria) with dimensioning factor 108.8% and efficiency 97.7% was used. In hybrid system, the inverter with additional charge regulator and battery energy storage system (Fronius Symo Hybrid 3.0-3-S + BYD B-Box Premium HVM 11.0) providing approximately 24 h of autonomy were applied. In both cases, the production of electricity was modeled in PV*SOL software (Valentin Software GmbH, Germany) within the use of 1-min time step in modeling. The PV system is located in Lublin, Poland (22°34′ E, 51°14′ N), with inclination −40° and orientation 180°.
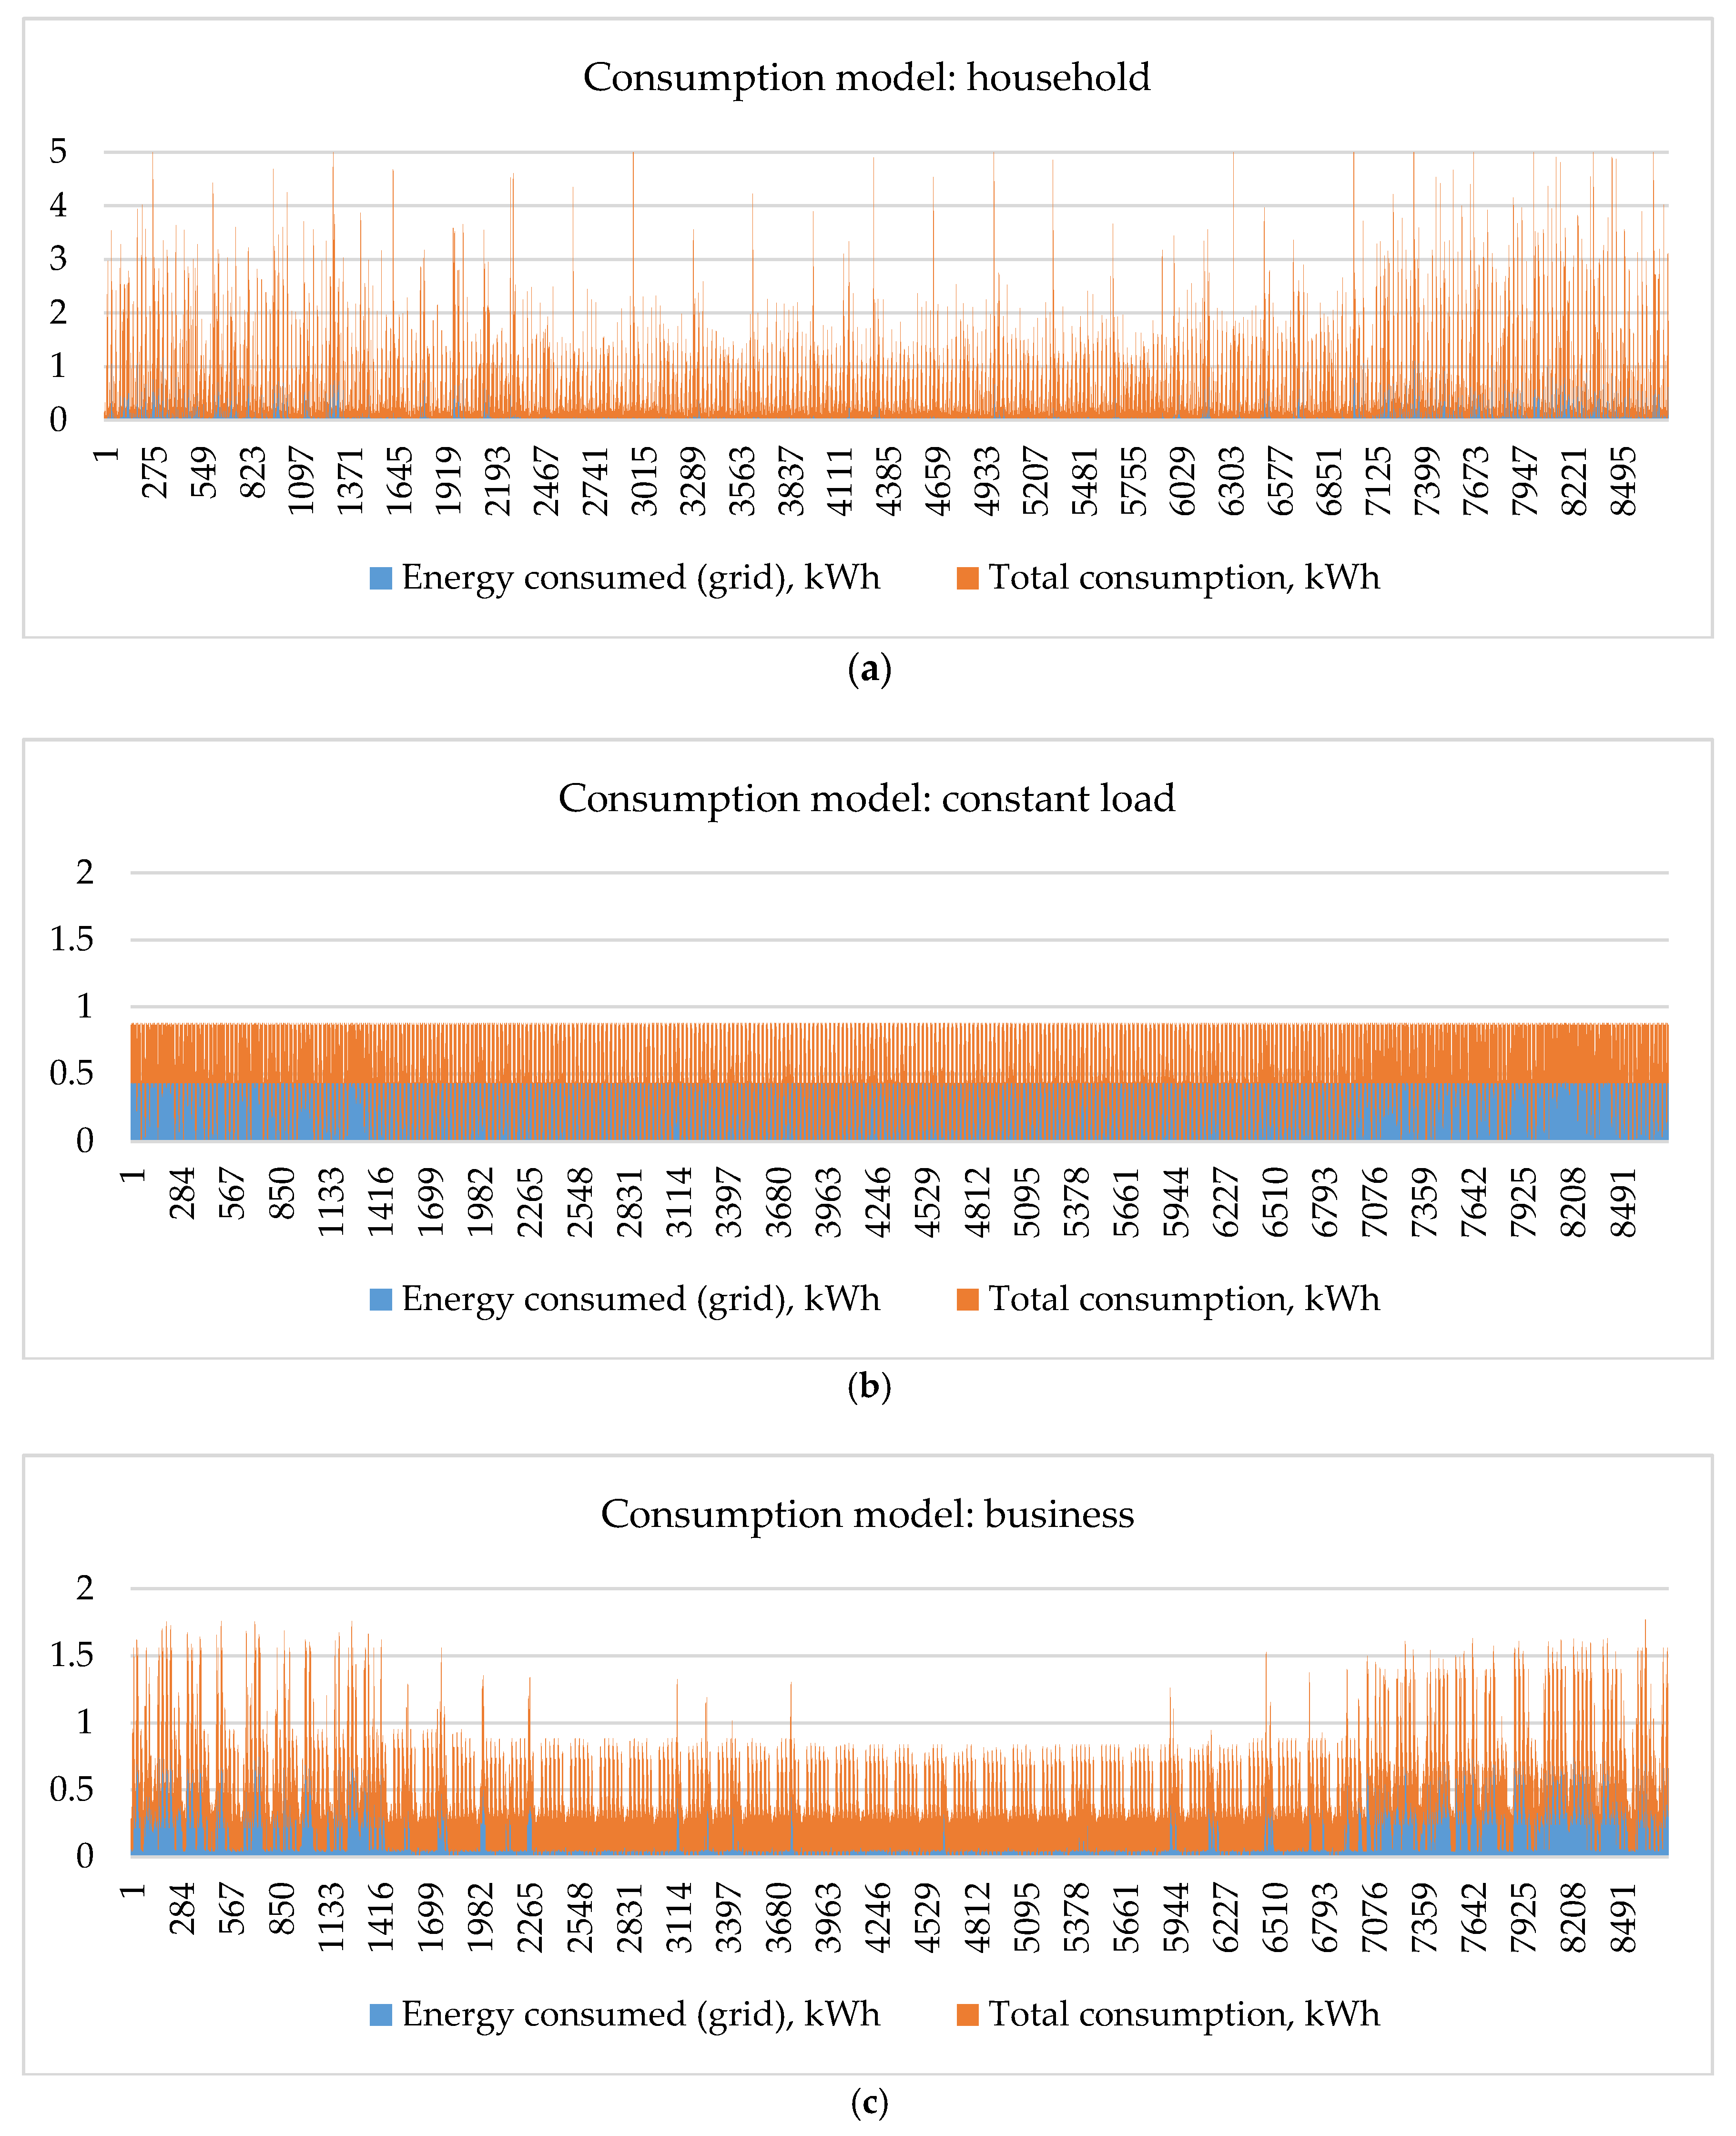
2.2. Electricity Consumption
The models of energy supply systems were based on the statistical electricity demand [
21] equal to 3797 kWh (arithmetic average for one year, expressing the electricity consumption in households, including agricultural activities). The profiles of energy consumption are presented in
Figure 2.
The three applied consumption models are presented in
Table 1. The first model (household) includes typical domestic consumption of energy by four family members, where the consumption is dependent on both season and time of day. Constant load means theoretical model including the regular load with only small fluctuations. Business consumption model was an average of various profiles of businesses’ loads and was implemented into the analysis to provide the base for comparing the possible applications. All profiles were implemented in PV*SOL and based on measured values.
In the detailed model, the breaks in energy supply were included. Polish electrical grid is mostly built as overhead network, with high proportion of outdated sections. According to the statistics of Polish Power System [
22], the two main indicators, System Average Interruption Duration Index (SAIDI) and System Average Interruption Frequency Index (SAIFI), equal 172.18 min and 0.29 break/consumer, respectively. These data were introduced into the model for the 30-year operation of power supply systems, assuming that, during the breaks, on-grid system is off because of security issues.
2.3. Energy Balance
Modeling of PV systems operation in PV*SOL resulted in 3399 kWh of annual yield, while the global horizontal solar irradiation was equal to 1114.1 kWh/m
2. Reindel model was used for calculation of scattered radiation, while the Hay and Davies model was used for radiation per inclined plane. Other assumptions included 0.5% loss by bypass diodes, 1% loss by deviation from the standard spectrum, 2% loss by mismatch and 20% annual albedo. The implemented model included various efficiencies of inverters operating in different modes, the drop of solar panel efficiency and self-discharge of batteries according to the producers’ data, as well as the self-consumption of energy by the elements of the system. Therefore, the data on energy balance over the 30-year period presented in
Table 2 include the differences connected with the energy losses and own consumption of analyzed scenarios.
2.4. Modeling of Systems’ Lifecycle
The time perspective for the balancing of the examined systems was 30-year lifespan, typical for the LCA of PV systems [
23]. During the mentioned period, batteries and inverters need to be replaced every 15 years, based on producers’ and literature data [
24,
25]. Additional service included washing of panels with distilled water. End-of-life scenario predicted the recycling of batteries (23% of impact minimization caused by iron reuse) [
26] and PV panels (mechanical process of the extraction of the remaining materials—80%, with 70% criterion of reuse in PV panels), which allowed minimizing the environmental impact of the entire studied system [
26].
The functional unit used in this study, i.e., the platform for normalization of all the data included in LCA, was 1 kWh of energy used by the analyzed systems. This means that the functional units for HS and OGS include some specific proportions of energy generated by PV system and supplied from grid, depending on the consumption model (
Table 2), while, for the GS reference system, only the process of electricity supply by low voltage grid is used.
For LCA modeling, SimaPro v 8.1.13 (PRé Consultants B.V., Amersfoort, The Netherlands) with the Ecoinvent v3 database was applied. Lifecycle inventory was based on the detailed scheme of systems as well as the energy balance and end-of-life scenarios based on literature recommendations [
23,
24,
25,
26].
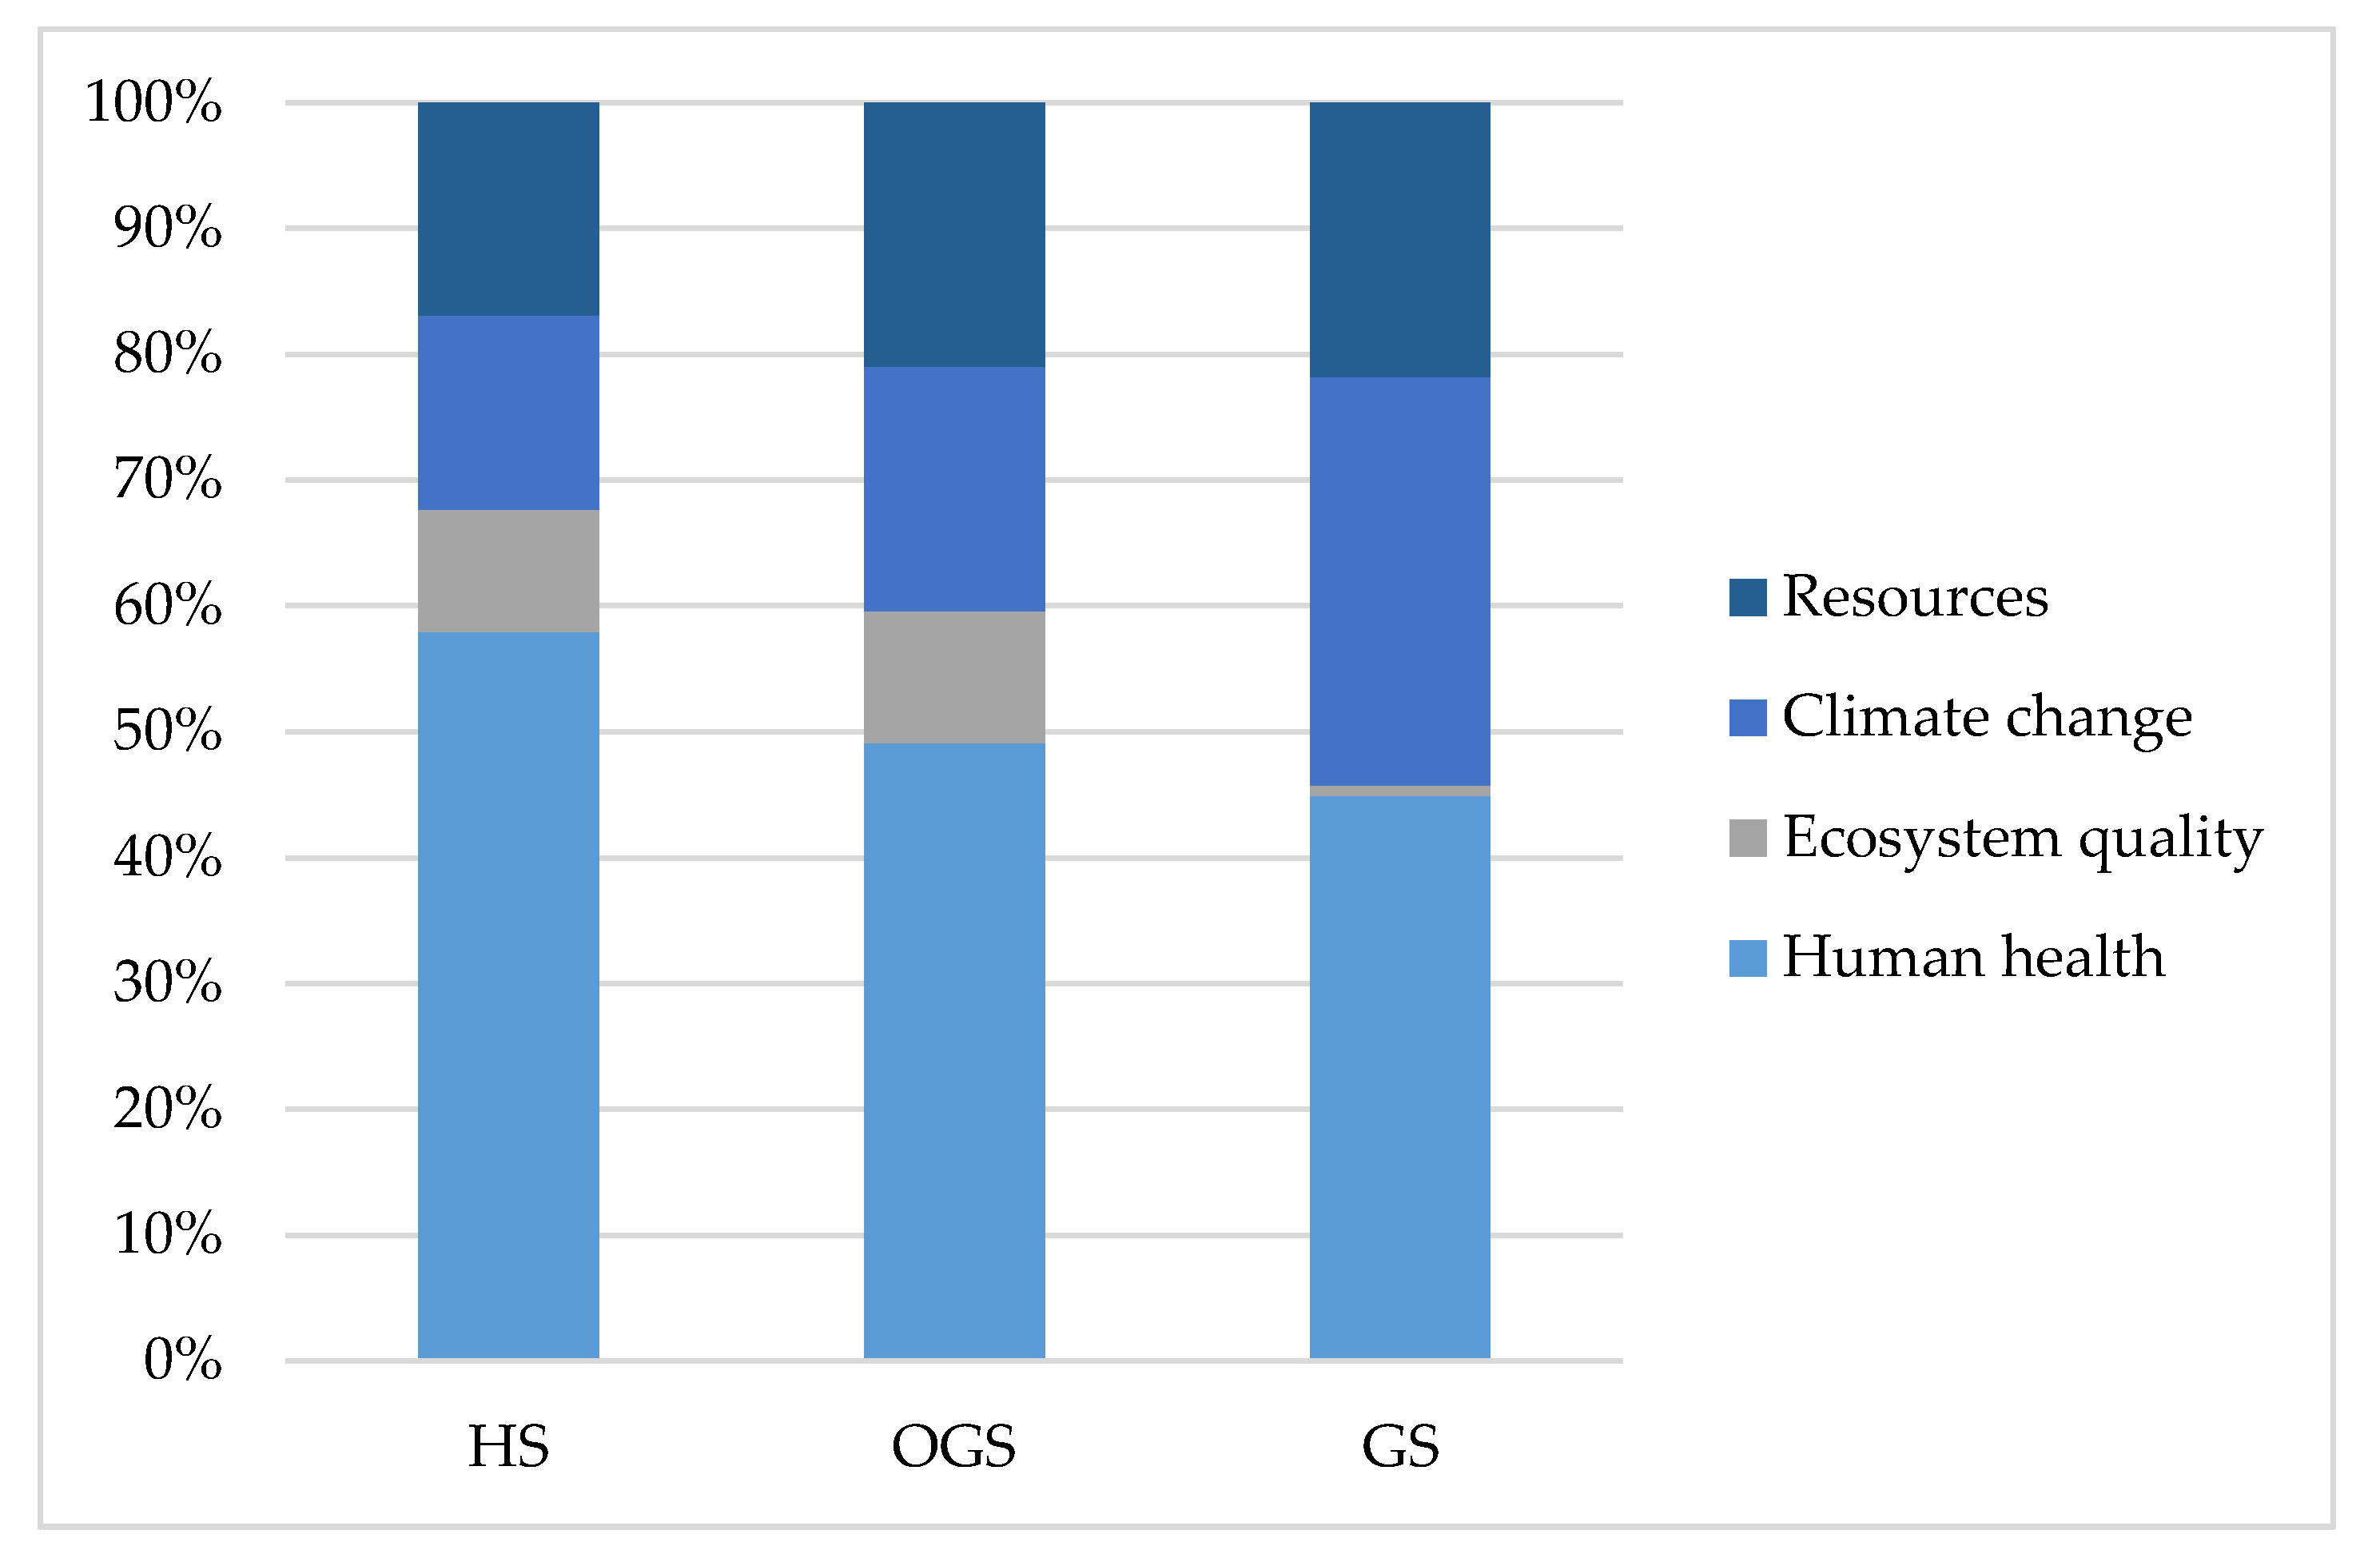
2.5. Methods for Environmental Criterion Assessment
Environmental criterion assessment was based on lifecycle impact assessment methods. To accomplish the broad perspective of the assessment, IMPACT 2002+ method was used as the first environmental criterion (IMPACT). This method allows linking all types of lifecycle inventory results via several midpoint categories into four main damage categories: human health, ecosystem quality, climate change and resources. The final results, expressed in “points” (Pt), are equal to “pers·y”, and, due to the used normalization factors, represent the average impact in a specific category caused by a statistical European [
27].
In general, the greater is the environmental impact, the higher is the indicator calculated by this method. Therefore, in the multicriteria analysis, the best option is the one with the lowest IMPACT parameter.
In the context of climate change, global warming potential method in 100 years perspective (IPCC 2013: GWP 100a) was used as the second environmental criterion (GWP). This method is based on inventory of emissions to the atmosphere, where the reference substance is the main greenhouse gas, carbon dioxide. Any emissions considered as potentially affecting climate balance in this context are recalculated into the equivalent of CO
2 by the use of the characterization factors (kg
CO2eq/kg
emission) [
28]. Again, in the multicriteria analysis, the most desirable result is the one with the lowest GWP parameter.
2.6. Methods for Economic Criterion Assessment
To perform the economic assessment, the investment costs of installation as well as operation and maintenance (O&M) costs were estimated under the Polish conditions and are presented in
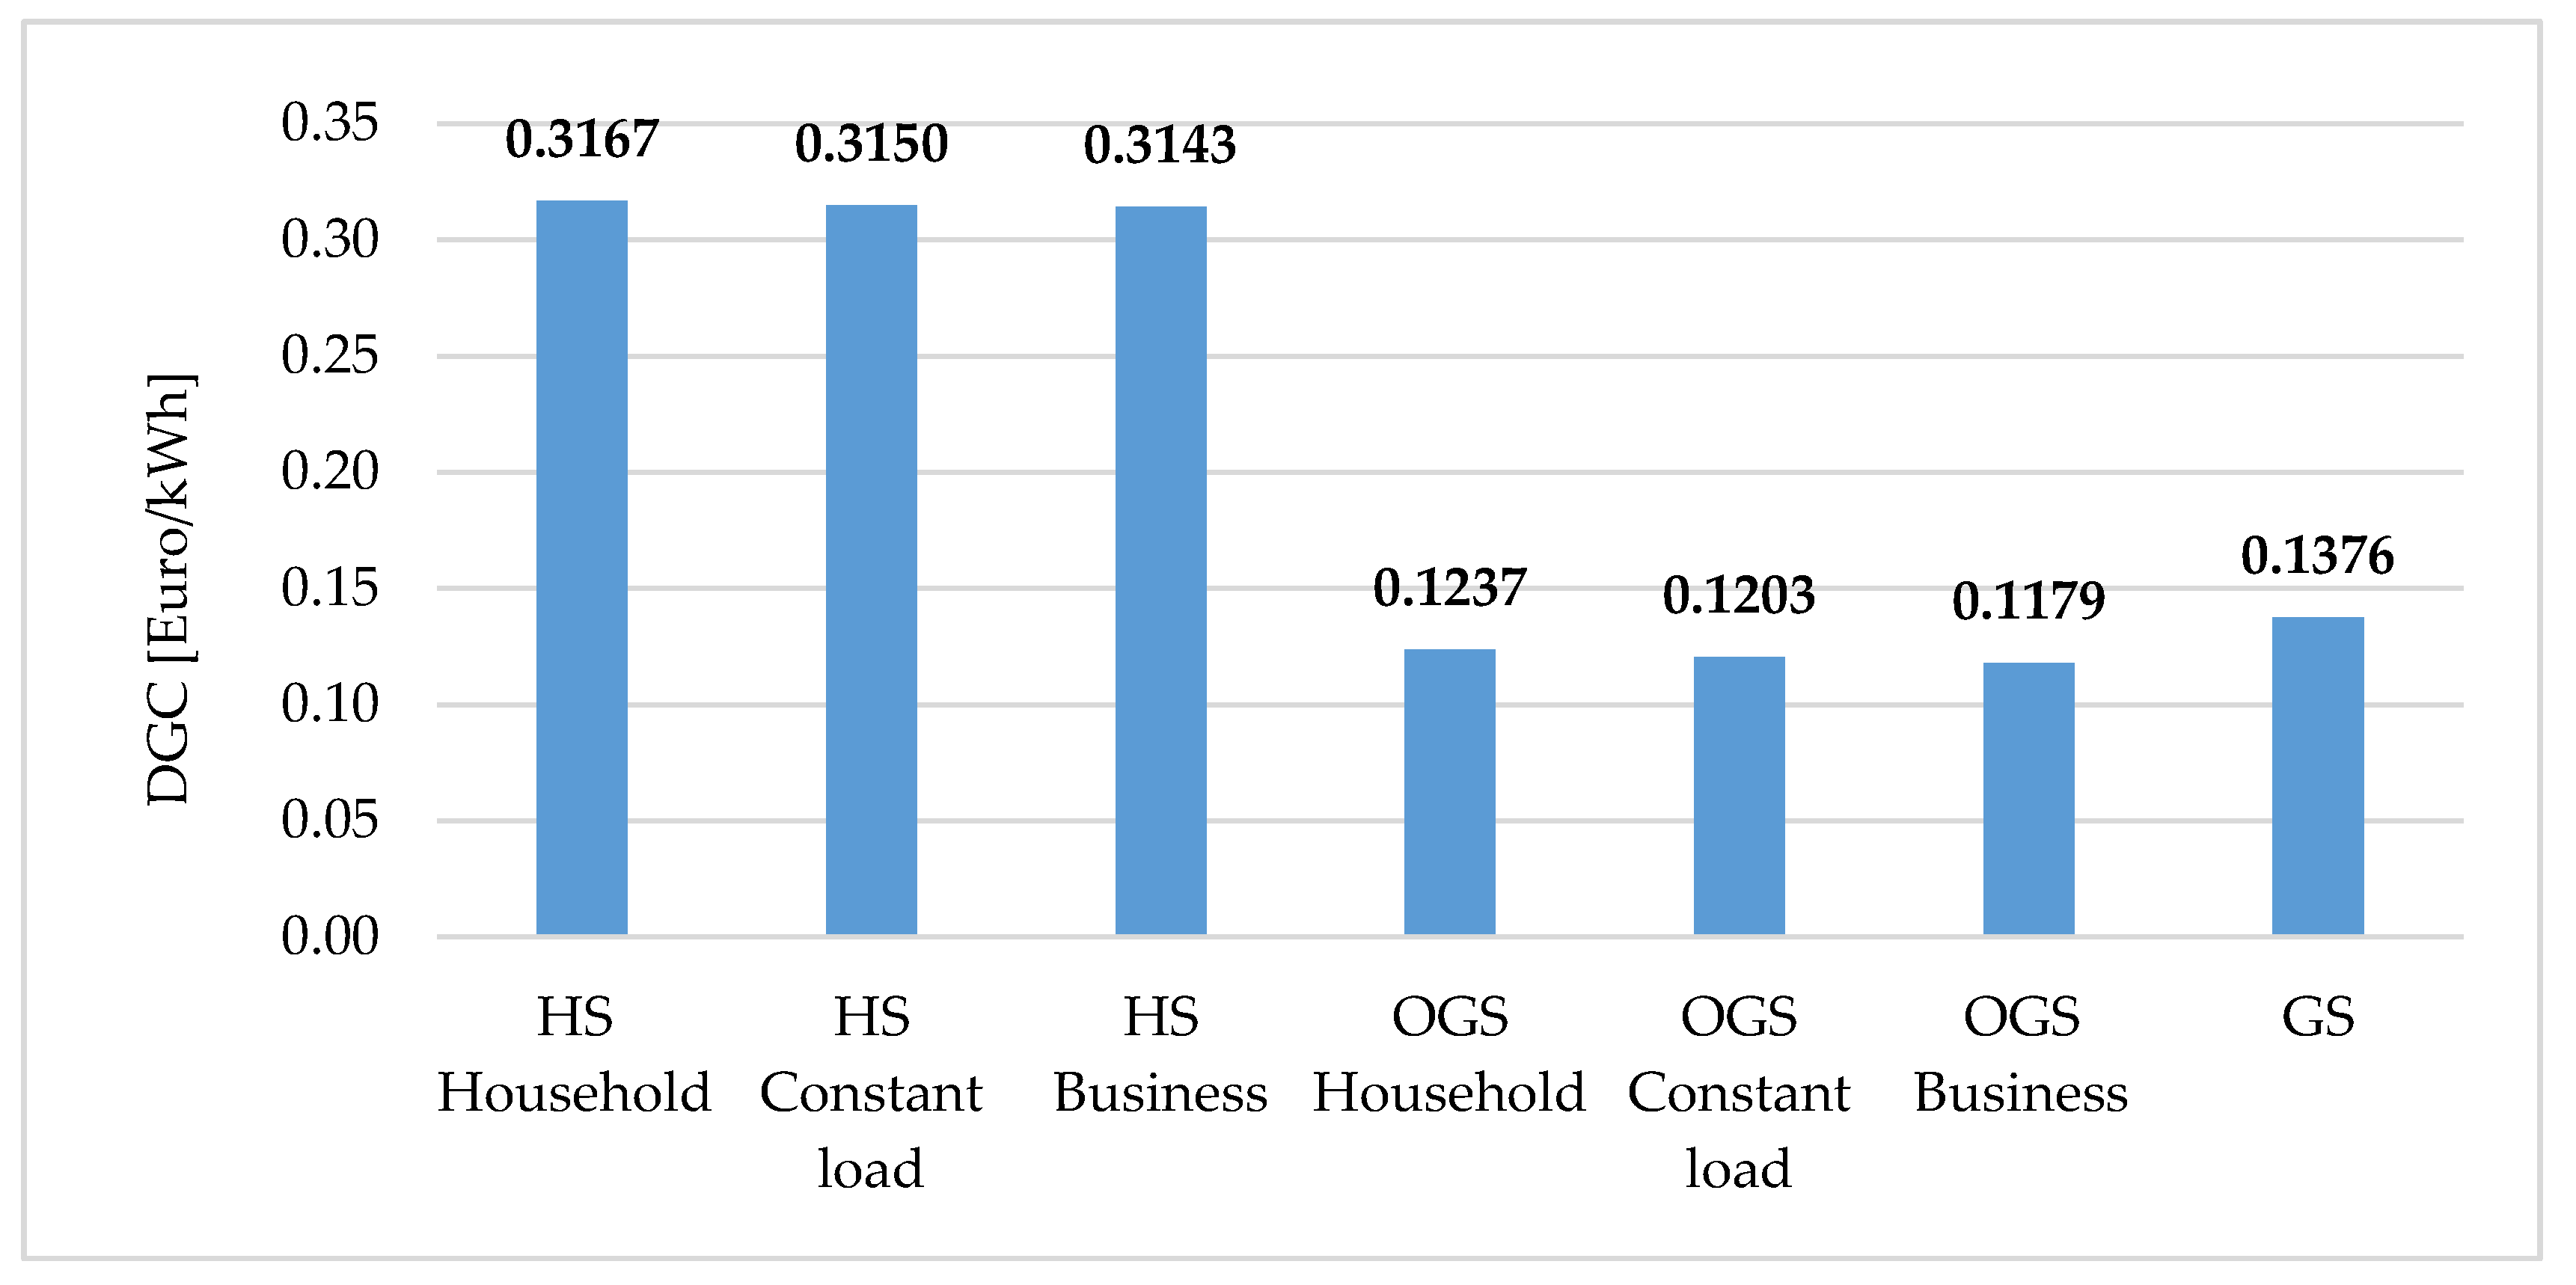
Table 3. The investment cost in the economic assessment is treated as an additional cost of PV installation—costs of the basic energy installation are the same for all cases and were not included in the valuation. Thus, the investment cost for the grid system (GS) case was assumed as 0 Euro. The average cost of 1 kWh from the electrical grid, including the taxes and the transfer fees, was assumed on the level of 0.1376 Euro [
29].
In the case of HS, the majority of O&M (Euro/year) is connected with the replacement of the devices and system maintenance—it accounts for almost 71% of the total annual O&M costs (see
Table 3). The remaining 29% of the annual O&M is related to electricity purchasing from the grid. However, when it comes to OGS, the proportions of these components of O&M costs are different—most of the average costs incurred during the year (approximately 74%) are related to the electricity purchasing to cover the required electrical energy demand.
The prices of the devices used in the simulations and economic analysis are as follows:
10 single-crystalline PV modules (HS, OGS): 3348.2 Euro;
Inverter (OGS): 1116 Euro;
Hybrid inverter (HS): 1682 Euro; and
BESS: 5972.8 Euro.
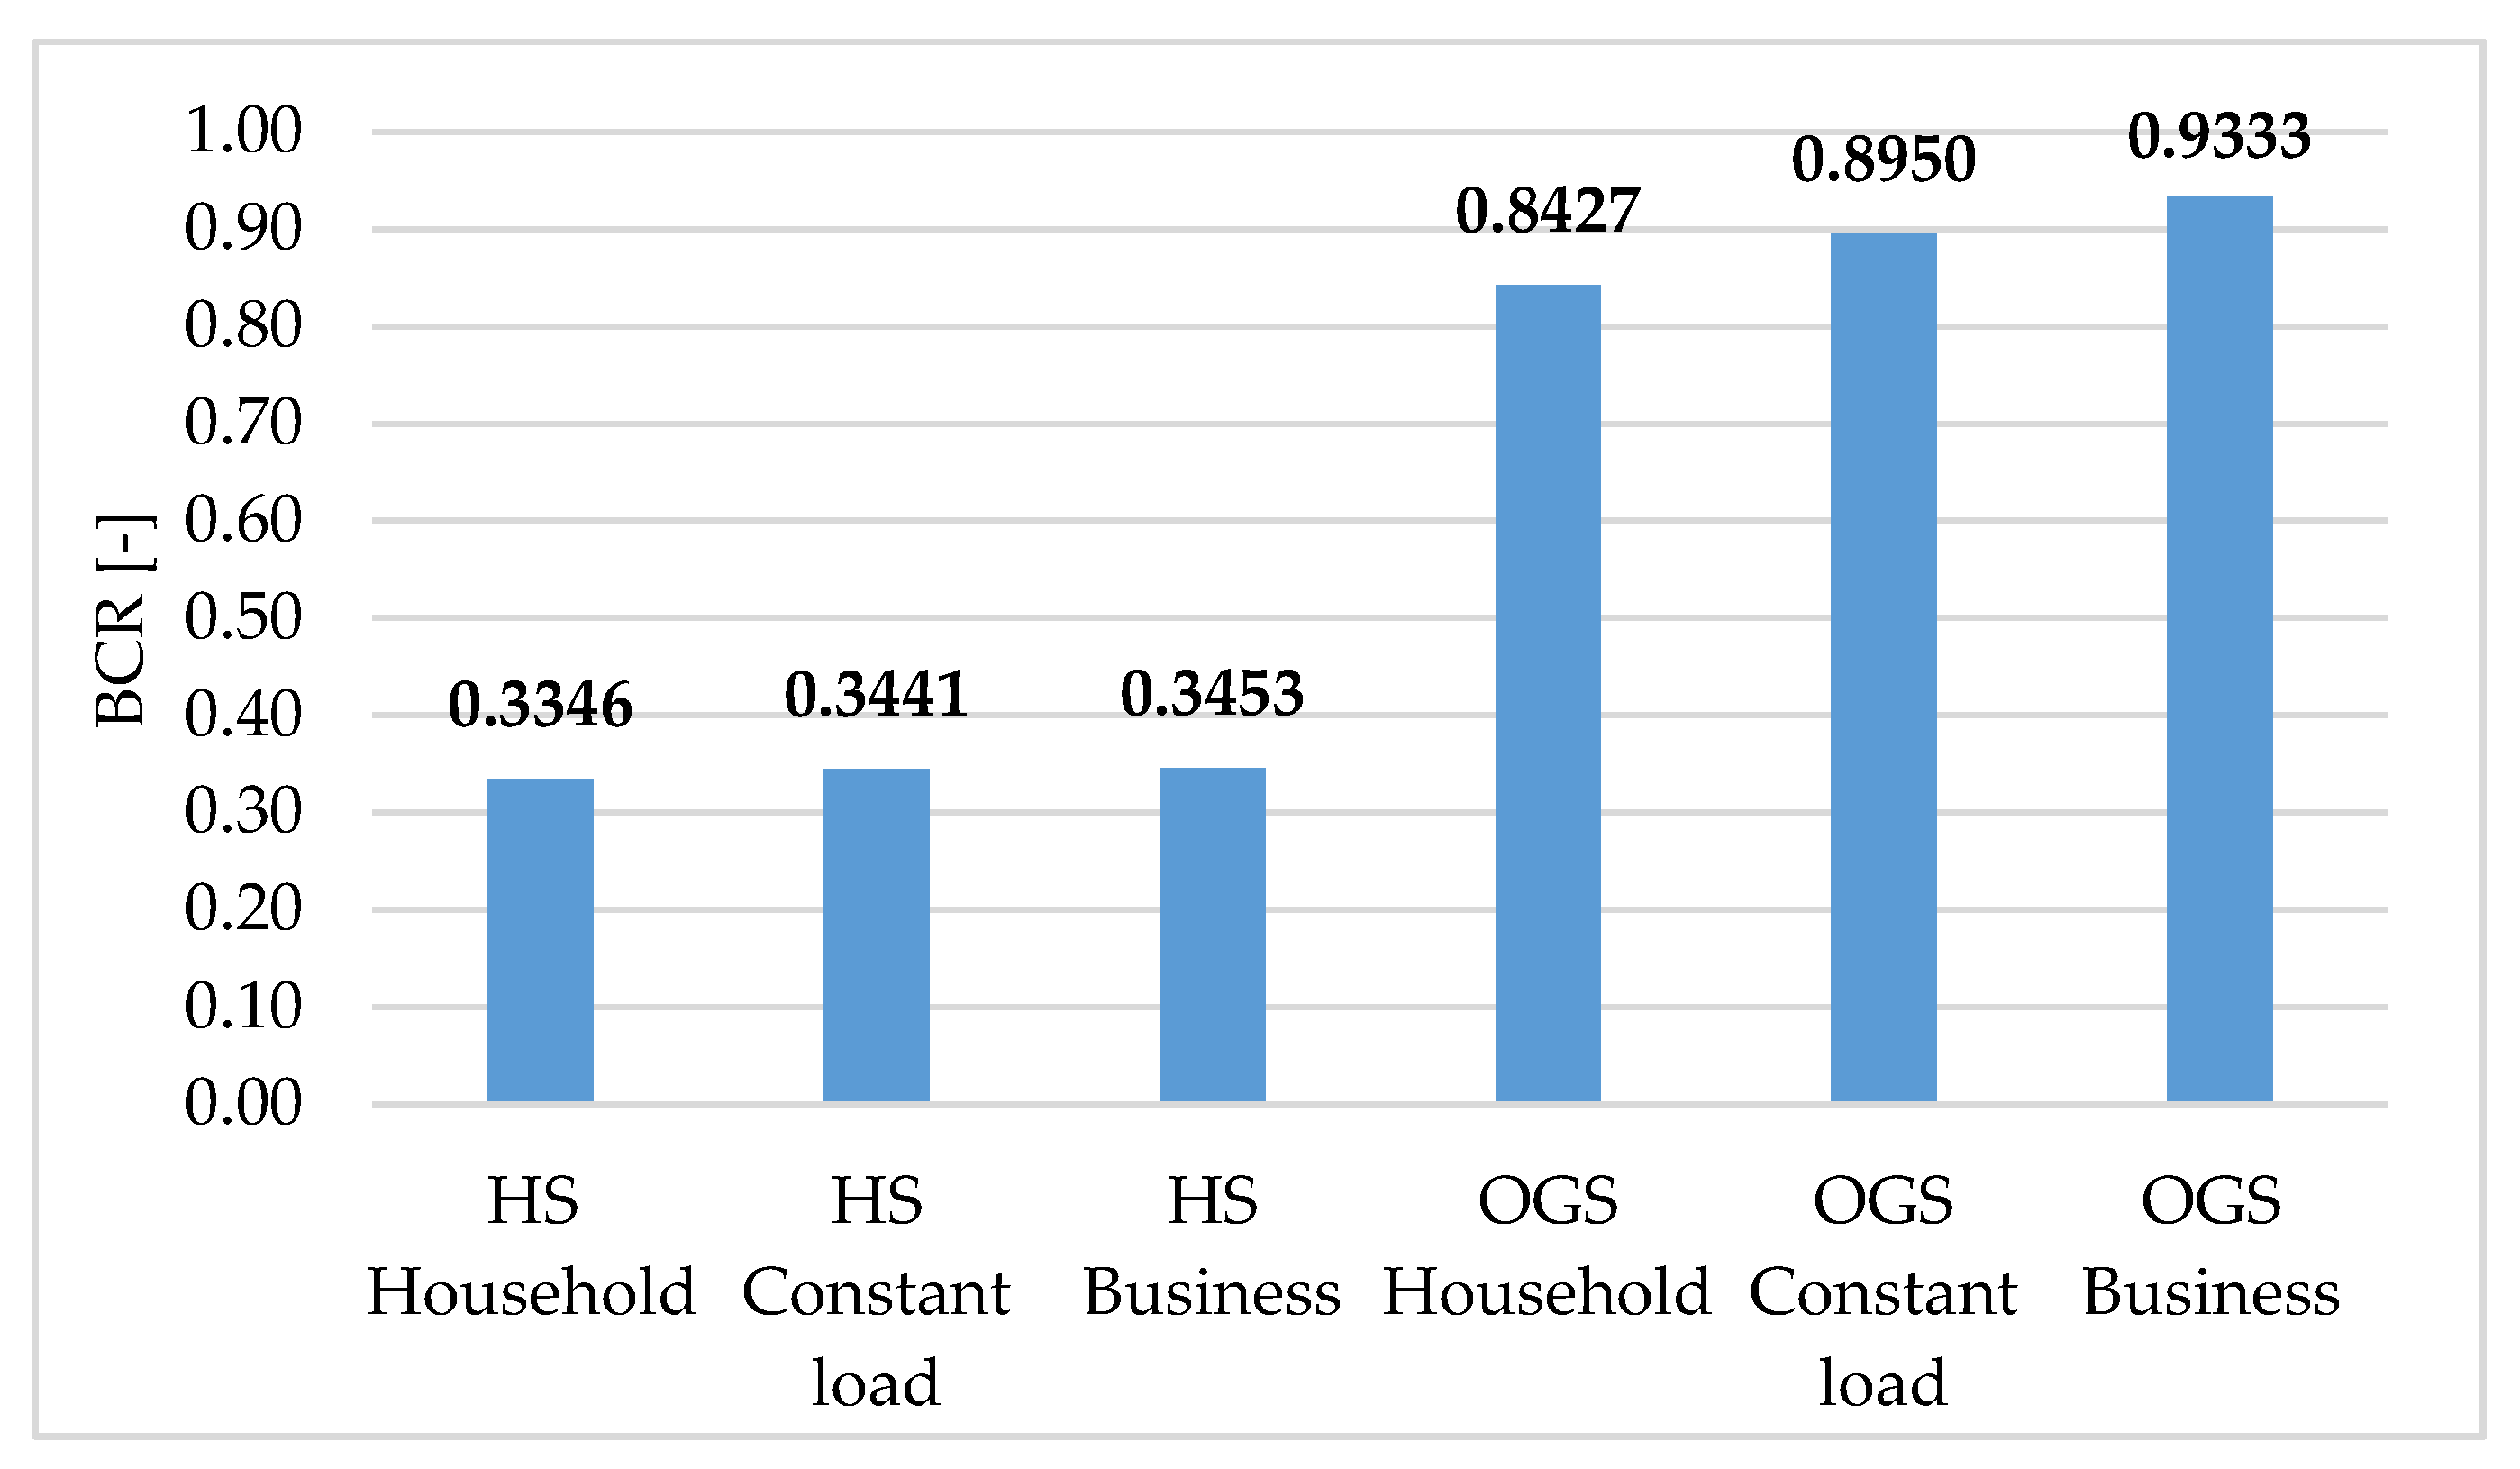
The economic assessment was conducted using the following indicators of the investment cost efficiency: the dynamic generation cost (DGC) and the benefit–cost rate (BCR).
The first economic criterion, the dynamic generation cost is one of the economic indicators enabling the selection of the most profitable investment. In this assessment, DGC shows the technical cost of obtaining 1 kWh of electric energy from a certain type of installation including the investment costs as well as operation and maintenance costs. The lower is the value of DGC indicator, the more economical is the system; therefore, low values of DGC are preferred in multicriteria analysis. The DGC value, expressing the price of the ecological unit effect of the investment in Euro/kWh, can be determined from the following equation [
30]:
where
ICt is the annual investment costs, Euro;
ECt is the annual operation and maintenance costs, Euro;
t is the year of investment time duration, from 0 to
n, where
n is the last assessed year of investment activity, years;
i is the discount rate, percent; and
EEt is the ecological effect unit in given year, kWh.
The second economic criterion, benefit–cost rate (BCR), presents dimensionless ratio of discounted investment benefits (incomes or savings) to its discounted costs (including initial investment, operation and maintenance costs) in a certain period. The profitable investment is characterized by the value of BCR indicator higher than 1 (BCR ≥ 1). BCR can be calculated from the following equation [
31]:
where
PVb is the discounted value of benefits, Euro;
PVc is the discounted value of costs, Euro; and
IBt is the investment benefits (cash inflows) in a given year, Euro.
In the case of BCR parameter, the highest values are the most profitable in multicriteria analysis. In both cases, the discount rate (i) was assumed as 6%.
2.7. Methods for Technical Criterion Assessment
The technical criterion in this study is based mostly on the reliability issues, since other aspects, such as the availability of technology and expert knowledge, appear to be at a similar level, as solar installations have now become one of the most popular orientations of energy technology development. The first technical criterion uses failure rate, λ, as the basic indicator. Failure rate expresses the number of failures per year, and, for complex systems, can be calculated according to the formula [
32]:
where
λi is the failure rate of
ith particular element of system.
In this parameter, the literature values were used as reference. In general, the greater is the failure rate, the higher is the probability of breakdown; therefore, in the multicriteria analysis, the best solution is the one with the lowest λ parameter.
The second technical criterion included the average system inavailability index calculated according the formula [
33]:
Since OGS operation is dependent of GS availability, ASUI was calculated separately for all cases including the service breaks necessary for exchange of systems’ elements, as well as predicted breaks in energy supply. In the case of ASUI, the lowest of the obtained results is treated as the most beneficial in multicriteria analysis.
2.8. Multicriteria Analysis
In the final part of the assessment, all the calculated indicators are expressed as percentage of maximal obtained value to simplify the common presentation of results. For the indicators with the calculated range of deviation, maximal values were accepted with the utilization of confidence interval 95% (environmental criteria) or following the literature (technical criteria). The weighting factors were assigned to the criteria equally in the basic option. Critical values of weights were added as supplementary ones justifying the choice of HS options for the indicated consumer groups.
The formulas used for calculation of normalized multicriteria results according to the Weighted Sum Method (WSM) are as follows [
34]:
where
aij is the normalized value of
jth indicator,
Ai is the WSM score of alternative
i and
wj is the weighting factor for
jth indicator.
Weighting factors were assumed as equal to 16.67% for the particular indicators (33.33% for each criterion).
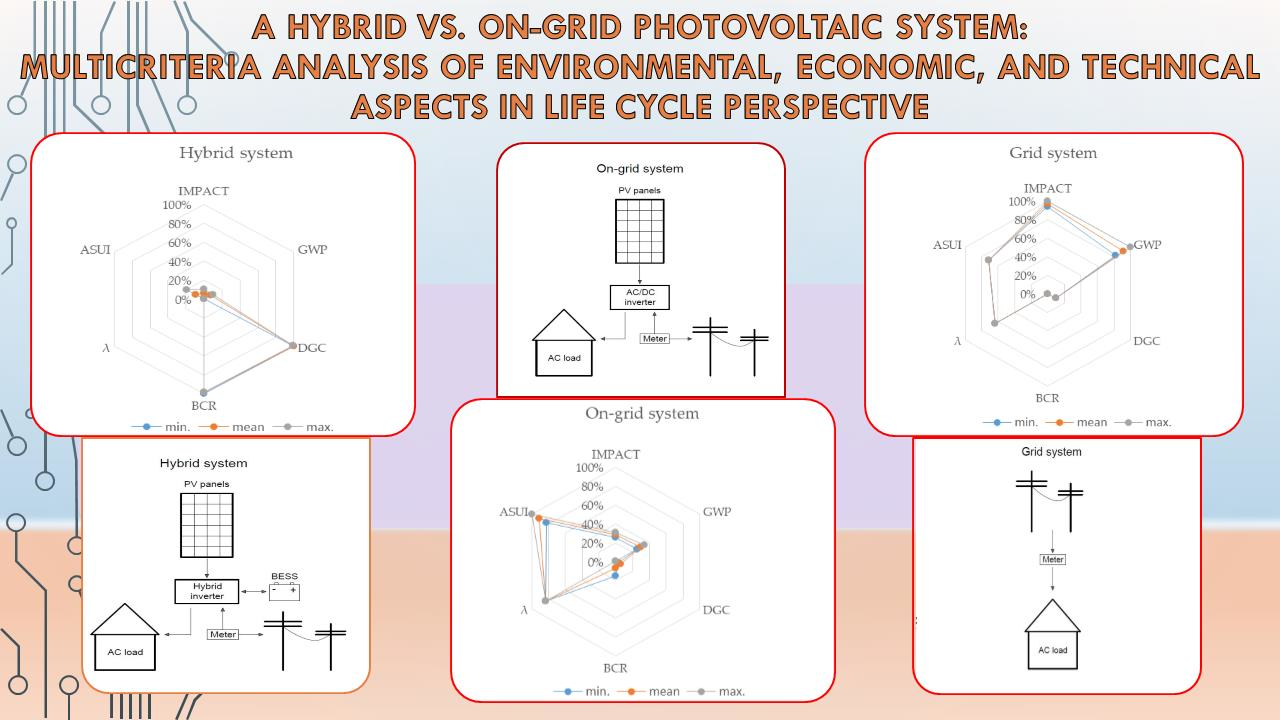
4. Multicriteria Analysis: Summary
The applied scenario included equal weighting factors for all examined solutions. In this case, the scale of 0–100% was used to express all criteria (for BCR, 100% to 0% scale was used since the meaning of indicator was opposite). Detailed comparison between mean results for analyzed systems are presented in
Table 8. The lower is the total contribution (A
i), the better is the position in multicriteria analysis ranking of profits. According to the presented results, the best option for both environmental and technical criteria seems to be hybrid system, especially in business or constant load models of consumption. The high position in the ranking for all the analyzed consumption models is connected with high reliability and proportion of self-consumed PV energy. For financial profitability of the hybrid system, the analyzed model should include high risk of damage in production process caused by breakdown. Within the calculated loses of 11,000 Euro for OGS and GS, the economic criterion would also be assessed positively in the case of hybrid system.
The on-grid system, second in the general ranking, is cheaper and more financially profitable, but it has lower security of energy supply. Environmental criteria for this kind of system are still assessed better than for grid electricity. In the case of OGS, the consumption model contributes to differentiation of multicriteria results, especially in the category of environmental burdens, where values differ by up to 18%. This is caused by the strong dependence of PV electricity self-consumption on applied consumption models, which was not so important in the case of hybrid system.
The worst option, except the first economic criteria, is grid system, since its environmental criteria are dependent on inventory of emissions from grid electricity with high share of conventional energy sources in energy production process.
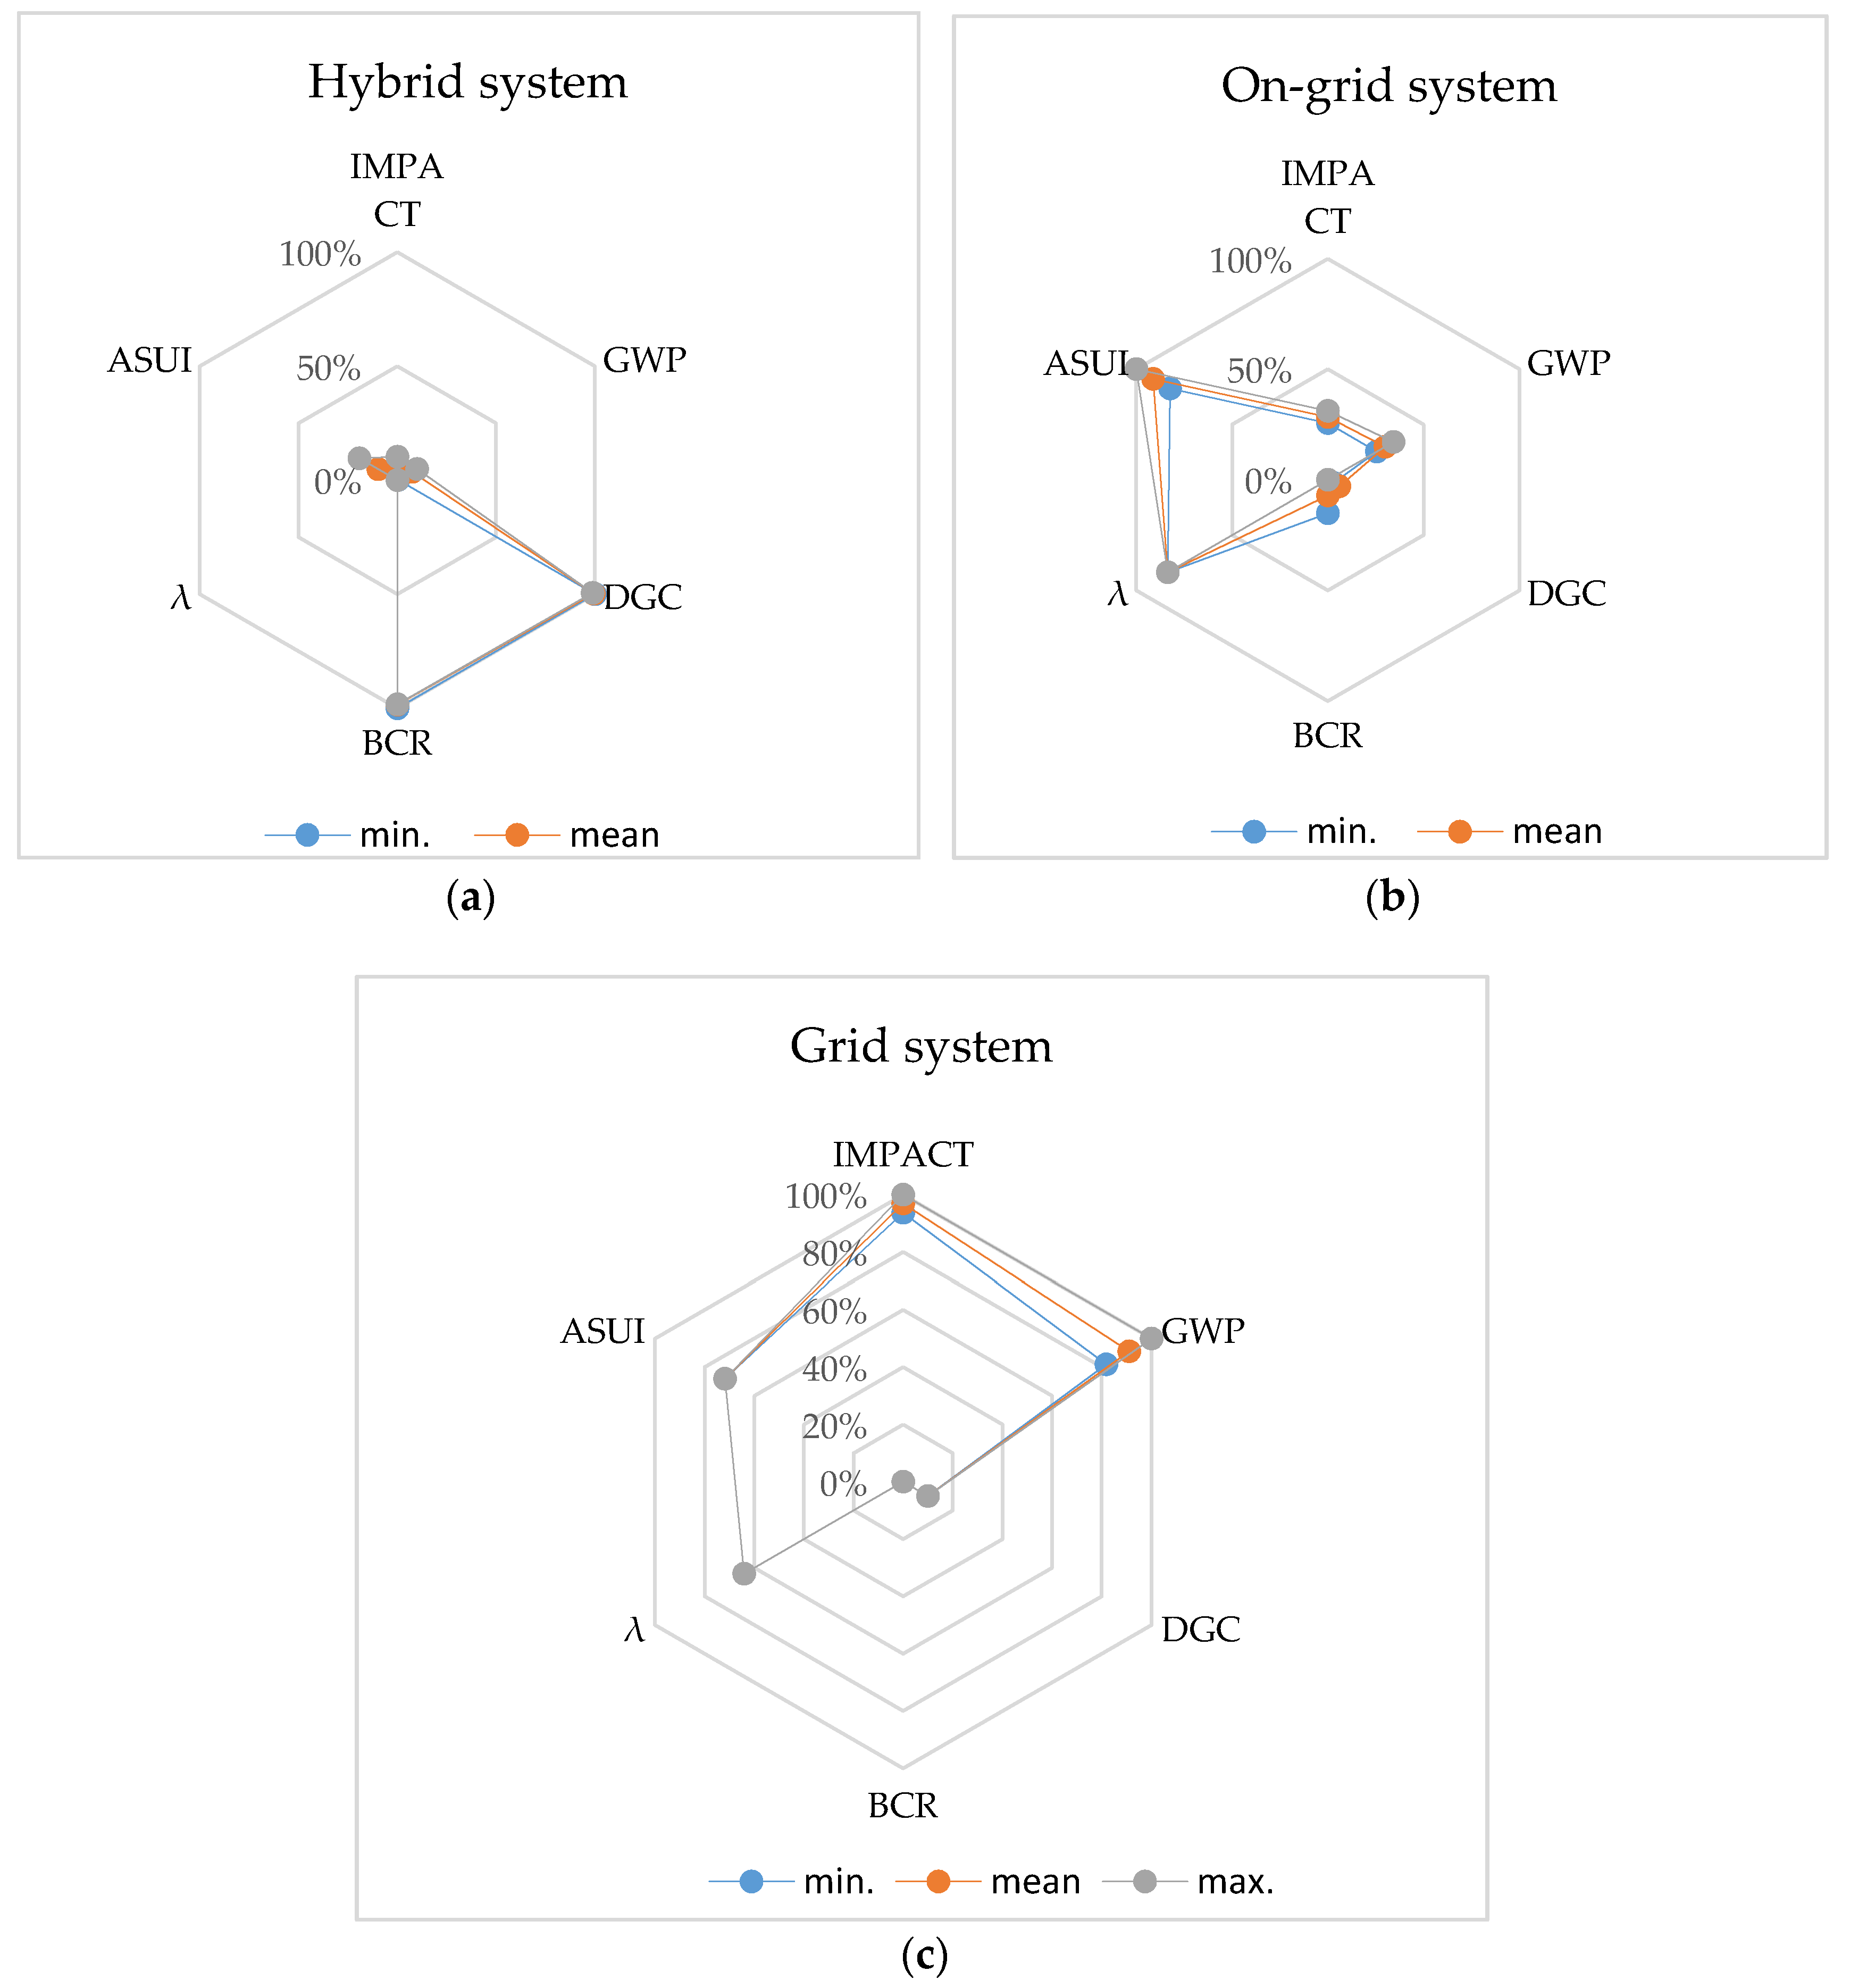
The results of equally-weighted criteria comparison, normalized for the analyzed systems, are presented in
Figure 6a–c. These results include the minimal and maximal values of particular indicators (mean calculated for all the applied consumption models) in order to compare their full ranges. As presented in
Figure 6a, the economic criterion is the only one with negative results. It should be underlined that no financial support was included in the economic analysis, therefore the results obtained for DGC and BCR could be improved. The studies devoted to hybrid PV systems indicate that the improvement of the profitability of the hybrid system is possible if the price of battery drops to 250 Euro/kWh in the case of Li-ion batteries [
39] but even 1000 Euro/kWh is acceptable [
40]. Furthermore, if the weighting factors were different (e.g., weight of economic criteria higher than 40%), or the reliability of grid electricity supply higher, the ranking of profitable solutions would change in favor of on-grid system.
Further studies on hybrid system competitiveness should also include the relations between the indicators and type or size of the battery used in the hybrid system. This kind of studies performed in Switzerland and USA show the role of the geographical location of the analyzed PV system [
11]. Proper sizing of batteries with the optimum battery depth of discharge is an important issue since it directly influences the battery lifetime and finally the cost of energy produced in the PV system [
41].
5. Conclusions
According to the performed multicriteria analysis, the utilization of hybrid system, with an option of autonomy in the case of breakdown, can be justified with the use of environmental and technical criteria. Optimization of PV generated energy consumption for own purposes leads to the low environmental indicators, since the presented model included the contribution of the PV-generated and grid electricity in the total consumption. The range of calculated environmental impact indicators, including emission of the carbon dioxide equivalent between 0.198 and 0.280 kgCO2eq/kWh of energy consumed, places the analyzed hybrid system among low-emission sources of energy. The rising contribution of PV in grid electricity was neglected; however, it was not crucial in the presented small-scale model perspective.
Even though the assessed economic criteria do not speak in favor of HS solution, it should be noted that it is possible to optimize the investment and maintenance costs, thus increase the final viability of this system. Moreover, the location of the PV installation and local electricity prices have an important influence on the economic performance of the investment and should be taken into account during the decision-making process.
High reliability of hybrid system may become very important in specific cases, such as the necessity to supply medical equipment, fragile installations (e.g., active solar collector systems) or expensive manufacturing processes. Considering the more sophisticated functions and applications of battery energy storage systems in electrical grids, such as the possibility to manage overloading, one can expect future governmental projects supporting the investments in hybrid systems, which may contribute to the minimization of environmental impacts of the energy sector.


