Article

Assessment of Energy Storage from Photovoltaic Installations in Poland Using Batteries or Hydrogen

Division of Low-Emission Energy Sources and Waste Management, Wroclaw University of Environmental and Life Sciences, 51-630 Wroclaw, Poland
*
Author to whom correspondence should be addressed.
Submission received: 9 June 2020 / Revised: 24 July 2020 / Accepted: 29 July 2020 / Published: 4 August 2020
(This article belongs to the Special Issue Assessment of Photovoltaic-Battery Systems)

Abstract

:
This paper presents a series of economic efficiency studies comparing three different investment variants: without energy storage, with energy stored in batteries and hydrogen installation with a PEM fuel cell stack for a location in Poland. To reach a target, the current solar potential in Poland, the photovoltaic (PV) productivity, the capacity of the energy storage in batteries as well as the size of the hydrogen production system were calculated. The solar potential was determined using archival meteorological data and the Krieg estimation method. A laboratory scale PV system (1 kW) was used to estimate the decrease in real solar installation power during the last 10 years of operation. All analyses were made for a 100 kW photovoltaic array located in Poland using static and dynamic methods of investment project assessment, such as Simply Bay Back Period (SPBP) or Net Present Value (NPV). The results showed that the SPBP amounted to 8.8 years and NPV 54,896 € for non-storage systems. Whereas, for systems with energy stored the economic indexes were, as follow: SPBP = never, NPV = 183,428 € for batteries and SPBP = 14.74 years, NPV = 22,639 € for hydrogen/fuel cell installation. Storage in hydrogen is more advantageous than batteries due to the smaller investment outlays.

Graphical Abstract

1. Introduction

The Polish energy sector is characterized by many problems such as high demand for energy, an inadequate level of development of the production and transport infrastructure of fuels and energy as well as the dependence on external fuel suppliers. Currently, electricity in Poland is mainly produced from non-renewable sources. In 2018 the most commonly used fuels were hard coal with a share of 47.8% and lignite with a share of 29% [1]. However, their resources are systematically decreasing. Moreover, the combustion of fossil fuels is not in line with the strategy of the European Union (EU) in the coming future [2]. Therefore, other solutions for applying renewable energy sources (RES) are considered.
The RES ensure the implementation of the most important goals of the strategic document of the Polish Energy Policy until 2030 i.e., guaranteeing the reliability of fuel and energy supplies, increasing the competitiveness of the economy, increasing energy efficiency, and minimizing the negative impact of the energy sector on the natural environment [3]. In the diversification of energy sources, solar energy is widely used, as it has many advantages e.g., no direct CO2 emissions and no noise during energy production. The drawbacks belong mainly to seasonal and daily differences in the amount of produced energy, the need for appropriate location conditions, dependence on the value of solar radiation intensity, the occurrence of shading, aging of the PV installation [4].
Correct forecasting of electricity production is important in the photovoltaic industry. The supporting tool in taking into account the variation of solar radiation across the estimated surface is Geographical Information System (GIS) [5].
Changes in the efficiency with which sunlight is converted into electricity have a large impact on the profitability of the photovoltaic array. Accurate determination of the annual degradation rate (annual decrease in electricity production), is a key issue of all stakeholders—investors, researchers, etc. [6]. According to Ferrara and Philipp [7] research, high ambient temperature, and subsequently, high module operating temperatures have a negative influence on the material structure of the solar module. Besides, ultraviolet (UV) radiation and high temperatures cause many changes in the structure of ethylene–vinyl acetate (EVA) film contained in the solar module causing its discoloration and loss of elasticity [8,9].
Quansah and Adaramola [6] presented results from field studies on electricity production degradation in twenty–two mono–crystalline silicon solar panels for 16 years in three communities in the northern part of Ghana, prior to electricity grid extension. The results of their measurements showed that the maximum power of the modules (Pmax) decreased by 18.2–38.8% (median—24.6%) during this time, annually noting a linear degradation of 1.54%. The decrease in electricity production by PV array was significantly affected by losses in short–circuit current (Isc) and filling factor (FF). The warranty of solar panel performance has changed over the years, from about 5 years in the 1980s to the current duration of 25–30 years, during which about 80–90% of initial module Pmax is guaranteed [10,11]. Reis et al. [12] for 11 years investigated PV array consisting of 192 mono-Si modules in Arcata (CA, USA) and noted a low 0.4%∙year−1 degradation rate. The majority of energy losses were associated with a change of current Isc Similar correlations were observed by Quansah and Adaramola [6]. Osterwald et al. [13] conducted similar studies for a set of two monocrystalline and multi-crystalline panels. Their research showed that the initial rapid degradation of the module was caused by the presence of oxygen in the bulk of the Si junction, in contrast, slow lasting linear degradation concerned module exposure on ultraviolet radiation.
Even more, the energy production by PV installation very often does not correspond to the actual energy demand of the electricity grid. To minimize these negative effects, various energy storage systems are considered that allow the sale (or avoid purchase) of energy during peak demand. Among others, the electrochemical systems are the most popular energy storage method. Battery energy storage systems (BESS) have a simple structure and operating principles. There are many types of batteries, including lithium-ion, vanadium, nickel-cadmium, and nickel-hydrogen. Their main disadvantages are a short discharge period, a limited service life, and a future problem with utilization [14]. The cost of an energy storage system for lithium-ion batteries for a nominal power of 1–100 kW is 600–3800 USD∙MWh−1 [15]. Hydrogen is environmentally friendly and is also classified as a source of renewable energy [16]. It can be stored as compressed gas, liquid, or solid form hydrides located in containers or adsorptive in carbon nanotubes. The hydrogen storage system consists of three main elements: an electrolyzer, a hydrogen tank, and a fuel cell stack. The electricity produced by the PV system is consumed by the electrolyzer, whose task is to produce hydrogen and oxygen from water. The produced hydrogen is stored in the tank for a period of low energy demand by the electricity grid and supplies the fuel cell stack generating electricity during the peak hours. The storage facilities using hydrogen have a power indicator of up to 10 MW [17]. The disadvantage of the hydrogen as a fuel is flammability and storage problems due to its low density [18]. As a result, it cannot be stored for a long period like many other fuels (biomass, coal, natural gas, or oil). The cost of energy storage in the form of hydrogen and its conversion to electricity using fuel cells for a nominal power of 1–50 MW is 6–725 USD∙MWh−1 [17]. To reduce the costs of hydrogen production, the electrolyzers should have a high utilization rate and low price. It is predicted that the costs of electrolyzers will drop from 840 USD∙kW−1 (in 2019) to 375 USD∙kW−1 in 2050 [19].
Another example of energy storage is mechanical storage such as water pumped storage power plants, compressed air storage, or flywheels. Water pumped storage systems are characterized by high investment costs, time–consuming construction, and a long charging cycle. The advantages of such energy storage include are high power and operational flexibility. The average cost of energy storage for a nominal power of 100–5000 MW is from 5 to 100 USD per MWh [15,20]. The kinetic energy stored in a flywheel is characterized by fast response time and low operating costs but has disadvantages including short storage time. The cost of energy storage for a nominal power of 0.4–20 MW is 1000–14,000 USD per MWh [15]. Compressed air storage is characterized by capacities up to 400 MW and high investment costs. They require appropriate tanks (caverns) for storing compressed air under high pressure. The compressor driven by an electric motor during low electricity demand injects cooled air into the caverns. The tank uses water to ensure constant pressure of the injected air. During the electricity demand by the grid, the compressed air flows through the two-stage heat exchanger and is injected into the gas turbine combined with the power generator [21]. The cost of energy storage for a nominal power of 50–300 MW is 2–120 USD∙MWh−1 [15].
In order to properly select the electricity storage system, they are compared with each other. Zhang et al. [22] made a comparison of the economic efficiency of electricity storage in batteries and hydrogen for building located in Sweden, which is supplied by energy from PV panels. The results of their research indicate that battery storage system is superior to the hydrogen storage system regarding NPV. Because of different unitary prices changing with the size of the installation with region, or technology, however, the results cannot be easily transferred to other regions or countries with other electricity market rules etc. Thus, the unitary economic analysis is rather impossible and the analysis should be performed basing on the case studies.
The energy market in Poland differs significantly from the other countries belonging to the EU. Also, the selling regulations of the electricity in Poland are different. The subject of the exchange is not only electricity, but also fuel and emissions. Its aim is to balance the demand and supply of energy, thus supporting the country’s energy security policy [23]. As Poland is obligated to increase the share of RES to 15% in 2020 and later in 2030 20%, the problem of power grid stabilization, especially in peak demands, will become more and more important [3]. As a result, there is a need to develop the energy storage banks taking into account clean and promising solutions, such as PV systems combined with storage options.
In this context the most important in the analysis of energy storage is to consider the PV panels efficiency decrease after years, forecasting the energy produced in different regions, proper design, cost calculation and economic analysis which should be dynamic due to a long period of the investment.
This study aims to: (i) evaluate the rate of efficiency decrease in function of time, estimate the solar potential in Poland basing on the metrological data, (ii) design of the three comparable PV systems (without energy storage, with energy storage in batteries, with energy storage system in hydrogen) (iii) economic assessment of proposed systems.
The structure of the paper is as follow: Section 1 includes information on the Polish energy sector, a description of electricity storage methods, the results of research on the ageing of PV panels. Section 2 presents the description of the considered investment scenarios, the method of determining the solar potential for the area of Poland, the method of estimating the annual decrease in electricity production, assumptions for conducting economic analysis and the formulas required for technical calculations. Section 3 contains the results of the research, technical calculations and economic efficiency analysis of each of the three options. Section 4 presents the conclusions and compares the most economically effective scenario with the results of other scientists working in this field of science.

2. Materials and Methods

To evaluate the storage economic efficiency of energy produced in the PV system three scenarios were chosen:
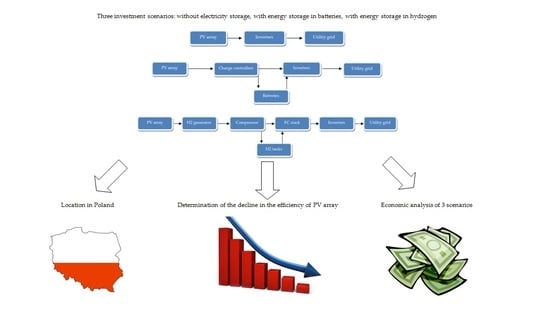
  • Scenario 1. The energy produced from the PV system without storage (reference scenario). The price is set up on the RES auctions and the average price of sold energy (Figure 1a);
  • Scenario 2. Energy from the PV system is stored with batteries and sold at the price of the afternoon peak (Figure 1b);
  • Scenario 3. Energy from PV is stored and sold at the price of the afternoon peak as well, but the storage bases on hydrogen, electrolyzer and PEM fuel cell stack (Figure 1c).
Other energy storage methods described in the introduction were rejected such as the use of flywheels due to the requirement for a long storage period, and a lack of caverns nor the water reservoir excluded pumped water storage or compressed air storage possibility.
The analysis is divided into three main stages:
(1)
evaluation of solar potential in Poland and the place designated for the investment especially, based on meteorological data and performed by simulation using the Krieg estimation method; the determination of the decrease in actual installation capacity over the years,
(2)
design of the installation and investment cost analysis for investigated scenarios,
(3)
economic assessment taking into account the simulated energy production, actual energy prices, discount rate, and economic indexes.

2.1. Solar Potential in Poland

To show the solar potential in Poland, archival weather data provided by the PVGIS service was used. Data on the radiation intensity for the horizontal surface and the surface set at the optimal angle were elaborated. The map of the intensity of solar radiation was made with “Surfer 12” software using the Krieg estimation method, which consists in the sample data (measuring points) inside the estimation area (sample search area) are assigned appropriate weights in such a way to minimize the mean square estimation error [24]. The expected value of the random variable F, at the unobserved point (x0, y0), was computed according to:
E ( F ( x 0 ; y 0 ) ) = i = 1 n w i f ( x i , y i )
where: wi–coefficient calculated from the system of normal equations in order to minimize the prediction error, (xi, yi)—known base points.
The simulation was prepared based on data from PVGIS service to change discrete data to continuous data. The elaborated map allows estimating the solar potential in every location in Poland, not only in places where the measurement was performed (Section 3.1).
For economic analysis, an in-depth analysis of revenues from the sale of electricity was made. In addition to the analysis of electricity prices, production losses resulting from the deteriorating efficiency of photovoltaic cells based on own measurements performed since 2010 in the Laboratory of Renewable Energy Sources of the Wroclaw University of Environmental and Life Sciences have also been specified.

2.2. Estimation of the Energy Production Reduction

The experimental part of the work consisted of measuring the actual photovoltaic installation, which was placed on the roof of the building of the Laboratory of Renewable Energy Sources of the Wroclaw University of Environmental and Life Sciences. The installation consisted of four PV panels connected in series, which were mounted under an optimal angle of 40°. The nominal power of one PV panel was 250 W. The panels were connected to the SMA Sunny Boy Inverter with a continuous rated power of 800 W. The connection scheme is presented in Figure 2.
The inverter was equipped with the power meter. The counter was written down at least every 2 weeks. The installation was equipped with a solar radiation sensor, which allowed to log the amount of solar energy reaching the panels.

2.3. Assumptions for Technical and Economic Analysis

The technical and economic analysis is the first stage of work on the photovoltaic plant. It allows to determine the energy potential of a given installation. Considering the investment outlays, revenues from the sale of energy, operating and maintenance costs its financial profitability can be determined. The following assumptions were made for the following analysis:
(1)
the nominal power of PV farm Pinst = 100 kW,
(2)
the location of the solar farm-Poland, Wroclaw, Lower Silesia (51°08’ N; 17°07′ E),
(3)
the PV farm is located close to the medium voltage network with free capacity,
(4)
the type of the montage system: free-standing installation based on piles driven into the ground,
(5)
the main components of PV installation: Panel Q.PLUS BFR-G4.1 (PPV = 275 W), inverters SMA Sunny Tripower 9000TL,
(6)
the price per hectare of land amounting to 7000 € was accepted [25],
(7)
the electricity price was adopted depending on analysis scenario: 80 €·MWh−1 for an array without energy storage, 120 €·MWh−1 for systems with energy storage (price in the afternoon peak) [26],
(8)
the PV system O&M costs of 18 €·kW−1·yr−1 were assumed [27],
(9)
the connection of the batteries is parallel,
(10)
the discount rate r = 2.68% was assumed based on the internal banking index,
(11)
the energy accumulation options: energy storage in lithium-ion batteries (Scenario 2), in hydrogen based on the use of an electrolyzer, compressor, cylindrical tank made of kevlar, and fuel cell stack (Scenario 3),
(12)
the lifespan of main components: PV panels = 30 years [28], inverter = 12 years [29], batteries = 15 years [30], electrolyzer = 20 years [31], compressor = 15 years [32], fuel cell stack = 10 years [33].

2.4. Energy Production by Photovoltaic Installation

The efficiency of the PV installation was calculated from the following formula:
η i n s t · η P V · η I N V · η d
where: η P V —the efficiency of the solar panel ( η P V = 0.169 [33]), η I N V —the efficiency of the inverter ( η I N V   = 0.98 [34]) η d —the efficiency of the distribution grid ( η d = 0.98 was adopted [35]).
The annual average amount of produced energy was calculated from the formula.
          E y r = I o p t · n P V · η inst · S
where: I o p t   —insolation in the given location for the optimal PV panel angle; S—active surface of the PV panel (for calculations S = 1.5 m2 [33]).
The daily amount of electricity produced by the PV installation was determined from the formula:
                  E d = E y r n d
where: n d —number of days in year (d).

2.5. Calculation of the Energy Storage Systems

The required battery capacity was calculated according to the formula:
C = E d · 1 η b U
where: η b —the efficiency of the battery (for calculations η b —0.95 was adopted [36]), U—battery voltage (U = 51.2 V [37]).
Calculation of the daily amount of electricity after passing through the electrolyzer:
E H 2 = E d · η H 2 ,
where: η H 2 electrolyzer efficiency (for calculations η H 2   = 0.9 was adopted [38]).
The daily amount of energy needed to compress hydrogen to 30 MPa was calculated based on the modified Clapeyron equation:
E c = n · R · T · l n V 2 V 1 · E H 2 η C · H H V
where: n —number of moles of gas, R—the universal gas constant (R = 8.314 J·mol−1·K−1); T —temperature (K); V 2 —volume of gas after compression (m3); V 1 —volume of gas before compression (m3); η C   —compressor efficiency (for calculations η C   = 0.9 was assumed [39]); HHV— higher heating value of hydrogen (HHV = 12.7 MJ∙Nm3).
The daily amount of energy for storage was calculated from the formula:
          E s = E H 2 E c
The tank volume for hydrogen compressed to p H 2     = 30 MPa is:
                  V t = q v s ·   p a · t s p H 2 ·
where: q v s   —daily volume of hydrogen for storage; p a —atmospheric pressure ( p a = 0.1 MPa was assumed) ;   t s —storage time ( t s = 1 day was assumed).
To calculate the required fuel cell stack power, Equation (9) was used:
                      P F C = P i n s t · η H 2 · η c · η F C
where: η F C   —fuel cell stack efficiency ( η F C = 0.7 was adopted [40]).
The amount of the daily energy stored for sale after passing through the electrolyzer, compressor and fuel cell stack was determined from the formula:
                      E n = E d · η H 2 · η C · η F C

2.6. Methods of Investment Project Assessment

2.6.1. Simple Payback Period (SPBP)

Simple Payback Period (SPBP) determines the ratio of total investment outlays to the value of the estimated cash flow, without consideration of the change value of money in time and is expressed by the following formula [41]:
S P B P = I C o   C F 1
where: IC0—the value of the invested capital, (€); CF1cash flow, achieved as the result of the implementation of energy–saving measures and savings in operating costs, or expected to be achieved at the stage of project development after the end of the calendar year, (€).

2.6.2. Return on Investment (ROI)

Return on Investment (ROI) is the quotient of the operating profit obtained after the investment total investment expenditure [42]. The ROI of an investment is usually compared to the industry average ratio or the weighted average cost of capital (WACC) [43]:
R O I = ( G F I C F I ) C F I
where: GFI—gain from investment, (€); CFI—the cost of investment, (€).

2.6.3. Net Present Value (NPV)

The NPV method is one of the main methods that consider time in the assessment of investment projects and is widely used in practice. This ratio discounts future cash flows resulting from the functioning investment with an assumed discount rate and then summing them together [44]. The formula is as follows:
N P V = t = 0 n C F ( 1 + r ) t
where: C F —cash flow in the period t ; (€); r —assumed discount rate (%).

2.6.4. Internal Return Rate (IRR)

The IRR is the rate of return for which the NPV function is zero. The higher the value of this indicator, the more profitable it is to start the investment [45]. The formula is as follows:
N P V = t = 0 n C F ( 1 + r ) t = 0

2.6.5. Discounted Payback Period (DPP)

The DPP is a period for which the cumulative discounted value of cash inflows CI is equal to investment outlays C0 as shown in the following formula [46]:
Σ C I ( 1 + r t ) = C 0

3. Results and Discussion

Calculations in this section were made with assumptions given in the point 2.3. All of them are bound with limitations coming from the fact, that the installation based on real elements and equipment. The development of RES technologies can change assumptions and the results as well.

3.1. Solar Potential at Optimal Angle for Poland

The optimal angle should be understood as the angle used for a long time during a year. The optimal installation setting allows to maximize energy yields. The values of optimal angles of the solar installation setting for each voivodeship (Poland is divided into 16 administrative regions—“voivodeships”) are presented in Table 1.
In Poland, the optimal angle varies with latitude. It ranges from 35° for the south and south–east to 39° for the north (Gdansk)of the country. Based on data from the PVGIS database for all the 16 voivodeship capitals the intensity of radiation on the horizontal surface (Horizontal) and intensity of radiation on the surface set at the optimal angle (Hopt) were developed. Table 2 presents the radiation intensity data presented as the amount of energy expressed in kilowatt-hours (kWh) from one square meter per year. Data from Table 2 are shown graphically in Figure 3.
Examining the presented data in Figure 3, it should be noted that on the territory of Poland, differences in the amount of energy from the sun, obtained from one square meter of surface. Depending on the geographical location this parameter varies from 1062.150 to 1120.550 kWh·m−2∙yr−1 for horizontal surface. The highest value was determined in north part of Poland (the Pomerania voivodeship, Gdańsk). The southern part of the country also has good conditions. For example, in such cities like Wroclaw or Opole, the radiation amounts 1109.022 and 1116.900 kWh m−2∙yr−1 respectively.
Figure 4 shows the map of the intensity of solar radiation made with “Surfer 12” software, which was prepared based on data from Table 2. The map is also marked with measuring points. The other values were estimated using the Krieg method.
The average value of the radiation intensity for Poland is 1265 kWh·m−2·yr−1, which is remarkably similar to the values found in other European countries, such as: Germany, Czech Republic [48].

3.2. Technical Calculations

Table 3 shows the calculated parameters: efficiency of the PV system, the required number of PV panels, the annual and daily electricity generated by the solar system for each scenario.
For scenarios with energy storage additionally:
(1)
Scenario 2: required battery capacity;
(2)
Scenario 3: daily amount of electricity after passing through the electrolyzer, daily amount of energy needed to compress hydrogen to 30 MPa, daily amount of energy for storage, tank volume for hydrogen compressed to p H 2 = 30 MPa, required fuel cell stack power, daily stored energy for sale after passing through the electrolyzer, compressor and fuel cell stack.

3.3. Results of Measurements of PV Aging

The main disadvantage of the PV panel is the aging process. It relates to a decrease in efficiency. In Figure 5 solar radiation and PV system energy yield is shown. The monthly average solar radiation and energy yield measurements are represented by dots. For comparison of the results the solar radiation, and the energy yield are expressed in kWh·m−2. There is a visible trend in the amount of electricity produced depending on the season of the year. Statistical analysis of the presented data provided an information about average decrease in energy production, which was further used in, economic analysis.
Basing on solar radiation and energy yield the efficiency of the PV system was calculated. Efficiency is understood as the quotient of the amount of electricity produced and the intensity of solar radiation. The results are presented in Figure 6.
The efficiency of the PV system, which includes both inverter and PV panels, depends on many variables. However, the PV panels are mostly sensitive to the operating temperature. The efficiency of the energy production decrease with the increase of the temperature. The recommended production conditions are high solar radiation (above 800 W·m−2) and low temperature (>10 °C). Based on these measurements, the average annual decrease in electricity yield ΔE = 0.60%·yr−1 was determined.

3.4. Results of Economic Analysis of Investment Scenarios

Table 4, Table 5 and Table 6 present investment outlays for each of the analyzed installation scenarios. Investment cost calculation was performed based on the offers of the producers of installation components directly from the product catalogue and by request for the price.
Table 7 compares investment options by comparing the average for 30 years annual net electricity stored and incomes for its sale. It also presents the cash outlays of each type.
The analysis of the economic efficiency of each installation option was also carried out based on the methods described in Section 2.2. The results in the graphic form are presented in Figure 7.
Figure 7 shows the actual discounted and accumulated cash flows, whose intersection with the horizontal axis allows to determine the actual payback period. The scenario without energy storage (Scenario 1) achieves a positive economic effect, approximately within 10 years. Significantly longer takes the reaching of a positive investment effect for the Scenario 1with the storage of electricity in hydrogen (about 18 years). Unfortunately, the variant with lithium-ion batteries (Scenario 2) will not pay off in the investigated period. The significant drop of the NPV value for Scenario 2 around year 15 for “Batteries (Figure 7.) is caused by the need to replace the batteries set which is associated with very high investment costs. The detailed results of the analysis are presented in Table 8.
Comparison of three scenarios has shown, that energy storage in batteries or hydrogen tanks is not so profitable as installation of direct energy production. It can change due to aspiration of European countries to make renewable energy production more predictable. Besides, an increase in the price of energy from conventional sources is inevitable, and the process of increasing these prices has just begun. It is highly probable that a similar analysis performed in a few years’ time will yield different results.

4. Conclusions

The economic analysis carried out indicates relatively low profitability of electricity production using a photovoltaic plant. It also indicates that standard and simple economic analyses (e.g., based on SPBT) give too optimistic forecasts. Actual cash flow, considering the effect of discount and deterioration of efficiency of PV cells with age, make the actual payback period longer.
The comparison of installation without storage and with storage in polish conditions showed, that batteries are not the best solution. The much better effect gives hydrogen storage, which, although was much above 10 years, but it was placed below the lifespan of installation. The best economic efficiency was obtained for the non-storage system. However, this solution does not solve the problem of supporting power grid in peak demands or other urgent situations.
Therefore, the economic effect is not the only criterion for decision making. Installation with storage gives more advantages: it solves the typical problem of RES that the energy is characterized by high fluctuation and unpredictability, regardless of demand. Additionally, implementing the storage should make the installation sustainable. Another argument supporting energy storage using hydrogen should be a forecast of the International Renewable Energy Agency (IRENA) of a decrease in electrolyzer prices in the future. Also, the prices of batteries will diminish according to developing technologies and rising capacity.
The paper also creates a space for further research as there are many issues such as ageing other types of PV installation, or economic analyses for another case studies or other regions that still need to be analyzed. Analyses made in the past for similar cases (for instance [22] in the year 2016) showed no profitability which can be illustrated with negative NPV. Analyses for the year 2020 presented in the paper showed positive NPV, which allows to be optimistic about the growing profitability of these installations in the near future.

Author Contributions

B.K. and P.B. contributed to the conception and design of the study; M.D. collected, analyzed the data and performed the simulation work; B.K. and P.B. made calculations; B.K. and A.P. wrote the original draft; M.D, P.B. and A.D. reviewed and edited the paper. All authors have read and agreed to the published version of the manuscript.

Funding

This research received no external funding.

Conflicts of Interest

The authors declare no conflict of interest.

References

  1. CSO of Poland. CSO Energy Statistics in 2017 and 2018; Central Statistical Office of Poland: Warsaw, Poland, 2019.
  2. EU Parliament and Council. Directive (EU) 2018/2001 of the European Parliament and of the Council of 11 December 2018 on the promotion of the use of energy from renewable sources. Off. J. Eur. Union 2018, 21, 82–209. Available online: https://eur-lex.europa.eu/legal-content/EN/TXT/?uri=CELEX%3A32018L2001 (accessed on 3 August 2020).
  3. Ministry of Economy of Poland. Announcement of Ministry of Economy from 21.12.2009 in a Matter of the National Energy Policy up to 2030; Monitor of Poland of 2010: Warsaw, Poland, 2009. [Google Scholar]
  4. Kadar, P. Pros and Cons of the renewable energy application. Acta Polytech. Hung. 2014, 11, 211–224. [Google Scholar]
  5. Lazzeroni, P.; Moretti, F.; Stirano, F. Economic potential of PV for Italian residential end-users. Energy 2020, 200, 117508. [Google Scholar] [CrossRef]
  6. Quansah, D.A.; Adaramola, M.S. Ageing and degradation in solar photovoltaic modules installed in northern Ghana. Sol. Energy 2018, 173, 834–847. [Google Scholar] [CrossRef]
  7. Ferrara, C.; Philipp, D. Why do PV modules fail? Energy Procedia 2012, 15, 379–387. [Google Scholar] [CrossRef]
  8. Bandou, F.; Arab, A.H.; Belkaid, M.S.; Logerais, P.O.; Riou, O.; Charki, A. Evaluation performance of photovoltaic modules after a long-time operation in Saharan environment. Int. J. Hydrog. Energy 2015, 40, 13839–13848. [Google Scholar] [CrossRef]
  9. Wohlgemuth, J.H.; Kurtz, S. Using accelerated testing to predict module reliability. In Proceedings of the 37th IEEE Photovoltaic Specialists Conference (PVSC 37), Seattle, Washington, DC, USA, 19–24 June 2011; pp. 1–5. [Google Scholar]
  10. Jordan, D.C.; Kurtz, S.R. Photovoltaic degradation rates-an analytical review: Photovoltaic degradation rates progress. Photovolt. Res. Appl. 2013, 21, 12–29. [Google Scholar] [CrossRef] [Green Version]
  11. Meydbray, J.; Dross, F. PV Module Reliability Scorecard Report; DNV GL: Oslo, Norway, 2016. [Google Scholar]
  12. Reis, A.M.; Coleman, N.T.; Marshall, M.W.; Lehman, P.A.; Chamberlin, C.E. Comparison of PV module performance before and after 11-years of field exposure. In Proceedings of the 29th PV Specialists Conference, New Orleans, LA, USA, 19–24 May 2002; pp. 1432–1435. [Google Scholar] [CrossRef]
  13. Osterwald, C.R.; Anderberg, A.; Rummel, S.; Ottoson, L. Degradation analysis of weathered crystalline-silicon PV modules. In Proceedings of the 29th PV Specialists Conference, New Orleans, LA, USA, 19–24 May 2002; pp. 1392–1395. [Google Scholar] [CrossRef]
  14. Belu, R. Energy storage for electric grid and renewable energy application. In Energy Storage, Grid Integration, Energy Economics, and the Environment; CRC Press Taylor & Francis Group: Boca Raton, FL, USA, 2019; pp. 29–33. [Google Scholar]
  15. Wojciechowski, H. Technologie magazynowania energii cz. II. Instal 2017, 3, 16–27. [Google Scholar]
  16. Zuttel, A. Hydrogen storage methods. Naturwissenschaften 2004, 91, 157–172. [Google Scholar] [CrossRef] [PubMed]
  17. Kharel, S.; Shabani, B. Hydrogen as a long-term large-scale energy storage solution to support renewables. Energies 2018, 11, 2825. [Google Scholar] [CrossRef] [Green Version]
  18. Dawood, F.; Shafiullah, G.; Anda, M. Stand-Alone microgrid with 100% renewable energy: A case study with hybrid solar PV-battery-hydrogen. Sustainability 2020, 12, 2047. [Google Scholar] [CrossRef] [Green Version]
  19. International Renewable Energy Agency (IRENA). Hydrogen: A renewable energy perspective. In Proceedings of the 2nd Hydrogen Energy Ministerial Meeting, Tokyo, Japan, 25 September 2019. [Google Scholar]
  20. Bartosik, M. Magazynowanie energii elektrycznej i gospodarka wodorowa. Przegląd Elektrotechniczny 2016, 1, 334–342. [Google Scholar] [CrossRef]
  21. Jamrozik, A.; Głuszek, A.; Olejnik, A. Modern methods of energy storage. J. Civ. Eng. Environ. Archit. 2014, 61, 227–236. [Google Scholar] [CrossRef]
  22. Zhang, Y.; Lundblad, A.; Campana, P.E.; Yan, J. Comparative study of battery storage and hydrogen storage to increase photovoltaic self-sufficiency in a residential building of Sweden. Energy Procedia 2016, 103, 268–273. [Google Scholar] [CrossRef]
  23. Rakowski, J. Rynek bilansujący energii elektrycznej w Polsce—Geneza, zasady funkcjonowania, przyszłość. Biuletyn Miesięczny. PSE SA 2000, 3, 30. [Google Scholar]
  24. Niedoba, T. Application of kriging in approximations of grained materials characteristics distribution functions. In Proceedings of the XXV International Mineral Processing Congress, Brisbane, Australia, 6–10 September 2010; pp. 3321–3326. [Google Scholar]
  25. Sikorska, A. Rynek Ziemi Rolniczej. Analizy rynkowe 2018, 21, 79–80. [Google Scholar]
  26. Electricity Distributor TAURON. Tariff for Customers of Tariff Groups G11, G12, G12w, G13. Available online: https://www.tauron-dystrybucja.pl/ (accessed on 3 August 2020).
  27. NREL. Report Distributed Generation Renewable Energy Estimate of Costs; National Renewable Energy Laboratory: Golden, CO, USA, 2016.
  28. Laronde, R.; Charki, A.; Bigaud, D. Lifetime estimation of a photovoltaic module based on temperature measurement. In Proceedings of the 2nd IMEKO TC 11 International Symposium Metrological Infrastructure, Cavtat, Croatia, 15–17 June 2011. [Google Scholar]
  29. Sangwongwanich, A.; Yang, Y.; Sera, D.; Blaabjerg, F. Lifetime evaluation of PV inverters considering panel degradation rates and installation sites. In Proceedings of the IEEE Applied Power Electronics Conference and Exposition (APEC), Tampa, FL, USA, 26–30 March 2017; pp. 2845–2852. [Google Scholar] [CrossRef]
  30. Haidl, B.; Bader, S. Lifetime analysis of energy storage systems for sustainable transportation. Sustainability 2019, 11, 6731. [Google Scholar] [CrossRef] [Green Version]
  31. Bareiß, K.; de la Rua, C.; Möckl, M.; Hamacher, T. Life cycle assessment of hydrogen from proton exchange membrane water electrolysis in future energy systems. Appl. Energy 2019, 237, 862–872. [Google Scholar] [CrossRef]
  32. Ramsden, T. An Evaluation of the Total Cost of Ownership of Fuel Cell-Powered Material Handling Equipment; NREL Technical Report: Golden, CO, USA, 2013. [Google Scholar]
  33. Datasheet of Q. PLUS BFR-G4.1 Solar Panel. Available online: https://archiwum.allegro.pl/oferta/panel-fotowoltaiczny-qcells-qplus-bfr-g4-1-275-285-i7898262517.html (accessed on 3 July 2020).
  34. Datasheet of SMA Sunny Tripower 9000tl Solar Inverter. Available online: https://www.solar-go.co.uk/sm.a-sunny-tripower-9000tl-20-solar-inverter.html (accessed on 3 July 2020).
  35. NACAA. NACAA’s Menu of Options Implementing EPA’s Clean Power Plan: A Menu of Options; National Association of Clean Air Agencies: Washington, DC, USA, 2015. [Google Scholar]
  36. Makibar, A.; Narvarte, L. Characterization and efficiency test of a Li-Ion energy storage system for PV systems. In Proceedings of the 31st European Photovoltaic Solar Energy Conference and Exhibition, Hamburg, Germany, 14–18 September 2015; pp. 1652–1658. [Google Scholar]
  37. Datasheet of Lithium Battery Tesvolt TS-System 48V. Available online: https://www.solaryours.com/produ.cts/lithium-storage-system-ts-the-commercial-all-rounder/ (accessed on 3 July 2020).
  38. Wanjiku, J.G.; Khan, M.A.; Barendse, P.S.; Sebitosi, A.B. Analytical sizing of an electrolyser for a small-scale wind electrolysis plant. In Proceedings of the 2010 IEEE International Energy Conference, Manama, Bahrain, 18–22 December 2010. [Google Scholar]
  39. Dale, N.V.; Mann, M.D.; Salehfar, H.; Han, T.; Dhirde, A.M. Modeling and analysis of electrochemical hydrogen compression. In Proceedings of the NHA Annual Hydrogen Conference, Sacramento Convention Center, Sacramento, CA, USA, 30 March–3 April 2008. [Google Scholar]
  40. Kaytara, S.; Iżykowski, J.; Staszewski, Ł.; Shaikh, F. Technical and economical evaluation of proton exchange membrane (PEM) fuel cell for commercial applications. Present Probl. Power Syst. Control. 2017, 8, 41–49. [Google Scholar]
  41. Basinska, M.; Koczyk, H.; Kosmowski, A. Assessment of thermo modernization using the global cost method. Energy Procedia 2015, 78, 2040–2045. [Google Scholar] [CrossRef] [Green Version]
  42. Zamfir, M.; Manea, M.D.; Ionescu, L. Return on investment—Indicator for measuring the profitability of invested capital. Valahian J. Econ. Stud. 2016, 7, 79–86. [Google Scholar] [CrossRef] [Green Version]
  43. Wunder, T. What is strategy? In Essentials of Strategic Management: Effective Formulation and Execution of Strategy; Schäffer-Poeschel Verlag: Stuttgart, Germany, 2016; pp. 1–38. [Google Scholar]
  44. Zizlavsky, O. Net present value approach: Method for economic assessment of innovation projects. Procedia Soc. Behav. Sci. 2014, 156, 506–512. [Google Scholar] [CrossRef]
  45. El Tahir, Y.; El Otaibi, D. Internal rate of return: A suggested alternative formula and its macro-economic implications. J. Am. Sci. 2014, 10, 216–221. [Google Scholar]
  46. Bhandari, S.B. Discounted payback period—A viable complement to net present value for projects with conventional cash flows. J. Cost Anal. 1989, 7, 43–53. [Google Scholar] [CrossRef]
  47. Photovoltaic Geographical Information System (PVGIS). Available online: https://ec.europa.eu/jrc/en/pvgis (accessed on 5 July 2020).
  48. Quirós, E.; Pozo, M.; Ceballos, J. Solar potential of rooftops in Cáceres city, Spain. J. Maps 2018, 14, 44–51. [Google Scholar] [CrossRef]
  49. Datasheet of Solar Charge Controller Smart Solar MPPT 100/20 48V. Available online: https://www.inutec-i nt.com/us/victron-energy-smartsolar-mppt-100-20-48v html (accessed on 3 July 2020).
  50. Ruth, M.; Mayyas, A.; Mann, M. Manufacturing competitiveness analysis for PEM and alkaline water electrolysis systems. In Proceedings of the 2017 Fuel Cell Seminar and Energy Expo, Long Beach Conferation Center, Long Beach, CA, USA, 5–7 September 2017. [Google Scholar]
  51. Zachmann, G.; Holtermann, M.; Radeke, J.; Tam, M.; Huberty, M.; Naumenko, D.; Faye, A.N. Rationale for supporting the transition to a new energy and transport system. In The Great Transformation: Decarbonising Europe’s Energy and Transport Systems; Bruegel Blueprint: Brussel, Belgium, 2012; Volume 16, pp. 6–38. [Google Scholar]
  52. Datasheet of Hydrogen Compressor. Available online: https://www.alibaba.com/product-detail/Small-hydrogen--R134A-CAR-REFRIGERATOR-compressor_60424079045.html?spm=a2700.7724857.normalList.212.2 (accessed on 3 July 2020).
  53. Datasheet of Hydrogen Tank. Available online: https://www.alibaba.com/product-detail/300bar-hydrogen-hydrogen-40L-gas-cylinder-air_60843543250.html?spm=a2700.7724857.normalList.89.2dee3f1ctnzKSW (accessed on 3 July 2020).
Figure 1. Block schemes of three investment scenarios: (a) without electricity storage, (b) with energy storage in batteries, (c) with energy storage in hydrogen.
Energies 13 04023 g001
Figure 2. Simplified connection scheme of the tested PV installation.
Energies 13 04023 g002
Figure 3. The amount of energy reaching the horizontal surface and surface set at an optimal angle for individual voivodeship capital [47].
Energies 13 04023 g003
Figure 4. Map of solar radiation intensity in Poland.
Energies 13 04023 g004
Figure 5. Solar radiation and PV system energy yield.
Energies 13 04023 g005
Figure 6. The efficiency of the PV system.
Energies 13 04023 g006
Figure 7. Discounted cumulative cash flows for 3 scenarios.
Energies 13 04023 g007
Table 1. The juxtaposition of optimal installation angels for solar installation [47].
VoivodeshipVoivodeship CapitalAngle, °
Lower SilesiaWroclaw36
Kuyavia-PomeraniaBydgoszcz37
LublinLublin35
LubuszGorzow Wlkp.37
LodzkieLodz36
Lesser PolandCracow35
MasoviaWarsaw36
OpoleOpole36
SubcarpathiaRzeszow35
PodlasieBialystok35
PomeraniaGdansk39
SilesiaKatowice35
Holy CrossKielce35
Warmia-MasuriaOlsztyn38
Greater PolandPoznan37
West PomeraniaSzczecin38
Table 2. The amount of energy reaching the horizontal surface and surface set at an optimal angle for individual voivodeship [47].
VoivodeshipVoivodeship CapitalHorizontalHopt
kWh∙m−2∙yr−1kWh∙m−2∙yr−1
Lower SilesiaWroclaw1109.0221281.485
Kuyavia-PomeraniaBydgoszcz1080.41259.25
LublinLublin1109.61266.55
LubuszGorzow Wlkp.1091.351270.2
LodzkieLodz1091.351251.95
Lesser PolandCracow1102.31259.25
MasoviaWarsaw1080.41241
OpoleOpole1116.91284.8
SubcarpathiaRzeszow1109.61270.2
PodlasieBialystok1062.151215.45
PomeraniaGdansk1120.551332.25
SilesiaKatowice1098.651255.6
Holy CrossKielce1098.651251.95
Warmia-MasuriaOlsztyn1084.051262.9
Greater PolandPoznan1098.651273.85
West PomeraniaSzczecin1076.751259.25
Table 3. Calculated parameters of the system.
ParameterScenario 1Scenario 2Scenario 3
η i n s t , 0.16260.16260.1626
n P V , pc364364364
E y r , kWh∙yr−1113,770113,770113,770
E d , kWh∙d−1311.7311.7311.7
C , Ah- 6408-
E H 2 , kWh∙d−1--280.53
q V H 2 , Nm3∙d−1--22.09
E c , kWh∙d−1--14.18
E S ,   kWh∙d−1--266.34
V t , m3--0.252
P F C , kW--56.7
E n , kWh∙d−1--186.44
Table 4. Investment expenditure of PV array without energy storage (Scenario 1) [25,33,34].
ItemUnitAmountUnit Price, €Cost, €
PV panel 0.275 kWpc.36412846,592
Land for constructionha0.370002100
Inverter 9 kWpc.9142012,780
Total---61,472
Table 5. Investment outlays of a photovoltaic system with Li-Ion battery energy storage (Scenario 2) [25,33,34,37,49].
ItemUnitAmountUnit Price, €Cost, €
PV panel 0.275kWpc.36412846,592
Land for constructionha0.370002100
Inverter 9kWpc.9142012,780
Li-Ion battery 940Ahpc.727,000189,000
Charge regulatorpc.71441152
Total---251,624
Table 6. Investment costs of a photovoltaic system with a hydrogen storage system (Scenario 3) [25,33,34,50,51,52,53].
ItemUnitAmountUnit Price, €Cost, €
PV panels 0.275 kWpc.36412846,592
Land for constructionha0.370002100
Inverter 9 kWpc.9142012,780
Electrolyzerpc.118051805
Compressorpc1225225
Hydrogen tank 0.04 cbmpc.74653255
Fuel cell stack 63 kWpc.130873087
Total---69,844
Table 7. Efficiency, costs, and incomes of the considered scenarios.
NoDescriptionUnitNo Storage
(Scenario 1)
With Batteries
(Scenario 2)
With Storage in H2
(Scenario 3)
1Annual electricity producedkWh·yr−1104,405104,405104,405
2Annual net electricity storedkWh·yr−1104,40599,18462,449
3Investment outlays61,472251,62469,844
4Average annual incomes€·yr−1825511,7647407
Table 8. Detailed results of economic efficiency analysis.
ScenarioNo Storage
(Scenario 1)
Batteries
(Scenario 2)
Hydrogen Storage
(Scenario 3)
Investment expenditures, €61,472251,62469,844
Annual profits (average in 30 years), €8,25511,7647,407
Annual O&M costs, €180018001,800
SPBP, years8.8never14.74
ROI (30 years), %73.4566.4892.48
NPV (30 years), €54,896183,42822,639
IRR (30 years), %9.34-5.28
DPP, years10.21never17.4

