Article

Optimal PV Parameter Estimation via Double Exponential Function-Based Dynamic Inertia Weight Particle Swarm Optimization

by
Arooj Tariq Kiani
1,
Muhammad Faisal Nadeem
1,
Ali Ahmed
1,
Irfan Khan
2,*,
Rajvikram Madurai Elavarasan
3,* and
Narottam Das
4,5
1
Department of Electrical Engineering, University of Engineering and Technology Taxila, Taxila 47080, Pakistan
2
Marine Engineering Technology Department in a joint appointment with the Electrical and Computer Engineering Department, Texas A&M University, Galveston, TX 77553, USA
3
Electrical and Automotive parts Manufacturing unit, AA Industries, Chennai 600 123, Tamilnadu, India
4
School of Engineering and Technology, Central Queensland University, Melbourne, VIC 3000, Australia
5
Centre for Intelligent Systems, School of Engineering and Technology, Central Queensland University, Brisbane, QLD 4000, Australia
*
Authors to whom correspondence should be addressed.
Submission received: 5 June 2020 / Revised: 17 July 2020 / Accepted: 29 July 2020 / Published: 4 August 2020
(This article belongs to the Special Issue Nano-Structured Solar Cells 2020-2022)

Abstract

:
Parameters associated with electrical equivalent models of the photovoltaic (PV) system play a significant role in the performance enhancement of the PV system. However, the accurate estimation of these parameters signifies a challenging task due to the higher computational complexities and non-linear characteristics of the PV modules/panels. Hence, an effective, dynamic, and efficient optimization technique is required to estimate the parameters associated with PV models. This paper proposes a double exponential function-based dynamic inertia weight (DEDIW) strategy for the optimal parameter estimation of the PV cell and module that maintains an appropriate balance between the exploitation and exploration phases to mitigate the premature convergence problem of conventional particle swarm optimization (PSO). The proposed approach (DEDIWPSO) is validated for three test systems; (1) RTC France solar cell, (2) Photo-watt (PWP 201) PV module, and (3) a practical test system (JKM330P-72, 310 W polycrystalline PV module) which involve data collected under real environmental conditions for both single- and double-diode models. Results illustrate that the parameters obtained from proposed technique are better than those from the conventional PSO and various other techniques presented in the literature. Additionally, a comparison of the statistical results reveals that the proposed methodology is highly accurate, reliable, and efficient.

Graphical Abstract

1. Introduction

Environmental concerns, inflating fossil fuel prices and the depletion of conventional energy resources, compel researchers to retain their efforts towards sustainable, reliable, and economical sources for electric power generation. In this aspect, renewable energy sources (RES) like biomass, solar, hydro, and wind are gaining the interest of researchers [1,2]. Among these RES, solar energy is a widely and freely available energy source, which can be easily captured directly through a photovoltaic (PV) system [3,4]. Some factors which emphasize the importance of solar energy are listed below:
  • Less operational cost (as no fuel is consumed) [5];
  • Low maintenance (as it requires no lubrication as well as no dynamic part or machinery is involved) [6];
  • Very little or no greenhouse gas emission results in reduced air pollution [7].
A PV cell is a basic unit of a PV system, and various cells are combined in series and parallel configuration to form a PV module for generating electric power of a required level [8]. The accurate electrical and mathematical modeling of PV cells/modules is a hot research topic nowadays, as it helps to understand the non-linear behavior of a PV system under certain atmospheric conditions, such as a partial shading condition or an abrupt change in temperature and irradiance levels [9]. The most common approach to accurately model PV cells and module behavior is to utilize electrical equivalent models. Single and double-diode models are widely opted and utilized by various researchers for PV cell/module modeling [10,11,
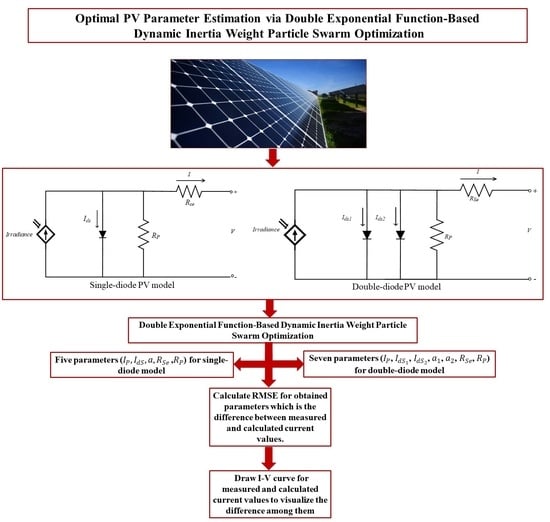
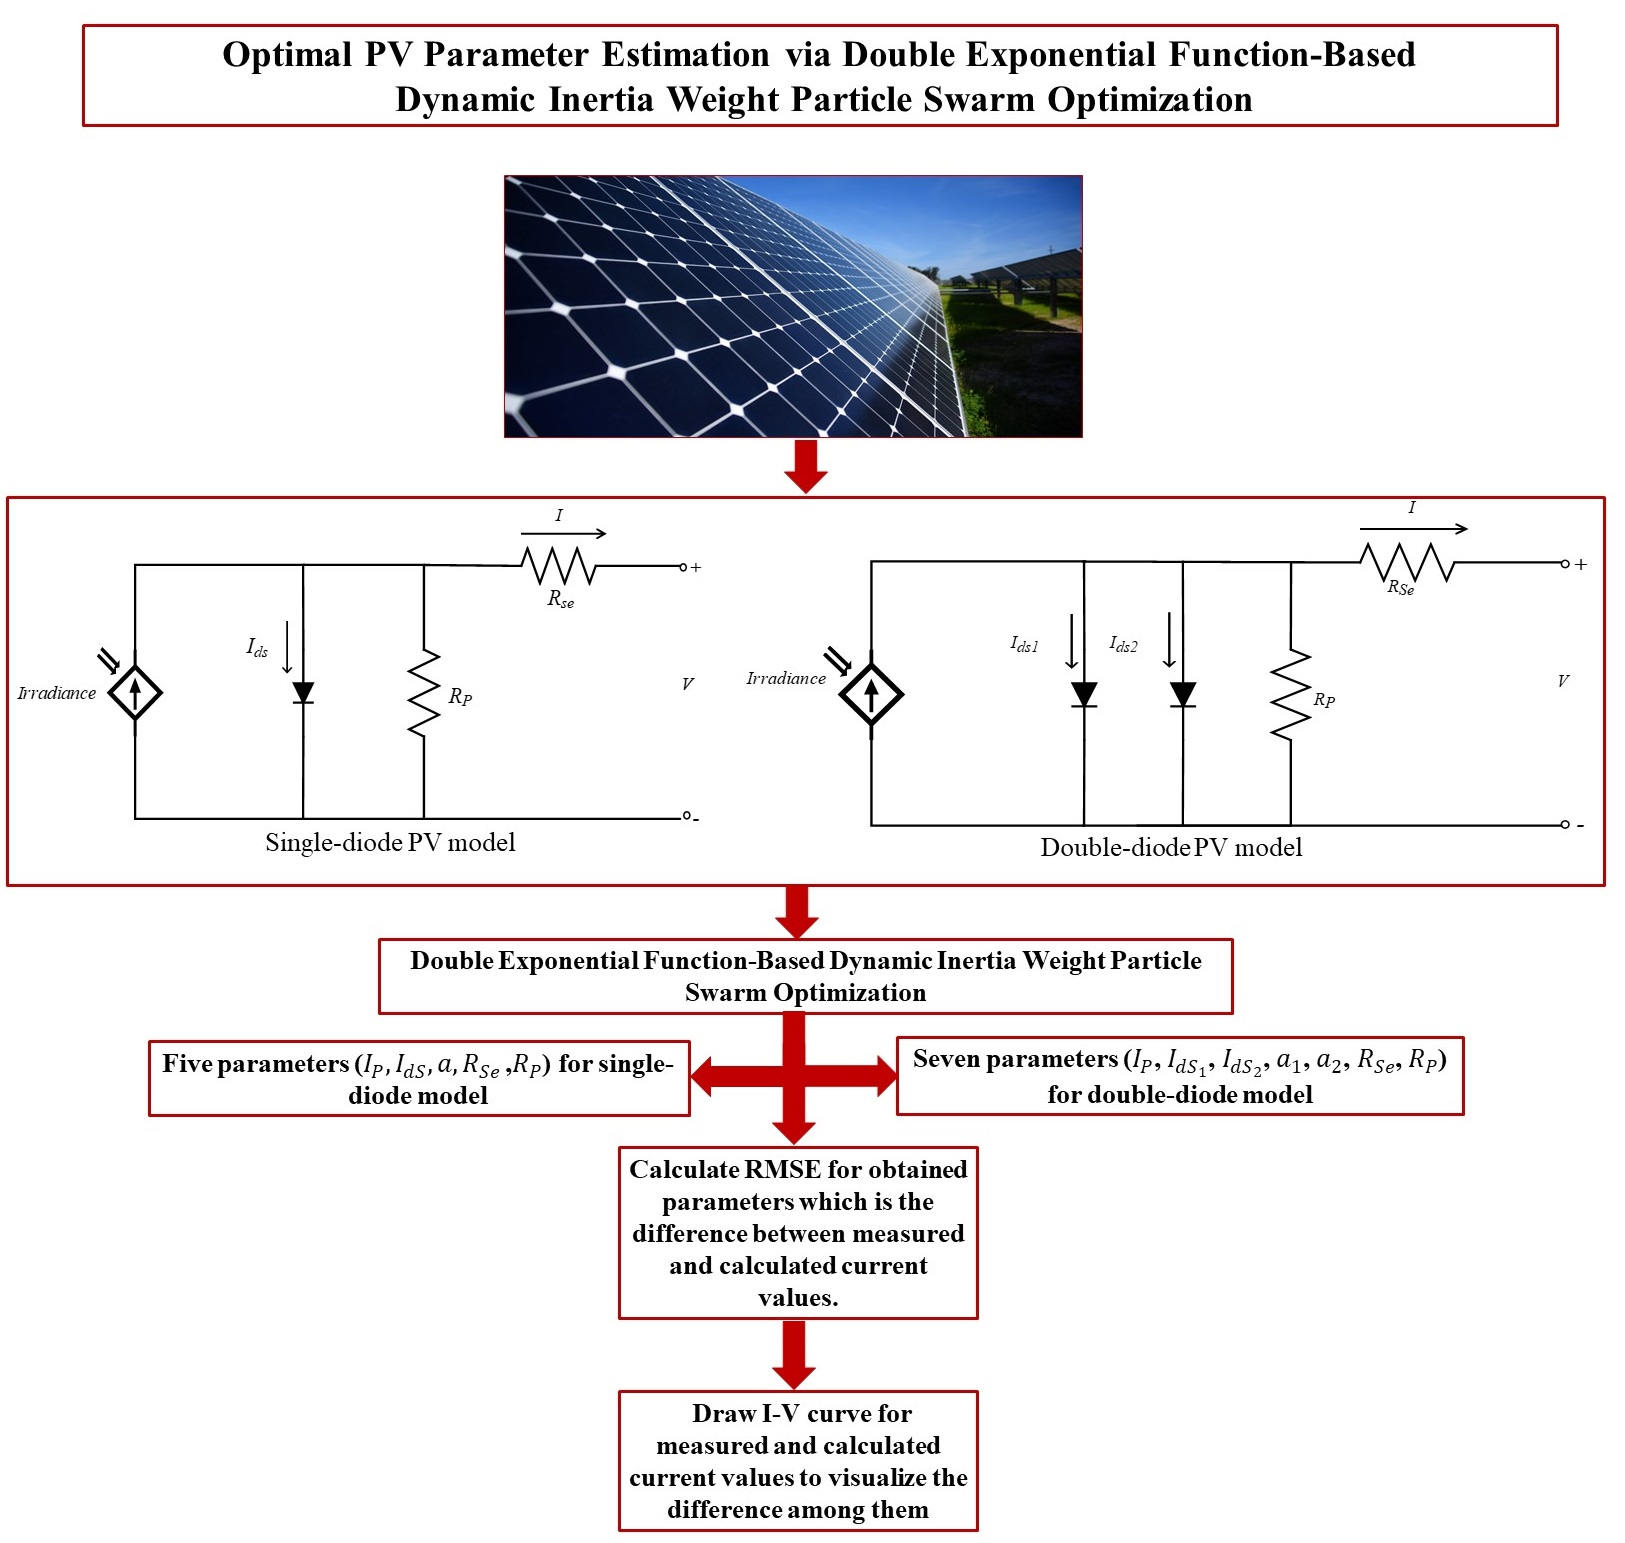
12]. The single-diode model presented in Figure 1 has five associated parameters; I P , I d S ,   a ,   R S e   and   R P . The I–V characteristic defined by the Shockley diode equation is as follows in Equation (1) [13]:
I = I P I d S [ e x p ( q ( V + I R S e ) a k T ) 1 ] ( V + I R S e ) R P
where, I P , I d S ,   a ,   R S e ,   R P are the photon current, diode saturation current, diode ideality factor, series resistance and the parallel resistance, respectively. These five parameters must be estimated for the modeling of single-diode solar cells and modules, while   q , k , T represent the electron charge, Boltzmann constant, and temperature in Kelvin, respectively.
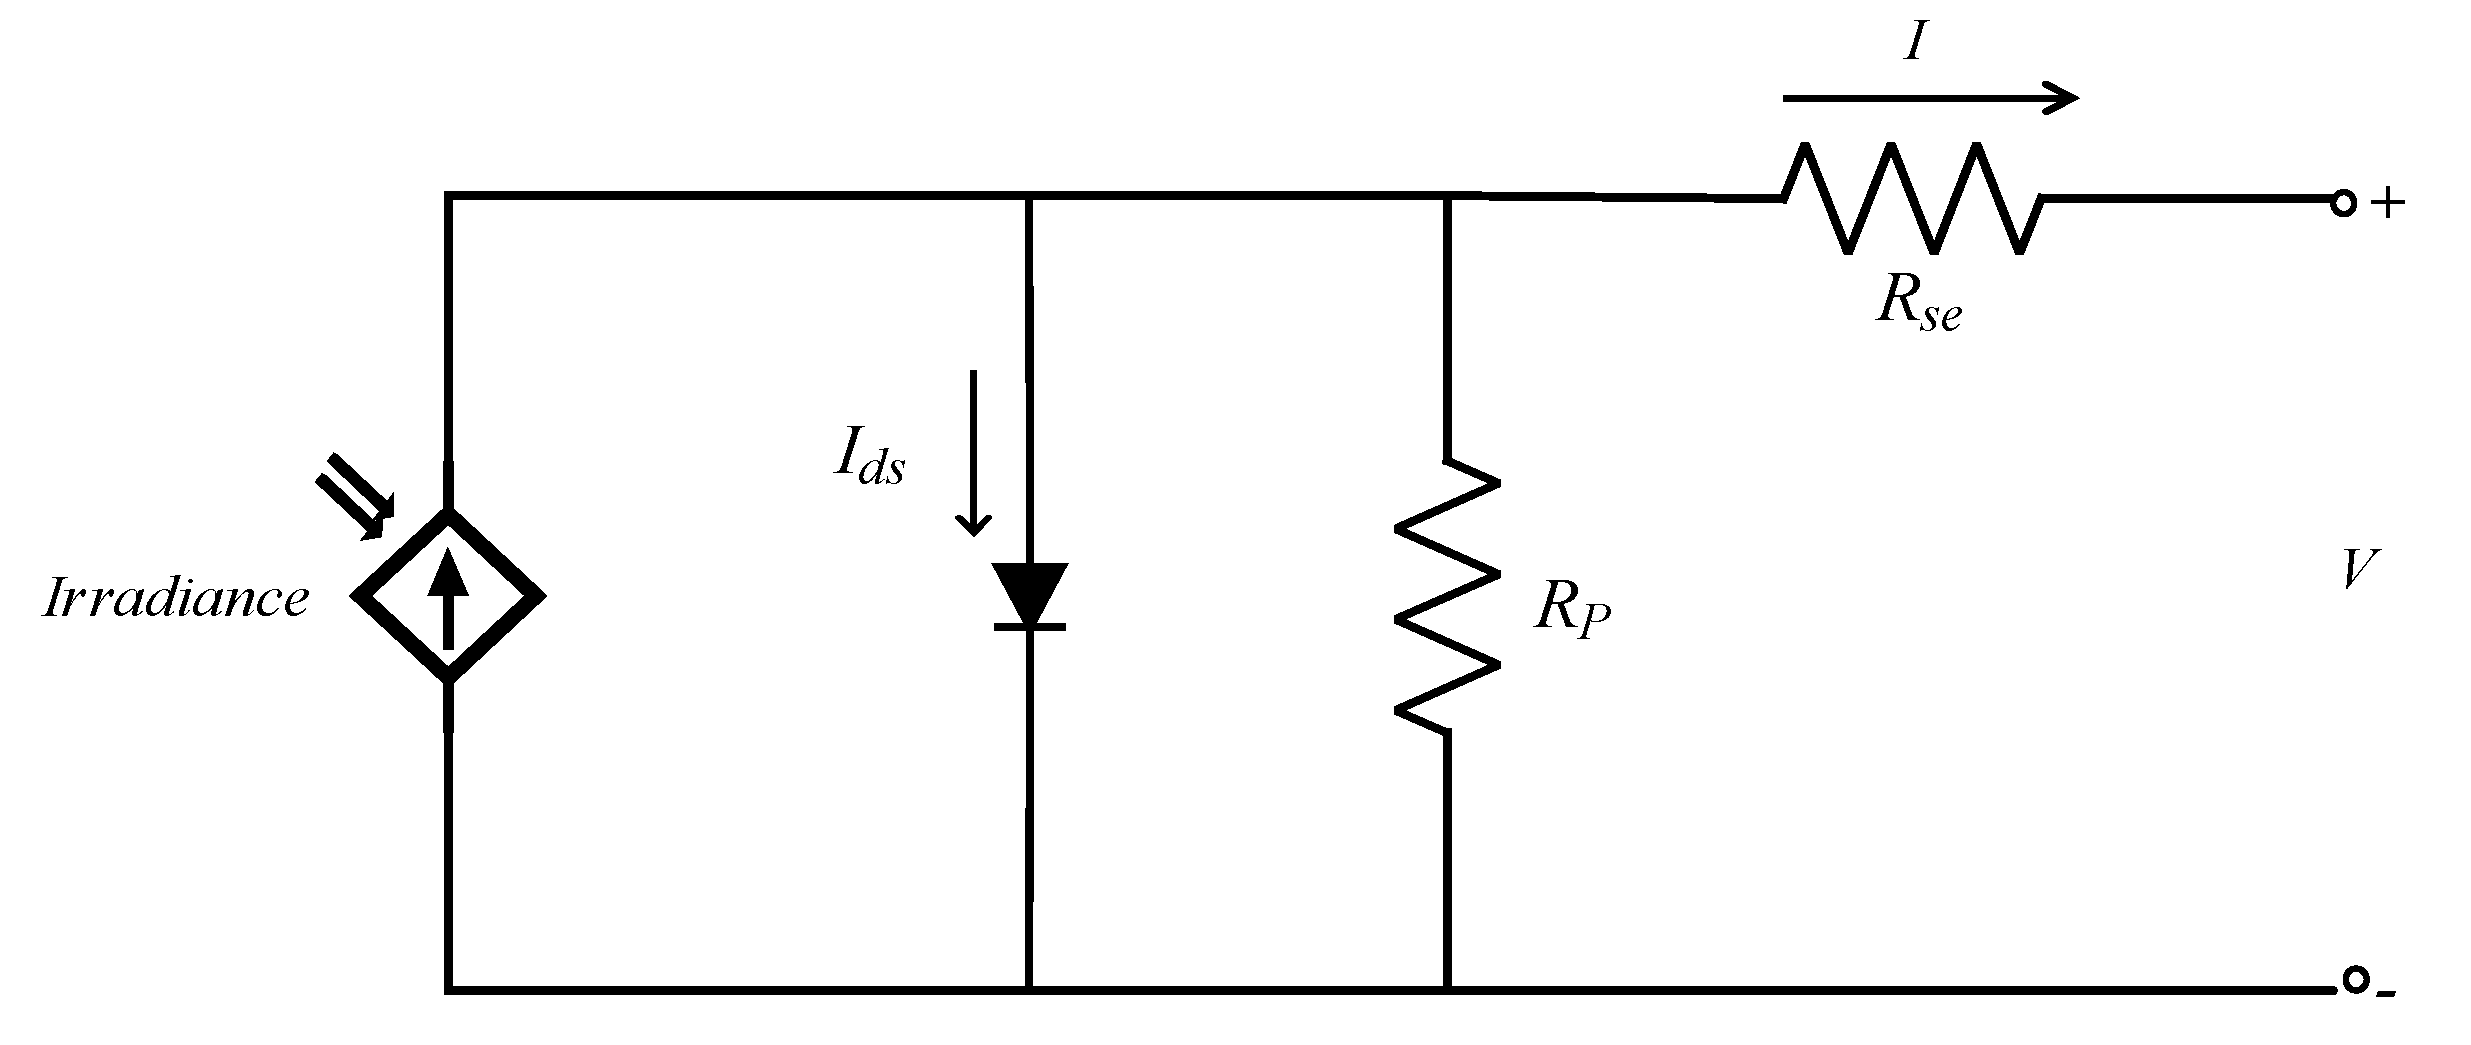
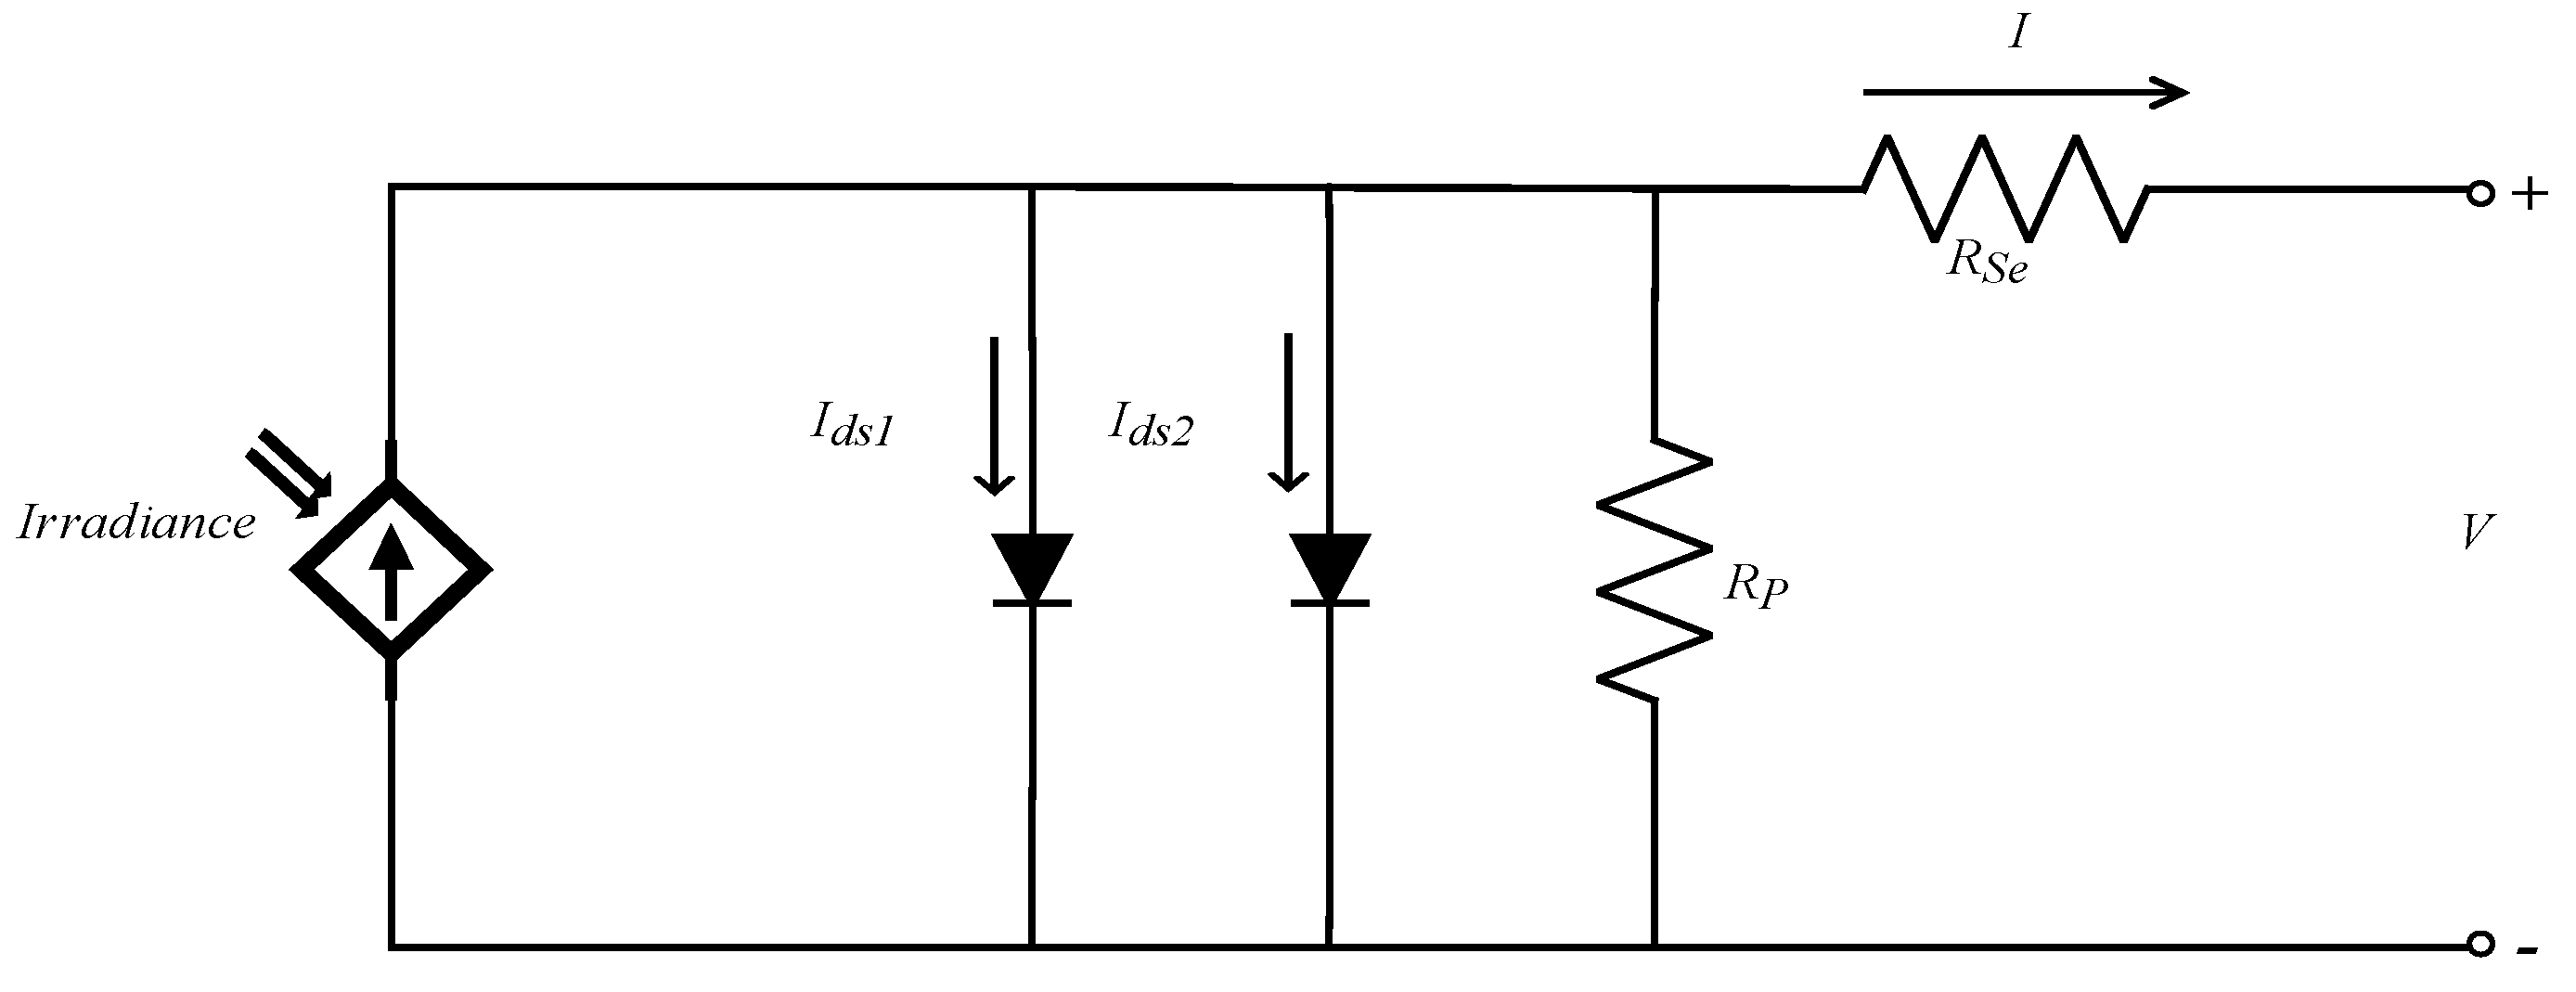
The second most utilized PV model is a double-diode model, presented in Figure 2. The I–V characteristics of the double-diode model are depicted in Equation (2) [14]:
I = I P I d S 1 [ e x p ( q ( V + I R S e ) a 1 k T ) 1 ] I d S 2 [ e x p ( q ( V + I R S e ) a 2 k T ) 1 ] ( V + I R S e ) R P
where, I d S 1 , I d S 2 are the saturation currents of diode 1 and 2; a 1 ,   a 2 are the ideality factors of diode 1 and 2, respectively. The seven associated parameters I P , I d S 1 , I d S 2 , a 1 , a 2 , R S e , R P of the double-diode model must be estimated efficiently to accurately calculate the current from the double-diode cell or module [15]. The double-diode model is more complex but offers more accuracy than a single-diode model [16]. Five parameters for the single and seven parameters for the double-diode model must be estimated in such a way that the obtained model accurately emulates the I–V characteristics of the original model, such that the difference in the calculated and originally measured currents for the PV cell/module should be minimal [17]. Therefore, this problem emerged as an optimization problem and is termed as the “parameter estimation of solar cells and modules”.
To solve this optimization problem, various methodologies have been utilized by researchers, which can be categorized into two broad term categories. Analytical approaches involve the formulation of functions based on the information obtained from the datasheet [18,19] and metaheuristic techniques which estimate PV parameters by converting them into an optimization problem. Analytical approaches require complex computational efforts and are not suitable for large or complex systems [20]. However, metaheuristic approaches are artificially intelligent population-based techniques that aim to find a global best solution for any optimization problem [1,21] by updating the population in an iterative process and are mostly utilized for estimating the PV parameters of cells and modules [22].
In [23], a biogeography-based heterogeneous cuckoo search algorithm (BHCS) has been proposed, which combines the biogeography and cuckoo search algorithm. Two test systems, the RTC France solar cell and the STM6-40/36 module, were utilized for the validation of results. Data from [24] were utilized for the parameter estimation of the PV cell and module, while the root mean square error (RMSE) was considered as an objective function as defined in Equation (3) [25]:
R M S E = i = 1 M ( I i , m I i , c a l ) 2 M
where, I i , m represents the measured current of the solar model obtained from [24] , I i , c a l represents the calculated current and M is the number of I–V pairs.
In [26], the artificial bee colony has been utilized for the parameter estimation of single- and double-diode RTC France solar cell considering varying temperature levels. A modified variant of artificial bee colony (ABC) has been proposed in [27] for the parameter estimation of the single- and double-diode cell models. The RTC France solar cell with a 57 mm diameter was utilized for the validation of the proposed approach, and the obtained results were compared with various other algorithms. In [28], a differential evaluation (DE) algorithm was utilized for the parameter estimation of solar cells, including thin-film, multi-crystalline, and mono-crystalline cells. A penalty function was introduced for constraint handling. An improved variant of DE was proposed in [29] for the parameter estimation of the RTC France solar cell. An adoptive cross-over rate, a mutation strategy, and an adaptive scaling factor were introduced to improve the search ability of the conventional DE algorithm. In [30], the cuckoo search (CS) algorithm was utilized for the parameter estimation of the RTC France solar cell, which represents high accuracy under various operating conditions. In [31], a cat swarm optimization (CSO) has been presented for the parameter estimation of single- and double-diode cells and modules. The RTC France solar cell and PWP201 Photo-watt module have been considered for the validation of results.
Despite all the merits of metaheuristic approaches, they offer some limitations, such as the particle swarm optimization (PSO) which suffers from premature convergence problem, which implies that while searching for the global best solution, it can be easily trapped in local solution, hence providing non-optimal results. To solve this problem, the researchers proposed different improved variants of PSO. In [32], a chaotic inertia weight PSO (CIWPSO) has been implemented for the parameter extraction of single- and double-diode solar cells. In this variant, the inertia weight follows a chaotic map logic to find an optimal solution while avoiding premature convergence. In [33], time-varying acceleration coefficient PSO (TVACPSO) was proposed for the parameter estimation of single- and double-diode solar cells and modules. In this proposed variant, the personal acceleration coefficient was decreased, and the social acceleration coefficient was increased during the iterative process. In [34], enhanced leader PSO (ELPSO) was proposed for the parameter estimation of single- and double-diode models. In this variant, the leader particle was enhanced by utilizing a five-staged mutation strategy. The results were compared with other available techniques. In [35], another improved variant named guaranteed convergence PSO (GCPSO) was implemented for the parameter estimation of PV cells and modules. In this variant, the success and failure rate along with a scale factor were proposed, which guarantee the convergence of the algorithm towards an optimum solution.
The comprehensive evaluation of literature depicts that a lot of work has been presented in [21,22,23,24] to cope with the premature convergence problem of conventional PSO. However, the studies [21,22,23] have not proven the strength of the proposed approaches on a real-time practical system, that undergoes variation in irradiance and temperature levels, hence increasing the computational burden. There is thus a need to present a dynamic strategy that can effectively deal with the issues of conventional PSO in real-time scenarios. This paper proposes a double exponential dynamic inertia weight PSO (DEDIWPSO) for the parameter estimation of single- and double-diode cells and modules. This inertia weight strategy was inspired by decreasing the rate of an exponential function. The fast growing nature of the exponential function improves the speed of convergence by maintaining a balance between the global and local search. The notable contributions of this paper are mentioned below:
  • A dynamic and efficient strategy—DEDIWPSO—was proposed to solve the premature convergence problem of conventional PSO, hence providing optimal, efficient, and accurate solutions for the parameter estimation problem;
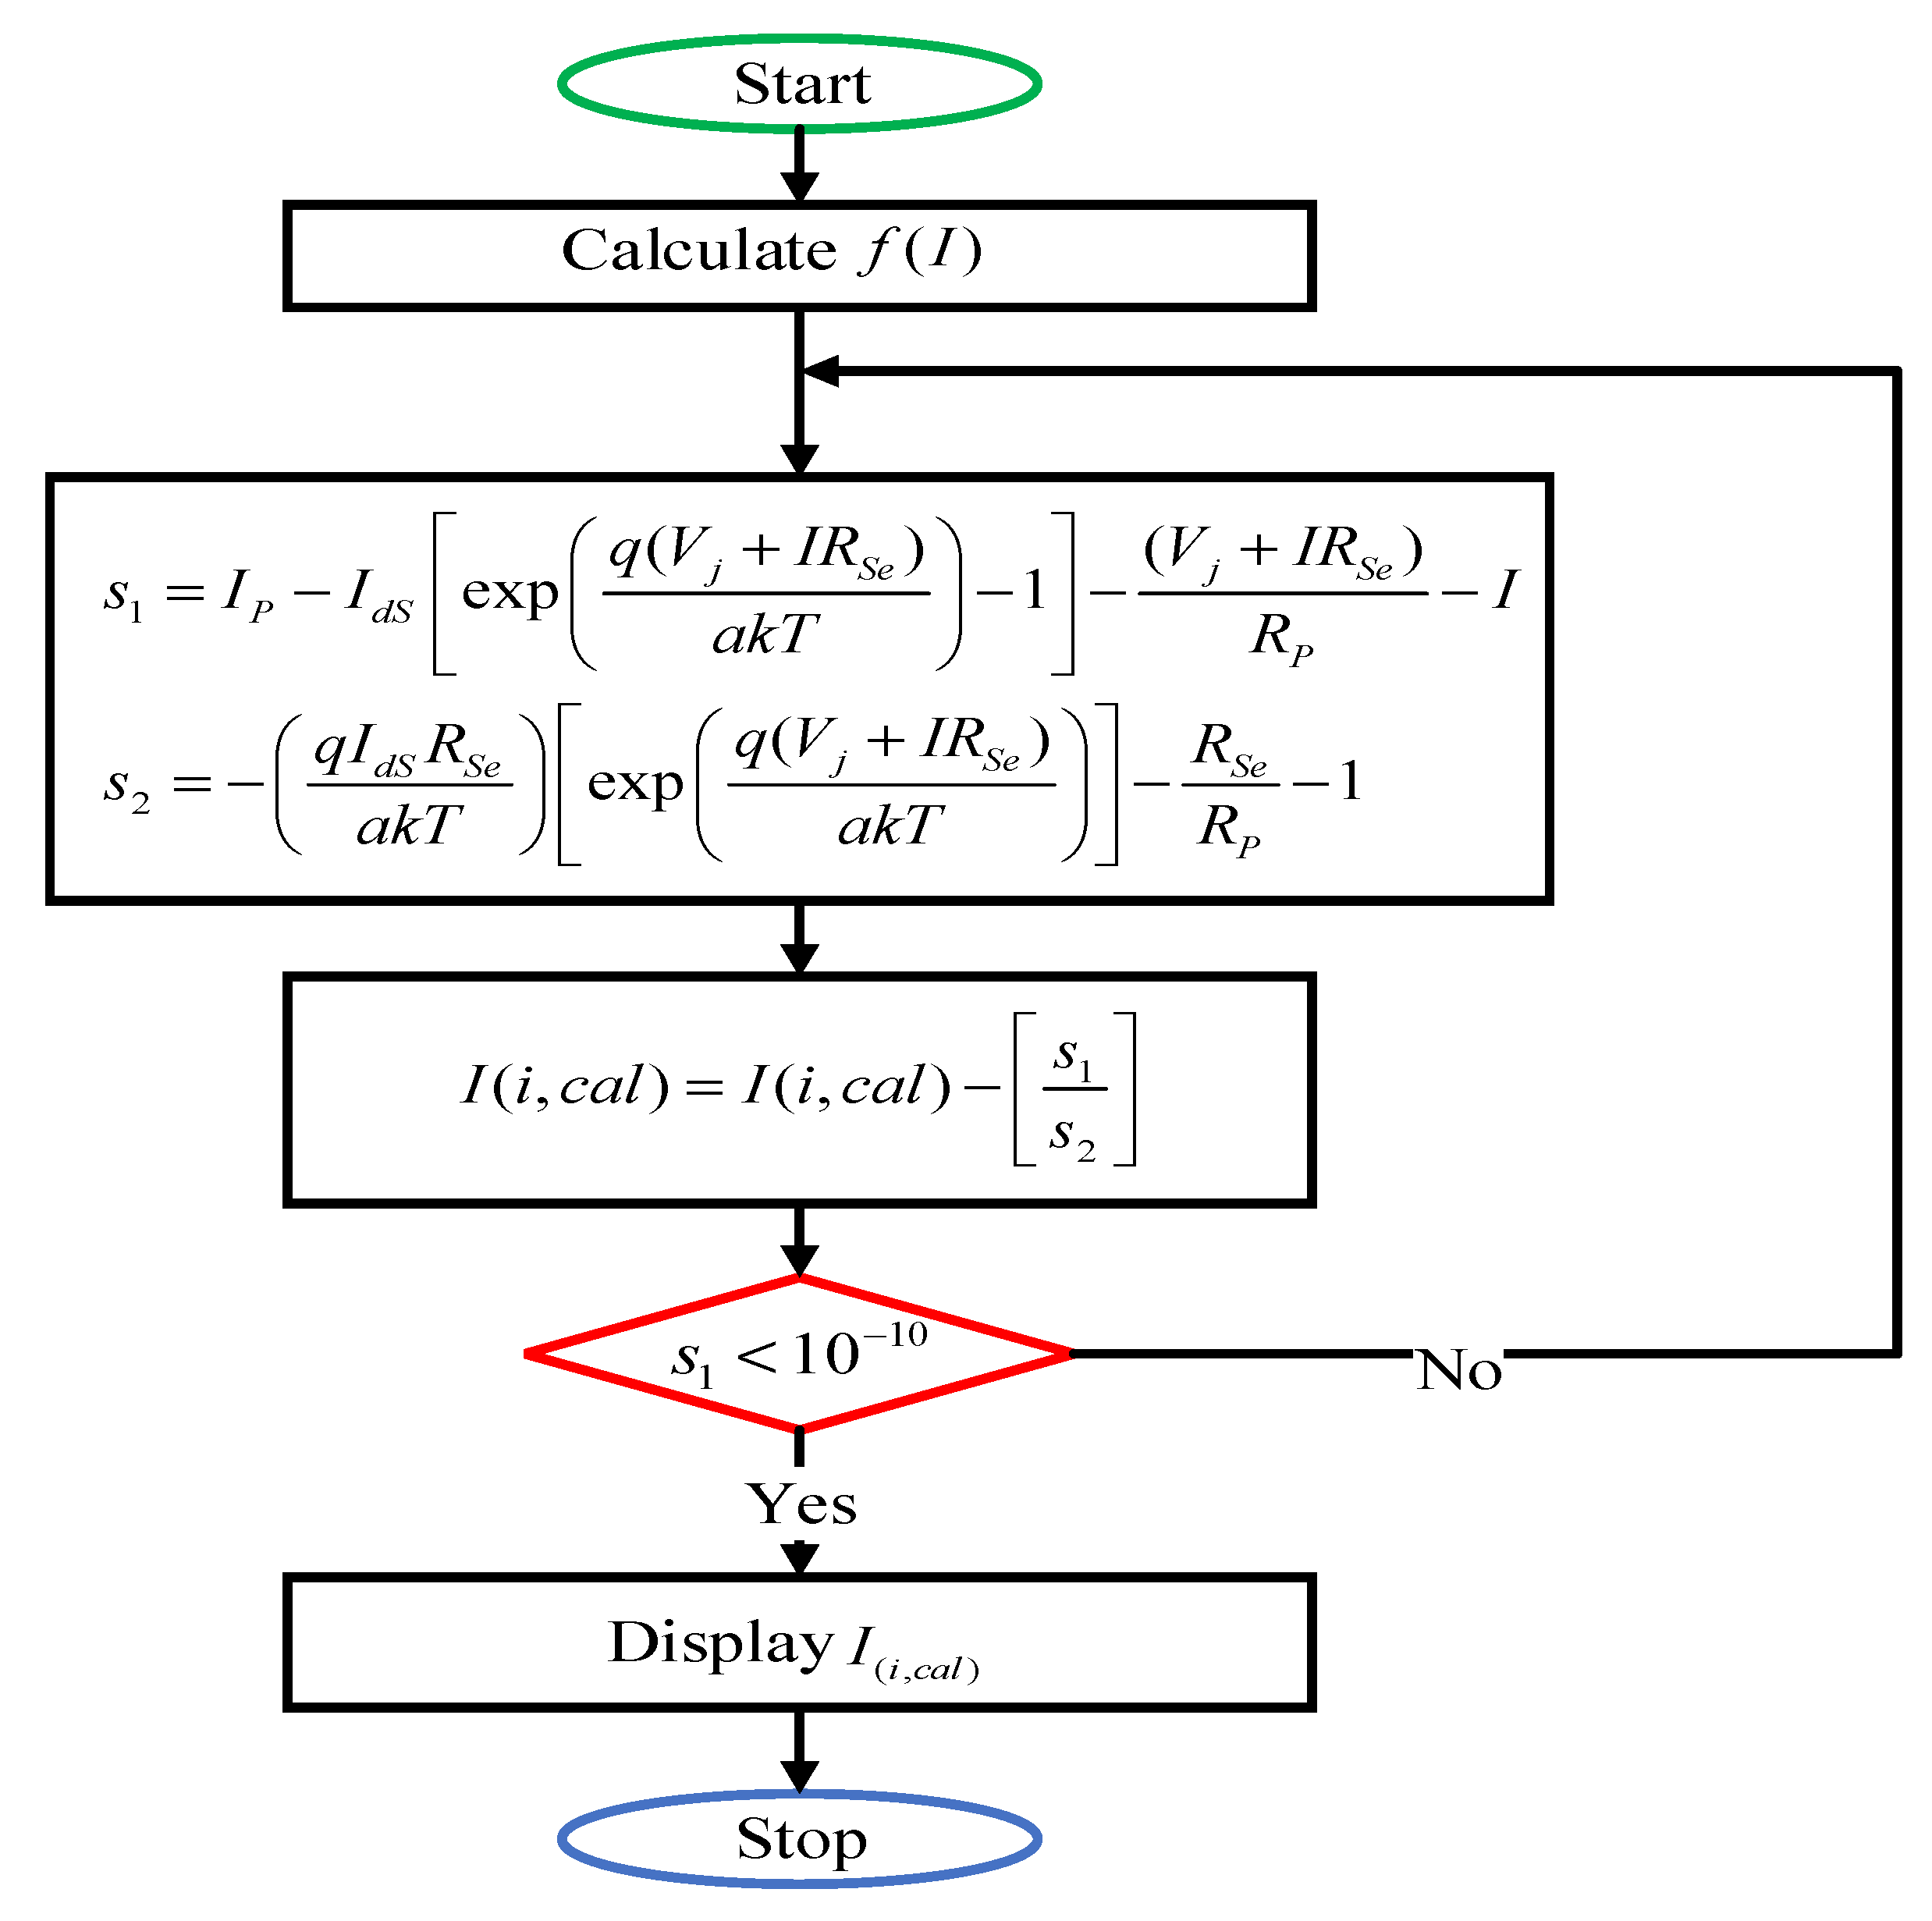
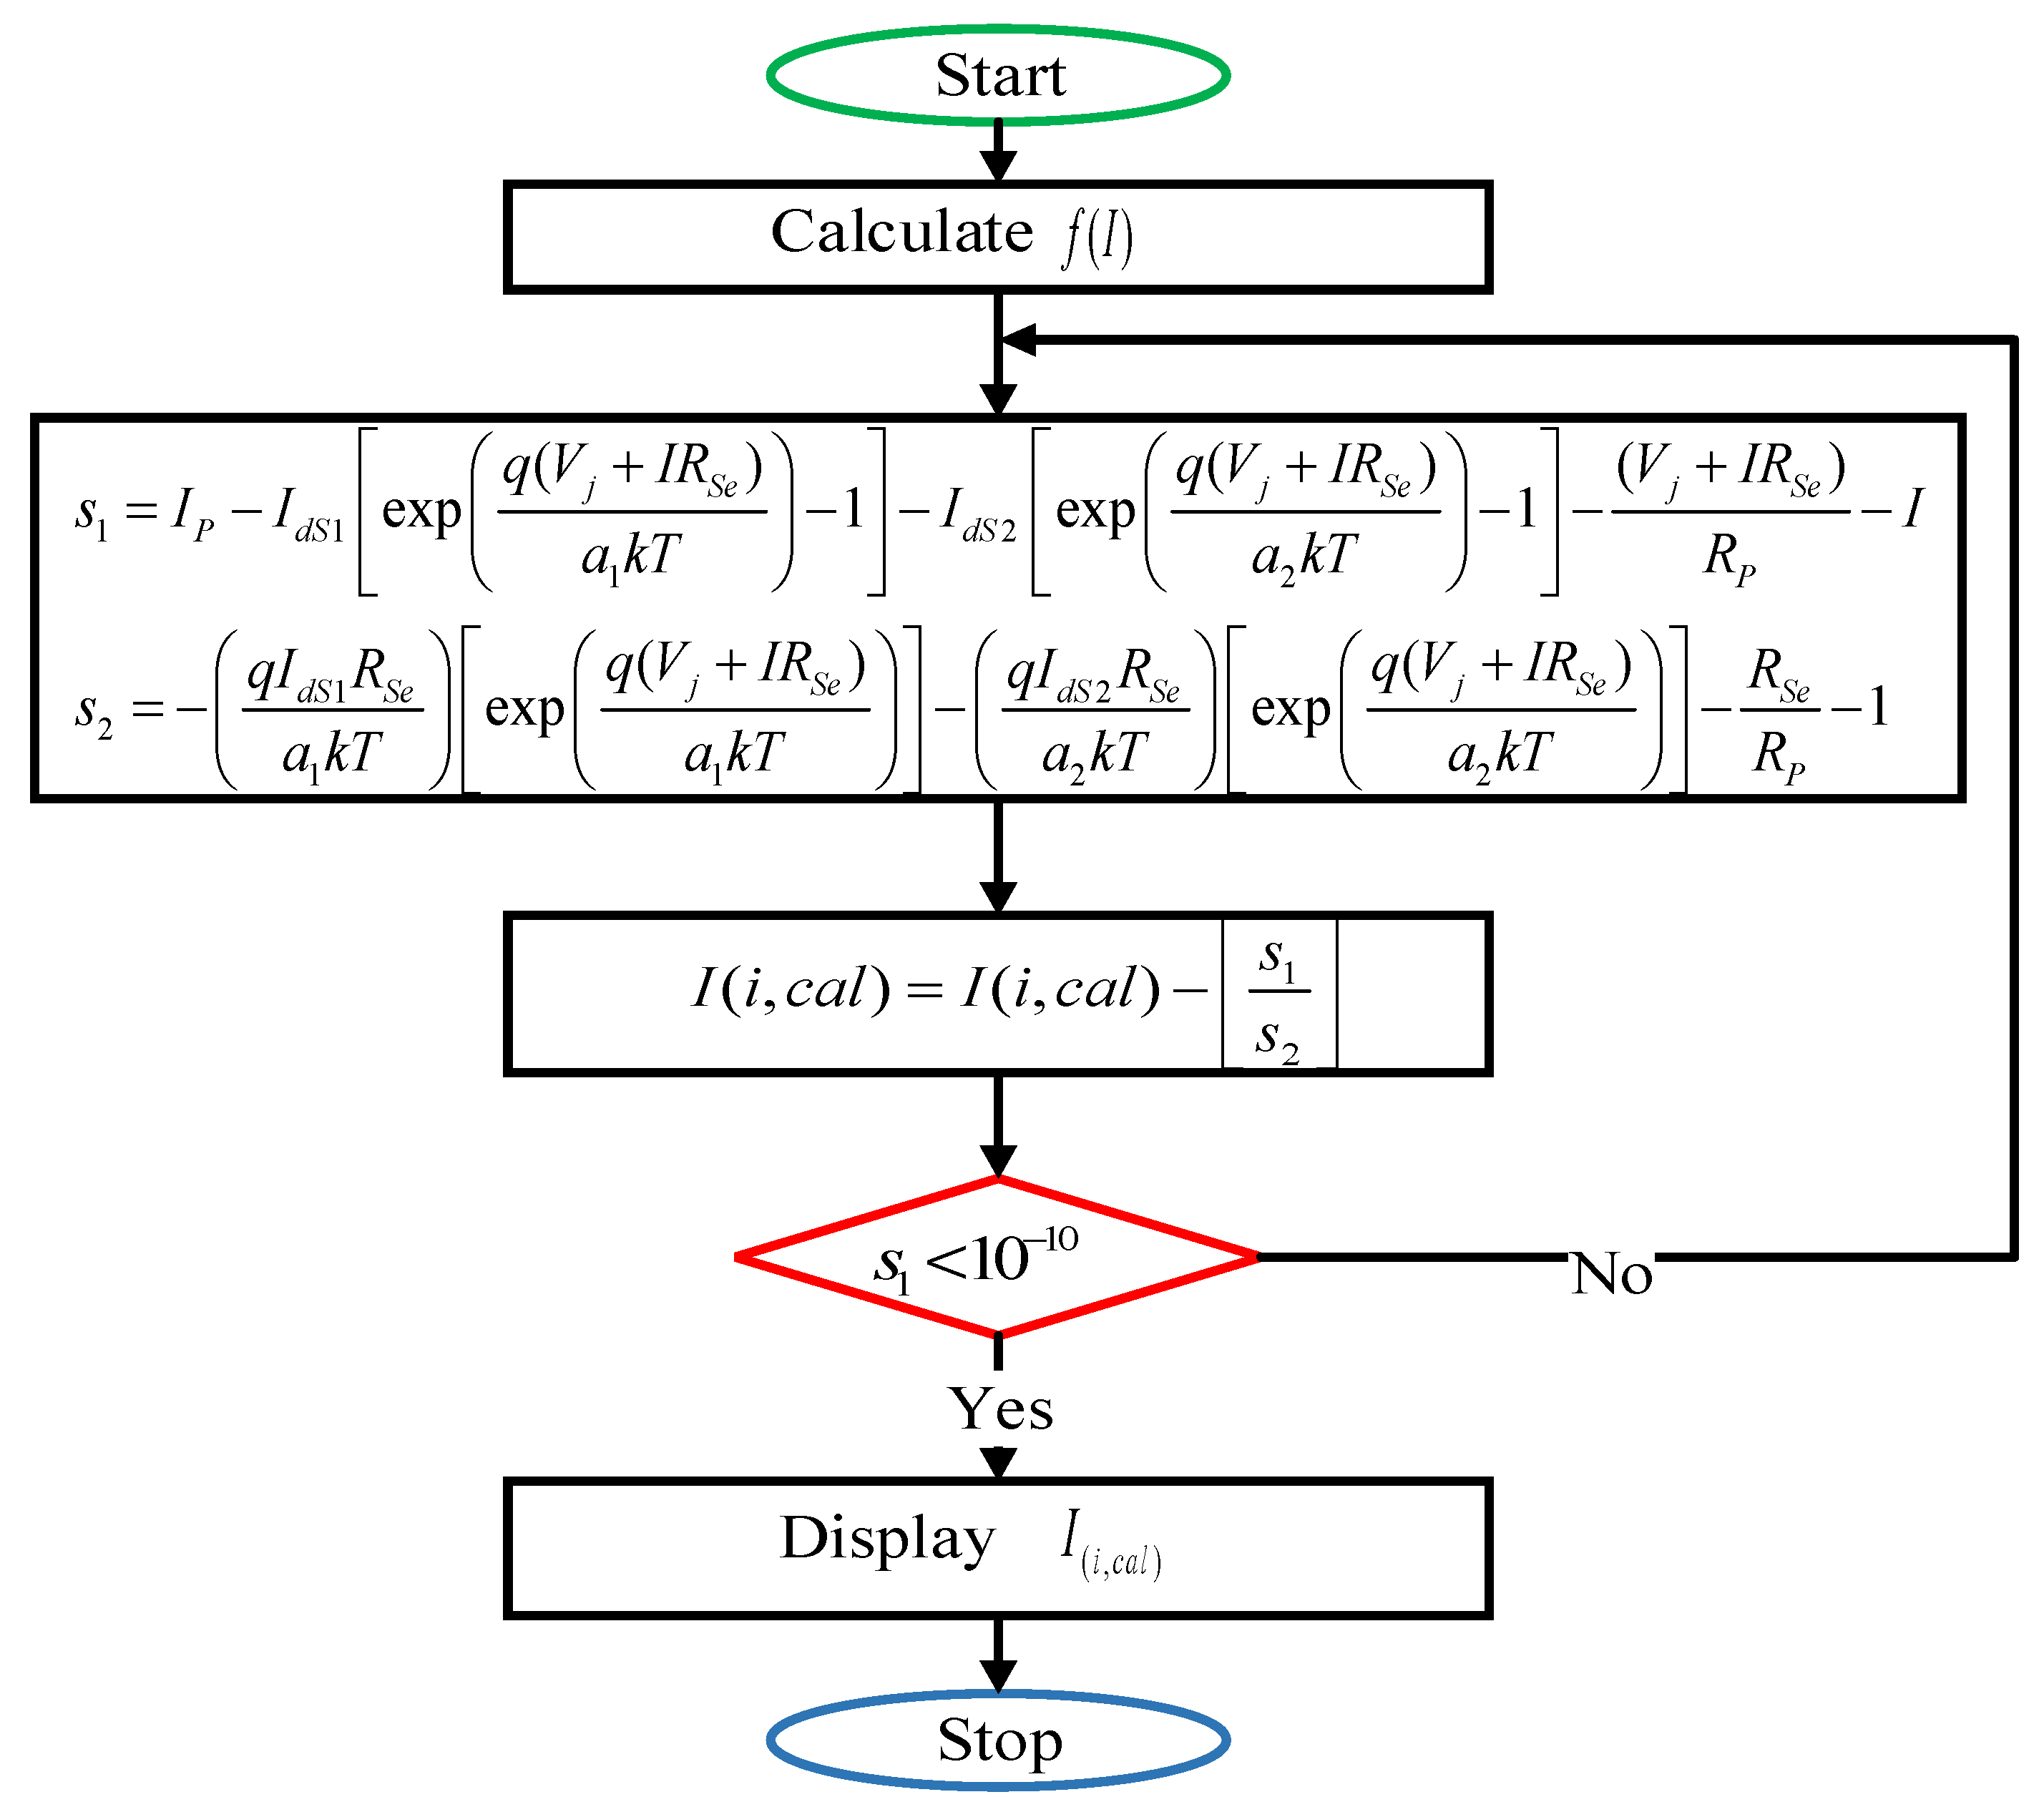
  • A Newton–Raphson method (NRM)-based computational intelligent (CI) approach was implemented to accurately estimate the current for each set of optimal parameters;
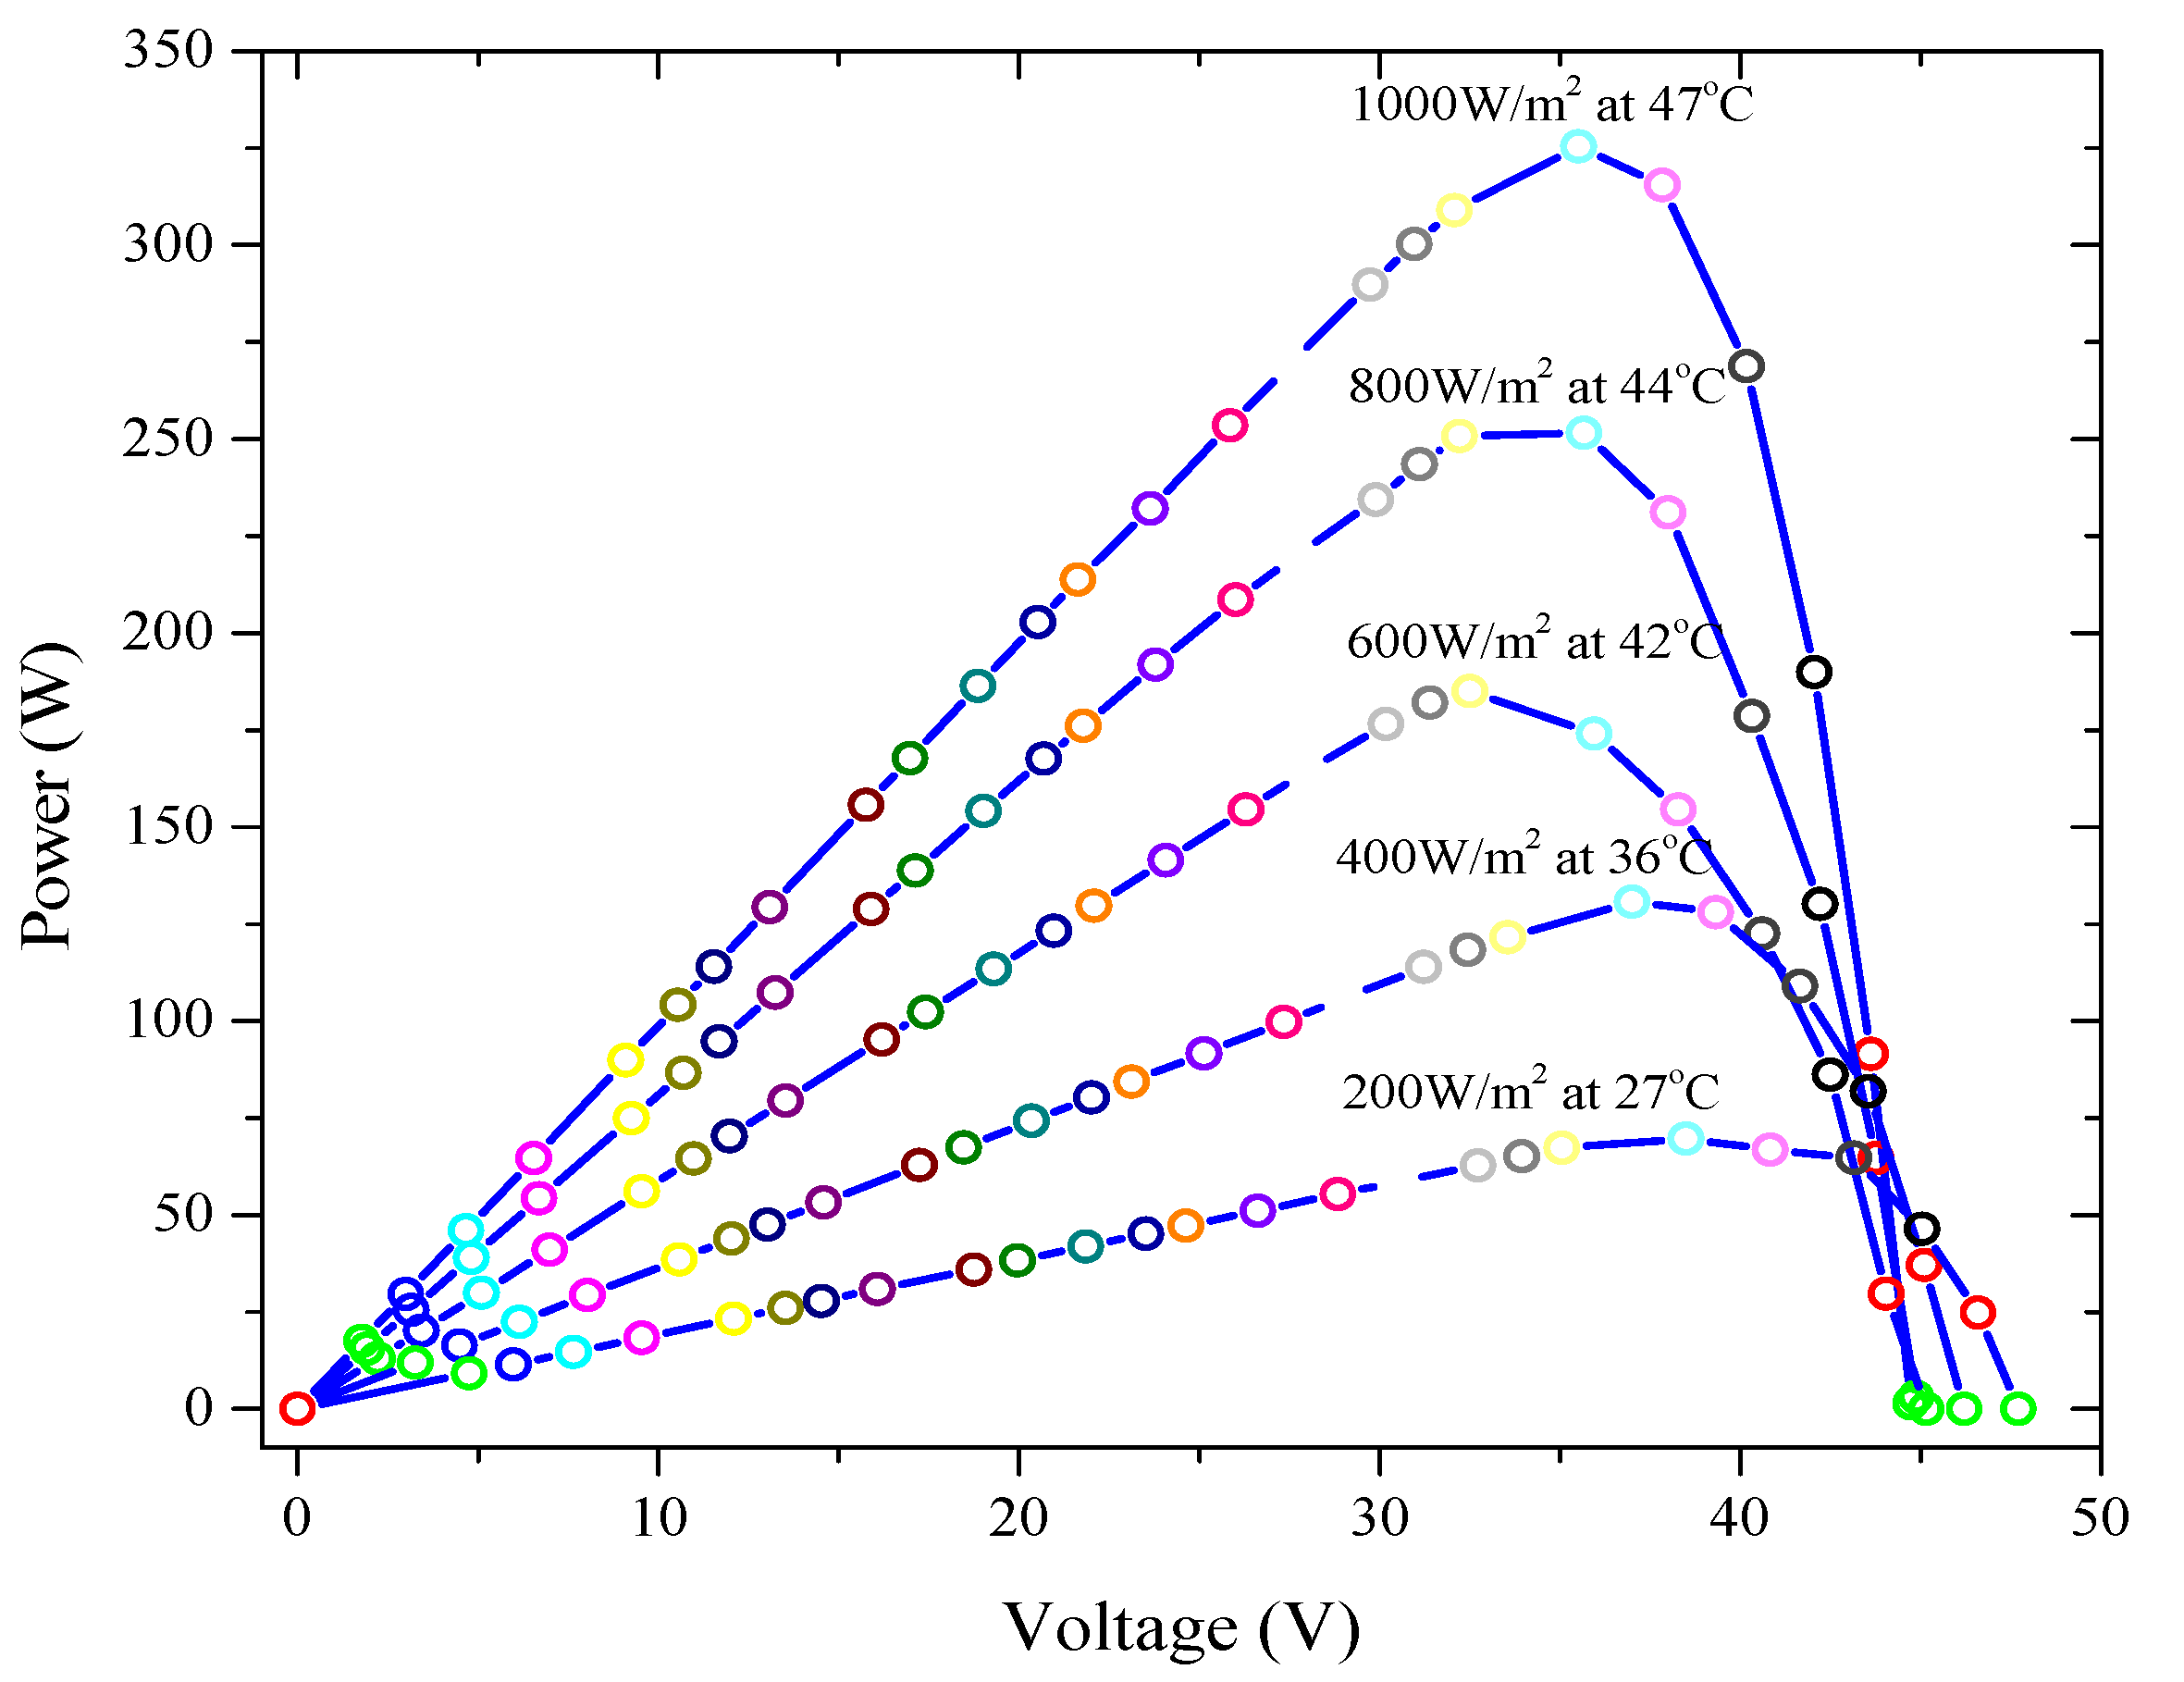
  • Three case studies, (1) the RTC France solar cell, (2) the PWP201 Photo-watt module, and a practical test system JKM330P-72 (310 W) polycrystalline module under real environmental conditions were considered for the validation of the proposed approach;
  • The obtained optimal results and statistical analysis were compared with other techniques available in the literature to present the effectiveness of the proposed approach.
The remainder of this paper is arranged as follows: Section 2 formulates the PV parameter estimation as an optimization problem, Section 3 presents the proposed methodology to solve this optimization problem, Section 4 discusses the obtained results from the proposed technique, and finally Section 5 concludes the whole paper.

2. Problem Formulation

This section presents the parameter estimation problem as an optimization problem for single- and double-diode models. For the accurate estimation of PV parameters, it is aimed to obtain the set of parameters that show the minimum difference between the measured and calculated data, which results in the minimum value of objective function.

2.1. Single-Diode Model

Data obtained from [24] consist of 26 pairs of I–V ( I j , V j ) data and for each pair, and the current is calculated by solving the nonlinear equation in Equation (4) given below:
I = I P I d S [ e x p ( q ( V j + I R S e ) a k T ) 1 ] ( V j + I R S e ) R P
Solving Equation (4) for f ( I ) = 0 gives Equation (5).
f ( I ) = I P I d S [ e x p ( q ( V j + I R S e ) a k T ) 1 ] ( V j + I R S e ) R P 1 = 0
Equation (5) is then solved by the Newton–Raphson method (NRM), as represented in Figure 3, where, s 1 , s 2 illustrate f ( I ) and its derivative, respectively, I i , c a l represents the calculated current obtained by solving Equation (5) for the I–V data. The difference between I i , m and I i , c a l is then obtained by considering RMSE as an objective function (OF):
min ( O F , R M S E ) = i = 1 M ( I i , m I i , c a l ) 2 M
The aim of the proposed methodology was to minimize an objective function by extracting the optimal parameters that are bound between the upper and lower limits. The value of these limits for the PV module is presented as follows:
I P [ 0 , 1.2 ] A , I d S [ 10 12 , 10 5 ] A , a [ 0.5 , 2.5 ] , R S e [ 0.001 , 2 ] , R P [ 0.001 , 5000 ]
Similarly, the value of the upper and lower limits for the solar cell is given as below:
I P [ 0 , 1 ] A , I d S [ 10 12 , 10 5 ] A , a [ 0.5 , 2.5 ] , R S e [ 0.001 , 0.5 ] , R P [ 0.001 , 100 ]
Bounds for the JKM330P-72 (310 W) polycrystalline module are given as
I P [ 0 , 10 ] A , I d S [ 10 12 , 10 5 ] A , a [ 0.5 , 2.5 ] , R S e [ 0.001 , 2 ] , R P [ 0.001 , 5000 ]

2.2. Double-Diode model

For a double-diode model, the data obtained from [24] consist of 26 pairs of I–V ( I j , V j ) data and for each pair, the current is calculated by solving nonlinear Equations (7) and (8) as given below:
I = I P I d S 1 [ e x p ( q ( V + I R S e ) a 1 k T ) 1 ] I d S 2 [ e x p ( q ( V + I R S e ) a 2 k T ) 1 ] ( V + I R S e ) R P
Solving (7) for f ( I ) = 0 gives (8):
f ( I ) = I = I P I d S 1 [ e x p ( q ( V + I R S e ) a 1 k T ) 1 ] I d S 2 [ e x p ( q ( V + I R S e ) a 2 k T ) 1 ] ( V + I R S e ) R P 1 = 0
Equation (8) is then solved by NRM, as represented in Figure 4, where, s 1 , s 2 illustrate f ( I ) and its derivative, respectively. I i , c a l represents the calculated current obtained by solving (8) for the I–V data. To model the PV cell as a double-diode model, the parameter ranges are presented as follows:
I P [ 0 , 1 ] A , I d S 1 [ 10 12 , 10 5 ] A , I d S 2 [ 10 12 , 10 5 ] A , a 1 [ 0.5 , 2.5 ] , a 2 [ 0.5 , 2.5 ] R P [ 0.001 , 100 ] , R S e [ 0.001 , 0.5 ]
Similarly, the upper and lower parameter limits for the PV module are given as below:
I P [ 0 , 1.2 ] A , I d S 1 [ 10 12 , 10 5 ] A , I d S 2 [ 10 12 , 10 5 ] A , a 1 [ 0.5 , 2.5 ] , a 2 [ 0.5 , 2.5 ] R S e [ 0.001 , 2 ] R P [ 0.001 , 5000 ]
Bounds for the JKM330P-72 (310 W) polycrystalline double-diode module are given as
I P [ 0 , 10 ] A , I d S 1 [ 10 12 , 10 5 ] A , I d S 2 [ 10 12 , 10 5 ] A , a 1 [ 0.5 , 2.5 ] , a 2 [ 0.5 , 2.5 ] R S e [ 0.001 , 2 ] R P [ 0.001 , 5000 ]

3. Proposed Methodology

Particle swarm optimization (PSO) is a population-based metaheuristic technique inspired by the swarming behavior of birds and fishes they present while moving from one place to another in search of food. A population consists of N number of particles, and these individuals (particles) explore search space to find a globally optimum solution. Equation (9) presents the position of the j t h particle in the multidimensional search space:
χ j 1 + χ j 2 , χ d j , χ j m
where m represents the number of decision variables (dimensions). At first, the N number of particles were initialized randomly in a confined search space. Then, the personal best ( ք b e s t ) and global best ( ģ b e s t )   are calculated and updated by evaluating the objective function. Personal best position of a particle is considered as   ք b e s t and the best value among all particles is considered as ģ b e s t . The position and velocity of each particle are updated in every iteration using the following Equations (10) and (11):
ν j ( i t + 1 ) = ω ν j ( i t ) + c 1 r 1 (   ք b e s t j χ j ) + c 2 r 2 (   ģ b e s t χ j )
χ j ( i t + 1 ) = χ j ( i t ) + ν j ( i t + 1 )
where ν j , χ j represent the velocity and position of the j t h particle, respectively. c 1 , c 2 are the personal and social acceleration coefficients, respectively. ω is the inertia weight coefficient and r 1 , r 2 are random numbers between 0 and 1. After updating ν j and χ j , the personal best ( ք b e s t ) and global best ( ģ b e s t ) are updated, and this procedure continues until the stopping criteria is achieved.
PSO is simple and widely utilized by researchers for solving various optimization problems [36] but like other metaheuristic techniques, it has a tendency to become stuck in local minima due to the “stagnation of particles” that leads to non-optimal solutions and the premature convergence problem. To improve the search capability of PSO, many variants have been proposed in which different strategies have been employed to tune its controlling parameters. Inertia weight ( ω )   is an important parameter of PSO, responsible for an appropriate tradeoff between the global and local search. An efficient mechanism of inertia weight can solve the premature convergence problem of conventional PSO [
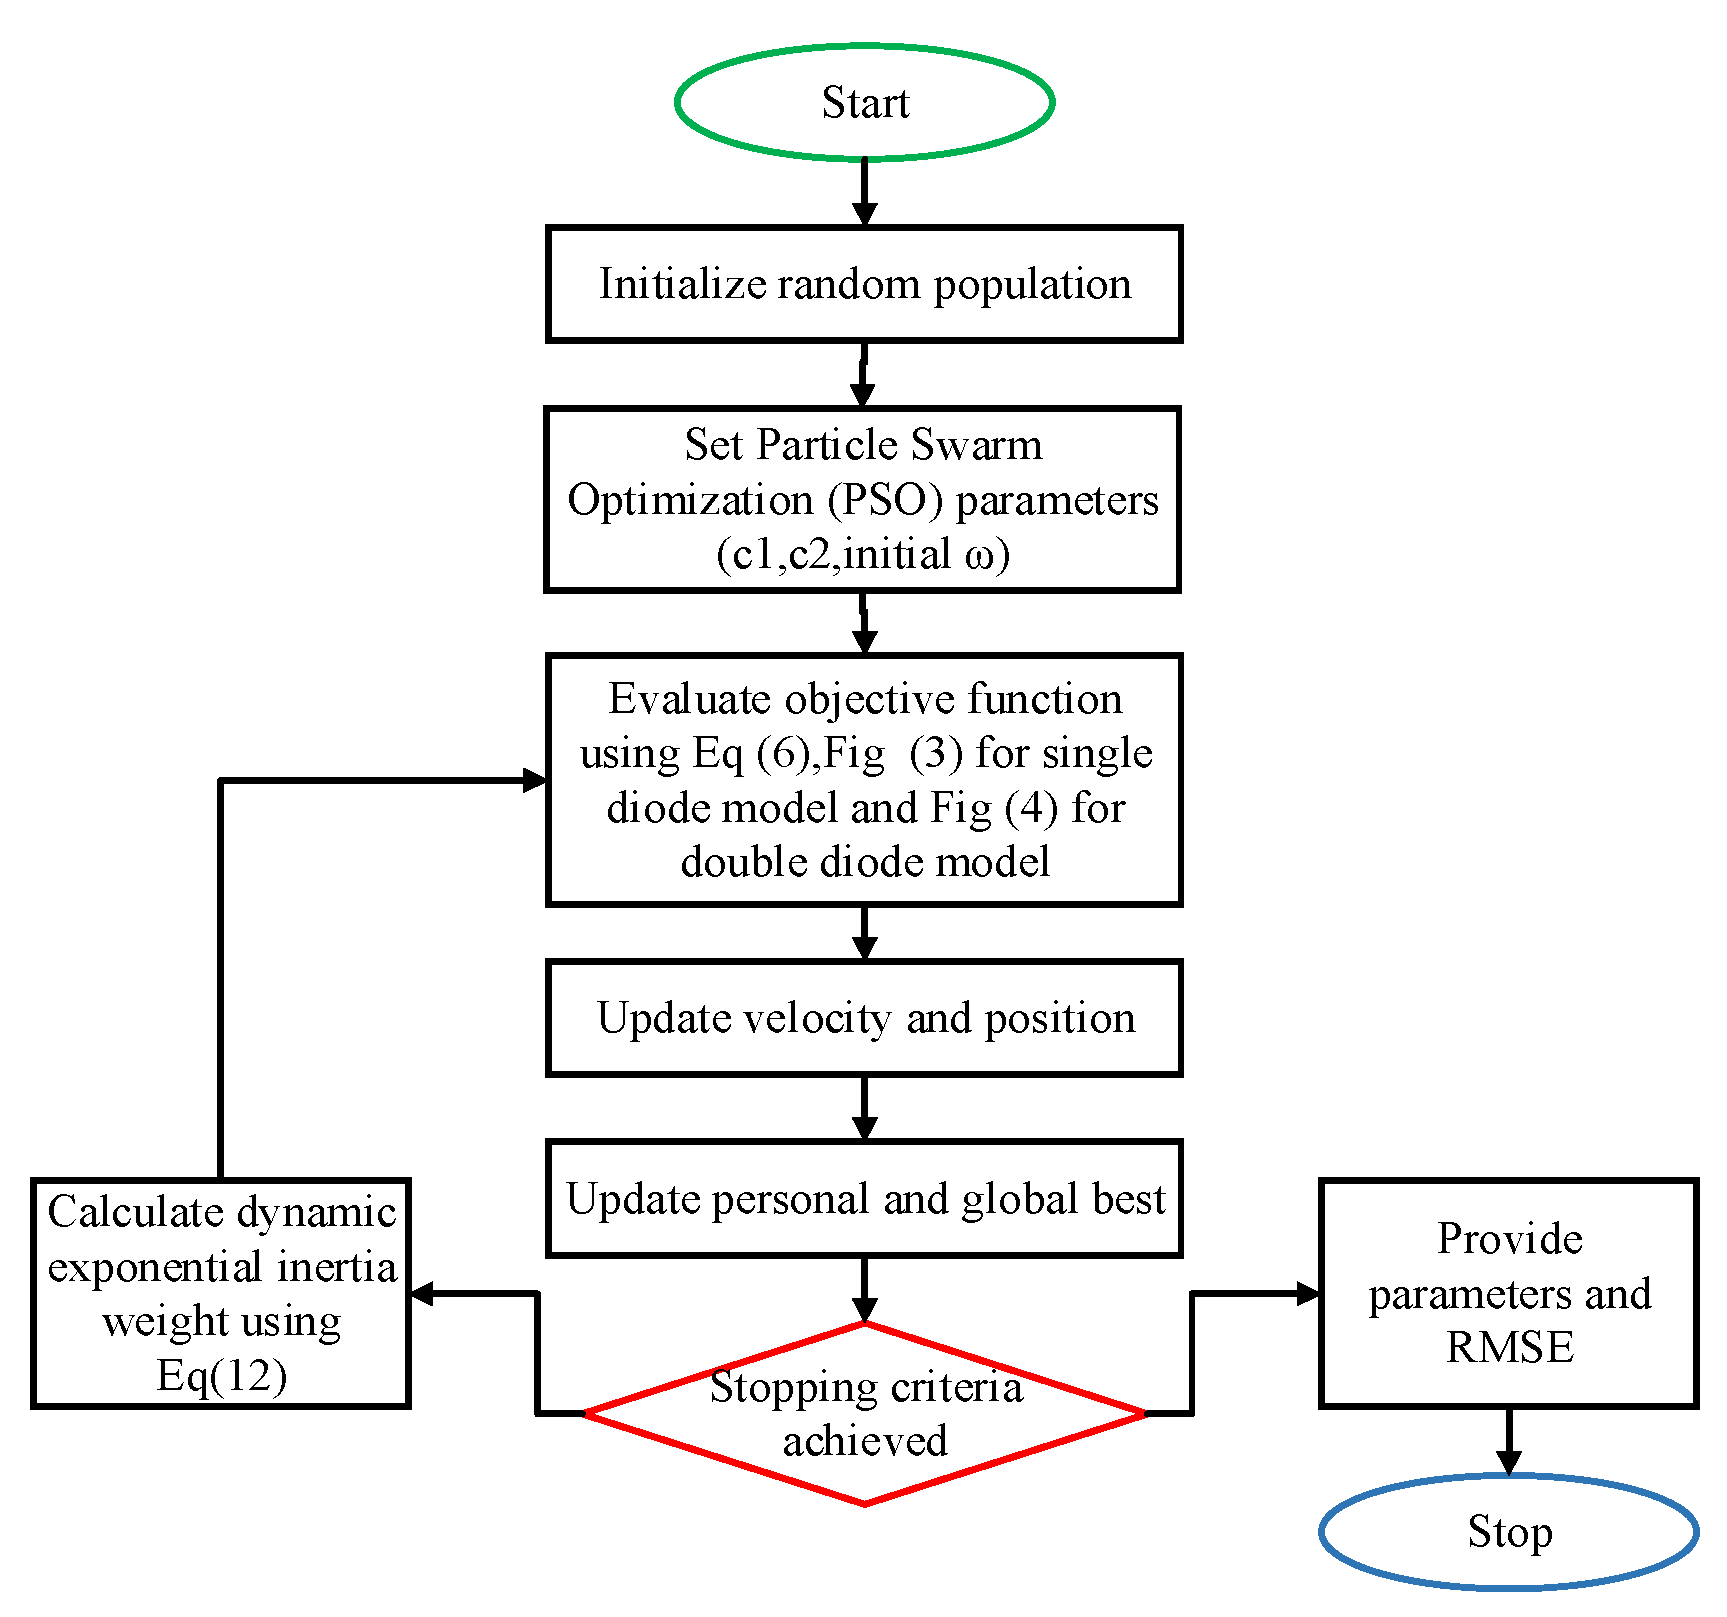
37]. This study presents double exponential function-based dynamic inertia weight PSO (DEDIWPSO), intended to improve the search capability of conventional PSO by solving the premature convergence problem. DEDIW is inspired by the rapid growing nature of the exponential function and incorporate the “Gompertzian function” which is a dying double exponential function as Equations (12) and (13) below:
ω ( i t + 1 ) = y ( e x p exp ( R i ) )
R i = ( m a x i t i t m a x i t )
where y = 1 and R i   is the performance index, which is calculated for each particle at every iteration. This dynamic inertia weight decreases with increasing iterations. At first, ω is set to 0.8 [37] then calculated using Equations (12) and (13). In early iterations, the particles are away from the global best solution, and the proposed strategy provides a greater rate of exploration so that the particles can explore more search space to find the best optimum solution. Later, a relatively smaller value of ω is provided to guarantee precision in the exploration phase. The fast-growing nature of exponential function improves the speed of convergence, and hence provides optimal, efficient, and accurate solutions for the parameter estimation problem. The flow chart of the proposed methodology is presented in Figure 5.

4. Results and Discussions

Optimal parameters obtained using DEDIWPSO for the Photo-watt module (PWP201), RTC France silicon solar cell and a practical PV system are presented in this section. The I–V data for the first two test systems were taken from [24], and have been utilized by various researchers [38,39,40,41]. Inertia weight was initially set at 0.8, and then exponentially decreased following Equation (12). The stopping criteria of the proposed framework was the maximum number of iterations, which was set at 10,000 with a population size of 100. The results obtained by DEDIWPSO were validated by comparing it with various other techniques available in the literature. The results for 30 independent runs have been obtained to check the optimality and reliability of the proposed approach.

4.1. Results for Solar Cell

This section presents the results for a 57 mm-diameter RTC France solar cell, which was utilized for PV parameter estimation. The data consist of 26 I–V points obtained from [24] at 33 °C temperature and under a 1000 W/m2 irradiance level.

4.1.1. Single-Diode Cell

The best obtained parameters of the single-diode cell for 30 independent runs using DEDIWPSO are presented in Table 1. While Table 2 depicts a comparison of the mean, minimum and maximum values of RMSE with GCPSO, TVAPSO, ELPSO, constant PSO (CPSO), basic flower pollination algorithm (BFPA), improved teaching learning-based optimization (GOTLBO), comparative learning-based PSO (CLPSO), cuckoo search (CS), ABC, improved sine cosine algorithm (ISCA), teaching learning-based ABC algorithm (TLABC) and teaching learning based optimization (TLBO). The value of the RMSE is very sensitive as it highly depends on the obtained parameters. Hence, its value up to six decimal digits is presented in this paper. The mean value of the RMSE obtained from the proposed technique for 30 independent runs is 7.730062 × 10 4 with minimum and maximum values of 7.730062 × 10 4 and 7.730062 × 10 4 , respectively.
The computational cost is also presented in Table 1, which presents the number of iterations and computational time required by the proposed technique to attain the optimal parameters. The calculated and measured values of currents with voltages are presented in Table 3. The results show that the proposed technique is more efficient and accurate than the approaches available in the literature. The individual absolute error (IAE) was calculated for each I–V pair, which indicates how close the calculated current is to the measured current. The IAE can be calculated as follows:
I A E = | I i , m I i , c a l |
Figure 6 presents the I–V curve of the calculated and measured data, which shows that the calculated data closely follow the measured data. Moreover, the obtained parameters were utilized to compute the output power for each given data set and were plotted as P–V curve in Figure 7.

4.1.2. Double-Diode Cell

The obtained results of the double-diode cells for 30 independent runs using DEDIWPSO are presented in Table 4. However, the comparison between the mean, minimum and maximum values of the RMSE with GCPSO, TVAPSO, ELPSO, CPSO, BFPA, GOTLBO, CLPSO, CS, ABC, ISCA, TLABC, and TLBO is depicted in Table 5. The mean value of the RMSE obtained from the proposed technique for 30 independent runs is 7.187462 × 10 4 with the minimum and maximum values of 7.182306 × 10 4 and 7.318100 × 10 4 , respectively. The standard deviation of RMSE for 30 runs is 2.486129 × 10 6 , and its comparison with other techniques reveals that the proposed technique is efficient.
The computational cost is also presented in Table 4, which presents a number of iterations and computational time required by the proposed technique to attain the optimal parameters. The obtained results reveal that the computational cost is larger for the double-diode model, which justifies the higher complexity of the double-diode model in comparison with the single-diode model. The calculated current values with the reference I–V data for double-diode cell are presented in Table 6 along with their IAE.
Figure 8 presents the I–V curve of the calculated and measured data, which shows that the calculated data closely follow the measured data. Moreover, the obtained parameters were utilized to compute the output power for each given data set and were plotted as the P–V curve in Figure 9. The convergence curve of the proposed algorithm for the double-diode cell is presented in Figure 10.

4.2. Results for PV Module

The experimental data for the Photo-watt PWP201 module were obtained from [24], which contain 26 pairs of I–V data. The selected module consists of 36 numbers of polycrystalline silicon cells in series, and its operation was assumed at 45 °C temperature and under a 1000 W/m2 irradiance level.

4.2.1. Single-Diode Module

Results of the single-diode module obtained for 30 independent runs using DEDIWPSO are presented in Table 7. The obtained results in terms of best parameters, optimal RMSE with standard deviation, and computational cost are also presented in Table 7. On the other hand, in Table 8, the comparison of the obtained results with GCPSO, TVAPSO, CPSO, BFPA, TLABC, GWO, and TLBO in terms of the best, worst, and mean values of RMSE is depicted. The best value of RMSE obtained for 30 runs is 2.039992 × 10 3 with the mean and maximum values of 2.039992 × 10 3 and 2.039992 × 10 3 , respectively. The comparison of the statistical results of the proposed methodology with other available techniques indicates that the purposed methodology shows the optimal solution and better performance.
The I–V curve of the calculated and measured currents for the given voltages is plotted in Figure 11. This figure depicts that the calculated current is in proximity to measure the current. The P–V curve shown in Figure 12 was drawn utilizing the calculated currents and given voltages. Table 9 presents the I–V data of the measured and calculated values with IAE.

4.2.2. Double-Diode module

Results of the single-diode module obtained for 30 independent runs using the proposed framework are presented in Table 10. The obtained results in terms of best parameters, optimal RMSE with standard deviation and computational cost are also presented in Table 10. On the other hand, Table 11 shows the comparison of RMSE in terms of the maximum, minimum and mean value with GCPSO, TVAPSO, CPSO and GWO. The mean value of the RMSE obtained by the proposed technique for 30 runs is   2.039992 × 10 3 with the maximum and minimum values of 2.039992 × 10 3   and 2.039992 × 10 3 , respectively. The comparison of the statistical analysis indicates that the purpose methodology presents an optimal solution and better performance than other algorithms.
The obtained results also reveal that the computational cost is larger for the double-diode model, which can be justified as the double-diode model is more complex than the single-diode model. The I–V curve for the calculated and measured currents for given voltages is plotted in Figure 13. This figure reveals that the calculated current closely follows the measured data. The P–V curve depicted in Figure 14 was drawn utilizing the calculated currents and given voltages. The I–V data of the measured and calculated values with their respective IAE are given in Table 12. The convergence curve of the proposed algorithm for the double-diode module is presented in Figure 15.

4.3. Results for Practical Test System

To evaluate the performance of the proposed approach under real and varying environmental conditions (irradiation and temperature levels), the data obtained from the JKM330P-72, 310 W polycrystalline PV module were utilized for the parameter estimation of the single- and double-diode modules. The JKM330P PV module consists of 72 series of connected polycrystalline cells, having characteristic point values at the maximum power point (MPP), the voltage at MPP ( V mpp ) = 37.0   V , current at MPP ( I mpp ) = 8.38   A , the short circuit current ( I SC ) = 8.96   A and the open circuit voltage ( V OC ) = 45.9   V . The data were obtained for five different irradiation and temperature levels of 1000 W/m2 at 47 °C, 800 W/m2 at 44 °C, 600 W/m2 at 42 °C, 400 W/m2 at 36 °C, 200 W/m2 at 27 °C.

4.3.1. Single-Diode Module

Results for the single-diode JKM330P-72, 310 W polycrystalline PV module were obtained for 30 independent runs, but only the parameters extracted from the best run are presented in Table 13. On the other hand, the mean, minimum and maximum RMSE, standard deviation and the computational cost, which includes the total number of iterations and time required to converge for each experimental I–V data set, are given in Table 14. The minimum difference between the measured current and the calculated current obtained from the best extracted parameters for the different temperature and irradiance levels can be seen in Figure 16. Moreover, the power computed using the optimal obtained parameters for different experimental levels with respective voltages is shown in Figure 17. Table 15 presents the I–V data of the measured and calculated values with their IAE.

4.3.2. Double-Diode model

Results for the double-diode JKM330P-72, 310 W polycrystalline PV module were obtained for 30 independent runs, but only the parameters extracted from the best run are presented in Table 16. On the other hand, the mean, minimum and maximum RMSE, standard deviation, and computational cost, which includes the total number of iterations and time required to converge for each experimental I–V data set, are given in Table 17. From the obtained results, it can be observed that the computational cost and variation in the RMSE for the double-diode model were greater compared to the single-diode model. Minimum difference between the measured current and the calculated current obtained from the best extracted parameters for the different temperature and irradiance levels can be seen in Figure 18. Table 18 presents the I–V data of the measured and the calculated values for the 1000 W/m2 and 47 °C curve with their corresponding IAE. Moreover, the power computed using the optimal obtained parameters for the different experimental levels, and each voltage value, are shown in Figure 19. Convergence curve of the proposed algorithm for the double-diode module at 1000 W/m2 and 47 °C is presented in Figure 20.

4.4. Comparison of Results

The comparison of the obtained results from the proposed approach for the three different cases is discussed in this sub-section for both the single- and double-diode models. Firstly, in the case of the RTC France solar cell, the double-diode model shows higher efficiency than the single-diode model in terms of RMSE, which is 7.730062 × 10 4 for the single and 7.187462 × 10 4 for the double-diode cell. Secondly, for the Photowatt-PWP201 PV module, the minimum value of RMSE remains the same for both the single- and double-PV modules, which is 2.039992 × 10 3 and finally, for the JKM330P-72, 310 W polycrystalline PV module, the double-diode model shows greater efficiency than the single-diode model for all the I–V curves data, except for the 600 W/m2, 42 °C I–V curve, which represents same value of RMSE (0.022270) for both models. The obtained results show that the double-diode model requires a larger number of iterations and computational time than the single-diode model. The standard deviation of each case study also indicates the complexity of the double-diode model. Considering these observations, it can be concluded that for the Photowatt-PWP201 PV module, the single-diode model is preferred as the RMSE for both models is the same, but the computational cost is greater for the double-diode model. For the RTC France solar cell, the double-diode model is preferred as it provides a smaller value of RMSE compared to the single-diode model. Finally, for the JKM330P-72, 310 W polycrystalline PV module, the double-diode model is also preferable because it provides optimal results, even at a lower irradiance level. Table 2 and Table 5 present the comparison of the obtained RMSE with the previously available techniques for single- and double-diode cells, and it can be observed from these tables that the minimum RMSE available in the literature for single- and double-diode cells is 7.730063 × 10 4 and 7.182745 × 10 4 , respectively while the obtained RMSE for the single- and double-diode cell is 7.730062 × 10 4 and 7.182306 × 10 4 , respectively. Similarly, the minimum RMSE in the case of the single- and double-diode module is 2.046536 × 10 3 and 2.046535 × 10 3 , respectively, while the obtained RMSE for both the single- and double-diode module is 2.039992 × 10 3 . Table 2, Table 5, Table 8 and Table 11 provide the comparative statistical results of both the single- and double-diode models for the first two cases. The analysis of the referred tables reveals that the proposed approach shows a stable performance while providing the minimum RMSE. Similarly, for the JKM330P-72, 310 W polycrystalline PV module, Table 14 and Table 17 show the minimum, maximum and mean values of RMSE, the computational time and iterations for five different irradiance and temperature levels for the single- and double-diode models, respectively. The comparison of the results with other techniques depicts that the proposed technique provides effective and efficient PV parameters, while providing a minimum value of RMSE.

5. Conclusions

In this paper, the PV parameter estimation problem was addressed by using an improved variant of PSO. A double exponential dynamic inertia weight strategy was implemented to solve the premature convergence problem of the conventional PSO. This variant increases the speed of convergence by increasing the search capabilities of particles and provides an appropriate balance between the exploration and exploitation phases. Three different systems are utilized to validate the performance of the proposed approach, including the RTC France solar cell, het Photo-watt PWP201 module, and a JKM330P-72, 310 W polycrystalline PV module. Five different temperature and irradiance levels were also considered to model the behavior of a PV system under varying environmental conditions. The RMSE was considered as an objective function, and the proposed methodology provides an optimal value of RMSE with accurately estimated PV parameters. The proposed technique shows the maximum improvement of 61.577% and 64.86% for the single- and double-diode RTC France solar cells, respectively, from the compared technique. Similarly, for the Photo-watt PWP201 module, the maximum improvement was reported as 15.87% for both the single- and double-diode modules. Regarding the experimental results and their statistical analysis, the following conclusions can be attained.
  • Convergence curve indicates that the DEDIWPSO has a fast speed of convergence;
  • Comparison with other techniques reveals that the results obtained from the proposed approach are highly accurate and deserve sincere attention;
  • Experimental results of the third case study show that the proposed approach is also highly accurate and reliable for estimating the parameters of a PV system, working under real environmental conditions;
  • Standard deviation for each successful run reveals that DEDIWPSO upholds the stable capability of reaching an optimal global solution;
  • Obtained results reveal that the single-diode model requires less computational cost but provides less accurate results, whereas the double-diode model is more complex because of its greater number of parameters, but it provides optimal results even at a low irradiance level;
  • Results show that the proposed variant of PSO is a potential tool for solving PV parameter estimation and other optimization problems, while avoiding premature convergence.

Author Contributions

Conceptualization and Draft writing: A.T.K.; Methodology: M.F.N.; Software Implementation and Review: A.A.; Results validation and review: I.K.; Investigation and Data curation: R.M.E.; Review and Editing: N.D. All authors have read and agreed to the published version of the manuscript.

Funding

This research received no external funding.

Conflicts of Interest

The authors declare no conflict of interest.

Nomenclature

a Diode ideality factor
a 1 Ideality factor of diode 1
a 2 Ideality factor of diode 2
c 1 Personel acceleration coefficient
c 2 Social acceleration coefficient
q Electron charge
ģ b e s t Particle global best position
I i , c a l Calculated current
I i , m Measured current
I P Photon current
I d S Diode saturation current
I d S 1 Saturation current of diode 1
I d S 2 Saturation current of diode 2
k Boltzman constant
M Number of I–V pairs
ք b e s t Particle personel best position
R i Performance index
R s e Series resistance
R p Parrallel resistance
r 1 , r 2 Random numbers
T Temperature in Kelvin
ν j Particle velocity
w Inertia weight
χ j Particle position

References

  1. Ahmed, A.; Nadeem, M.F.; Sajjad, I.A.; Bo, R.; Khan, I.A. Optimal Allocation of Wind DG with Time Varying Voltage Dependent Loads Using Bio-Inspired: Salp Swarm Algorithm. In Proceedings of the 3rd International conference on Computing, Mathematics and Engineering Technologies Idea to Innovsource Building a Knowledge Economy iCoMET 2020, Kahului, HI, USA, 29–30 January 2020; pp. 1–7. [Google Scholar] [CrossRef]
  2. Khuong, P.M.; McKenna, R.; Fichtner, W. A cost-effective and transferable methodology for rooftop PV potential assessment in developing countries. Energies 2020, 13, 2501. [Google Scholar] [CrossRef]
  3. Vasiliev, M.; Nur-E-Alam, M.; Alameh, K. Recent developments in solar energy-harvesting technologies for building integration and distributed energy generation. Energies 2019, 12, 1080. [Google Scholar] [CrossRef] [Green Version]
  4. Kim, J.; Bae, S.; Yu, Y.; Nam, Y. Experimental and numerical study on the cooling performance of fins and metal mesh attached on a photovoltaic module. Energies 2019, 13, 85. [Google Scholar] [CrossRef] [Green Version]
  5. Li, G.; Chen, X.; Jin, Y. Analysis of the primary constraint conditions of an efficient photovoltaic-thermoelectric hybrid system. Energies 2017, 10, 20. [Google Scholar] [CrossRef] [Green Version]
  6. Ullah, I.; Rasul, M.G. Recent developments in solar thermal desalination technologies: A review. Energies 2019, 12, 119. [Google Scholar] [CrossRef] [Green Version]
  7. Jelle, B.P. Building integrated photovoltaics: A concise description of the current state of the art and possible research pathways. Energies 2016, 9, 21. [Google Scholar] [CrossRef] [Green Version]
  8. Pathy, S.; Subramani, C.; Sridhar, R.; Thamizh Thentral, T.M.; Padmanaban, S. Nature-inspired MPPT algorithms for partially shaded PV systems: A comparative study. Energies 2019, 12, 1451. [Google Scholar] [CrossRef] [Green Version]
  9. Bai, J.; Cao, Y.; Hao, Y.; Zhang, Z.; Liu, S.; Cao, F. Characteristic output of PV systems under partial shading or mismatch conditions. Sol. Energy 2015, 112, 41–54. [Google Scholar] [CrossRef]
  10. Abd Elaziz, M.; Oliva, D. Parameter estimation of solar cells diode models by an improved opposition-based whale optimization algorithm. Energy Convers. Manag. 2018, 171, 1843–1859. [Google Scholar] [CrossRef]
  11. Messaoud, R.B. Extraction of uncertain parameters of single and double diode model of a photovoltaic panel using Salp Swarm algorithm. Meas. J. Int. Meas. Confed. 2020, 154, 107446. [Google Scholar] [CrossRef]
  12. Gnetchejo, P.J.; Ndjakomo Essiane, S.; Ele, P.; Wamkeue, R.; Mbadjoun Wapet, D.; Perabi Ngoffe, S. Important notes on parameter estimation of solar photovoltaic cell. Energy Convers. Manag. 2019, 197, 111870. [Google Scholar] [CrossRef]
  13. Pourmousa, N.; Ebrahimi, S.M.; Malekzadeh, M.; Alizadeh, M. Parameter estimation of photovoltaic cells using improved Lozi map based chaotic optimization Algorithm. Sol. Energy 2019, 180, 180–191. [Google Scholar] [CrossRef]
  14. Alam, D.F.; Yousri, D.A.; Eteiba, M.B. Flower Pollination Algorithm based solar PV parameter estimation. Energy Convers. Manag. 2015, 101, 410–422. [Google Scholar] [CrossRef]
  15. Fathy, A.; Rezk, H. Parameter estimation of photovoltaic system using imperialist competitive algorithm. Renew. Energy 2017, 111, 307–320. [Google Scholar] [CrossRef]
  16. Jordehi, A.R. Parameter estimation of solar photovoltaic (PV) cells: A review. Renew. Sustain. Energy Rev. 2016, 61, 354–371. [Google Scholar] [CrossRef]
  17. Khursheed, M.U.N.; Nadeem, M.F.; Khalil, A.; Sajjad, I.A.; Raza, A.; Iqbal, M.Q.; Bo, R.; Rehman, W.U. Review of Flower Pollination Algorithm: Applications and Variants. In Proceedings of the 2020 International Conference on Engineering and Emerging Technologies (ICEET), Lahore, Pakistan, 22–23 February 2020; pp. 1–6. [Google Scholar] [CrossRef]
  18. Chouder, A.; Silvestre, S.; Sadaoui, N.; Rahmani, L. Modeling and simulation of a grid connected PV system based on the evaluation of main PV module parameters. Simul. Model. Pract. Theory 2012, 20, 46–58. [Google Scholar] [CrossRef]
  19. Hadj Arab, A.; Chenlo, F.; Benghanem, M. Loss-of-load probability of photovoltaic water pumping systems. Sol. Energy 2004, 76, 713–723. [Google Scholar] [CrossRef]
  20. Et-torabi, K.; Nassar-eddine, I.; Obbadi, A.; Errami, Y.; Rmaily, R.; Sahnoun, S.; El fajri, A.; Agunaou, M. Parameters estimation of the single and double diode photovoltaic models using a Gauss–Seidel algorithm and analytical method: A comparative study. Energy Convers. Manag. 2017, 148, 1041–1054. [Google Scholar] [CrossRef]
  21. Yang, B.; Wang, J.; Zhang, X.; Yu, T.; Yao, W.; Shu, H.; Zeng, F.; Sun, L. Comprehensive overview of meta-heuristic algorithm applications on PV cell parameter identification. Energy Convers. Manag. 2020, 208, 112595. [Google Scholar] [CrossRef]
  22. Nayak, B.; Mohapatra, A.; Mohanty, K.B. Parameter estimation of single diode PV module based on GWO algorithm. Renew. Energy Focus 2019, 30, 1–12. [Google Scholar] [CrossRef]
  23. Chen, X.; Yu, K. Hybridizing cuckoo search algorithm with biogeography-based optimization for estimating photovoltaic model parameters. Sol. Energy 2019, 180, 192–206. [Google Scholar] [CrossRef]
  24. Easwarakhanthan, T.; Bottin, J.; Bouhouch, I.; Boutrit, C. Nonlinear Minimization Algorithm for Determining the Solar Cell Parameters with Microcomputers. Int. J. Sol. Energy 1986, 4, 1–12. [Google Scholar] [CrossRef]
  25. Long, W.; Cai, S.; Jiao, J.; Xu, M.; Wu, T. A new hybrid algorithm based on grey wolf optimizer and cuckoo search for parameter extraction of solar photovoltaic models. Energy Convers. Manag. 2020, 203, 112243. [Google Scholar] [CrossRef]
  26. Oliva, D.; Cuevas, E.; Pajares, G. Parameter identification of solar cells using artificial bee colony optimization. Energy 2014, 72, 93–102. [Google Scholar] [CrossRef]
  27. Askarzadeh, A.; Rezazadeh, A. Artificial bee swarm optimization algorithm for parameters identification of solar cell models. Appl. Energy 2013, 102, 943–949. [Google Scholar] [CrossRef]
  28. Ishaque, K.; Salam, Z.; Mekhilef, S.; Shamsudin, A. Parameter extraction of solar photovoltaic modules using penalty-based differential evolution. Appl. Energy 2012, 99, 297–308. [Google Scholar] [CrossRef]
  29. Gong, W.; Cai, Z. Parameter extraction of solar cell models using repaired adaptive differential evolution. Sol. Energy 2013, 94, 209–220. [Google Scholar] [CrossRef]
  30. Ma, J.; Ting, T.O.; Man, K.L.; Zhang, N.; Guan, S.U.; Wong, P.W.H. Parameter estimation of photovoltaic models via cuckoo search. J. Appl. Math. 2013, 2013, 10–12. [Google Scholar] [CrossRef]
  31. Guo, L.; Meng, Z.; Sun, Y.; Wang, L. Parameter identification and sensitivity analysis of solar cell models with cat swarm optimization algorithm. Energy Convers. Manag. 2016, 108, 520–528. [Google Scholar] [CrossRef]
  32. Kiani, A.T.; Faisal Nadeem, M.; Ahmed, A.; Sajjad, I.A.; Raza, A.; Khan, I.A. Chaotic Inertia Weight Particle Swarm Optimization (CIWPSO): An Efficient Technique for Solar Cell Parameter Estimation. In Proceedings of the 3rd International conference on Computing, Mathematics and Engineering Technologies Idea to Innovsource Building a Knowledge Economy iCoMET 2020, Kahului, HI, USA, 29–30 January 2020; pp. 1–6. [Google Scholar] [CrossRef]
  33. Jordehi, A.R. Time varying acceleration coefficients particle swarm optimisation (TVACPSO): A new optimisation algorithm for estimating parameters of PV cells and modules. Energy Convers. Manag. 2016, 129, 262–274. [Google Scholar] [CrossRef]
  34. Rezaee Jordehi, A. Enhanced leader particle swarm optimisation (ELPSO): An efficient algorithm for parameter estimation of photovoltaic (PV) cells and modules. Sol. Energy 2018, 159, 78–87. [Google Scholar] [CrossRef]
  35. Nunes, H.G.G.; Pombo, J.A.N.; Mariano, S.J.P.S.; Calado, M.R.A.; Felippe de Souza, J.A.M. A new high performance method for determining the parameters of PV cells and modules based on guaranteed convergence particle swarm optimization. Appl. Energy 2018, 211, 774–791. [Google Scholar] [CrossRef]
  36. Ahmed, A.; Faisal, M.; Ali, I.; Bo, R.; Khan, I.A. Sustainable Energy, Grids and Networks Probabilistic generation model for optimal allocation of wind DG in distribution systems with time varying load models. Sustain. Energy Grids Netw. 2020, 22, 100358. [Google Scholar] [CrossRef]
  37. Chauhan, P.; Deep, K.; Pant, M. Novel inertia weight strategies for particle swarm optimization. Memetic Comput. 2013, 5, 229–251. [Google Scholar] [CrossRef]
  38. Gnetchejo, P.J.; Essiane, S.N.; Ele, P.; Wamkeue, R.; Wapet, D.M.; Ngoffe, S.P. Enhanced Vibrating Particles System Algorithm for Parameters Estimation of Photovoltaic System. J. Power Energy Eng. 2019, 7, 1–26. [Google Scholar] [CrossRef] [Green Version]
  39. Ali, E.E.; El-Hameed, M.A.; El-Fergany, A.A.; El-Arini, M.M. Parameter extraction of photovoltaic generating units using multi-verse optimizer. Sustain. Energy Technol. Assess. 2016, 17, 68–76. [Google Scholar] [CrossRef]
  40. Chen, Y.; Sun, Y.; Meng, Z. An improved explicit double-diode model of solar cells: Fitness verification and parameter extraction. Energy Convers. Manag. 2018, 169, 345–358. [Google Scholar] [CrossRef]
  41. Premkumar, M.; Babu, T.S.; Umashankar, S.; Sowmya, R. A new metaphor-less algorithms for the photovoltaic cell parameter estimation. Optik Stuttg. 2020, 208, 164559. [Google Scholar] [CrossRef]
  42. Chen, X.; Xu, B.; Mei, C.; Ding, Y.; Li, K. Teaching–learning–based artificial bee colony for solar photovoltaic parameter estimation. Appl. Energy 2018, 212, 1578–1588. [Google Scholar] [CrossRef]
  43. Xu, S.; Wang, Y. Parameter estimation of photovoltaic modules using a hybrid flower pollination algorithm. Energy Convers. Manag. 2017, 144, 53–68. [Google Scholar] [CrossRef]
  44. Rao, R.V.; Savsani, V.J.; Vakharia, D.P. Teaching-Learning-Based Optimization: An optimization method for continuous non-linear large scale problems. Inf. Sci. N. Y. 2012, 183, 1–15. [Google Scholar] [CrossRef]
  45. Liang, J.J.; Qin, A.K.; Member, S.; Suganthan, P.N.; Member, S.; Baskar, S. Comprehensive learning PSO for global optimization of multimodal functions. IEEE Trans. Evol. Comput. 2006, 10, 281–295. [Google Scholar] [CrossRef]
  46. Chen, X.; Yu, K.; Du, W.; Zhao, W.; Liu, G. Parameters identification of solar cell models using generalized oppositional teaching learning based optimization. Energy 2016, 99, 170–180. [Google Scholar] [CrossRef]
  47. Chen, H.; Jiao, S.; Heidari, A.A.; Wang, M.; Chen, X.; Zhao, X. An opposition-based sine cosine approach with local search for parameter estimation of photovoltaic models. Energy Convers. Manag. 2019, 195, 927–942. [Google Scholar] [CrossRef]
Figure 1. Equivalent circuit of the single-diode model.
Energies 13 04037 g001
Figure 2. Equivalent circuit of the double-diode model.
Energies 13 04037 g002
Figure 3. Newton–Raphson method (NRM) flow chart of the single-diode model for the current calculations.
Energies 13 04037 g003
Figure 4. NRM flow chart of the double-diode model for the current calculations.
Energies 13 04037 g004
Figure 5. Flow chart of the proposed methodology for estimating photovoltaic (PV) parameters.
Energies 13 04037 g005
Figure 6. I–V curve of the measured and calculated currents for the single-diode cell.
Energies 13 04037 g006
Figure 7. P–V curve obtained from the calculated current for the single-diode cell.
Energies 13 04037 g007
Figure 8. I–V curve of the measured and calculated currents for the double-diode cell.
Energies 13 04037 g008
Figure 9. P–V curve obtained from the calculated current for the double-diode cell.
Energies 13 04037 g009
Figure 10. Convergence curve for the double-diode cell.
Energies 13 04037 g010
Figure 11. I–V curve of the measured and the calculated currents for the single-diode module.
Energies 13 04037 g011
Figure 12. P–V curve obtained from the calculated current for the single-diode module.
Energies 13 04037 g012
Figure 13. I–V curve of the measured and the calculated currents for the double-diode module.
Energies 13 04037 g013
Figure 14. P–V curve obtained from the calculated current for the double-diode module.
Energies 13 04037 g014
Figure 15. Convergence curve for the double-diode module.
Energies 13 04037 g015
Figure 16. I–V curves of the measured and the calculated currents for the single-diode practical system at different irradiance and temperature levels.
Energies 13 04037 g016
Figure 17. P–V curves obtained from the calculated current for the single-diode practical system at different irradiance and temperature levels.
Energies 13 04037 g017
Figure 18. I–V curves of the measured and the calculated currents for the double-diode practical system at different irradiance and temperature levels.
Energies 13 04037 g018
Figure 19. P–V curves for the double-diode practical system at different irradiance and temperature levels.
Energies 13 04037 g019
Figure 20. Convergence curve for the double-diode JKM330P-72, 310 W polycrystalline PV module.
Energies 13 04037 g020
Table 1. Results for the single-diode cell.
Obtained RMSE and ParametersComputational Cost
Best ParametersRMSEIterationTime (s)
I P ( A ) 0.76078Maximum 7.730062 × 10 4   Maximum9163Maximum109
I d S ( µ A ) 3.10685 × 10 1   Minimum 7.730062 × 10 4   Minimum2356Minimum76
a 1.47559Mean 7.730062 × 10 4   Mean8829Mean93
R S e 0.03654Std 5.18668 × 10 15  
R P 52.8898
Table 2. Comparsion of the obtained RMSE for the single-diode cell.
AlgorithmMaximumMinimumMeanStd
DEDIWPSO 7.730062 × 10 4   7.730062 × 10 4 7.730062 × 10 4 5.18668 × 10 15
GCPSO [35] 7.730063 × 10 4 7.730063 × 10 4 7.730063 × 10 4 4.405583 × 10 11
TVACPSO [33] 7.7301 × 10 4 7.7301 × 10 4 7.7301 × 10 4 5.5805 × 10 10
ELPSO [34] 7.7455 × 10 4 7.7301 × 10 4 7.7314 × 10 4 3.4508 × 10 7
CPSO [31] 9.2832 × 10 4 7.7301 × 10 4 7.7847 × 10 4 2.8344 × 10 5
TLABC [42] 1.03970 × 10 3 9.86022 × 10 4 9.98523 × 10 4 1.86022 × 10 5
BFPA [43] 1.943194 × 10 3 9.860219 × 10 4 1.133753 × 10 3 2.419249 × 10 4
TLBO [44] 1.23579 × 10 3 9.87332 × 10 4 1.04761 × 10 3 6.58940 × 10 5
ABC [26] 1.41740 × 10 3 9.88148 × 10 4 1.12125 × 10 3 1.19818 × 10 4
CLPSO [45] 1.39910 × 10 3 1.01347 × 10 3 1.09114 × 10 3 5.68626 × 10 5
GOTLBO [46] 2.3454 × 10 3 1.34432 × 10 3 1.02903 × 10 3 2.3454 × 10 3
CS [30] 6.09130 × 10 2 2.01185 × 10 3 7.60819 × 10 3 1.10512 × 10 2
Table 3. I–V values and relative individual absolute error (IAE) for the single-diode cell.
Sr. NumberVoltage Measured   I Calculated   I IAE
1 0.20570.7640.7641490.000149
2 0.12910.7620.7627020.000702
3 0.05880.76050.7613740.000874
40.00570.76050.7601550.000345
50.06460.760.7590390.000961
60.11850.7590.7580110.000989
70.16780.7570.757046 4.57 × 10 5
80.21320.7570.7560850.000915
90.25450.75550.7550220.000478
100.29240.7540.7535970.000403
110.32690.75050.7513270.000827
120.35850.74650.7473050.000805
130.38730.73850.7400850.001585
140.41370.7280.7274260.000574
150.43730.70650.7070260.000526
160.4590.67550.6754 9.97 × 10 5
170.47840.6320.6309980.001002
180.4960.5730.5721750.000825
190.51190.4990.4995390.000539
200.52650.4130.4134850.000485
210.53980.31650.3171620.000662
220.55210.2120.212017 1.67 × 10 5
230.56330.10350.1026370.000863
240.5736 0.01 0.00930.000702
250.5833 0.123 0.124360.001361
260.59 0.21 0.20910.000898
Table 4. Results for the double-diode cell.
Obtained RMSE and ParametersCOMPUTATIONAL COST
Best ParametersRMSEIterationTime (s)
I P ( A ) 0.76082Maximum 7.318100 × 10 4 Maximum10,000Maximum201
I d S 1 ( µ A ) 1.35233 × 10 4 Minimum 7.182306 × 10 4 Minimum9998Minimum 197
a 1 1.402796Mean 7.187462 × 10 4 Mean 9999Mean 199
I d S 2 ( µ A ) 8.011757Std 2.486129 × 10 6
a 2 2.499999
R S e 0.037955
R P 60.93531
Table 5. Comparsion of the obtained RMSE for the double-diode cell.
AlgorithmMaximumMinimumMeanStd
DEDIWPSO 7.318100 × 10 4 7.182306 × 10 4 7.187462 × 10 4 2.486129 × 10 6
GCPSO [35] 7.41714 × 10 4 7.182745 × 10 4 7.30138 × 10 4 5.371820 × 10 6
ELPSO [34] 7.8476 × 10 4 7.424 × 10 4 7.5904 × 10 4 9.4291 × 10 6
TVACPSO [33] 7.8476 × 10 4 7.4365 × 10 4 7.5883 × 10 4 1.1044 × 10 5
CPSO [31] 0.001220 7.4444 × 10 4 7.90204 × 10 4 1.0145 × 10 5
ISCA [47] 9.86863 × 10 4 9.8342 × 10 4 9.83800 × 10 4 1.65397 × 10 6
BFPA [43] 1.934336 × 10 3 9.835164 × 10 4 1.13798 × 10 3 2.440882 × 10 4
ABC [26] 1.28482 × 10 3 9.89560 × 10 4 1.05765 × 10 3 6.18669 × 10 5
TLABC [42] 1.50482 × 10 3 9.84145 × 10 4 1.05553 × 10 3 1.55034 × 10 4
TLBO [44] 1.52057 × 10 3 1.00692 × 10 3 1.15977 × 10 3 1.86022 × 10 5
CLPSO [45] 1.39910 × 10 3 1.01243 × 10 3 1.09482 × 10 3 5.62326 × 10 4
GOTLBO [46] 4.43212 × 10 3 1.20232 × 10 3 1.03530 × 10 3 1.02312 × 10 4
CS [30] 4.37199 × 10 2 2.44398 × 10 3 7.90243 × 10 3 8.06719 × 10 3
Table 6. I–V values and the relative IAE for the double-diode cell.
Sr. NumberVoltage Measured   I Calculated   I IAE
1 0.20570.7640.7637370.000263
2 0.12910.7620.7624790.000479
3 0.05880.76050.7613230.000823
40.00570.76050.7602570.000243
50.06460.760.759270.00073
60.11850.7590.7583390.000661
70.16780.7570.7574270.000427
80.21320.7570.7564620.000538
90.25450.75550.7553230.000177
100.29240.7540.7537460.000254
110.32690.75050.7512670.000767
120.35850.74650.7470220.000522
130.38730.73850.7396360.001136
140.41370.7280.7269410.001059
150.43730.70650.7066650.000165
160.4590.67550.6752910.000209
170.47840.6320.6311560.000844
180.4960.5730.5725020.000498
190.51190.4990.4998720.000872
200.52650.4130.4136750.000675
210.53980.31650.3171380.000638
220.55210.2120.2118010.000199
230.56330.10350.1023340.001166
240.5736 0.01 0.009530.000467
250.5833 0.123 0.124350.001345
260.59 0.21 0.208780.001218
Table 7. Results for the single-diode module.
Obtained RMSE and ParametersComputational Cost
Best ParametersRMSEIterationTime (s)
I P ( A ) 1.03235Maximum 2.039992 × 10 3   Maximum9466Maximum110
I d S ( µ A ) 2.49999Minimum 2.039992 × 10 3   Minimum3546Minimum65
a 1.31659Mean 2.039992 × 10 3   Mean7059Mean95
R S e 1.24054Std 2.995289 × 10 15  
R P 748.323
Table 8. Comparsion of the obtained RMSE for the single-diode module.
AlgorithmMaximumMinimumMeanStd
DEDIWPSO 2.039992 × 10 3   2.039992 × 10 3   2.039992 × 10 3   2.995289 × 10 15
GCPSO [35] 2.046536 × 10 3   2.046535 × 10 3   2.046535 × 10 3   1.105194 × 10 10  
TVACPSO [33] 2.0537 × 10 3   2.0530 × 10 3   2.0530 × 10 3   1.3400 × 10 3  
CPSO [31] 2.0576 × 10 3   2.0530 × 10 3   2.0531 × 10 3   8.6188 × 10 7  
GWO [25] 6.9661 × 10 3   2.1903 × 10 3   3.9111 × 10 3 1.2608 × 10 3  
BFPA [43] 2.742508 × 10 3   2.425075 × 10 3   1.370372 × 10 3   5.034340 × 10 2
TLABC [42] 2.44584 × 10 3   2.42507 × 10 3   2.42647 × 10 3   3.99568 × 10 6
TLBO [44] 2.54750 × 10 3   2.42509 × 10 3   2.43827 × 10 3   2.43361 × 10 5
Table 9. I–V values and the relative IAE for the single-diode module.
Sr. NumberVoltage Measured   I Calculated   I IAE
1 1.94261.03451.0332420.001258
20.12481.03151.0304780.001022
31.80931.031.0282110.001789
43.35111.0261.026093 9.33 × 10 5  
54.76221.0221.024040.00204
66.05381.0181.0218780.003878
77.23641.01551.0192690.003769
88.31891.0141.0155910.001591
99.30971.011.0097860.000214
1010.21631.00351.0002080.003292
1111.04490.9880.9845760.003424
1211.80180.9630.960090.00291
1312.49290.92550.9238570.001643
1413.12310.87250.8736210.001121
1513.69830.80750.8082980.000798
1614.22210.72650.7286480.002148
1714.69950.63450.6367040.002204
1815.13460.53450.5354550.000955
1915.53110.42750.4281820.000682
2015.89290.31850.3177990.000701
2116.22290.20850.2069390.001561
2216.52410.1010.0975780.003422
2316.7987 0.008 0.008640.000639
2417.0499 0.111 0.11099 1.2 × 10 5  
2517.2793 0.209 0.208570.000425
2617.4885 0.303 0.300840.002164
Table 10. Results for the double-diode module.
Obtained RMSE and ParametersComputational Cost
Best ParametersRMSEIterationTime (s)
I P ( A ) 1.032357Maximum 2.039992 × 10 3   Maximum10,000Maximum199
I d S 1 ( µ A ) 1.000 × 10 6   Minimum 2.039992 × 10 3   Minimum4605Minimum78
a 1 1.317132Mean 2.039992 × 10 3   Mean8593Mean83
I d S 2 ( µ A ) 2.50Std 2.05687 × 10 15  
a 2 2.499999
R S e 1.240547
R P 748.3235
Table 11. Comparsion of the obtained RMSE for the double-diode module.
AlgorithmMaximumMinimumMeanStd
DEDIWPSO 2.039992 × 10 3   2.039992 × 10 3   2.039992 × 10 3   2.05687 × 10 15  
GCPSO [35] 2.046536 × 10 3   2.046535 × 10 3   2.046535 × 10 3   1.673103 × 10 10
GWO [25] 5.1250 × 10 3   2.2138 × 10 3   3.5558 × 10 3   1.0786 × 10 3  
TVACPSO [33] 2.1125 × 10 3   2.0530 × 10 3   2.0583 × 10 3   1.3101 × 10 7  
CPSO [31] 2.1002 × 10 3   2.0530 × 10 3   2.0644 × 10 3   1.3423 × 10 3  
Table 12. I–V values and the relative IAE for the double-diode module.
Sr. NumberVoltage Measured   I Calculated   I IAE
1 1.94261.03451.0332420.001258
20.12481.03151.0304780.001022
31.80931.031.0282110.001789
43.35111.0261.026093 9.33 × 10 5  
54.76221.0221.024040.00204
66.05381.0181.0218780.003878
77.23641.01551.0192690.003769
88.31891.0141.0155910.001591
99.30971.011.0097860.000214
1010.21631.00351.0002080.003292
1111.04490.9880.9845760.003424
1211.80180.9630.960090.00291
1312.49290.92550.9238570.001643
1413.12310.87250.8736210.001121
1513.69830.80750.8082980.000798
1614.22210.72650.7286480.002148
1714.69950.63450.6367040.002204
1815.13460.53450.5354550.000955
1915.53110.42750.4281820.000682
2015.89290.31850.3177990.000701
2116.22290.20850.2069390.001561
2216.52410.1010.0975780.003422
2316.7987 0.008 0.008640.000639
2417.0499 0.111 0.11099 1.23 × 10 5  
2517.2793 0.209 0.208570.000425
2617.4885 0.303 0.300840.002164
Table 13. Obtained parameters for the single-diode JKM330P-72, 310 W polycrystalline PV module.
Best
Parameters
1000 W/m2
at 47 °C
800 W/m2
at 44 °C
600 W/m2
at 42 °C
400 W/m2
at 36 °C
200 W/m2
at 27 °C
I P ( A ) 9.8823878.1933035.8973883.6932111.955859
I d S ( µ A ) 2.636305 × 10 1 3.7889711.285490 6.578293 × 10 1 9.999999
a 1.2909271.5150141.3778761.1508671.689369
R S e 0.2419260.1428900.3156710.7884940.302527
R P 467.515589.44717217.6296159.4358177.7895
RMSE0.0431130.0549860.0222700.0353030.018150
Std 6.3128 × 10 17 4.8127 × 10 10 2.2069 × 10 13 7.2621 × 10 15 1.62 × 10 14
Table 14. Statistical results for the single-diode JKM330P-72, 310 W polycrystalline PV module.
Experimental CurvesRMSEIterationTime (s)
MaxMinMeanMaxMinMeanMaxMinMean
1000 W/m2 at 47 °C0.0431130.0431130.04311399011030729111098100
800 W/m2 at 44 °C0.0549860.0549860.05498610,00021998437171137140
600 W/m2 at 42 °C0.0222700.0222700.02227010,00020189120187103146
400 W/m2 at 36 °C0.0353030.0353030.035303899094363451169899
200 W/m2 at 27 °C0.0180450.0180450.018045998985052311308590
Table 15. I–V values and the relative IAE for the single-diode JKM330P-72, 310 W polycrystalline PV module.
Sr. NumberVoltage Measured   I Calculated   I IAE
109.828049.8733480.045308
21.7757419.8294389.8704870.041048
32.9965579.865639.8685160.002886
44.6613119.8669379.865820.001117
56.5480389.8684269.8627490.005677
69.1006589.8704329.8585450.011887
710.543419.8715679.8561270.01544
811.54239.8723579.8544260.017932
913.096089.8735839.8517140.021869
1015.759729.8756819.8467590.028922
1116.980479.8766439.8442710.032372
1218.867189.8781229.8399580.038164
1320.531939.8442119.8353840.008827
1421.64189.8450829.831690.013392
1523.639499.8466639.8228680.023794
1625.859229.7779589.8070410.029084
1727.523979.7440369.7870610.043025
1829.743629.6753419.7380990.062759
1930.964469.6410749.6911750.0501
2032.074239.6067179.6274240.020707
2135.514729.257179.1613580.095812
2237.845438.3783538.3396420.038712
2340.176056.5836726.69360.109928
2442.062764.5420544.5125570.029497
2543.616532.1479132.0920310.055882
2644.726400.0356050.035605
Table 16. Obtained parameters for the double-diode JKM330P-72, 310 W polycrystalline PV module.
Best
Parameters
1000 W/m2
at 47 °C
800 W/m2
at 44 °C
600 W/m2
at 42 °C
400 W/m2
at 36 °C
200 W/m2
at 27 °C
I P ( A ) 9.8782215.8973885.8973883.6926971.954250
I d S 1 ( µ A ) 3.721615 × 10 2 1.2854891.2854889.9999998.691569
a 1 1.1689231.3778761.3778762.4999992.093038
I d S 2 ( µ A ) 9.99796 1.1879 × 10 6   1.000 × 10 6     5.1105 × 10 2   9.999999
a 2 1.9138821.3775702.49999311.1353721.683647
R S e 1.1689230.3156710.31567160.7961590.259395
R P 610.505844217.6297217.62956161.5022182.6477
RMSE0.0423770.0432980.0222700.0352920.018041
Std 9.255079 × 10 5 4.810 × 10 10 2.2069 × 10 13 7.2637 × 10 15 1.61898 × 10 14
Table 17. Statistical results for the double-diode JKM330P-72, 310 W polycrystalline PV module.
Experimental CurvesRMSEIterationTime (s)
MaxMinMeanMaxMinMeanMaxMinMean
1000 W/m2 at 47 °C0.0424190.0423770.0431010,00020987912132100101
800 W/m2 at 44 °C0.0432990.0432980.0432910,00022549185189144145
600 W/m2 at 42 °C0.0222700.0222700.02227010,00032879657190133155
400 W/m2 at 36 °C0.0352920.0352920.03529210,00014896991176101110
200 W/m2 at 27 °C0.0180410.0180410.01804110,0001991617314399120
Table 18. I–V values and the relative IAE for the double-diode JKM330P-72, 310 W polycrystalline PV module.
Sr. NumberVoltage Measured   I Calculated   I IAE
109.828049.8772760.049236
21.7757419.8294389.8734790.044041
32.9965579.865639.8708680.005238
44.6613119.8669379.8673070.00037
56.5480389.8684269.8632690.005157
69.1006589.8704329.8577970.012635
710.543419.8715679.8546960.016871
811.54239.8723579.8525410.019817
913.096089.8735839.8491690.024414
1015.759729.8756819.8432750.032405
1116.980479.8766439.8404780.036166
1218.867189.8781229.8359050.042217
1320.531939.8442119.8314010.012809
1421.64189.8450829.8279580.017124
1523.639499.8466639.82010.026563
1625.859229.7779589.806250.028293
1727.523979.7440369.7883740.044338
1829.743629.6753419.7426260.067285
1930.964469.6410749.6972290.056155
2032.074239.6067179.6343180.027602
2135.514729.257179.1640770.093093
2237.845438.3783538.3351110.043242
2340.176056.5836726.6893380.105666
2442.062764.5420544.5160720.025982
2543.616532.1479132.0968560.051057
2644.726400.0315690.031569

