A Method of DC Arc Detection in All-Electric Aircraft


1
School of Electrical Engineering, Beijing Jiaotong University, Beijing 100044, China
2
School of Automation Science and Electrical Engineering, Beihang University, Beijing 100191, China
3
Tangshan Power Supply Company of State Grid Jibei Electric Power Co., Ltd., Tangshan 063000, China
*
Authors to whom correspondence should be addressed.
Energies 2020, 13(16), 4190; https://0-doi-org.brum.beds.ac.uk/10.3390/en13164190
Submission received: 1 July 2020
/
Revised: 26 July 2020
/
Accepted: 10 August 2020
/
Published: 13 August 2020
Abstract
:Arc faults in an aircraft’s power distribution system (PDS) often leads to cable and equipment damage, which seriously threatens the personal safety of the passengers and pilots. An accurate and real-time arc fault detection method is needed for the Solid-State Power Controller (SSPC), which is a key protection equipment in a PDS. In this paper, a new arc detection method is proposed based on the improved LeNet5 Convolutional Neural Network (CNN) model after a Time–Frequency Analysis (TFA) of the DC currents was obtained, which makes the arc detection more real-time. The CNN is proposed to detect the DC arc fault for its advantage in recognizing more time–frequency joint details in the signals; the new structure also combines the adaptive and multidimensional advantages of the TFA and image intelligent recognition. It is confirmed by experimental data that the combined TFA–CNN can distinguish arc faults accurately when the whole training database has been repeatedly trained 3 to 5 times. For the TFA, two kinds of methods were compared, the Short-Time Fourier Transform (STFT) and Discrete Wavelet Transform (DWT). The results show that DWT is more suitable for DC arc fault detection. The experimental results demonstrated the effectiveness of the proposed method.

1. Introduction
An arc fault in the power distribution system (PDS) of an all-electric aircraft (AEA) is difficult to be traced since it is a transient phenomenon [1]. Furthermore, many arc faults only occur when the aircraft is flying, accompanying the severe vibration of the frame, the high stress on the cable, the high altitude, etc. These environmental factors lead to the insulation being declined or the cable connection loosened, which make it easier to cause arc faults. The arc discharge is also an erratic phenomenon affected by different power electronic loads and controllers [2]. Different environment makes these arc faults hard to reproduce during the maintenance after the aircraft has landed [3]. Therefore, it is necessary to obtain an accurate and real-time arc detection method. According to the cause and location of the arc, aircraft arc faults can be divided into parallel arc faults, ground arc faults, and series arc faults. Caused by the insulation destruction of the cables, parallel arc fault refers to the short-circuit arc faults developed between cables, while ground arc faults regularly occur between the cable and chassis [4]. Series arc faults, generated between the loosened contacts, often appears at the connections of the plug or series load, and the arc can be regarded as an extra load [5]. When it occurs at the PDS, it is difficult to be detected because the circuit current is very small. Moreover, conventional circuit breakers, which are unsuited to switch to a low-current circuit off, might introduce a series arc fault during the over-current circuit break [6]. Therefore, it is not suitable for the PDS protection.
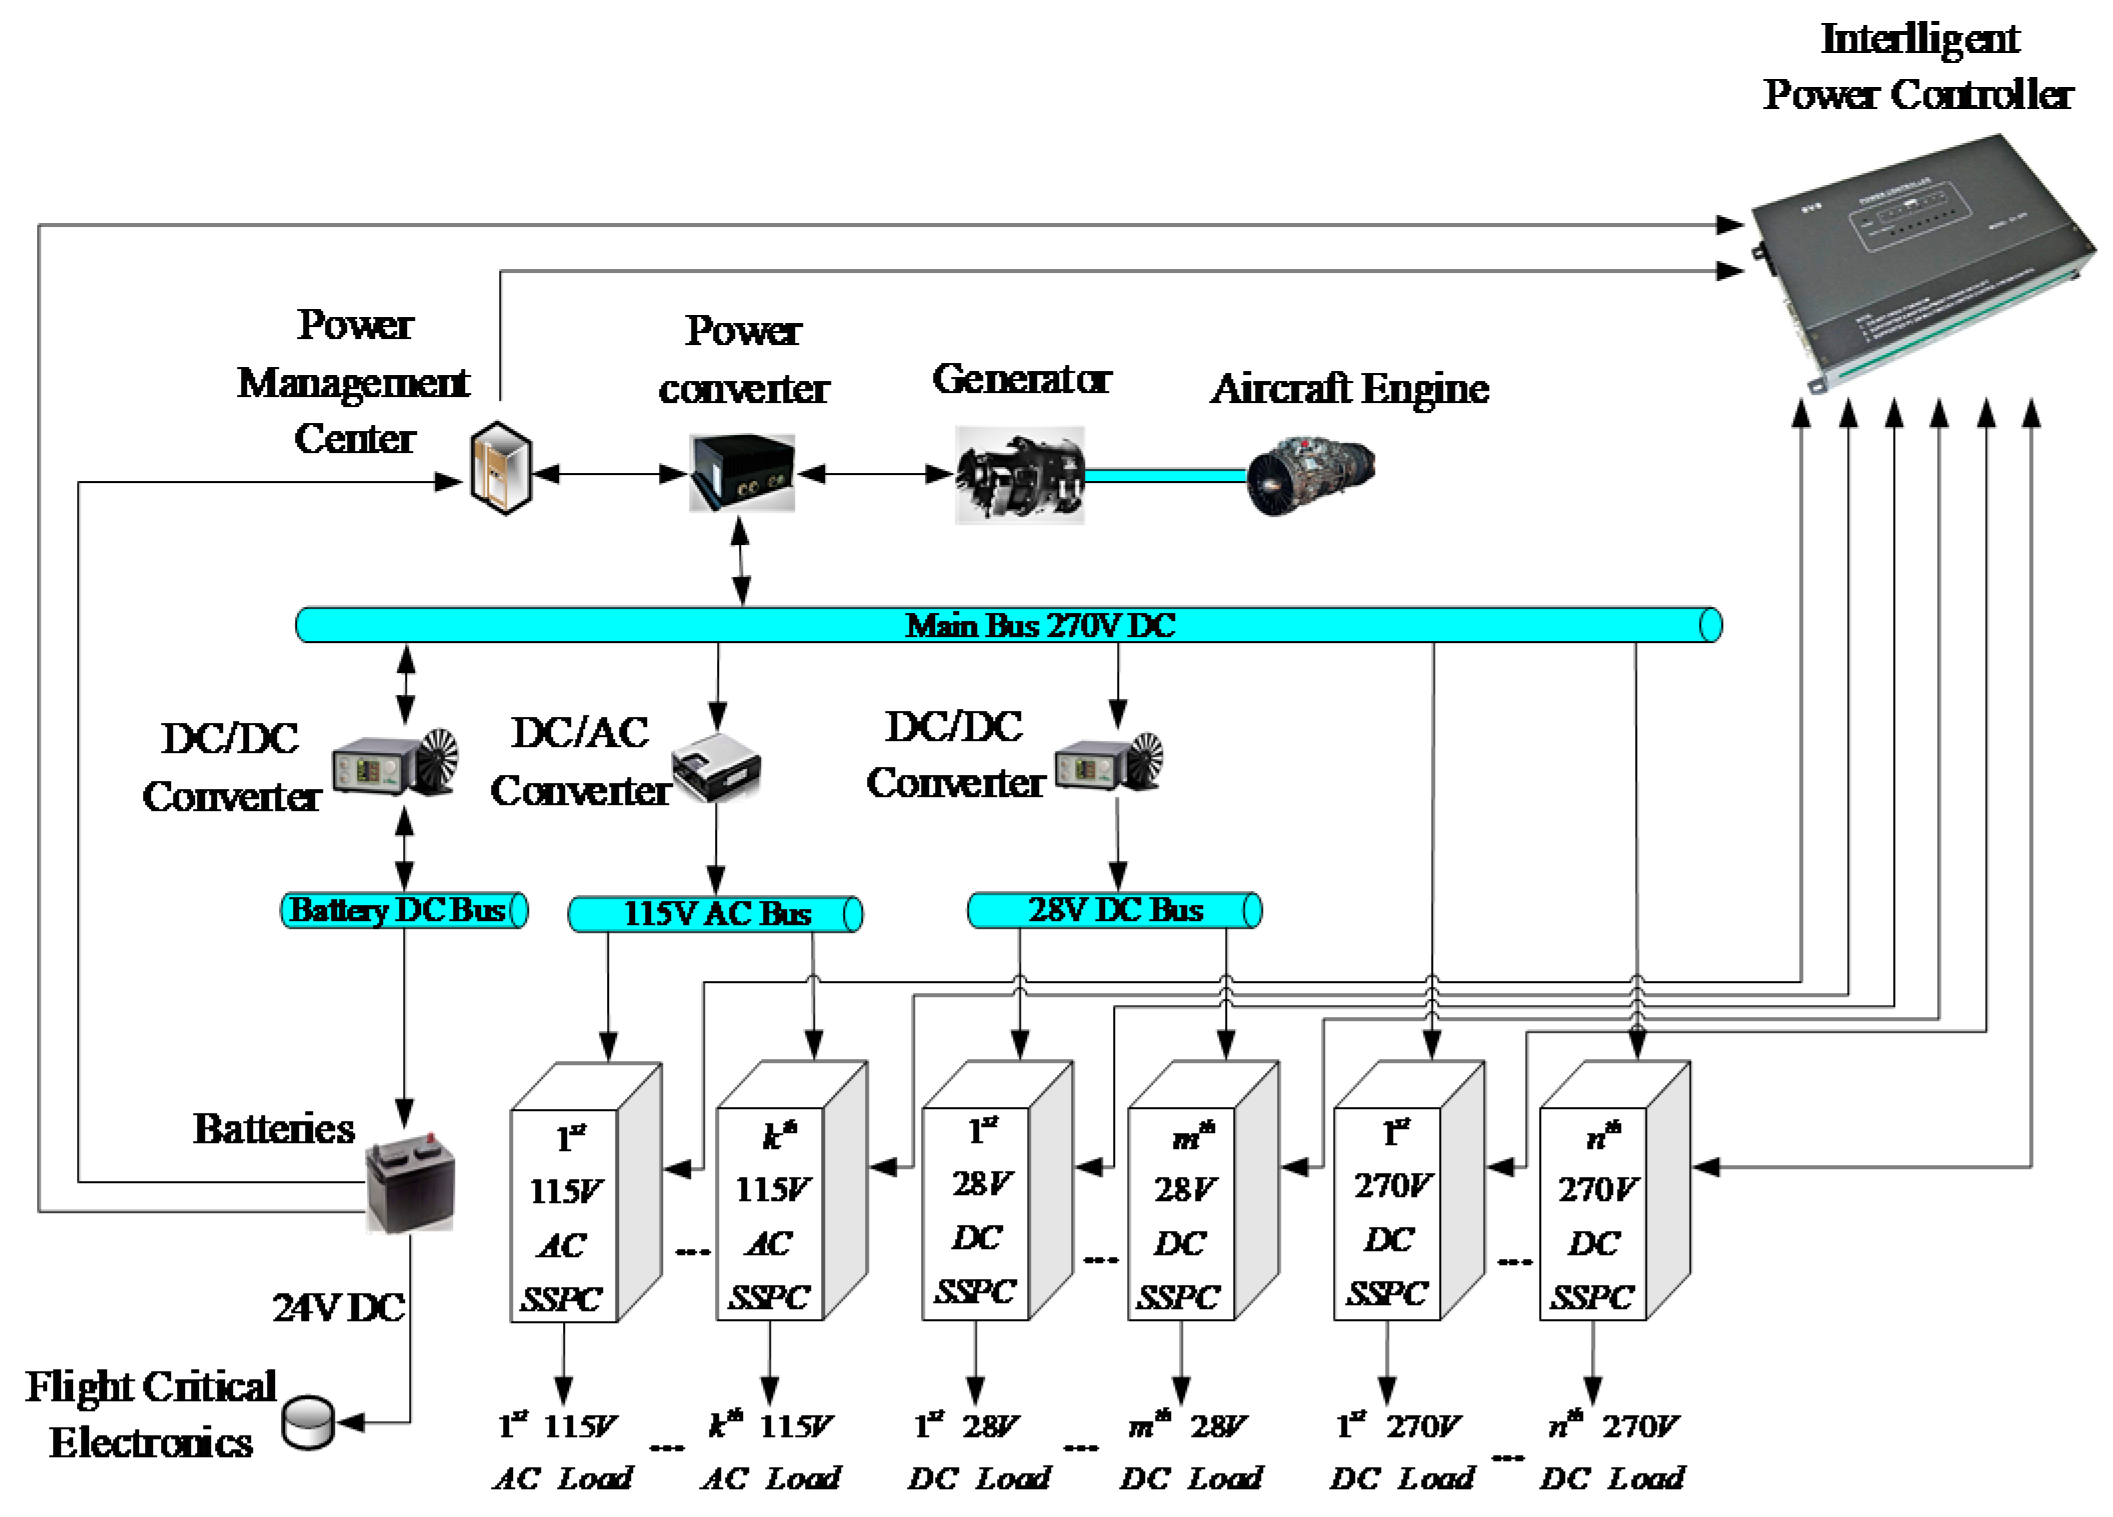
A Solid-State Power Controller (SSPC), an intelligent power controller with a protection function, has been widely used to protect the PDS [7]. The PDS, including a main Direct Current(DC) bus and a series of SSPCs, is shown in Figure 1; it shows the aircraft load and the power supply are connected under the control of the SSPC. An SSPC is used to break the circuit in more critical conditions since it is more reliable and faster to switch the power off [8]. Although an SSPC is able to protect the circuit from many faults, such as from short circuits, overloads, and some arc faults [9], it is hard to protect the cables from a series of arc fault [6]. Thus, a detection method for series arc faults is needed.
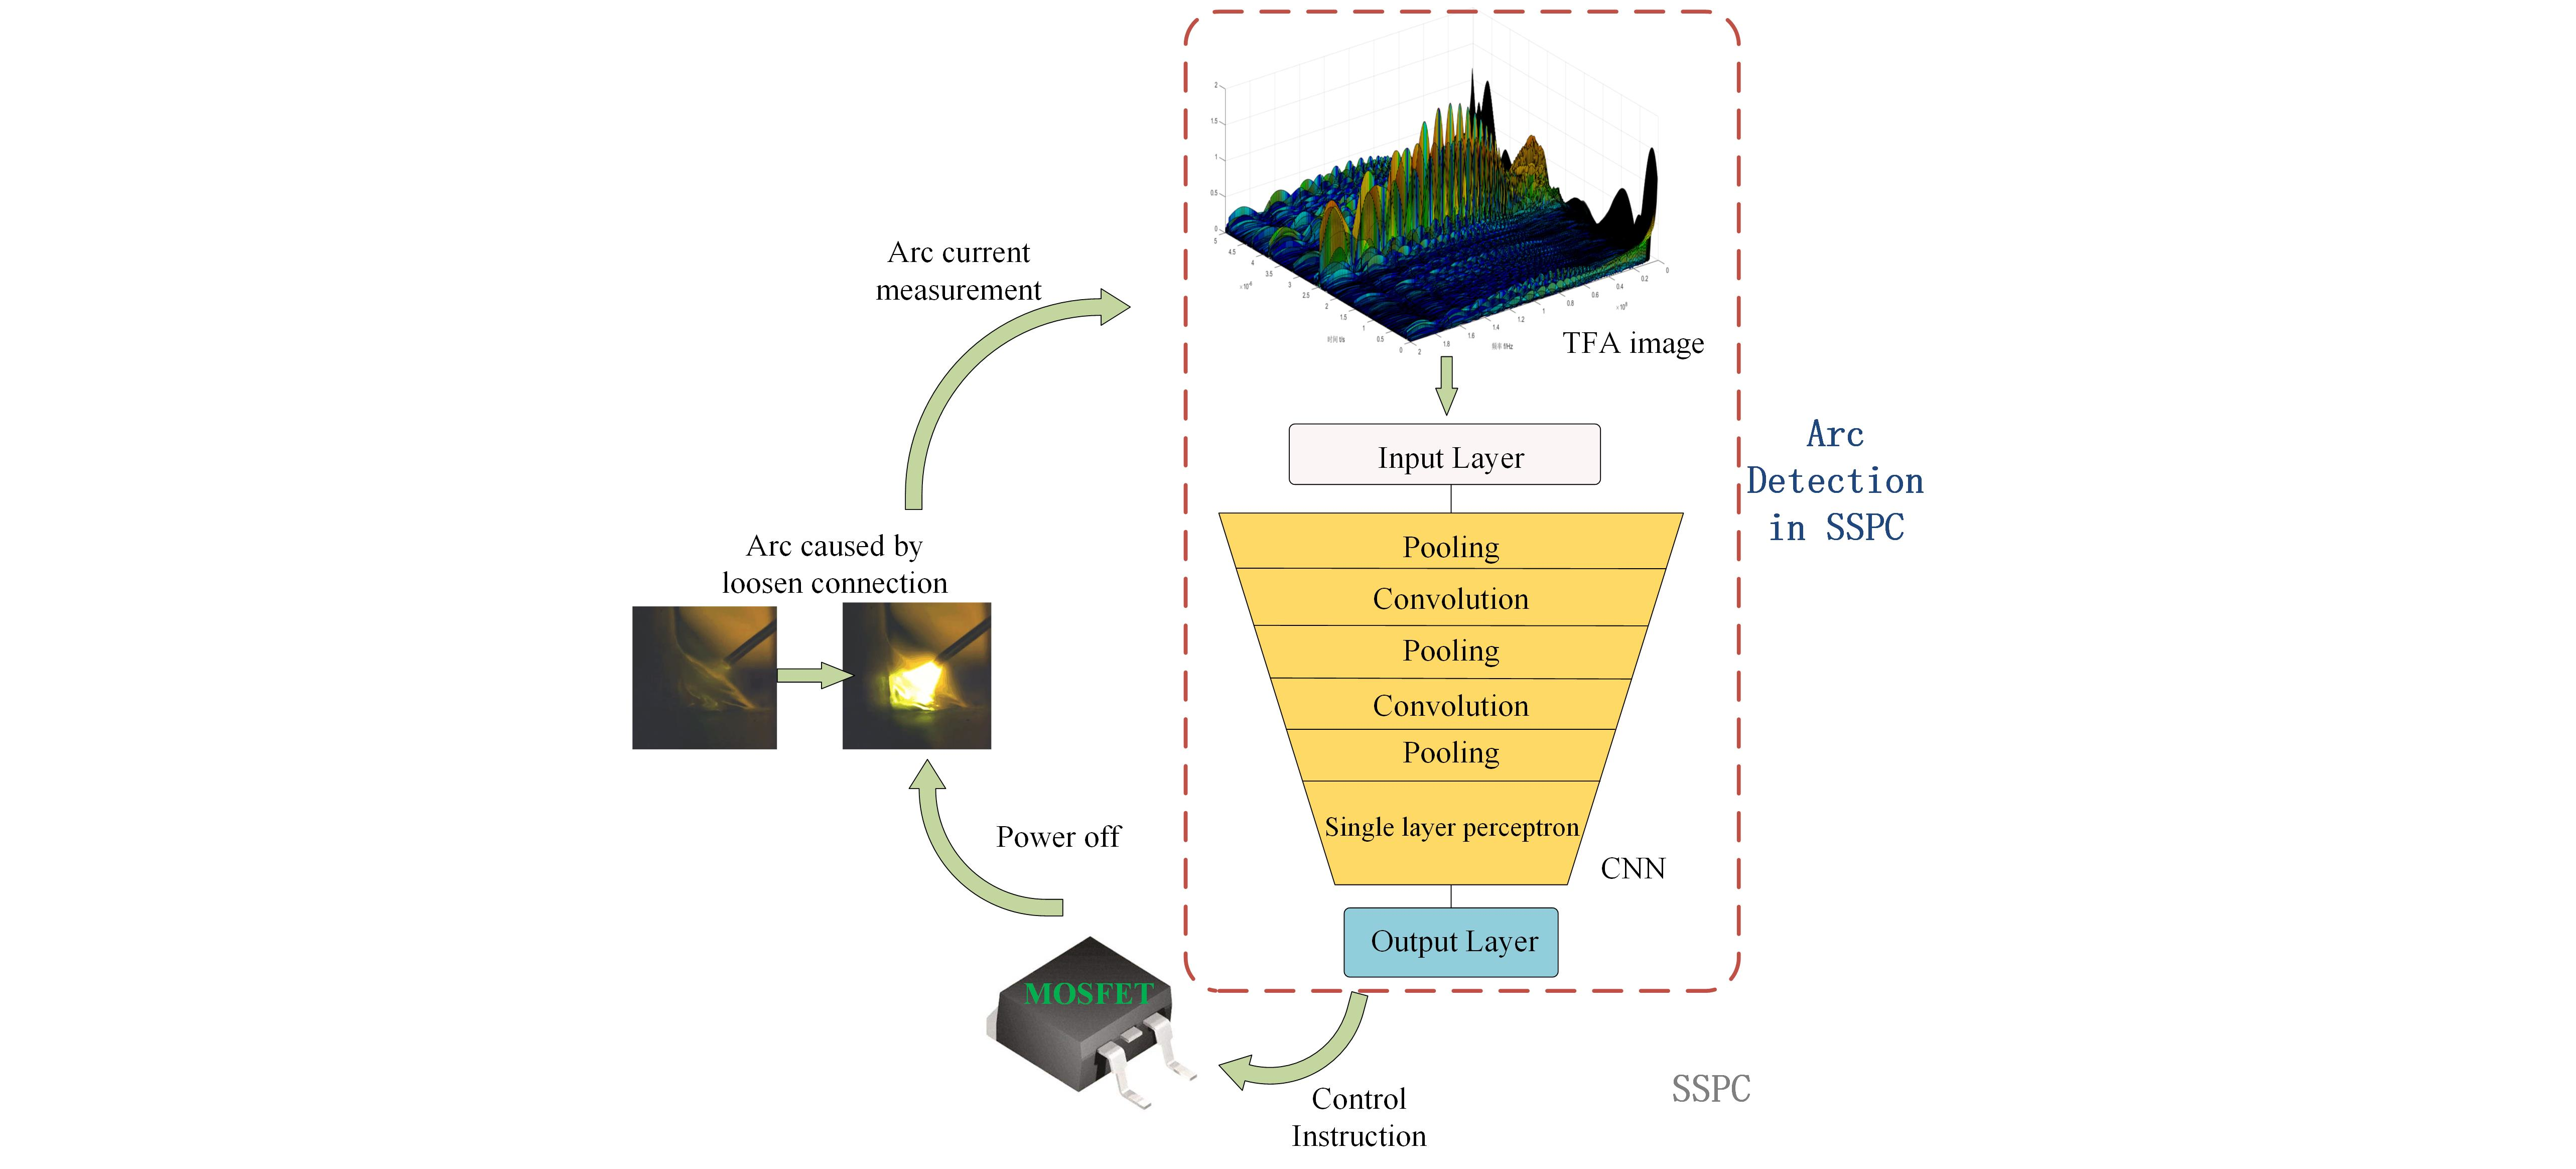
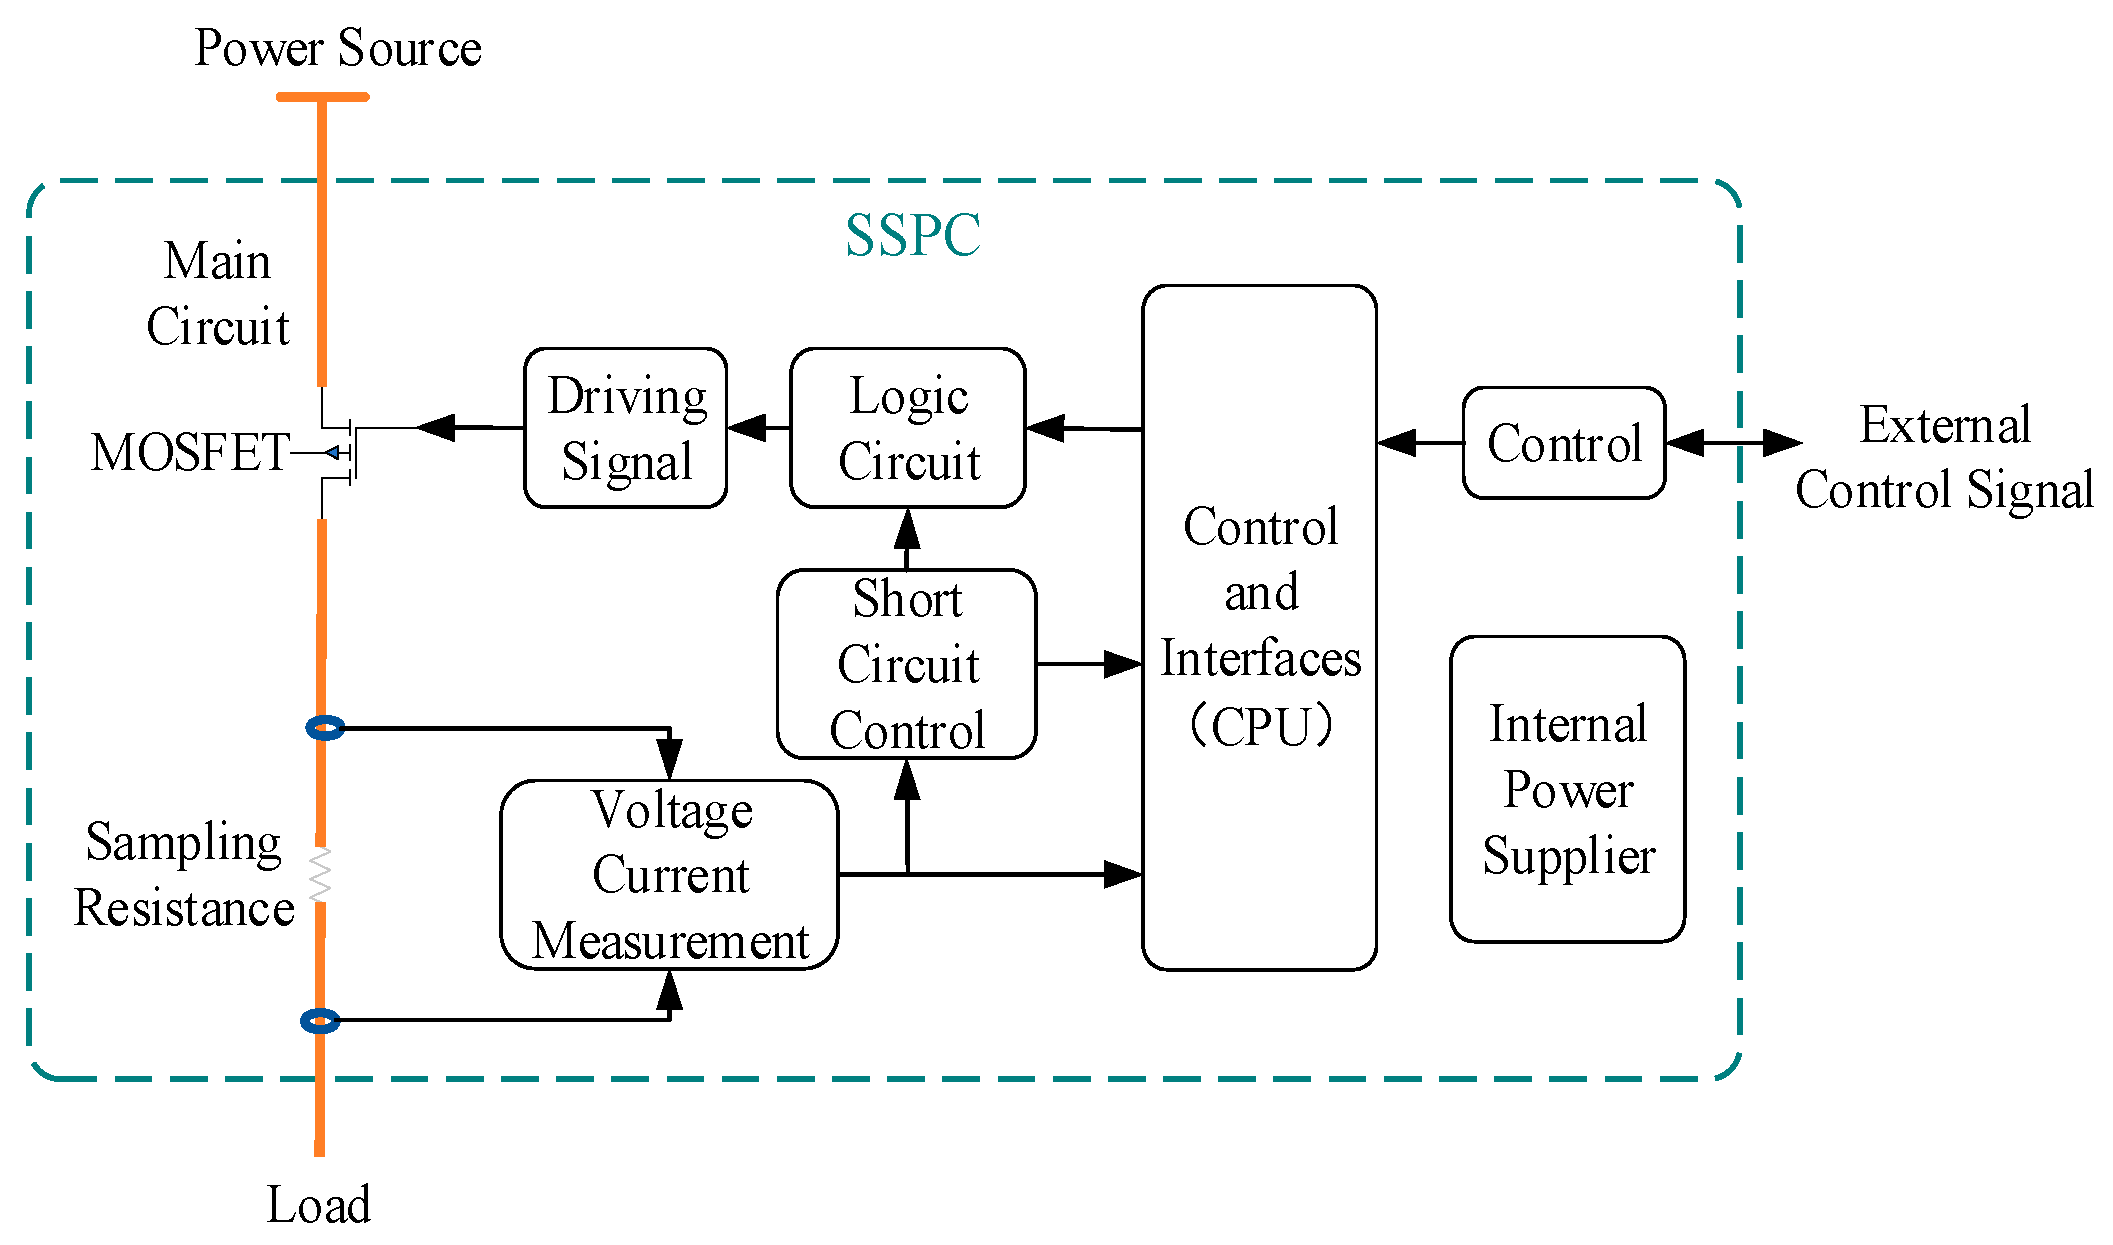
The structure of the SSPC is shown in Figure 2. Unlike traditional breakers, MOSFETs will not introduce arcs when switching the circuit off [3]. Therefore, an SSPC has the advantages of compactness, high reliability, and fast control by cutting off the power supply within 25 ms [3]. A DC arc fault detection algorithm can be integrated in the SSPC. According to the diagnosis results of the voltage or current of the main circuit measured by the voltage/current measurement modules, the algorithm generates driving signals to disconnect the MOSFETs with the power supply when the DC arc is detected.
Researchers in various fields have been studying arc fault detection, such as renewable energy power generation [10], electric vehicles [11], DC power distribution systems [12], aerospace [3], etc. According to the characteristics of the current flowing through the arc, arc faults can be divided into DC arc faults and Alternating Current(AC) arc faults [4]. Two kinds of AC arc fault detection methods based on an SSPC in aerospace have been presented [3]. Unlike the AC current, it is not easy to extinguish the DC arc since it has no zero-crossing point [13], so it is necessary to develop a DC arc detection method that can be integrated into the SSPC. For the DC arc detection, the parallel and ground arcs cause large load current surges, which can be more easily detected by the overcurrent protection. It is more difficult to detect series arcs since it decreases the load current [2]; there remains to be this lack in the methods to obtain high-accuracy arc fault detection and diagnosis for series DC arc faults in aircrafts.
Various detection methods have been studied in the past. The proposed detection methods can be divided into the physical feature methods, including the heat, sound, and light detection methods [14,15,16]; time domain feature methods [13,17,18]; frequency domain feature methods [19,20,21]; time-to-frequency analysis methods [12,13,14,19]; artificial intelligence methods [9,13,15,20]; the arc current entropy method [22,23]; and the blind-source separation method [24]. The study of time domain and frequency domain features based on the arc voltage or current are reliable compared to the physical feature methods, where the detection accuracy is sensitive to the position of the sensor installation [25]. Furthermore, as aforementioned, it can realize the real-time detection within dozens of milliseconds. However, the detection accuracy is usually below 90% since most of them only extracted some features of the signals as the arc fault detection criteria, such as the amplitude or the variance of the wavelet coefficient of the arc current [18]. The accuracy is low by using some criteria purely in certain domains due to the limited characteristic information of the arc current or voltage, even though multiple criteria was adopted [17,26].
Time–Frequency Analysis (TFA) could present the time and frequency local features at the same time, or the mapping relationship of the features in the two domains. Therefore, with the TFA it is easier to distinguish the arc signal from the normal signal [27]. It shows that the Short-Time Fourier Transform (STFT) with a Hamming window behaves much better than the real-time Fast Fourier Transform(FFT) for getting a more obvious separation between the normal and fault detection variable values [18]. Of course, data fusion from multiple detection methods could further improve the accuracy. For example, the time-domain fluctuation and STFT analysis variables are fused to give a high accuracy above 95.9% [18]. The Discrete Wavelet Transform (DWT) has also been applied [28]. It has a relatively higher accuracy compared to the STFT; however, with a lower computation efficiency [18].
Due to the nonstationary and nonlinearity of the arc signals, artificial intelligent methods could further improve the arc detection accuracy. A series of machine learning methods have been applied to perform the arc detection, including the support vector machine (SVM) [29], extremely randomized trees (ET), random forest (RF), K-nearest neighbor (KNN), Gaussian Naive Bayes (GNB), hidden Markov model (HMM) [30], etc. Each method has its own advantage and disadvantage, such as there is no need for the KNN to be trained compared to the SVM; however, SVM has a better detection accuracy [17,29]. Ensemble machine learning (EML) has been performed to achieve a higher accuracy close to 100%. Three ensemble techniques, including bagging, boosting, and stacking, were studied. It showed that the stacking ensemble algorithm maintains superior performance compared to other EML algorithms [17].
Even though the EML has a high accuracy, however, it heavily relies on the ensemble method and integrated models. It shows that the bagging technique that used SVM as a base learner (E-SVM) only achieved a 98.5% accuracy using 3000 training datasets [17]. In contrast, deep learning can automatically extract and choose the features. A deep neural network (DNN) with Fourier coefficients, Mel cepstrum data, and wavelet features as inputs were used to identify the DC arc faults [31]. Comparing with other deep learning methods, there are problems, such as the expansion of the number of parameters and overfitting for reaching a high accuracy, and it is impossible to model the changes in the time series [32]. Convolution Neural Network (CNN) has shared convolution kernels; there is no pressure for processing the high dimensional data by using CNN compared to DNN [32]. A domain adaptation (DA) combined with a deep convolutional generative adversarial network (DCGAN) was proposed to diagnose the DC series arc faults in a changed scene, where the lightweight CNN classifier was used offline firstly for training the network and then online for the arc fault diagnosis. However, normal and arc data in the time domain were packed to form the 2D image as the input of the CNN other than the TFA generation [33]. A new DC arc fault detection algorithm based on a Convolution Neural Network (CNN) is proposed here. CNN is used to distinguish the arc fault by automatically analyzing the time–frequency spectrum of the circuit current, which is obtained from the Time–Frequency Analysis (TFA) of the current signal with full detail representation. There is no need to the extract and choose the features manually as with some machine learning methods. This method has been applied for detecting other faults [32]. However, it is the first time its feasibility and accuracy are explored for detecting a series DC arc in aircraft. The TFA generation methods of the STFT and the DWT were used. Combined with an improved CNN, the experimental results bearing the arc faults show a high accuracy for a series arc fault diagnosis, which is close to a 100% accurate identification after the CNN is trained by the TFA of 104 arc signals. At the same time, the diagnosis time is also fast, which is around 1 s.
2. Time–Frequency Analysis of the Current Signal
Compared to pure time-domain or frequency-domain representation, the TFA includes information in both domains for the DC arc. Moreover, there is no need to extract the arc characteristics anymore; considering the arc is easily disturbed by the noise, the TFA can separate the detected signal from the surrounding noise intuitively [9]. Therefore, the signal information is more complete without discarding some details.
Nowadays, a great number of TFA methods have been developed, including the Empirical Mode Decomposition (EMD) [13], Wigner–Ville Distribution (WVD) [15], and Discrete Wavelet Transform (DWT) [20]. However, bilinear time–frequency distribution methods represented by WVD are used less due to the inherent cross-interference items, and the EMD methods are susceptible to mode aliasing [26]. DWT has been paid lots of attention to in the multiresolution analysis because it can identify the component of a signal on a multi-scale and has been applied in the field of arc fault detection [28]. Here, we will discuss the DWT method by comparing two kinds of wavelet bases.
In the general wavelet basis, the dependent variables of the time–frequency spectrum are the scale coefficient and the wavelet coefficient, while the dependent variable is the wavelet coefficient in the orthogonal wavelet basis [34]. As a result, the spectrum of the orthogonal wavelet generation is selected here to reduce the impact factors of the spectrum generation.
In DWT, scale a and translation b are discrete, and the input signal is continuous [35]. Thus, the discrete current signal in the database should be reconstructed into a continuous signal before the DWT. The reconstructive function is
where n is the number of sampling points for each current data; fs is the sampling frequency; t is the time variable; f(i/fs) is the value of discrete sampling signal; and f(t) is the reconstructed function. fs must satisfy the Shannon sampling theorem, so that there will be no spectrum aliasing when the signal is reconstructed. The wavelet coefficients of the DWT are calculated accordingly:
where Ψ*j,k(t) means the conjugate of Ψj,k(t); Wf (2−j, 2−jk) is the wavelet coefficient in two dimensions; a is 2−j and b is 2−jk; and Ψj,k(t) is the orthonormal basis generated by the orthogonal wavelet Ψ(t), which is shown as follows:
where Ψ[(t−2−jk)/2−j] is the result of Ψ(t) after t is magnified by dividing 2−j firstly and then shifted to the right by 2−jk.
In Equation (2), the wavelet coefficient is a measurement of the similarity between the wavelet basis and the original signal Ψj,k (t) [35]. In other words, Equation (2) only expresses the relationship between the wavelet coefficient and the relative frequency of the signal on the wavelet basis, but not the relationship between the wavelet coefficient and the actual frequency of the signal.
The actual frequency fa can be calculated by the wavelet center frequency fc and the sampling frequency fs, which is shown as follows:
where ca is the scale sequence and c is a constant. The constant c should be determined to get fa. According to Shannon sampling theorem, fa is in the range of (0, fs/2), thus the corresponding range of the scale sequence ca is (2fc, ∞). Suppose s is the length of ca. When the sampling frequency and wavelet basis are fixed, the value of fa depends on the value of ca, and the smaller ca is, the larger fa is. The maximum value fs/2 of fa corresponds to the minimum value c/s of ca. Thus, it is easy to obtain that the value of c is 2 × fc × s.
The time-independent variable sequence ta that only depends on fs and n can be calculated by Equation (5), where ta is the time corresponding to certain sampled point and n is the certain sampling points. Derived from Equation (1) to Equation (5), the time–frequency spectrum is established according to the wavelet coefficients at different times and frequencies derived from the current signals, as shown in Figure 3. When n is fixed, the resolution of the time–frequency spectrum depends on scale a, in which the larger the j, the higher the resolution. On the other hand, the amount of calculation is positively related to j. Therefore, the value of j cannot be set, neither as infinity nor infinitesimal. Through a large number of tests, it is more appropriate that the value of j is 8, so that the length of m is 256.
From Equation (2), the wavelet coefficients merely depend on the reconstructive signal f(t) when the wavelet basis is constant, and the wavelet coefficients of the same signal will be different under different wavelet bases. The commonly used wavelet basis in the field of arc detection is db4, db10, and bior1.5 [4]. Since bior1.5 is not an orthogonal wavelet, db4 and db10 are only discussed here as the wavelet bases of DWT.
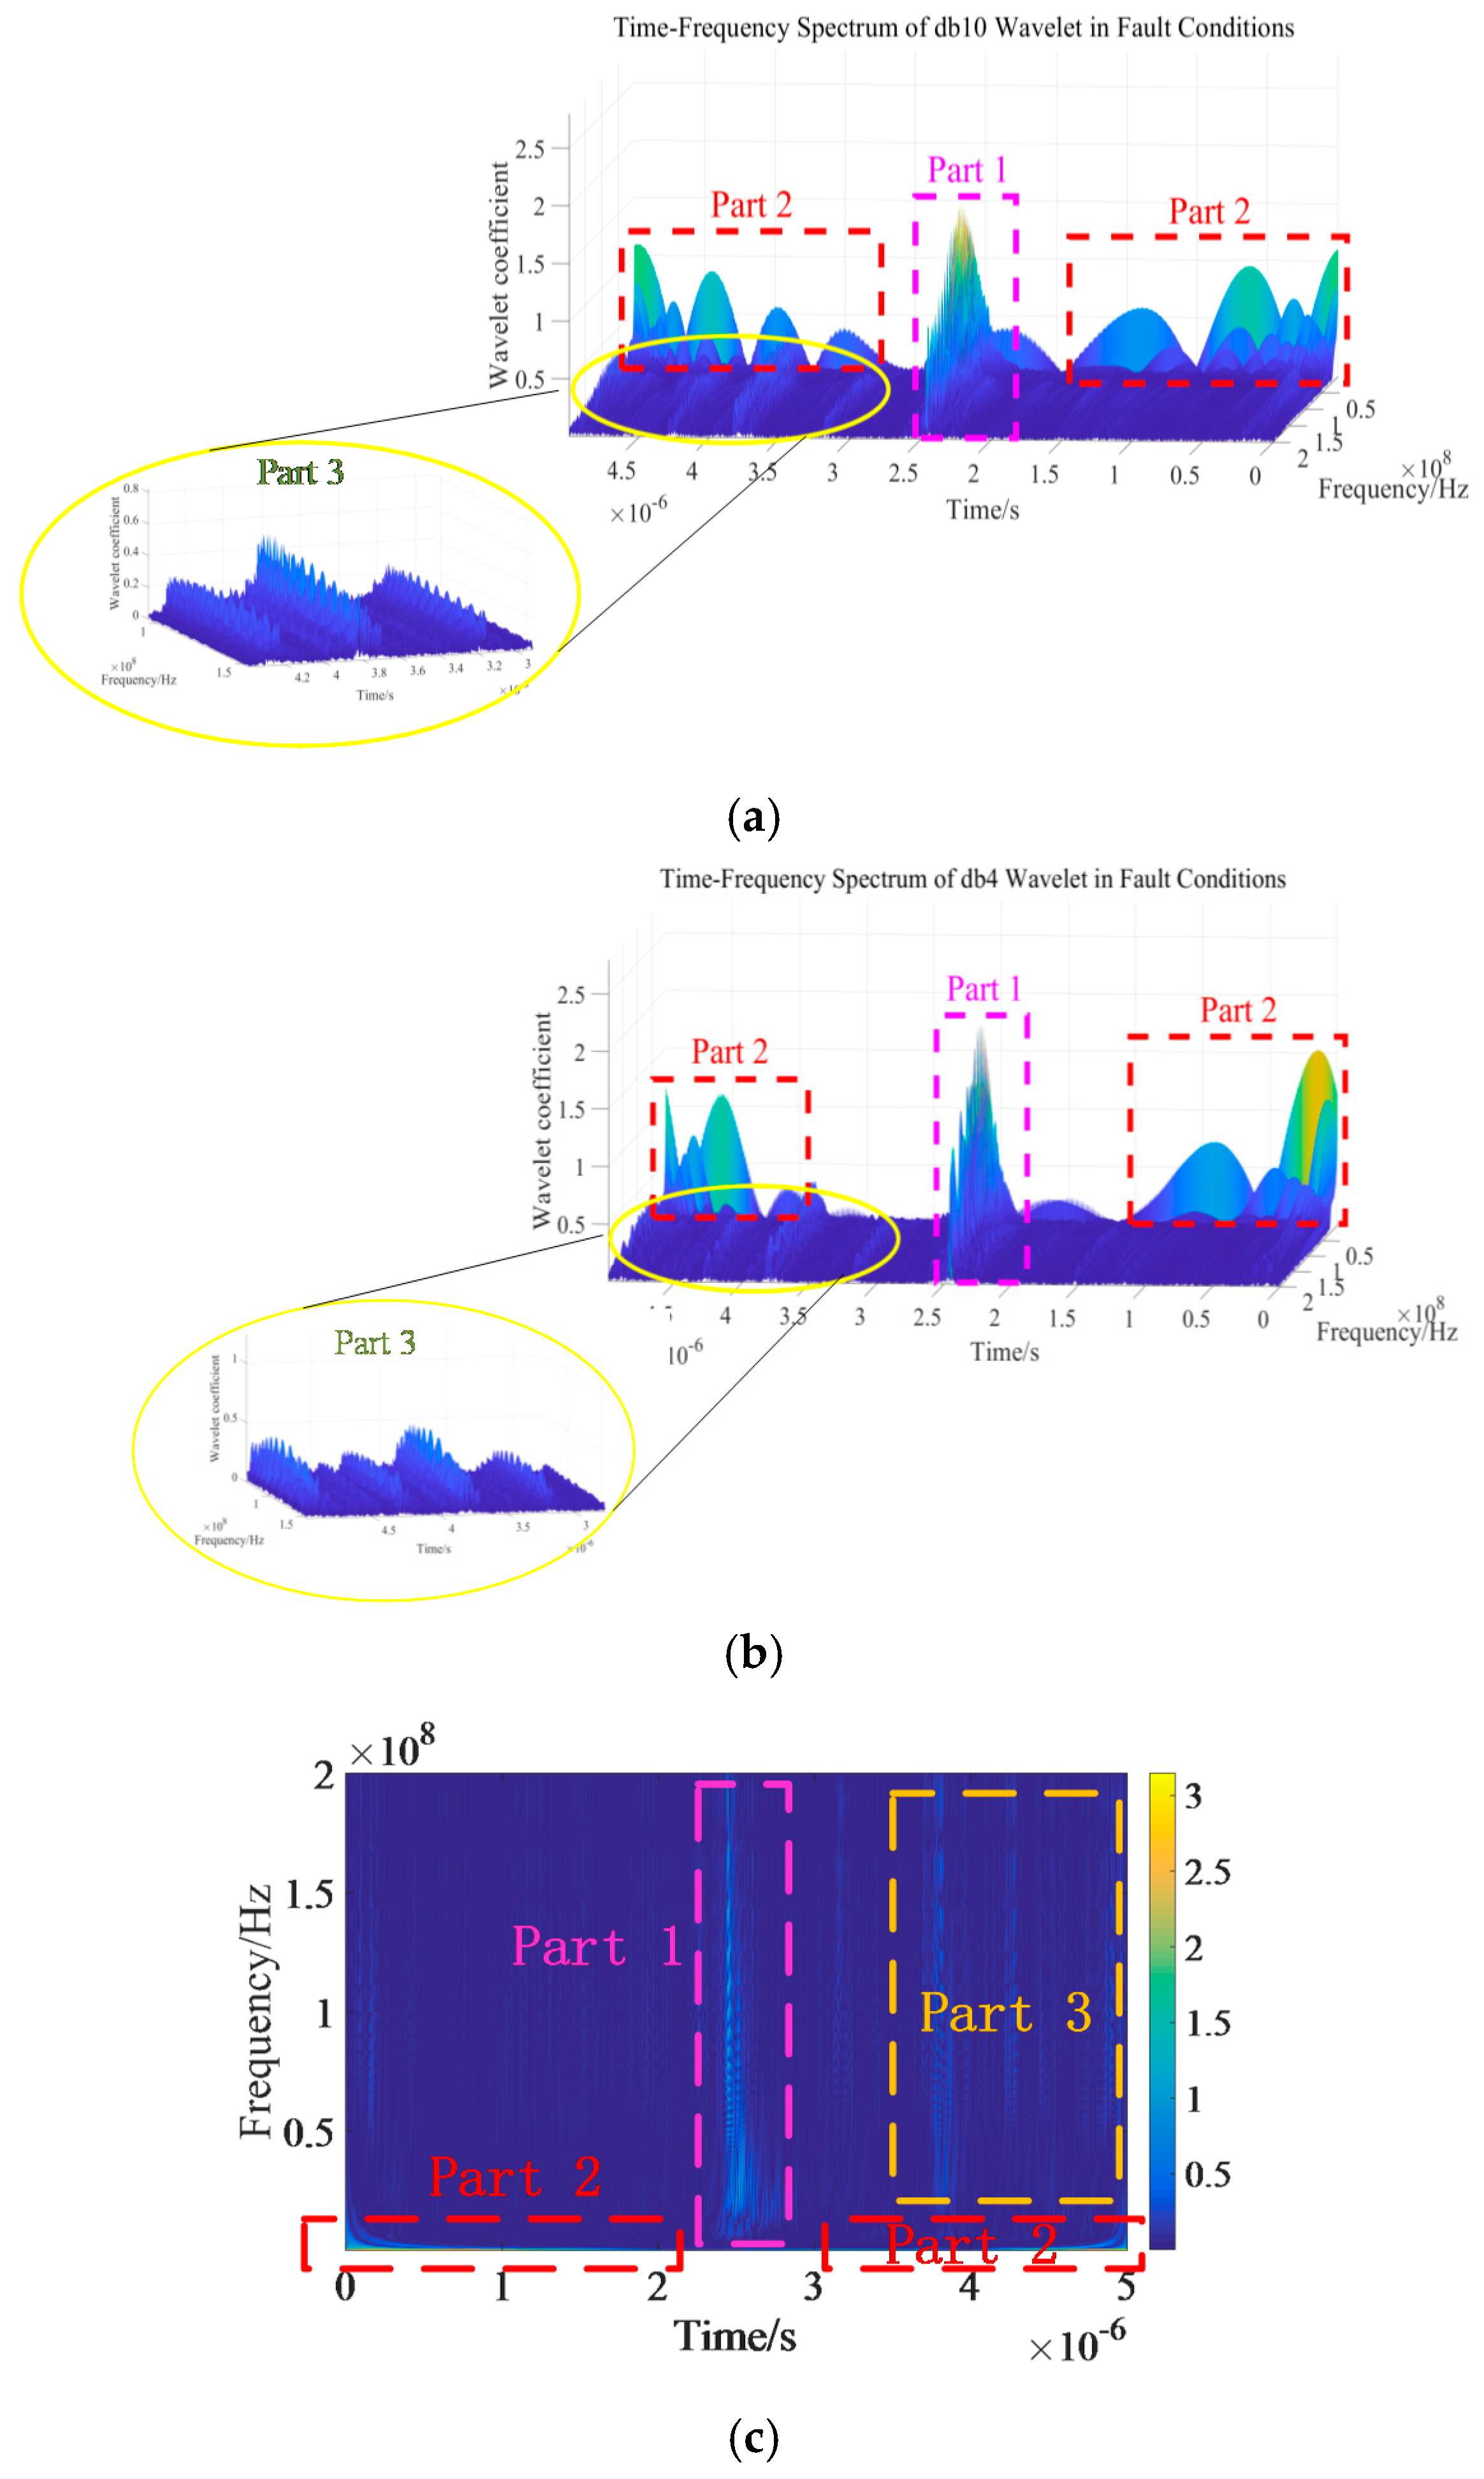
One fault datum is selected randomly from the database, and the time–frequency spectra with db4 and db10 are formed, respectively, to determine the optimal wavelet basis. The results can be seen from Figure 3a,b, corresponding, respectively, to the outcome with db10 and db4.
From Figure 3a,b, the maximum value of the spectrum appears at around 2.5 s in Part 1, and at this moment, it can be observed on the experimental platform that there is an obvious arc between the two electrodes. There are some other peaks in Part 3, shown in the spectrum after the main peak in Part 1, which belong to the arc nuisance noise. However, the peaks in the low frequency bands shown in Part 2 are the artefacts caused by the wavelet transform. Figure 3c is the 2D form of Figure 3b, and it shows that the peaks in Part 2 are at the edges of the image, which do not affect the recognition of the arc fault.
Compare Figure 3a,b: it indicates the wavelet basis of db4 has a better performance since the peak in Part 1 has a larger value. As a consequence, the db4 wavelet is more suitable for the representation of the DC arc when the DWT is applied.
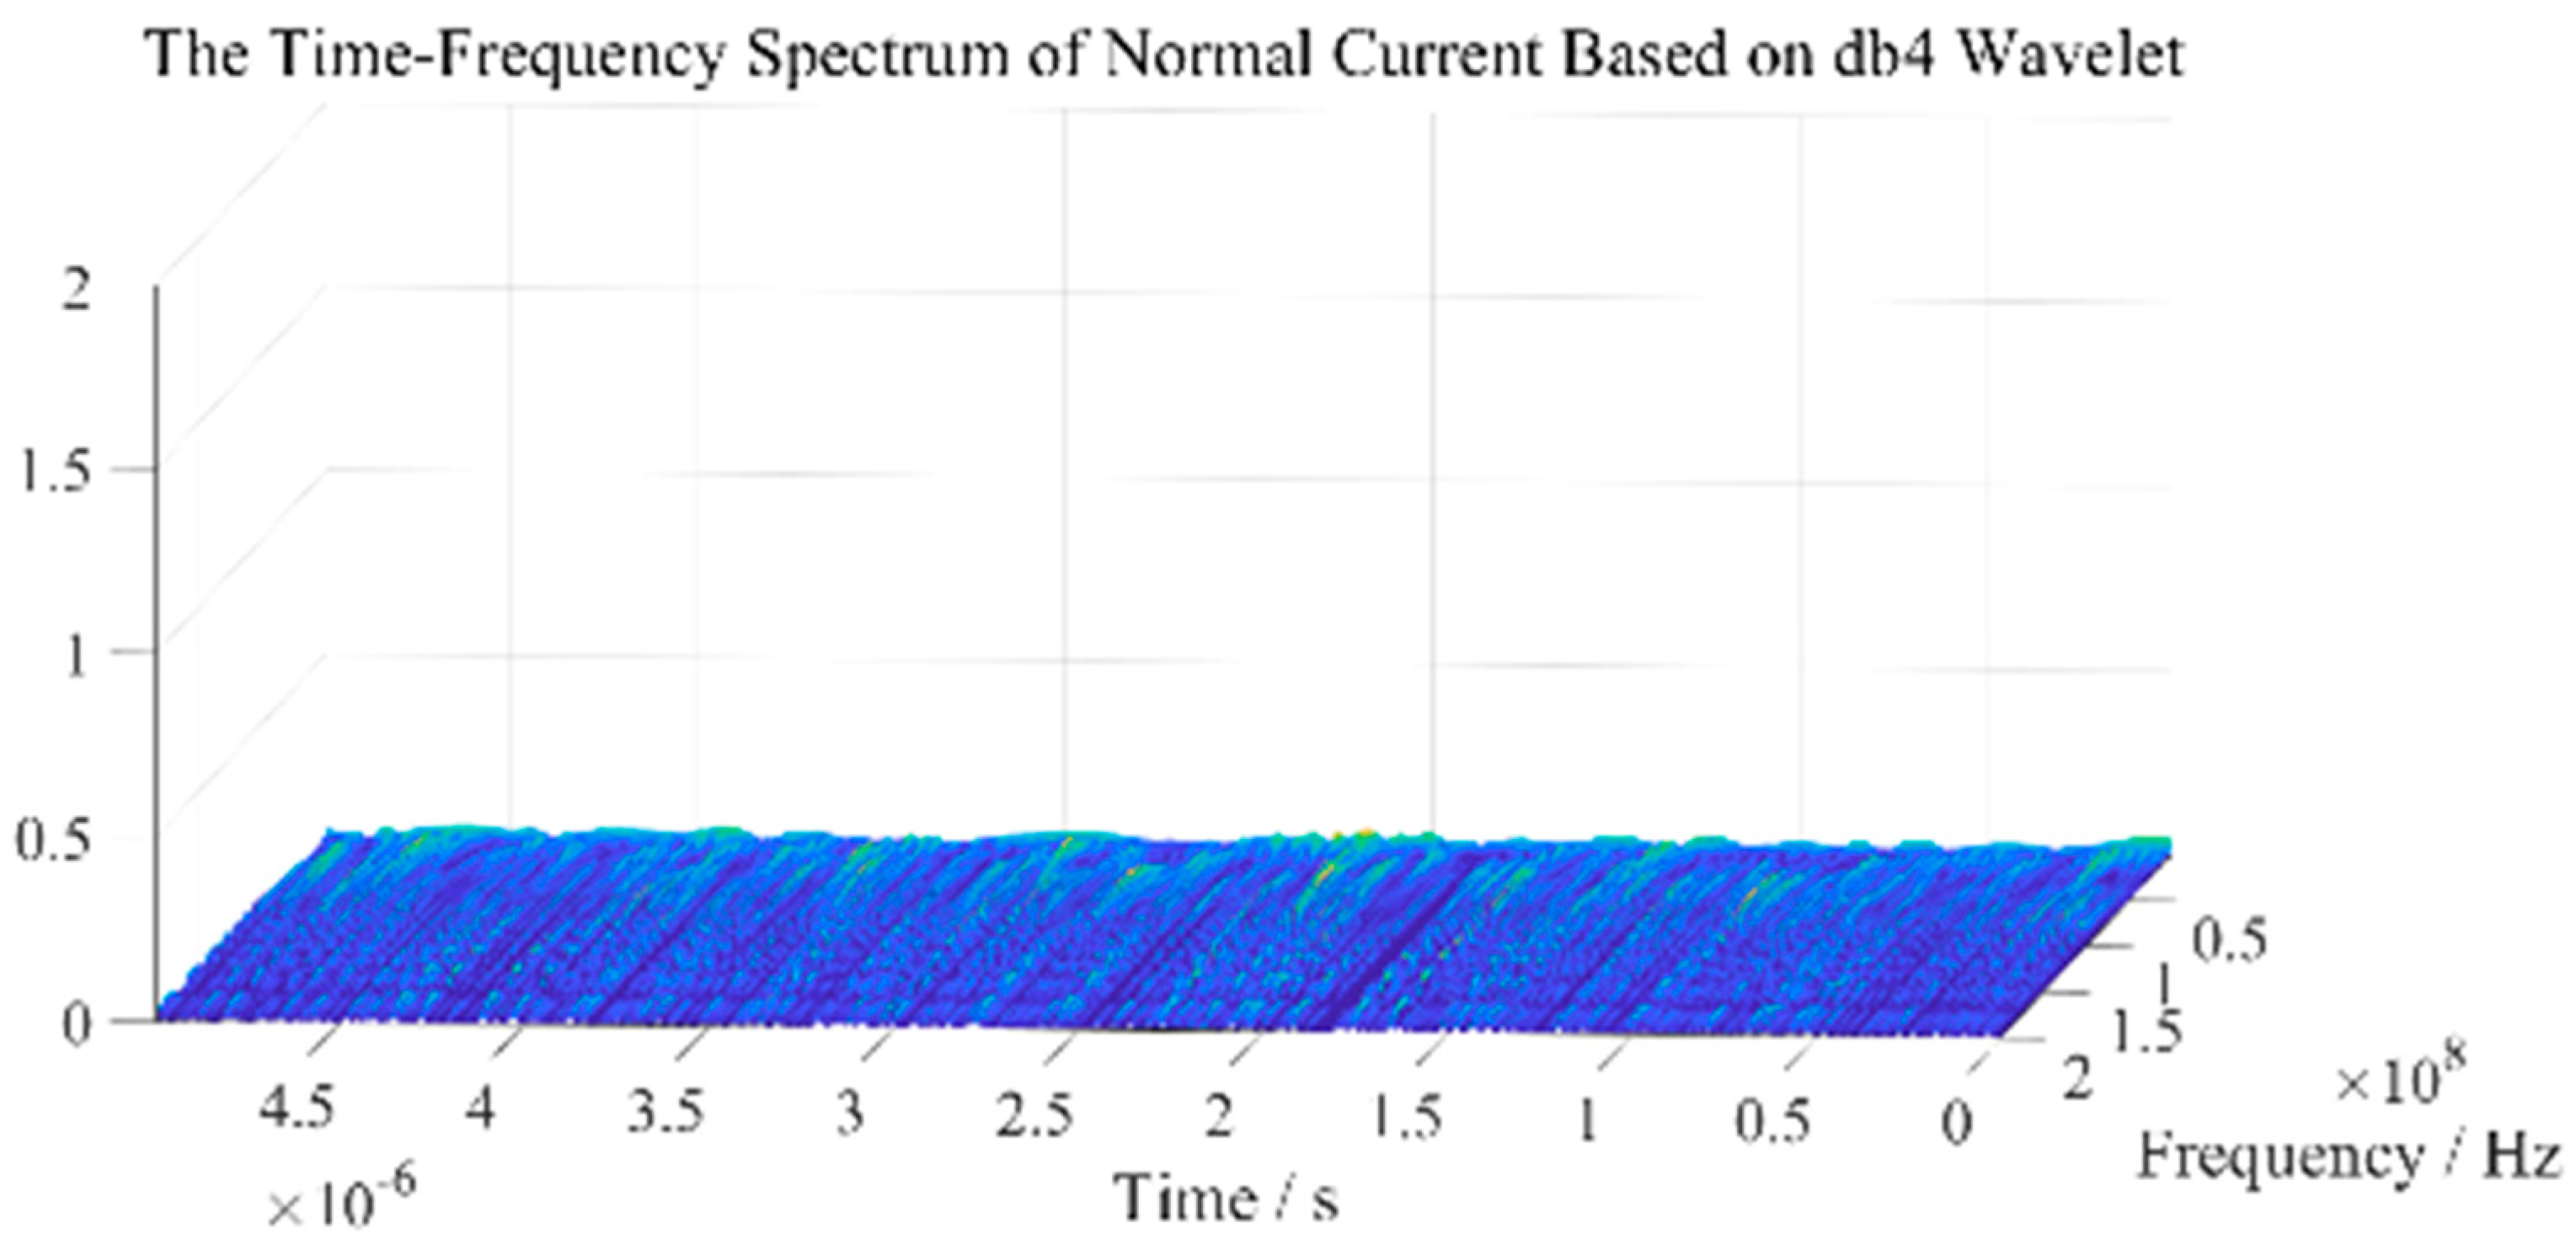
The normal data, which were measured in the same environment as the fault data in Figure 3b, was selected from the database, and its time–frequency spectrum is shown in Figure 4. It can be concluded that the time–frequency spectrum of the normal data is flatter than the spectrum presented in Figure 3b based on the db4 wavelet basis, which means the magnitude of the normal current is far less than the arc current and the normal current fluctuates uniformly. Furthermore, the influence of the db4 wavelet basis on the normal data is not obvious.
3. Construction and Training of the CNN
CNN is a feedforward neural network, which has been successfully applied to image classification [16], face recognition [34], semantic segmentation [35], and object detection [36]. CNN can be viewed as a composite model that is supervised. At the internal of the CNN, each hidden layer serves as the visible layer for the next hidden layer [37]. The connection between the two adjacent layers is sparse, except for the fully connected layer. Connections between the neurons in the same layer are not allowed. The neurons of each layer calculate the output of the upper layer through their weight-sharing, which reduces the complexity of the network and the number of weights [37]. Thus, the calculation speed is efficient.
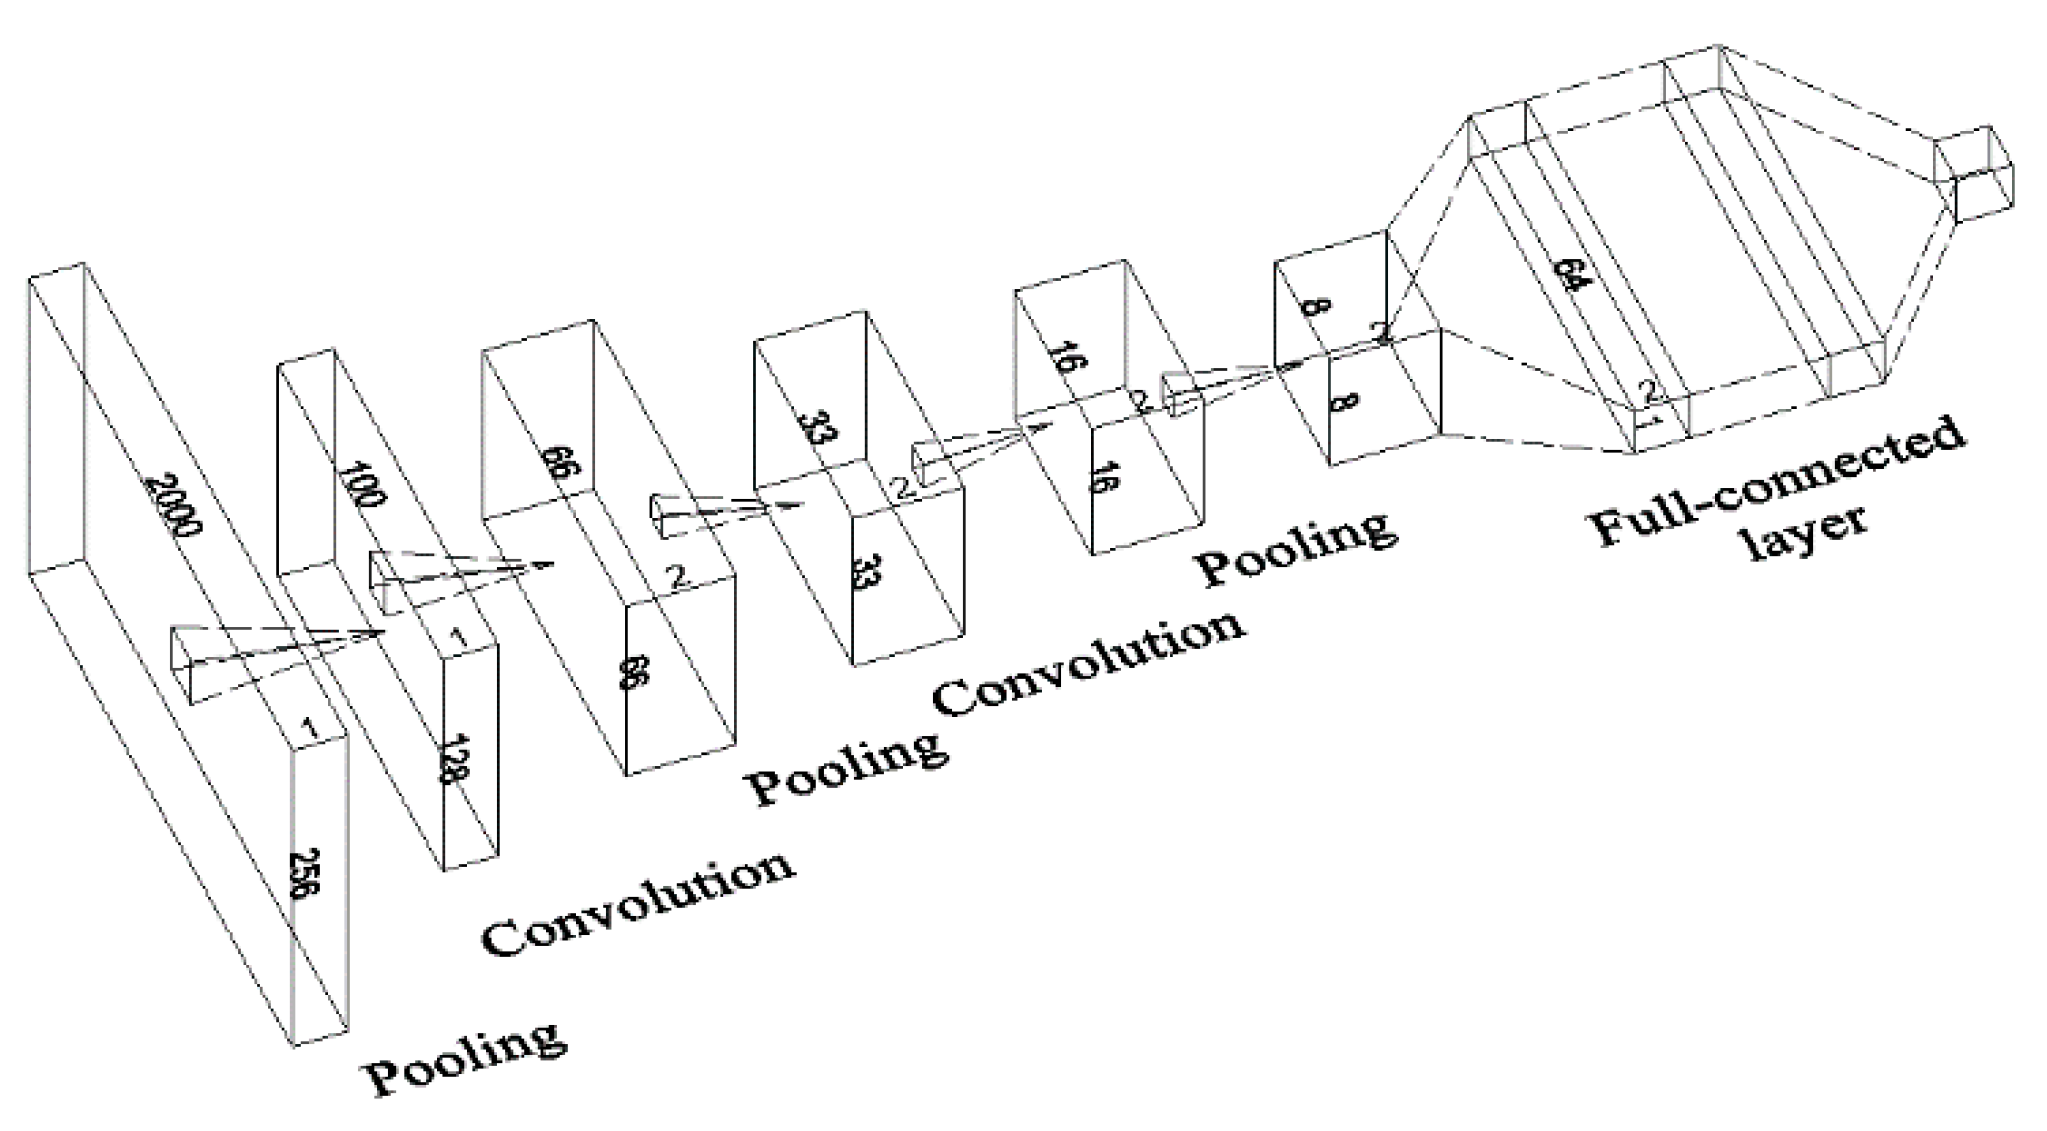
Many CNN structures have been proposed, including some classical structures: LeNet5 [36], AlexNet [37], and VGG [38]. AlexNet and VGG have a complicated architecture in which numerous parameters need to be iteratively calculated. Hence, lots of samples are demanded to train the network before the parameter identification. Besides, numerous parameters lead to an increased computation and extended calculation time. As a result, a complex CNN structure is not suitable for arc detection in SSPC. In this paper, a CNN structure is based on LeNet5, which usually includes two convolution layers, two pooling layers, a full-connection layer, and an output layer. However, one pooling layer is added here as the first layer, to downsize the sample from a 2000 × 256 TFA image to 100 × 128. Therefore, the computation time is decreased greatly. The structure is shown in Figure 5 and the related parameters are shown in Table 1.
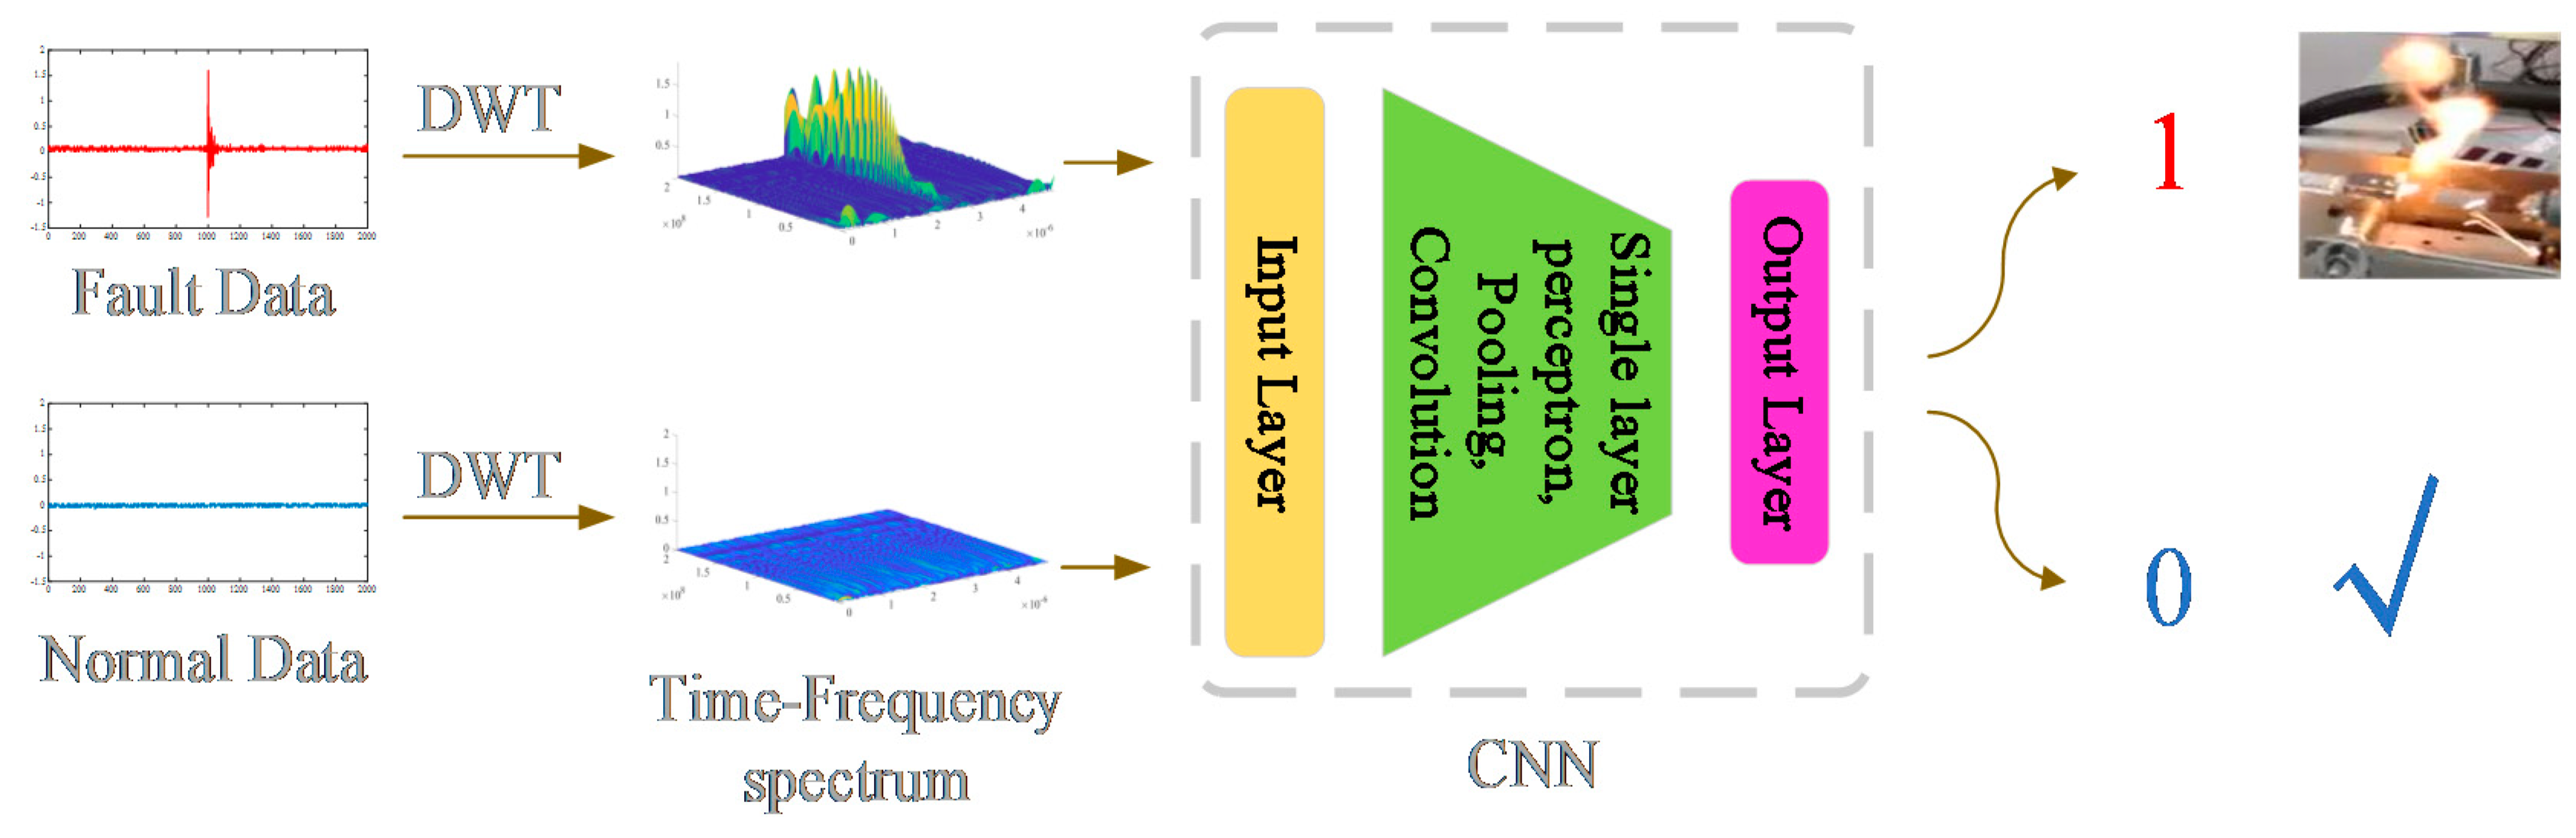
Two feature maps of the normal and arc data were used at the same time for extracting the information. The flow chart of the algorithm is shown in Figure 6. The circuit current is transformed into a time–frequency spectrum as input for the CNN. The result of the CNN indicates whether the arc fault occurs in the circuit.
The load in the circuit was changed while the other conditions were kept constant. The normal current and arc current were measured at the same circumstance where the normal current was measured many times due to the different load each time. There were a total of 104 signals. The normal current data take the proportion of 25.96% in the database while the arc current data take 74.04%. There are only two ideal results of the CNN: 1 and 0, where 1 stands for the arc fault condition and 0 represents the normal condition. We extracted 5 fault signals and 5 normal signals randomly from the database as the test database, and the other 94 signals from the training database. In order for the CNN to learn sufficiently, the time–frequency spectrum of the training data from the training database had been put into the CNN several times.
4. Results and Discussion
4.1. Experimental Results
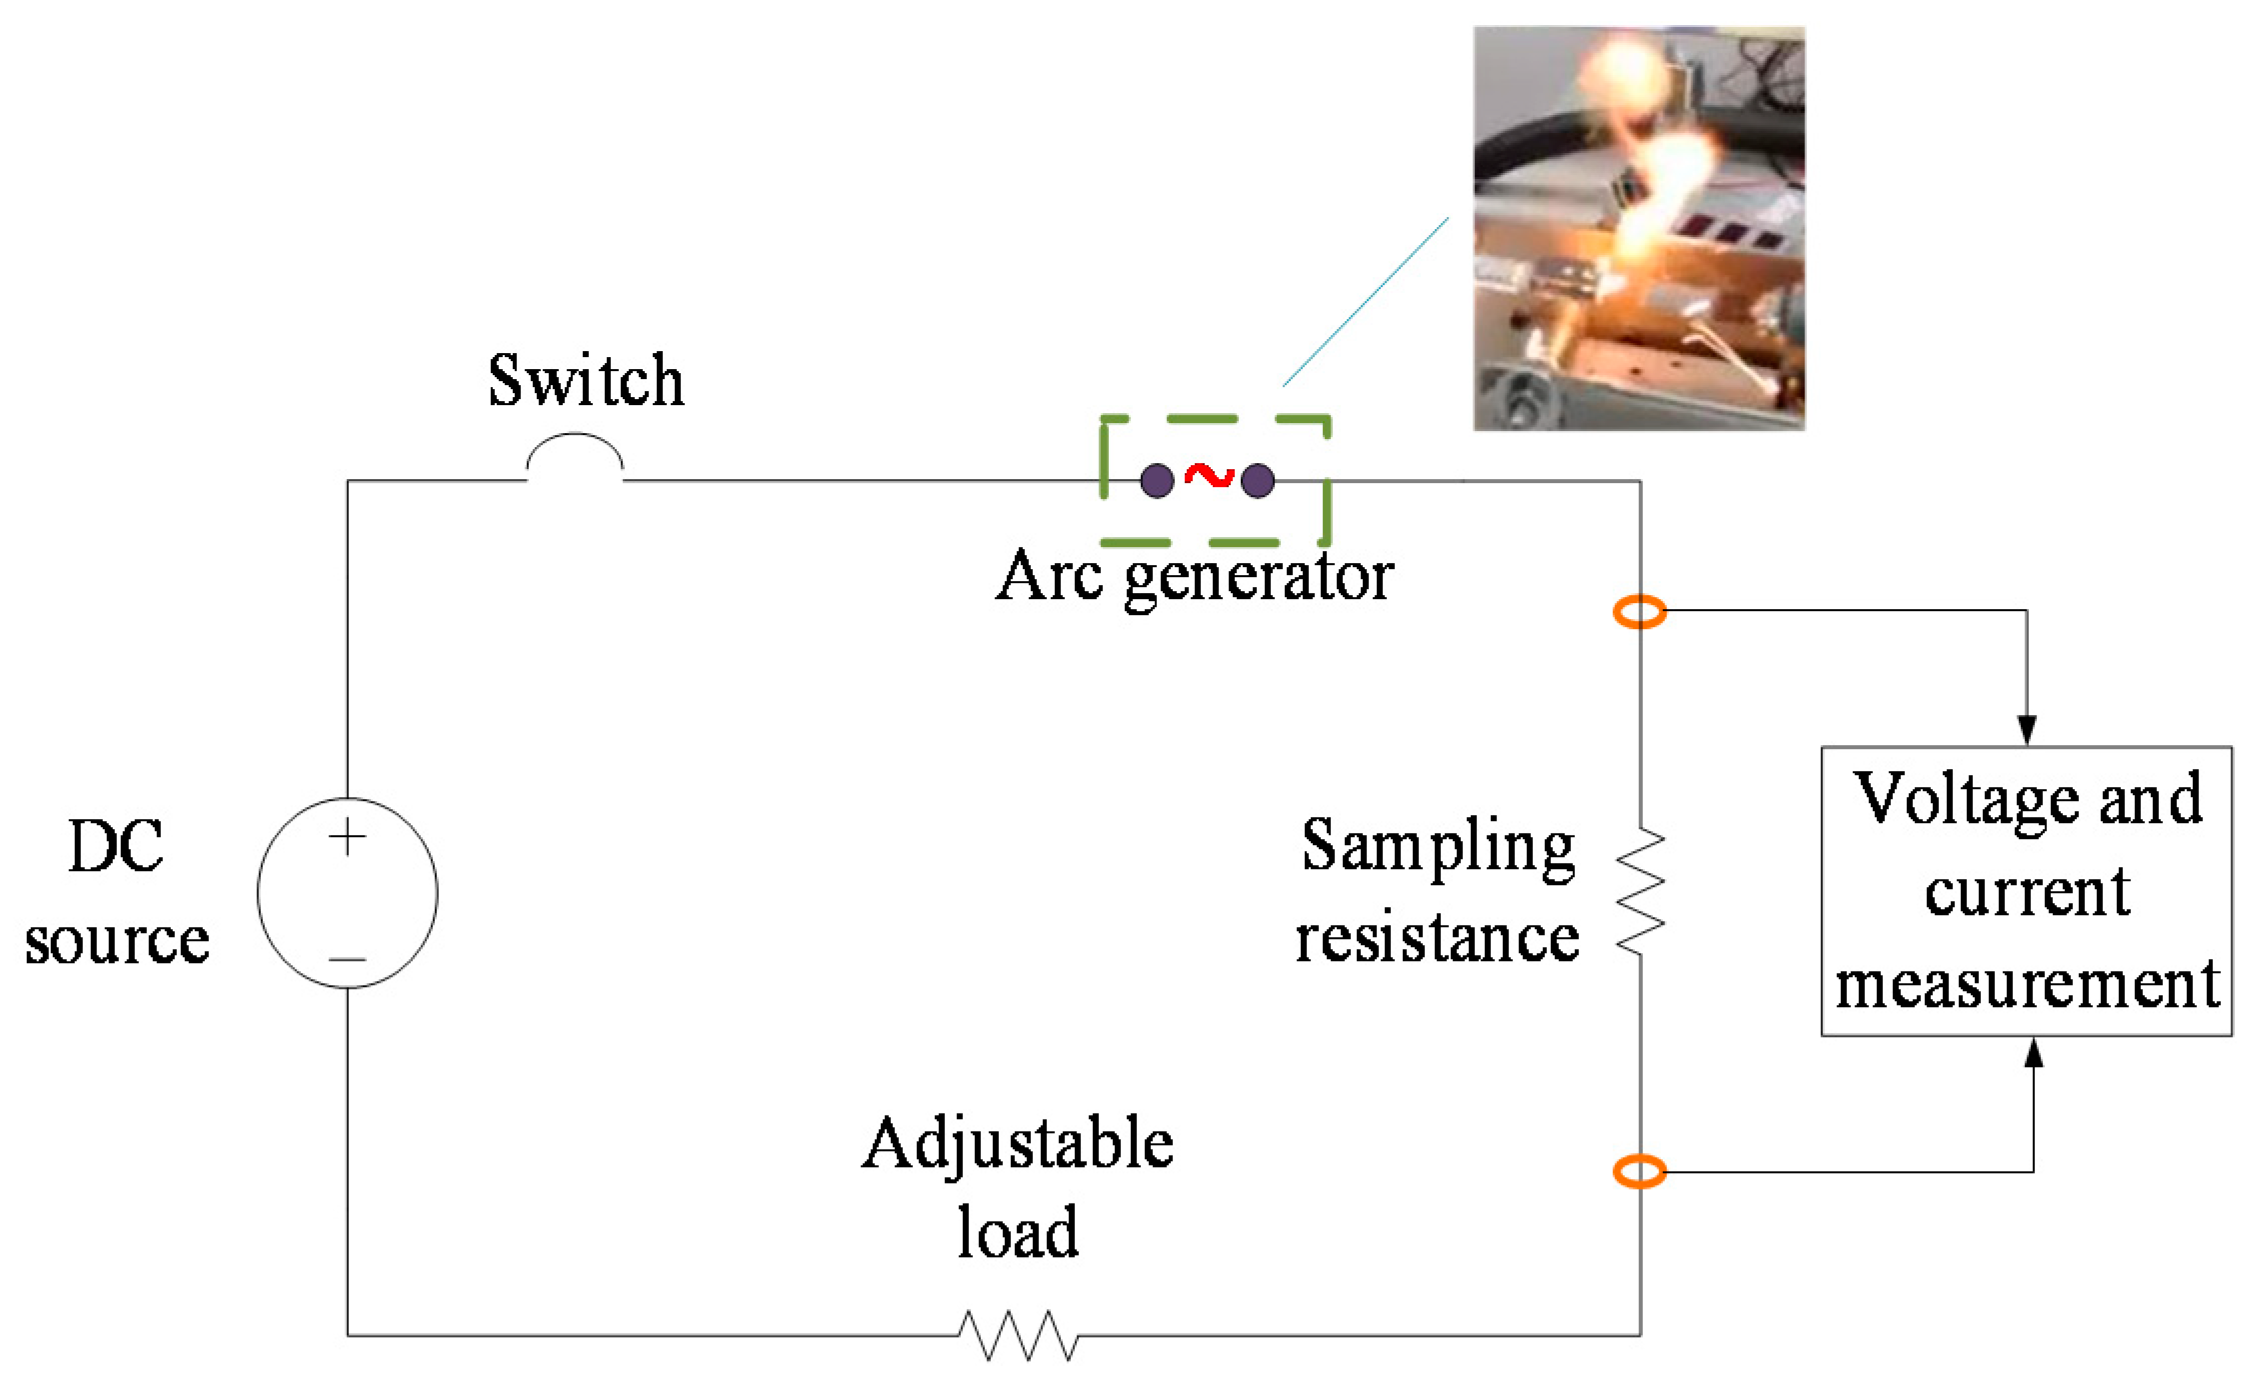
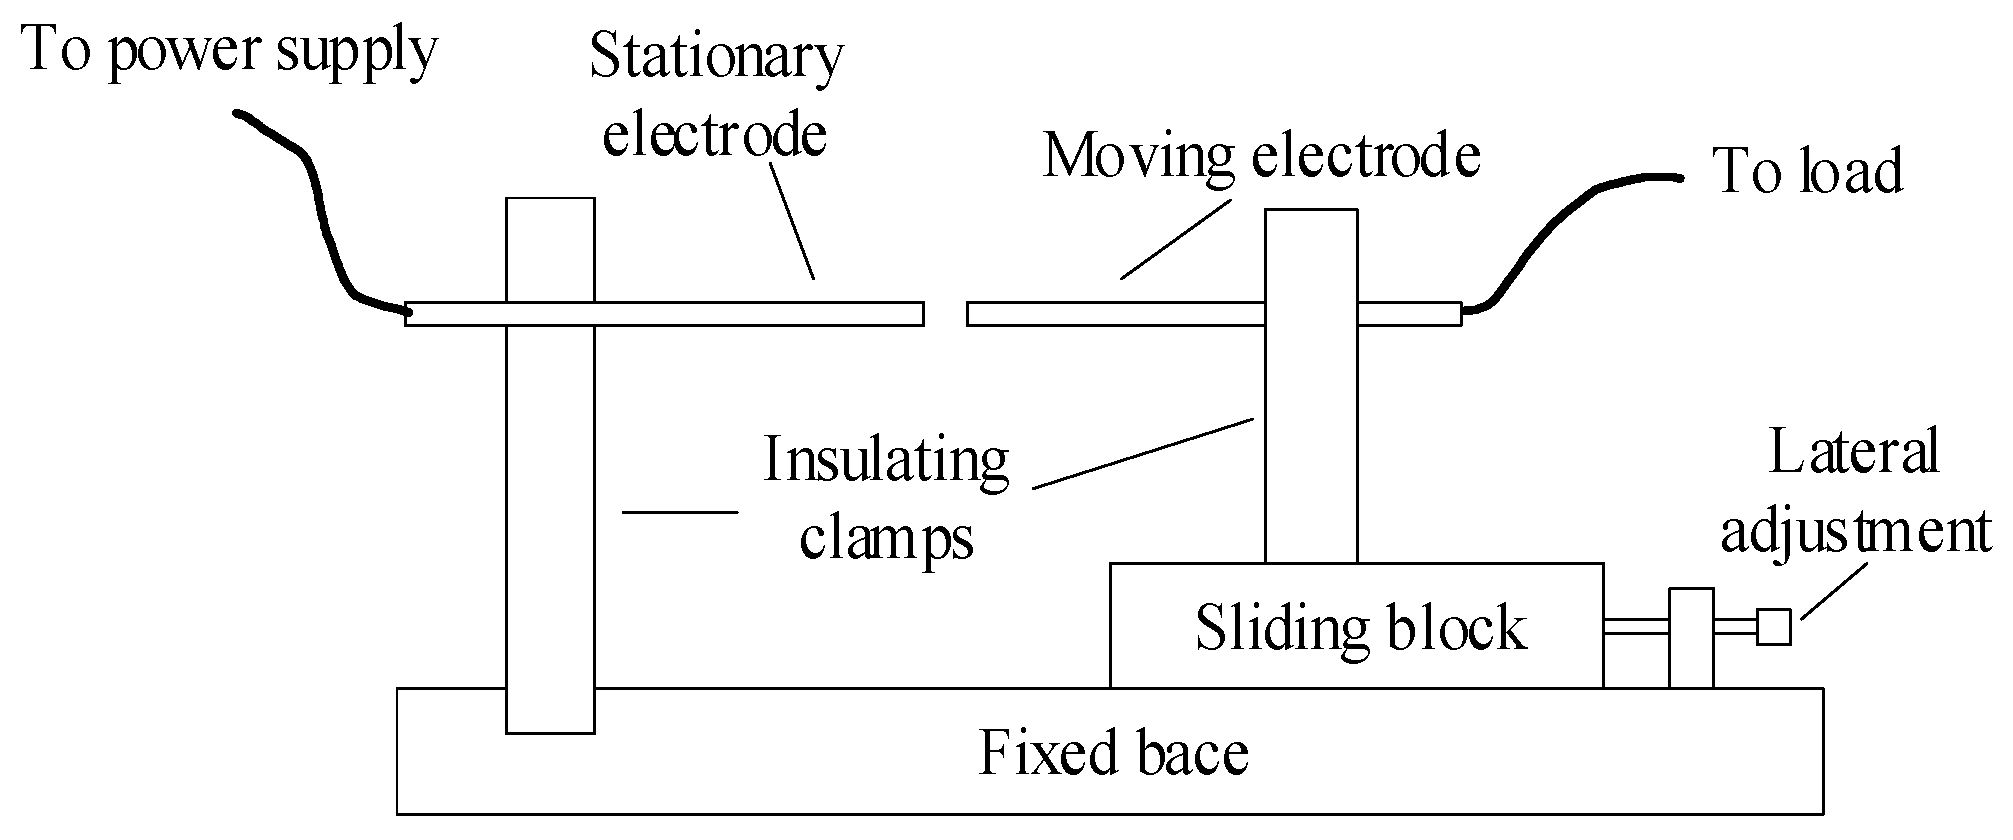
To simulate the DC series arc fault in the AEA, a DC series arc fault experiment platform was set up, as shown in Figure 7. The experimental platform consisted of a DC source, switch, voltage and current measurement circuit, adjustable load, and arc generators, which were established according to the UL1699B (Underwriters Laboratories Standard for Safety for Arc-Fault Circuit Interrupters) standard and is illustrated in Figure 8.
In the experiment, the stationary electrode and moving electrode were separated gradually so that the arc generator could produce a distinct arc, which was beneficial to analyze the features of the DC arc. The mechanism of simulating the arc in the laboratory and the actual arc in aircraft is similar, which is a process of discharge after the air breakdown [5]. The electrodes were polished before the experiment because the burning arc might lead to the electrodes dissolving. The normal current data and arc current data with different loads were collected by voltage and current measurement circuits, constituting the database.
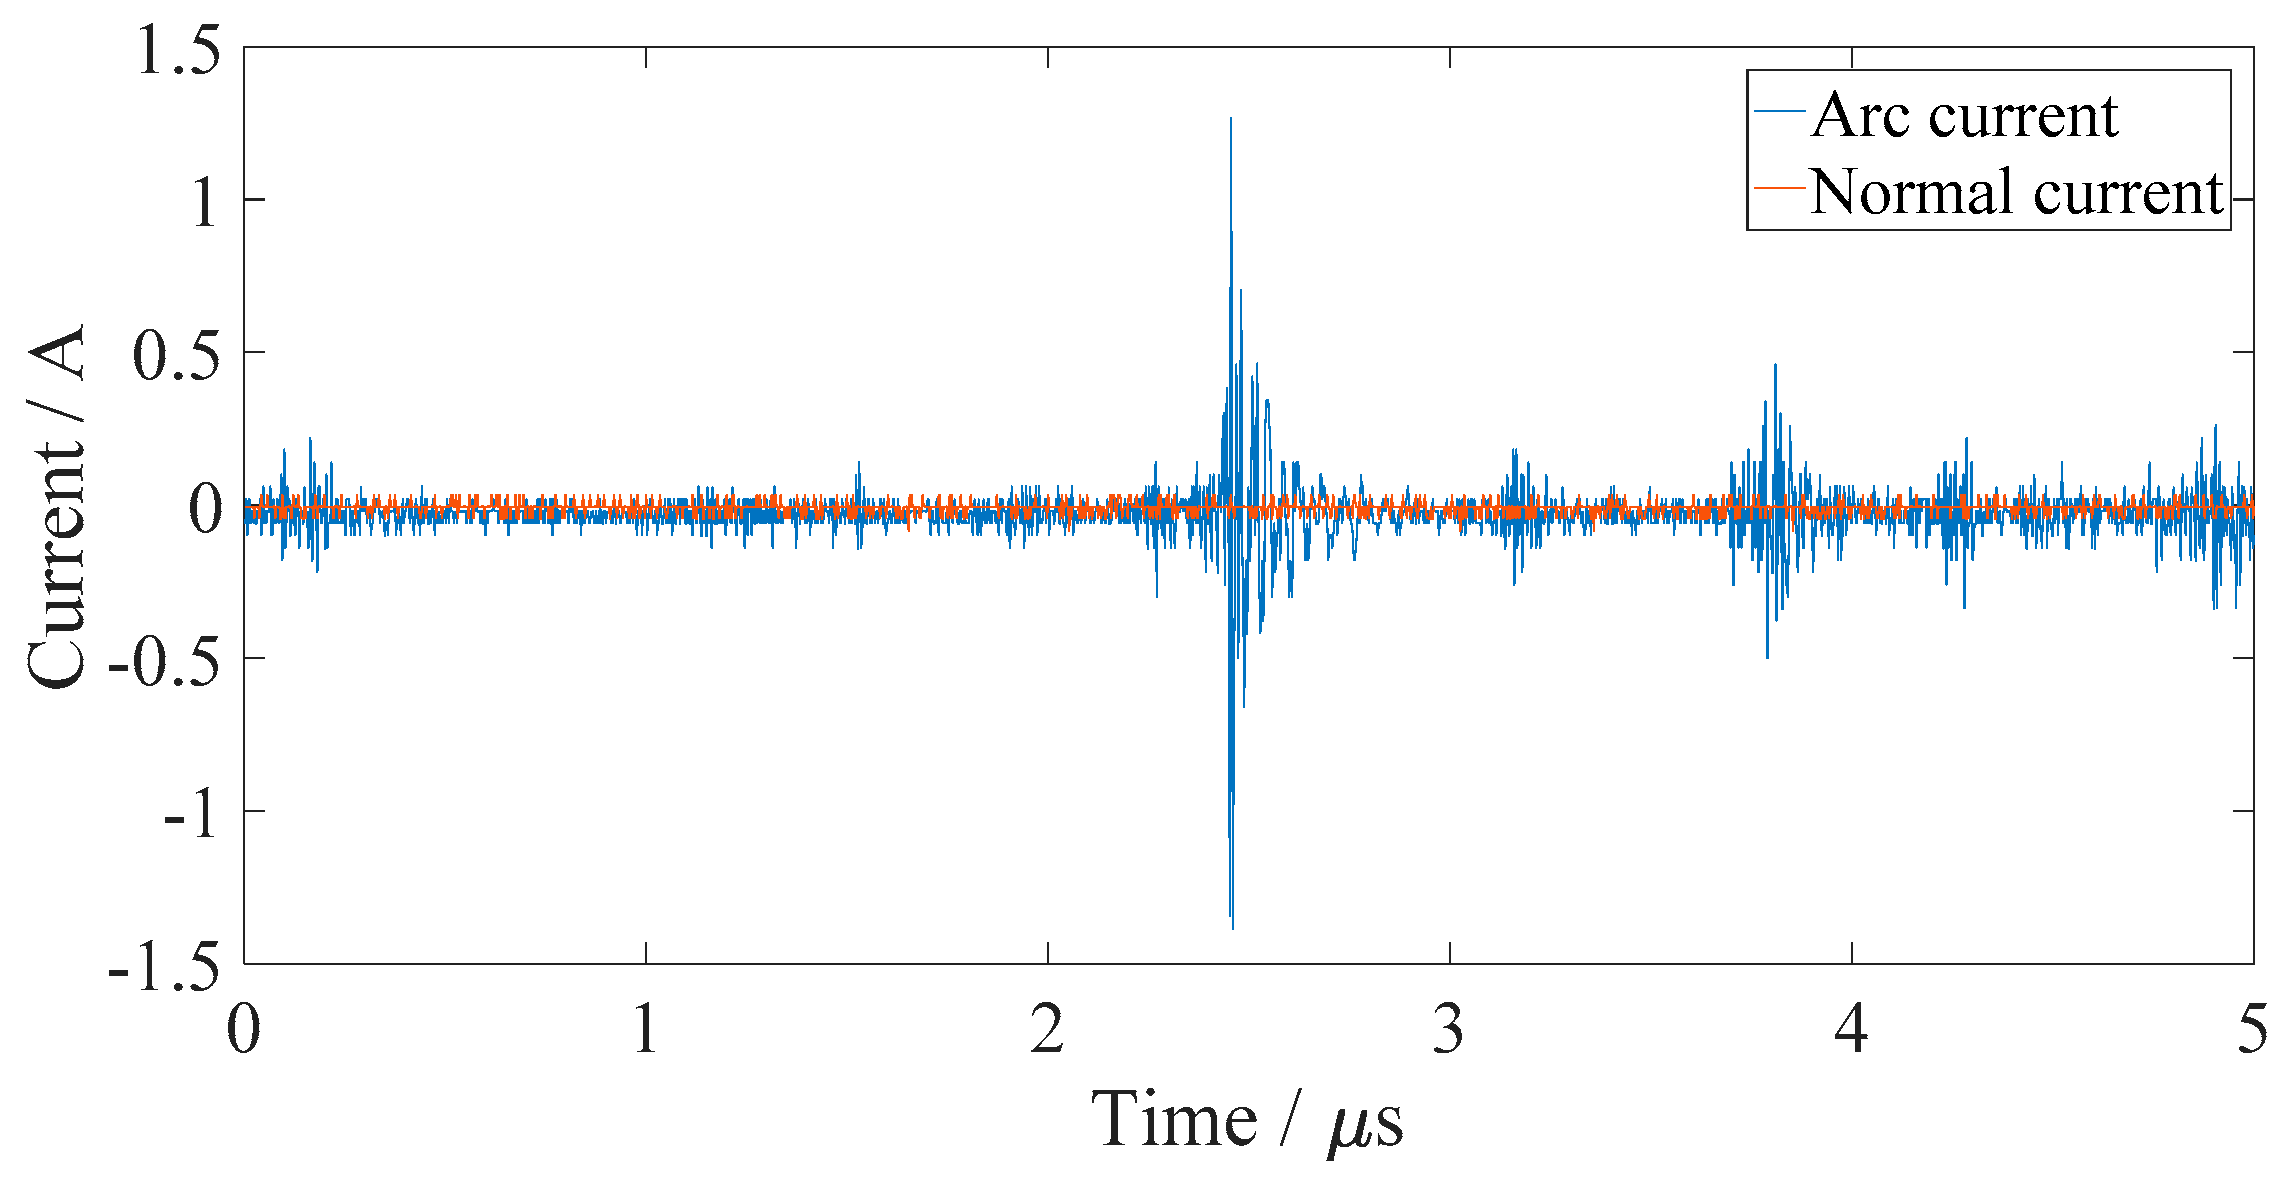
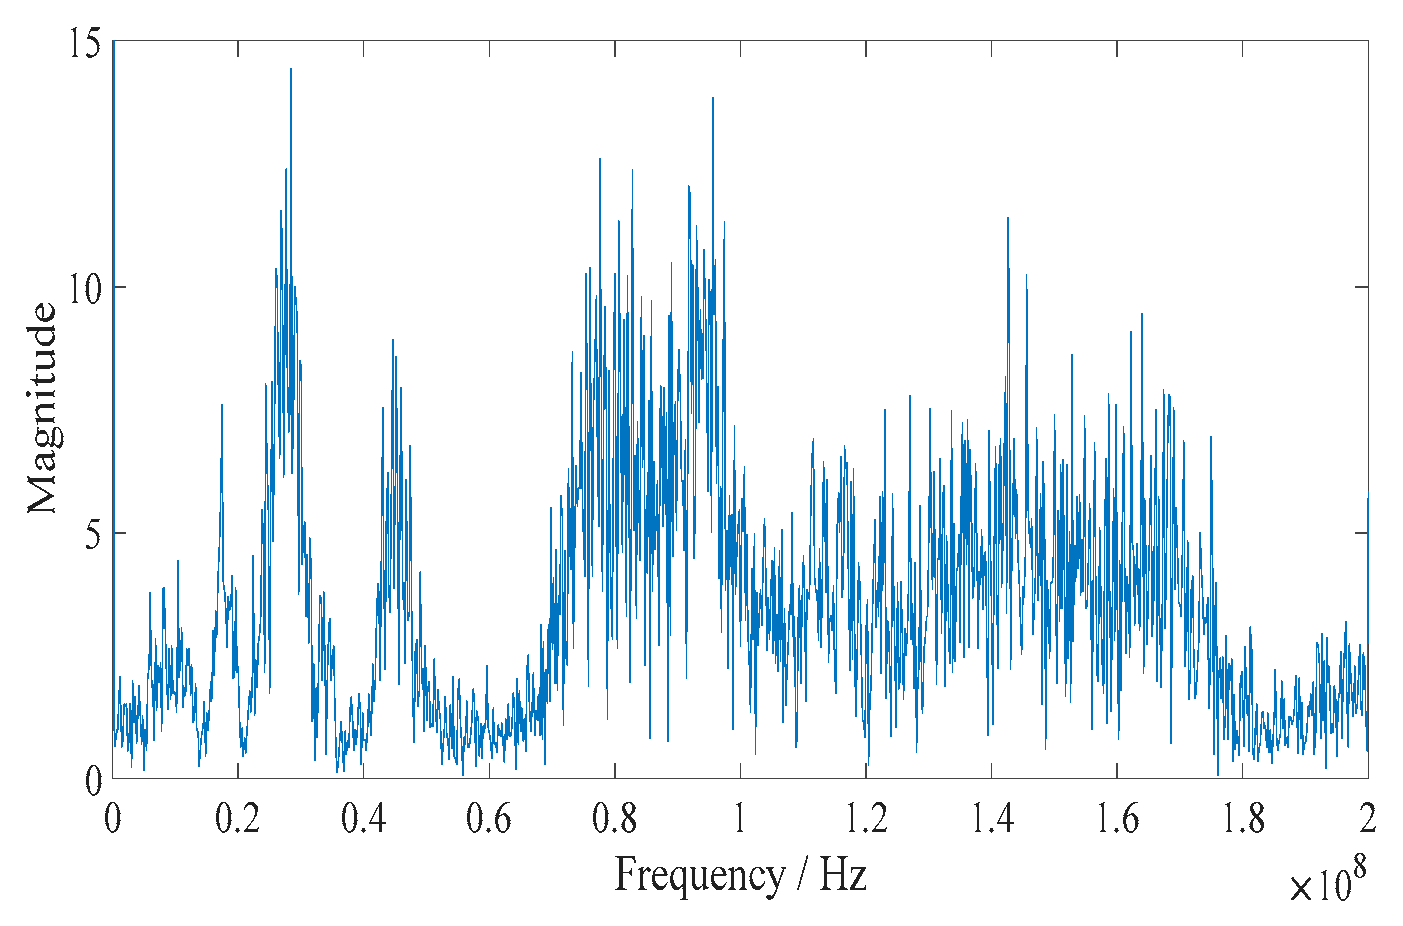
An oscilloscope with a high sampling rate of 400 MHz (2000 points in 5 μs) was used to record the experimental data. Waveforms of an arc current and a normal current are shown together in Figure 9. Figure 10 shows the Fourier frequency spectrum of the arc current.
Figure 9 illustrates the contrast between the arc current and normal current in the time domain. It can be seen that the normal current fluctuates near 0, which is far less than the arc current, and the time when the maximum magnitude of the arc current appears is not fixed due to the nonstationary form of the arc. From Figure 10, we can see the frequency of the arc current is broadband and random. As a result, it is not an excellent idea to choose the maximum, variance, and mean amplitude in the frequency domain by Fourier transform as the criteria to recognize the arc fault, due to the arc’s randomness.
4.2. Assessment of Detection Accuracy
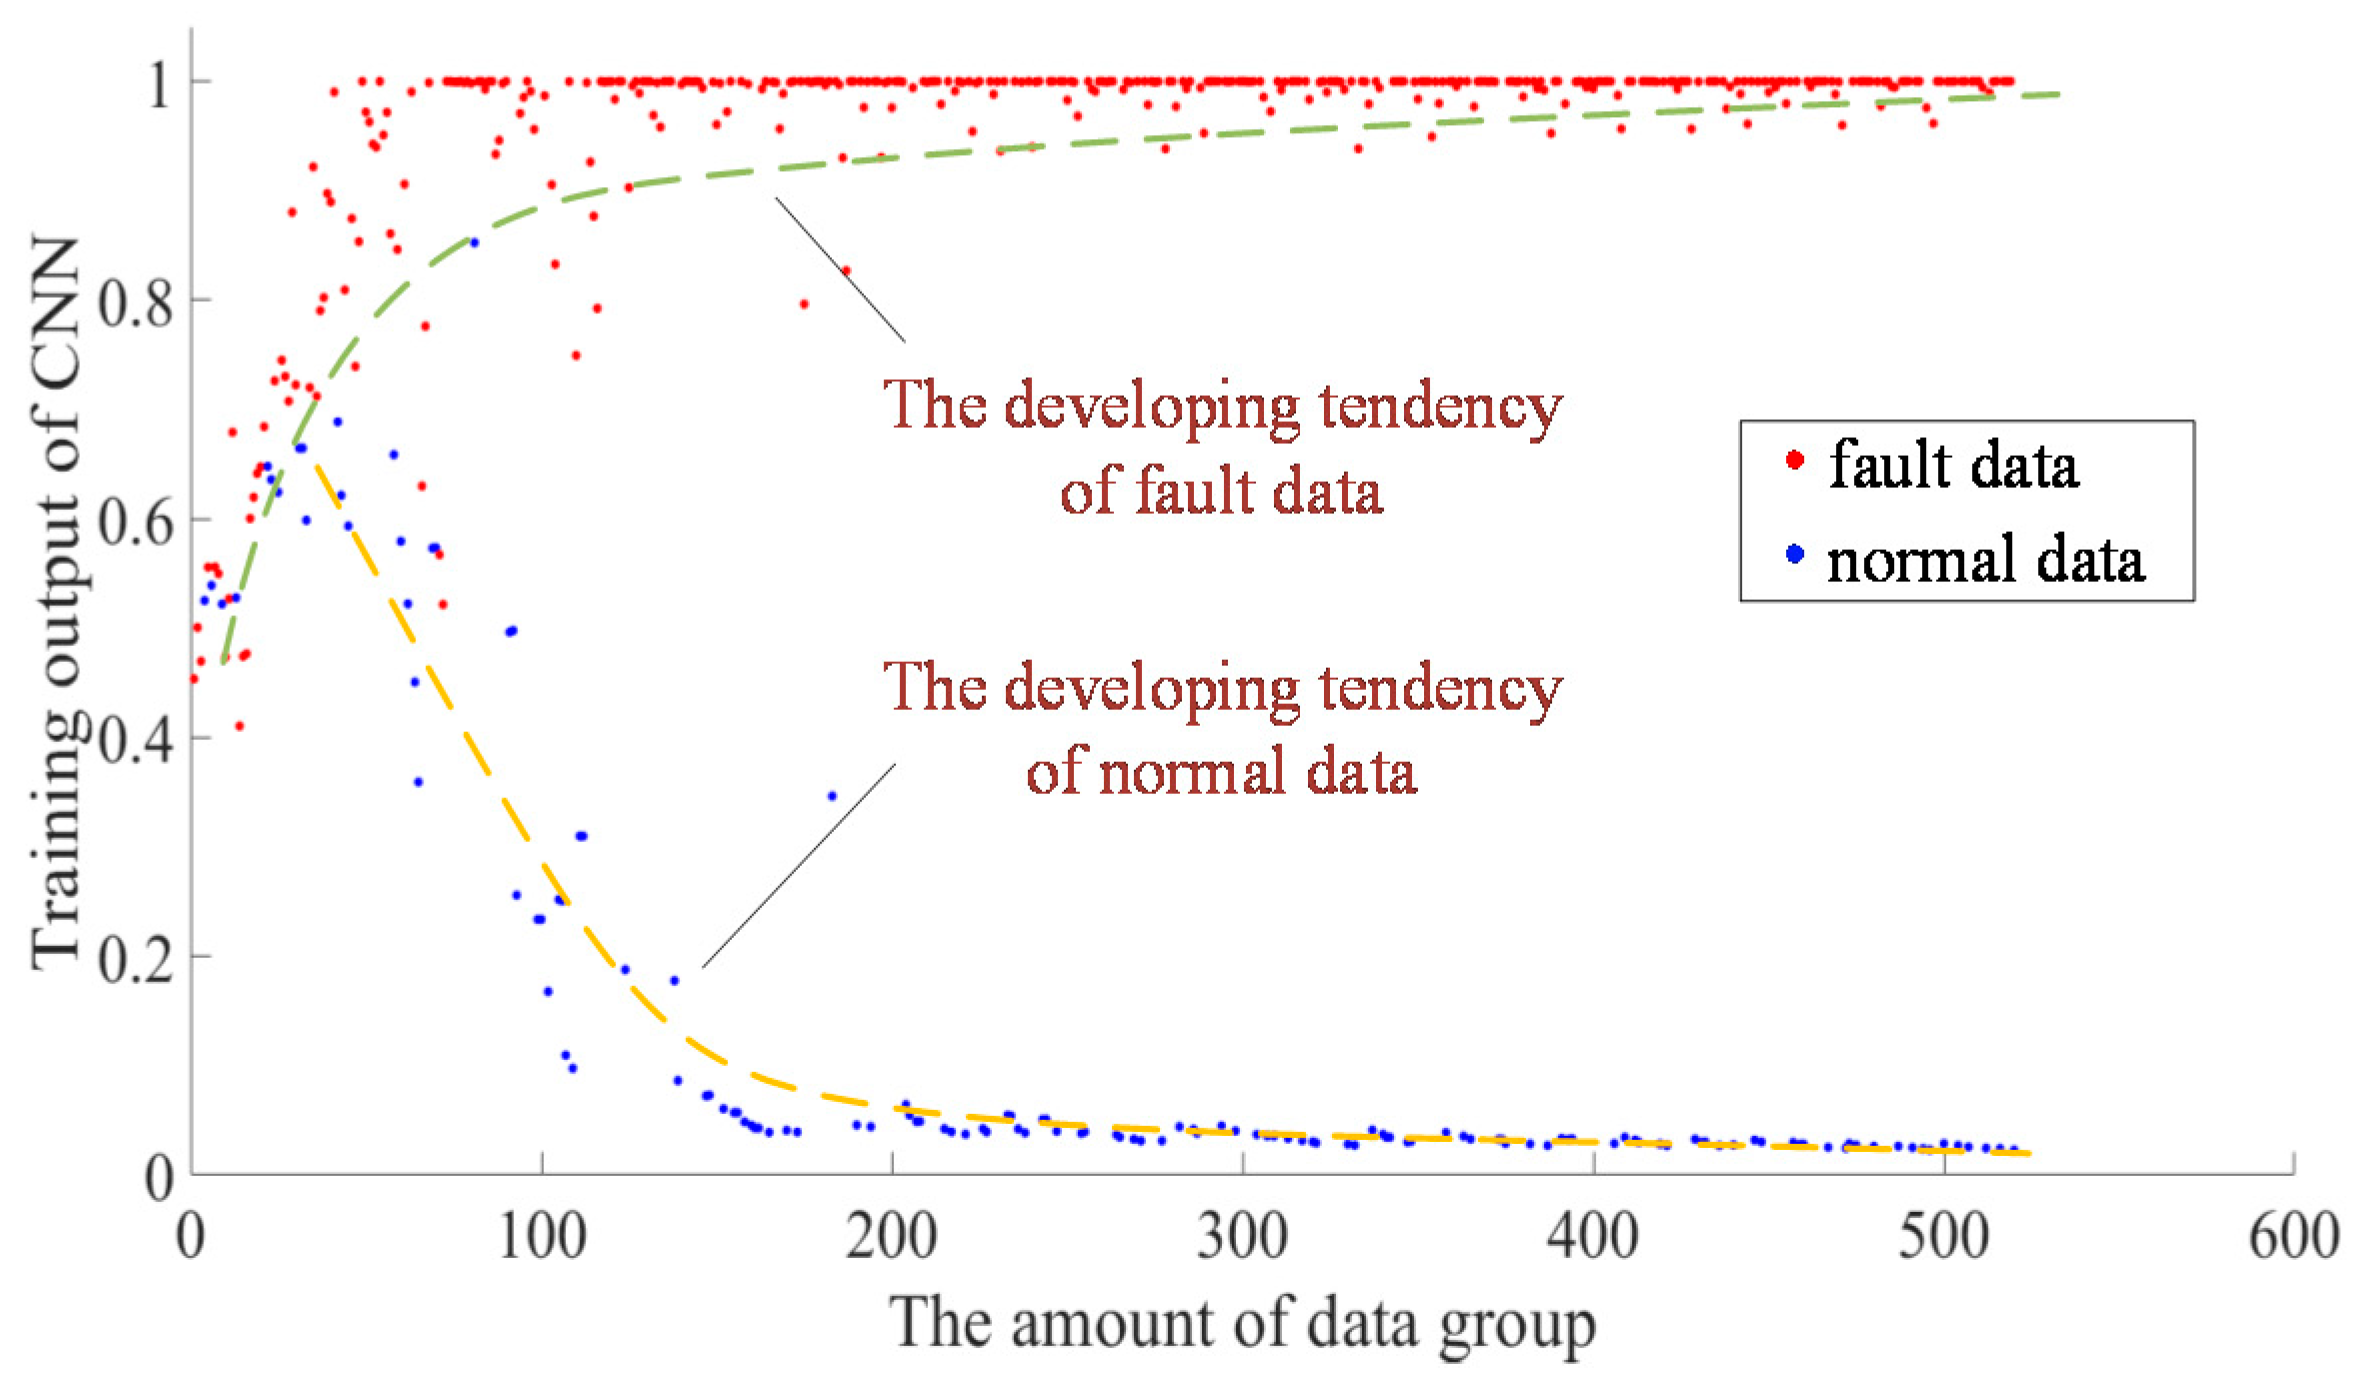
Each output is recorded when the data in the training database are inputted to the CNN, and a scatter diagram of the results was plotted, as shown in Figure 11.
As seen in Figure 11, almost all of the results gather around the value of 0.5 at the beginning. With the amount of training data increasing, the fault data and normal data were separated gradually from each other and the fault data got close to 1, while the normal data clustered together around 0. The green line and the yellow line show the developing tendency of the results, and that the accuracy ratio of the judgement will be improved as more training data are inputted into the CNN.
In order to separate the normal and fault data, the threshold of the result was set to 0.5. When the output result is greater than 0.5, the input data is considered fault data, and the others thus considered normal data. In this paper, the True Positive Rate (TPR) and False Positive Rate (FPR) were introduced to assess the accuracy of the method.
From Table 2, when the epoch = 1, the TPR has a low value of 29.63%, and the value of the FPR (92.21%) is also a little bit low for arc fault detection in aircraft. When the epoch = 6, the CNN is overfitting, so the case of an epoch ≥ 6 is not considered. When the epoch = 2, 3, 4, or 5, the TRP and FPR are both 100%. However, it can be seen from Figure 11 that the fault data were separated from the normal data when the network was trained the second round, i.e., signals from No. 105 to 208 were used; however, the scatter of the data is still relatively large, which means a large identification error. Considering that the amount of experimental data is limited, a certain margin should be reserved in a practical application. As a result, the value of the training time from 3 to 5 is more appropriate for the epoch.
4.3. Verification and Comparison of the TFA Plus CNN Method
Data in test database were used to judge the detection accuracy of the algorithm. As per the flow chart shown in Figure 6, the test data are input into the CNN that has been trained and the results are displayed in Table 3. The fault data and the normal data in the test database have been separated, evidently. The minimum of the fault data results is 0.9988, while the maximum of the normal data results is 0.1356. Some fault data results are 1, which is the ideal output, while the results of the normal data are close to 0. Thus, TFA + CNN is an effective method to detect the DC arc.
Not only can DWT produce a time–frequency spectrum, but Short-Time Fourier Transform (STFT) is another suitable method for TFA.
A comparison between STFT and DWT was performed, and the results are shown in Table 4 [40]. At the same level of sampling frequency, the DWT has a lower computational complexity and spends less time than the STFT in the DC arc detection field. From this angle, DWT is more appropriate for DC arc fault detection in an aircraft.
When the recognition accuracy of the DWT + CNN is configured, the method STFT + CNN was conducted with the same training database and test database, and the results are shown in Table 5.
From Table 5, the minimum value of the fault data is 0.9982 while the maximum value of the normal data is 0.2654; that is, the values of the fault data are close to 1 while those of the normal data are near 0. It can be concluded that STFT + CNN also can discriminate between the fault data and normal data. Nevertheless, the results of the STFT + CNN method fluctuate in a wider range than that of the DWT+CNN method. For example, the values under normal conditions are in the range of 0.2654 to 0.1249 for the STFT+CNN method, while the results of the DWT + CNN method vary from 0.1311 to 0.1356 in Table 3. It seems that the convergence of the DWT + CNN is much better than that of the STFT + CNN method.
Data in the training database and test database were refreshed by the data in the database, and two algorithms were detected many times. The results show that DWT + CNN is more reliable than STFT + CNN to detect DC arc faults. Therefore, DWT + CNN is more appropriate to monitor the DC arc occurring in the PDS of an AEA.
5. Conclusions and Prospects
This paper proposes a DC arc fault detection method for an SSPC in a PDS. The proposed method is based on current time–frequency analysis and CNN. The dataspace was composed of normal current data and arc current data. The experimental results illustrate the method proposed is effective to detect the DC arc fault and the accuracy is close to 100%; the detection time is also fast, close to 1 s. However, there is the need to train the CNN 3–5 times by using the training database.
The highlight of this paper is that a CNN was introduced into arc detection. A CNN could determine whether the DC arc fault occurs in the PDS by recognizing the time–frequency spectrum of the circuit current. Besides, DWT is a more appropriate way to produce a time–frequency spectrum than the STFT in the field of aircraft DC arc fault diagnosis.
It is recommended that further research be undertaken in the following areas: First, it is necessary to study the minimum sampling frequency that reflects the arc characteristics, since a high sampling rate was used in the experiment. It ensures that the cost of the sampling device is reduced as much as possible with the same accuracy. However, it is promising to transplant this method to a low sampling detection since the arc signal is broadband and a low-frequency band in the range of 10 to 100 Hz is still representative [40]. Secondly, the method proposed in this paper can be tried to identify the AC arc fault. It may detect all kinds of arc failures in the PDS simultaneously by using the proposed method here.
Author Contributions
Writing-review & editing, T.L.; Writing-original draft, Z.J.; Data curation, L.W.; Resources, Y.M. All authors have read and agreed to the published version of the manuscript.
Funding
This work is funded by the National Key Research and Development Program of China (No. 2018YFB1500800) and the Fault Location Program supported by Tangshan power supply company(No. E18L00560).
Acknowledgments
Thank Mu Longhua and his research group at Tongji University for providing the technical support in the experiments.
Conflicts of Interest
The authors declare no conflict of interest. The funders had no role in the design of the study; in the collection, analyses, or interpretation of data; in the writing of the manuscript, and in the decision to publish the results.
References
- Brusso, B.C. History of Aircraft Wiring Arc-Fault Protection [History]. IEEE Ind. Appl. Mag. 2017, 23, 6–11. [Google Scholar] [CrossRef]
- Li, X.; Pan, C.; Luo, D.; Sun, Y. Series DC Arc Simulation of Photovoltaic System Based on Habedank Model. Energies 2020, 13, 1416. [Google Scholar] [CrossRef] [Green Version]
- Yaramasu, A.; Cao, Y.; Liu, G.; Wu, B. Aircraft electric system intermittent arc fault detection and location. IEEE Trans. Aerosp. Electron. Syst. 2015, 51, 40–51. [Google Scholar] [CrossRef]
- He, C.; Mu, L.; Wang, Y. The Detection of Parallel Arc Fault in Photovoltaic Systems Based on a Mixed Criterion. IEEE J. Photovolt. 2017, 7, 1717–1724. [Google Scholar] [CrossRef]
- Uriarte, F.M.; Hotz, T.J.; Kwasinski, A.; Gattozzi, A.L.; Herbst, J.D.; Estes, H.B.; Hebner, R.E. A DC Arc Model for Series Faults in Low Voltage Microgrids. IEEE Trans. Smart Grid 2012, 3, 2063–2070. [Google Scholar] [CrossRef]
- Li, W.; He, K.; Liu, W.; Zhang, X.; Dong, Y. A fast arc fault detection method for AC solid state power controllers in MEA. Chin. J. Aeronaut. 2018, 31, 1119–1129. [Google Scholar] [CrossRef]
- Izquierdo, D.; Barrado, A.; Fernandez, C.; Sanz, M.; Lázaro, A. SSPC Active Control Strategy by Optimal Trajectory of the Current for Onboard System Applications. IEEE Trans. Ind. Electron. 2013, 60, 5195–5205. [Google Scholar] [CrossRef]
- Yu, B.; Wang, L.; Ahmed, D. Drain–Source Voltage Clamp Circuit for Online Accurate ON-State Resistance Measurement of SiC MOSFETs in DC Solid-State Power Controller. IEEE J. Emerg. Sel. Top. Power Electron. 2020, 8, 331–342. [Google Scholar] [CrossRef]
- Izquierdo, D.; Barrado, A.; Raga, C.; Sanz, M.; Zumel, P.; Lázaro, A. Protection devices for aircraft electrical power distribution systems: A survey. IEEE Trans. Aerosp. Electron. Syst. 2011, 47, 1538–1550. [Google Scholar] [CrossRef]
- Miao, W.; Liu, X.; Lam, K.H.; Pong, P.W.T. Arc-Faults Detection in PV Systems by Measuring Pink Noise With Magnetic Sensors. IEEE Trans. Magn. 2019, 55, 1–6. [Google Scholar] [CrossRef]
- Kay, J.A.; Hussain, G.A.; Lehtonen, M.; Kumpulainen, L. New pre-emptive arc fault detection techniques in medium voltage switchgear and motor controls. IEEE Trans. Ind. Appl. 2015, 52, 1–12. [Google Scholar]
- Naidu, M.; Schoepf, T.; Gopalakrishnan, S. Arc fault detection scheme for 42-V automotive DC networks using current shunt. IEEE Trans. Power Electron. 2006, 21, 633–639. [Google Scholar] [CrossRef]
- Yao, X.; Herrera, L.; Ji, S.; Zou, K.; Wang, J. Characteristic Study and Time-Domain Discrete- Wavelet-Transform Based Hybrid Detection of Series DC Arc Faults. IEEE Trans. Power Electron. 2014, 29, 3103–3115. [Google Scholar] [CrossRef]
- Orton, H.E. Method for Diagnosing Degradation in Aircraft Wiring. U.S. Patent 6,909,977, 21 June 2005. [Google Scholar]
- Zhao, C.; Li, K.; Zhang, Y.; Wang, Y. Arc fault detection based on electromagnetic radiation. Adv. Technol. Electr. Eng. Energy 2017, 36, 70–74. [Google Scholar]
- Yang, Y.; Peng, Z.; Zhang, W.-M.; Meng, G. Parameterised time-frequency analysis methods and their engineering applications: A review of recent advances. Mech. Syst. Signal Process. 2019, 119, 182–221. [Google Scholar] [CrossRef]
- Le, V.; Yao, X.; Miller, C.; Tsao, B.-H.; Hung, T.-B. Series DC Arc Fault Detection Based on Ensemble Machine Learning. IEEE Trans. Power Electron. 2020, 35, 7826–7839. [Google Scholar] [CrossRef]
- Chen, S.; Xiong, J.; Li, X. Series Arc Fault Identification for Photovoltaic System Based on Time-Domain and Time-Frequency-Domain Analysis. IEEE J. Photovolt. 2017, 7, 1105–1114. [Google Scholar] [CrossRef]
- Artale, G.; Cataliotti, A.; Cosentino, V.; Di Cara, D.; Nuccio, S.; Tine, G. Arc Fault Detection Method Based on CZT Low-Frequency Harmonic Current Analysis. IEEE Trans. Instrum. Meas. 2017, 66, 888–896. [Google Scholar] [CrossRef]
- Mu, L.; Wang, Y.; Jiang, W.; Zhang, F. Study on characteristics and detection method of DC arc fault for photovoltaic system. Proc. CSEE 2016, 36, 5236–5244. [Google Scholar]
- Ahmadi, M.; Samet, H.; Ghanbari, T. Series Arc Fault Detection in Photovoltaic Systems Based on Signal-to-Noise Ratio Characteristics Using Cross-Correlation Function. IEEE Trans. Ind. Inform. 2019, 16, 3198–3209. [Google Scholar] [CrossRef]
- Georgijevic, N.; Jankovic, M.; Srdic, S.; Radakovic, Z. The Detection of Series Arc Fault in Photovoltaic Systems Based on the Arc Current Entropy. IEEE Trans. Power Electron. 2016, 31, 5917–5930. [Google Scholar] [CrossRef]
- Jovanovic, S.; Chahid, A.; Lezama, J.; Schweitzer, P. Shunt active power filter-based approach for arc fault detection. Electr. Power Syst. Res. 2016, 141, 11–21. [Google Scholar] [CrossRef]
- Ahmadi, M.; Samet, H.; Ghanbari, T. A new method for detecting series arc fault in photovoltaic systems based on the blind source separation. IEEE Trans. Ind. Electron. 2019, 67, 5041–5049. [Google Scholar] [CrossRef]
- Islam, A.; Birtwhistle, D.; Saha, T.K.; Islam, M.S. Interruption of Low-Voltage DC Arc in Air under Axial Magnetic Field. IEEE Trans. Power Deliv. 2020, 35, 977–986. [Google Scholar] [CrossRef]
- Zhang, X.; Liu, Z.; Wang, J.; Wang, J. Time–frequency analysis for bearing fault diagnosis using multiple Q-factor Gabor wavelets. ISA Trans. 2018, 87, 225–234. [Google Scholar] [CrossRef]
- Jiao, Z.; Li, T.; Wang, L.; Mu, L.; Khalyasmaa, A. DC series arc-fault detection of photovoltaic system based on convolutional neural network. Adv. Technol. Electr. Eng. Energy 2019, 38, 29–34. [Google Scholar]
- Qi, P.; Jovanovic, S.; Lezama, J.; Schweitzer, P. Discrete wavelet transform optimal parameters estimation for arc fault detection in low-voltage residential power networks. Electr. Power Syst. Res. 2017, 143, 130–139. [Google Scholar] [CrossRef]
- Xia, K.; He, S.; Tan, Y.; Jiang, Q.; Xu, J.; Yu, W. Wavelet packet and support vector machine analysis of series DC ARC fault detection in photovoltaic system. IEEJ Trans. Electr. Electron. Eng. 2019, 14, 192–200. [Google Scholar] [CrossRef]
- Telford, R.D.; Galloway, S.; Stephen, B.; Elders, I. Diagnosis of Series DC Arc Faults—A Machine Learning Approach. IEEE Trans. Ind. Inform. 2017, 13, 1598–1609. [Google Scholar] [CrossRef] [Green Version]
- Siegel, J.E.; Pratt, S.; Sun, Y.; Sarma, S.E. Real-time Deep Neural Networks for internet-enabled arc-fault detection. Eng. Appl. Artif. Intell. 2018, 74, 35–42. [Google Scholar] [CrossRef] [Green Version]
- Li, H.; Huang, J.; Ji, S. Bearing Fault Diagnosis with a Feature Fusion Method Based on an Ensemble Convolutional Neural Network and Deep Neural Network. Sensors 2019, 19, 2034. [Google Scholar] [CrossRef] [PubMed] [Green Version]
- Lu, S.; Sirojan, T.; Phung, B.T.; Zhang, D.; Ambikairajah, E. DA-DCGAN: An Effective Methodology for DC Series Arc Fault Diagnosis in Photovoltaic Systems. IEEE Access 2019, 7, 45831–45840. [Google Scholar] [CrossRef]
- Bong, K.; Choi, S.; Kim, C.; Yoo, H.-J. Low-Power Convolutional Neural Network Processor for a Face-Recognition System. IEEE Micro 2017, 37, 30–38. [Google Scholar] [CrossRef]
- Dolz, J.; Ayed, I.B.; Yuan, J.; Gopinath, K.; Lombaert, H.; Desrosiers, C. HyperDense-Net: A hyper-densely connected CNN for multi-modal image semantic segmentation. IEEE Trans. Med. Imaging 2018, 38, 1116–1126. [Google Scholar] [CrossRef] [Green Version]
- Zhang, C.; Yue, X.; Wang, R.; Li, N.; Ding, Y. Study on Traffic Sign Recognition by Optimized Lenet-5 Algorithm. Int. J. Pattern Recognit. Artif. Intell. 2020, 34, 158–165. [Google Scholar] [CrossRef]
- Krizhevsky, A.; Sutskever, I.; Hinton, G.E. ImageNet classification with deep convolutional neural networks. Proc. Adv. Neural Inf. Process. Syst. 2012, 1, 1097–1105. [Google Scholar] [CrossRef]
- Luo, J.-H.; Zhang, H.; Zhou, H.-Y.; Xie, C.-W.; Wu, J.; Lin, W. ThiNet: Pruning CNN Filters for a Thinner Net. IEEE Trans. Pattern Anal. Mach. Intell. 2018, 41, 2525–2538. [Google Scholar] [CrossRef]
- Lu, S.; Phung, B.; Zhang, D. A comprehensive review on DC arc faults and their diagnosis methods in photovoltaic systems. Renew. Sustain. Energy Rev. 2018, 89, 88–98. [Google Scholar] [CrossRef]
- Johnson, J.; Pahl, B.; Luebke, C.; Pier, T.; Miller, T.; Strauch, J.; Kuszmaul, S.; Bower, W. Photovoltaic DC arc fault detector testing at Sandia National Laboratories. In Proceedings of the 2011 37th IEEE Photovoltaic Specialists Conference, Seattle, WA, USA, 19–24 June 2011; pp. 3614–3619. [Google Scholar]
Figure 1.
A Solid-State Power Controller (SSPC)-based aircraft power distribution system (PDS).

Figure 2.
The structure of the SSPC.

Figure 3.
Time–frequency spectrum of the arc current based on the db10 and db4 wavelet: (a) time–frequency spectrum of the arc current based on db10; (b) time-frequency spectrum of the arc current based on db4; (c) two-dimensional spectrum of the arc current based on db4.
Figure 3.
Time–frequency spectrum of the arc current based on the db10 and db4 wavelet: (a) time–frequency spectrum of the arc current based on db10; (b) time-frequency spectrum of the arc current based on db4; (c) two-dimensional spectrum of the arc current based on db4.

Figure 4.
Time–frequency spectrum of the normal current based on db4.

Figure 5.
The structure of the CNN.

Figure 6.
The flow chart of the algorithm.

Figure 7.
Schematic diagram of the DC series arc fault experimental platform.

Figure 8.
The structure diagram of the arc generator.

Figure 9.
Current waveform in normal and arc fault conditions.

Figure 10.
Fourier frequency spectrum of the arc current.

Figure 11.
Training results of the CNN.


Table 1.
CNN parameters.
| Parameters | Value |
|---|---|
| The size of input vector | 256 × 2000 |
| The number of input channels | 1 |
| The number of feature maps | 2 |
| Filter size | 63 × 35, 18 × 18 |
| Pooling size | 2 × 20, 2 × 2, 2 × 2 |
| Activation function | Sigmoid |
Table 2.
CNN assessment results.
| Epoch | TP | TN | FP | FN | TP + TN | FP + FN | TPR | FPR |
|---|---|---|---|---|---|---|---|---|
| 1 | 8 | 19 | 71 | 6 | 27 | 77 | 29.63% | 92.21% |
| 2 | 27 | 0 | 77 | 0 | 100% | 100% | ||
| 3 | 27 | 0 | 77 | 0 | 100% | 100% | ||
| 4 | 27 | 0 | 77 | 0 | 100% | 100% | ||
| 5 | 27 | 0 | 77 | 0 | 100% | 100% | ||
| 6 | Overfitting | |||||||
Table 3.
Test results of the two measures.
| Signal Number | Ideal Results | Results of DWT + CNN |
|---|---|---|
| 1 | 1 | 1 |
| 2 | 1 | 1 |
| 3 | 1 | 0.9988 |
| 4 | 1 | 1 |
| 5 | 1 | 1 |
| 6 | 0 | 0.1311 |
| 7 | 0 | 0.1322 |
| 8 | 0 | 0.1315 |
| 9 | 0 | 0.1347 |
| 10 | 0 | 0.1356 |
Table 4.
Comparison between Short-Time Fourier Transform (STFT) and Discrete Wavelet Transform (DWT).
Table 4.
Comparison between Short-Time Fourier Transform (STFT) and Discrete Wavelet Transform (DWT).
| Feature | STFT | DWT |
|---|---|---|
| Sampling frequency | Medium/High | Medium/High |
| Computational complexity/effort | Low/Medium | Medium/High |
| Detection time | 0.5 s | Less than 0.2 s |
Table 5.
Test results of the two measures.
| Signal Number | Ideal Results | Results of STFT + CNN |
|---|---|---|
| 1 | 1 | 1 |
| 2 | 1 | 1 |
| 3 | 1 | 0.9982 |
| 4 | 1 | 0.9997 |
| 5 | 1 | 1 |
| 6 | 0 | 0.1270 |
| 7 | 0 | 0.2654 |
| 8 | 0 | 0.1873 |
| 9 | 0 | 0.1249 |
| 10 | 0 | 0.1588 |
© 2020 by the authors. Licensee MDPI, Basel, Switzerland. This article is an open access article distributed under the terms and conditions of the Creative Commons Attribution (CC BY) license (http://creativecommons.org/licenses/by/4.0/).
Share and Cite
MDPI and ACS Style
Li, T.; Jiao, Z.; Wang, L.; Mu, Y. A Method of DC Arc Detection in All-Electric Aircraft. Energies 2020, 13, 4190. https://0-doi-org.brum.beds.ac.uk/10.3390/en13164190
AMA Style
Li T, Jiao Z, Wang L, Mu Y. A Method of DC Arc Detection in All-Electric Aircraft. Energies. 2020; 13(16):4190. https://0-doi-org.brum.beds.ac.uk/10.3390/en13164190
Chicago/Turabian StyleLi, Teng, Zhijie Jiao, Lina Wang, and Yong Mu. 2020. "A Method of DC Arc Detection in All-Electric Aircraft" Energies 13, no. 16: 4190. https://0-doi-org.brum.beds.ac.uk/10.3390/en13164190
Note that from the first issue of 2016, this journal uses article numbers instead of page numbers. See further details here.