Article

Detection Limit of CO Concentration Measurement in LPG/Air Flame Flue Gas Using Tunable Diode Laser Absorption Spectroscopy

1
Clean Energy System R&D Department, Korea Institute of Industrial Technology, Cheonan 31056, Korea
2
Mechanical Engineering Department, Yonsei University, Seoul 03722, Korea
3
Mechanical Engineering Department, Sungkyunkwan University, Suwon 2066, Korea
4
Physics Department, Chungbuk National University, Cheongju 1, Korea
*
Authors to whom correspondence should be addressed.
Submission received: 20 July 2020 / Revised: 9 August 2020 / Accepted: 13 August 2020 / Published: 16 August 2020
(This article belongs to the Section B: Energy and Environment)

Abstract

:
In a combustion reaction of hydrocarbon fuel, carbon monoxide (CO) is a gas species that is closely related to air pollution generation and combustion efficiency. It has a trade-off with nitrogen oxide and increases rapidly in case of incomplete combustion or in fuel-rich (Φ > 1) environments. Therefore, it is essential to measure CO concentration in order to optimize the combustion condition. In the case of a steel annealing system, the combustion environment is maintained in a deoxidation atmosphere to prevent the formation of an oxide layer on the steel sheet surface. However, it is difficult to measure the CO concentration in a combustion furnace in real-time because of the harsh environment in the furnace. Tunable diode laser absorption spectroscopy, which has the advantages of non-invasiveness, fast response, and in situ measurement-based optical measurement, is highly attractive for measuring the concentration of a certain gas species in a combustion environment. In this study, a combustion system of a partially premixed flamed burner was designed to control the equivalence ratio for fuel-rich conditions. CO concentration was measured using a distributed feedback laser with a wavenumber of 4300.7 cm−1 in the mid-infrared region. The results showed that the CO concentration measured at an equivalence ratio of 1.15 to 1.50 was 0.495% to 6.139%. The detection limit in the combustion environment was analyzed at a path length of 190 cm and an internal temperature of 733 K. The ranges of the peak absorbance were derived as 0.064 and 0.787, which were within the theoretical bounds of 10−3 and 0.80 when the equivalence ratio was varied from 1.15 to 1.50.

1. Introduction

Recently, pollutants generated during the combustion of hydrocarbon-based fuels have caused serious problems related to air pollution, and hence, the regulations on emissions have been strengthened. Meanwhile, the development of high-efficiency combustion technology has been promoted to reduce fuel consumption. Nitrogen oxides (NOX) and sulfur oxides (SOX) formed during the combustion process are considered as fine dust precursors. Therefore, the development of a clean combustion technology that suppresses the generation of air pollutants, such as fine dust precursors in the combustion process, and that of high-efficiency combustion technology for improving the combustion efficiency, are being actively promoted.
Carbon monoxide (CO) produced during the combustion of hydrocarbon fuels is a colorless and odorless toxic gas, whose concentration increases in case of incomplete combustion. Moreover, it is a factor that directly affects the combustion efficiency. CO has a trade-off with NOX: it decreases during complete combustion, while NOX increases with the flame temperature [1,2]. Therefore, in order to optimize the combustion condition of a large combustion system, such as a power plant boiler and steel annealing, it is essential to measure the CO concentration in real-time. A combustion environment that requires measurement of CO concentration is a steel annealing system. In the case of the non-oxidation furnace (NOF) zone in a steel annealing system, the combustion environment is maintained in a deoxidation atmosphere to prevent the formation of oxide layers on the steel sheet surface. For this reason, it maintains a fuel-rich condition, generating considerable CO. In these processes, to increase the system efficiency, to comply with atmospheric regulations, and to maintain production quality, combustion control through continuous monitoring based on CO concentration measurement in real-time is required for technological applications.
Most of the devices for measuring CO concentration are contact-type, such as an electrochemical sensor; these devices are sampling methods that are insufficient for analyzing the overall internal circumstance in large-scale combustion systems. Moreover, an electrochemical method usually measures a high CO concentration with a higher dilution factor, but the dilution rate causes a large error. These methods have a long response time due to the sampling and analyzing process, and they need frequent replacement due to the persistence limitation of sensor sensitivity in harsh environments. Consequently, the existing methods have a limitation in measuring the CO concentration in a combustion environment in real-time.
Thus, optical technologies with a non-contact measurement method have been considered to measure CO concentration in a combustion environment. Among the typical optical measurement methods, tunable diode laser absorption spectroscopy (TDLAS), which exhibits high selectivity, durability, and fast response characteristics through a narrow linewidth, is mainly used in combustion environments [3,4,5,6,7,8,9].
Various CO concentration measurement methods can be found in the literature. From 1990 to the beginning of 2019, CO concentration has been measured within the near-infrared wavelength range of 6410 cm−1 to understand the phenomenon of the combustion reaction in coal-fired power plants [5]. On the other hand, the mid-infrared wavelength range has been used to measure CO concentration under various combustion environment conditions: it has been measured in a mid-infrared wavelength region of 4300 cm−1 [10,11] and another region of 2173 cm−1 [12]. After analyzing previous studies in detail, Chao et al. [10] measured the CO concentration of a premixed ethylene/air flame using a distributed feedback (DFB) laser in the mid-infrared wavelength region, but the measurement was limited to fuel-lean conditions. Mihalcea et al. [8] measured CO, CO2, and CH4 concentrations of a premixed methane/air flame by using a DFB laser in the near-infrared wavelength region, but increased the optical distance to ensure sufficient resolution. In addition, Spearrin et al. [12] measured CO and CO2 concentrations and temperature in a scramjet combustion chamber using quantum cascade (QC)-TDLAS in the mid-infrared wavelength region. Summarizing the previous studies, CO concentration has been measured at 6410 cm−1 in the near-infrared and 4300 cm−1 and 2173 cm−1 in the mid-infrared regions. In the mid-infrared wavelength of 2173 cm−1 region, the QC-TDLAS system has been used with a high resolution; however, it is large and suited better for a laboratory environment rather than field measurement environments because of the cooling problem of the laser. Meanwhile, a low resolution has been confirmed for the blended or interference absorption of H2O in the near-infrared 6410 cm−1 region. The mid-infrared 4300 cm
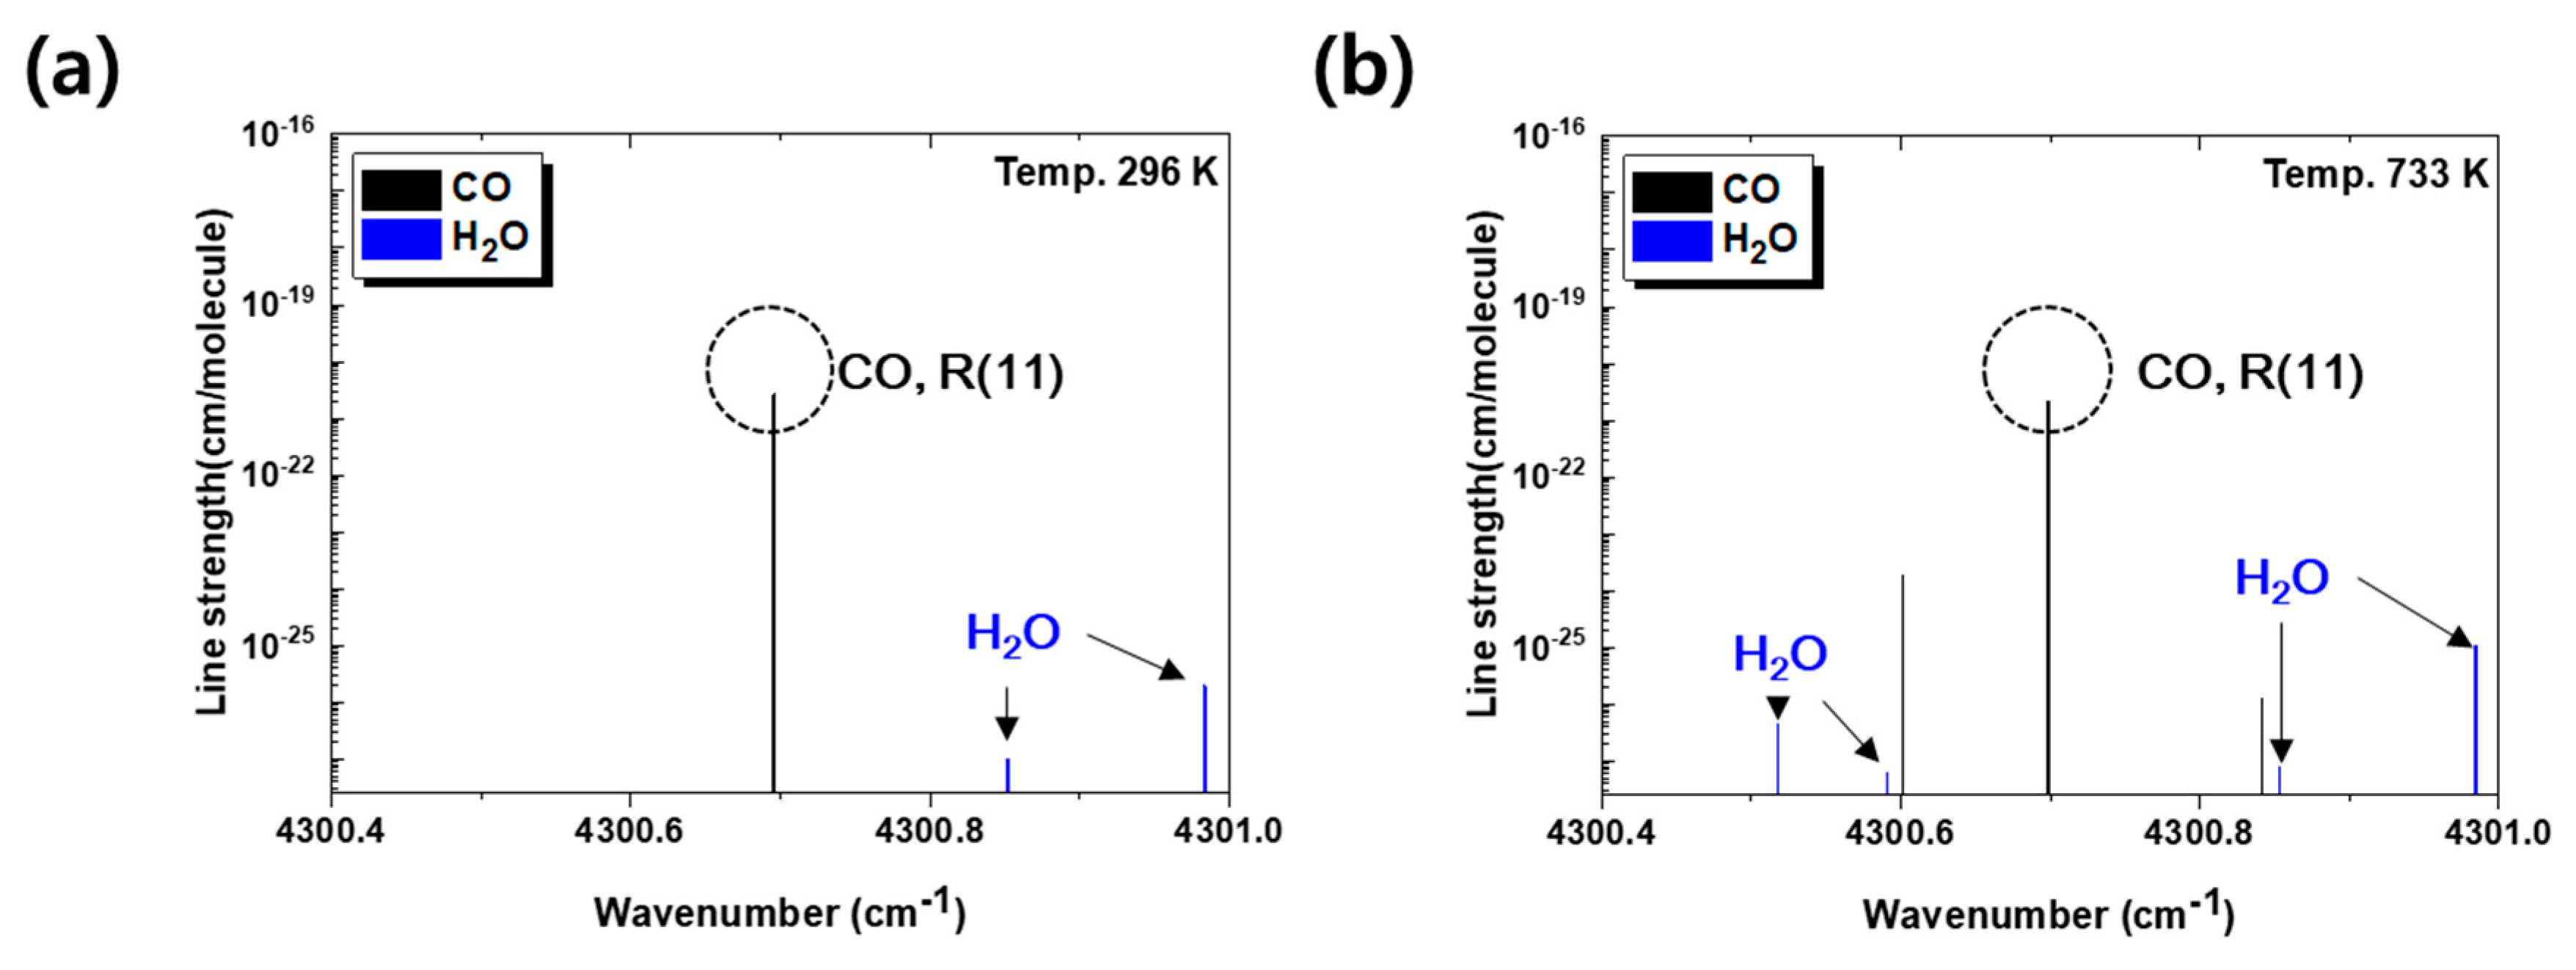
−1 region using a DFB laser has been considered suitable for field measurements, as there are no H2O interference and cooling problems of the laser.
Therefore, in the present study, the mid-infrared 4300.7 cm−1 region was selected for measuring CO concentration in a Liquefied Petroleum Gas (LPG)/air flame. Most of the experiment was performed under a fuel-rich condition with a high CO concentration. The present study aimed to determine the detection limit of CO concentration measurement in the combustion gas using the TDLAS method. The experimental results were compared with the theoretical values.

2. Theory

2.1. Direct Absorption Spectroscopy

Direct absorption spectroscopy (DAS) in the TDLAS method is based on Beer–Lambert’s law. When a light source with a narrow spectrum and at a specific frequency passes through a uniform gas medium, this can be expressed by the ratio between the initial intensity I o and transmitted intensity I [13]:
( I I 0 ) ν = e x p ( k ν L ) = i , j S i , j ( T ) χ i P ϕ ( ν ν 0 , i , j ) L
where a spectral absorption coefficient k ν (cm−1) can be expressed as
k ν = P χ i S i , j ( T ) ϕ ( ν ν 0 , i , j )
In the case of a single transition j for a specific gas species i , the product k ν L is the spectral absorbance α v , which can be expressed as
α ν l n ( I I 0 ) ν = k ν L = P χ i S i , j ( T ) ϕ ( ν ν 0 , i , j ) L
where χ i is the mole fraction of the absorbing species; P (atm) is the static pressure of the gas mixture; L (cm) is the optical path length; ϕ ( ν ν 0 , i , j ) (cm) is the line-shape function, and S i , j ( T ) (cm−2atm−1) is the temperature-dependent line strength of species i of transition j at the center frequency ν 0 , i , j , which can be expressed as [13]
S i ( T ) = S i ( T 0 ) Q ( T 0 ) Q ( T ) ( T 0 T ) e x p [ h c E i k ( 1 T 1 T 0 ) ] [ 1 e x p ( h c ν 0 , i k T ) ] [ 1 e x p ( h c ν 0 , i k T ) ] 1
where Q ( T ) is the molecular partition function; h (Js) is the Planck’s constant; k (J/K) is the Boltzmann’s constant; c is the speed of light; S ( T 0 ) (usually T 0 is reference temperature; 296 K) is the line strength, and E (cm−1) is the lower-state energy. The line-shape function ϕ ( ν ν 0 , i , j ) is normalized to 1, as ϕ ν d ν 1 , and the integrated absorbance A i   (cm−1) can be obtained as
A i = α ν d ν = P χ i S i , j ( T ) L
As mentioned above, the integrated absorbance is proportional to the static pressure, mole fraction, line strength, and gas medium of the optical path length. Therefore, the concentration of the gas species can be simply obtained as the following:
χ i = A i P S i , j ( T ) L

2.2. Line-Shape Function

Combustion products in the combustion environment interact with the light on a molecular basis to form various line-shape mechanisms. The first is the Lorentzian line-shape function, which is closely related to pressure-broadening in collisions with gas molecules under pressure conditions. The second is the Gaussian line-shape function, which corresponds to the Doppler-broadening for the thermal motion of the absorbing molecules. However, this function is simultaneously affected by both temperature and pressure when measuring the desired gas molecules in an actual combustion environment. For these reasons, it is difficult to represent a single line-shape function and is rather appropriate to use the Voigt line-shape function, which is a mixed form [14]. The gas molecules excited at various temperature ranges in the gas medium occur in random thermal motion, and the line-shape function can be expressed in the form of a Gaussian function, as follows:
ϕ D = 2 Δ ν D l n 2 π e x p [ 4 l n 2 ( ν ν 0 Δ ν D ) ] 2
This equation represents the Doppler-broadening effect in the form of a Gaussian function, where ν D is the full width at half maximum of the integrated absorbance caused by thermal motion, called the Doppler width, and can be expressed as
Δ ν D = 7.1623 · 10 7 ν 0 T M
where M (gmol−1) represents the molar mass of the absorbed gas species. Meanwhile, pressure-broadening is governed by the collision of the absorbed gas species and the pressure in the measurement space and can be expressed in the form of a Lorentzian function:
ϕ c ( ν ) = 1 π Δ ν c 2 ( ν ν 0 ) 2 + ( Δ ν c 2 ) 2
where Δ ν c is the full width at half maximum of the integrated absorbance due to collision of the absorbing species and can be expressed as
Δ ν c = P i χ i 2 γ i
where γ i is the broadening coefficient resulting from the collision of only the absorbing gas species or the collision between the absorbing and disturbing gas species.
Equation (11) is a Voigt function form in which Gaussian and Lorentzian expressions are represented by convolution [15].
ϕ ν ( ν ) = ϕ D ϕ C ( ν u ) d u
However, the Voigt line-shape function is not available as a simple analytic function and must be approximated numerically, whose approximation is suitable for fitting optical absorption signals and comparing data measured by direct absorption spectroscopy [15,16].

2.3. Detection Limit in DAS

In DAS, the peak absorbance is proportional to the optical path length, mole fraction, and line strength, which is the optical property of a gas molecule and can be expressed as Equation (1). Note that the temperature of the measuring environment has a close influence on the detection limit because of the temperature-dependent line strength of the gas molecule.
α ν , p e a k = 10 3 S ( T ) · P · L · χ i · ϕ ν , p e a k 0.8
Here, α ν ,   p e a k is the peak absorbance, and ϕ ν ,   p e a k is the peak value of the Voigt line-shape function. This can be derived through simulation of the Voigt line-shape function. In other words, a numerical approximation to the Voigt profile is used to calculate the peak value of the line-shape function [17,18]. The detection limit can be determined from the value of peak absorbance. It is known theoretically that the peak absorbance must be greater than 10−3, which is the lower limit of an “optically thin condition” and must be less than about 0.8 to avoid experimental difficulties associated with “optically thick condition” [18]. In this study, the CO detection limit was analyzed under various conditions in a combustion environment. In addition, the integrated absorbance theoretically measured by the simulation of the Voigt line-shape function [16] and that measured experimentally were compared using the MATLAB software.

3. Experimental Setup and Methods

3.1. Selection of CO Light Absorption Region

The experiments in this study could be divided into two main categories: (1) the CO concentration measurement for securing basic data in the laboratory gas cell at room temperature of 296 K and (2) the CO concentration measurement in the combustion environment where the equivalence ratio is 1.0 or more. Before conducting experiments for measuring CO concentration, a single CO light absorption wavenumber region should be selected from the HITRAN database without interference from other combustion products [19]. In the wavenumber region we selected, the important combustion products do not contain O2, CO, CO2, NO, NO2, SO2, and SO3, or they are distributed with very low line strength. However, the line strength of H2O exists around the CO line strength. Figure 1a,b show a comparison of the line strength of a CO gas molecule and H2O at room temperature.
In general, CO2 and H2O are produced in much more quantity than CO in combustion products. They can affect the absorption signal, even though their line strength is small. Thus, gas molecules produced at high concentrations must be compared with those with low-scale line strength. Figure 1a confirms that the line strength of CO gas is free of interference from those of H2O and other combustion products because the H2O line strength is apart enough, and there is no light absorption of other combustion gases in this region.
Figure 1b shows a comparison of the line strengths of a CO gas molecule and H2O of combustion products under an expected temperature condition of the combustion exhaust gas. As the temperature increases, more H2O line strengths are observed than H2O of Figure 1a. However, it is confirmed that no interference occurs in the CO light absorption region. For this study, a light absorption region of 4300.7 cm−1, which is not affected by other combustion products under room and combustion temperature conditions, was selected. The absorption region is an R(11) branch line in the first overtone band of CO near 4300 cm−1 [10]. A preliminary experiment under various CO concentration conditions at room temperature and a CO concentration analysis in the combustion environment was conducted in this absorption region.

3.2. Preliminary Experimental Setup

The first purpose of this study was to determine the detection limit through CO measurement with various concentrations at room temperature as a preliminary experiment to secure the data of CO concentration measurement. As mentioned in the Introduction, the combustion environment for measuring CO concentration in the NOF zone of a steel annealing system is a fuel-rich condition. Therefore, the experiment focused on measuring the high concentration of CO by percent units. To set the range of various CO concentrations, 10% CO gas balanced with N2 and pure N2 gas was adjusted using a mass flow controller (MFC).
Figure 2 shows the preliminary experimental arrangement used for measuring the detection limit of CO concentration in a quartz gas cell of 111 cm. The DFB (Nanopuls) diode laser near 4300.7 cm−1 was used to measure the CO concentration, which produced an optical power of approximately 4–5 mW. The laser wavenumber and intensity were controlled by a combination of injection current and temperature (90 mA–16 °C) using a laser controller (ILX Lightwave LDC-3908). In addition, the laser wavenumber was tuned over the selected absorption by a linear ramp (1 kHz–1 V) of current from a function generator (Tektronix AFG3022C). The laser output was split into two beams, as shown in Figure 2. One beam was propagated through a solid etalon, with a free spectral range of 0.48 GHz, to enable the conversion of the time domain to the wavenumber domain and to determine the zero-absorption laser intensity I 0 . The second beam was transmitted through the quartz gas cell and detected by an InGaAs detector (Thorlabs DET10D2). The outer sections of the laser and detector were filled with N2 gas at atmospheric pressure to avoid interference by ambient H2O in room air along the optical path length. Wedged windows (CaF2) were installed on the quartz tube to reduce the etalon noise. The transmitted signals of the laser wavenumber scanned at 1 kHz frequency were recorded using the National Instruments data-acquisition system (NI PCIe-6361, 500 kS/s).

3.3. Combustion Experimental Setup

In this study, a combustion experiment was conducted with a co-axial burner to investigate the CO concentration characteristics according to the equivalence ratio (Φ: the ratio of the actual fuel/air ratio to the stoichiometric fuel/air ratio ( F / A ) ( F / A ) s t o i c ) and its detection limit in a partially premixed flame. Figure 3 shows a swirl-type co-axial burner, with a total capacity of 4000 kcal/h, designed to form a stable flame. The fuel was LPG and was supplied mainly to the burner center nozzle. The general compressed air was used by the oxidant and was supplied to the outside of the fuel nozzle. Figure 3 shows a schematic of the combustion system for measuring the exhaust gas, where the burner that formed the partially premixed flame was installed in the combustion chamber part, and the exhaust gas was flown through the exhaust pipe. The combustor chamber and the exhaust pipe were insulated to maintain a steady-state temperature condition. The optical path length of the exhaust pipe was designed as 190 cm, which is the length between the windows. An air-fuel flow rate to form the flame was controlled by the MFC, and the gas temperature in the exhaust pipe was measured using K-type thermocouples. Similar to the previous preliminary experiment setup, the left side was a laser transmitter, and the right side was a receiver system for analyzing the transmitted signal. The transmitted laser through the transmission part was irradiated from the direction opposite to that of the exhaust gas flow and then collimated on the photodetector.
Table 1 shows the fuel-rich operating conditions for generating unburned CO concentrations under the equivalence ratio of 1.15 to 1.50.

4. Results and Discussion

This study aimed to measure various CO concentrations in a quartz gas cell at room temperature and the real combusted gas under the fuel-rich condition and to confirm its detection limit when the TDLAS method was used. 
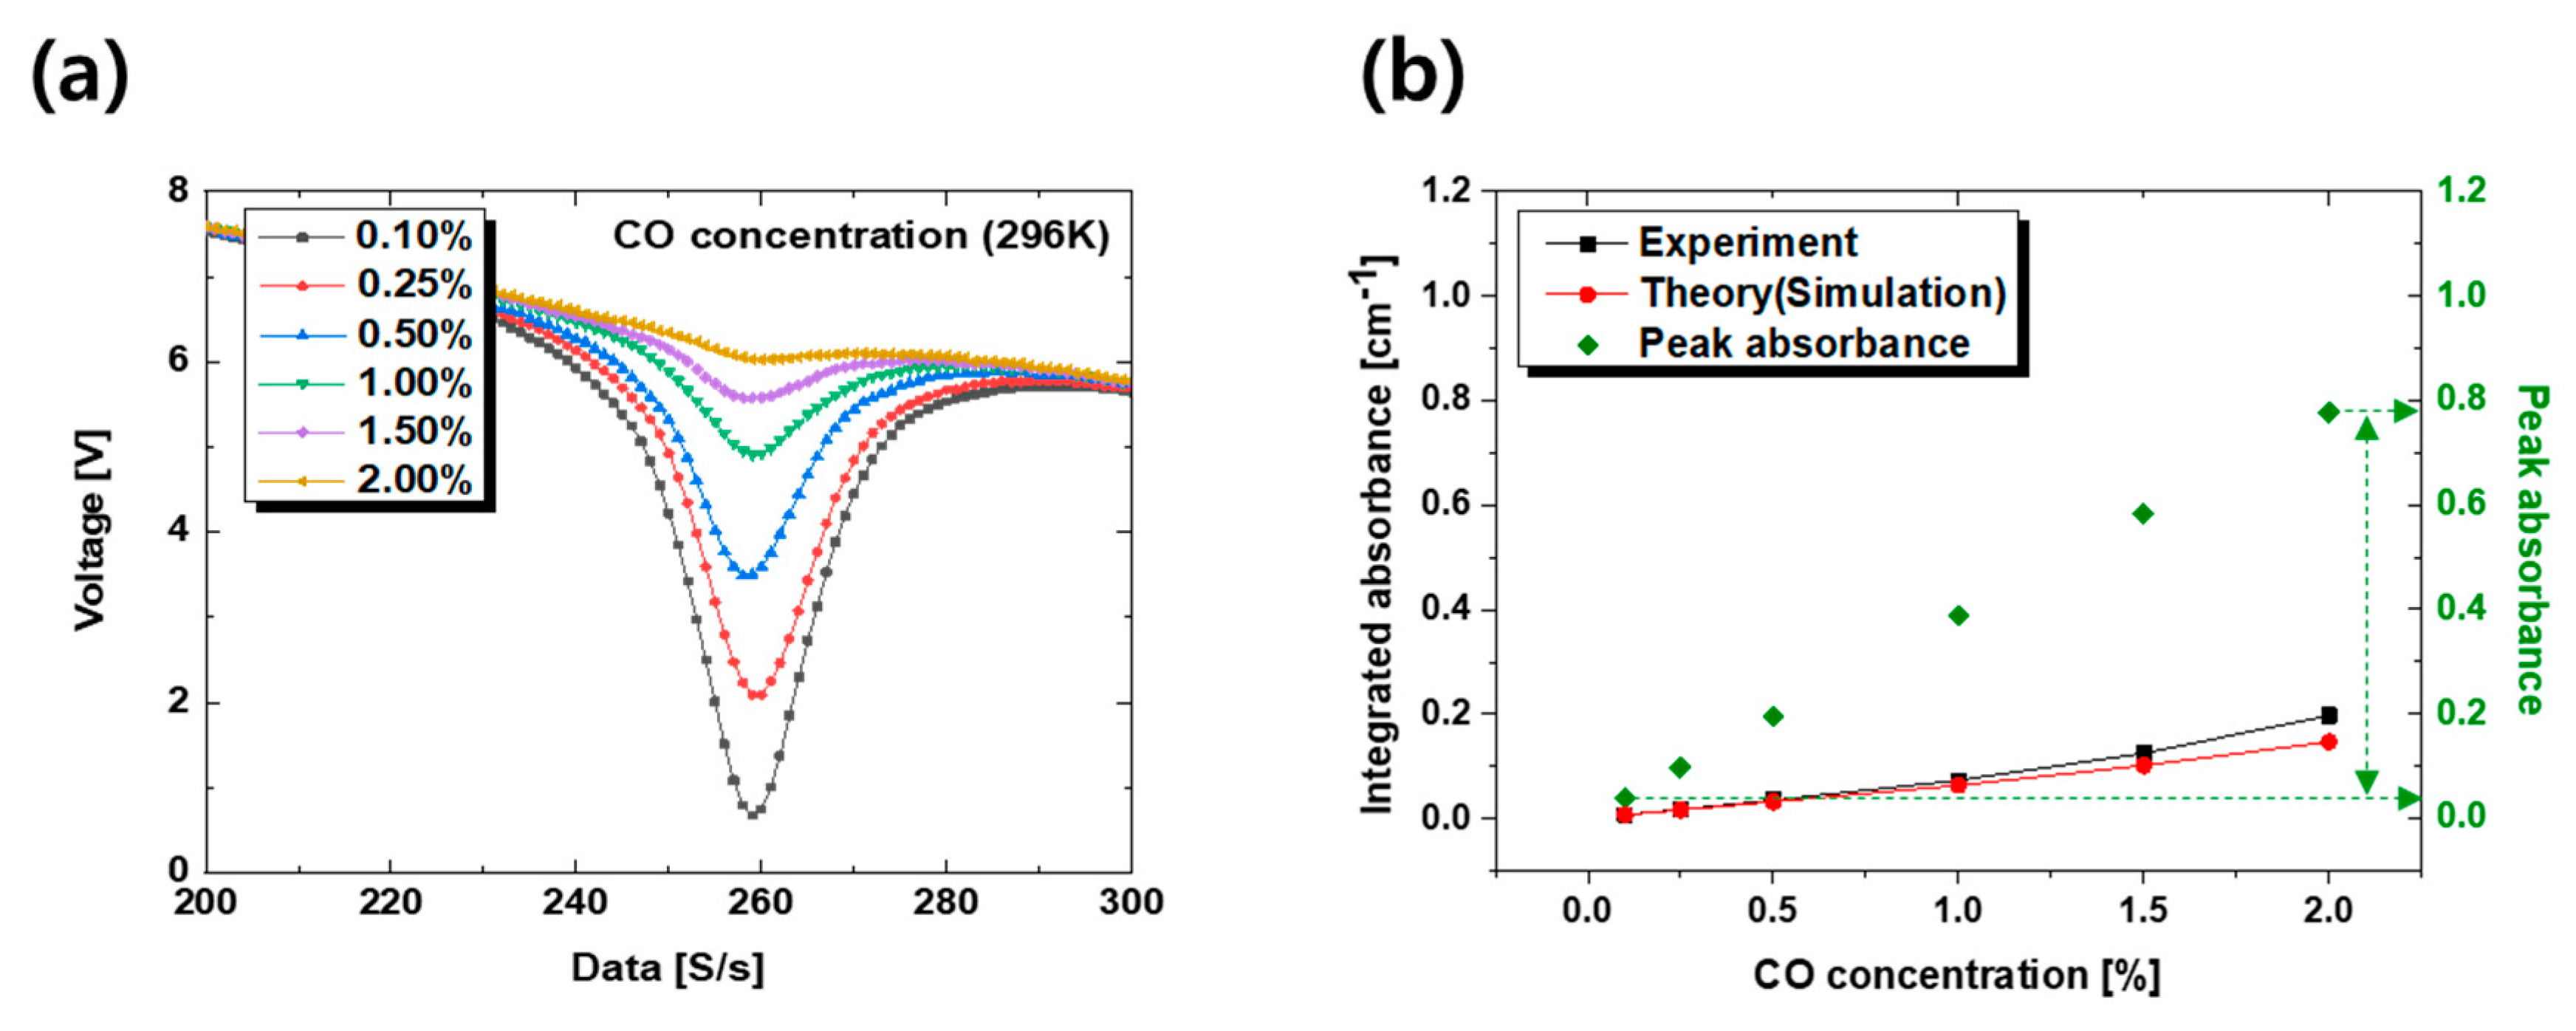
Figure 4a shows the results of the light absorption signal obtained by measuring CO concentrations of 0.1%, 0.25%, 0.5%, 1%, and 2% at room temperature. The light absorption signal reflected well the tendency of the light absorption signal area, which increased with the CO concentration, as shown in Equation (5).
Figure 4b shows a comparison of the integrated absorbance obtained experimentally by analyzing various CO gases through the TDLAS method at room temperature and that obtained theoretically by simulation of the Voigt line-shape function [16]. At CO concentrations of 0.1%, 0.25%, 0.5%, 1%, and 2%, both the experimental and theoretical integrated absorbances were well-fitted.
However, the result analyzed at above 2% CO concentration had a large error. The peak absorbance values derived via Equation (12) were 0.582 and 0.777 for CO concentrations of 1.5% and 2%, respectively. An error in the concentration analysis occurred when the peak absorbance was 0.958 at a CO concentration of 2.5%. Table 2 shows the measurement results of CO concentration in the preliminary experiment. Summarizing the results of the preliminary experiment, the concentration range was measured from 0.101% to 2.021% under room temperature and atmospheric pressure at a path length of 111 cm. Under most experiment conditions, except for where the CO concentration was 2.5%, the peak absorbance was calculated to be below 0.8, and the maximum error rate was 1.60%. At a CO concentration of 2.5%, the peak absorbance was 0.958, and the concentration measurement failed because of the absorption signal of optically thick conditions for calculation.
According to the measurement results of CO concentration in the laboratory environment, an experiment was conducted on the CO concentration measurement of the exhaust gas produced by the combustion reaction under fuel-rich conditions. 
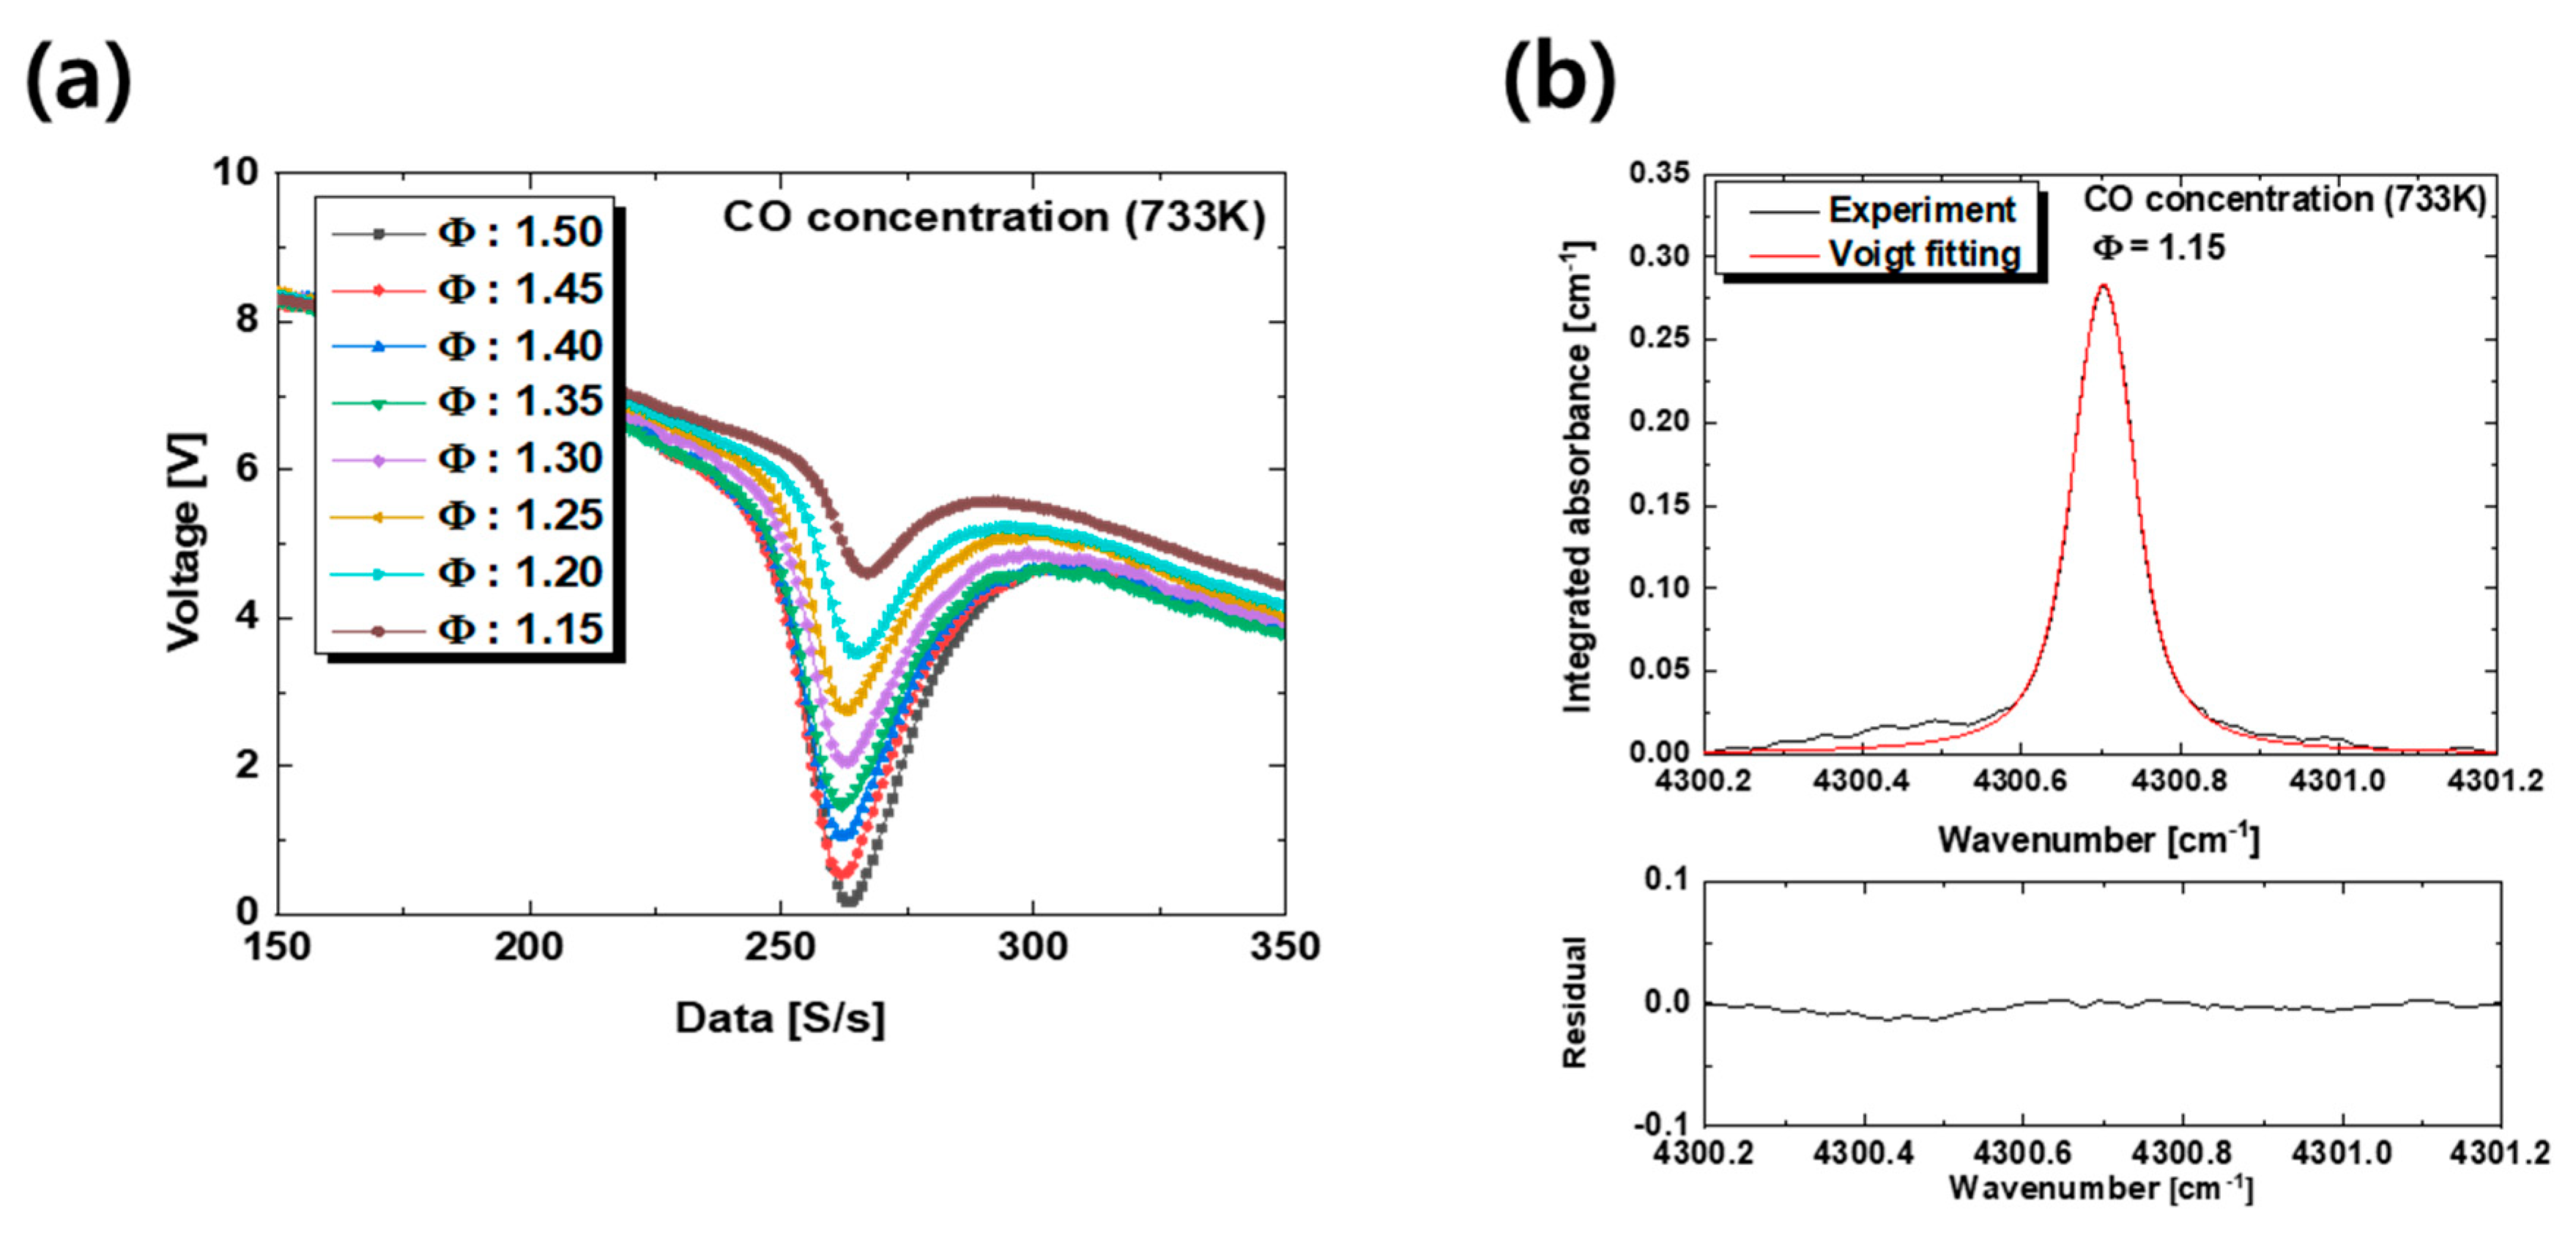
Figure 5a shows that the experiment was performed at 0.05 intervals of the equivalence ratio ranging from 1.15 to 1.50, and the CO absorption signal increased as the equivalence ratio increased from 1.15 to 1.50. Considerable unburned CO was generated with an increase in the fuel ratio under the fuel-rich condition. Therefore, the increase in the CO absorption signal was expected to match the general trend [20]. Figure 5b shows the CO absorption signal measured at an equivalence ratio of 1.15 in the combustion environment.
As the water vapor and soot particles generated from the LPG/air flame affected the signal distortion, the integrated absorbance obtained by applying Voigt fitting to the CO absorption signal was compared with the experimentally obtained integrated absorbance without fitting. Likewise, the integrated absorbance derived through Voigt fitting was analyzed for the CO concentration signal throughout the remaining equivalent ratio from 1.20 to 1.50.
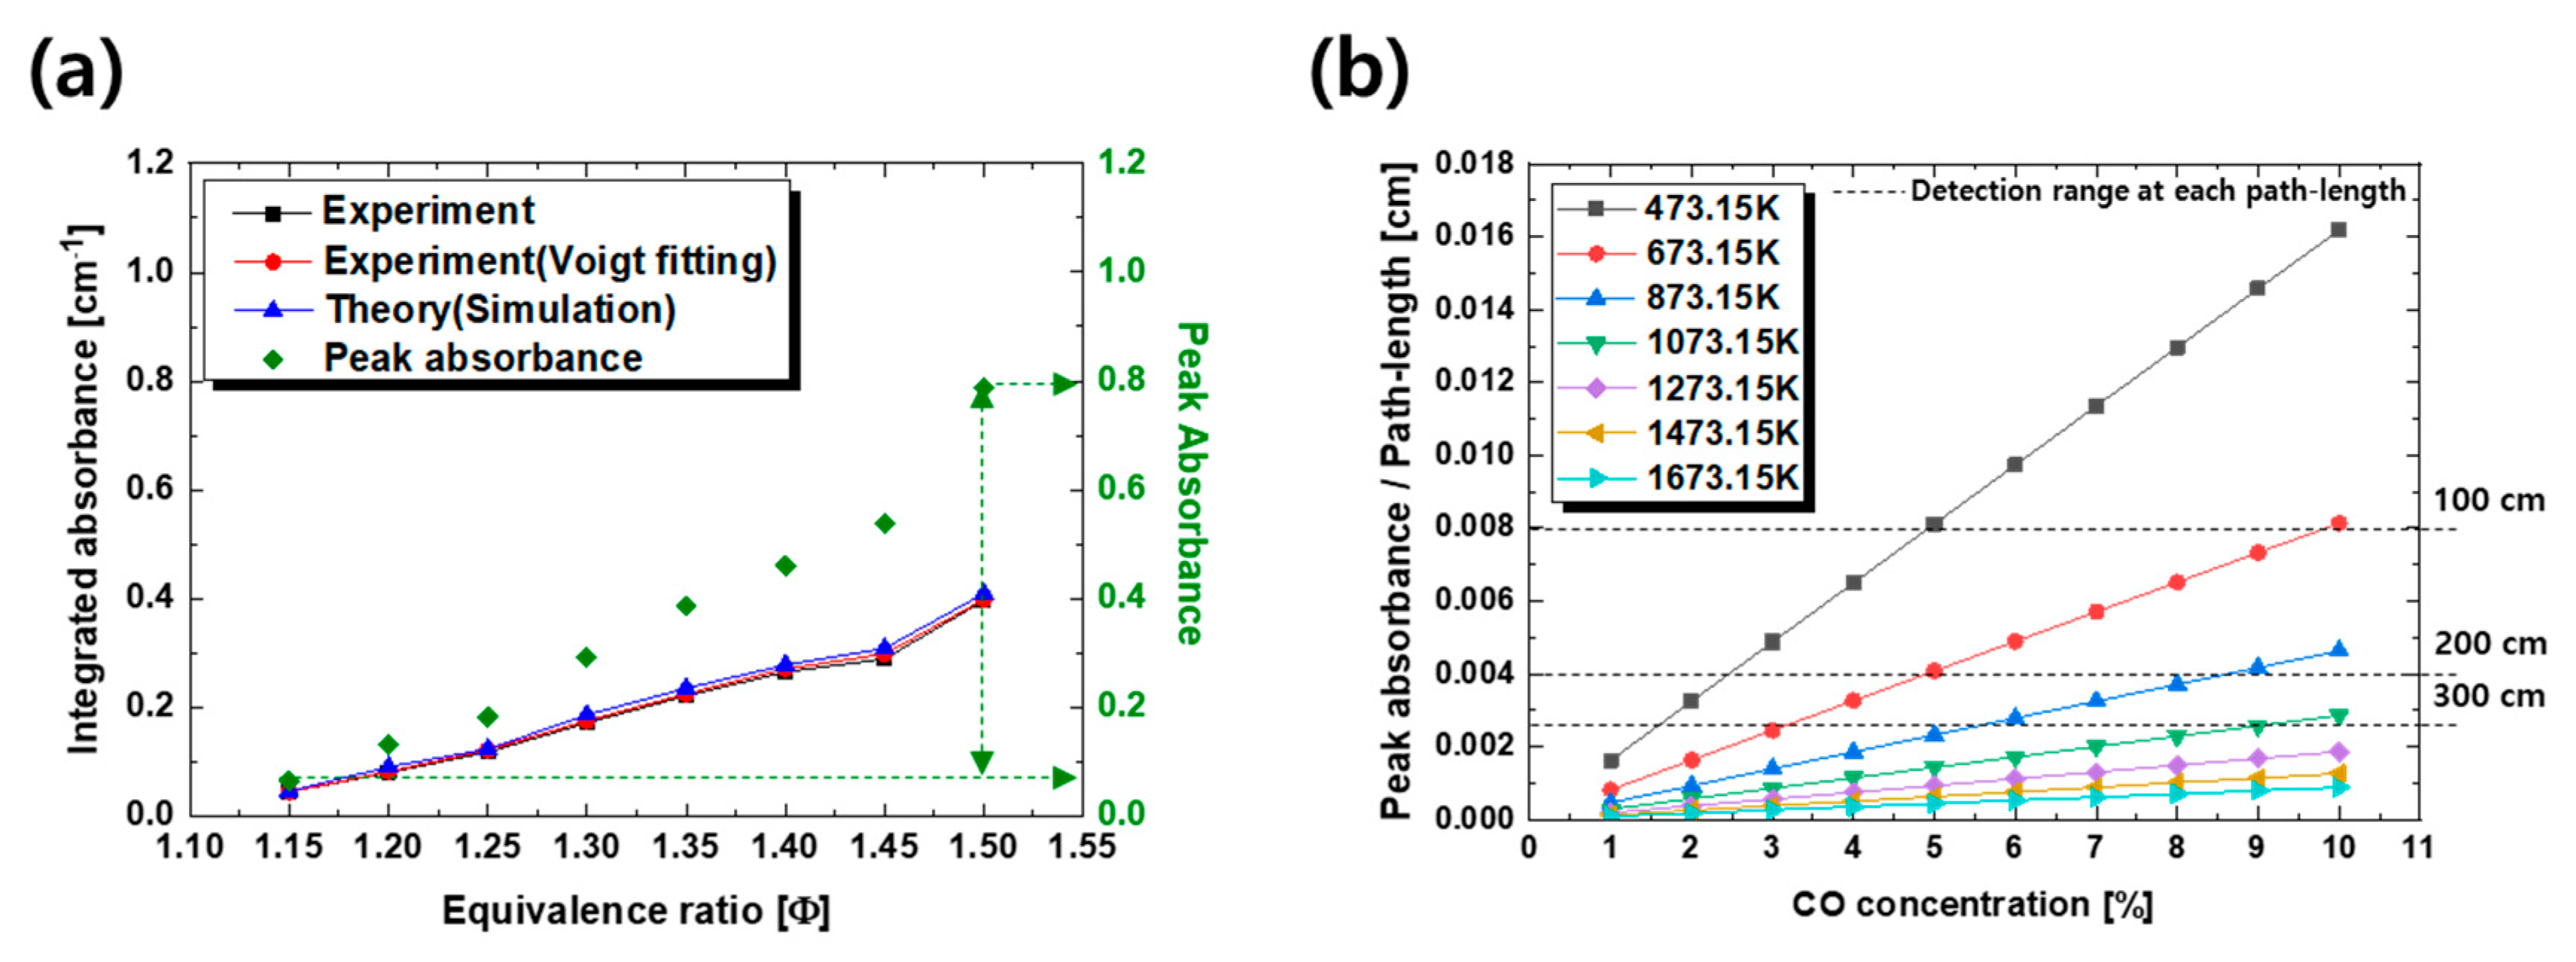
Figure 6a shows a comparison between the integrated absorbance of CO absorption signals obtained from TDLAS and that obtained from the simulation of the Voigt line-shape function in the combustion environment. The experimental and theoretical values with increasing equivalence ratio were derived using Equation (5) and Voigt simulation [16]. When the equivalence ratio was increased from 1.10 to 1.50, the black and red dots in Figure 6a indicated the integrated absorbance measured via TDLAS and that measured by Voigt fitting, respectively. The integrated absorbance compensated by Voigt fitting almost coincided with the experimental integrated absorbance. Moreover, the integrated absorbance obtained from TDLAS under the conditions of equivalence ratio ranging from 1.15 to 1.50 almost coincided with that obtained through Voigt simulation.
The results obtained in the combustion environment were tested under steady-state conditions. Table 3 shows the results of the CO concentration measured in the exhaust gas produced under the fuel-rich condition. The CO concentrations at equivalence ratio ranging from 1.15 to 1.50 were measured at 0.495% and 6.139%. The peak absorbance ranged between 0.064 and 0.787, with equivalence ratios of 1.15 and 1.50. When the equivalence ratio increased to 1.55, the peak absorbance was expected to exceed 0.8, according to the increasing tendency. As confirmed in the preliminary experiment, if the equivalent ratio increases beyond 1.55, the absorption signal corresponding to the condition of optically thick is expected to be generated. The absorbance analysis was practically impossible at the equivalence ratio of 1.55. Therefore, the concentration detection limit was confirmed at 6.139% with a path length of 190 cm, based on the exhaust gas temperature of 733 K.
Comparing the results obtained in the laboratory environment at room temperature with those obtained in the combustion environment in Table 3, it was difficult to measure the CO gas concentration above 2% in the laboratory environment, but that in the combustion environment could be measured up to 6.139%. The peak absorbance in Equation (12) indicated that the detection limit was proportional to the concentration, path length, pressure, the peak value of the Voigt line-shape function, and line strength, which is a function of temperature. It could be confirmed that the CO line strength in the combustion environment in Figure 1b was lower than that at room temperature in Figure 1a. As shown in Equation (8), as the temperature increased, the line width increased due to the Doppler-broadening effect, which lowered the peak value of the Voigt line-shape function. According to Equation (12), the lower line strength created a margin for other variables, such as concentration, under the same peak absorbance condition. For this reason, the CO concentration measurement range increased in the combustion experiment as compared to that in the preliminary experiment. These results indicated that the path length was a recessive variable than the temperature to affect the detection limit. Comparing the results of the two experiments, the concentration detection range was increased, although the path length increased in the combustion environment experiment. It was expected that the CO concentration measurement range could be reduced because of the increase in the path length, according to Equation (12). However, the effect of temperature was dominant, which made the concentration detection range wider over the disadvantageous path-length condition.
Hence, the prediction of temperature, path length, and concentration in the measurement environment are important to judge whether it is measurable. In the case of the NOF zone of a steel annealing system, the internal temperature of the combustion furnace was generally 1273.15 K or higher, and the operation was performed at an equivalence ratio range of 1.10–1.40. Therefore, the CO concentration range between 1% and 2.5% was considered important in the NOF zone. Figure 6b shows the results of simulating the detection limit range under various temperature and CO concentration conditions at 1 atm. The Y-axis of the figure indicates the peak absorbance normalized by path length, which is an independent variable that is not coupled with other variables, except for peak absorbance; the lower peak absorption limit was set at 10−3.
From the simulation results, the detection limit range of the concentration could be expected according to the temperature and path length. As described above, as the internal temperature of the NOF zone operated at 1273.15 K or more, the detection limits for measuring the CO concentration range could be predicted as follows. Based on the target temperature of 1273.1–1673.15 K, the peak absorbance was determined from 0.03 to 0.6, and it contained CO concentration ranging from 1% to 10% when the path length was 300 cm. According to these results, the detection limit of the CO concentration could be wider under the higher-temperature condition than that under the lower-temperature condition. In conclusion, when the actual NOF zone condition was 1% or more of the CO concentration at a temperature ranging from 1273.15–1673.15 K, the simulation result obtained under the condition of 300 cm path length was suitable for the detection limit range of DAS measurement with high resolution.

5. Conclusions

In this study, the CO concentration in the combustion environment was measured using TDLAS. The detection limit of the CO concentration was analyzed under fuel-rich conditions. The wavenumber required to obtain an optical absorption signal of CO without interference from other combustion products at the desired measurement temperature was confirmed by HITRAN.
The experiment was divided into two categories. First, it was performed to measure various CO concentrations under room temperature in a laboratory environment. Second, the combustion system was designed to produce fuel-rich conditions. Fuel-rich conditions were formed at equivalence ratios of 1.15 and 1.50. As a result of the laboratory environment measurement, the detection limit of the CO concentration measured from 0.101% to 2.021% ranged peak absorbance between 0.038 and 0.777.
According to the results of the combustion environment, the CO concentration was measured as 0.495% at an equivalence ratio of 1.15 and 6.139% at a maximum equivalence ratio of 1.50. The detection limit in the combustion environment was analyzed at a path length of 190 cm and an internal temperature of 733 K. The peak absorbance was derived to range between 0.064 and 0.787, which were included between 10−3 and 0.80, when the equivalence ratio was varied from 1.15 to 1.50.
To determine the optimum detection limit range to be measured in various environments, the optimum measurement conditions according to temperature and concentration were derived through Voigt simulation. In this study, the detection limit was considered to be an accurate indicator for high CO concentration measurement in a fuel-rich environment, such as the NOF zone in the steel annealing system. The CO concentration measurement using TDLAS is expected to make an essential contribution to optimal combustion control.

Author Contributions

Conceptualization, S.S.; methodology, S.S.; Software, S.S.; validation, J.P. and A.S.; formal analysis, C.L. and J.H.; investigation, S.S. and A.S.; resources, C.L.; data curation, S.S. and J.P.; writing-original draft preparation, S.S.; writing-review and editing, M.Y. and C.L.; visualization, J.P. and A.S.; supervision, M.Y. and C.L.; project administration, C.L.; funding acquisition, C.L. All authors have read and agreed to the published version of the manuscript.

Funding

This work was also supported by the Technology Innovation Program (20005750, Commercial Development of Combustion System Control Technology for Minimizing Pollutant with Multiple Analysis) funded by the Ministry of Trade, Industry, & Energy (MOTIE, Republic of Korea).

Conflicts of Interest

The authors declare no conflict of interest.

References

  1. Van der Lans, R.P.; Glarborg, P.; Johansen, K.D. Influence of process parameters on nitrogen oxide formation in pulverized coal burners. Prog. Energy Combust. Sci. 1997, 23, 349–377. [Google Scholar] [CrossRef]
  2. Christopher, A.P.; Andre, L.B. Comparison of CO and NO emissions from propane, n-butane, and dimethyl ether premixed flames. Energy Fuels 1999, 13, 650–654. [Google Scholar]
  3. Nagali, V.; Hanson, R.K. Design of a diode-laser sensor to monitor water wapour in high-pressure combustion gases. Appl. Opt. 1997, 36, 9518–9527. [Google Scholar] [CrossRef] [PubMed]
  4. Allen, M.G. Diode laser absorption sensors for gas-dynamic and combustion flows. Meas. Sci. Technol. 1998, 9, 545–562. [Google Scholar] [CrossRef] [PubMed] [Green Version]
  5. Upschulte, B.L.; Sonnenfroh, D.M.; Allen, M.G. Measurements of CO, CO2, OH, and H2O in room-temperature and combustion gases by use of a broadly current-tuned multisection InGaAsP diode laser. Appl. Opt. 1999, 38, 1506–1512. [Google Scholar] [CrossRef] [PubMed]
  6. Teichert, H.; Fernholz, T.; Ebert, V. Simultaneous in situ measurement of CO, H2O and gas temperatures in a full-sized coal-fired power plant by near-infrared diode lasers. Appl. Opt. 2003, 42, 2043–2051. [Google Scholar] [CrossRef] [PubMed] [Green Version]
  7. Zhu, X.; Yao, S.; Ren, W.; Lu, Z.; Li, Z. TDLAS monitoring of carbon dioxide with temperature compensation in power plant exhausts. Appl. Sci. 2019, 9, 442. [Google Scholar] [CrossRef] [Green Version]
  8. Mihalcea, R.M.; Baer, D.S.; Hanson, R.K. Diode laser sensor for measurements of CO, CO2, and CH4 in combustion flows. Appl. Opt. 1997, 36, 8745–8752. [Google Scholar] [CrossRef] [PubMed]
  9. Du, Y.; Peng, Z.; Ding, Y. High-accuracy sinewave-scanned direct absorption spectroscopy. Opt. Express 2018, 26, 29550–29560. [Google Scholar] [CrossRef] [PubMed]
  10. Chao, X.; Jeffries, J.B.; Hanson, R.K. Absorption sensor for CO in combustion gases using 2.3 um tunable diode lasers. Meas. Sci. Technol. 2009, 20, 115201–115209. [Google Scholar] [CrossRef]
  11. Burkle, S.; Dreizler, A.; Ebert, V.; Wagner, S. Experimental comparison of a 2D laminar diffusion flame under oxy-fuel and air atmosphere. Fuel 2018, 212, 302–308. [Google Scholar] [CrossRef]
  12. Spearrin, R.M.; Goldenstein, C.S.; Schultz, I.A.; Jeffries, J.B.; Hanson, R.K. Simultaneous sensing of temperature, CO, and CO2 in a scramjet combustor using quantum cascade laser absorption spectroscopy. Appl. Phys. B 2014, 117, 689–698. [Google Scholar] [CrossRef]
  13. Nagali, V.; Chou, S.I.; Baer, D.S.; Hanson, R.K.; Segall, J. Tunable diode laser absorption measurement of methane at elevated temperatures. Appl. Opt. 1996, 35, 4026–4032. [Google Scholar] [CrossRef] [PubMed]
  14. Puerta, J.; Martin, P. Three and four generalized Lorentzian approximations for the Voigt line shape. Appl. Opt. 1981, 20, 3923–3928. [Google Scholar] [CrossRef] [PubMed]
  15. Liu, X.; Jeffries, J.B.; Hanson, R.K. Measurement of spectral parameters of water-vapour transitions near 1388 and 1345 for accurate simulation of high-pressure absorption spectra. Meas. Sci. Technol. 2006, 18, 1185–1194. [Google Scholar] [CrossRef]
  16. McLean, A.; Mitchell, C.; Swanston, D. Implementation of an efficient analytical approximation to the Voigt for photoemission lineshape analysis. J. Electron. Spectroc. 1994, 69, 125–132. [Google Scholar] [CrossRef]
  17. Whiting, E.E. New empirical approximation to the Voigt profile. J. Quant. Spect. Radiat. Transf. 1976, 16, 611–614. [Google Scholar]
  18. Zhou, X.; Liu, X.; Jeffries, J.B.; Hanson, R.K. Development of a sensor for temperature and water concentration in combustion gases using a single tunable diode laser. Meas. Sci. Technol. 2003, 14, 1459–1468. [Google Scholar] [CrossRef]
  19. Rothman, L.S.; Gordon, I.E.; Babikov, Y.; Barbe, A.; Chris, B.D.; Bernath, P.F.; Brik, M.; Bizzocchi, L.; Boudon, V.; Brown, L.R.; et al. The HITRAN2012 molecular spectroscopic database. J. Quant. Spec. Radiat. Transf. 2013, 130, 4–50. [Google Scholar] [CrossRef]
  20. Balakrishnan, A.; Parthasarathy, R.N.; Collahalli, S.R. Experimental correlation of laminar flame pollutant emission indices with methyl ester fuel degree of unsaturation and equivalence ratio. Fuel 2019, 238, 139–148. [Google Scholar] [CrossRef]
Figure 1. (a) Absorption line strength at log-scale of carbon monoxide (CO) and combustion products in the 4300.4–4301.0 cm−1 spectral range at 296 K and (b) absorption line strength at log-scale of CO and combustion products in the 4300.4–4301.0 cm−1 spectral range at 733 K from the HITRAN database.
Energies 13 04234 g001
Figure 2. Schematic of the optical setup used for the preliminary experiment.
Energies 13 04234 g002
Figure 3. Schematic of the experimental setup of the combustion system with the co-axial burner.
Energies 13 04234 g003
Figure 4. (a) Measured CO absorption signal of the preliminary experiment at 296 K. (b) Comparison of the experimentally obtained integrated absorbance with that obtained through Voigt simulation for the analysis of detection limit in the preliminary experiment.
Energies 13 04234 g004
Figure 5. (a) Measured CO absorption signal at 733 K under the conditions of the equivalence ratio in the combustion environment. (b) Voigt profile for experimental data at the equivalence ratio of 1.15.
Energies 13 04234 g005
Figure 6. (a) Comparison of the experimentally obtained integrated absorbance with that calculated through Voigt simulation for the analysis of the detection limit in the combustion environment. (b) Simulation results of detection limit range according to various temperature and CO concentration conditions at 1 atm.
Energies 13 04234 g006
Table 1. Fuel-rich operating conditions for the combustion experiment.
Equivalence
Ratio (∅)
Total Flow Speed (m/s)Fuel
(L/min)
Air
(L/min)
Total
(L/min)
1.152.51.8638.3840.2
1.201.9438.3040.2
1.252.0238.2240.2
1.302.1138.1440.2
1.352.1938.0640.2
1.402.2737.9840.2
1.452.3537.9040.2
1.502.4337.8140.2
Table 2. Results of carbon monoxide (CO) concentration and detection limit range for the preliminary experiment.
CaseConcentration by Mass Flow Controller (MFC) (%)Measured Concentration (%)Peak AbsorbanceError Rate (%)
10.1000.1010.0381.00
20.2500.2460.0971.60
30.5000.4940.1941.20
41.0001.0150.3881.50
51.5001.5200.5821.33
62.0002.0210.7771.05
72.500Not measurable0.958-
Table 3. Results of CO concentration and detection limit range for combustion environment.
Equivalence Ratio (∅)Measured Concentration (%)Voigt Fitting Concentration (%)Peak Absorbance
1.150.5010.4950.064
1.201.0081.0370.130
1.251.4071.4760.182
1.302.2502.3220.292
1.352.9743.0370.385
1.403.5463.6470.459
1.454.1464.2560.537
1.506.0846.1390.787

