Article

Influence of Atlantic Microclimates in Northern Spain on the Environmental Performance of Lightweight Concrete Single-Family Houses

by
Daniel González-Prieto
1,
Yolanda Fernández-Nava
2,
Elena Marañón
2 and
Maria Manuela Prieto
1,*
1
Energy Department, University of Oviedo, Campus of Gijón, 33204 Gijón, Spain
2
Chemical and Environmental Engineering Department, University of Oviedo, Campus of Gijón, 33204 Gijón, Spain
*
Author to whom correspondence should be addressed.
Submission received: 16 July 2020 / Revised: 13 August 2020 / Accepted: 17 August 2020 / Published: 21 August 2020

Abstract

:
The use of lightweight concrete for the construction of single-family houses has become increasingly popular in Spain. In this paper, single-family houses with different shape factors and window-to-wall ratios are analysed from both a thermal and environmental perspective using Passive House Planning Package (PHPP) software to calculate the energy demand. The study has been carried out for different Atlantic microclimates (coastal, inland, and mountain) in northern Spain. What most affects the thermal energy used for air conditioning is the variation of the microclimates, so the study focuses mainly on this aspect. Operational energy for heating has decreased greatly via the use of high degree of insulation and hence the next task is to decrease the total energy consumed taking into account the embodied energy. Impacts on Primary Energy and Global Warming Potential are calculated using a cradle-to-grave approach. The energy use for heating and domestic hot water is analysed for different thicknesses of insulation under three energy supply scenarios: electricity only (for 2018 and with the Spanish decarbonisation plan for 2030); heat pump plus electricity; and natural gas boiler. Even for houses with a good level of insulation, the ratio of operational-to-total impacts varies significantly: from 46% to 87% for primary energy and from 31% to 75% for global warming potential, depending on the shape factor of the house, the microclimate and the heat supply scenario. By applying future environmental policies, electricity can become a more environmentally friendly option than natural gas.

Graphical Abstract

1. Introduction

Buildings in the European Union represent 40% of final energy consumption, 36% of CO2 emissions, 30% of consumption of raw materials, 12% of consumption of drinking water and are producers of 30% of the waste destined for landfill [1]. The need to reduce energy consumption in Europe has led to the approval of Directives to achieve almost zero energy buildings in new constructions by 2020 [2,3,4]. The reduction in energy consumption has mainly affected energy of use, also known as operational energy, which represents the highest percentage of the energy that the buildings will use throughout their life cycle (see Sartori and Hestnes [5]). In recent years, there has been a progressive evolution towards low-energy buildings, passive buildings and buildings with almost zero consumption. The decrease in energy of use has also led to a decrease in the ratio between this energy and the total energy to be used throughout building’s lifespan. Consequently, the energy consumed in other stages of the life cycle, such as embodied energy, has gained importance. Karinpour et al. [6] and Chastas et al. [7] analysed cases to illustrate the embodied energy in the transition from conventional to nZEB, passive and low energy buildings, and realized that, despite the reduction in the total life cycle energy, the share of embodied energy takes an important role, mainly in nZEB and low-energy buildings. The need to understand the possibilities of reducing the embodied impacts has led to the “Annex 57” EBC (European Brain Council) project, a broad call for case studies launched with the aim of identifying design strategies to reduce the embodied energy and CO2 emissions from buildings. Malmqvist et al. [8] performed a systematic analysis of a collection of case studies in Annex 57, as well as of further scientific literature on this topic. Regarding passive houses, Stephan et al. [9] studied the total life cycle energy demand of a typical Belgian single-family detached house, which comprises embodied, operational and transport energy, highlighting the importance of the manufacture of building materials, especially due to the large amount of insulation required to achieve high operational efficiencies.
Energies consumed in stages other than manufacturing and use, such as in maintenance, deconstruction and disposal or recycling, currently have a lower impact, as can be deduced from Morales et al. [10] and Cuéllar-Franca and Azapagic [11]. Therefore, manufacturing is the life cycle stage of the where interest is progressively gaining greater importance [6,9].
Sustainability assessment has been performed for diverse climates, but most of these refer to cold climatic regions, as in Takano et al. [12], where buildings with different typologies were studied. Concerning mild and warm climates, Hanandeh [13] analysed six construction systems in Jordan, a country with a Mediterranean climate with great variation in temperatures and rainfall. The role played by the envelope materials in the tropical climate of Indonesia was presented by Utama and Gheewala [14]. Energy demands in different climatic regions of China were discussed by Luo et al. [15] for various insulation thicknesses. There are also examples for hot desert climates in Qatar [16] and for the tropical Lebanese climate [17].
As regards the materials used to manufacture building envelopes, there are numerous studies covering those most commonly used: brick masonry [18], laminated-timber [19] and concrete [20]. Wooden constructions are the most widely studied, since timber is a frequently used material due to its near zero impact in the production of greenhouse gases and its relatively low conductivity [19]. However, there is a scarcity of data concerning buildings made of lightweight concrete, a material that admits a certain degree of recycling and has low conductivity [21], being at the same time of great interest for its use in industrialized construction.
Previous studies have shown the importance of considering the embodied impacts of buildings for different materials and climates. However, particular case studies are required for housing typologies, especially for single-family houses. According to Eurostat [22], in 2015 in the EU-28, more than 4 out of every 10 persons (42.0%) lived in flats, close to one quarter (24.1%) in semi-detached houses and one third (33.3%) in single-family houses. Therefore, single-family houses are important from the point of view of energy efficiency and environmental impacts.
As for the scenarios of sustainability and energy supply, recntly it is necessary to apply decarbonisation policies, both in general and in the production of electricity, in order to reduce climate change. Recently, Spain presented to the European Union the Integrated Energy and Climate National Plan for Spain [23], which covers the objectives until 2030 and greatly increases electricity generation based on renewable sources. Therefore, in the near future an electricity-only scenario may become a highly appropriate option from a sustainability perspective, and that is the reason why it has been included as one of the scenarios to study in this paper. On the other hand, in Spain, particularly in the north, the use of heat pumps is gaining increasing interest, due to their performance and also in order to comply with the mandatory Spanish standards contained in the “Spanish Technical Building Code” [24]. According to this code, part of the demand for domestic sanitary water must be covered by renewable energy. In this respect, the heat pump is a very good alternative to solar hot water panels in those regions where solar insolation is quite low, such as in northern Spain. For this reason, a heat pump installation has been chosen as the second power supply scenario. Finally, to take into account fossil fuels, a third energy supply scenario based on natural gas has been added, since: (i) it is a relatively clean fuel (it does not contain sulphur); (ii) its use to satisfy heating and domestic water demands is widespread; and (iii) the performance of natural gas boilers has improved substantially in recent decades.
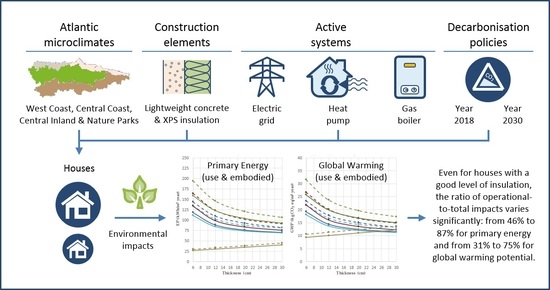
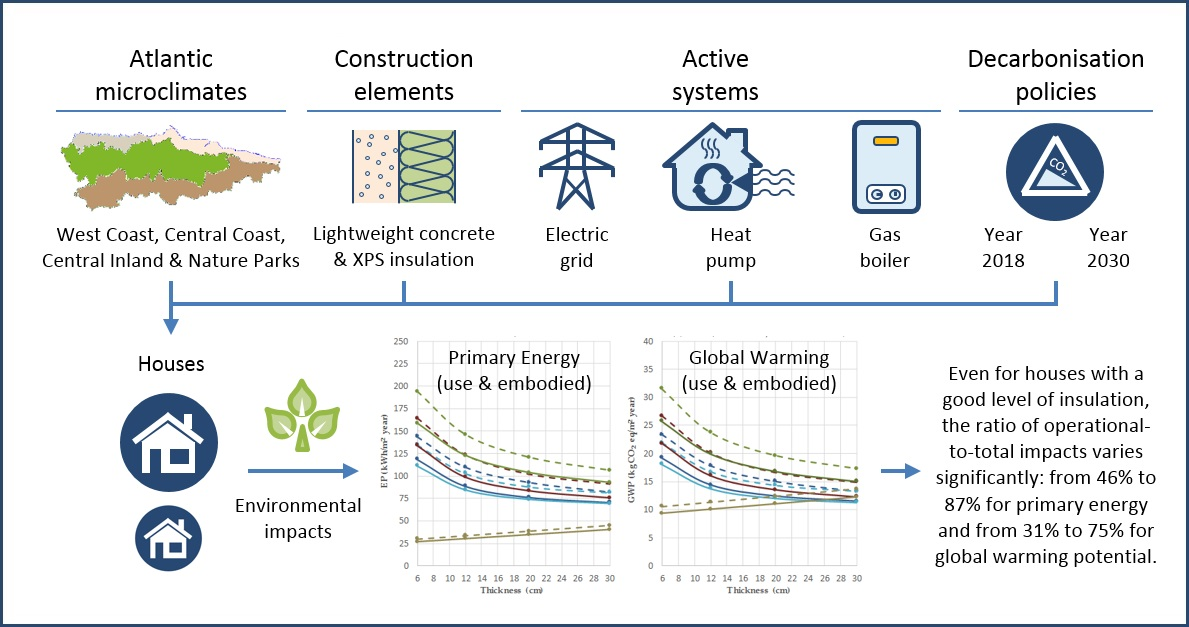
This paper analyses sustainability aspects obtained from life cycle assessment of a single-family house that has been designed to be built industrially using lightweight concrete panels with expanded clay. Two sizes of houses are considered that adapt to the needs of the potential users of single-family housing in northern Spain. The thermal behaviour and embodied impacts of the houses as the insulation thickness increases is analysed for different locations in the Principality of Asturias, located on Spain’s Atlantic coast. The set of considered locations presents a wide variety of climates, given that Asturias can be divided into sub-regions which, although geographically close, have very different weather conditions: the west and central coast, the central inland area and the mountains. The impacts on primary energy (embodied and use) and on greenhouse gas emissions (embodied and use) are analysed for various insulation thicknesses, taking into account that the two types of single-family houses have different shape factors and window-to-wall ratios. Regarding the impacts due to the energy used to cover the thermal demand, three supply scenarios are considered: (i) electricity only; (ii) heat pump plus electricity; and (iii) natural gas boiler. Finally, the influence on future impacts of the planned Spanish electricity mix in the 2030 horizon is analysed when using electricity only.

2. Materials and Methods

The information to calculate the life cycle assessment is provided in this section: thermal balance equations to calculate energy demand; geometric parameters (Design); materials, properties and inventory (Materials); climatic data (Climate); calculation of heating and cooling demands; and system boundaries. 
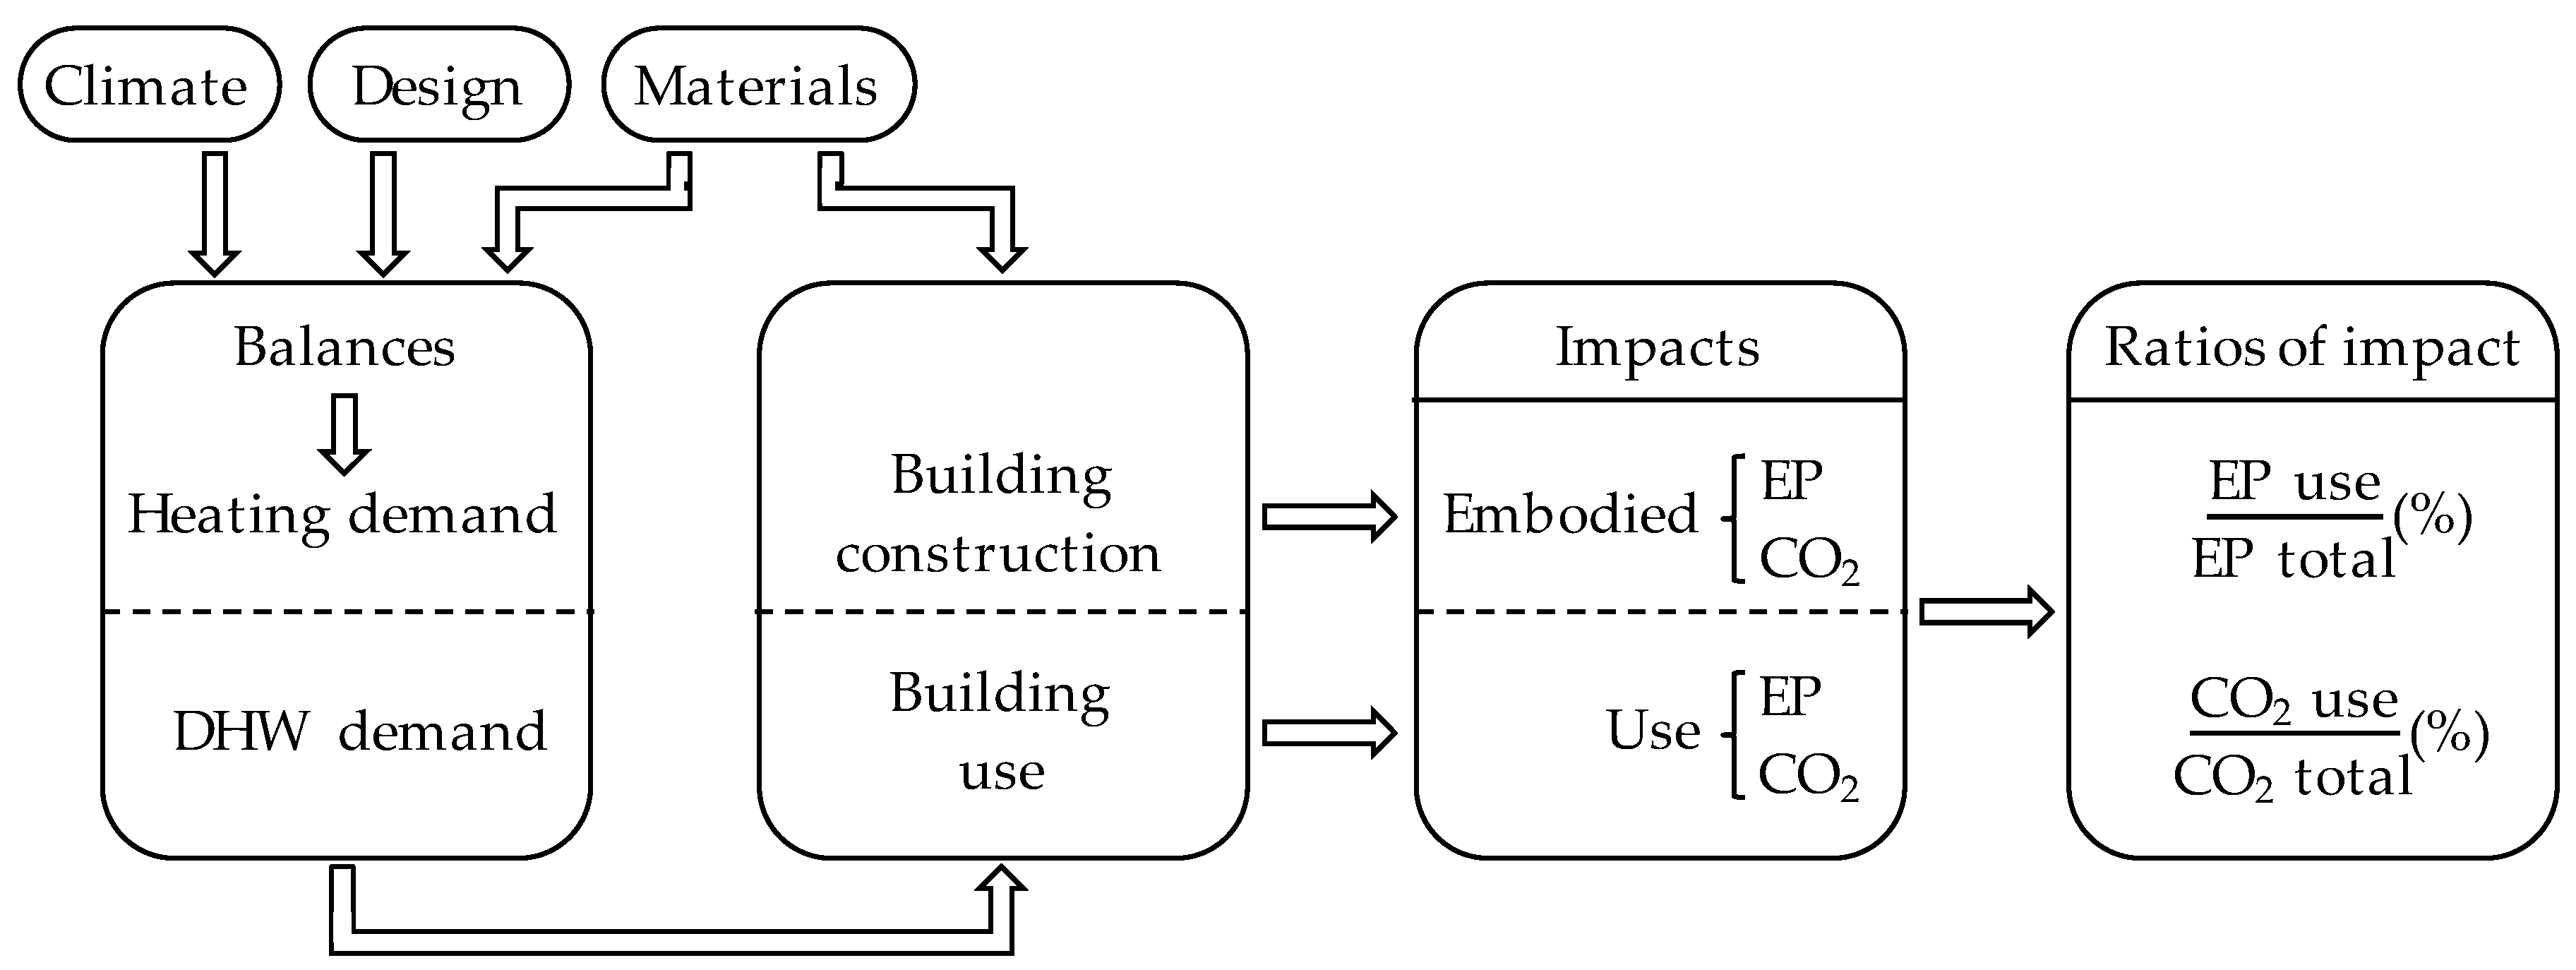
Figure 1 shows a flow chart to illustrate the development of the study: (i) thermal energy consumption, which includes the calculation of balances, heating and domestic hot water (DHW) demands; (ii) definition of the thermal energy supply in three scenarios, in this case “only electric supply”, “with heat pump plus supplementary electric supply” and “natural gas boiler supply”); (iii) calculation of the building use impacts considering the Spanish passage factors [25]; (iv) parallel calculation of the embodied impacts, in this case, primary energy (EP) and CO2 equivalent emissions via Global Warming Potential (GWP); and (v) calculation of the use-to-total ratio of impacts for primary energy and CO2 equivalent emissions.

2.1. Thermal Balances

Thermal balances are obtained using simplified expressions from EN (European Norm) ISO (International Organization for Standardization) 13790 [26], which are used in [19] and in the Passive House Planning Package (PHPP) standard [27], which is the software used in the present study. The validity of the simulation model has been assessed in the literature. Recent papers discuss and compare the performance of buildings calculated under own country codes, using the widely employed software packages EnergyPlus and PHPP. An energy-efficient house built following Passive House design principles and equipped with extensive monitoring was compared to a reference house designed following the Romanian energy efficiency code in [28]. Regarding the use of PHPP, the authors uphold the ability of this software to determine the energy performance of buildings according to European standards. Besides, four climatic regions of Portugal were also analysed in [29] using EnergyPlus software and the Portuguese code, concluding that it is essential to adapt and detail the technical and constructive solutions for different regions.
The energy balance in Equation (1) considers heat inputs and outputs: transmission losses ( Q t ), ventilation losses ( Q v ) , internal gains ( Q i ) and solar gains ( Q s ) . This overall balance in the building is performed in order to obtain the heating ( Q h ) and cooling ( Q c ) demands from Equations (2) and (3), respectively:
Q t + Q v + Q i + Q s = Δ Q
Δ Q = Q h  
Δ Q = Q c  
In the above equations, the building’s thermal inertia and the performance of the building in the unsteady state should be taken into account. In the quasi-stationary method according to EN ISO 13790 [26], the heat gains are reduced by the utilization factor, η G , which is introduced to calculate the heating demand in the following expressions:
Q h = Q L η G Q G
where Q L are the heat losses, Q G are the heat gains and:
Q L = Q t + Q v   and   Q G = Q s + Q i
The solar gains ( Q s ) for the annual calculation are proportional to the window-to-wall ratio gross area ( A w ) and the total solar insolation ( G s ) during the period considered (heating or cooling):
Q s = r   g   A w   G s   / A r e f _ n e t
where r is the total shading reduction factor, g is the solar factor (energy transmitted through the glazing normal to the irradiated surface) and A r e f _ n e t is the usable floor area. The solar gains diminish the heat demand during the heating period, but increase the cooling demand in the summer period. Therefore, the solar factor should be carefully chosen according to the location to minimize the sum of the annual energy demand for the heating and cooling periods. More detailed expressions consider insolation according to the four orientations (N, S, E and W). However, as the transmittance of the windows is higher than the transmittance of the opaque elements, a high window-to-wall ratio also increases losses by transmission through the windows and hence the importance of an appropriate selection of the windows. The transmission losses are a function of the areas of the construction elements:
Q t = A   U   f T   G t / A r e f _ n e t
where A is the area of the element of the envelope (roof, floor, wall, window), U is the transmittance of the element, f T is the temperature reduction factor and G t is the sum of the differences in temperature (exterior air temperature and base temperature), which is calculated on an hourly basis, i.e., degree hours for the period (heating or cooling).

2.2. Geometric Parameters

The type of housing and the living spaces were defined based on: the average income level of the potential users and the number of children per couple, as reported in [
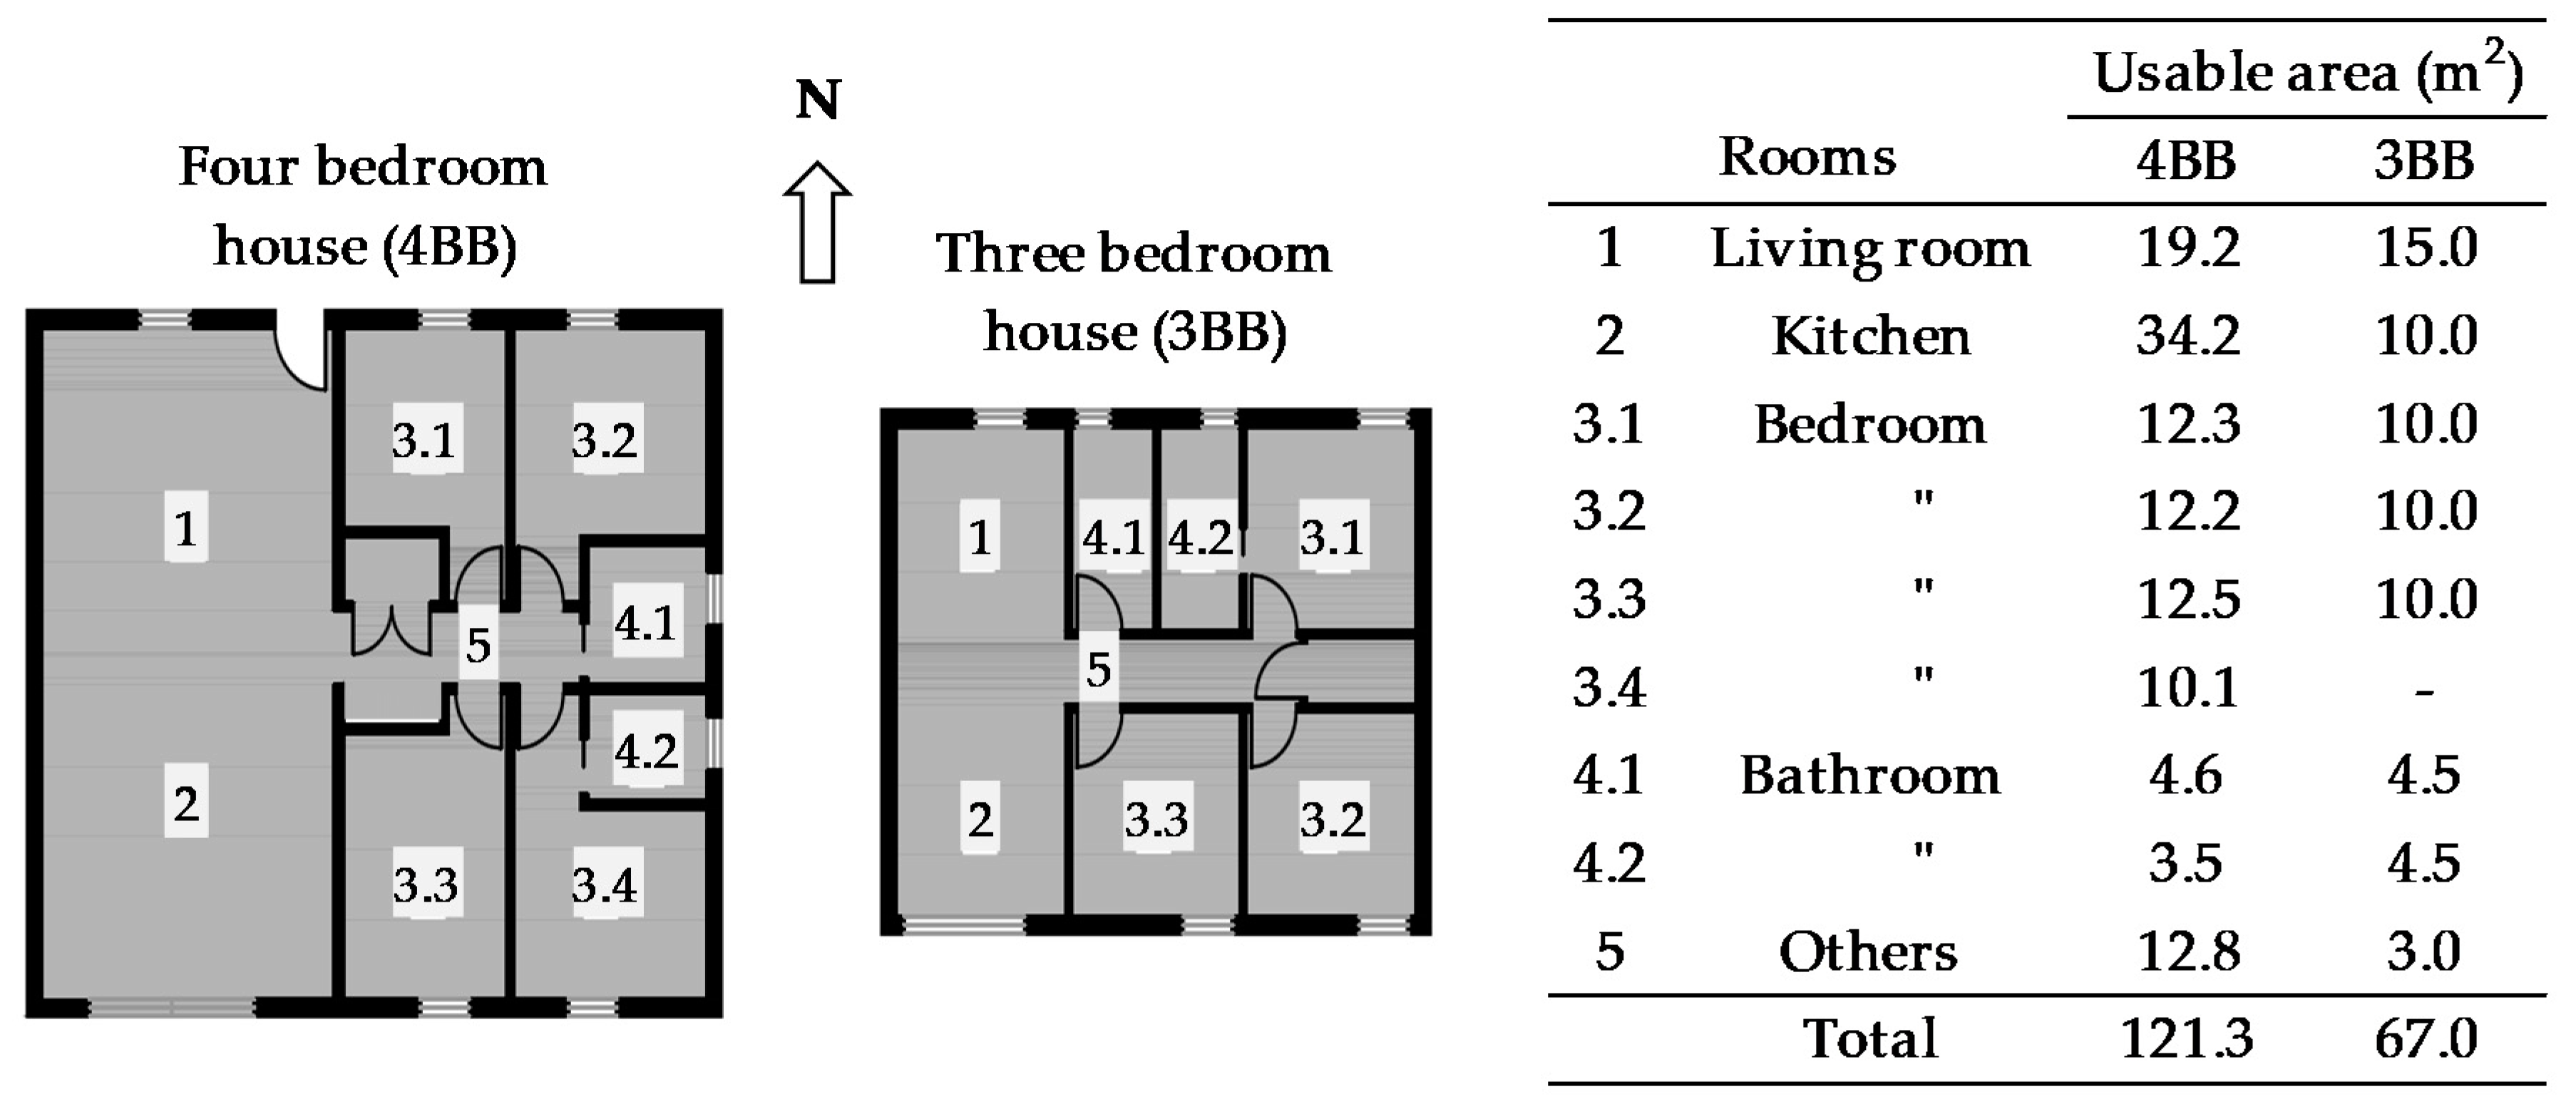
30]. However, it is also very common for 5 occupants to live together in the house when considering a large family or when living with older relatives, so the study considers two sizes of single-family houses. The layout for both types of houses and the floor areas of the rooms is shown in Figure 2. The one on the left corresponds to a four-bedroom building (referred to as 4BB), while the one on the right is for a three-bedroom building (3BB); the houses include a living room/kitchen, corridor and a facilities room. The usable floor areas are 121.27 and 67 m2, respectively. The houses are on one level, with a 20-degree pitched roof and slate finish.
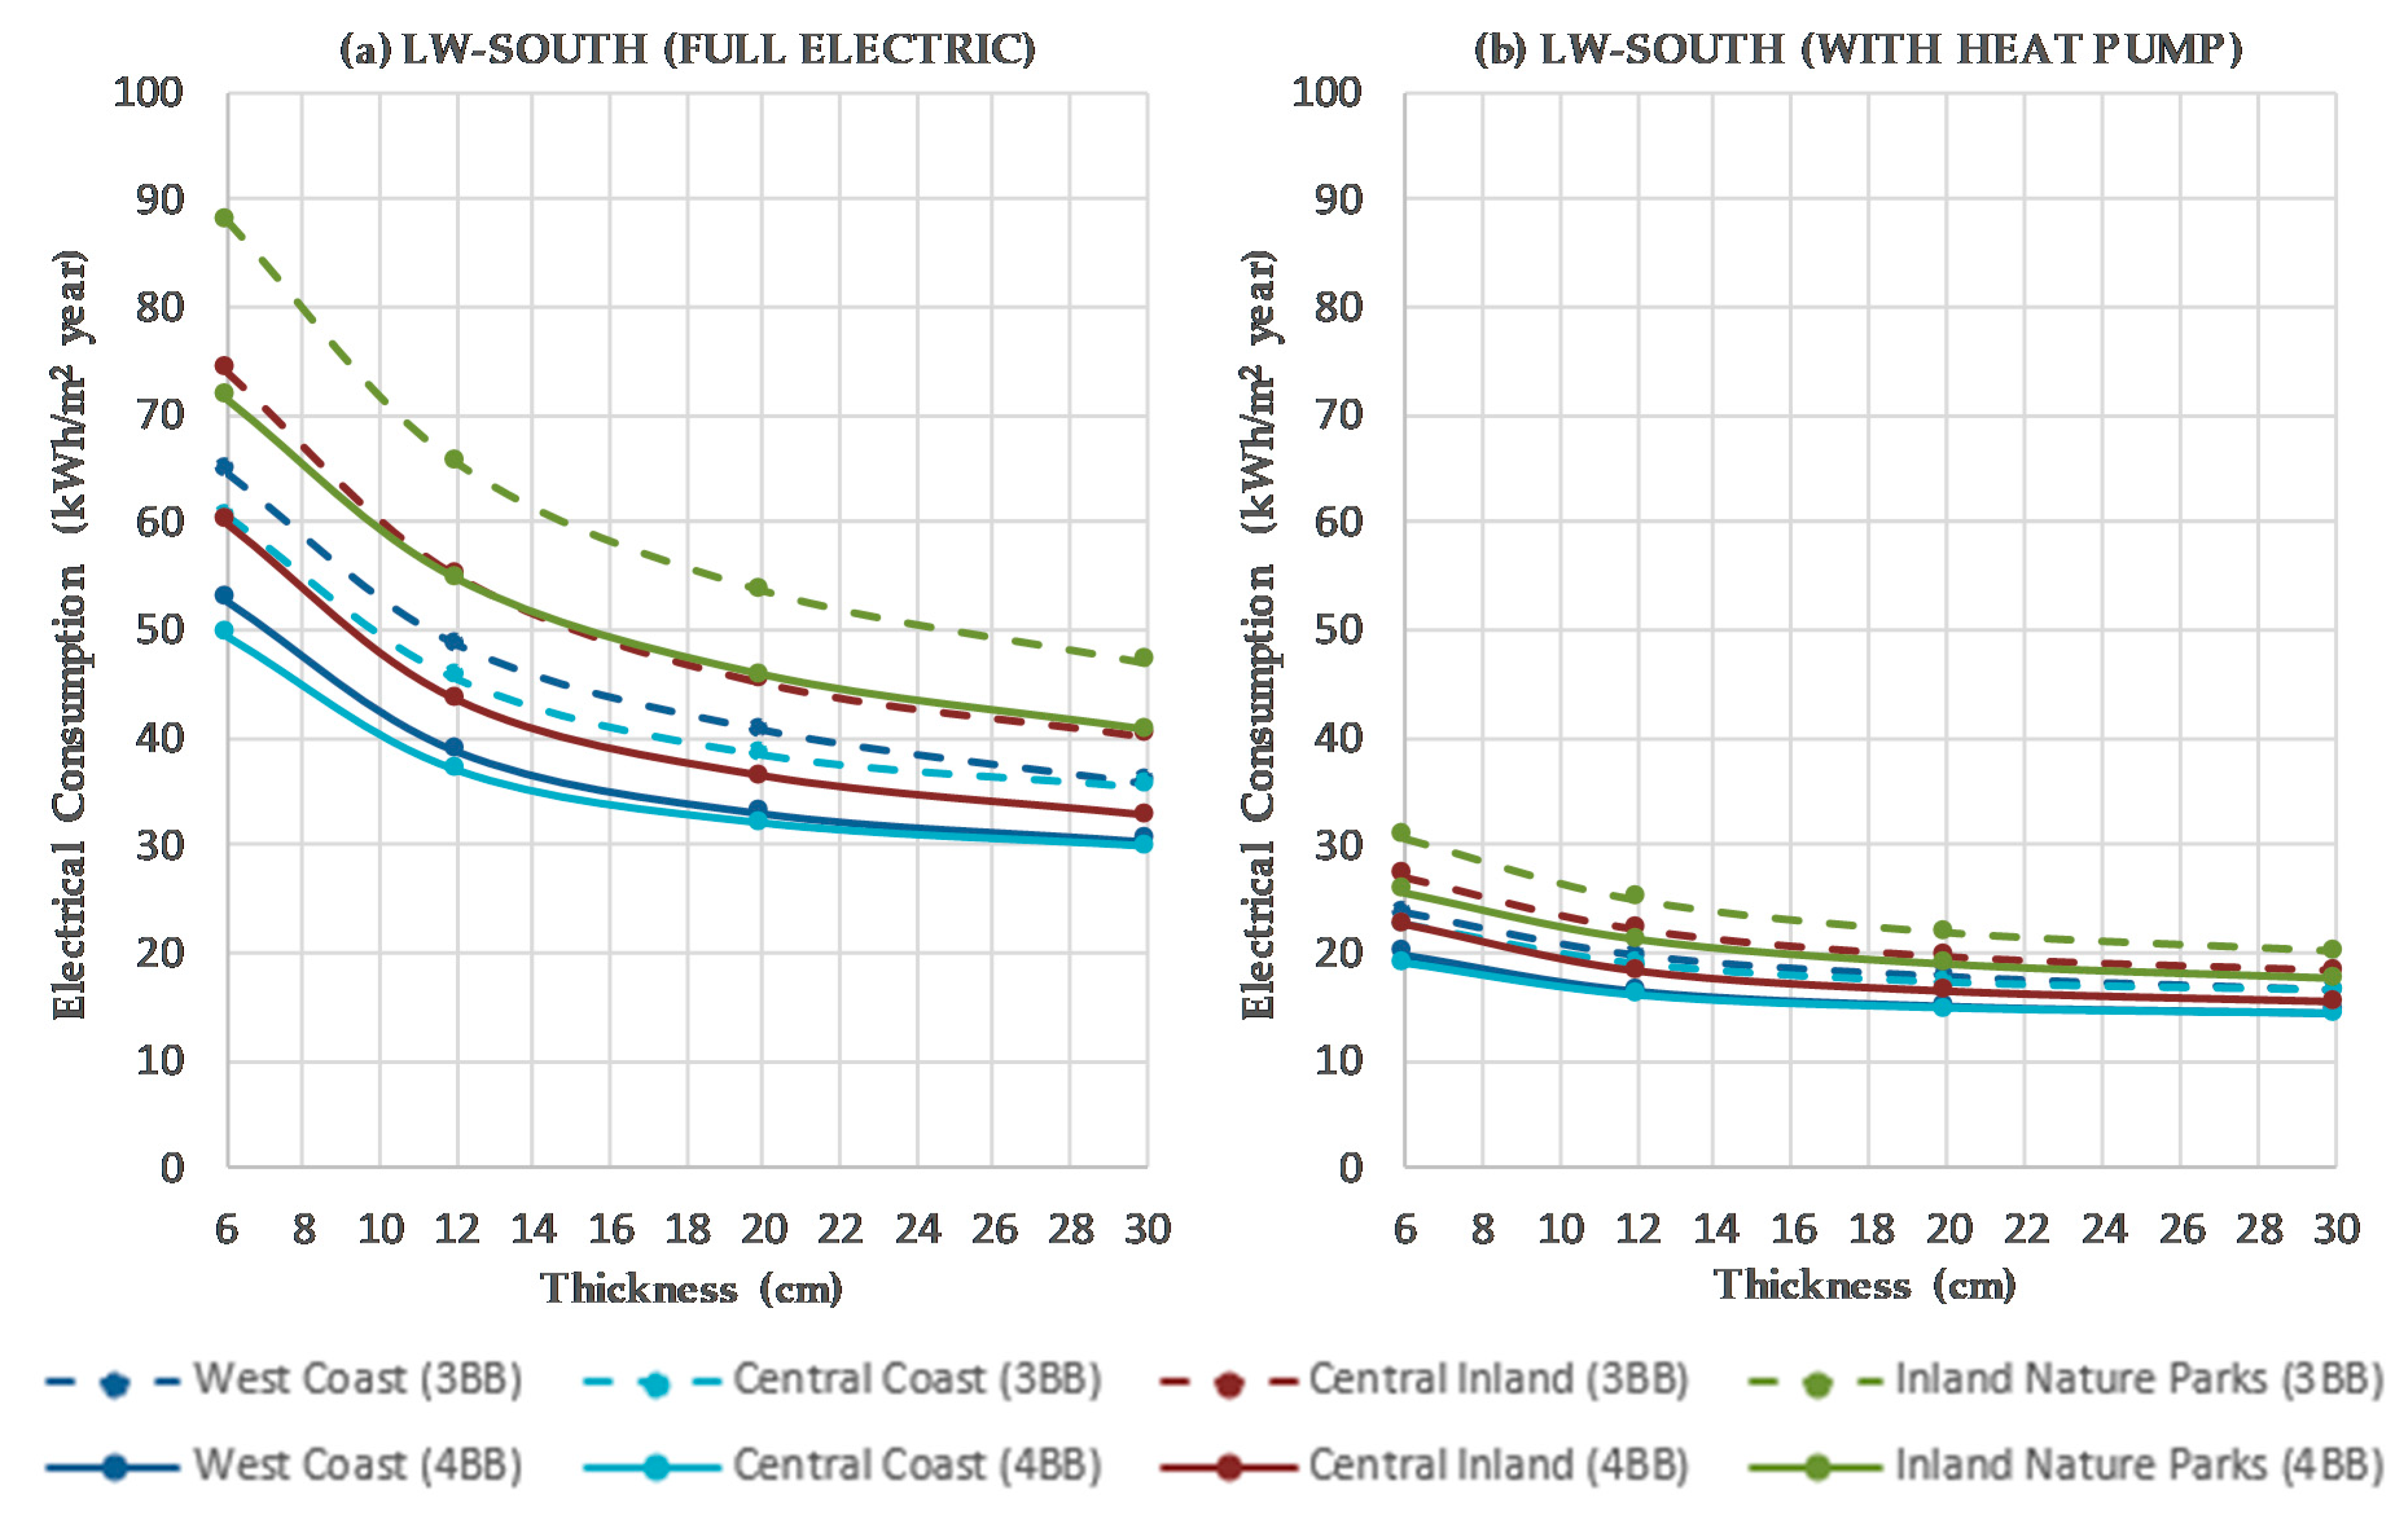
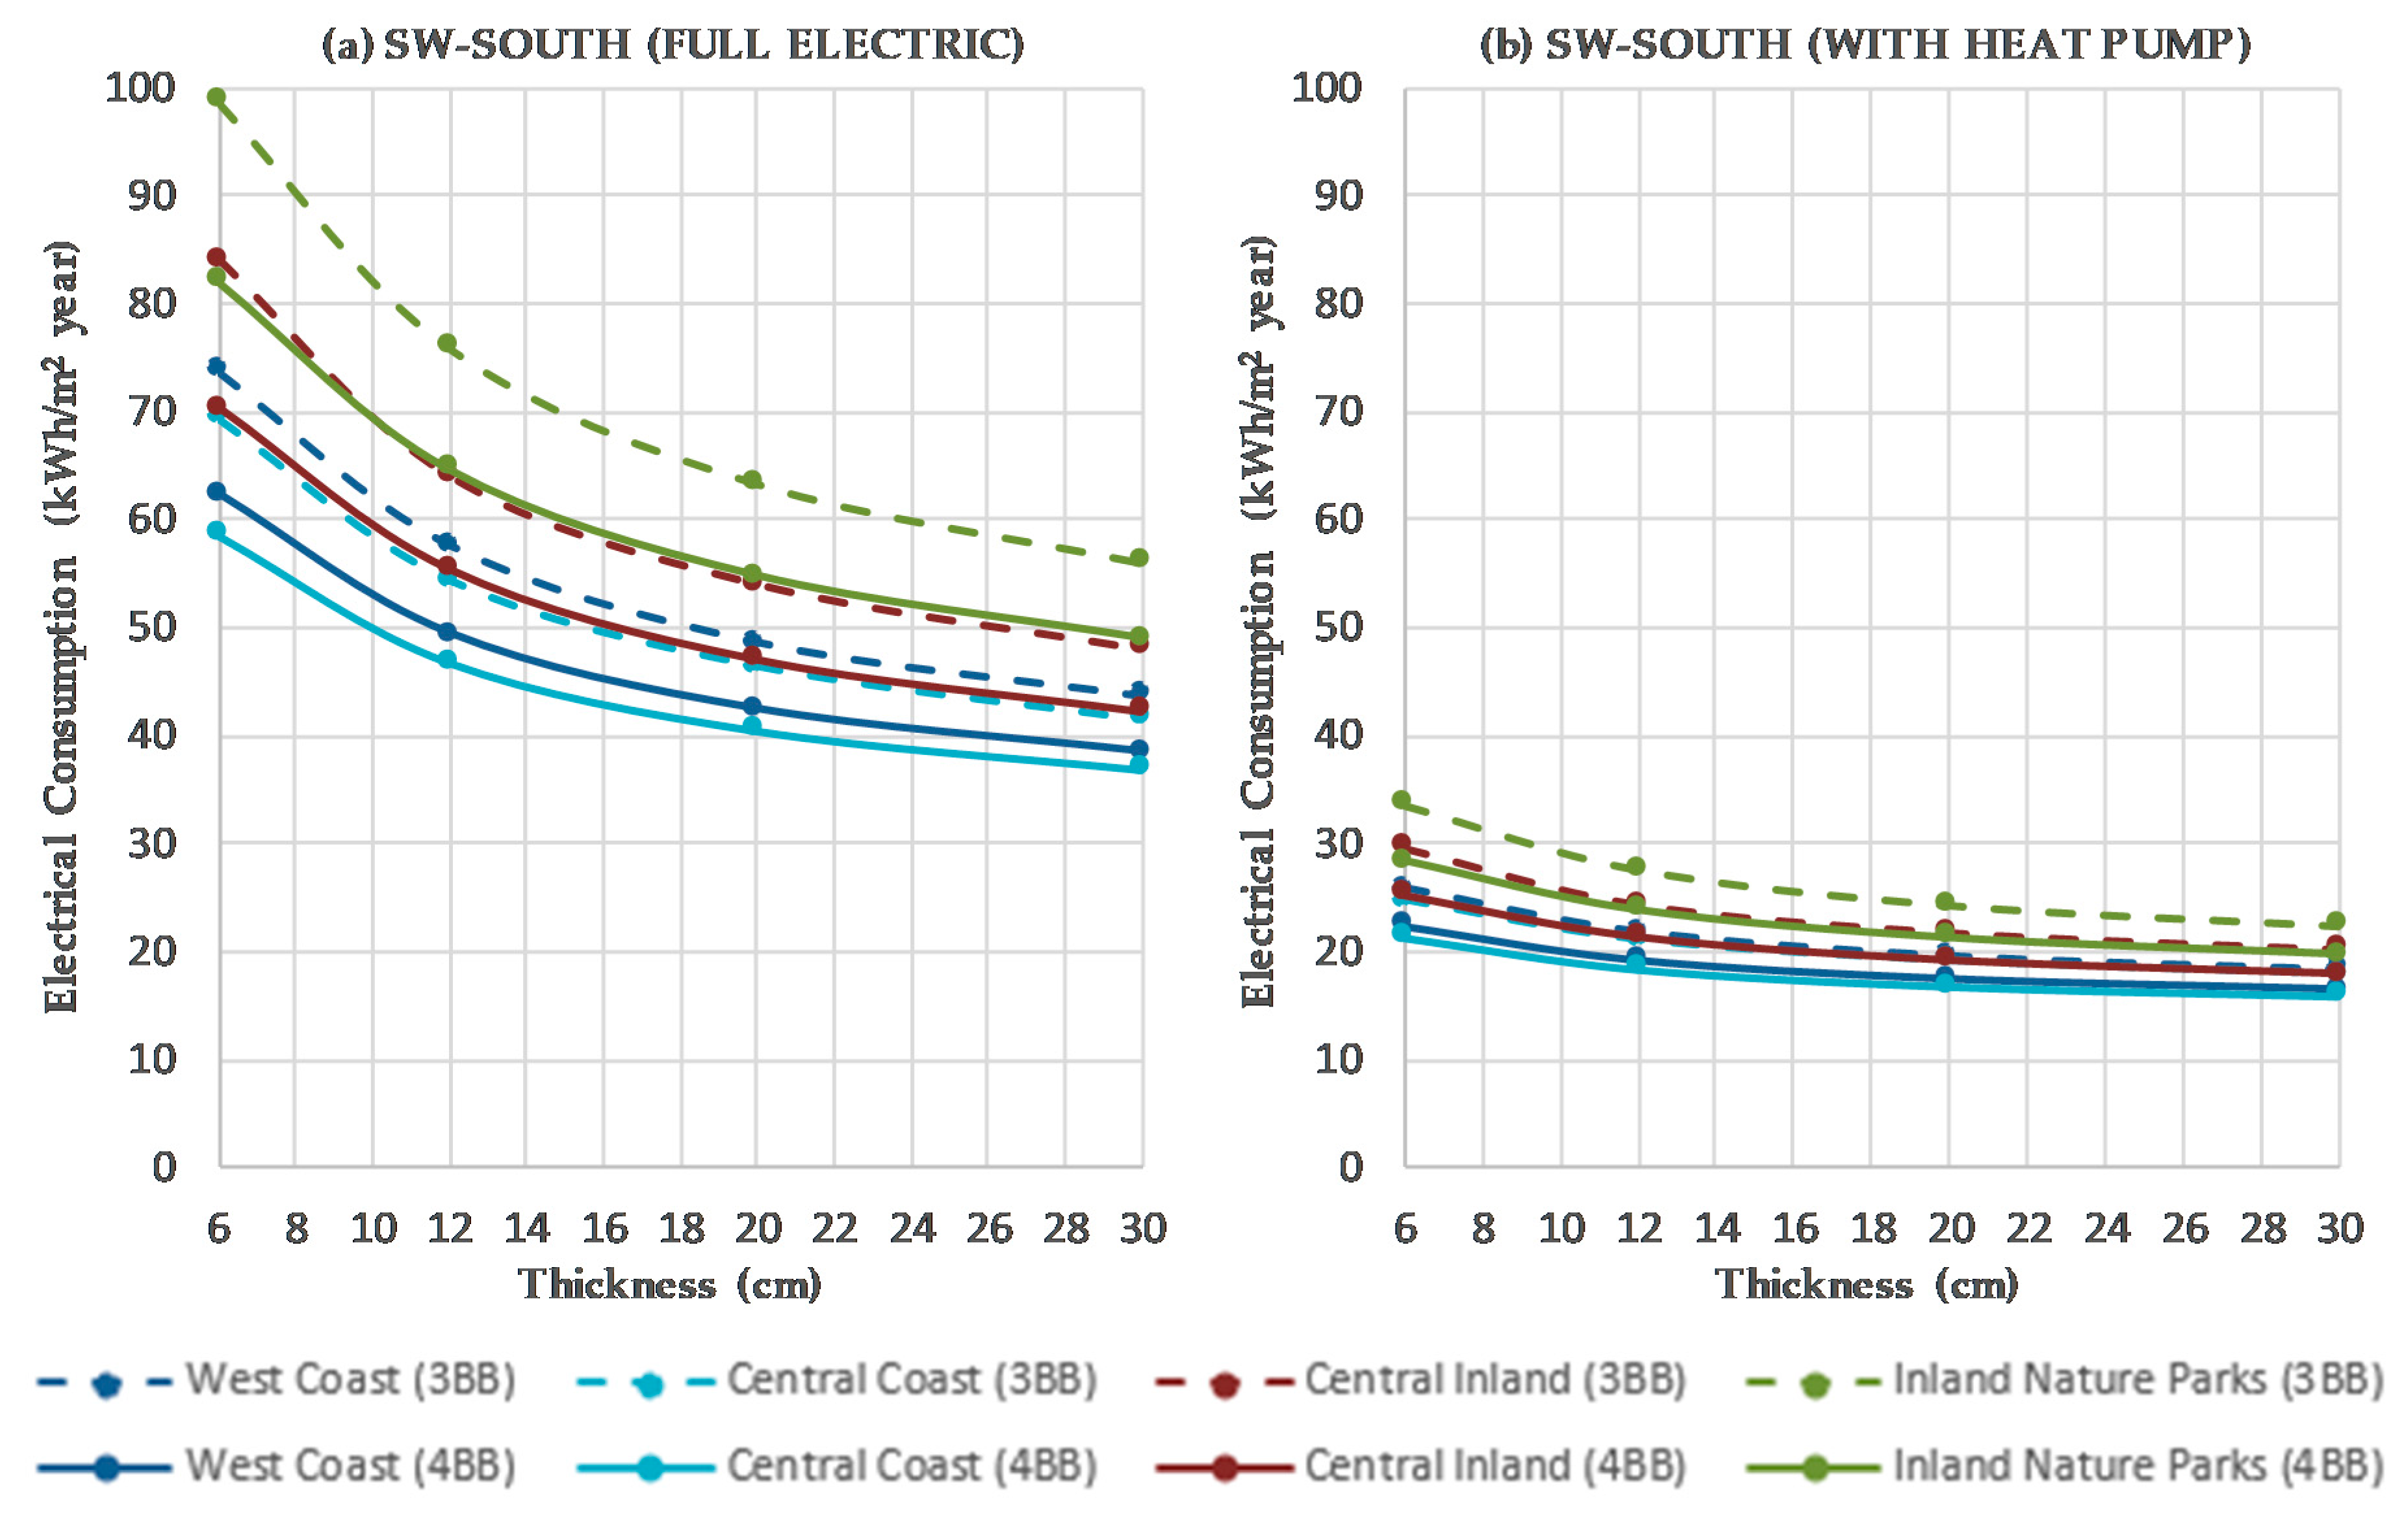
Table 1 shows parameters that define the thermal performance of the windows. The window-to-wall ratio (AWF) is defined in this paper as the ratio of the gross area of the windows facing south to the total area of the south facade. The solar gains depend on the glazing fraction (AGF), which is the glazing-to-wall area ratio for the south oriented facade. The buildings have a rectangular floor plan, with windows only on the north and south facades. Two cases were studied: large windows facing south and small windows facing north (LW-SOUTH), and small windows facing south and large windows facing north (SW-SOUTH). The average glass fraction (GFavg) considers the ratio of the overall glazing areas to the total wall area of the building. Similarly, the average frame fraction (FFavg) considers the ratio of the overall framed areas to the total wall area of the building. The transmittances are: Uf for the frame, Ug for the glazing and Uw_avg for the average of all windows. The values for both buildings are quite similar, the windows being somewhat larger for the 4BB. The windows use argon-filled triple glazing with a solar factor g = 0.51. The window frames are made of aluminium, with thermal bridge breaking, absorptivity = 0.4 and infiltration class = 4.
Table 2 contains the characteristics of the opaque components and the geometric values of the buildings: Aref_net is the usable area; Agross is the outer projection area; Atot is the total outer area of the envelope (i.e., the sum of areas of opaque elements in contact with the surrounding air: wall, roof and floor). The table also shows the shape factor, Fc, which is the ratio of Atot to the inner heated volume of the building, Vint. The shape factor and the window-to-wall ratio, AWF, are the two parameters that are most often taken into account when studying the performance of buildings. A compact shape (associated with a low shape factor) is desirable to minimize transmission losses. Concerning the influence of this factor, Albatici and Passerini [31] found it more important in cold localities and less important in mild and warm climates. The aspect ratio (L/W), which is the ratio of the building’s length to its width, is another parameter that is often considered to determine solar access to the building. In cold climates, the ideal L/W value for a rectangular shape ranges from 1.3 to 1.5, as cited in Premrov et al. (2016) [19]. However, the influence of the L/W ratio for mild and warm climates is not so well defined [12,32]. Area ratios for the wall (Fwall) and the roof (Froof) help interpret transmission losses. The overall opaque transmittance of the building, Uop_avg, depends on the thickness of the insulation, and for the present study ranges from 0.14 to 0.33 W/m2 K.

2.3. Materials and Properties

2.3.1. Construction Elements of the Building

Table 3 shows the life cycle inventory, with the areas of each constructive element, as well as the density, thickness and thermal conductivity of each layer of materials, all of which were obtained from the catalogue of construction elements [33]. The thickness of the expanded polystyrene (XPS) insulation installed on the building’s exterior is studied parametrically for each location. When the thickness of the XPS insulation is increased, maintaining the rest of the building elements the same, the transmittance values decrease accordingly. PHPP requirements are met for a thickness of about 20 cm: 0.130 W/m2 K for the floor and the external walls with internal lining, and 0.147 W/m2 K for the roof.

2.3.2. Active Technical Systems

The characteristics of the active systems that are used by each of the three thermal energy supply scenarios are found in Table 4. The energy systems are decentralized and the houses are equipped with a heat recovery ventilation unit. They include heat pumps, gas boilers, water heating tanks and pipes, as well as hydronic radiant floors that will be used with heat pumps or boilers. In the electricity-only scenario, the electricity is used as an energy source for: space heating by electric radiators (about 50 W/m2), DHW and LED lights (about 4 W/m2). The environmental behaviour depends on the embodied impacts (EP and GWP) of the materials that compose the active systems employed and therefore these impacts are included in the present study. Impact values for the active components were obtained from Ecoinvent v3.3 (2016) in SimaPro (aerothermal heat pump, gas boiler, hydronic floor, tank and ventilation unit) and Leskovar et al. [34] (electric radiators, piping, electric cables and LED lights).
The active components that comprise each scenario are as follows: (i) the electricity-only scenario comprises electric radiators, a ventilation unit, pipes, electrical cables and LED lights; (ii) the heat pump plus electricity scenario comprises a heat pump, hydronic floor, ventilation unit, pipes, tank, electric cables and LED lights; and (iii) the natural gas boiler scenario comprises a boiler, hydronic floor, ventilation unit, pipes, tank, electric cables and LED lights.

2.4. Climate Data

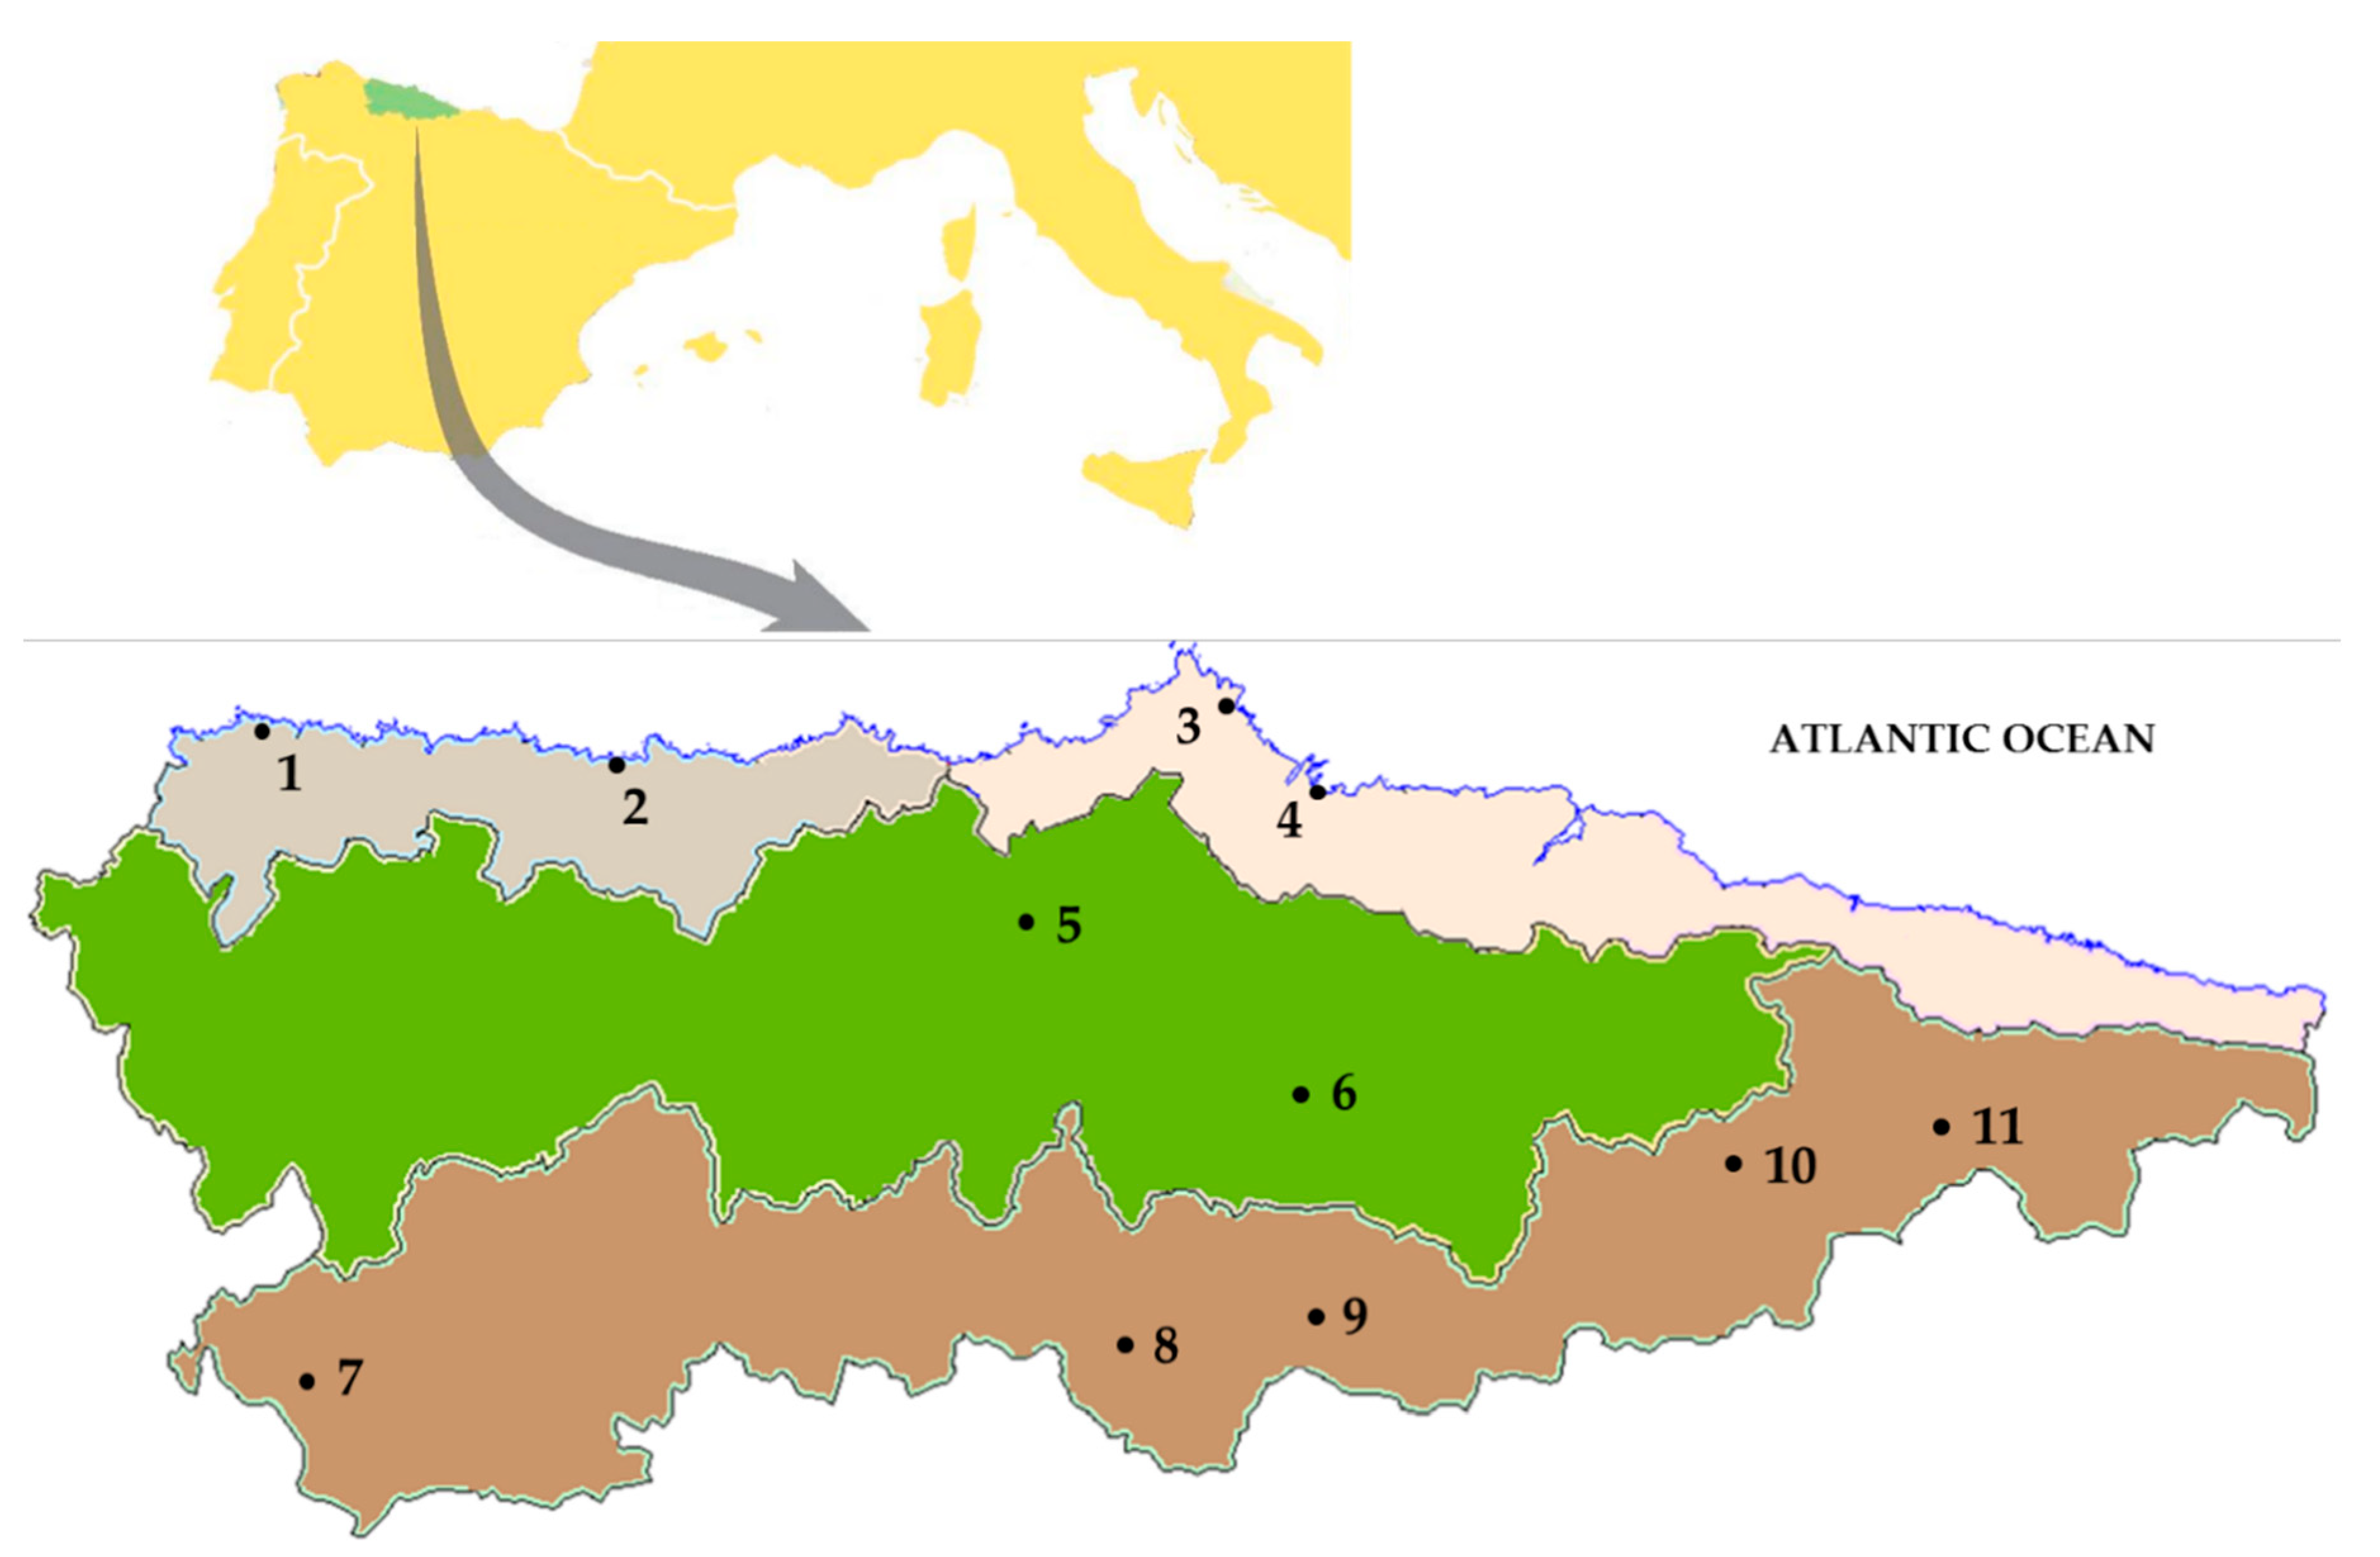
Asturias is located in the central region of Spain’s Atlantic coast, where the climate is Atlantic with mild winters and cool summers. According to the Köppen–Geiger Classification [35], part of the territory is Cfb (oceanic) and part is Csb (Mediterranean). The annual thermal oscillation is generally slight and there is abundant rainfall because of the proximity of the ocean. However, the orography is very rugged due to the presence of the Cantabrian Mountains. This context of coast and mountains so close together produces strong variations in altitude between locations and results in a variety of microclimates. In general terms, four main climatic sub-regions can be established: the coastal strip, highly influenced by the sea, with a more continental climate in the west; the central inland strip, with an oceanic climate, although not as influenced by the sea as the coast; and the mountain strip in the Cantabrian Mountains. The locations whose climatic data were studied are numbered from 1 to 11 in the map of Figure 3. The classification of the points into sub-regions, location names, geographical coordinates and altitudes can be seen in Table 5: Valdés, which is a typical tourist resort on the west coast; Gijón, also a tourist resort, which is located on the central coast and is the region’s largest city; Oviedo, the administrative capital, which is the second largest city in terms of inhabitants; and Ibias, a representative location in the mountains that comprise several areas listed as Nature Parks, which was chosen for its high altitude and very different climatic conditions.
Table 6 and Table 7 present climatic data for a representative location from each sub-region studied here. The data were obtained using the Meteonorm software [36]. Table 6 shows the following data for each period of thermal energy use (heating and cooling) and each sub-region: degree hours, solar insolation on the vertical planes (N, E, S and W) and global insolation on the horizontal plane. The degree hours are calculated as the sum over the period (heating or cooling) of temperature differences with respect to a reference temperature corresponding to each period (20 °C for the heating period and 25 °C for the cooling period). The heating period runs from the first day of October to the last day of May, and the rest is considered as the cooling period. Table 7 presents monthly averaged data for outdoor air temperature (Tamb) and dew point (Tdew) for the representative location of each sub-region. These data were obtained for open field landscapes.

2.5. Calculation of Heating and Cooling Demands

The software used to assess the energy performance of the houses was the Passive House Planning Package PHPP [27], in accordance with DIN EN ISO 13790 [26].
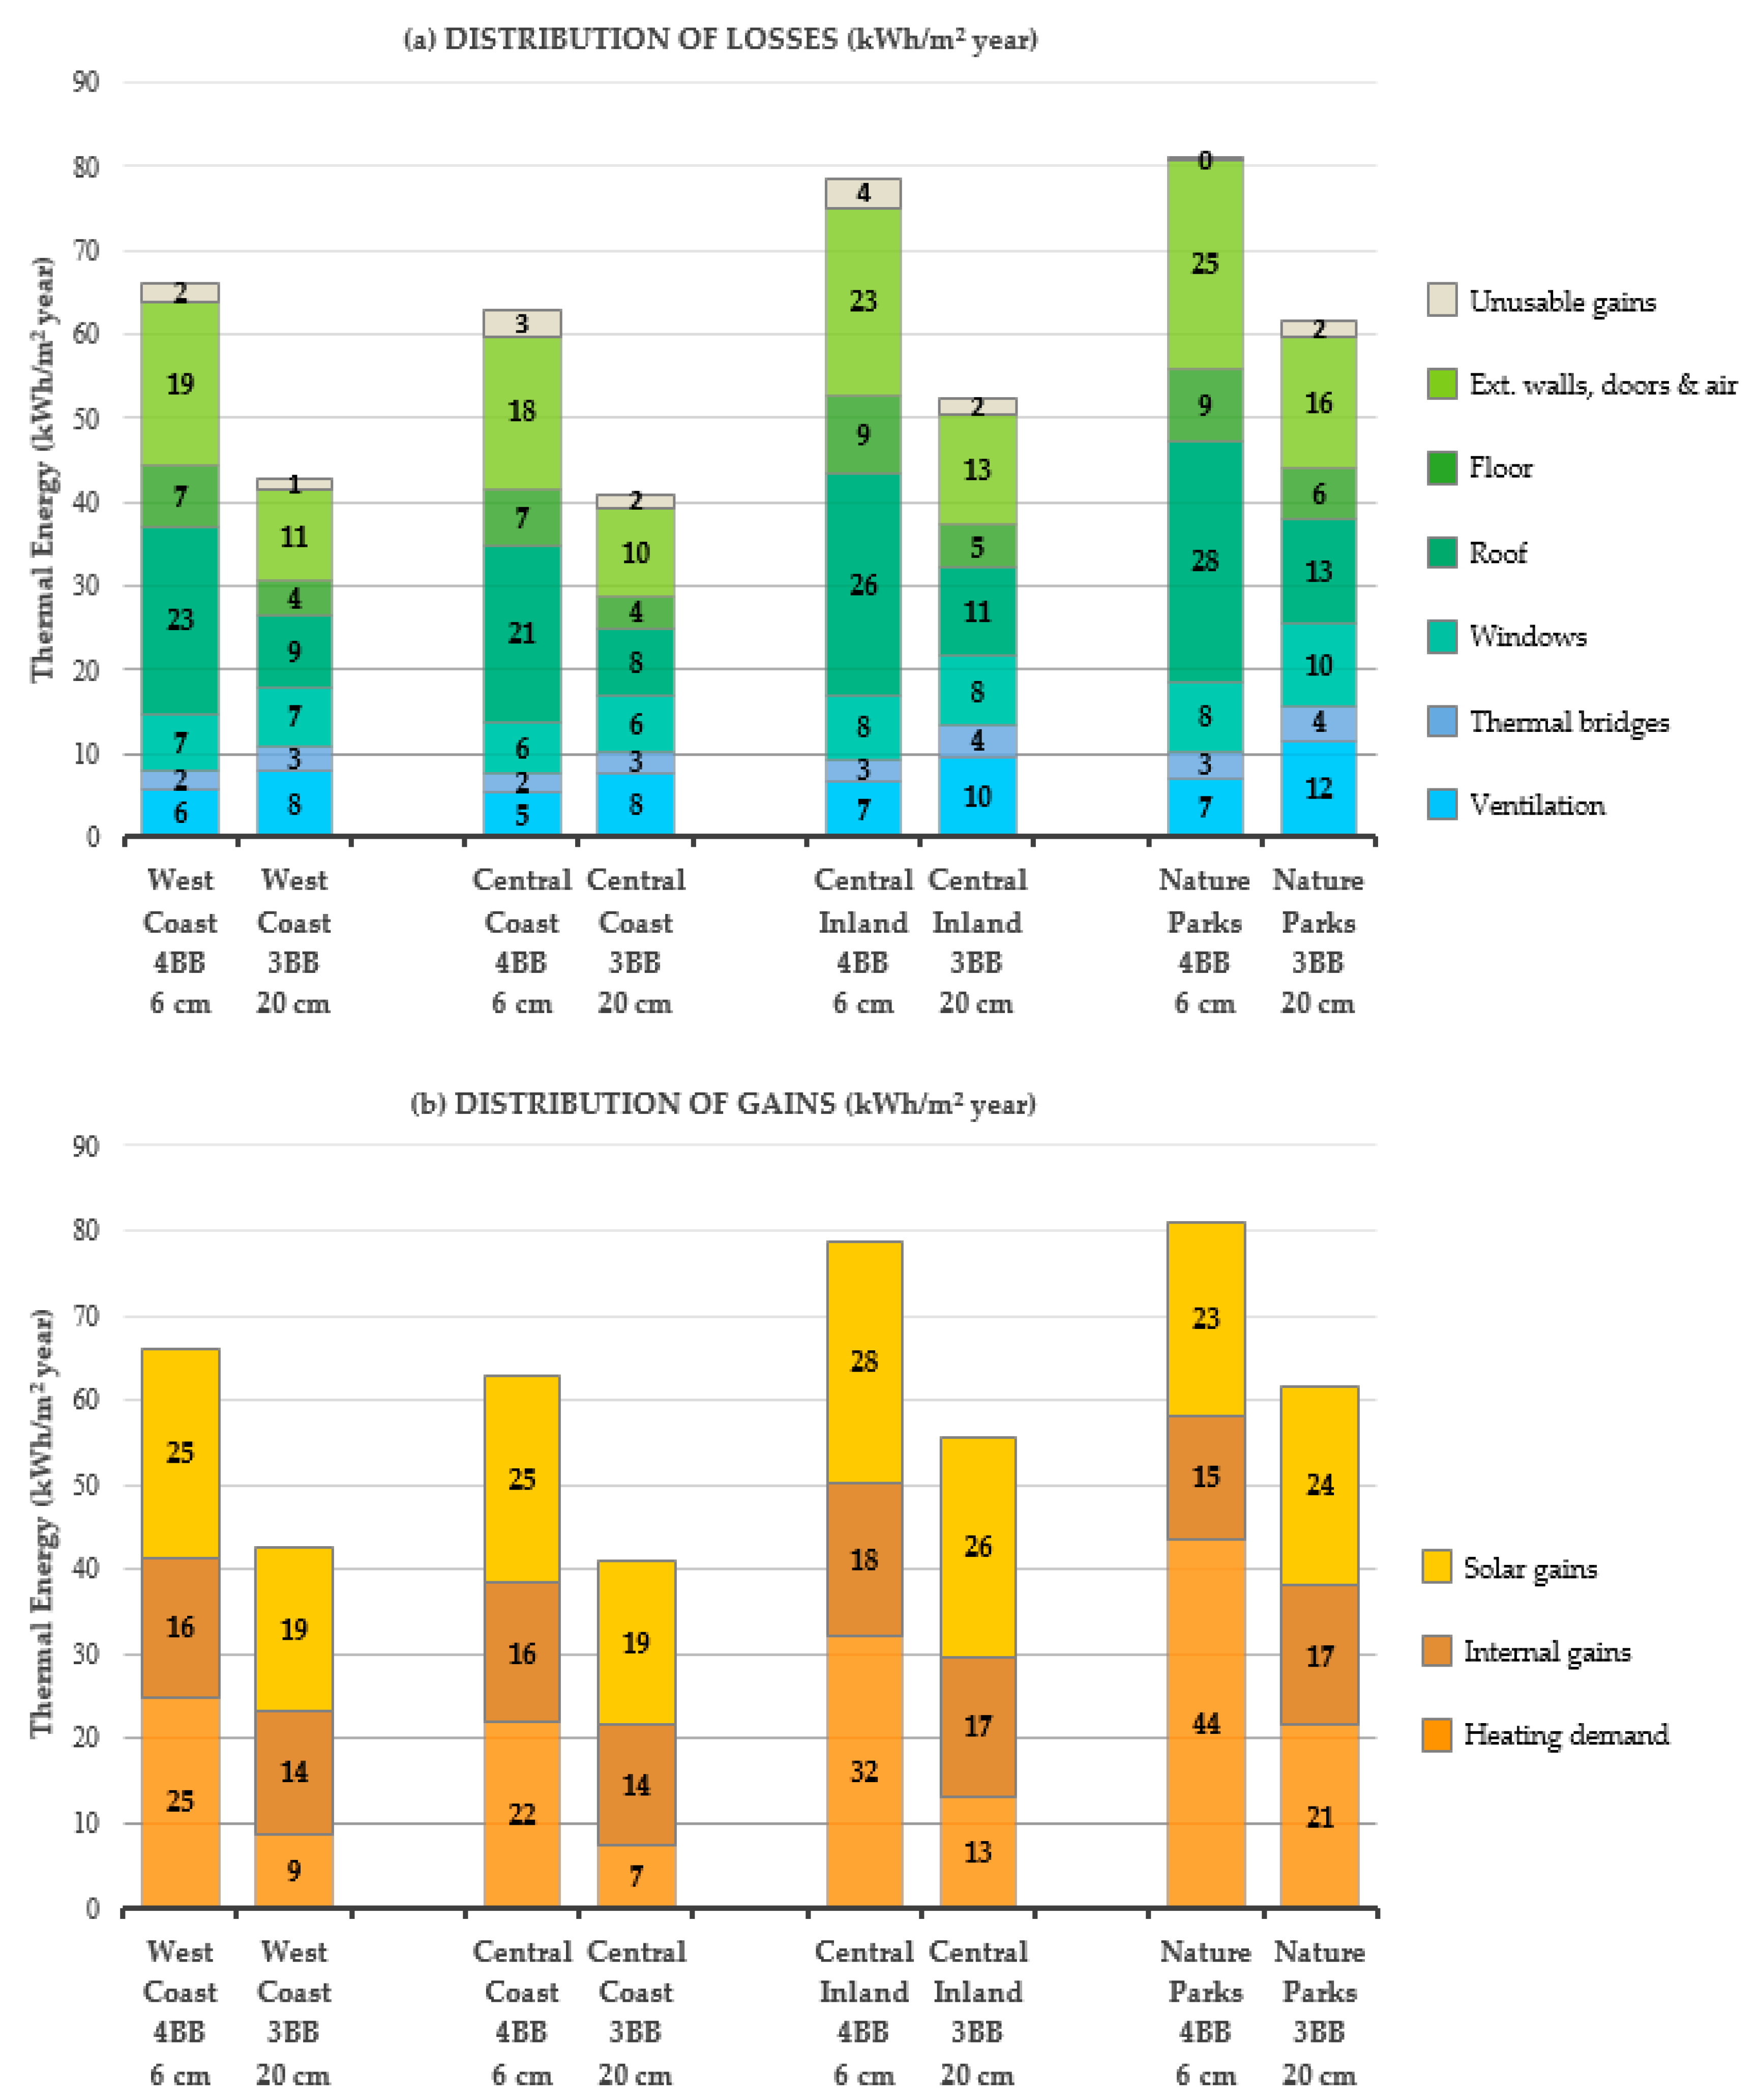
The energy balances were analysed and the results compared for the four sub-regions of different microclimates. Subsequently, the effect of climatic variation was investigated, expanding the number of situations. Finally, to achieve the best sustainability conditions, the influence of the insulation thickness was studied for two possible orientations of the building: with the largest windows facing south (LW-SOUTH) and with the smallest windows facing south (SW- SOUTH). The results were obtained using a monthly steady-state computing method, implemented in PHPP. The set point temperature is 20 °C for winter and 25 °C for summer. The infiltration rate is 0.6 h−1 and the ventilation rate was calculated using PHPP software according to the number of occupants in the house: five people for 4BB and three people for 3BB. An air-to-air heat recovery unit with 82% efficiency was considered.
The domestic hot water energy needs include usable hot water and losses due to distribution and accumulation. The usable DHW is calculated considering 25 litres per person per day, which means 23.06 kWh/m2 year for 4BB and 24.90 kWh/m2 year for 3BB. The heat losses in the distribution and in the storage tanks are respectively: 4.29 and 1.47 kWh/m2 year for 4BB and 5.17 and 1.88 kWh/m2 year for 3BB. This calculation was performed considering the following heat loss coefficients: 0.11 W/m K per metre of length of a pipe with an interior diameter of 0.014 m and 0.45 W/m K per metre of height of a tank with an interior diameter of 0.220 m. These heat loss coefficients were calculated using an auxiliary calculation tool in PHPP, for an insulation of 0.034 W/m K, with a thickness of 30 mm for the pipes and 60 mm for the tank.
An electrical consumption of 2.7 kWh/m2 year was added to the electrical energy needs for air conditioning and domestic hot water. This value, suggested in Leskovar et al. [34], corresponds to the ventilation unit (including heat recovery equipment) and LED lights. As for the rest of the household appliances, their energy consumption was not considered strictly associated with the characteristics of the building, so it was excluded due to the difficulty in establishing accurate data and the variability of both its performance and the occupants’ usage habits.
The service life, characteristics and software used to calculate the active systems are given in Section 2.3.2.

2.6. Life Cycle and System Boundaries

Concerns about environmental aspects have led to greater use of life cycle studies, with the impacts reflected in the environmental product declaration, EN 15804 [37], and the environmental performance of buildings, EN 15978 [38]. The life cycle assessment in this study is carried out from cradle–to-grave and focuses on the calculation of the following impacts: primary energy (EP) and global warming potential (GWP, i.e., CO2 equivalent emissions). The stages considered are: (i) manufacturing of components (A1 + A2 + A3), where A1 is the supply of raw materials, A2 is the transportation of raw materials and A3 is the manufacturing of the product; (ii) construction of the building, which consists of the transport of materials to the factory (A4) and the on-site erection of the building (A5); (iii) replacement (B5) of the active systems at the end of their service life, but not of the opaque elements of the building envelope, nor of the windows or coatings, since the durability of the chosen materials is greater than the lifespan of the building (50 years); and (iv) operational energy use (B6). To obtain the embodied primary energy and the CO2 equivalent emissions, the CypeCad “Archimedes” database [39], which implements ISO 14040 and 14044 standards [40,41], was used for the materials of the passive elements of the buildings, which are those included in the inventory of materials in Table 3.
The envelope as a whole is a 14 cm skin of lightweight concrete panel with expanded clay and includes the exterior walls, roof and floor. It is cladded with mineral wool and plasterboard on the inside and with expanded polystyrene (XPS) of different thicknesses on the outside. The walls that divide the interior spaces are 8 cm thick and are also made of lightweight concrete panels. The panels are reinforced with steel mesh during their manufacture.
As no data were found in the “Archimedes” database or in other sources on the impacts corresponding to the manufacture of lightweight reinforced concrete panels, or of other concretes that had a composition sufficiently similar to them, impact data were obtained from the composition of the panels, as explained below. The composition of lightweight expanded clay mortars was provided by the manufacturer Laterlite [42], while data on the reinforcing steel, for a square mesh of 10 x 10 cm with 4 mm diameter wire, were provided by the manufacturer [43]. The composition considered for the panels was: 22.0% Portland cement; 25.0% expanded clay; 83% water; 1.95% and 2.2% reinforcing steel for panels 8 and 14 cm thick, respectively; 1.4% hydrated lime; 0.2% organic chemicals; and the rest, up to 100%, of silica sand. The impacts for the 8 and 14 cm thick panels were obtained from these compositions using SimaPro and the Impact 2002+ method software (PRè Consultants, Amersfoort, The Netherlands), as well as the Ecoinvent v. 3.2 database. The resulting total impacts, per m2 of panel, for a panel lifespan of 50 years, were: 102.3 and 178.9 kWh/m2 for EP and 47.3 and 82.7 kg CO2 eq/m2 for GWP, for 8 and 14 cm thick panels, respectively.
The overall impacts were calculated taking into account the total amount of each material present in the building, and are expressed per m2 of usable floor area, which is the functional unit for all buildings.
All the products necessary to construct the building and their respective packaging are considered to be transported from the factory to the construction site by diesel trucks, with an average route of 80 km.
The calculation method and the service lives that were considered for the active systems are given in Section 2.3.2. The demolition and disposal stages were not considered in the present study, as they are of much less relative importance.

3. Results

3.1. Energy Use Assessment

3.1.1. Balances and Demands

The heating demand depends on the climatic data, construction elements and building design. Summer climatic severity is indicated by a number ranging from 1 (low severity) to 4 (high severity), according to the regulations in force in the Spanish Technical Building Code [24,44]. Asturias is assigned a value of 1, which indicates that the cooling needs are very low, so the cooling demand is not included in the present study. Table 6 presents climatic data obtained for the four representative locations. Both coastal locations have quite similar solar insolation during the heating period. However, insolation during the cooling period is higher on the central coast and consequently the degree hours are likewise greater there. The central inland location has a greater number degree hours per year during the heating period than the location on the central coast. Nevertheless, the number of degree hours per year during the cooling period is lower in the central inland area, because of the increasing distance from the coast. The location in the inland nature parks has more degree hours and days of heating and less cooling degree hours than the location in the central inland area. Therefore, the nature parks sub-region is expected to have higher heating needs than the central inland location and much higher needs than the coastal locations.
Temperatures in the central inland area are higher in the winter months than in the nature parks, while this trend is reversed in the summer months. The dew point is higher on the central coast than on the west coast, with a higher risk of condensation due to moisture. The dew point in the nature parks is much lower than at the other locations, so the risk of condensation due to moisture is lower there.
The energy balances for the representative locations are shown in Figure 4. The analysis was conducted at these locations for 4BB (to e XPS = 6 cm) and 3BB (to e XPS = 20 cm) in order to highlight the differences. These cases correspond to the extreme values of the Fc and Fwall parameters in Table 2: a shape factor (Fc) of 1.02 (4BB, 6 cm) and 1.34 (3BB, 20 cm) and an area ratio (Fwall) of 1.13 (4BB, 6 cm) and 1.66 (3BB, 20 cm). Total gains and losses vary for each sub-region, with the greatest differences among sub-regions being for 3BB (due to its higher Fc). Location in the nature parks increase 29% for 4BB and 50% for 3BB with respect to the central coast.
Heat losses are represented in Figure 4a. The most significant are transmission losses. External wall losses are very important, along with roof losses. Roof losses are the greatest for the 4BB building, because it has less insulation. For the 3BB building, which has more insulation, these losses are less important, although losses for the walls are greater than for the roof. Relative losses through the floor are not very great in either type of building, being somewhat higher in the nature parks. Transmission losses through windows vary little with the type of building, except in the case of the nature parks, and, like other transmission losses, they become greater when shifting from the coast to the inland nature parks. The percentages of transmission losses with respect to total losses are higher for 4BB, which has less insulation, ranging from 87% on the central coast to 91% in the nature parks. Changes are minor for 3BB and range from 77% on the central coast to 78% in the nature parks. Therefore, as the insulation increases, the percentage that the transmission losses represents decreases and the differences between locations are smaller. Ventilation losses are essentially due to the increase in the number of occupants from 3 to 5 and the amount of air that enters due to infiltration, which increases with the size of the house, as it depends on its interior volume. However, when the calculation refers to the usable area, the 3BB presents higher values. When the location of the house changes from the central coast to the nature parks, the losses increase 36% for 4BB and 57% for 3BB due to the change in climate between these locations.
The heat gains are presented in Figure 4b. The most important are the solar gains, which for 4BB represent values comparable to the heating demands of the building, even with the thinnest insulation, except for the case of the nature parks, where the solar gains provide slightly more than half of the energy to be supplied for heating. For 3BB, the solar gains are much higher than the heating requirements, except for the case of the nature parks, where both magnitudes are similar, although the solar gains are somewhat higher. As for internal gains, these are similar for 4BB and 3BB and vary somewhat with climate and insulation. The calculated trends in heating demands considering the effects of the shape factor (Fc) and the area ratio (Fwall) are in agreement with Premrov et al. [19,32] and Takano et al. [12], who studied the variation of these factors for different types of buildings and climates.
Table 8 presents the heating and domestic hot water (DHW) demands for the eleven locations in the different sub-regions. At all the locations, the heating demand for the same insulation thickness is higher for 3BB, which has higher Fc values. It has also been shown in all eleven cases that the heating demand depends inversely on the shape factor, as noted in Premrov et al. (2016 and 2018) [19,20,21,22,23,24,25,26,27] and Takano et al. [12]. Concerning conformity with PHPP standards, for 12 cm thick or more insulation, demand is less than or equal to 15 kWh/m2 year for 4BB in three of the sub-regions: west coast, central coast and central inland. However, in these three sub-regions, 3BB has a higher demand and at least 20 cm of insulation thickness would be required to reduce demand to 15 kWh/m2 year or less. A special case is that of the nature parks, which have the highest thermal demands and require 30 cm of insulation. However, using such thick insulation in these locations increases the chance of overheating, so changes in the size and location of windows are likely to be required.
The calculation of domestic hot water includes the water consumption associated with the number of occupants of the house, plus the heat losses in the distribution of the water circuit and the water tank. It can be seen that this demand is very important for both houses and becomes relatively more important with increasing insulation. This was also highlighted in Hassel’s technical note [45], which argues that, in UK households and in passive housing standards, DHW demand becomes more important as insulation increases. In passive house standards, DHW almost doubles heating needs, so it is very important to address this concept in passive houses. Therefore, in order to reduce the energy consumption for DHW, it would be necessary to additionally use other complementary renewable energy systems (e.g., photovoltaic or thermal solar panels).

3.1.2. Electricity Consumption

Three scenarios are considered to meet heating and DHW demands: (i) “Electricity only”, in which the total thermal demand is supplied only by electricity; (ii) “Heat pump + electricity”, in which the thermal demand is supplied by a heat pump, which heats the water up to 45 °C (for low temperature heating), plus the electricity to power an element that heats the water from 45 °C to 60 °C necessary to store DHW; and (iii) “natural gas boiler”.
The study includes the electricity-only scenario because, although it is not very common in single-family homes, it may become a very appropriate option in the future, seeing as the decarbonisation policies of European countries contemplate generating electricity with a significant amount of use of renewable energy for the 2030 and 2050 horizons.
Figure 5 and Figure 6 show the variation in the consumption of electrical energy with respect to the thickness of the insulation, respectively considering electricity only and heat pump plus electricity. Figure 5 corresponds to the case where the south-facing windows are the large ones and Figure 6 represents the case where south-facing windows are the small ones.
The same heat pump was considered for 4BB and 3BB, employing a seasonal coefficient of performance of 4. The curves representing the behaviour of 3BB are above those corresponding to 4BB, which means that 4BB has a better use of energy (due to its lower FC value), regardless of the insulation thickness. The comparison between locations indicates that the lowest values are obtained for the central coast, followed by the west coast (both have very close values, the difference being slightly greater for 3BB). The difference in consumption is slightly greater for the central inland location and increases considerably in the location of the nature parks, which is further from the coast and at a higher altitude. As the thickness increases, all locations show very similar behaviour. Although consumption is influenced by DHW demand, DHW values practically do not vary with location and are essentially a function of the occupancy (higher for 4BB than for 3BB).
The heat pump significantly reduces the consumption of electrical energy, as it uses renewable energy. In fact, comparison of the two graphs shows that consumption is divided by a factor of at least two, being almost three for the lowest insulation thickness. The heat pump reduces the environmental impacts caused by electricity consumption during the stage of use of the buildings in the same proportion.
The effect of variation in the size of the south-facing windows can be appreciated by comparing Figure 5 and Figure 6. This effect is quite relevant on the consumption of electrical energy, although its magnitude depends on the insulation thickness. Considering, for example, the location on the central coast, when shifting from small south-facing windows (SW-SOUTH) to large south-facing windows (LW-SOUTH), the consumption for 4BB ( e XPS = 6 cm) decreases 18.59% when using electricity only and 11.99% when using a heat pump plus electricity; while the consumption for 3BB ( e XPS = 30 cm) increases 23.81% when using electricity only and 12.42 % when using a heat pump plus electricity.

3.1.3. Natural Gas Consumption

The behaviour for the scenario with a natural gas boiler is similar to that obtained for the electricity-only scenario, but the amount consumed in the case of gas increases because the thermal performance coefficient considered for the condensation boiler is 0.92 (in terms of the gross calorific value), which is less than 1 (the performance for the electricity only scenario).

3.2. Buildings Impacts

3.2.1. Construction of Buildings

Figure 7 shows the results of the embodied energy and CO2 equivalent emissions taking into account the stages of manufacturing, transportation and construction of the building components. The impacts also take into account the inventory of materials in Table 3, along with the areas and thicknesses of those employed. The total values of the impacts of the components refer to the usable area of each building, as stated in Section 2.6. The label “Total” indicates the global impact of the building. The components of the construction elements are grouped into the categories indicated in the figure to highlight their impacts, rather than those of the construction elements. The categories considered and the percentages for 4BB of EP and GWP are respectively: the envelope (reinforced lightweight concrete in exterior walls, roof and floor slab), 53 and 61%; mortar, 5 and 4%; vertical partitions of reinforced lightweight concrete, 6 and 7%; external walls (cladded on the inside) and horizontal partition of the attic; insulation (XPS) and polymer membranes, 16 and 9%; glazing panels, 1 and 1%; carpentry, 6 and 8%; coatings, 6 and 5%; and the roof (except XPS insulation and reinforced lightweight concrete), 1 and lower than 1%. The components that contribute the most are: the panels of the envelope, which are lightweight concrete (14 cm thick); the interior partitions, which are also lightweight concrete (8 cm thick); the sum of the insulation (XPS), the claddings and the horizontal partition, which includes glass wool; and the sum of carpentry and glazing.
Table 9 shows the embodied impacts for primary energy and CO2 equivalent emissions according to the type of house and insulation thickness ( e XPS = 6 to 30 cm) for the building components. The impacts for the three stages were added: manufacturing of components (A1 + A2 + A3), transport (A4) and construction (A5). As with active systems, disposal was not considered. Insulation was shown to be one of the building components that generates the greatest impacts, which increase with the thickness used: for 4BB, a change in thickness from 6 to 30 cm increases EP by 64.43% and GWP by 34.59%; for 3BB, the increases are 63.39% for EP and 33.87% for GWP.
Table 10 presents the embodied impacts for primary energy and CO2 equivalent emissions according to the active system used. The impacts for the three stages were added: manufacturing of components (A1 + A2 + A3), transport (A4) and construction (A5). For both types of building, the impacts of the heat pump and gas boiler scenarios are greater than those of the scenario with electricity only, which is consistent with the greater complexity and quantity of materials used (heat supply equipment plus hydronic soil). It can be seen that: (i) the increase in embedded impacts due to active systems is slightly higher for the 3BB building; and (ii) the increases are greater in GWP than in EP. The increase in GWP ranges from 62.42% (3BB building with natural gas boiler) to 82.22% (4BB building with heat pump). The increase in EP ranges from 35.47% (4BB building with heat pump) to 42.53% (3BB building with natural gas boiler).

3.2.2. Embodied and Use Impacts

Figure 8 and Figure 9 show the impacts EP and GWP due to the operational and embodied life cycle stages considering the scenarios of electricity only and heat pump plus electricity, respectively. Values were obtained using passage factors from final energy (energy consumption) to primary energy and from final energy to CO2 equivalent emissions. These factors were calculated in [46] according to the Spanish electricity mix in 2018 and applying SimaPro software. The factors used are: 2.133 KWh EP/kWh consumed and 0.347 kg CO2 eq/kWh consumed. Previous factors available for 2016 in [25] are: 2.403 KWh EP/kWh consumed and 0.357 kg CO2 eq/kWh consumed.
In Figure 8, which corresponds to the electricity-only scenario, it can be seen that the impacts of use vary greatly with location and thickness of insulation. Total impacts for EP vary from a minimum of 108 kWh/m2 year for 4BB on the central coast, to a maximum of 224 kWh/m2 year for 3BB in the inland nature parks. On the other hand, total impacts for GWP vary from a minimum of 23 kg CO2 eq/m2 year for 4BB on the central coast to a maximum of 42 kg CO2 eq/m2 year for 3BB in the inland nature parks. As shown in the graph, the EP impact of the use stage of buildings is always greater than that of their construction stages (including thermal systems), which represent embedded impacts. Likewise, the GWP impact due to the use stage is greater than that of the embodied impact, except for high thicknesses, where the use impact curves intersect with the embodied impact curves. For the central coast, the intersection corresponds approximately to e XPS = 25 cm for 4BB and e XPS = 26 cm for 3BB. For locations with higher demand, such as the central inland area, the intersection corresponds to e XPS = 30 cm for 4BB, and no intersection occurs for the location in the nature parks.
Figure 9, which represents the impacts of the heat pump plus electricity scenario, shows that the variation in use impacts with location and thickness is much lower than in the other two power system scenarios. Total EP impacts range from 72 kWh/m2 year (4BB on the central coast) to 86 kWh/m2 year (3BB in the inland nature parks). In terms of total GWP impacts, they range from 14 kg CO2 eq/m2 year (4BB on the central coast) to 22 kg CO2 eq/m2 year (3BB in the inland nature parks). The EP impact curves of the use stage and those of the construction stages of buildings (including thermal systems) intersect significantly in the analysed range of thicknesses. On the central coast, the intersection corresponds to about 18 cm for 4BB and about 20 cm for 3BB. For places with higher demand, the intersection occurs for a thickness of about 22 cm in the central inland area and about 30 cm in the inland nature parks. The impact of the GWP of the use stage is less than the embodied impact and there is no intersection of the curves, except for 4BB in the inland natural parks when the thickness is low.
Figure 10 shows the impacts due to the operational energy considering the scenario of thermal demand covered with natural gas. Values were obtained using conversion factors from final energy (energy consumption) to primary energy and from final energy to CO2 equivalent emissions, as in IDAE (Institute for the Diversification and the Energy Savings) [25]. The latest factors available for natural gas correspond to 2016 and are: 1.195 KWh EP/kWh consumed and 0.252 kg CO2 eq/kWh consumed. The behaviour is intermediate between the two previous scenarios. Total impacts for EP range from 78 kWh/m2 year (4BB on the central coast) to 135 kWh/m2 year (3BB in the inland nature parks), while total impacts for GWP vary from 20 kg CO2 eq/m2 year (4BB on the central coast) to 28 kg CO2 eq/m2 year (3BB in the inland nature parks). In this scenario, both in the case of EP and that of GWP, the embodied impact curves intersect those of the use impact, except in the case of EP in the interior nature parks. EP curves intersect when the insulation thickness is around 26 cm. GWP curves intersect for a thickness of about 10 cm in coastal areas and about 20 cm in inland natural parks.
Figure 11 plots the electricity-only scenario for the 2030 horizon if the Spain’s decarbonisation plan in [23] is implemented. The coefficients of passage were obtained from [46], applying the SimaPro software for the electricity mix proposed for 2030, the forecast coefficients being 1.007 KWh EP/kWh consumed and 0.149 kg CO2 eq/kWh consumed. In relation to the coefficients of passage for natural gas, these are kept constant. This scenario notably improves the impacts that are currently obtained with the 2016 passage factors, the behaviour being close to that of the heat pump at present, although with somewhat greater impacts on primary energy. EP impacts are similar to those of the natural gas boiler scenario. However, the positive effect of this system lies in the GWP impact value, which is close to that of the heat pump and is much lower than that obtained for the natural gas boiler scenario.

3.3. Ratios of Impacts

The ratios of impacts are calculated by dividing the impacts of use by the total impacts (embodied in building materials and active systems plus use) from data plotted of primary energy and CO2 equivalent emissions in Figure 8, Figure 9, Figure 10 and Figure 11.
Two criteria, applied to each energy supply scenario, are followed for the discussion of the results: (i) calculation of the average values considering all the thicknesses, sub-regions and buildings; and (ii) analysis of the maximum and minimum values considering each mode of energy supply. The results are shown in Table 11.
The average impact ratios for EP vary from 55.4% for heat pump plus electricity to 74.2% for electricity only, for the electricity mix in 2018. The EP value for the electricity-only scenario in 2030 is low: 59.4%, indicating that the effects of decarbonisation may lead to considering electricity as an environmentally-friendly scenario. As for the GWP average impact ratios, these decrease from 59.3% to 38.0% for the electricity-only and heat pump plus electricity scenarios in 2018, respectively. It is well known that the implementation of the Spanish decarbonisation plan may make the electricity-only scenario more environmentally friendly than the use of a natural gas boiler by 2030.
The maximum values of the proportions of impacts correspond to 3BB with 6 cm thick insulation in the nature parks, the case in which EP varies from 69.9% (heat pump plus electricity, in 2018) to 86.7% (electricity only, in 2018) and in which GWP varies from 50.0% to 75.0% in line with the same energy scenarios as EP. The minimum values of the impact ratios correspond to 4BB with 30 cm thick insulation on the central coast, the best scenario being the heat pump plus electricity in 2018, which has EP = 46.0% and GPW = 30.9%, followed by the electricity-only scenario in 2030, which has EP = 47.0% and GPW = 30.5%. Concerning the effects of the microclimate, 4BB presents higher percentages of improvement in impact ratios than 3BB with increasing insulation thickness, the percentage improvement being greater for the heat pump plus electricity scenario.
These findings demonstrate that the electricity-only scenario can be very suitable versus the gas boiler. However, the impacts of the electricity-only scenario will always be greater than those of the heat pump scenario, since if the electricity mix is improved, the improvement will also have a favourable effect on the heat pump impacts. On the other hand, the energy obtained from the air must also be taken into account. One of the aspects in which the heat pump could be disadvantageous compared to the electricity-only scenario, would be damage to the ozone layer, which is a very important impact to consider.

4. Discussion

In the calculation of use demands, the importance of the demand for DHW was highlighted for the studied buildings, which have a high level of insulation. The demand for DHW is twice that of the demand for heating, a fact that has also been highlighted in Hassell for other buildings with a high level of insulation [45]. The heating demands calculated in this paper for sub-regional Atlantic climates depend inversely on the shape factor, as observed for other buildings and climates in Premrov et al. (2016 and 2018) [19,20,21,22,23,24,25,26,27] and Takano et al. [12].
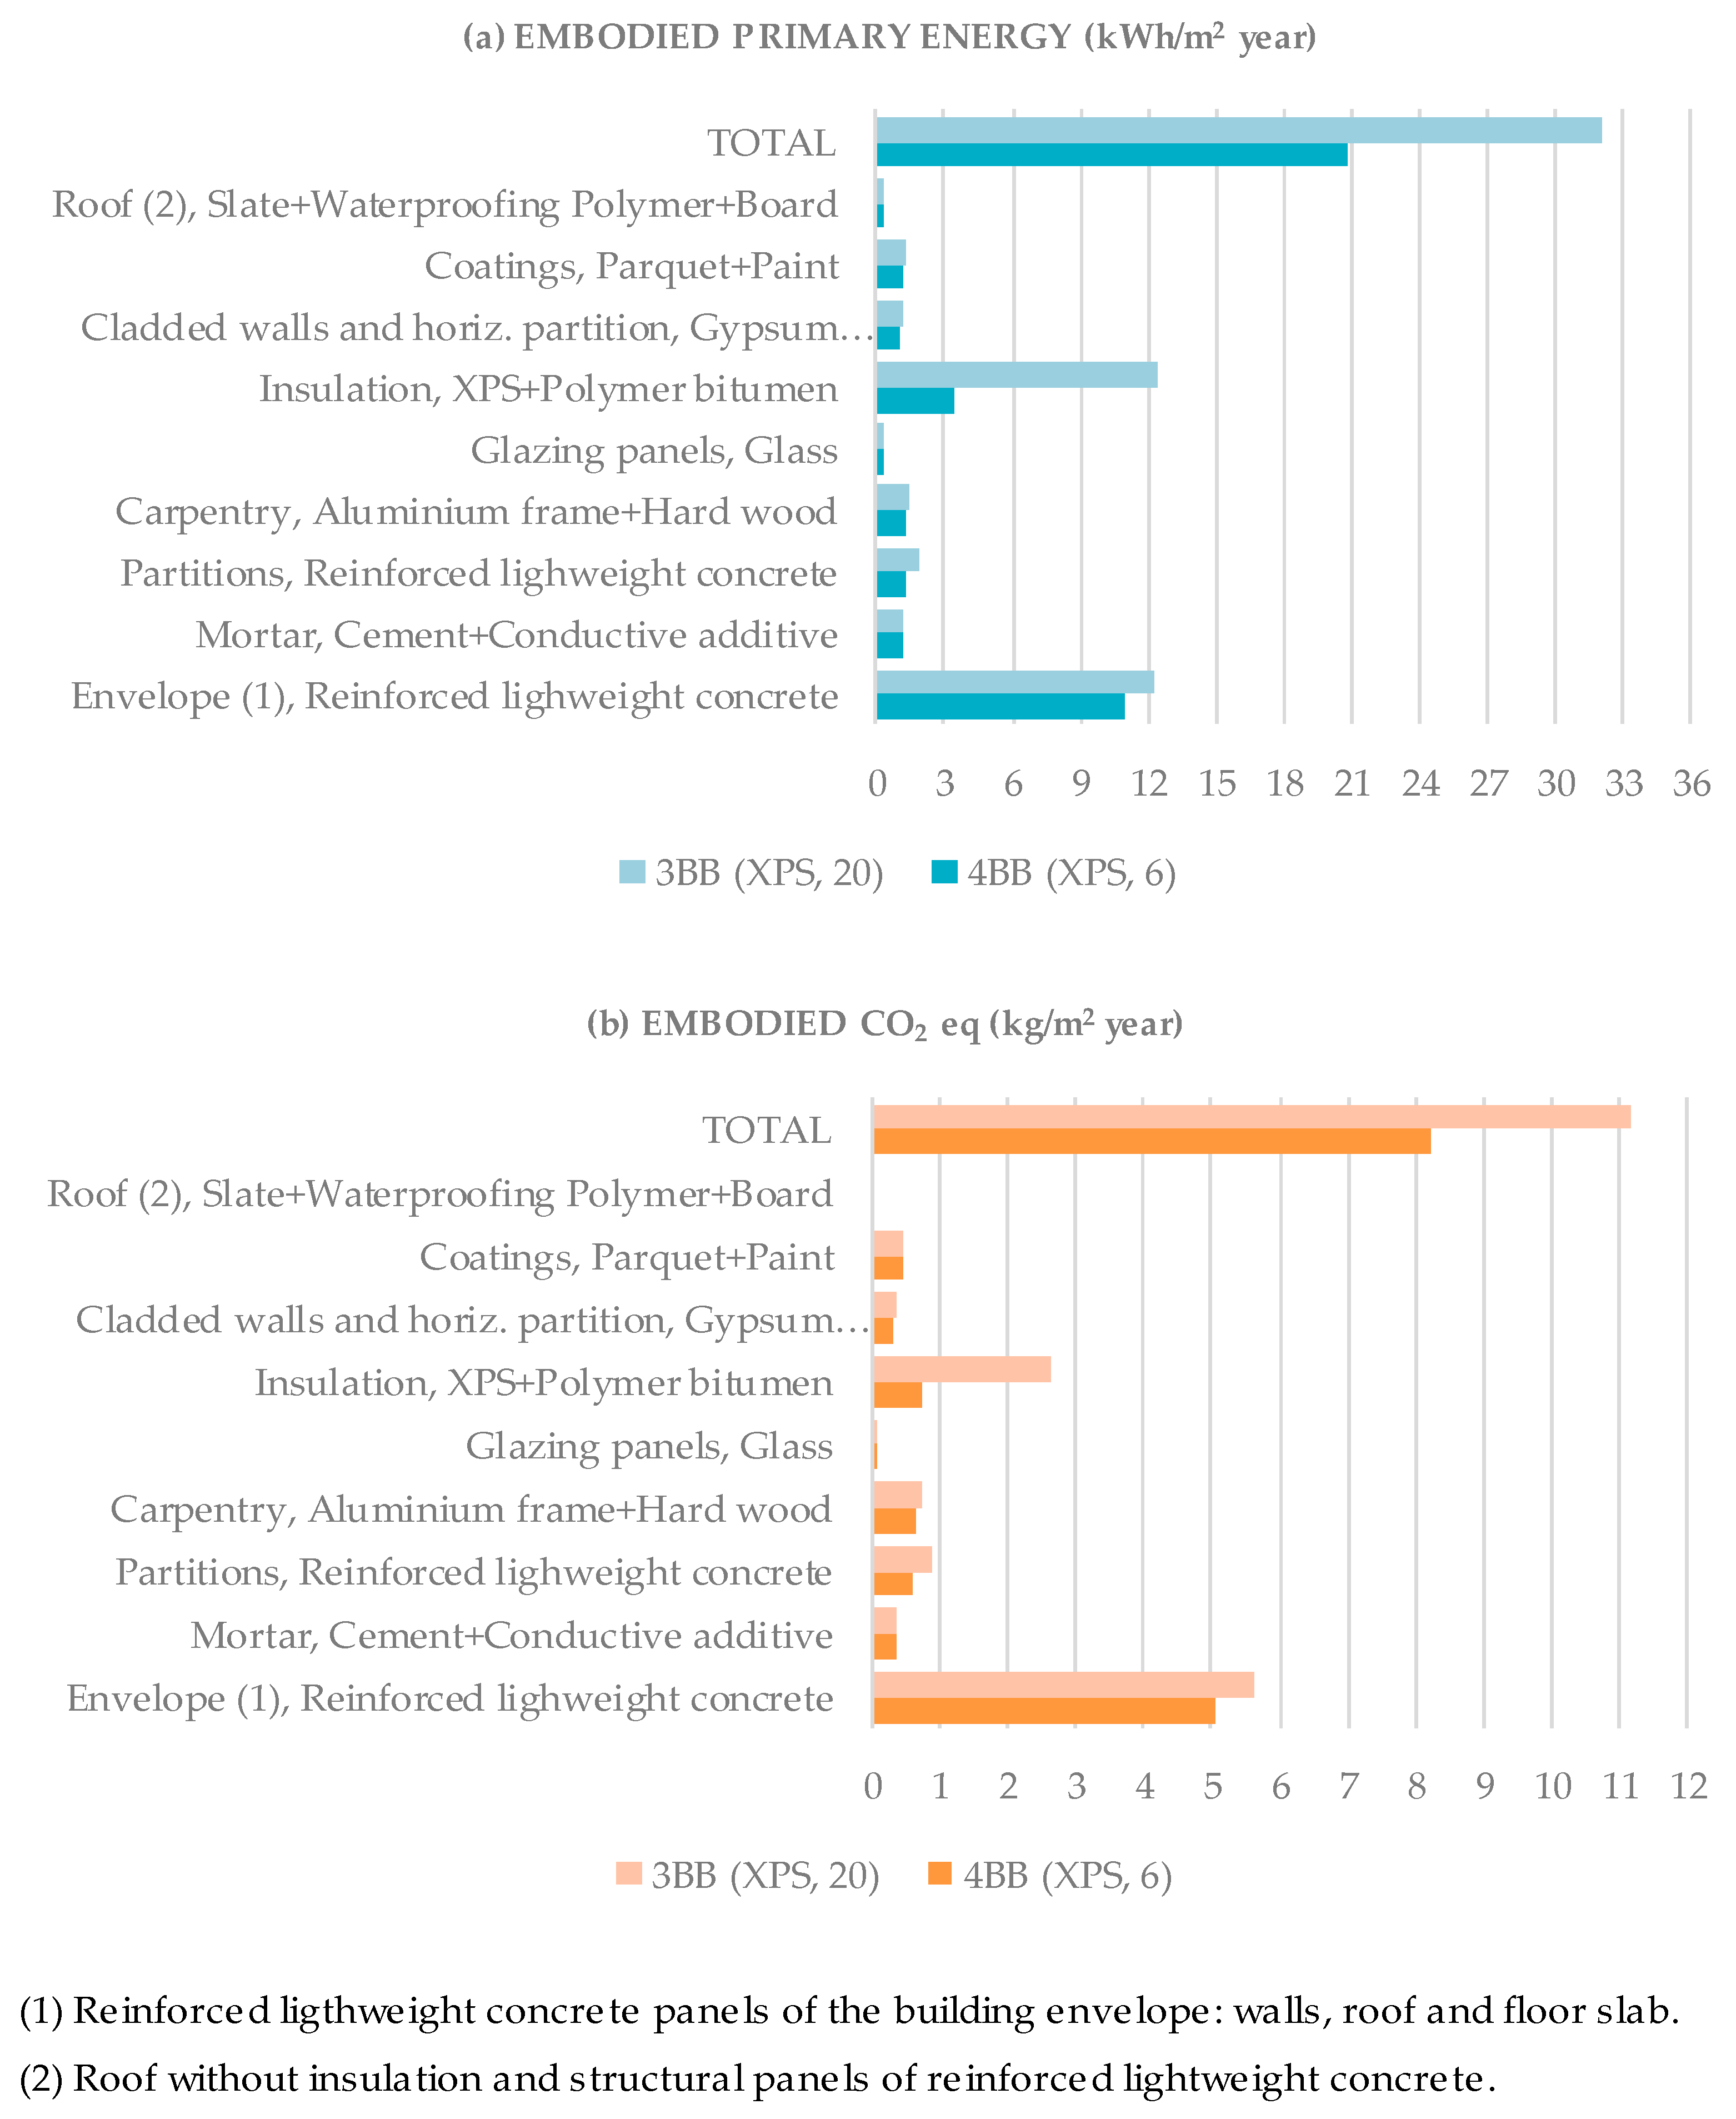
From the present study, it was found that the embodied primary energy depends on the insulation level and the shape factor, with values ranging from 26.8 kWh/m2 year (4BB, e XPS = 6 cm) to 47.4 kWh/m2 year (3BB, to e XPS = 30 cm). Data in the literature show dependence on lifespan, usable floor area and construction materials. Lifespan ranges from 40 to 100 years in previous papers, as reported in the review by Karinpour [6]. Mithraratne and Vale [47] studied an individual house in New Zealand with 90 m2 of usable floor area, a 100-year lifespan and built in concrete, obtaining an embodied primary energy of 13 kWh/m2 per year, a result that is not so far from that calculated in the current study, bearing in mind that the latter corresponds to a 50-year lifespan. Ramesh et al. [48] carried out a life cycle energy analysis in different climatic zones of India for a residential building with 85.5 m2 of usable floor area, a 75-year lifespan and built using aerated concrete for the envelope. They obtained a value of 27 kWh/m2 year of embodied primary energy and an operational energy of 167 kWh/m2 year.
In general, it is observed that, although the values of embodied energy may be more in agreement, this is not the case of those of energy use. This result is reasonable, seeing as the technologies for obtaining and manufacturing materials have similar efficiencies everywhere. However, energy use is highly dependent on the climate and the technology used for its supply. In addition to this, it depends on the country’s energy mix, which has a major influence on the results. As for CO2 equivalent emissions, this is an impact related to the system used for energy supply, which is strongly linked to the country’s mix in the case of electricity.
The average data (for all locations and thicknesses studied) obtained for primary energy and CO2 equivalent emissions are in keeping with data reported in the literature for mild climates. Data normalized in kWh/m2 year of embodied and operational energy were summarized from a literature review in Karinpour [6] for several buildings with a usable net area from 50 to 130 m2 and in a variety of climates and construction technologies. The ratio of embodied to total was found to be around 25% for primary energy and 35% for CO2 eq emission in mild climates. The primary energy in [6] falls within the range of the results obtained in the current study, in which the embodied energy varies on average from 25.80% to 44.60% of the total energy, as the energy use varies on average from 74.20% to 55.40% of the total energy, depending in both cases on the energy scenario (the extreme values corresponding to the electricity-only and heat pump plus electricity). Similarly, average CO2 equivalent emissions range from 25.03% to 69.13%, when expressed as embodied-to-total ratio, and from 74.97% to 30.87%, when expressed as use-to-total ratio.
Moschetti et al. [18] analysed the sustainability of buildings with different typologies and climates in Italy. In their paper, the lifespan was considered to be 50 years and the aspects of sustainability that were studied include total primary energy and climate change. Several energy supply systems were also analysed, including one with a natural gas boiler and another with electrical energy from the energy mix in Italy. Although various types of buildings were studied and the energy demands were established for insulation thicknesses lower than those of the present study, both the methodology and the global trends show similarities. The values of the total primary energy found in [18] range from 69 to 121 kWh/m2 year, the stage of energy of use representing 75% on average, while the values obtained in the present study range from 51.1 kWh/m2 year (Spanish energy mix) to 88.7 kWh/m2 year (gas boiler). The differences in values are related to the different types of buildings and the different levels of insulation used. Regarding the impact of climate change, the average value in [18] is 34.2 kg CO2 eq/m2 year, while in the present study the values range from 41.4 kg CO2 eq/m2 year (Spanish energy mix) to 75.0 kg CO2 eq/m2 year (gas boiler). As in the present study, in [18] it was found that the GWP values are greatly defined by the energy supply system.
For their part, Leskovar et al. [34] carried out a study comparing several typologies of wooden buildings (cross-laminated timber) with similar construction characteristics, a high degree of insulation and different form factors. The buildings were located in a Dfb climate-classified region of Central Europe, with cold winters and hot summers. The active systems consisted of an air conditioning unit, the system for heating the domestic hot water not being clearly specified. The environmental study was carried out for a lifespan of the building of 50 and 100 years. Regarding the analysed impacts, non-renewable primary energy and global warming were evaluated, in addition to the potential for acidification. Although the materials are very different from those used in the present study, the overall trends regarding the effects of the form factor are similar when comparing the two buildings in this study (67.0 m2 for 3BB and 121.3 m2 for 4BB) with the two buildings in [34] that have the closest size to them (42.3 and 84.5 m2), the thermal behaviour and effect of impacts being better when the form factors are smaller (the case of the larger building). The total global warming potential for these buildings in [34] is 23 and 29 kg CO2 eq/m2 year, respectively, the GWP impact of use representing 73% in both cases. These values are lower than those calculated in the present study due to the use of laminated wood in the structure of buildings in [34], instead of lightweight concrete panels.

5. Conclusions

The relative importance of embodied and use impacts of buildings is increasingly changing because of the application of energy efficiency and environmental directives. In this paper, these impacts are investigated for single-family houses with lightweight concrete envelopes in sub-regions of northern Spain presenting different Atlantic microclimates. The effects of varying the insulation thickness, compactness, size of the windows and three scenarios of thermal energy supply (electricity only, heat pump plus electricity and gas boiler) are calculated.
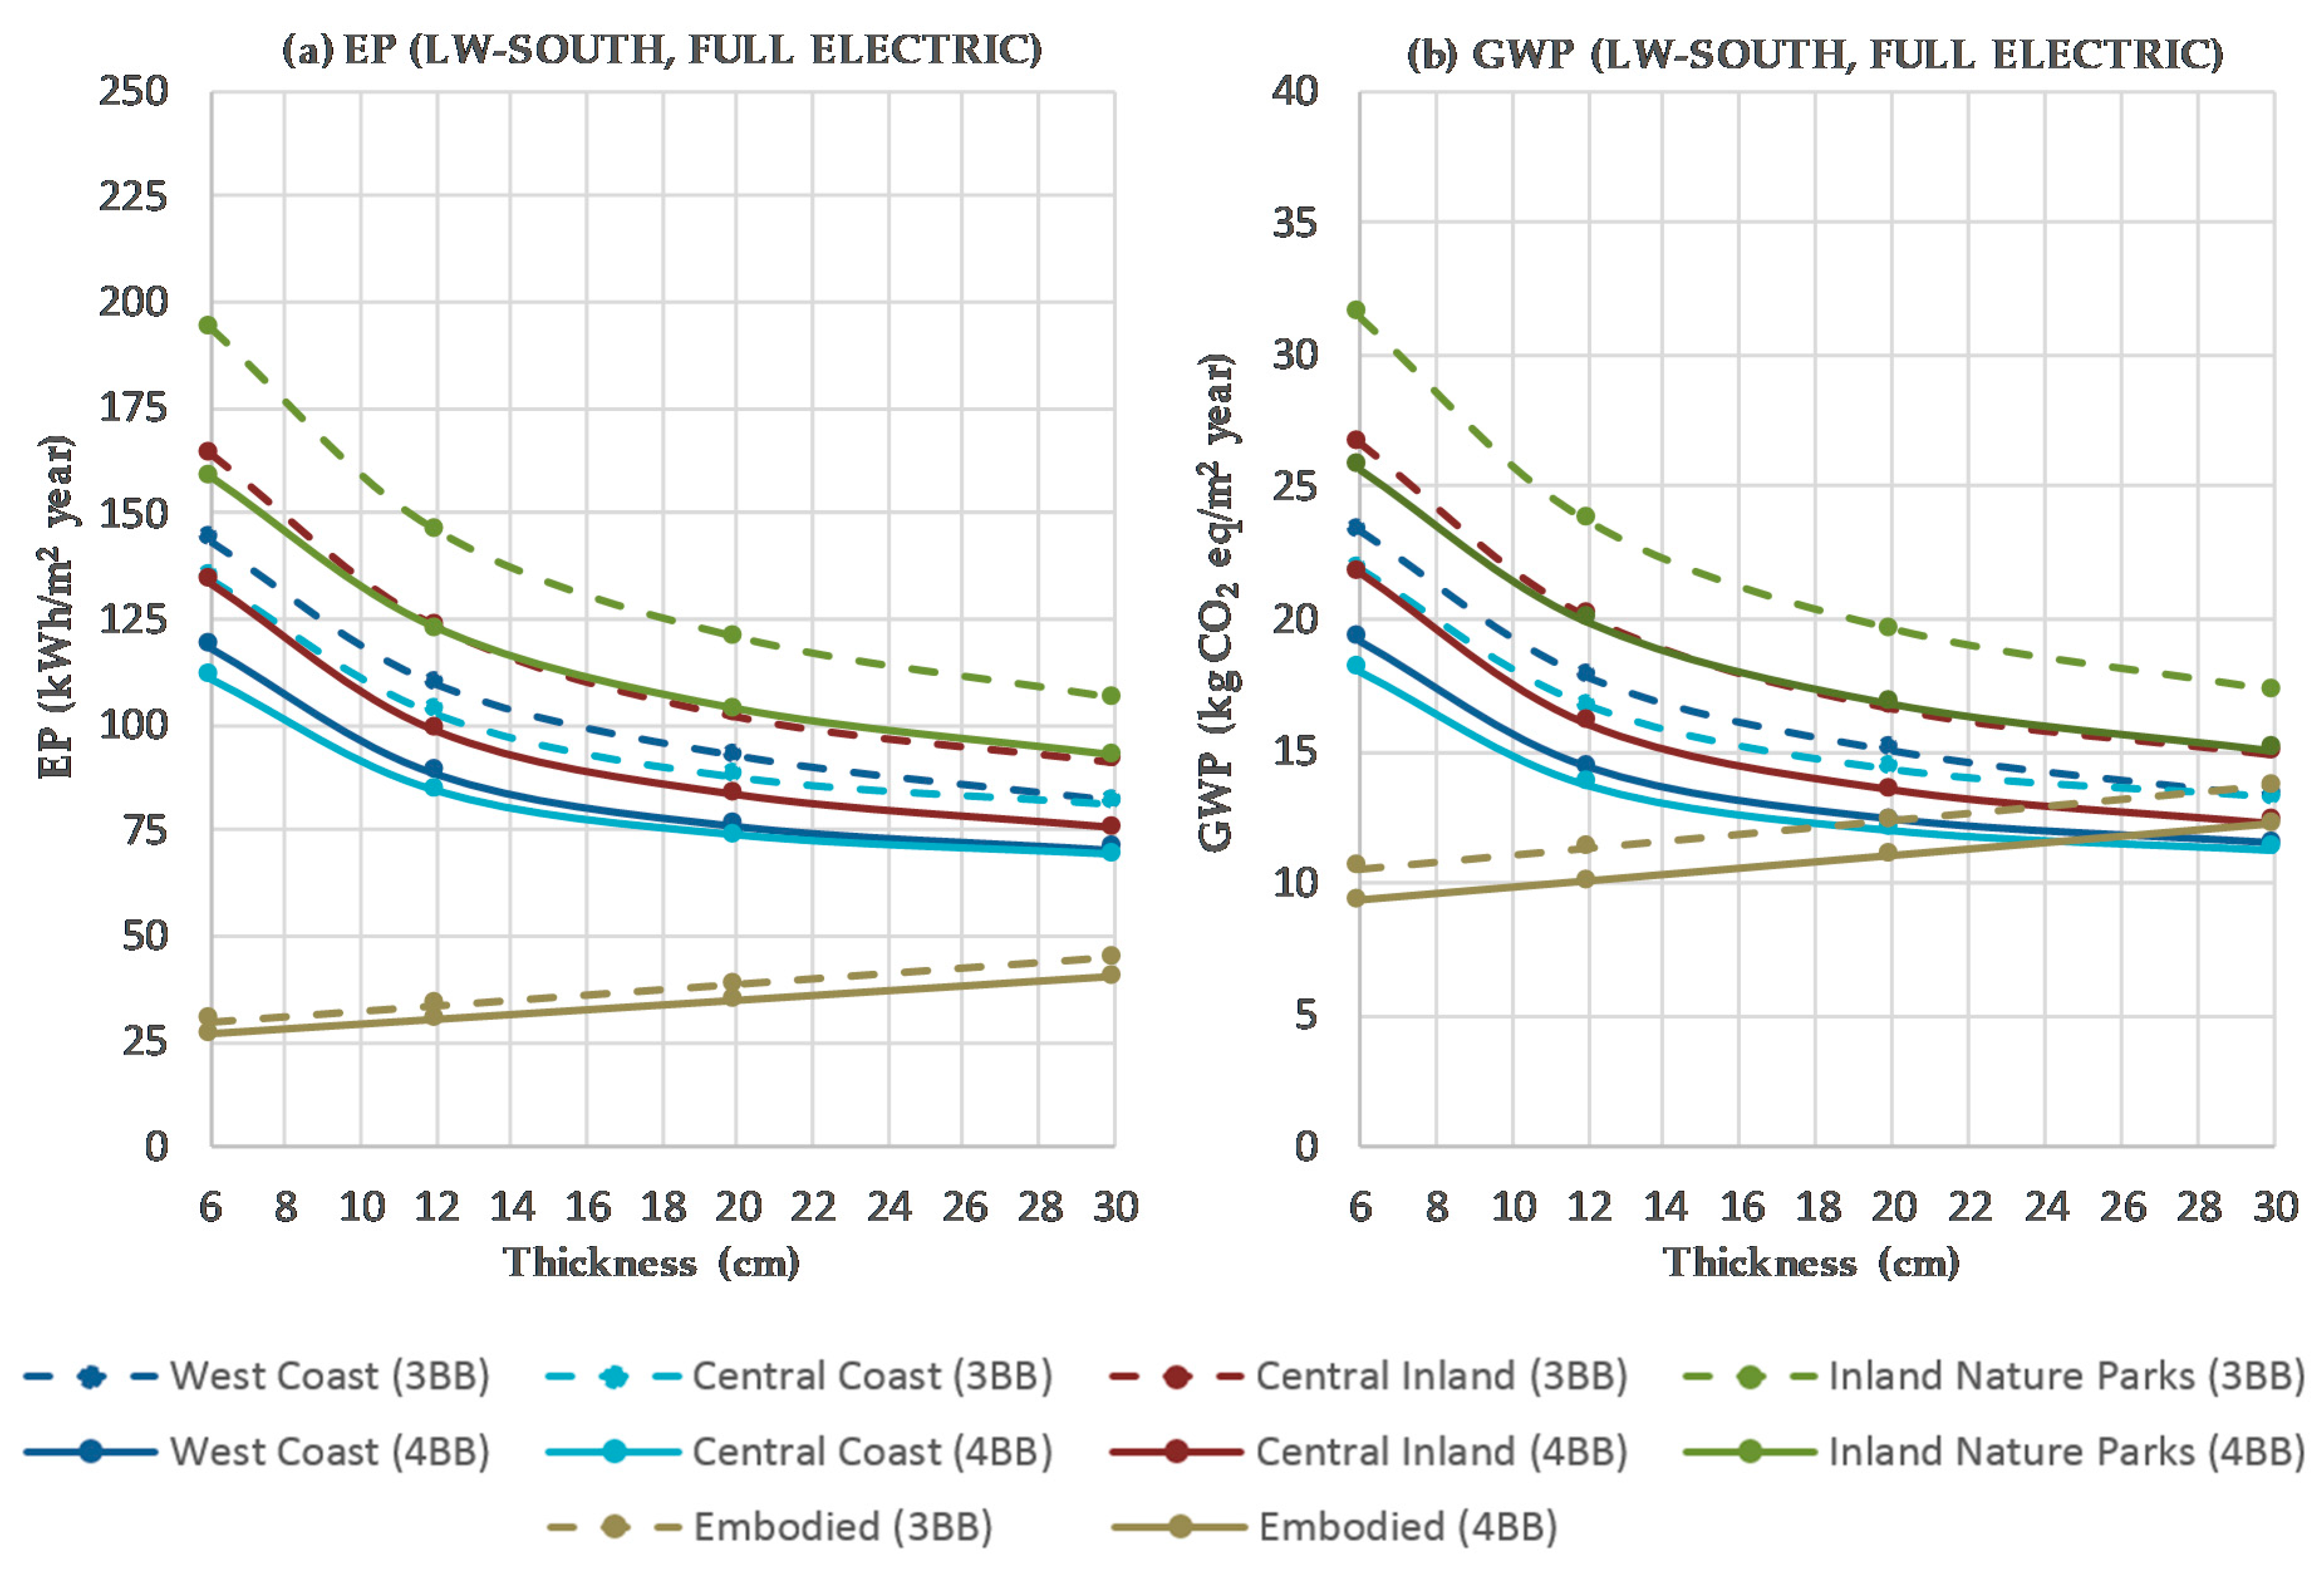
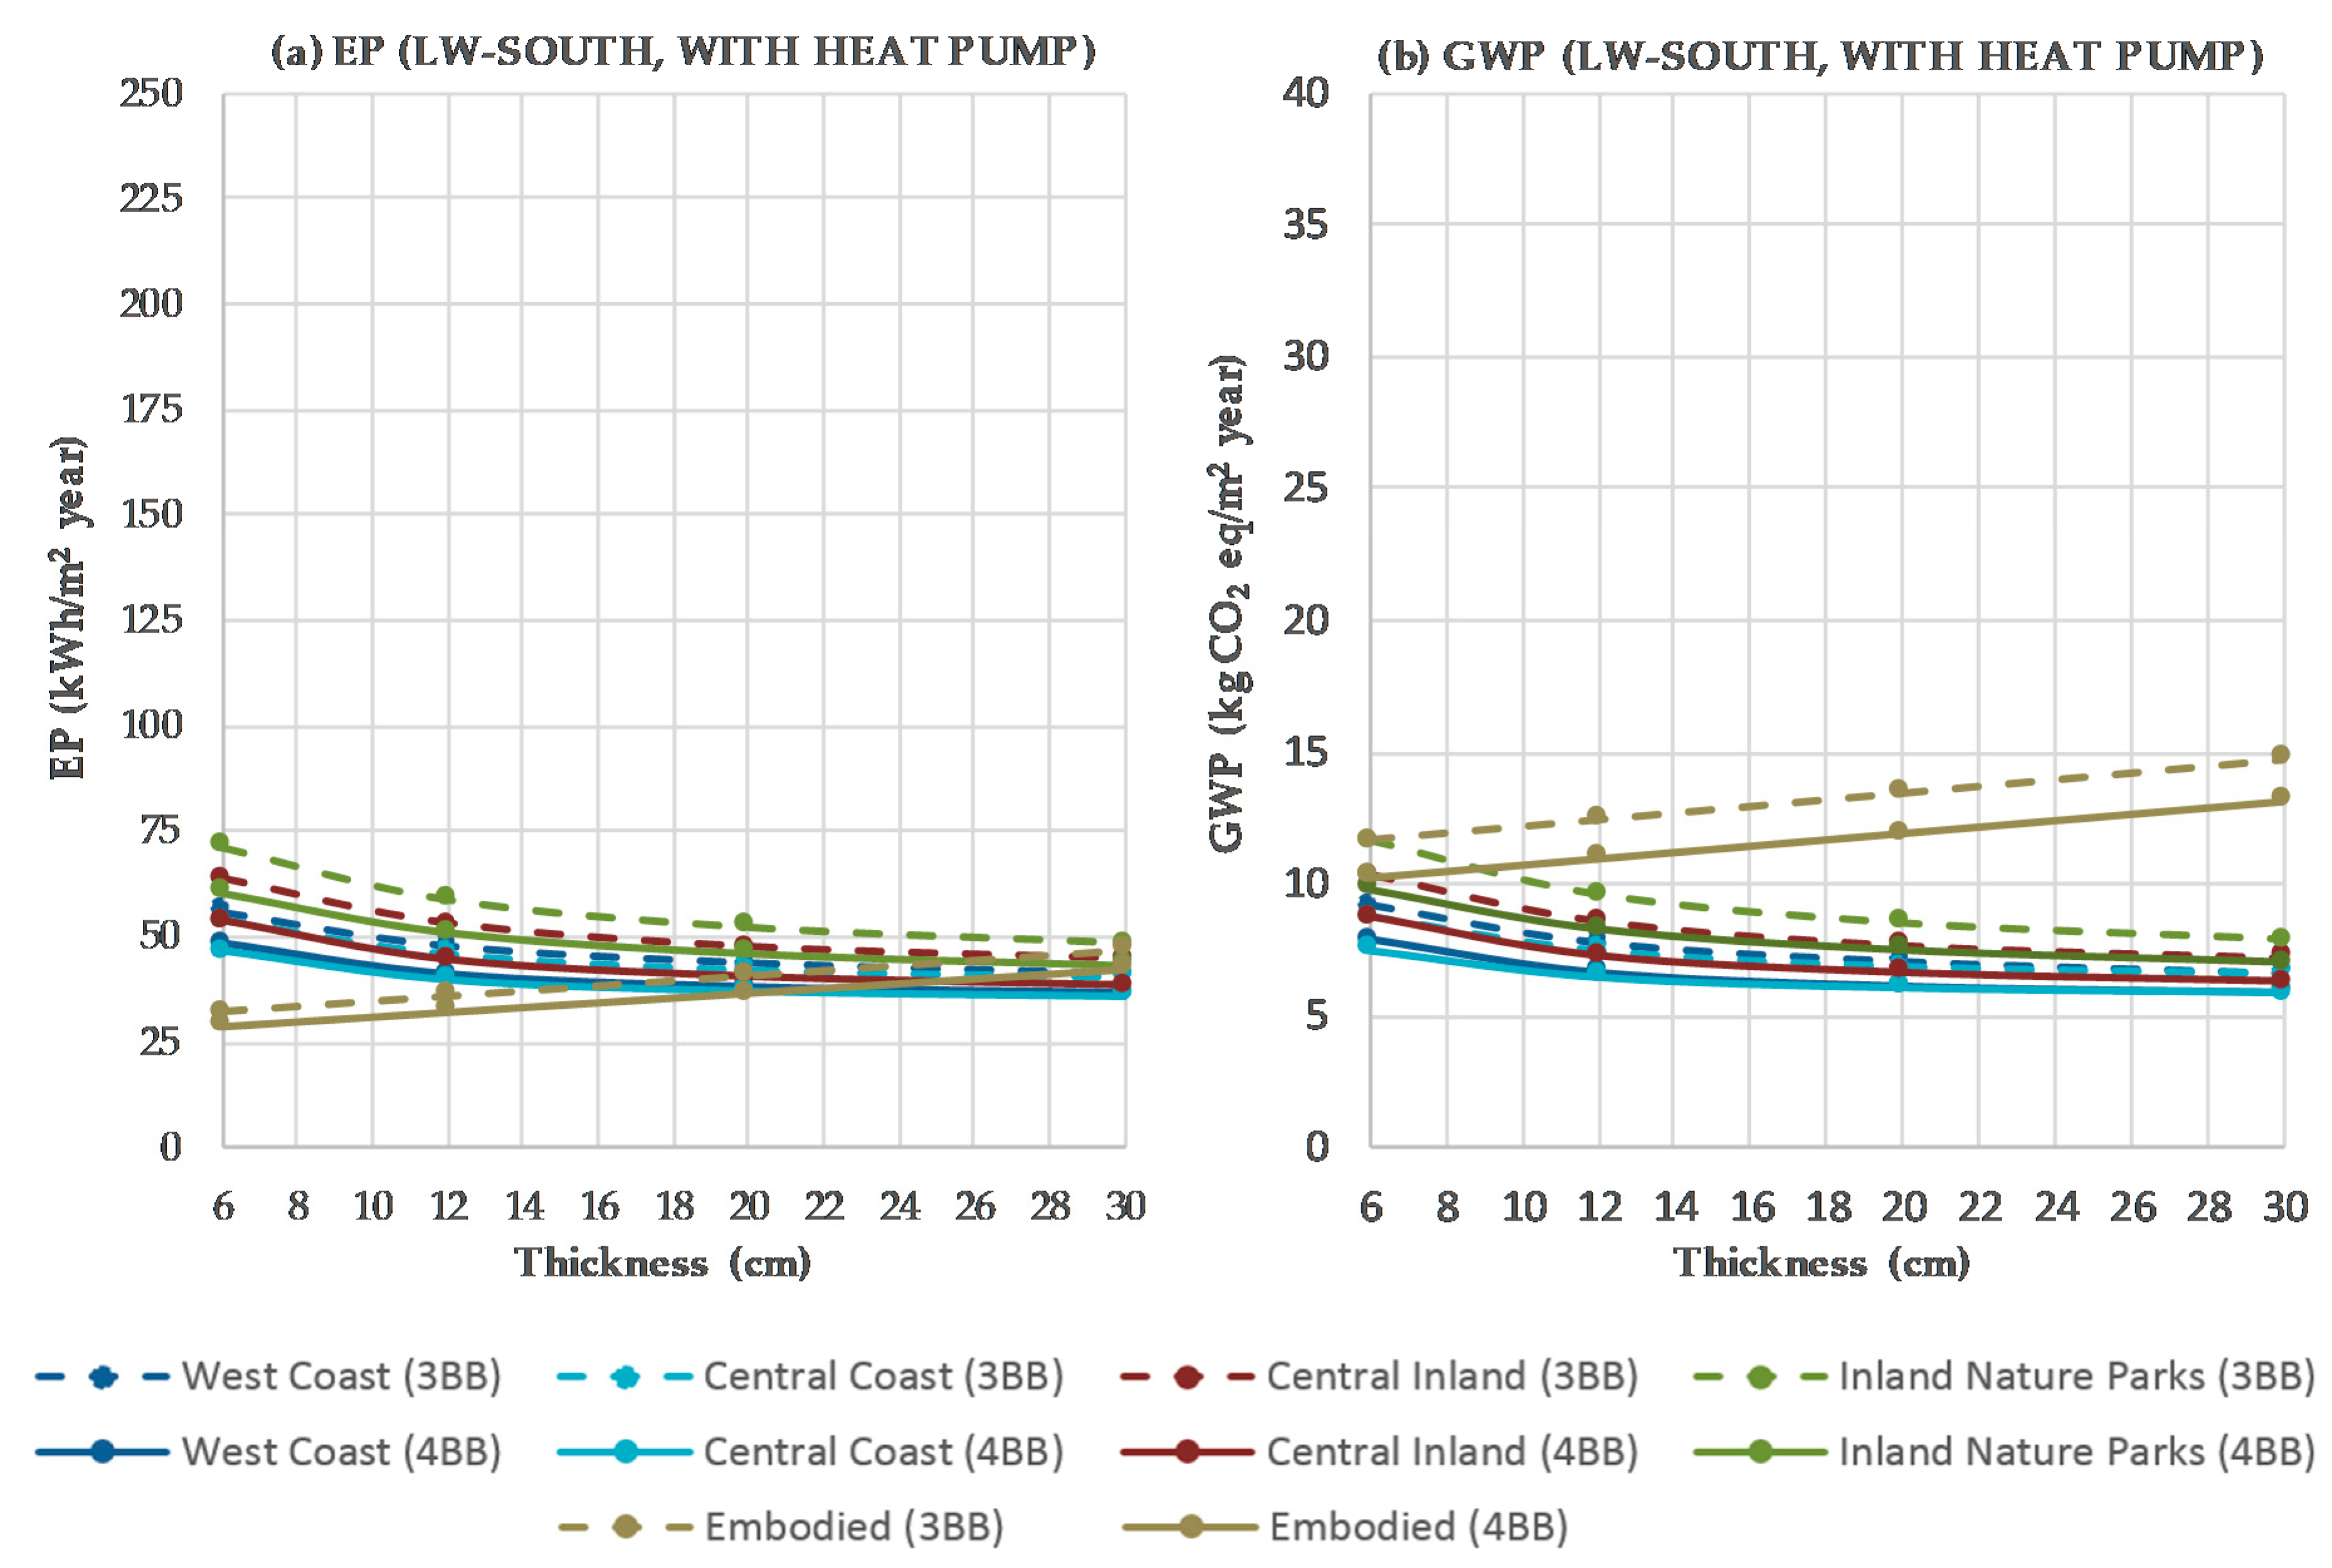
The use of electricity only has impacts on primary energy and on climate change that almost triple those calculated for heat pumps and there is greater variation with the microclimate.
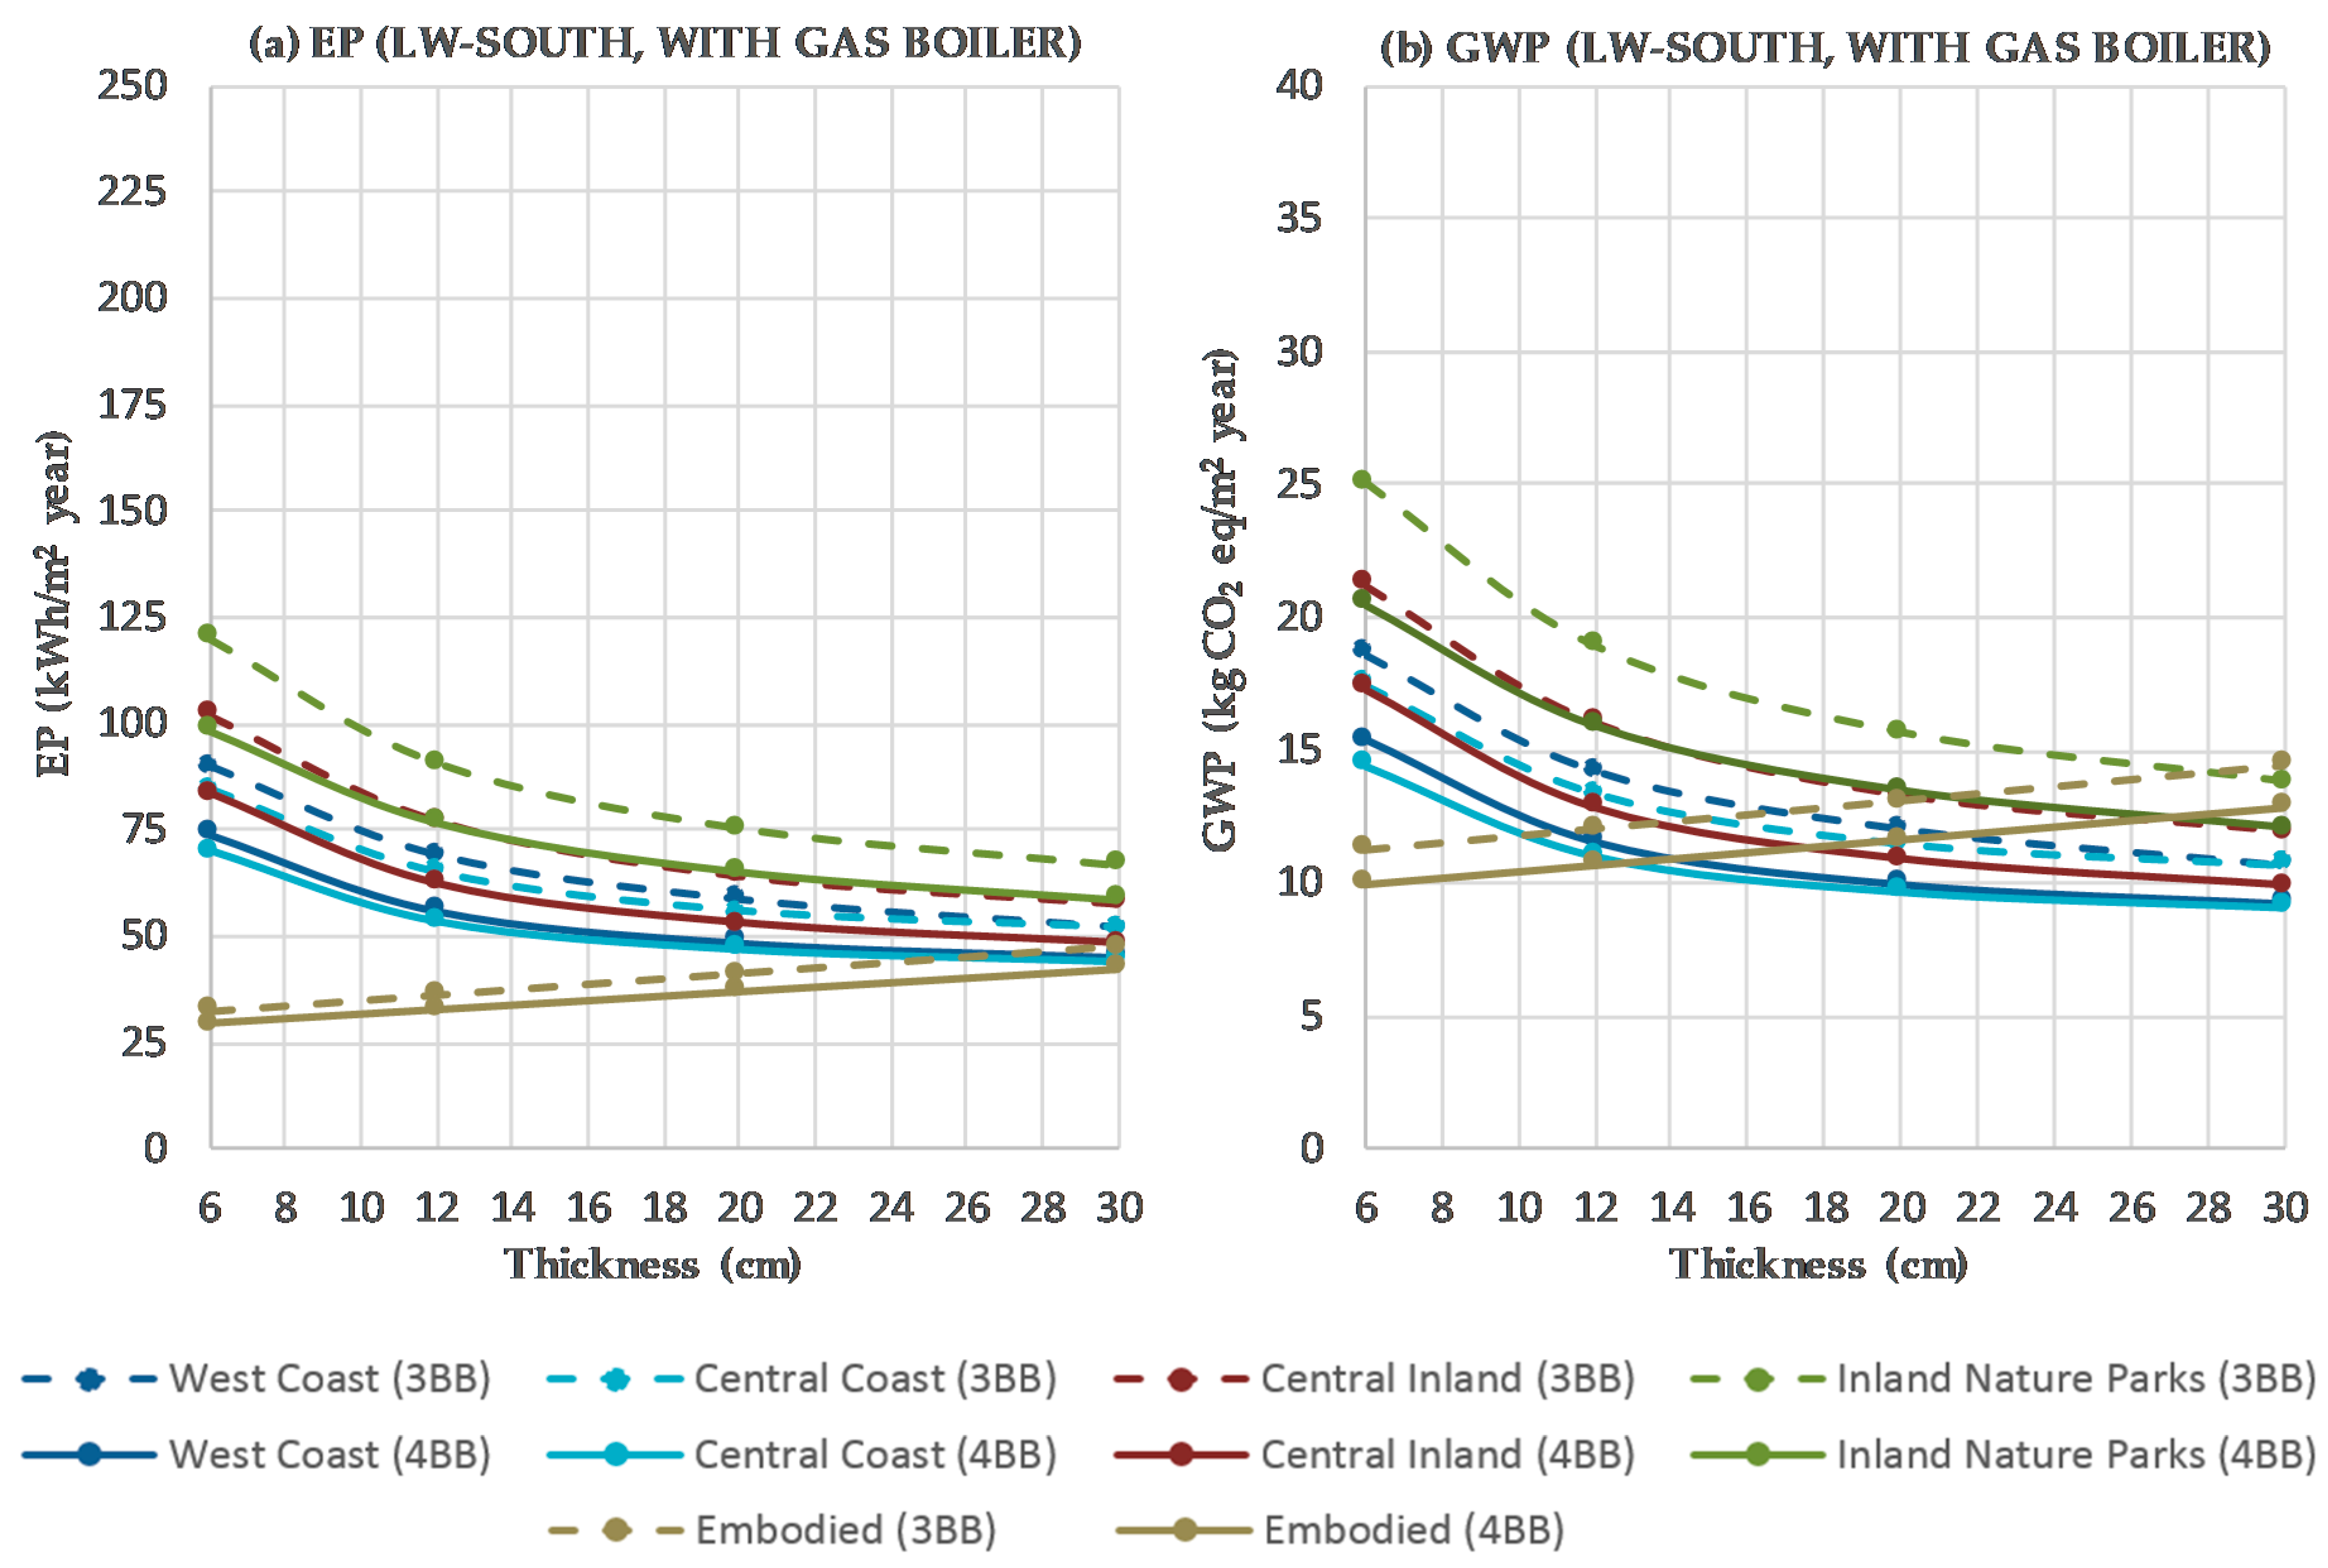
For the heat pump and for the gas boiler, the embodied impact can exceed the impacts of use, hence the interest in achieving insulation with less environmental impact and in using insulation thicknesses according to the climate.
The current Spanish electric energy mix does not have sufficient supply of renewable energy to compete in terms of environmental impacts with the use of the heat pump and natural gas. However, although the heat pump will continue to be a very sustainable system in the long term, natural gas may no longer have the environmental advantages it currently has if environmental policies planned for Spain are implemented by the 2030 horizon.
As future work, aimed at improving the life cycle analysis, it would be convenient to carry out a broader-reaching study that considers the variation in lifespan and the recycling of lightweight concrete. This would help in future decisions to select the most appropriate material for each microclimatic sub-region.

Author Contributions

Conceptualization, D.G.-P., Y.F.-N. and M.M.P.; Data curation, D.G.-P., Y.F.-N. and E.M.; Formal analysis, Y.F.-N., E.M. and M.M.P.; Investigation, D.G.-P.; Methodology, D.G.-P., Y.F.-N., E.M. and M.M.P.; Software, D.G.-P., Y.F.-N. and M.M.P.; Supervision, Y.F.-N., E.M. and M.M.P.; Validation, D.G.-P., Y.F.-N., E.M. and M.M.P.; Writing—original draft, D.G.-P., Y.F.-N. and M.M.P.; Writing—review & editing, Y.F.-N., E.M. and M.M.P. All authors have read and agreed to the published version of the manuscript.

Funding

This research received no external funding.

Conflicts of Interest

The authors declare no conflict of interest.

References

  1. European Union. European Commission Directorate-General for Energy, Section Topics–Energy Efficiency–Buildings. 2017. Available online: https://ec.europa.eu/energy/en/topics/energy-efficiency/buildings (accessed on 15 February 2020).
  2. Directive (EU) 2018/2002 of the European Parliament and of the Council of 11 December 2018 Amending Directive 2012/27/EU on Energy Efficiency. Official Journal of the European Union L328/210. 2018. Available online: https://eur-lex.europa.eu/legal-content/EN/TXT/?uri=uriserv%3AOJ.L_2018.328.01.0210.01.ENG (accessed on 31 January 2020).
  3. Directive 2012/27/EU of the European Parliament and of the Council of 25 October 2012 on Energy Efficiency, Amending Directives 2009/125/EC and 2010/30/EU and repealing Directives 2004/8/EC and 2006/32/EC. Official Journal of the European Union L315/1. 2012. Available online: https://eur-lex.europa.eu/legal-content/EN/TXT/PDF/?uri=CELEX:32012L0027&from=EN (accessed on 31 January 2020).
  4. Directive 2010/31/EU of the European Parliament and of the Council of 19 May 2010 on the Energy Performance of Buildings (Recast). Official Journal of the European Union L153/13. 2010. Available online: https://eur-lex.europa.eu/LexUriServ/LexUriServ.do?uri=OJ:L:2010:153:0013:0035:EN:PDF (accessed on 6 February 2020).
  5. Sartori, I.; Hestnes, A.G. Energy use in the life cycle of conventional and low-energy buildings: A review article. Energy Build. 2007, 39, 249–257. [Google Scholar] [CrossRef]
  6. Karinpour, M.; Berlusko, M.; Xing, K.; Bruno, F. Minimising the life cycle energy of buildings: Review and analysis. Build. Environ. 2014, 63, 106–114. [Google Scholar] [CrossRef]
  7. Chastas, P.; Theodosiou, T.; Bikas, D. Embodied energy in residential buildings-towards the nearly zero energy building: A literature review. Build. Environ. 2016, 105, 267–282. [Google Scholar] [CrossRef]
  8. Malmqvist, T.; Nehasilova, M.; Moncaster, A.; Birgisdottir, H.; Rasmussen, F.N.; Wiberg, A.H.; Potting, J. Design and construction strategies for reducing embodied impacts from buildings—Case study analysis. Energy Build. 2018, 166, 35–47. [Google Scholar] [CrossRef] [Green Version]
  9. Stephan, A.; Crawford, R.H.; Myttenaere, K. A comprehensive assessment of the life cycle energy demand of passive houses. Appl. Energy 2013, 112, 23–34. [Google Scholar] [CrossRef] [Green Version]
  10. Morales, M.; Moraga, G.; Kirchheim, A.P.; Passuelloo, A. Regionalized inventory data in LCA of public housing: A comparison between two conventional typologies in southern Brazil. J. Clean. Prod. 2019, 238, 117869. [Google Scholar] [CrossRef]
  11. Cuéllar-Franca, R.M.; Azapagic, A. Environmental impacts of the UK residential sector: Life cycle assessment of houses. Build. Environ. 2012, 54, 86–99. [Google Scholar] [CrossRef]
  12. Takano, A.; Kumar, S.; Kuittinen, M.; Alanne, K. Life cycle energy balance of residential buildings: A case study on hypothetical building models in Finland. Energy Build. 2015, 105, 154–164. [Google Scholar] [CrossRef]
  13. El Hanandeh, A. Environmental assessment of popular single-family house construction alternatives in Jordan. Build. Environ. 2015, 92, 192199. [Google Scholar] [CrossRef] [Green Version]
  14. Utama, A.; Gheewala, S.H. Life cycle energy of single landed houses in Indonesia. Energy Build. 2008, 40, 1911–1916. [Google Scholar] [CrossRef]
  15. Luo, H.; Liang, X.; Lu, J.; Zhang, X. Applicability analysis of insulation in different climate zones of China. Energy Procedia 2017, 142, 1835–1841. [Google Scholar] [CrossRef]
  16. Elsarrag, E.; Alhorr, Y. Modelling the thermal energy demand of a Passive-House in the Gulf Region: The impact of thermal insulation. Int. J. Sustain. Built Environ. 2012, 1, 1–15. [Google Scholar] [CrossRef] [Green Version]
  17. Tibi, G.; Ghaddar, N.; Ghali, K. Sustainable design guidelines for detached housing in the Lebanese inland region. Int. J. Sustain. Built Environ. 2012, 1, 177–193. [Google Scholar] [CrossRef] [Green Version]
  18. Moschetti, R.; Mazzarella, L.; North, N. A novel methodology to define reference values for building sustainability parameters. Energy Build. 2015, 88, 413–427. [Google Scholar] [CrossRef] [Green Version]
  19. Premrov, M.; Leskovar, V.Z.; Mihalic, K. Influence of the building shape on the energy performance of timber-glass buildings in different climatic conditions. Energy 2015, 108, 201–221. [Google Scholar] [CrossRef]
  20. Robertson, A.B.; Lam, F.; Cole, R.J. A Comparative Cradle-to-Gate Life Cycle Assessment of Mid-Rise Office Building Construction Alternatives: Laminated Timber or Reinforced Concrete. Buildings 2012, 2, 245–270. [Google Scholar] [CrossRef]
  21. Napolano, l.; Menna, C.; Graziano, S.; Asprone, D.; D’Amore, M.; Gennaro, R.; Dondi, M. Environmental life cycle assessment of lightweight concrete to support recycled materials selection for sustainable design. Constr. Build. Mater. 2016, 119, 370–384. [Google Scholar] [CrossRef]
  22. Eurostat, “Housing statistics”, EU-28. 2017. Available online: http://ec.europa.eu/eurostat/statisticsexplained/index.php/Housing_statistics (accessed on 8 June 2018).
  23. Spanish Ministry of Ecological Transition. National Integrated Energy and Climate Plan 2021–2030. 2019. Available online: https://www.miteco.gob.es/images/es/pnieccompleto_tcm30-508410.pdf (accessed on 3 March 2020). (In Spanish).
  24. Spanish Ministry of Housing. Spanish Technical Building Code. Basic Document on Energy Savings DB-HE. Royal Legislative Decree 314 of 17 March 2006. Available online: http://www.codigotecnico.org (accessed on 12 January 2020). (In Spanish).
  25. IDAE (Institute for the Diversification and the Energy Savings), Factors of CO2 Emission and Coefficients of Passage to Primary Energy of Different Final Energy Sources Consumed in the Building Sector in Spain. Ministry of Industry, Energy and Tourism. 2016. Available online: https://energia.gob.es/desarrollo/EficienciaEnergetica/RITE/Reconocidos/Reconocidos/Otros%20documentos/Factores_emision_CO2.pdf (accessed on 30 June 2020). (In Spanish).
  26. ISO 13790. Energy Performance of Buildings Calculation of Energy Use for Space Heating and Cooling; International Organization for Standardization: Geneva, Switzerland, 2008. [Google Scholar]
  27. PHPP. Passive House Planning Package, Version 9; Passive House Institute: Darmstadt, Germany, 2015. [Google Scholar]
  28. Dan, D.; Tanasa, C.; Stoian, V.; Brata, S.; Stoian, D.; Nagy Gyorgy, T.; Florut, S.C. Passive house design—An efficient solution for residential buildings in Romania. Energy Sustain. Dev. 2016, 32, 99–109. [Google Scholar] [CrossRef]
  29. Figueiredo, A.; Kämpf, J.; Vicente, R. Passive house optimization for Portugal: Overheating evaluation and energy performance. Energy Build. 2016, 118, 181–186. [Google Scholar] [CrossRef]
  30. González Prieto, D.; Prieto González, M.M. Impact of socio-economic aspects on the typologies of industrialized housing: Use of lightweight concrete in Asturias. In Proceedings of the 9th European Conference on Energy Efficiency and Sustainability in Architecture and Planning/2nd International Congress on Advanced Construction, Bilbao, Spain, 10–12 September 2018; Available online: https://www.uik.eus/es/9o-congreso-europeo-sobre-eficiencia-energetica-y-sostenibilidad-en-arquitectura-y-urbanismo-eesap-9 (accessed on 4 February 2020).
  31. Albatici, R.; Passerini, F. Bioclimatic design of buildings considering heating requirements in Italian climatic conditions—A simplified approach. Build. Environ. 2011, 46, 1624–1631. [Google Scholar] [CrossRef]
  32. Premrov, M.; Zigart, M.; Leskovar, V.Z. Influence of the building shape on the energy performance of timber-glass buildings located in warm climatic regions. Energy 2018, 179, 496–504. [Google Scholar] [CrossRef]
  33. Construction Elements Catalogue. CAT-EC-v06.3 Madrid: Spanish Ministry of Housing. 2010. Available online: http://www.codigotecnico.org (accessed on 8 July 2018). (In Spanish).
  34. Leskovar, V.Z.; Zigart, M.; Premrov, M.; Lukman, R.K. Comparative assessment of shape related cross-laminated timber building typologies focusing on environmental performance. J. Clean. Prod. 2019, 216, 482–494. [Google Scholar] [CrossRef]
  35. Peel, M.C.; Finlayson, B.L.; McMahon, T.A. Updated world map of the Köppen-Geiger climate classification. Hydrol. Earth Syst. Sci. 2007, 11, 1633–1644. [Google Scholar] [CrossRef] [Green Version]
  36. Meteonorm v7.2, Climate and Weather Generator, v7.2. 2017. Available online: http://www.energiehaus.es/wp-content/uploads/2015/06/manual-usuario-part-2-meteonorm.pdf (accessed on 8 July 2018).
  37. AENOR (Asociación Española de Normalización). Norma UNE-EN 15804:2012+A1:2014; “Sostenibilidad en la Construcción. Declaraciones Ambientales de Producto. Reglas de Categoría de Producto Básicas para Productos de Construcción”; AENOR Publication Service: Madrid, Spain, 2014. [Google Scholar]
  38. AENOR (Asociación Española de Normalización). Norma UNE-EN 15978:2012; “Sostenibilidad en la Construcción. Evaluación del Comportamiento Ambiental de los Edificios. Métodos de cálculo”; AENOR Publication Service: Madrid, Spain, 2012. [Google Scholar]
  39. Impacto Ambiental y Análisis de Ciclo de Vida. Available online: http://gestion.cype.es/impacto_ambiental_analisis_ciclo_de_vida.htm (accessed on 2 March 2020). (In Spanish).
  40. ISO. ISO 14040, Environmental Management—Life Cycle Assessment—Principles and Framework; ISO: Geneva, Switzerland, 2006. [Google Scholar]
  41. ISO. ISO 14044, Environmental Management—Life Cycle Assessment—Requirements and Guidelines; ISO: Geneva, Switzerland, 2006. [Google Scholar]
  42. Laterlite Trademark. Available online: https://amadosalvador.es/wp-content/uploads/downloads/2014/11/Laterlite_cat%C3%A1logo_general.pdf (accessed on 14 January 2019). (In Spanish).
  43. GyM Company. Available online: https://docplayer.es/38943827-Ref-catalogo-de-productos-planta-cota-c-marca.html (accessed on 14 January 2019). (In Spanish).
  44. Spanish Ministry of Housing. Order VIV/984/2009, of 15 April, Amending Certain Basic Documents of the Spanish Technical Building Code Approved by the Royal Legislative Decree 314/2006 and the Royal Legislative Decree 1371/2007. Available online: http://www.codigotecnico.org (accessed on 12 January 2020). (In Spanish).
  45. Hassell, C.; Time for passive house designers to address hot water demand. Passivehouseplus Magazine. 2016. Available online: https://www.greenregister.org.uk/blog/reducing-hot-water-demand-in-passivhaus (accessed on 6 May 2020).
  46. González-Prieto, D.; Fernández-Nava, Y.; Marañón, E.; Prieto, M.M. Effect of Decarbonisation Policies and Climate Change on Environmental Impacts due to Heating and Cooling in a Single-Family House. Sustainability 2020, 12, 3529. [Google Scholar] [CrossRef]
  47. Mithraratne, N.; Vale, B. Life cycle analysis model for New Zealand houses. Build. Environ. 2004, 39, 483–492. [Google Scholar] [CrossRef]
  48. Ramesh, T.; Prakash, R.; Shukla, K.K. Life cycle energy analysis of a residential building with different envelopes and climates in Indian context. Appl. Energy 2012, 89, 193–202. [Google Scholar] [CrossRef]
Figure 1. Flow chart of the application of the methodology.
Energies 13 04337 g001
Figure 2. House layout: four-bedroom building (4BB) and three-bedroom building (3BB).
Energies 13 04337 g002
Figure 3. Chosen locations (from different climatic sub-regions of Asturias): west coast (top left); central coast (top right); central inland area (central strip); and nature parks (bottom).
Energies 13 04337 g003
Figure 4. Thermal balances for the four locations with south–north orientation for 4BB ( e XPS = 6 cm) and 3BB ( e XPS = 20 cm): (a) Losses; (b) Gains.
Energies 13 04337 g004
Figure 5. Electrical consumption according the insulation thickness for the four locations with LW-SOUTH for 4BB and for 3BB: (a) Electricity only; (b) Heat pump plus electricity.
Energies 13 04337 g005
Figure 6. Electrical consumption according the insulation thickness for the four locations with SW-SOUTH for 4BB and for 3BB: (a) Electricity only; (b) Heat pump plus electricity.
Energies 13 04337 g006
Figure 7. Impacts of the construction elements, by components, per m2 of usable floor area for 4BB ( e XPS = 6 cm) and 3BB ( e XPS = 20 cm): (a) Embodied energy; (b) Equivalent of CO2 emissions throughout the manufacturing, transport and construction stages.
Energies 13 04337 g007
Figure 8. Embodied and use impacts of primary energy and CO2 equivalent emissions for the electricity-only scenario, depending on insulation thickness, for the four locations, with LW-SOUTH both for 4BB and 3BB.
Energies 13 04337 g008
Figure 9. Embodied and use impacts of primary energy and CO2 equivalent emissions for the heat pump plus electricity scenario, depending on insulation thickness, for the four locations, with LW-SOUTH both for 4BB and 3BB.
Energies 13 04337 g009
Figure 10. Embodied and use impacts of primary energy and CO2 equivalent emissions for the natural gas boiler scenario, depending on insulation thickness, for the four locations, with LW-SOUTH both for 4BB and 3BB.
Energies 13 04337 g010
Figure 11. Embodied and use impacts of primary energy and CO2 equivalent emissions for the electricity-only scenario in Spain’s 2030 horizon [23,46], depending on insulation thickness, for the four locations, with LW-SOUTH both for 4BB and 3BB.
Energies 13 04337 g011
Table 1. Characteristics of the windows of the buildings.
Characteristics of the Windows4BB3BB
LW_SouthSW_SouthLW_SouthSW_South
AWF0.380.170.310.12
AGF0.230.100.190.07
FFavg0.40-0.43-
GFavg0.60-0.58-
Uf (W/m2K)0.83-0.83-
Ug (W/m2K)0.56-0.56-
Uw_avg (W/m2K)0.67-0.68-
Table 2. Shape factor, other design ratios for the usable floor area and average thermal transmittance.
Characteristics of the Opaque Construction Elements4BB3BB
6 cm XPS20 cm XPS6 cm XPS20 cm XPS
Aref_net (m2)121.27121.2767.0067.00
Aref_gross (m2)136.46143.1179.0084.09
Atot (m2)425.39448.25271.37289.65
Vint (m3)418.31418.31216.80216.80
L/W1.201.201.281.27
Fw all = Aw all/Aref_net1.131.211.541.66
Froof = Aroof/Aref_net1.251.311.361.44
Aroof/(Aw all = Aroof)0.520.520.460.46
Fc = Atot/Vint1.021.071.251.34
Up_avg (W/m2 K)0.330.140.320.14
Table 3. Characteristics of the construction elements of the houses without additional expanded polystyrene (XPS) insulation.
Construction ElementSurface (m2)ComponentThickness (cm)Density (kg/m3)Conductivity (W/m K)
4BB3BB
External wall (inner cladded)91.1770.38Gypsum paster0.0138000.250
Mineral wool0.047400.035
Lightweight concrete0.1416800.680
Reinforcing steel---
XPS-320.034
Coat of cement0.01816000.459
Paint---
External wall (non cladded)19.4510.34Lightweight concrete0.1416800.680
Reinforcing steel---
XPS-320.034
Coat of cement0.01816000.459
Paint---
Floor slab123.7369.35Solid parquet0.027700.130
Conductive cement mortar0.0420002.00
XPS with acoustic protection0.04230.034
Lightweight concrete0.1416800.680
Reinforcing steel---
XPS-320.034
Polymer bitumen sealing0.00781100-
Cement motor0.0516001.050
Concrete slab0.225601.050
Roof133.2375.02Lightweight concrete0.1416800.680
Reinforcing steel---
XPS-320.034
Polymer waterproofing0.00781100-
Oriented strand board (OSB)0.0246500.120
Polymer bitumen sealing0.00781100-
Slate0.01828002.200
Horizontal partition123.7369.35Plaster 0.0138000.250
Mineral wood0.4400.035
Paint---
Vertical partition76.7461.61Lightweight concrete0.0816800.680
Reinforcing steel---
Paint---
Window frames7.545.11Aluminium frame---
Window glazing11.156.93Triple glaced panes---
Interior doors11.2311.23Hardwood timber0.34--
Exterior doors1.891.89Hardwood timber0.44--
Table 4. Data on the active components of buildings, including information on primary energy (EP), Global Warming Potential (GWP) and service life.
Active ComponentHouseCharacteristics (Unit)EP (KWh)GWP (kg CO2 eq)Service LifeDisposal
Electric component4BB-9.202.2720Not considered
3BB-9.202.2720
Aerothermal heat pump4BB7 (kW)15.779.3620Not considered
3BB5 (KW)20.3912.1020
Gas boiler4BB12 (kW)18.654.7420Not considered
3BB9 (KW)25.336.4320
Hydronic floor installation4BB121.3 (m2)73.6621.0750Not considered
3BB67.0 (m2)73.6621.0750
Hot water tank4BB180 (l)7.321.9325Not considered
3BB100 (l)7.371.9425
Piping4BB-3.200.7950Not considered
3BB-3.200.7950
Ventilation unit4BB150 (m3/h)65.9714.6620Not considered
3BB90 (m3/h)71.6615.9220
Electric cables4BB-5.000.7450Not considered
3BB-5.000.7450
LED lights4BB-17.700.9712.5Not considered
3BB-17.700.9712.5
Values per m2 of usable floor area.
Table 5. Coordinates and altitudes for the selected locations.
Sub-RegionLocationNumberCoordinates 1 Altitude (m)
West CoastCaridad143.558 N 6.826 W70
Valdés243.472 N 6.390 W216
Central CoastLuanco343.624 N 5.787 W63
Gijón443.538 N 5.624 W30
Central InlandOviedo543.359 N 5.863 W302
Entrego643.287 N 5.634 W245
Nature ParksIbias743.014 N 6.531 W780
Lena843.076 N 5.492 W370
Aller943.054 N 5.284 W750
Amieva1043.160 N 5.071 W370
Cabrales1143.311 N 4.853 W458
1 Coordinates are expressed in decimal degrees, in the same way as Meteonorm [36], the software used to obtain climate data.
Table 6. Climate parameters of the representative location of each sub-region: degree hours, solar insolation for heating and cooling periods.
Climate Parameters(Unit)West CoastCentral CoastCentral InlandInland Nat. Parks
Heating PeriodCooloing PeriodHeating PeriodCooloing PeriodHeating PeriodCooling PeriodHeating PeriodCooling Period
Degree hours for period(kKh/year)47−3744−4557−3968−34
Solar insolation N(kWh/m2 period)159226159261181229181238
Solar insolation E(kWh/m2 period)352478357567417488432584
Solar insolation S(kWh/m2 period)582510576622687513708600
Solar insolation W(kWh/m2 period)352460356552407466423568
Global insolation(kWh/m2 period)570794584953664805685963
Table 7. Ambient and dew point temperatures (monthly average from hourly data).
MonthWest CoastCentral CoastCentral InlandInland Nat. Parks
Heating Period Tamb (°C)Cooloing Period Tdew (°C)Heating Period Tamb (°C)Cooloing Period Tdew (°C)Heating Period Tamb (°C)Cooling Period Tdew (°C)Heating Period Tamb (°C)Cooling Period Tdew (°C)
January9.44.811.15.39.24.44.21.2
February9.64.811.15.39.44.66.01.2
March11.26.412.46.811.16.18.92.6
April11.87.613.07.811.87.310.83.8
May14.310.315.410.514.410.414.86.5
June17.213.318.313.517.713.720.19.6
July18.614.519.714.818.914.721.010.1
August19.215.220.415.319.515.320.010.3
September17.613.518.913.717.713.817.98.8
October15.310.916.611.315.311.112.87.9
November11.57.313.27.711.27.17.54.0
December9.65.011.45.69.24.64.51.3
Table 8. Heating and domestic hot water demand for the locations and insulation thickness.
Sub-RegionLocation4BB3BB
Heating DemandDHWHeating DemandDHW
6 cm12 cm20 cm30 cm6 cm12 cm20 cm30 cm
XPSXPSXPSXPSXPSXPSXPSXPS
West CoastCaridad218312929147332
Valdés2410422933179432
Central CoastLuanco219422928147432
Gijón219412929147432
Central InlandOviedo31157429422313832
Entrego29136329392112732
Inland Nature ParksIbias42261712295633211532
Lena31179529412213732
Aller41241510295432201332
Amieva311710629422313832
Cabrales321810629432414832
Values in (kWh/m2 year).
Table 9. Embodied cradle-to-grave impacts of the building components: primary energy and CO2 equivalent emissions for 4BB and 3BB with various insulation thicknesses.
Thickness (cm)4BB3BB
Energy kWh/m2 yearCO2 eq kg/m2 yearEnergy kg/m2 yearCO2 eq kg/m2 year
620.758.2423.419.33
1224.108.9527.1210.12
2028.559.9032.0711.17
3034.1211.0938.2512.49
Table 10. Embodied cradle-to-grave impacts of the active technical systems: primary energy and CO2 equivalent emissions for 4BB and 3BB.
Active Systems Scenario4BB3BB
Energy kWh/m2 yearCO2 eq kg/m2 yearEnergy kWh/m2 yearCO2 eq kg/m2 year
Electricity only6.091.126.431.20
Heat pump plus electricity8.252.058.872.29
Natural gas boiler8.421.779.171.95
Table 11. Criteria for comparing the impacts for different energy supply scenarios.
CriteriaImpactScenario
Electricity Only (2018) [46]Heat Pump Plus Electricity (2018) [46]Natural Gas Boiler (2016) [25]Electricity Only (2030) [46]
AverageEP74.255.463.059.4
GWP59.338.052.540.4
Max (3BB, 6 cm)EP86.768.978.776.0
GWP75.050.069.057.2
Min (4BB, 30 cm)EP63.346.051.147.0
GWP48.030.941.430.5

