Article

Optimal Selection of Integrated Electricity Generation Systems for the Power Sector with Low Greenhouse Gas (GHG) Emissions

1
Department of Chemical Engineering, Pakistan Institute of Engineering and Applied Sciences (PIEAS), Islamabad 45650, Pakistan
2
Department of Chemical Engineering, Khalifa University of Science and Technology, SAN Campus, P.O. Box 2533, Abu Dhabi, UAE
3
Department of Chemical Engineering, University of Waterloo, Waterloo, ON N2L 3G1, Canada
*
Author to whom correspondence should be addressed.
Submission received: 29 July 2020 / Revised: 27 August 2020 / Accepted: 29 August 2020 / Published: 3 September 2020

Abstract

:
Cheap and clean energy demand is continuously increasing due to economic growth and industrialization. The energy sectors of several countries still employ fossil fuels for power production and there is a concern of associated emissions of greenhouse gases (GHG). On the other hand, environmental regulations are becoming more stringent, and resultant emissions need to be mitigated. Therefore, optimal energy policies considering economic resources and environmentally friendly pathways for electricity generation are essential. The objective of this paper is to develop a comprehensive model to optimize the power sector. For this purpose, a multi-period mixed integer programming (MPMIP) model was developed in a General Algebraic Modeling System (GAMS) to minimize the cost of electricity and reduce carbon dioxide (CO2) emissions. Various CO2 mitigation strategies such as fuel balancing and carbon capture and sequestration (CCS) were employed. The model was tested on a case study from Pakistan for a period of 13 years from 2018 to 2030. All types of power plants were considered that are available and to be installed from 2018 to 2030. Moreover, capacity expansion was also considered where needed. Fuel balancing was found to be the most suitable and promising option for CO2 mitigation as up to 40% CO2 mitigation can be achieved by the year 2030 starting from 4% in 2018 for all scenarios without increase in the cost of electricity (COE). CO2 mitigation higher than 40% by the year 2030 can also be realized but the number of new proposed power plants was much higher beyond this target, which resulted in increased COE. Implementation of carbon capture and sequestration (CCS) on new power plants also reduced the CO2 emissions considerably with an increase in COE of up to 15%.

1. Introduction

Energy demand is growing rapidly due to population growth, industrial developments and increased comfort standards. Increased energy demand requires progress in the power sector to ensure energy security. Various energy sources like fossil (e.g., coal, oil, natural gas (NG)) and non-fossil (e.g., solar, hydroelectric, wind, nuclear, biomass) are mainly utilized to meet the energy demand. Many countries are facing serious shortfalls in meeting the cheap energy demand for the past two decades [1]. Pakistan for instance adopted a coal based power under the China Pakistan Economic Corridor (CPEC) as a short term solution. Under CPEC, some of the coal based power plants (e.g., Sahiwal coal power plant, HUB coal power plant) have been installed while remaining plants (e.g., Thar coal, Balloki coal power plant) are expected to be installed in the near future. Current energy mix includes around 68% fossil fuel based energy as shown in Figure 1 [2]. Fossil fuel based energy sources (especially coal) are responsible for greenhouse gas (GHG) emissions such as carbon dioxide (CO2), which accounts for the highest portion of GHG emissions due to its huge volumes [3,4]. These emissions are of great concern due to global warming issues. Furthermore, future increase in fuel prices may also significantly increase the cost of electricity (COE) [5], as most of the power generation is based on fossil fuels. Some other factors responsible for the increase in COE are poor choice of fuel, inefficiencies of thermal plants, uncertain policies, delay in hydroelectric power projects, and transmission and distribution losses [6]. Most of the fossil fuel based power plants utilize costly furnace oil (FO), which shares 33% in all fossil fuel based power plants. However, despite the large hydroelectric potential, the current energy mix of Pakistan involves only 21.3% of hydroelectric power as shown in Figure 1. In contrast, renewable energy sources are now competitive with fossil fuels, with solar energy being the most important one [7]. The future energy mix should have a greater share of renewable energy to avoid environmental damage and ensure energy security. Projected emissions of CO2 will rise more than two times until 2030, as shown in Figure 2 [8]. Pakistan has proposed to achieve 37% reduction in GHG emissions by 2030 [9]. Moreover, Pakistan has recently signed the Paris Agreement [10]. This shows the concern of climate protection agencies of Pakistan to minimize the CO2 emissions to contribute in achieving stabilized atmospheric level emissions and to attract foreign investments in the power sector.
Cost of electricity (COE) for different types of power plants is given Table 1 [11,12,13,14]. Solar, wind and NG based plants have low COE, as shown in Table 1. There are issues related to the availability of NG in Pakistan as NG resources are depleting at much higher rates resulting in decreased pressure from wells. Due to high domestic consumption for heating purposes during winter, the availability of NG is significantly affected. Furthermore, the Pakistan-Iran gas pipeline project was affected due to some political reasons. Although a huge amount of coal is available in Pakistan, hydroelectric power plants involve much higher capital cost as well as high construction time than coal based power plants. Due to huge investments, high construction time and political instability, governments in Pakistan generally do not adopt the hydroelectric power plants. Biomass technology is not very advanced in Pakistan and availability of biomass varies from season to season. Solar and wind power has become cheaper than fossil fuel due to technological advancements in recent years. Despite the least COE, attention was not paid towards solar and wind power plants due to investment issues. However, Pakistan is now focusing on solar and wind energy. In this regard, Pakistan has recently signed an agreement for 560 MW of new wind power facilities [15]. Coal power plants were considered due to huge investments from China via CPEC projects in the past few years. Apart from CPEC, special interest of China for the development of coal technology in Pakistan was also due to its future interest for the import of coal from Pakistan. On the other hand, Pakistan was facing serious electricity short fall. Hence, Pakistan adopted coal based power generation under CPEC projects to meet its energy demands in minimal time.
Future variations in fuel prices will significantly affect the COE, and hence energy planning efforts. Variations in fuel prices are generally predicted taking into account the advancement in technologies for extraction of those fuels, fluctuating world economics, supply and demand situations, and political considerations [5]. The projections of fuel prices of various fossil fuel types used in thermal power plants are shown in Figure 3. For the national fuel reserves of natural gas, projections of fuel prices are taken from the Pakistan Energy Yearbook 2018 [2]. Whereas, for the imported fuels and local coal, projections are taken from NTDC Report [5], based on the data from various national and international organizations. As shown in Figure 3, it represents the price projection for both imported (e.g., FO and LNG) and nationally extracted fossil fuels (e.g., coal and NG). The prices of FO and LNG are increasing rapidly compared to NG. Therefore, the COE for these power plants will rise at higher rates in the future. On the other hand, energy demand will also increase in the future. Prior planning will require future energy demand predictions, which may be done based on gross domestic product (GDP) growth predictions. The National Transmission and Dispatch Company (NTDC) of Pakistan projected the electricity demand for three possible GDP scenarios, which are low (3.5% GDP growth), normal (5% GDP growth) and high (6.5% GDP growth) [16]. These projections are shown in Figure 4.
Various long term strategies for power planning are employed considering the available energy supply resources and finances. The business as usual (BAU) scenario urges to use government-developed policies and plans for fulfilling the future energy demands for the next two decades [17]. The second strategy is the new coal (NC) scenario. Considering the large coal reserves of Pakistan that are projected to be 185.5 billion tons [18], the NC scenario focuses on utilizing the local coal reserves instead of imported furnace oil for electricity generation. Finally, the green future (GF) strategy focuses on using renewable energy instead of fossil fuel based electricity generation [17]. The BAU strategy is considered in this study. However, capacity expansion is employed if the demand is not met by the BAU strategy.
Furthermore, various CO2 mitigation techniques are available for CO2 mitigation such as fuel balancing, fuel switching, using renewable energy, carbon capture and sequestration (CCS), and geo-engineering [19]. Fuel balancing involves the adjustment of all power plants in such a way that major electricity load relies on non-fossil fuel based power plants rather than fossil fuel based power plants to reduce CO2 emission [20]. Less carbon intensive fossil fuels (such as NG rather than coal) are used in the fuel switching technique. CCS has gained significant attention due to its effectiveness (90% efficiency) of carbon removal as post-combustion or pre-combustion capture. A CCS system can also be installed on existing fossil fuel power plants with additional retrofitting costs. It has been observed that the capital cost of a fossil fuel based power plant fully equipped with a CCS system increases by 36% to 110%, depending on the technology adopted, compared to normal thermal power plants [21]. Furthermore, the researchers are currently shifting their focus from CCS to carbon capture and utilization (CCU) to avoid storage issues associated with CCS and to promote utilization of CO2 for other useful products. The selection of CO2 mitigation technologies depends on various factors such as available resources, financial constraints, potential of renewable energy, technological developments, etc. B. Jia et al. [22] presented the current progress of CO2 injection enhanced oil recovery (EOR) and carbon storage in shale oil reservoirs. This provides a good option of CO2 utilization after being captured. P. Gabrielli et al. [23] compared three techniques including carbon capture and storage, carbon capture and utilization, and increased use of biomass, to mitigate CO2 emissions. R. Ahmed et al. [24] reviewed recent advances in carbon adsorbents for selective CO2 capture and separation during combustion processes. C. Bassano et al. [25] discussed economic evaluation for the production of synthetic natural gas from coal and biomass via power to gas plants with CCS.
The above discussion calls for a comprehensive strategy for energy planning and optimization of the power sector to achieve cheap electricity demand with reduced impact on the environment by associated emissions. Several authors have presented optimization models for energy planning at various scales and are widely supported for energy resource allocation, technological selection and predicting the promising and environmentally friendly paths [26,27,28,29,30]. These optimization studies involve the formulation of mixed integer programming (MIP) models. Initially, this approach was applied to optimize the energy mix of the process industry during the short and long term periods to minimize the overall cost of energy in the process industry of India [31]. In this study [31] a mixed integer linear programming (MILP) model was developed for the optimal decision regarding the energy mix comprising purchased electricity and electricity generation using an internal source of the process industry. However, CO2 mitigation was not taken into account. In another study [32], a linear optimization model was presented for the possible CO2 mitigation from the electric sector of Taiwan. Various CO2 mitigation techniques such as fuel alternatives, energy conservation, reduced peak production, improved electric efficiency and CO2 capture technologies were considered and compared [32]. In another study [33], the conventional energy system optimization model was improved by incorporating an important sub-model for the energy intensive pulp and paper industry, and a case study was presented for energy planning in Finland. It was found that abatement of CO2 emissions in Finland was not a preferable option, however, other solutions for CO2 mitigation exist. Instead of using a single economic indicator, a multi objective model including both the economic and environmental objectives was considered [33]. This multi objective mixed integer linear programming (MOMILP) model also addressed the expansion capacity for energy generation and demand side management.
A single period mixed integer programming (SPMIP) model applied to an existing Ontario Power Generation was presented by H. Hashim et al. [34], by incorporating the various power generation plants such as coal, natural gas, nuclear, hydroelectric and alternative energy sources. Three operating modes such as economic mode, environmental mode and integrated mode, were investigated [34]. The integrated mode was the multi-objective mode that combined both economic and environmental modes. Both fuel balancing and fuel switching CO2 mitigation options were considered. However, CCS was not considered as a mitigation option. Furthermore, various scenarios such as base-load demand, 0.1% growth rate in demand, 0.5% growth rate in demand and 1.0% growth rate in demand were employed. It was reported that the fuel balancing can contribute up to 3% for CO2 reduction. For further reduction in CO2 emission, fuel switching and plant retrofitting should be employed [34]. This work [34] was extended by H. Mirzaesmaeeli et al. [35], by formulating a multi-period mixed integer programming (MPMIP) model for energy planning of Ontario considering both fuel switching and CCS techniques for CO2 mitigation. In another extension of H. Hashim et al.’s [26] work, a fleet-wide model for energy planning incorporating power generation from existing and suggested new additional power plants along with recommended CCS and retrofit actions to meet the demand target as well as CO2 mitigation target for minimum COE was presented [36]. An MIP model was developed for energy planning of Malaysia [19] and Turkey [37] by minimizing the COE with CO2 reduction targets. For Malaysia, three CO2 mitigation strategies were used including fuel balancing, fuel switching and installation of new renewable power plants. While for Turkey, only installation of new power plants was considered as a CO2 mitigation technique. The optimal evolution of the new power generation technologies was incorporated to meet the energy targets using a multi-period MILP model for UAE’s power sector by minimizing the cost and CO2 emission for the time periods between the years 2015 and 2040 [38]. The use of CCS and alternative energy options were used for CO2 mitigation. D. Zhang et al. [39] used multi-period optimization for power planning of China until 2050 considering CO2 mitigation. In this study, capacity expansion, retrofitting and decommissioning were considered. For CO2 mitigation, CCS retrofitting and installation of new renewable power plants were considered. Moreover, a year-by-year power development plan was proposed. It was found that renewable energy sources were unable to completely replace fossil fuels. Anticipated increase in electricity demand by penetration of plug-in hybrid electrical vehicles was studied by L. Ahmadi et al. [40]. The multi-period optimization was used for planning of electricity generation systems for Ontario considering different case studies. C. B. Hibbert et al. [41] optimized future electricity supply for the UK using multi-period mixed integer linear programming. The main objectives were the optimization of the whole system costs and global warming potential. Negative carbon emissions were also achieved by implying carbon capture and storage on biomass. H. Tekiner et al. [42] studied multi-period multi-objective optimization of electricity expansion planning using Monte-Carlo simulation. Installation of new non-fossil fuel power plants was considered for CO
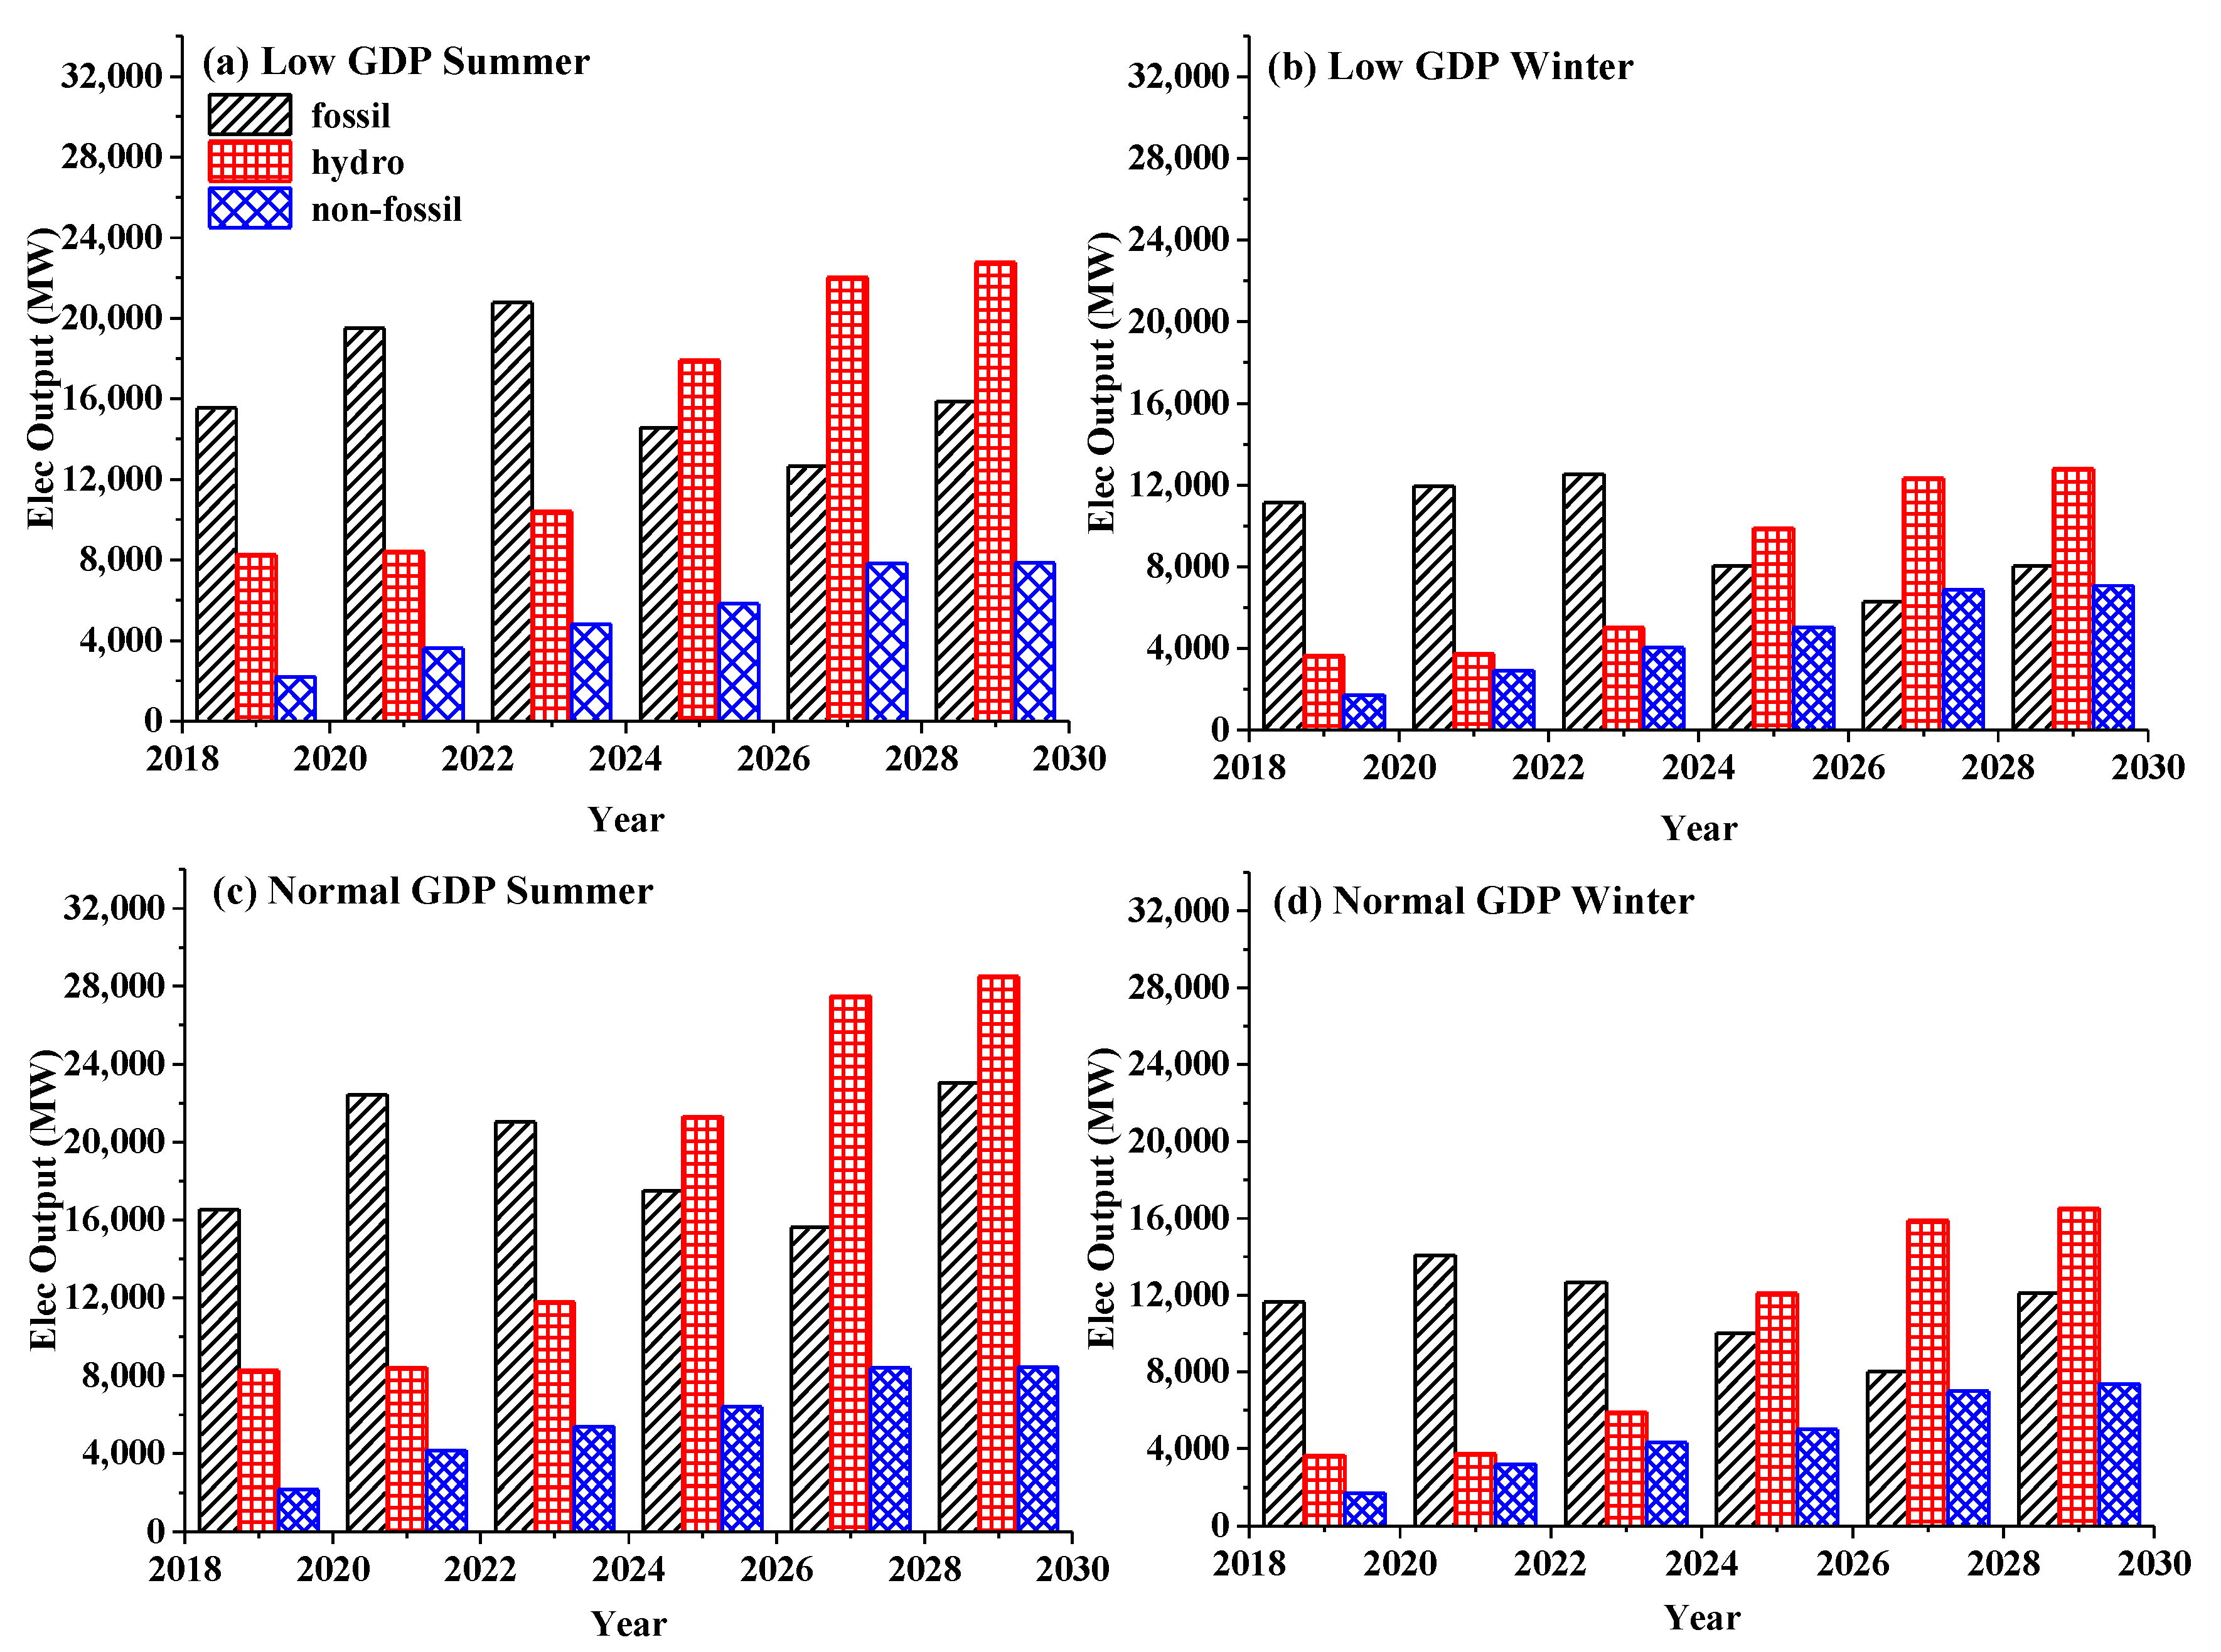
2 mitigation. The novelty of this study is that no such study is being conducted for Pakistan. Moreover, most of the previous studies were based on an annual basis. This study includes the time period for summer and winter of six months each instead of a year and also considers two different GDP’s (low and normal).
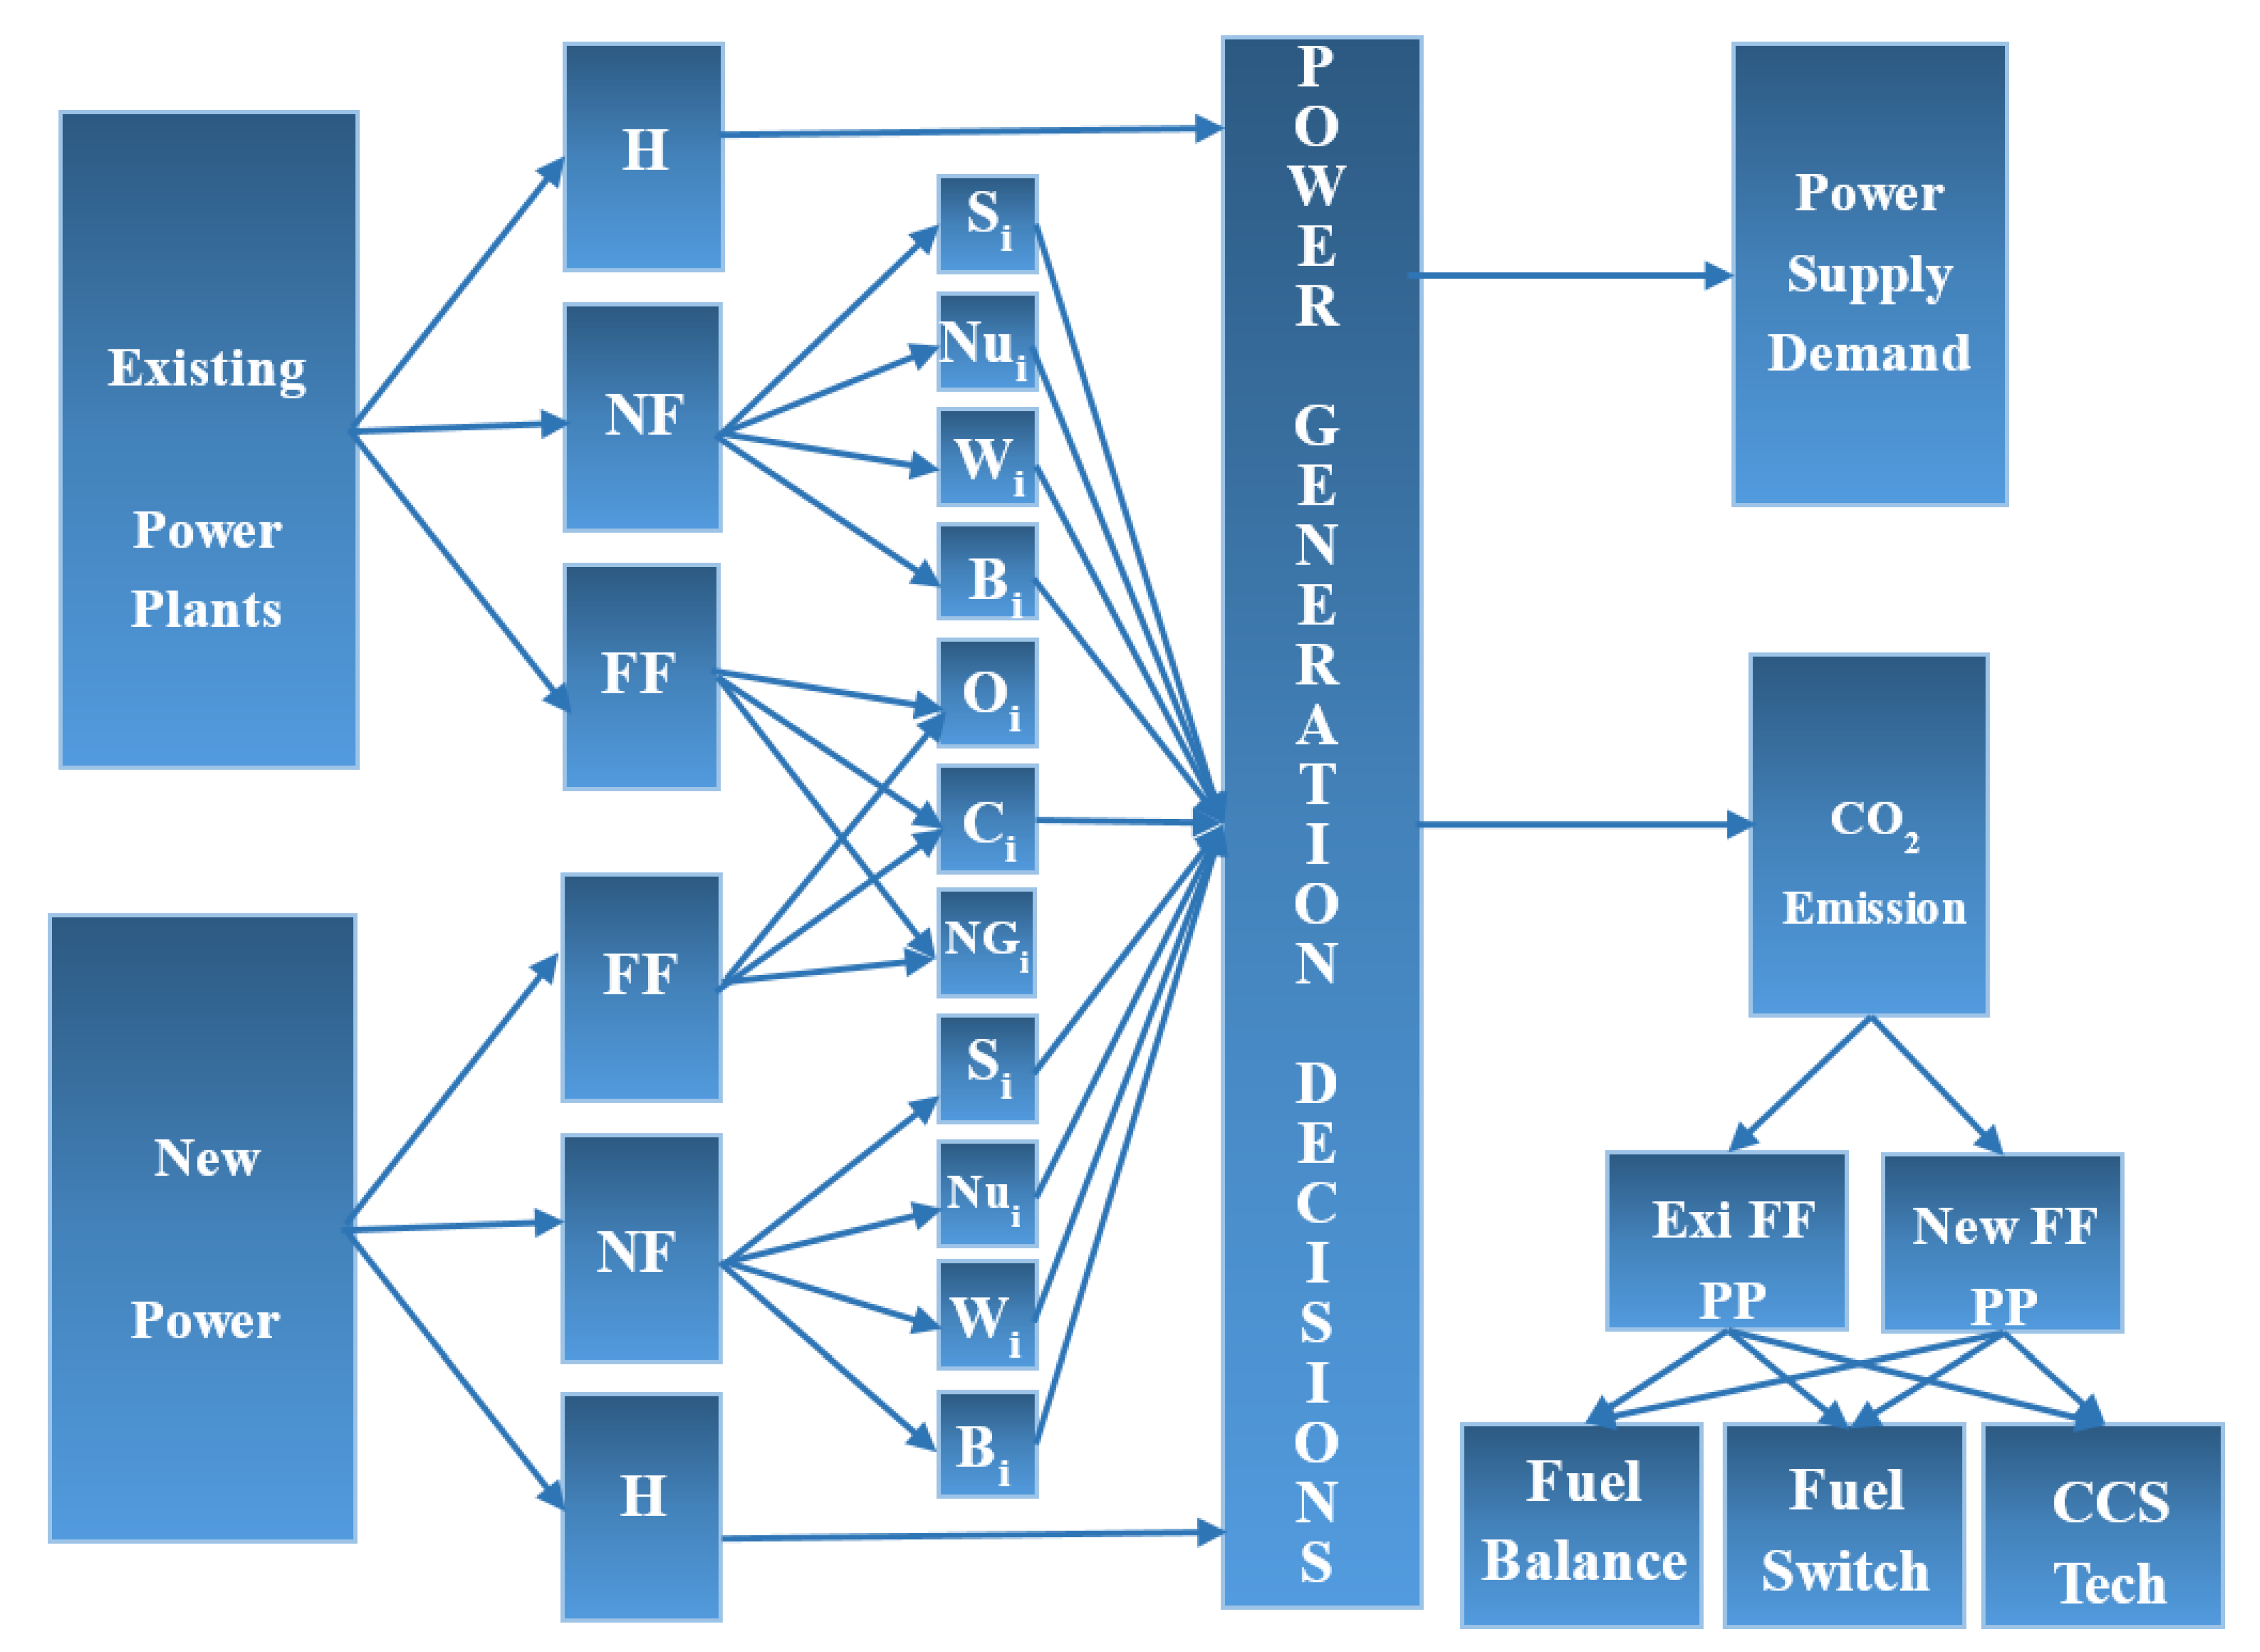
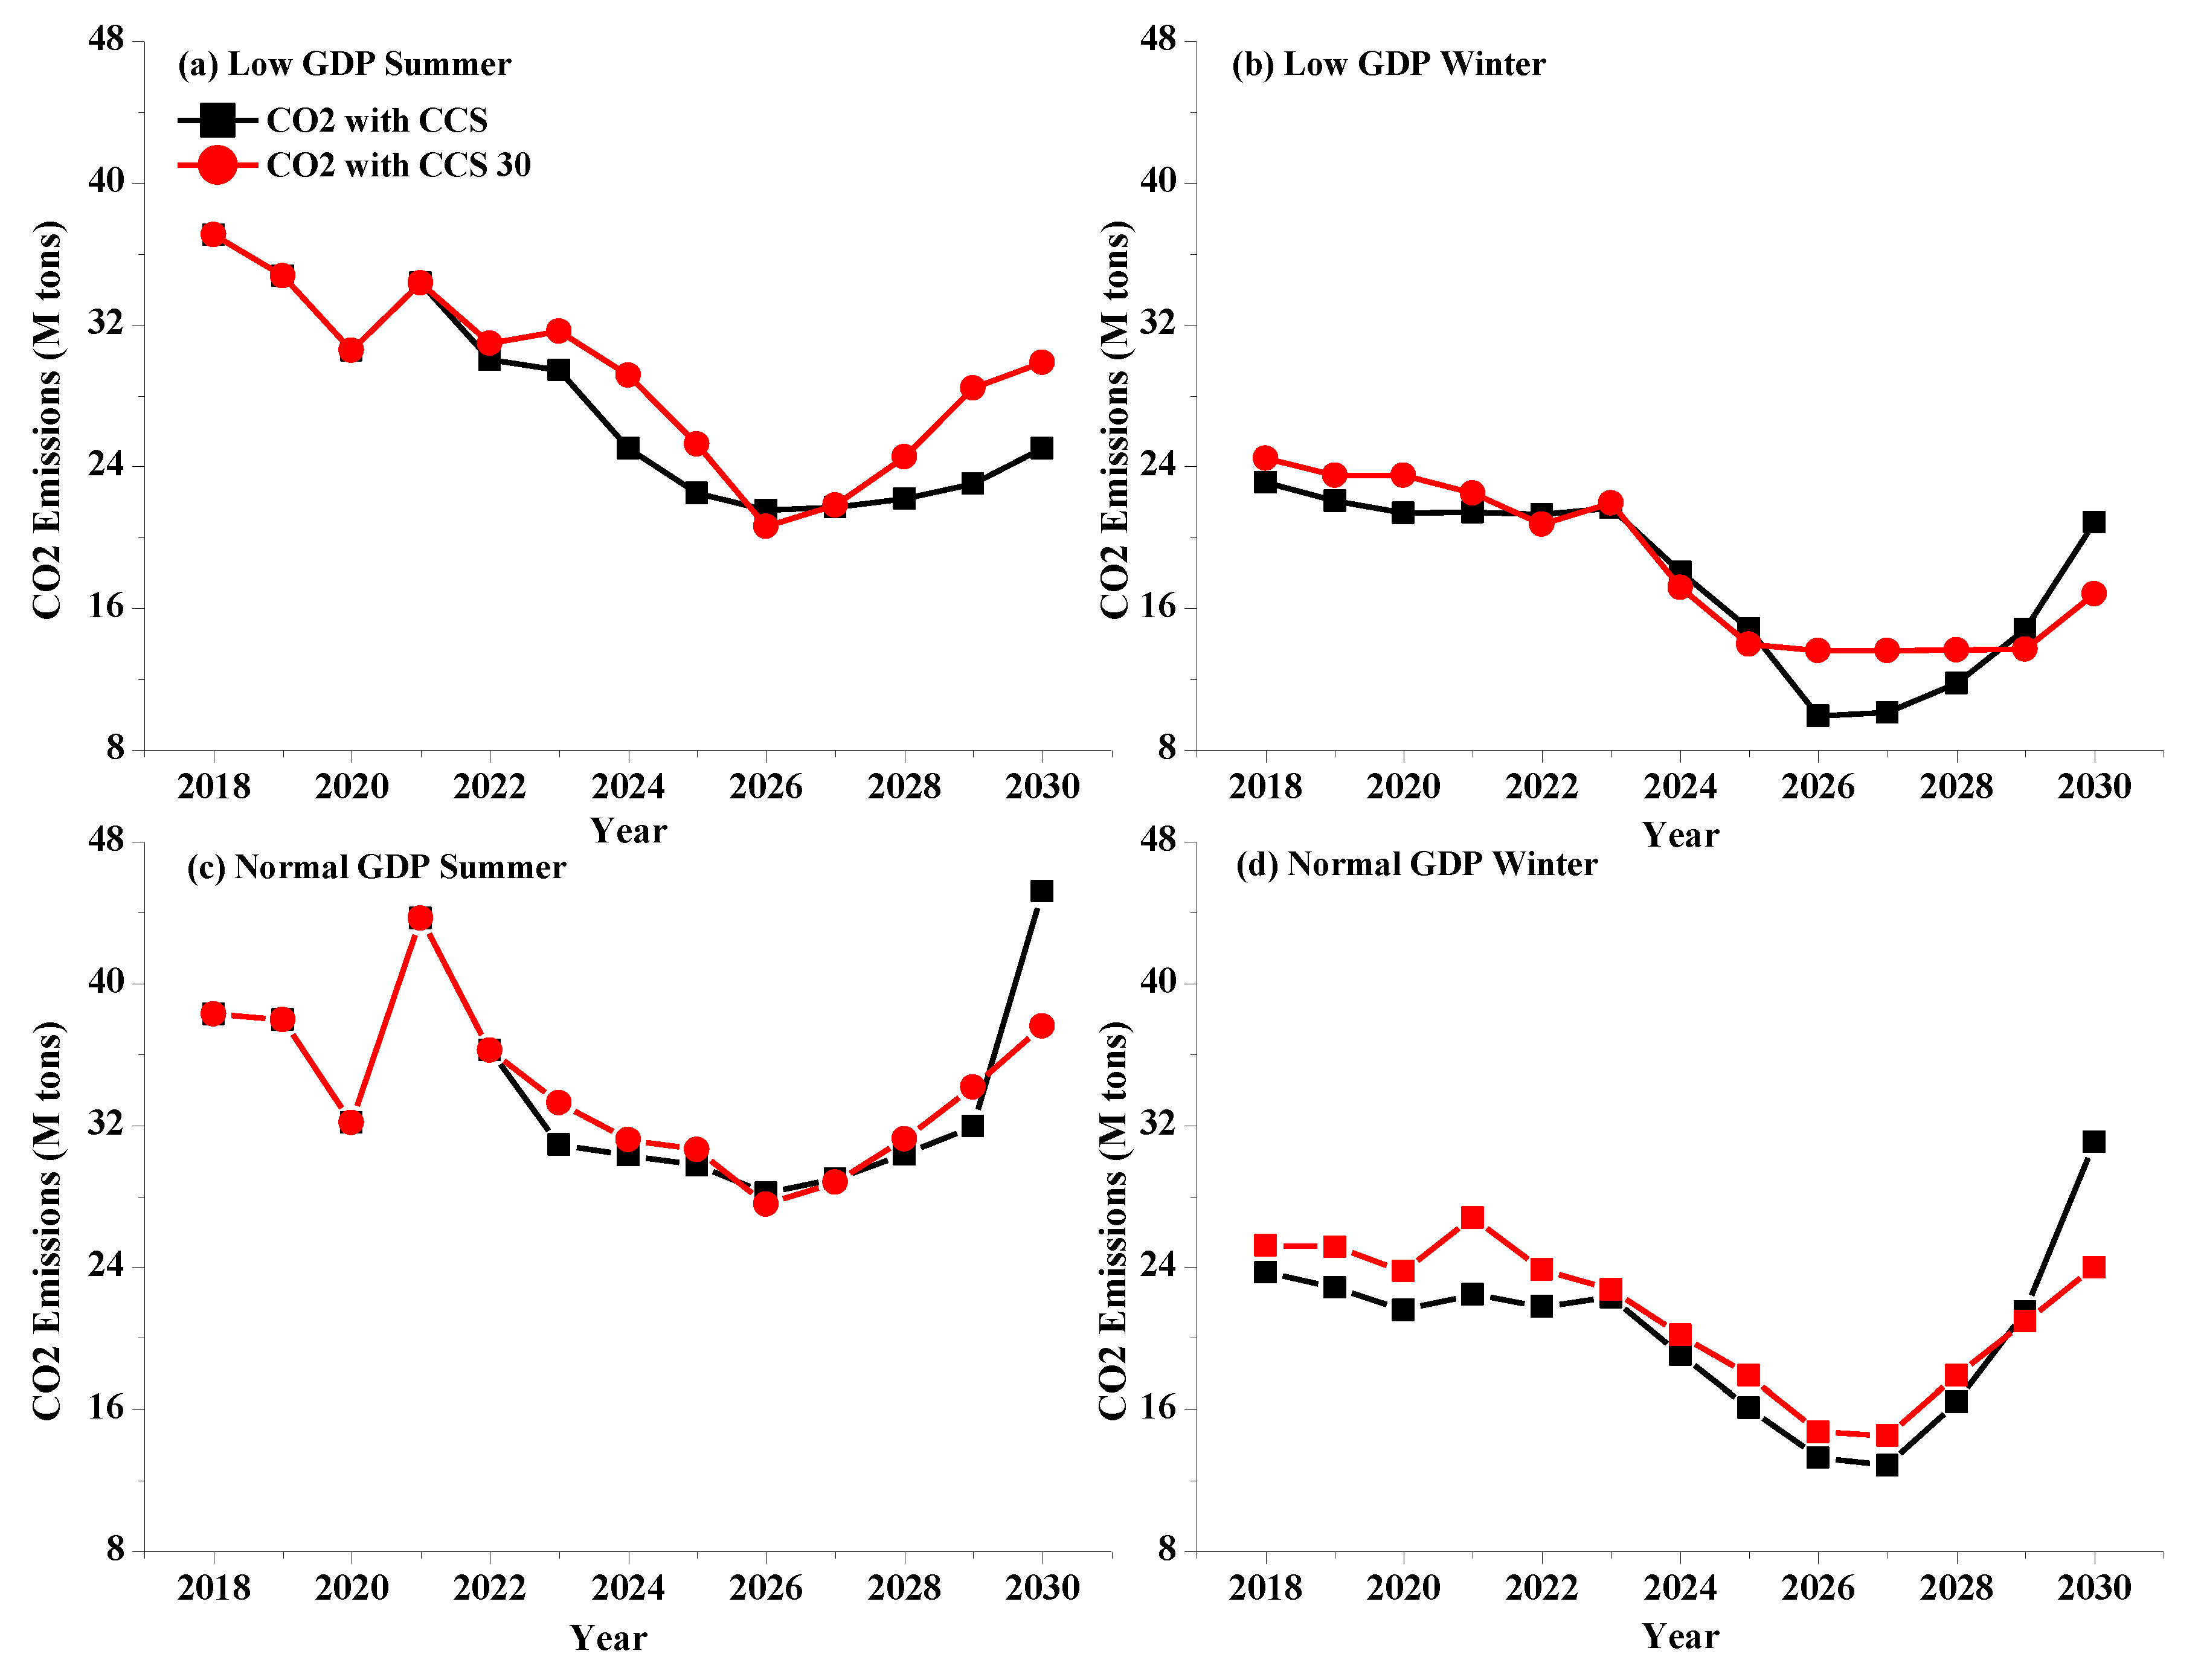
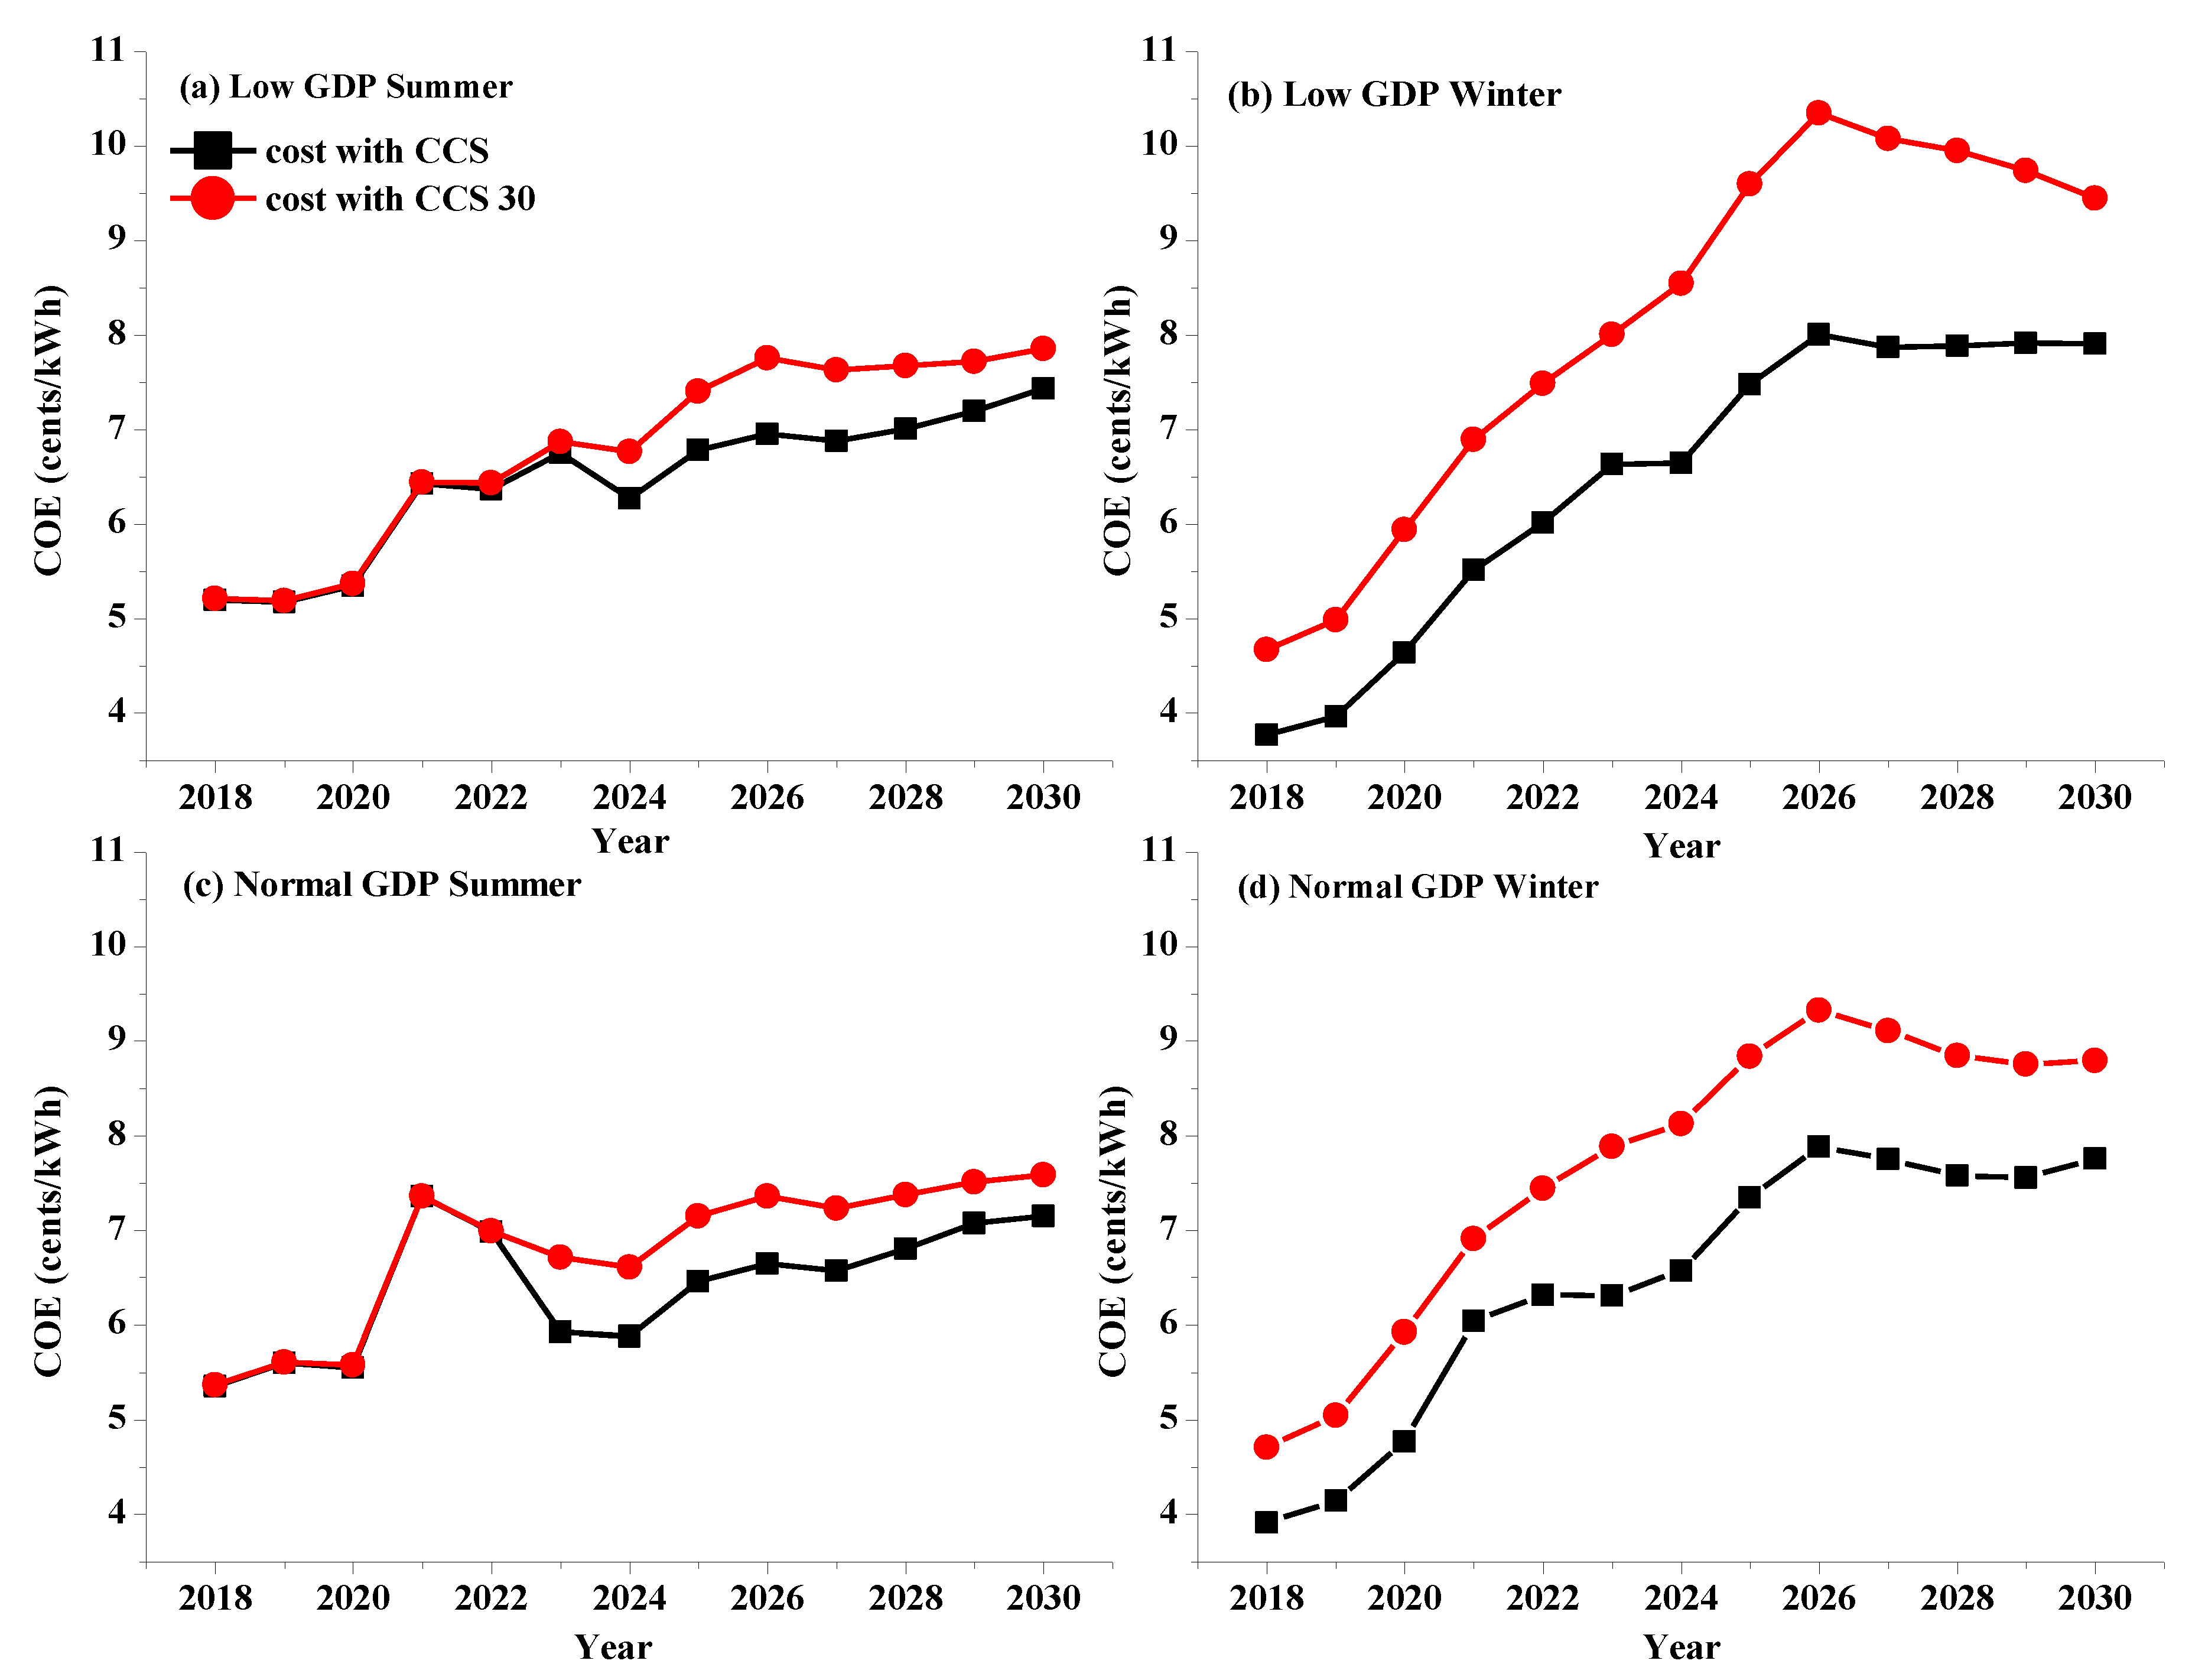
To this end, limited studies are available to optimize the energy mix with reduced emission targets by considering all the energy sources as discussed in the previous paragraphs. Furthermore, no such study is carried out for optimizing Pakistan’s power sector. Hence, a comprehensive approach is required to optimize the future energy mix of Pakistan. The insights obtained by optimizing the energy sector of Pakistan will be useful for future decision making. Two CO2 mitigation strategies (fuel balancing and CCS technology) are employed in this study for energy planning of Pakistan with low CO2 emission targets. An MPMIP model was formulated to optimize the power sector of Pakistan by minimizing the total cost associated with electricity demand over the time horizon under consideration. The model was developed for a period of 13 years from 2018 to 2030. The developed model considers all types of power plants (fossil fuel, hydroelectric, and other non-fossil), and also incorporates those power plants that are to be installed in the future as planned by the relevant authorities. Moreover, the optimizer will consider capacity expansion by optimally proposing new power plants if the demand is not met by the already existing plants as well as the planned plants to be installed in the future. Up to 40% CO2 mitigation was attained by the year 2030 without any rise in COE for low GDP, and for normal GDP, mitigation was attained with the increased COE (i.e., around 15%). Nevertheless, the average rise in COE using CCS was 12.4, 4.8, 2.7, and 7.7 for reducing the average CO2 emissions by 35.4, 8.7, 39.6 and 37.2, respectively, for low GDP summer, low GDP winter, normal GDP summer and normal GDP winter.
The rest of the paper summarizes all the steps of methodology such as problem statement, data collection, superstructure development, model formulation and the solution approach. Various case studies have been investigated from the perspective of Pakistan’s energy scenario. Then, the results are presented and discussed. Finally, conclusions are presented and recommendations for future work are given.

2. Methodology

Considering the current energy scenario and ever increasing GHG emissions, a comprehensive strategy is required to optimize the energy mix by minimizing the COE while meeting the CO2 emission targets over a time horizon. The developed methodology leads to the formulation of an MPMIP model to optimize the power sector with low GHG emissions. GHG reduction targets are achieved by incorporating various CO2 mitigation strategies such as fuel balancing and CCS. Various steps are involved in the developed methodology such as problem statement, literature review, data collection, model formulation and finally the solution of the optimization problem, as shown in Figure 5. The developed model will provide the optimal energy mix of the power sector to meet the present and future cheap and clean electricity demand. The model is applied to the case study of Pakistan for a period of 13 years, i.e., from 2018 to 2030. The model is implemented in the General Algebraic Modeling System (GAMS), and it minimizes the total cost associated with electricity demand incorporating the associated constraints over the time horizon under consideration. Details of all the steps of the methodology are presented in the following sub-sections.

2.1. Problem Statement

The research problem investigated in this study is holistic in its nature and incorporates all kinds of power production systems including thermal power plants, hydroelectric power plants, solar power plants, wind power plants, biomass power plants and nuclear power plants. Both the existing power plants and the new power plants, which are planned to be installed are considered. However, the broad classification of the power plants includes fossil fuel (FF) based power plants and non-fossil (NF) power plants. The fossil fuel types include coal, natural gas (NG), liquefied natural gas (LNG) and furnace oil (FO). Further details of the optimization problem are summarized below.
  • Set of existing fossil fuel based power plants “i” with fuel type “j”, where j coal, NG, LNG, FO.
  • Set of existing non-fossil based power plants “u”.
  • Set of new planned power plants “p” with fuel type “q”, where q FF, NF.
  • Set of new proposed fossil fuel power plants “a”.
  • Set of new proposed non-fossil fuel power plants “c”.
  • Each power plant can produce electricity as per defined gross capacity and capacity factor (CapFactor) for any individual power plant.
  • The cost for the existing power plant consists of fixed O&M cost, variable O&M cost and fuel cost.
  • No fuel cost for NF power plants.
  • New power plants will also have capital cost (CapCost).
  • CCS can be implemented on new FF based power plants.
  • The optimization problem is solved for a period of 13 years (2018 to 2030) by considering summer and winter scenarios separately due to seasonal dependence of electricity demand.
  • Both the low and normal GDP scenarios are considered.
The objective of the optimization model is to find:
  • The minimum COE for the reference case.
  • The minimum COE by implementing CO2 mitigation techniques for emission reduction including fuel balancing and CCS.
  • Optimal distribution of power production by each individual power plant.

2.2. Data Collection

In the first step, necessary data is collected for 272 power plants of Pakistan that include both existing and new power plants, which are planned to be installed between years 2018 and 2030. A short summary of the types of these plants is presented in Table 2. The data required for the development of this optimization model includes fixed and variable operating and maintenance costs, gross capacity, capacity factor, fuel cost, CO2 emission data of both existing and newly installed fossil fuel based power plants, capital cost of new power plants that are to be installed in the future, and carbon capture cost for fossil fuel based existing and new power plants. Furthermore, other required information includes electricity demand and CO2 mitigation targets.

2.3. Superstructure Development

The current optimization study involves various options such as the type of fuel, type of power plant and CO2 mitigation technique. A superstructure model represents the potential pathways available for an optimization tool to play with several decision variables in order to provide the best optimal mix. The developed superstructure model is presented in Figure 6. It represents the energy supply from various power plant types with all CO2 emission and potential CO2 mitigation techniques. The notations used for the fuel type are Ci, Oi, NGi, Hi, Si, Bi, Wi and Ni representing coal, oil, natural gas, hydroelectric, solar, biomass, wind and nuclear, respectively. Whereas, the notations used for the type of power plant are FF (Fossil Fuel) and NF (Non-Fossil Fuel) for both existing and new power plants. Due to its importance, H (hydroelectric) is also included in this general classification for the explanation of results. The subscript ‘i’ is designated for the power plant type where ‘exi’ represents the existing power plant and ‘new’ represents those power plants that are to be installed in the future.

2.4. Model Formulation

An optimization formulation involves an objective function that is to be maximized or minimized along with some associated constraints under which the optimization model is bound to provide the optimized values of desired variables. For this study, under desired CO2 mitigation and electricity demand targets, the optimization problem involves two sets of variables as described below.
  • Continuous Variables: The variables representing electricity output from all existing and new power plants are continuous variables, and provide continuous power output from each power plant, including “Eijt” (electricity output from fossil fuel based existing power plants “i” with fuel type of “j” in the time period “t”), “Eut” (electricity output from non-fossil fuel based existing power plants “u” in the time period “t”), “Epqt” (electricity output from new planned power plants “p” of fuel type “q” in the time period “t”), “Eat” (electricity output from new proposed fossil fuel power plant “a” in the time period “t”), “Ect” (electricity output from new proposed non-fossil fuel power plant “c” in the time period “t”).
  • Binary Variables: These variables represent binary decisions regarding the selection of existing fossil, existing non-fossil and new (both fossil and non-fossil) power plants. These variables include “xijt” (binary variable for the selection of existing power plant “i”, consuming fossil fuel of type “j” in the time period “t”), “yut” (binary variable for the selection of existing non fossil power plant “u” in the time period “t”), “zpqt” (binary variable for the selection of new planned power plant “p” with fuel type “q” in the time period “t”), “nat” (binary variable for selection of new proposed fossil fuel power plant “a” in the time period “t”) and “bct” (binary variable for selection of new proposed non-fossil fuel power plant “c” in the time period “t”). Binary variables are also referred to as decision variables and their values are either 1 or 0. These variables are responsible for the type of power plant the optimization model chooses and whether to include them in the grid or not.

2.4.1. Objective Function

The main objective is to minimize the total cost associated with electricity demand by optimal selection of power output by each power plant while satisfying CO2 mitigation targets.
Min f
s.t.
g(x) ≤ 0
where, ‘f’ is the total cost over the whole time horizon under study that is to be minimized and is given as follows.
f   =   i j t F i x i j t G C a p i j t x i j t + i j t V a r i j t E i j t Q + i j t V j t G i j E i j t Q + u t F i x u t G C a p u t y u t + u t V a r u t E u t Q + p q t F i x p q t G C a p p q t z p q t + p q t V a r p q t E p q t Q + p q t V q t G p q E p q t Q + p q t C a p C o s t p q t G C a p p q t + p q t C C S p q C O 2 p q t   ε   E p q t Q + a t F i x a t G C a p a t n a t + a t V a r a t E a t Q + a t V a t G a E a t Q + a t C a p C o s t a t G C a p a t + a t F i x a t G C a p a t n a t c a p + a t V a r a t E a t c a p Q + a t V a t G a E a t c a p Q + a t C a p C o s t a t G C a p a t n a t c a p + a t C C S a C O 2 a t ε   E a t c a p Q + c t F i x c t G C a p c t b c t + c t V a r c t E c t Q + c t C a p C o s t c t G C a p c t b c t
In Equation (1), superscript “cap” shows with CO2 capture. Where, the details of all the terms in above objective function along with their units are presented in the nomenclature table. COE is calculated for each period using Equation (1) except summation over time. Moreover, for each period, the units of the Equation (1) will be $/(time period) and the required multiplication factor ($/(time period) = 1/(10*Q*EDt(MW)) cents/kWh) was used to make the units of the COE as cents/kWh. Fuel cost was used only for fossil fuel based power plants and assumed negligible for hydroelectric and other non-fossil fuel based power plants. Equation (1) can be used for low GDP and normal GDP, separately. Both summer and winter scenarios are included in Equation (1) with odd numbers for summer (t = 2n − 1, n = 1, …, N) and even numbers for winter (t = 2n, n = 1, …, N). The model is solved for all N (=13) years, and the BAU strategy is employed where each period has its own electricity demand, mitigation targets and the new power plants to be installed in the future are already planned by the government. Furthermore, new power plant will also be proposed by the optimizer for capacity expansion if the demand is not met by the already existing plants and the plant to be installed in the future.
Optimization of selection means at what load power plants should work in order to get the minimum COE and which plant (type and capacity) should be constructed to meet the future electricity demand with given mitigation targets. There are some weaknesses in the proposed method because return on equity (ROE), return of equity during construction, insurance and debt servicing were not included. However, for preliminary study these can be neglected. However, all the other main costs including fixed and variable O&M costs, fuel costs, etc., were included, and it provides a good initial feasibility study for both low and average GDPs (for summer and winter).

2.4.2. Model Constraints

The model developed in this study involves some constraints, in addition to the objective function, that are not to be violated while providing the optimal solution. The electricity demand constraint specifies that the sum of the net annual electricity output by each existing (fossil and non-fossil fuel), new planned (fossil and non-fossil fuel) and new proposed (fossil and non-fossil fuel) power plants must be greater than or equal to the desired annual electricity target, and is represented as follows.
            i j E i j t + u   E u t + p q   E p q t + a   E a t + a   E a t c a p + c   E c t   E D ( t )           t
The plant capacity constraint sets an upper bound that the power output from each existing, new planned and new proposed (fossil and non-fossil fuel) power plant can only be less than or equal to its net electric capacity.
  • Existing Fossil Fuel Plants
            E i j t C a p F a c t o r i j t   G C a p i j t   x i j t         t ,     i ,     j F F
  • Existing Non-Fossil Fuel Plants
    E u t     C a p F a c t o r u t   G C a p u t   y u t         t ,     u N F
  • New Power Plants (To be Installed)
            E p q t     C a p F a c t o r p q t   G C a p p q t   z p q t         t ,     p ,   q F F   &   N F
  • New Proposed Fossil Fuel Plants (Capacity Expansion)
            E a t C a p F a c t o r a t   G C a p a t   n a t         t ,     a F F
  • New Proposed Fossil Fuel Plants with CCS (Capacity Expansion)
            E a t C a p F a c t o r a t G C a p a t c a p n a t c a p         t ,     a F F
  • Non-Fossil Fuel Plants New Proposed (Capacity Expansion)
            E c t C a p F a c t o r c t   G C a p c t   b c t         t ,     b N F
The gross capacity for new FF power plants will be updated in Equation (5) in the CCS case due to energy consumption in the CCS process.
A new proposed fossil fuel power plant can either be selected as without or with CCS. So,
        t n a t + t n a t c a p 1         a F F
The CO2 mitigation constraint sets the CO2 mitigation target to ensure a safe CO2 emission limit in fuel balancing case.
Q i j C O 2 i j t E i j t + Q p q C O 2 p q t E p q t + Q a   C O 2 a t E a t + Q a   C O 2 a t c a p E a t c a p   C E L ( t )         t
These constraints also involve some binary variables (xijt, yut, zpqt, nat, bct) that ensure which power plant is to be used and which is required to set at zero power output keeping in consideration the annual electricity demand and CO2 mitigation targets.

2.5. Model Solution

The MPMIP model was implemented in GAMS for the optimization of the power sector. The solver used was CPLEX, which is efficient for solving complex MIP models [43]. The data required for the model development such as fixed and variable O&M costs, gross capacity, capacity factor, fuel cost, CO2 emission data of both existing and new power plants, capital cost of new power plants, CCS cost, annual electricity demand and CO2 mitigation targets were arranged in an EXCEL spreadsheet. Then, the EXCEL file was imported to GAMS, which could easily read the data from the spreadsheet.
The MPMIP model involved several equations and variables. The model was executed on an HP EliteBook 8470p Intel® Core i5-3320M [email protected] with 4 GB RAM (Santa Clara, CA, USA). The runtime for each case was about 20–30 s. The model statistics are shown in Table 3. The number of equations are more for the fuel balancing case than the base case and the CCS case due to an additional constraint of the CO2 mitigation target.

3. Case Studies and Assumptions

The GDP growth of Pakistan back in 2015 and 2018 was 4.7% and 5%, respectively. Currently in 2019, the GDP growth rate is 3.2%. Considering the GDP growth rate of Pakistan for the last five years, the current study was conducted for electricity demand at two GDP growth rates, i.e., low (3.5%) and normal (5%) [16]. This study also considers BAU policy in developing the optimization model, as only the government-developed-policies and plans for fulfilling the future energy demand are considered without any capacity expansion by the model itself. Pak-INDC’s suggestion regarding CO2 mitigation of 37% until 2030 was also based on this BAU scenario [9]. However, under the BAU scenario, the power plants already planned by the government did not fit well in meeting the electricity demand for many scenarios and therefore capacity expansion was considered where needed. Three cases (reference case, fuel balancing and CCS) were investigated for electricity demand at both low (3.5%) and normal (5%) GDP growth rates.
  • The reference case was developed with no CO2 mitigation target and the sole objective was to minimize the overall COE per kWh for the power sector of Pakistan.
  • A fuel balancing approach was applied to meet the CO2 mitigation targets as suggested by Pak-INDC. In addition to terms in objective function, an additional constraint (Equation (10)) was also applied for CO2 mitigation.
  • CCS was applied on newly installed fossil fuel based power plants in order to achieve more CO2 mitigation. The energy mix was optimized to minimize the COE and meet the CO2 emission targets.
It was reported that the electricity demand and hydroelectric potential in winter reduces to 60% and 65%, respectively [44]. Keeping in consideration the load fluctuation in summer and winter seasons, these three cases were separately executed for electricity demand in summer and winter too.
All the previous discussed scenarios were modeled under the following rational assumptions.
  • All data is collected from various national (WAPDA, NEPRA, EPA, etc.) and international (NETL, NREL, ADB, etc.) resources.
  • All the prices are in 2018 United State Dollars (USD).
  • The data for all new power plants to be installed in the future are collected from NTDC and NEPRA reports and the BAU scenario is fully followed. However, capacity expansion is considered along with the BAU scenario only where annual electricity demand exceeds the maximum generation capacity in order to avoid the optimization solution from becoming infeasible and to meet the electricity demand.
  • In the fuel prices of fossil fuel based power plants, the increase with time is constant within that year. However, fixed and variable operating and maintenance costs of all power plants are assumed to remain constant in each year.
  • CCS technology is proposed to implement only on new fossil fuel based power plants and not on existing fossil fuel based power plants.
  • Capital costs of newly installed power plants are amortized over a period of 30 years with an eight percent interest rate. For solar and wind, the plant life is 20–25 years whereas for the others it can be up to 40 years. However, the capital charge factor or annual amortization factor does not significantly change by it (for plant life higher than 15 years) and so does the COE.
  • Fuel costs of nuclear fuel are not incorporated in calculations as nuclear power plants are capital intensive and their fuel cost is negligible.
  • Nuclear and hydroelectric power plants are supposed to run at their full net capacities to generate the maximum revenue and pay back their capital investments in a minimal time.

4. Results and Discussion

Three cases were developed to optimize the power sector of Pakistan. Each of the three cases involves four different scenarios including: (1) summer low GDP, (2) summer normal GDP, (3) winter low GDP, and (4) winter normal GDP. The reference case involves no constraint for CO2 mitigation, with the only objective of minimizing the COE and fulfilling the electricity demand. The second case is fuel balancing that involves the CO2 mitigation constraint. In fuel balancing, the optimizer tries to shift the load on the low carbon intensive non-fossil fuel based power plants rather than the fossil fuel based power plants. The third case considers the CCS installation on new fossil fuel based power plants to reduce the CO2 emissions. The results for all the cases are presented in the following sub-sections.

4.1. Reference Case

COE for all the scenarios of the reference case such as low GDP for summer, low GDP for winter, normal GDP for summer and normal GDP for winter is presented in Figure 7. In the reference case optimization, the only objective was to provide the optimal power output of each power plant by minimizing the total cost associated with all the time periods. Electricity demand and plant capacity constraints were also incorporated. The average COE during the complete time horizon for the low GDP winter was 8.2% higher than for the low GDP summer while the average COE for the normal GDP winter was 4.5% lower than the normal GDP summer case, as shown in Figure 7. The increase in average COE for low GDP case was due to the reduction of winter hydroelectric power to 60%. Hence, the major electricity load was shifted towards fossil fuel based power plants. Fossil fuel based plants are costly in operation as high fuel prices are involved, which resulted in average COE increase during the winter. During 2025–2030, COE for normal GDP winter was lower than low GDP winter. In normal GDP winter, load on fossil fuel power plants increases compared to low GDP winter, which should result in an increase in COE. However, this is not the case because in normal GDP winter, electricity demand becomes higher than low GDP winter. This increased demand resulted in three newly proposed hydroelectric power plants during these years, hence, caused a reduction in the COE. The details of the new proposed power plants are given in Appendix A.
COE was reduced during summer 2018–2020 due to expected completion of about 1350 MW hydroelectric power projects, which are usually cheaper than other sources. The COE was raised rapidly during 2021 for all scenarios due to the addition of planned power by installing 2370 MW of renewable and 2650 MW fossil fuel based power plants, which are definitely expensive due to the high initial cost of renewable and high fuel costs of fossil fuel based plants. For the normal GDP summer case, COE was decreased in 2022–2024 due to expected completion of about 11,500 MW hydroelectric projects. For normal GDP summer 2028–2029, COE was increased because the gap between demand and generation capacity squeezed, which left fewer options for optimizer for selection. For normal GDP summer 2030, capacity expansion was considered, which resulted in selection of three hydroelectric power plants (as presented in Appendix A) causing a decrease in COE. During capacity expansion, construction lead time was taken into account, which means during the construction of a certain power plant, there would be no power added to the grid from that power plant. Moreover, it can be seen from Appendix A that after the shaded area, power production starts for a certain power plant. The shaded area represents construction lead time. For low GDP summer, COE was relatively stable from 2026 to 2030. For low and normal GDP winter, COE was increased until 2026 and then started decreasing. The increase in COE, during 2020–2026, is mainly due to less power production from solar, wind and hydroelectric power plants in winter. The power production from non-fossil fuel power, other than hydroelectric, is costly but still cheaper than imported fueled power plants. About 50 non-fossil fuel power plants other than hydroelectric and nuclear are expected to be installed in the mentioned period. However, in 2026, two nuclear power plants of total capacity 2200 MW are expected to be completed, which did not involve seasonal variation and have a much higher capacity factor compared to other non-fossil fuel power plants.
The optimal energy mix at the reference case is shown in Figure 8. The energy mix was optimized such that the increasing trend of hydroelectric power plants was observed from the year 2018 to 2030, as shown in Figure 8. The optimizer opted to use the hydroelectric power plants rather than fossil fuel based power plants keeping in consideration the costs associated with each power plant type. During electricity demand at the normal GDP rate, a rise in consumption of fossil fuel power was observed in contrast to low GDP rate. The reason was that the electricity demand at the normal GDP rate was more than at low GDP rate, and therefore, the optimizer shifted more load on the fossil fuel based power plants to meet the electricity demand.

4.2. CO2 Mitigation by Fuel Balancing

The fuel balancing technique was employed to achieve the CO2 mitigation targets. In this technique, the optimizer seeks for the flexibility available in fossil and non-fossil fuel based power plants to adjust their power outputs. In this way, a major load shift occurs over non-fossil fuel based plants or low carbon intensive power plants to reduce CO2 emissions. In this study, the mitigation targets were set in a linearly increasing trend over the period of 2018–2030. These mitigation targets were set in such a pattern that, in the first turn, the target started from 1% CO2 mitigation in 2018 and increased linearly reaching to 10% CO2 mitigation in 2030. In the next turn, the target started from 2% CO2 mitigation in 2018 and terminated at 20% mitigation in 2030. Thus, the pattern was followed in an increasing trend in each turn until 50% CO2 mitigation in 2030 is reached. For low GDP, only 1–10% CO2 mitigation was possible without proposing new power plants. Therefore, above 1–10% CO2 mitigation, the optimization solution turned out to be infeasible. The real bottleneck was the year 2021, as there was a little gap between annual electricity demand and maximum generation capacity. That is why capacity expansion was incorporated to meet the energy demand. The model was able to achieve CO2 mitigation up to 5–50% via capacity expansion in addition to the already planned new power plants.
The COE followed the trend of the reference case with a slight rise for increasing CO2 mitigation during the low GDP summer and winter scenarios, as shown in Figure 9a,b. For low GDP summer, COE was increased significantly during 2021 for all CO2 mitigation targets. COE in the year 2021 was the same for all CO2 mitigation targets and was around 20% higher than the reference case for this year. For 2021, the gap between electricity demand and maximum generation capacity was narrow, which reduced the flexibility to some extent for the optimizer to choose. For low GDP summer, COE remained almost same from year 2022 to 2030, for all mitigation targets as well as for the reference case. The reason was that during this period, the optimizer had quite a handsome gap between electricity demand and maximum generation capacity for fuel balancing resulting in a negligibly small rise in COE with an increase in CO2 mitigation targets. The average COE increase for all the periods of low GDP summer compared to that of the reference case was 4.3% with a 5–50% CO2 mitigation target. Capacity expansion required for the 2–20% to 5–50% CO2 mitigation target is presented in Appendix A, and mostly hydroelectric, solar and wind power plants were chosen. For low GDP winter, no rise in COE was found for a CO2 mitigation target up to 2–20%, as shown in Figure 9b. A slight rise in COE was observed for higher mitigation targets, for example, 3.2% and 6.1% average rise in COE for a 4–40% and 5–50% CO2 mitigation target, respectively.
COE rise for all mitigation targets of the normal GDP summer case is shown in Figure 9c. The average COE for even 5–50% CO2 mitigation compared to the reference case was lower. This was because in the reference case, optimizer had to select from only those power plants available to it and no capacity expansion was assumed. However, for fuel balancing, capacity expansion was considered, which resulted in lowering the COE due to the installation of low cost power plants. Renewable power plants such as hydroelectric, solar and wind were selected in 2020 and for future years, which were cheaper than fossil fuel power plants. Therefore, average COE for all CO2 mitigation targets was slightly reduced from the reference case in the normal GDP summer case. For the years 2028–2030, the COE was significantly higher for the reference case, as shown in Figure 9c, as the optimizer has to choose among the limited options, which were mainly the already installed or decided plants in contrast to the mitigation cases where flexibility was more for the optimizer due to capacity expansion. For normal GDP winter, the rise in COE was relatively smooth with increase in CO2 mitigation targets, as shown in Figure 9d. The average rise in COE was 7.8%, 9.4%, 11.3%, 15.0% and 15.5% for CO2 mitigation targets of 1–10%, 2–20%, 3–30%, 4–40% and 5–50%, respectively. Optimal energy mix for fuel balancing for the 4–40% CO2 mitigation target for all scenarios is shown in Figure 10. The increased electricity demand for normal GDP resulted in more load shift towards the new proposed hydroelectric and other non-fossil fuel power plants (under capacity expansion) because the available non-fossil fuel power plants were already used.

4.3. CO2 Mitigation Using CCS Technology

CO2 mitigation was achieved using CCS technology and the results are discussed in this section. The CCS system was supposed to install on new fossil fuel based power plants with the carbon capture level of 90%. The model was developed considering all the factors such as carbon capture cost and energy penalty for CCS, and the results were compiled for the rise in COE along with the percentage reduction in CO2 emission. Average CO2 emission reductions were observed to be 35.4%, 8.7%, 39.6% and 37.2% for low GDP summer, low GDP winter, normal GDP summer and normal GDP winter, respectively, and are shown in Figure 11. The corresponding rise in COE due to capital and operational cost associated with CCS was 12.4%, 4.8%, 2.7 and 7.7%, respectively, as shown in Figure 12. The electricity output of all fuel type power plants (fossil, hydroelectric and other non-fossil) for CO2 mitigation by CCS system is shown in Figure 13 for all scenarios. It was observed that the optimizer selected the fossil and non-fossil power plants optimally, and the COE was high due to the presence of the CCS system. Since the capacity of power plants decreased with implementation of CCS due to the energy penalty associated with it, the capacity expansion was considered in normal GDP to meet the energy demand. In capacity expansion, 6 hydroelectric, 10 wind, 7 solar, 10 NGCC and 6 PC power plants were selected. Details of capacity expansion results are given in Appendix A.
CO2 emissions for the reference case were higher than the CCS case, as expected, except for low GDP winter 2026–2029. The optimizer selected no new fossil fuel power plant during 2026–2029 and shifted the load towards the existing fossil fuel power plants to avoid the cost of CCS. During the mentioned period, the reference case used only new NG based power plants. However, in order to avoid the cost of CCS, when the load was shifted towards existing fossil fuel power plants, some local coal power plants using cheaper fuel were selected by the optimizer but at the cost of higher CO2 emissions. The CO2 emissions were reduced after 2021 for summer scenarios and after 2023 for winter scenarios in the CCS case, and finally increased during the last few years. This was due to expected completion of 2950 MW hydroelectric and 1825 MW other non-fossil power projects. A decrease in CO2 emissions for 2024–2026, in the reference case, was due to the expected completion of hydroelectric and nuclear power projects during this period. For the reference case, CO2 emissions were increased for 2027–2030 due to the installation of 567 MW coal power plants each year. For low GDP winter, the rise in CO2 emissions during 2027–2030 was due to less production of power from solar, wind and hydroelectric power plants resulting in more load shifted towards existing fossil fuel power plants (in order to avoid the cost of CCS). For normal GDP summer and winter, the rise in CO2 emissions for 2027–2030 was due to new proposed fossil fuel power plants without CCS under capacity expansion as the optimizer shut down power plants using costly imported coal and LNG by proposing new NG and local coal based power plants. The reduction in CO2 emissions was significant in the CCS case for summer scenarios of both low and normal GDP due to a large share of fossil fuel power plants with CCS to meet the relatively high energy demand, as shown in Figure 11a,c. However, a reduction in CO2 emissions for low GDP winter was negligible due to a small share of fossil fuel with CCS to meet a relatively low energy demand, as shown in Figure 11b. Moreover, the reduction in CO2 emissions was more for normal GDP due to a relative higher share of fossil fuel power plants with CCS, selected for capacity expansions in addition to existing and new planned power plants.
As expected, COE for CCS turned out to be higher than the reference case except for normal GDP summer 2028–2030, as shown in Figure 12c. This was due to capacity expansion for the normal GDP case, which resulted in the selection of 23 renewable power plants causing lower COE than the reference case. It is true that capacity expansion was also considered for the reference case also but it was required only for 2030 with fewer power plants. The COE for the CCS case almost followed the same trend as that of the reference case. Furthermore, the average COE for the whole time horizon with CCS case was the same (6.4–6.5 cents/kWh) for all the scenarios. The optimal energy mix for the CCS case is presented in Figure 13. It can be observed that the load shift towards the hydroelectric power plants was increased from 2018 to 2030. However, in normal GDP, dependence on new proposed hydroelectric power plants (under capacity expansion) was increased due to increased electricity demand as compared to low GDP. Moreover, capacity expansion results for the selection of some new power plants and the details are provided in Appendix A.
Upon further analysis, it was found that many fossil fuel power plants were set to zero power output in meeting the electricity demand and CO2 mitigation targets for all four scenarios. Thus, keeping in consideration their capital investment and operational complexities, another case was developed with 30% operational constraint on new and existing fossil fuel based power plants. The constraint was set in such a manner that the fossil fuel based power plants must operate at least 30% of their maximum power output. For this case, the results of CO2 emissions and COE are presented in Figure 14 and Figure 15, respectively.
As expected, CO2 emissions for CCS with 30% operational constraint over fossil fuel power plants were slightly higher than the CCS case for most of the periods. For normal and low GDP summer for the years 2018–2021, as shown in Figure 14a,c, CO2 emissions were identical for both CCS and CCS with 30% operational constraint on fossil fuel power plants showing the same selection made for the power plant operation. The COE was also same for these periods in summer scenarios, as shown in Figure 15a,c. At some of the periods, CO2 emissions for CCS were higher than its rival case. This was because for the CCS case, more load was shifted towards existing fossil fuel power plants (to avoid the cost of CCS) as no CCS was implemented on the existing fossil fuel power plants. This resulted in a slight decline in CO2 emissions for CCS with 30% operational constraint. Average CO2 emissions for CCS with 30% operational constraint over CCS case were found to be 6.9%, 5.8%, −0.3% and 6.4% higher for low GDP summer, low GDP winter, normal GDP summer and normal GDP winter, respectively, as shown in Figure 14.
The COE for CCS with 30% operational constraint was higher than the CCS case due to involvement of fuel price and CCS operational cost as the optimizer was forced to select all fossil fuel based plants with at least 30% of its maximum capacity. However, the significant rise in COE due to 30% operational constraint was in winter low GDP and winter normal GDP scenarios, as shown in Figure 15b,d. The average rise in COE over the complete time horizon for CCS with 30% operational constraint over CCS with no constraint was 5.1%, 25.4%, 6.1% and 19.2% for low GDP summer, low GDP winter, normal GDP summer and normal GDP winter, respectively. The operational constraint of 30% on fossil fuel power plants avoids the optimizer setting zero power, resulting in a selection of fewer new proposed power plants under the capacity expansion compared to CCS, as shown in Appendix A.

4.4. COE Comparison for All Cases

A comparison of the COE for all cases (reference case, fuel balancing, CCS, etc.) for summer low GDP scenarios of 2018, 2024 and 2030 is presented in Figure 16. The current COE was taken from the State of Industry Report by NEPRA [44], and the COE for all other cases was obtained against their respective optimal energy mix. The results of the COE for all cases were compared to the current generation cost. This comparison revealed that under the reference case with no CO2 mitigation constraint, about 1.8 cents decline in the COE was observed compared to the current generation cost due to the load shift on hydroelectric power plants rather than fossil fuel based power plants. Load shift was also observed from high carbon fuel (e.g., coal, oil) to low carbon fuel (e.g., NG). Whereas, the COE for the reference case and fuel balancing case was almost the same with 40% CO2 mitigation achievement until the year 2030, for the scenario under discussion. Upon installing the CCS system on new power plants, the COE was almost 0.9 and 1.4 cents higher compared to the corresponding reference case, due to the associated CCS costs for the year 2024 and 2030, respectively. However, the COE was raised by 1.4 and 1.3 cents than the corresponding reference case when 30% operational bound was set on fossil fuel based power plants for the year 2024 and 2030, respectively. No COE was increased in the year 2018 for both of the CCS cases as the CCS has not started yet during the first year of the time horizon. It can be established from the above discussion that to achieve CO2 mitigation without a significant increase in the COE, fuel balancing should be preferred over CCS, as fuel balancing involves no retrofitting or additional operating and maintenance costs.
The comparison of average COE over the entire time horizon for all the four scenarios and all the cases is represented in Figure 17. For the fuel balancing case of the 4–40% CO2 mitigation target, the average COE is high only for normal GDP summer compared to that of the reference case. Other scenarios of fuel balancing attained almost the same average COE as that of the reference case. The average COE for the CCS case was the same for all scenarios and slightly higher than the reference case. However, due to the consumption of a significant portion of energy for CCS, more new power plants will be proposed under capacity expansion and hence more deviation from government plans. Finally, the average COE for the CCS case with 30% operational constraint was significantly higher than the reference case, especially for the winter scenarios.

5. Conclusions and Future Recommendations

The main objective of this study was to optimize the power output selection of each power plant by minimizing the overall cost considering all the associated constraints such as the electricity demand and CO2 mitigation targets. An MPMIP model was developed for this purpose and implemented in GAMS for 13 years from 2018 to 2030. Four different scenarios were investigated including: (1) summer low GDP scenario, (2) summer normal GDP scenario, (3) winter low GDP scenario, and (4) winter normal GDP scenario. The power sector of Pakistan was optimized to minimize the COE considering all the necessary constraints such as electricity demand, plant capacities and CO2 mitigation constraints. Fuel balancing and CCS were the two CO2 mitigation techniques employed in this study and compared with the reference case involving no CO2 mitigation constraint. Furthermore, an additional case was developed by modifying the CCS case with 30% operational constraint on new and existing fossil fuel based power plants. This constraint was set to operate the fossil fuel based power plants at at least 30% of their maximum power output. The following conclusions may be drawn from the results of this study.
  • Lower value for the reference case COE as well as COE with CO2 mitigation targets was achieved compared to the current, which confirmed the possibility of cheap electricity generation with reduced GHG emissions by optimizing the energy mix of Pakistan.
  • For low GDP summer and winter scenarios of the fuel balancing case, the CO2 mitigation target by fuel balancing can be increased beyond 50% with some increase in COE. However, several new proposed power plants under capacity expansion were considered to meet the electricity demand.
  • For the normal GDP winter scenario of fuel balancing case, the rise in COE was relatively higher with a large number of new proposed power plants under capacity expansion.
  • CCS technology for the mitigation of CO2 emissions when adopted on new fossil fuel power plants was also found effective with reasonable increase in COE. Average CO2 emissions were reduced by 35.4%, 8.7%, 39.6% and 37.2% with the corresponding increase in the COE by 12.4%, 4.8%, 2.7% and 7.7% for low GDP summer, low GDP winter, normal GDP summer and normal GDP winter, respectively.
  • A constraint on fossil fuel power plants to operate at least 30% of their maximum capacity contributed only a few percent CO2 emission reduction but with a significantly higher rise in COE.
  • Fuel balancing up to 4–40% CO2 mitigation target was found to be a more feasible CO2 mitigation technique than CCS because it did not involve any significant rise in the COE. This study shows that Pakistan should go for fuel balancing in order to mitigate CO2 up to 40% by 2030 as proposed by Pakistan INDC. Furthermore, capacity expansion was more for the case of CCS compared to fuel balancing. This was the indication of deviation from government planning, which should be avoided without significant benefits.
This paper can be considered as a preliminary study for the development of a general methodological framework, which can exploit more techniques and comprehensive data available in practice to improve the future policies and planning especially for the power sector of Pakistan. The economic and emission related data for the present work is claimed to be realistic and comprehensive for a practical study. However, predictions for prices and demand forecasting may be improved. The uncertainties in the available or predicted data should also be incorporated. Furthermore, various other CO2 mitigation techniques can be employed for the optimal energy planning. Some of the recommendations for future research are given as follows.
  • Fuel switching may be employed on the existing fossil fuel based power plants. This may reduce CO2 emissions to a certain level but at the expense of the retrofitting cost involved in fuel switching implementation.
  • A CCS system may be employed on the existing fossil fuel based power plants after incorporating retrofitting and CCS related costs.
  • For long term power planning, the renewable power potential of Pakistan must be investigated and planning should be done to promote the renewable power sources instead of conventional fossil fuel based power plants, which use highly carbon intensive fuel.
  • This model should also be modified to incorporate multi-period load fluctuations on an hourly, monthly, and yearly basis.

Author Contributions

A.A. initially started working on this research and he contributed in data collection and execution of simulations. M.R. contributed in analyzing the tool and paper writing. A.E. contributed in results analysis, paper writing and final revision, L.H. contributed in data collection, execution of the simulations, and writing the paper. M.Z. contributed in analysis of the results, paper writing and final revision. All authors have read and agreed to the published version of the manuscript.

Funding

This research received no external funding.

Acknowledgments

The authors acknowledge the fellowship received by the first author from the Pakistan Institute of Engineering and Applied Sciences (PIEAS) for his MS in Process Engineering. Authors are also thankful to the Computational and Internet Services Division at PIEAS for computational support. Furthermore, this research was supported by National Research Program for Universities (NRPU, No: 6090/Federal/NRPU/R&D/HEC/2016) funded by the Higher Education Commission (HEC) of Pakistan. Support was also provided by the Natural Sciences and Engineering Research Council (NSERC) of Canada.

Conflicts of Interest

The authors declare no conflict of interest.

Nomenclature

Indices
iFossil fuel based existing power plant
jFuel type for fossil fuel based existing power plants (coal, NG, LNG, FO)
uNon-fossil fuel based existing power plants
pNew power plant
qFuel type for new power plants (FF, NF)
aNew proposed fossil fuel power plants
cNew proposed non-fossil fuel power plants
tTime horizon consisting of 26 periods and 13 years from 2018-2030 including summer and winter in each year (for summer t = 1, 3, 5,……, 25 and for winter t = 2, 4, 6,……, 26)
Parameters
FixijtFixed cost for fossil fuel based existing power plants “i” with fuel type of “j” in the time period “t” ($/MW)
GCapijtGross capacity for fossil fuel based existing power plants “i” with fuel type of “j” in the time period “t” (MW)
VarijtVariable cost for fossil fuel based existing power plants “i” with fuel type of “j” in the time period “t” ($/MWh)
VjtFuel cost for fuel type of “j” in the time period “t” ($/GJ)
GijHeat rate of fuel for fossil fuel based existing power plants “i” with fuel type of “j” (GJ/MWh)
FixutFixed cost for non-fossil fuel based existing power plants “u” in the time period “t” ($/MW)
GCaputGross capacity for non-fossil fuel based existing power plants “u” in the time period “t” (MW)
VarutVariable cost for non-fossil fuel based existing power plants “u” in the time period “t” ($/MWh)
FixpqtFixed cost for new power plants “p” of fuel type “q” in the time period “t” ($/MW)
GCappqtGross capacity for new power plants “p” of fuel type “q” in the time period “t” (MW)
VarpqtVariable cost for new power plants “p” of fuel type “q” in the time period “t” ($/MWh)
VqtFuel cost for fuel type “q” in the time period “t” ($/GJ)
GpqHeat rate of fuel for new power plants “p” of fuel type “q” (GJ/MWh)
FixatFixed cost for new proposed fossil fuel power plants “a” in the time period “t” ($/MW)
GCapatGross capacity for new proposed fossil fuel power plants “a” in the time period “t” (MW)
VaratVariable cost for new proposed fossil fuel power plants “a” in the time period “t” ($/MWh)
VatFuel cost for new proposed fossil fuel power plants “a” in the time period “t” ($/GJ)
GaHeat rate of fuel for new proposed fossil fuel power plants “a” (GJ/MWh)
FixctFixed cost for new proposed non-fossil fuel power plants “c” in the time period “t” ($/MW)
GCapctGross capacity for new proposed non-fossil fuel power plants “c” in the time period “t” (MW)
VarctVariable cost for new proposed non-fossil fuel power plants “c” in the time period “t” ($/MWh)
CapCostpqtCapital cost for new power plants “p” of fuel type “q” in the time period “t” (m$/MW)
CapCostatCapital cost for new proposed fossil fuel power plants “a” in the time period “t” (m$/MW)
CapCostctCapital cost for new proposed non-fossil fuel power plants “c” in the time period “t” (m$/MW)
CCSpqCarbon capture and sequestration cost for new power plants “p” of fuel type “q” ($/ton CO2)
CCSaCarbon capture and sequestration cost for new proposed fossil fuel power plants “a” ($/ton CO2)
C a p F a c t o r i j t Capacity factor for fossil fuel based existing power plants “i” with fuel type of “j” in the time period “t
C a p F a c t o r u t Capacity factor for non-fossil fuel based existing power plants “u” in the time period “t
C a p F a c t o r p q t Capacity factor for new power plants “p” of fuel type “q” in the time period “t
C a p F a c t o r a t Capacity factor for new proposed fossil fuel power plants “a” in the time period “t
C a p F a c t o r c t Capacity factor for new proposed non-fossil fuel power plants “c” in the time period “t
CO2ijtCO2 emissions from fossil fuel based existing power plants “i” with fuel type of “j” in the time period “t” (Mton/MWh)
CO2pqtCO2 emissions from new power plants “p” of fuel type “q” in the time period “t” (Mton/MWh)
CO2atCO2 emissions from new proposed fossil fuel power plants “a” in the time period “t” (Mton/MWh)
EDtAnnual electricity demand in the time period “t” (MW)
ε Percent CO2 captured
QA multiplication factor, number of hours in a time period of six months (summer or winter)
Binary Variables
xijt1 if ith plant is used with jth fuel type in the time period “t” otherwise 0
yut1 if uth plant is used in the time period “t” otherwise 0
zpqt1 if pth plant is used with qth fuel type in the time period “t” otherwise 0
nat1 if ath plant is used in the time period “t” otherwise 0
bct1 if cth plant is used in the time period “t” otherwise 0
Continuous Variables
EijtElectricity output from fossil fuel based existing power plants “i” with fuel type of “j” in the time period “t” (MW)
EutElectricity output from non-fossil fuel based existing power plants “u” in the time period “t” (MW)
EpqtElectricity output from new power plants “p” of fuel type “q” in the time period “t” (MW)
EatElectricity output from new proposed fossil fuel power plants “a” in the time period “t” (MW)
EctElectricity output from new proposed non-fossil fuel power plants “c” in the time period “t” (MW)

Abbreviations

ADBAsian Development Bank
CELCO2 emission limit
CO2Carbon dioxide
EIAEnergy Information Agency
exiExisting power plants
FFFossil fuel
GDPgross domestic product
GJGiga Joule
LNGLiquefied natural gas
MWMega Watts
NEPRANational Electric Power Regulatory Authority
newNew power plants
NGNatural gas
NGCCNatural gas combined cycle
NTDCNational Transmission and Despatch Company
PCPulverized coal
CFCapacity factor
COECost of electricity (cents/kWh)
EPAEnvironmental Protection Agency
fCumulative cost of electricity over whole time horizon ($)
FOFurnace oil
GHGGreenhouse gas
IEAInternational Energy Agency
m$Million Dollar
MWhMega Watt hour
NETLNational Energy Technology Laboratory
NFNon-fossil
NRELNational Renewable Energy Laboratory
O&MOperating and maintenance
WAPDAWater and Power Development Authority

Appendix A

Table A1. Details of the Plants Installation under Capacity Expansion: Normal GDP Reference Case.
Energies 13 04571 i001
Table A2. Details of the Plants Installation under Capacity Expansion: Low GDP Fuel Balancing (2–20% Mitigation).
Energies 13 04571 i002
Table A3. Details of the Plants Installation under Capacity Expansion: Low GDP Fuel Balancing (3–30% Mitigation).
Energies 13 04571 i003
Table A4. Details of the Plants Installation under Capacity Expansion: Low GDP Fuel Balancing (4–40% Mitigation).
Energies 13 04571 i004
Table A5. Details of the Plants Installation under Capacity Expansion: Low GDP Fuel Balancing (5–50% Mitigation).
Energies 13 04571 i005
Table A6. Details of the Plants Installation under Capacity Expansion: Normal GDP Fuel Balancing (1–10% Mitigation).
Energies 13 04571 i006
Table A7. Details of the Plants Installation under Capacity Expansion: Normal GDP Fuel Balancing (2–20% Mitigation).
Energies 13 04571 i007
Table A8. Details of the Plants Installation under Capacity Expansion: Normal GDP Fuel Balancing (3–30% Mitigation).
Energies 13 04571 i008
Table A9. Details of the Plants Installation under Capacity Expansion: Normal GDP Fuel Balancing (4–40% Mitigation).
Energies 13 04571 i009
Table A10. Details of the Plants Installation under Capacity Expansion: Normal GDP Fuel Balancing (5–50% Mitigation).
Energies 13 04571 i010
Table A11. Details of the Plants Installation under Capacity Expansion: Normal GDP CCS on New PP’s.
Energies 13 04571 i011
Table A12. Details of the Plants Installation under Capacity Expansion: Normal GDP CCS on New PP’s (with 30% Operation Constraint on FF).
Energies 13 04571 i012
  • Boxes with red color indicate previous years which were not considered in capacity expansion.
  • Boxes with red acent 2 lighter 40 % color and broken lines indicate the construction years and arrow shows the starting year of construction. During construction, no power is produced.
  • Total ten hydroelectric power plants of different capacities were considered in this study. In order to differentiate these were named as hydro1, hydro2, etc.

References

  1. Khan, M.A.; Abbas, F. The dynamics of electricity demand in Pakistan: A panel cointegration analysis. Renew. Sustain. Energy Rev. 2016, 65, 1159–1178. [Google Scholar] [CrossRef]
  2. Pervaz, M. Pakistan Energy Year Book 2018; Hydrocarbon Development Institute of Pakistan: Islamabad, Pakistan, 2018. [Google Scholar]
  3. Masson-Delmotte, V.; Zhai, P.; Pörtner, H.-O.; Roberts, D.; Skea, J.; Shukla, P.R.; Pirani, A.; Moufouma-Okia, W.; Péan, C.; Pidcock, R. Global warming of 1.5 °C. IPCC Spec. Rep. Impacts Glob. Warm. 2018, 1, 109–110. [Google Scholar]
  4. Zaman, M.; Lee, J.H. Carbon capture from stationary power generation sources: A review of the current status of the technologies. Korean J. Chem. Eng. 2013, 30, 1497–1526. [Google Scholar] [CrossRef]
  5. National Power System Expansion Plan 2011–2030; SNC-Lavalin International Inc.: Islamabad, Pakistan, 2011.
  6. State of Industry Report 2015; National Electric Power Regulatory Authority: Islamabad, Pakistan, 2015.
  7. Herche, W. Solar energy strategies in the U.S. utility market. Renew. Sustain. Energy Rev. 2017, 77, 590–595. [Google Scholar] [CrossRef]
  8. Abas, N.; Kalair, A.; Khan, N.; Kalair, A.R. Review of GHG emissions in Pakistan compared to SAARC countries. Renew. Sustain. Energy Rev. 2017, 80, 990–1016. [Google Scholar] [CrossRef]
  9. Pakistan Intended Nationally Determined Contributions (INDCs); Pakistan INDC: Islamabad, Pakistan, 2020; pp. 1–20.
  10. UNFCCC PARIS AGREEMENT Signature Ceremony; United Nations Framework Convention on Climate Change: Bonn, Germany, 2017.
  11. The Nation. Available online: https://nation.com.pk/12-Jul-2020/nuclear-power-plant-makes-continuous-operation-record (accessed on 13 August 2020).
  12. Buckley, T. Pakistan’ s Power Future; Institute for Energy Economics and Financial Analysis: Lakewood, OH, USA, 2018. [Google Scholar]
  13. Fatima, U.; Nasim, A. Cost of Electricity Generation in Pakistan—Comparison of Levelized Cost of Electricity of CPEC Coal Plants with Oil and Natural Gas Based Plants Commissioned in 2010-14; Institute of Development and Economic Alternatives: Lahore, Pakistan, 2019. [Google Scholar]
  14. Determination of the Authority in the matter of Upfront Generation Tariff for Biomass Power Projects; National Electric Power Regulatory Authority: Islamabad, Pakistan, 2018.
  15. Institute for Energy Economics & Financial Analysis. Available online: https://ieefa.org/pakistan-signs-deals-for-560mw-of-new-wind-power/ (accessed on 21 August 2020).
  16. Kugelman, M. Pakistan’s Interminable Energy Crisis: Is There Any Way Out? Easing an Energy Crisis That Won’t End; Wilson Center: Washington, DC, USA, 2015. [Google Scholar]
  17. Perwez, U.; Sohail, A. Forecasting of Pakistan’s net electricity energy consumption on the basis of energy pathway scenarios. Energy Procedia 2014, 61, 2403–2411. [Google Scholar] [CrossRef] [Green Version]
  18. Khan, S.; Ashraf, H.F. Analysis of Pakistan’s Electric Power Sector; Blekinge Institute of Technology, Department of Electrical Engineering: Karlshamn, Sweden, 2015; pp. 1–45. [Google Scholar]
  19. Muis, Z.A.; Hashim, H.; Manan, Z.A.; Taha, F.M.; Douglas, P.L. Optimal planning of renewable energy-integrated electricity generation schemes with CO2 reduction target. Renew. Energy 2010, 35, 2562–2570. [Google Scholar] [CrossRef] [Green Version]
  20. Abdul Manaf, N.; Abbas, A. Economic and environmental sustainability of low-carbon power generation: Relevancy in the Malaysia Green Technology Master Plan (GTMP). J. Chem. Technol. Biotechnol. 2019, 94, 1425–1432. [Google Scholar] [CrossRef]
  21. Rubin, E.S.; Rao, A.B.; Chen, C. Comparative Assessments of Fossil Fuel Power Plants with CO2 capture and storage. In Greenhouse Gas Control Technologies 7; Elsevier Science Ltd.: Amsterdam, The Netherlands, 2005; pp. 285–293. [Google Scholar]
  22. Jia, B.; Tsau, J.S.; Barati, R. A review of the current progress of CO2 injection EOR and carbon storage in shale oil reservoirs. Fuel 2019, 236, 404–427. [Google Scholar] [CrossRef]
  23. Gabrielli, P.; Gazzani, M.; Mazzotti, M. The Role of Carbon Capture and Utilization, Carbon Capture and Storage, and Biomass to Enable a Net-Zero-CO2 Emissions Chemical Industry. Ind. Eng. Chem. Res. 2020, 59, 7033–7045. [Google Scholar] [CrossRef] [Green Version]
  24. Ahmed, R.; Liu, G.; Yousaf, B.; Abbas, Q.; Ullah, H.; Ali, M.U. Recent advances in carbon-based renewable adsorbent for selective carbon dioxide capture and separation—A review. J. Clean. Prod. 2020, 242, 118409. [Google Scholar] [CrossRef]
  25. Bassano, C.; Deiana, P.; Vilardi, G.; Verdone, N. Modeling and economic evaluation of carbon capture and storage technologies integrated into synthetic natural gas and power-to-gas plants. Appl. Energy 2020, 263, 114590. [Google Scholar] [CrossRef]
  26. Maroufmashat, A.; Taqvi, S.T.; Miragha, A.; Fowler, M.; Elkamel, A. Modeling and optimization of energy hubs: A comprehensive review. Inventions 2019, 4, 50. [Google Scholar] [CrossRef] [Green Version]
  27. Dagoumas, A.S.; Koltsaklis, N.E. Review of models for integrating renewable energy in the generation expansion planning. Appl. Energy 2019, 242, 1573–1587. [Google Scholar] [CrossRef]
  28. Ehsan, A.; Yang, Q. State-of-the-art techniques for modelling of uncertainties in active distribution network planning: A review. Appl. Energy 2019, 239, 1509–1523. [Google Scholar] [CrossRef]
  29. Twaha, S.; Ramli, M.A.M. A review of optimization approaches for hybrid distributed energy generation systems: Off-grid and grid-connected systems. Sustain. Cities Soc. 2018, 41, 320–331. [Google Scholar] [CrossRef]
  30. Moret, S.; Babonneau, F.; Bierlaire, M.; Maréchal, F. Decision support for strategic energy planning: A robust optimization framework. Eur. J. Oper. Res. 2020, 280, 539–554. [Google Scholar] [CrossRef]
  31. Arivalagan, A.; Raghavendra, B.G.; Rao, A.R.K. Integrated energy optimization model for a cogeneration based energy supply system in the process industry. Int. J. Electr. Power Energy Syst. 1995, 17, 227–233. [Google Scholar] [CrossRef]
  32. Bai, H.; Wei, J.H. The CO2 mitigation options for the electric sector: A case study of Taiwan. Energy Policy 1996, 24, 221–228. [Google Scholar] [CrossRef]
  33. Lehtilä, A.; Pirilä, P. Reducing energy related emissions: Using an energy systems optimization model to support policy planning in Finland. Energy Policy 1996, 24, 805–819. [Google Scholar] [CrossRef]
  34. Hashim, H.; Douglas, P.; Elkamel, A.; Croiset, E. Optimization model for energy planning with CO2 emission considerations. Ind. Eng. Chem. Res. 2005, 44, 879–890. [Google Scholar] [CrossRef]
  35. Mirzaesmaeeli, H.; Elkamel, A.; Douglas, P.L.; Croiset, E.; Gupta, M. A multi-period optimization model for energy planning with CO2 emission consideration. J. Environ. Manag. 2010, 91, 1063–1070. [Google Scholar] [CrossRef] [PubMed] [Green Version]
  36. Elkamel, A.; Hashim, H.; Douglas, P.L.; Croiset, E. Optimization of energy usage for fleet-wide power generating system under carbon mitigation options. AIChE J. 2009, 55, 3168–3190. [Google Scholar] [CrossRef]
  37. Özcan, E.C.; Erol, S. A Multi-Objective Mixed Integer Linear Programming Model for Energy Resource Allocation Problem: The Case of Turkey. Gazi Univ. J. Sci. 2014, 27, 1157–1168. [Google Scholar]
  38. Betancourt-Torcat, A.; Almansoori, A. Multi-period Optimization Model for the ARE Power Sector. Energy Procedia 2015, 75, 2791–2797. [Google Scholar] [CrossRef] [Green Version]
  39. Zhang, D.; Liu, P.; Ma, L.; Li, Z.; Ni, W. A multi-period modelling and optimization approach to the planning of China’s power sector with consideration of carbon dioxide mitigation. Comput. Chem. Eng. 2012, 37, 227–247. [Google Scholar] [CrossRef]
  40. Ahmadi, L.; Elkamel, A.; Abdul-wahab, S.A.; Pan, M.; Croiset, E.; Douglas, P.L.; Entchev, E. Multi-Period Optimization Model for Electricity Generation Planning Considering Plug-in Hybrid Electric Vehicle Penetration. Energies 2015, 8, 3978–4002. [Google Scholar] [CrossRef] [Green Version]
  41. Barteczko-Hibbert, C.; Bonis, I.; Binns, M.; Theodoropoulos, C.; Azapagic, A. A multi-period mixed-integer linear optimisation of future electricity supply considering life cycle costs and environmental impacts. Appl. Energy 2014, 133, 317–334. [Google Scholar] [CrossRef]
  42. Tekiner, H.; Coit, D.W.; Felder, F.A. Multi-period multi-objective electricity generation expansion planning problem with Monte-Carlo simulation. Electr. Power Syst. Res. 2010, 80, 1394–1405. [Google Scholar] [CrossRef] [Green Version]
  43. Richard, E.R. GAMS—A User’s Guide: Tutorial; GAMS Development Corporation: Washington, DC, USA, 2017. [Google Scholar]
  44. State of Industry; National Electric Power Regulatory Authority: Islamabad, Pakistan, 2017.
Figure 1. Pakistan 2018 energy mix.
Energies 13 04571 g001
Figure 2. CO2 emissions projection of Pakistan.
Energies 13 04571 g002
Figure 3. Fuel price projection.
Energies 13 04571 g003
Figure 4. Electricity demand of Pakistan. (a) Summer. (b) Winter.
Energies 13 04571 g004
Figure 5. Steps involved in methodology.
Energies 13 04571 g005
Figure 6. Superstructure representation for the optimization of the power sector.
Energies 13 04571 g006
Figure 7. Cost of electricity for the reference case.
Energies 13 04571 g007
Figure 8. Optimal energy mix at the reference case.
Energies 13 04571 g008
Figure 9. Cost of electricity for various CO2 mitigation targets under fuel balancing.
Energies 13 04571 g009
Figure 10. Optimal energy mix for fuel balancing at the 4–40% mitigation target.
Energies 13 04571 g010
Figure 11. CO2 emission under the carbon capture and sequestration (CCS) case (with CCS) and reference case (with no CCS).
Energies 13 04571 g011
Figure 12. Cost of electricity under the CCS case (with CCS) and reference case (with no CCS).
Energies 13 04571 g012
Figure 13. Optimal energy mix under the CCS case.
Energies 13 04571 g013
Figure 14. CO2 emissions for CCS case at 30% operational constraint on fossil fuel based power plants compared with the CCS case without such constraint.
Energies 13 04571 g014
Figure 15. Cost of electricity for CCS case at 30% operational constraint on fossil fuel based power plants compared with the CCS case without such constraint.
Energies 13 04571 g015
Figure 16. Cost of electricity comparison for all cases of summer low GDP.
Energies 13 04571 g016
Figure 17. Average cost of electricity comparison for all cases.
Energies 13 04571 g017
Table 1. Cost of electricity from different types of power plants in Pakistan.
Power Plant TypeCOE (Cents/kWh)Power Plant TypeCOE (Cents/kWh)
Solar5.25LNG9.36
Wind4.3NG6.51
Local Coal8.38Hydro8.2
Imported Coal8.8Biomass8.28
Furnace Oil11.74Nuclear6.44
Table 2. Number of different types of power plants in Pakistan.
Thermal PP82Hydroelectric PP68
Solar Power35Wind Power41
Biomass/Bioenergy36Nuclear PP10
Table 3. Solution statistics.
Solution Statistics for Reference Case
Low GDPNormal GDP Low GDPNormal GDP
Blocks of Equations29502Single Equations14,04125,295
Blocks of Variables3154Single Variables19,99334,841
Non Zero Elements60,157152,738Discrete Variables597816,874
Solution Statistics for Fuel Balancing Case (4–40% Mitigation)
Blocks of Equations5656Single Equations24,05825,678
Blocks of Variables5454Single Variables36,92140,041
Non Zero Elements179,619223,299Discrete Variables17,91419,474
Solution Statistics for CCS Case
Blocks of Equations30220Single Equations14,06723,298
Blocks of Variables3255Single Variables20,01934,867
Non Zero Elements60,663151,221Discrete Variables597816,874

