1. Introduction
Losses of electrical energy in the power grids at the transmission and distribution level include both technical losses (TL) and non-technical losses (NTLs) [
1]. The computation of TL is generally needed for the correct estimation of NTL [
2]. TLs are unavoidable as these occur in the equipment during the transmission and distribution (T&D) process, whereas NTLs are labeled as administrative losses that occur because of non-billed electricity, malfunction of the equipment, error in billings, low-quality infrastructure, and illegal usage of electricity [
3]. The fraudulent behavior of energy customers is usually associated with electricity theft, regularized corruption, and organized crime [
4]. Therefore, such sort of losses cannot be precisely estimated. Generally, the expenses linked with these NTL activities are compensated by legitimate customers. The effect of the NTLs is worse in under-developed or developing countries; however, it can affect the developed economies too [
5]. The researchers and experts in power industries and academia have been trying different methods to address the mentioned problem effectively. The traditional methods utilize the statistical analysis of data to understand the significant indicators of fraudulent behavior, allowing the development of effective policies to address the issue. The installation of smart meters has appeared to be one of the meaningful and latest solutions to address the NTL detection issue [
6]. However, their deployment, operational cost, and design involve massive amounts, which are not practical solutions for weak economies [
7]. Other methodologies include the utilization of machine learning algorithms for analyzing the data from meters and the evaluation of the consumption patterns that may imply fraudulent activities. Installations of specific equipment, sensors, and grid structures have also been suggested for efficient detection of NTLs [
8]. There is a great number of research articles available in the literature that have used several methods to address the NTL detection issue. Hence a systematic compilation of all the related articles is the need of the hour which consequently led the motivation behind carrying out current systematic review study on this important topic.
Even though the author in [
9] provided a useful review in the mentioned field, however, it only includes the paper until the year 2013. Furthermore, the authors have only discussed the technical aspects of the fraud detection system (FDS) while completely ignoring the features commonly used and the metrics which are used to evaluate the performance of the classifiers. The authors in [
10] provided a detailed review of the NTL detection articles published in a few important conferences and journals, but the detailed description of the methodologies is lacking. Similarly, the author in [
11] provides a comprehensive review in similar area of research. However, it covers articles up to 2017 and lacks in critical review of the literature. Furthermore, contrary to current work, the authors in the mentioned work did not adopt a systematic review approach. Therefore, the authors of the current research work felt the necessity of a comprehensive review in the mentioned field of study as there is a vast amount of research work with a variety of novel techniques left unattended which need to be summarized in order to provide a single comprehensive source of information in modern NTL detection methods. This article offers a comprehensive review of the literature on the subject of NTLs detection, offering a helping hand to the utilities and researchers on the latest development in NTL detection methods. The clear objectives of the paper are as follows:
- i.
Review for evaluating the available NTL detection solutions.
- ii.
Review of the various features used for NTL detection.
- iii.
Review of various metrics required for the evaluation of machine learning classifiers.
- iv.
The detailed comparison of the current approaches with their advantages and limitations.
It is worthwhile to mention here that, for achieving the objectives of the current review, an analysis of 85 papers has been carried out. The selected articles are thoroughly reviewed and analyzed in the current systematic literature review by using the guidelines of a general systematic literature review.
The article is set out as follows:
In
Section 2 the approach described in the article is discussed.
Section 3 sets out a description of NTL forms and sources.
Section 4 provides a description of the outcomes of NTL detection approaches. The meanings are set out in
Section 5.
2. Review Methodology
In this section, the methodology adopted for screening and selecting the articles for the current review is described in detail. The section is further divided into the following subsections based on the articles’ selection process.
2.1. Search Terms
The articles that were published after the year 2000 are adopted, while the rest are discarded. A wide variety of keywords such as electricity theft, non-technical losses, fraud in energy consumption, and supervised machine learning-based electrical theft detection methods.
2.2. Inclusion and Exclusion Criteria
Criteria for exclusion and inclusion are used to select the research articles from the pool of studies. The inclusion criteria in this review consist of:
- i.
The study should identify, estimate, or predict any form of NTLs in the electric grid.
- ii.
The study must present the analysis and determinants influencing the NTL.
- iii.
The study should suggest a novel strategy for detecting NTLs.
The exclusion criteria are stated below:
- i.
Studies must not be published before the year 2000.
- ii.
Duplicate articles with the same methodologies are discarded.
- iii.
It should not be a feasibility study of a specific area.
After performing the inclusion and exclusion criteria, only 85 most relevant articles were selected for the review.
2.3. Prisma Flowchart
The search process with the mentioned keywords was performed initially and 273 articles were selected from the databases of the following four repositories; Science Direct, IEEE explore, Google Scholar, and ACM Digital library. After eliminating the duplicates, all abstracts and titles were screened to choose the most appropriate research articles depending on the inclusion and exclusion criteria. The finalized lists of the articles selected from the journals and the conferences are depicted in tabular form in
Table 1 and
Table 2, respectively and the flow chart of the article selection procedure is shown in
Figure 1.
3. Features Used in NTL Detection
One of the most significant approaches available for NTL detection through machine learning algorithms is the feature-based NTL detection approach [
61]. In such methods, generally, time-series energy usage data are utilized to extract a few of the most relevant features of each consumer and based on the analysis of the outcomes, the consumers are categorized as honest or fraudulent [
11]. Different research studies use different types and numbers of features; therefore, it is a challenging task to explain all the features used for NTL detection precisely. The time resolution of these newly synthesized features relies heavily on the time resolution of its initial raw data features. Two of the major advantages of the feature-based classification are enhanced classification accuracy and reduction in data size as only the most relevant feature is selected by using a feature selection method that provides an accurate picture of NTL activity [
61]. However, the frequency for which new features are computed must be chosen carefully, i.e., hourly consumption features for one month may provide a different outcome than that of the monthly average consumption of 1 year.
Another important aspect of the feature-based NTL detection methods is the feature selection process. As mentioned earlier, the optimal and most relevant features are selected by utilizing the feature selection algorithm [
62]. The feature selection algorithms have utilized several times in literature for enhancing the functioning of different algorithms used for the NTL detection, such as in [
12,
23,
30,
58,
59,
81]. The authors in [
23] have tested all the possible fraud indications by utilizing a comparatively smaller number of features. Ramos et al. [
12] utilized several types of meta-heuristic algorithms, such as binary black hole algorithm, Harmony Search (HS), Particle Swarm Optimization (PSO), Differential Evolution (DE), and Genetic Algorithm (GA) for selecting an optimal set of features. The authors in [
58] evaluated the HS algorithm for the optimal feature selection process and have compared it to PSO on identical conditions. The same authors extended their work in [
30] and used the Binary Gravitational Search Algorithm (BGSA) for the same purpose and evaluated its performance against the HS and PSO. In another article, Pereira et al. [
59] used Social Spider Optimization (SPO) for tuning the parameters of the classifier and feature selection process. Martino et al. [
82] proposed the filter and wrapper-based method for selecting the best features.
Table 3 provides the detailed list of most commonly used features in the literature for NTL detection process.
4. Performance Metrics Used for NTL Detection
Generally, the performance of a classifier is assessed by evaluating different performance indicators. One of such indicators is the confusion matrix. It presents the details for the accurate classification as “True” and of the wrong classification as “False.” The True Positive (TP) in the confusion matrix signifies the fraudster customers who are rightly identified as the fraudsters, whereas the False Positive (FP) portrays the honest customers that are incorrectly classified as fraudsters. Likewise, the True Negative (TN) reflects legitimate customers accurately identified as legitimate and False Negative (FN) signifies the fraudulent customers incorrectly classified as honest. The other well-known metrics that are evaluated through the confusion matrix in the NTL classification problems are Accuracy (Acc), precision, Detection Rate (DR), True Negative Rate (TNR), False-Negative Rate (FNR), False Positive Rate (FPR), and F1 score.
The most commonly used matrix in the literature for NTL detection and in almost all the data-based approaches are Acc and DR. A better DR and good Acc reflect that the model operates well and has an excellent classifying ability for the samples belonging to both classes. However, there is a need for other performance metrics in the scenarios where the dataset is imbalanced, i.e., when the number of samples of negative class (honest) is significantly higher than the number of samples of positive type (fraudulent). Detection Rate (DR), Recall, or True Positive Rate are the metrics that are popularly used in such situations. These metrics describe the percentage of NTL samples classified accurately to the total amount of NTL in the dataset. High DR values usually imply a well-operating NTL detection model; however, to verify this, other metrics should also be considered. Therefore, both accuracy and DR must be considered when determining the efficiency of the model. FPR and precision are the other two most utilized metrics for NTL detection. Precision or Positive Predictive Value (PPV) of the classifier can be calculated by dividing the total number of fraudster customers correctly identified to the overall customers classified as fraudsters. On the other hand, the high precision of the classifier indicates that the majority of the customers that are classified as fraudsters are truly fraudsters. It is worthwhile to mention here that recall and precision are antagonistic metrics. The improvement in the performance of the one metric will result in the reduction of the performance of the other. Therefore, it is essential to achieve the perfect balance between both metrics. This balance between the two metrics is evaluated by computing the F1 score. A high value of the F1 score indicated that the model identifies maximum fraud cases with a very low rate of false positives. Nevertheless, his metric is occasionally used in literature for NTL detection, yet it is still one of the most relevant and vital metrics while working with imbalanced data [
73,
85]. In fact, numerous research works have been conducted on this issue as it offers a perfect solution for the correct assessment of the classifier [
37]. Another important performance evaluation metric is FPR. It is expressed as the number of samples that are wrongly marked as positive (fraudster) to the overall negative (honest) samples. If the value for FPR is high for any classifier, it leads to the excessive meter inspections that result in a large operational cost burden on PDCs. Therefore, the PDCs always want to achieve a low value of FPR because the threshold level relies on the overall size of the two classified categories, i.e., theft and healthy.
It is important to note that making decisions on the basis of any single metric may provide misleading information. For example, for a collection of 1000 customers with ten fraudulent and 990 honest consumers, the FPR is calculated as 10 percent, which implies that 99 customers are fraudulent. This assumption will lead to 99 needless inspections of meters to identify 10 cases of fraud. The FPR of 1% indicates that ten false reports would be generated in detecting ten genuine fraud cases. Therefore, the selection of the performance metrics is very tricky while addressing the class imbalance problems as in NTL detection. In the scenarios of imbalanced datasets, the combination of different metrics such as precision, accuracy, FPR, TNR, and DR should be utilized. The Bayesian Detection Rate (BDR) is another crucial metric, but that is not commonly used in literature for NTL detection [
64]. This parameter usually obtains small values in the intrusion and fraud detection domains because the fraud in these scenarios is not that frequent.
Table 4 provides the list of most commonly used performance metrics for the evaluation of NTL detection models.
5. Categorization of NTL Detection Methods
Researchers are trying different methodologies for efficiently identifying fraudster customers. The existing methods for NTL detection can be broadly categorized into hardware-based and non-hardware-based methods. The hardware-based solutions mainly focus on installing meters with specific equipment to enable PDCs in identifying any malicious activity by consumers [
56,
60]. The recent advances in communication and data processing of the energy consumers’ behavior have led to the development of non-hardware-based NTL detection methods. These non-hardware-based solutions are classified into three major categories, i.e., data-based methods, network-based methods, and hybrid methods. Furthermore, the relationship between demographic and socio-economic issues that helps PDCs to investigate the phenomenon of NTLs is categorized into different theoretical methods. A general classification of NTL detection schemes is given in
Figure 2.
The detailed aspect of every category along with the methodology adopted, benefits, and drawbacks are given in the subsequent sections.
5.1. Studies Based on Social and Economic Conditions
The literature discloses the presence of NTL over the specific population or geographical area and social aspects that relate to the fraud. The authors in [
47,
91] used the statistical techniques to develop the relation between market variables, economic, and social demographics to the amount of theft. The author in [
92] proposed a scheme to understand the main parameters linked to NTL in India and regions of Tanzania using ethnographic fieldwork, surveys, and empirical analysis. The author in [
67] examines different socio-economic characteristics of fraudulent customers using econometric analysis. The primary advantages of these studies are that they are beneficial in designing policies and have a great impact on decisions to decrease NTL. The complexity and the quantity of the data available in these types of studies can be managed easily even if it consists of the indicators and variables that cover the entire region. The major drawback of these techniques is that their scope is limited, i.e., it usually focuses on the specific country or region. These studies are not enough to identify instances of fraud and errors in billing or metering. The generalized additive model (GAM) has been used to demonstrate the spatial allocation of NTL activities in [
32]. This model has been inspired by the subject domain of epidemiology. The research study assumes that electricity theft and fraudulent activities increase in specific areas rendering to specific technical and social characteristics. GAM can be utilized to compute the chances of fraudulent activities in any area and the effect of every technical and social feature if provided with the consumers consumption data. A Markov chain model was utilized later to demonstrate how NTL can sweep in a particular region. This algorithm calculates the spatial distribution and the likelihood of fraud but did not detected the NTL. These models are beneficial when planning and making long-term guidelines for lessening the fraud.
5.2. Hardware-Based Solutions
The hardware-based solution mainly proposes a method in which the researchers majorly emphasize on the characterization and design of the apparatus that allows the identification and estimation of any fraudulent activity [
60]. The author in [
93] proposes an anti-tampering algorithm that offers help to PDCs in identifying tampering of energy meters. This anti-tempering algorithm will help the PDCs to address the issue of bypassing the neutral line and mainline, reversing problems and opening of the frame cover or terminal. The author in [
94] proposed a processor for the protection of energy meters from bypassing phase line, disconnection of neutral line, and tempering of energy meters. A message will be sent to the PDCs if any of the mentioned discrepancies are observed. The authors in [
95] addressed the NTL detection problem by proposing a radio frequency identification (RFID) technology for the sealing of energy meters and speeding the inspection process. The authors in [
65] proposed two points reading that identifies the difference in the electric current flowing from the power pole to the meter wire. The difference in readings of both points can lead to the detection of an NTL activity. The authors in [
96] proposed the usage of the harmonic signal generator for the NTL detection problem. The signals were introduced in the distribution feeders after disconnecting the supplies of honest consumers to destroy the appliances of fraudulent consumers. The authors in [
48] proposed a high-frequency signal generator to identify the location of NTL activity.
5.3. Non-Hardware Based Solutions
As the hardware-based methods need to install the new infrastructure, which involves massive amounts, therefore, it is not feasible for several PDCs, especially those in underdeveloped countries. Therefore, the researchers these days are giving more importance to non-hardware-based solutions. Non-hardware-based solutions relies on the studies in which the main focus of the researchers is to identify the presence of electricity theft from consumers’ energy consumption data. The non-hardware-based solutions can be further classified into the three major classes.
- i.
Data-based methods.
- ii.
Network-based methods.
- iii.
Hybrid methods.
The detail of each of the methods is given in the respective sections.
5.3.1. Data-Based Methods
Data-based methods are merely based on machine learning techniques and data analytics. The main difference between data-based and network-based methods is the utilization of the network in the electricity grid [
11]. The data-based methods are further subdivided into the supervised methods and unsupervised methods, each of which is discussed in the subsequent subsections.
5.3.2. Supervised Methods
Supervised methods are those methods that utilize the data of both classes (positive class/fraudster or negative class/honest class) for the training of the classifier [
73]. These methods learn the patterns in the consumption data of energy consumers for prediction purposes. These supervised methods used the labeled data for training of the classifier, which is later tested on the new dataset. The main drawback of the supervised methods is that, in the absence of the labeled data of fraudster (positive class) consumers, or where the number of fraud cases is much lower than those of honest customers, it is very difficult to use this method [
20]. The supervised machine learning techniques that have been used to solve the NTL detection problem are depicted in
Figure 3.
Each of the methods depicted in
Figure 3, is described in subsequent subsections along with their applications, merits, and limitations.
5.3.3. Support Vector Machine (SVM)
SVM has been used plenty of times as the binary classifiers for NTL detection problem because they are immune to the class imbalance issue [
1,
5,
15,
21,
28,
31,
40,
43,
59,
72,
78]. Many different methodologies have been used, including the cost-sensitive SVM (CS-SVM) and one-class SVM (OC-SVM). The OC-SVM can be viewed as an outlier identification technique. It is normally trained on the data that belong to one class (mostly the honest consumers, i.e., negative class). Nagi et al. [
5] trained an SVM-based model by utilizing the risk and energy usage data of the costumers to predict the presence of NTL. The model was tested in peninsular Malaysia to assist Tenaga Nasional Berhad (TNB) sdn.bhd. The SVM-based model increased the detection rate from 3 to 60%. The CS-SVM can give distinct weights to different classes, for example, one class can allot a higher cost to the wrong classifications of the class with a smaller number of labels that ultimately results in better performance, i.e., low FPR and high BDR. The study of recent literature indicates that SVMs can be used for NTL detection even though it is time-taking and problematic to tune the parameters of SVM. The other most frequently used classes of SVM are the radial basis function kernel (RBF) SVM (SVM-RBF) and linear kernel SVM (Linear-SVM). The difference between SVM-RBF and linear- SVM is that in SVM-RBF, the cost and gamma are required to be tuned, whereas only cost parameter must be tuned in case of Linear-SVM. To increase the classification performance, SVMs are sometimes combined with other well-known classifiers like fuzzy inference system (FIS), DT, or artificial neural networks (ANN).
5.3.4. Artificial Neural Networks (ANN)
ANN are multilayered machine learning algorithms. It has an interrelated set of artificial neurons that are used for addressing prediction and complex problems [
97]. Multi-layer perceptron (MLP) is the most used version of ANN that is used as a binary classifier for NTL detection problems along with back propagation MLP (BP-BLP) [
1,
2,
29,
41,
43,
98]. Furthermore, ANN models have also been utilized for time series forecasting of energy consumption. The difference between the measured value and the predicted value is used for detecting fraud in energy consumption. The selection of different thresholds and the likelihood that fraudulent consumers’ energy consumption data will affect the output of ANN must be considered. However, in both cases (forecast and binary classification), the training of the model must be done after choosing the structure of the network. Even though in most of the recent works, the selection of the optimal network structure is important, yet few of the methodologies select the number of hidden layers and a corresponding number of neurons by the trial and error method. The cross-validation process is used in this scenario to ensure that the model has good generalization ability. Extreme learning machine (ELM) has also been proposed apart from the BP-MLP for forecast and binary classification. ELMs have single or multiple layers of hidden nodes. Hence the parameter tuning of the hidden layers is not needed. In most of the cases, the output weights of the hidden layers are generally computed in a single step. Therefore, ELM models can be trained much faster without having any decline in their performance.
5.3.5. Optimum Path Forest
Optimum path forest (OPF) is also a supervised machine learning graph-based algorithm that is usually used for classification applications. The classification process in OPF is comprised of two steps, i.e., i. Fit and ii. Predict. Compared to the previously used machine learning algorithms which attempt to obtain the optimal hyperplane for the separation of the two classes. The OPF classifier functions by splitting the graph into optimum path trees (two or more than two trees), each one characterizing a separate class. Every tree is connected to the prototype and the assembly of these trees makes the OPF classifier. In the prediction process, the testing samples are assigned the labels of the prototype with the help of cost function. The main advantage of OPF classifier is that it can handle the overlapped class issue with less training time. Therefore, making it feasible for online training of NTL detection [
12,
23,
30,
38,
58]. These features are critical in the scenarios where the testing samples may differ significantly from the training samples.
5.3.6. Rule Induction Methods
A set of rules can be utilized for NTL detection comes in the category of rule induction methods. Expert knowledge and statistical analysis are mostly used in defining the rules for this purpose. In most of the cases, such knowledge is not enough. Therefore, the rule induction methods are utilized for extracting the rules hidden in the data (customarily labelled). The major aim of the process is to forecast the sample belonging to a specific class using the values of other features. FIS has been used for the NTL detection process to explain the reasoning procedure of the experts [
24,
31,
33,
35,
44,
66,
68]. To improve the classification performance of the rule-based systems, they are sometimes joined with well-known classifiers like DT, Bayesian networks and SVM, etc.
5.3.7. Decision Tree
DTs have been used several times for addressing the NTL detection problem [
25,
33,
40,
43,
62,
63,
99,
100,
101]. A DT is a support tool that uses a flowchart-like graph or model to form a set of rules that helps in classifying new samples. DT algorithms are regarded as one of the highly promising AI algorithms in supervised machine learning methods. DT maps the non-linear relations much better than linear models. These are used for performing both classification and regression problems. The rule formed by DTs helps in better understanding the characteristics of the NTL. Ensembles of DTs are formed by combining the practices of DTs with other specific rules, as defined by the experts [
63]. DTs are highly dependent on the training of the dataset and are sensitive to the class imbalance issue. A number of different DTs such as QUEST, CART, C5.0, and EBT have been used for solving NTL detection problems in the literature. The key benefit of using DTs includes their easy interpretation and transparency to the operatives.
5.3.8. Kth Nearest Neighbor
Kth nearest neighbor (K-NN) is one of the simplest supervised machine learning algorithms used for both classification and regression. K-NN classifies the new data by comparing it with the already present data using the similarity measure. K-NN is usually used in the literature for NTL detection as a baseline for comparison with other machine learning algorithms [
20,
55,
63,
102]. The class membership is the output in the k-NN classification. The plurality vote of the neighbors is used for classifying the object which is just allocated to the specific class if the value of k = 1 of its nearest neighbor.
5.3.9. Bayesian Classifiers
The Bayesian classifiers are the probabilistic classifiers in which the responsibility of the class is to predict the values of the features. The Bayesian classifier needs the previous information of NTL probability that can be obtained from the general statistics [
27,
33,
62,
64,
103]. The working of this classifier is based on the fact that if the class of the sample is known, it can be utilized to calculate the values of the different features. It accomplishes the mentioned objective by using the non-intrusive load monitoring (NILM) procedure to learn the pattern of every device being used by the customer. In the scenario of the new sample, NILM is performed repeatedly and the chance of fraud is estimated at the end of the process. These methods need a huge amount of previous information that significantly affects the output of the classifier. Bayesian networks in Bayesian classifiers utilize a set of variables that graphically signify the class probability. The main advantage of Bayesian networks is that they can be easily understood by humans and hence provide a human-friendly interface.
5.3.10. Unsupervised Methods
All those methods that do not require any labels (positive/negative) for the training of the classifiers are known as unsupervised methods [
38]. These methods do not need supervision and hence the model work at its own to learn the information hidden in the provided data. As compared to the supervised machine learning algorithms, unsupervised methods can perform more complicated processing tasks. The following types of unsupervised machine learning algorithms have been used for the NTL detection problem.
Each of the mentioned algorithms in
Figure 4 is discussed in the subsequent subsections.
5.3.11. Clustering Algorithms
Clustering algorithms have been used several times in the NTL detection problem [
4,
16,
38,
42]. Clustering is mostly done at the initial stage for data preprocessing. This is done in order to assemble similar costumers with different types of energy patterns and then a classifier is trained on them to identify or classify the unlabeled data. This process increases the classification performance by reducing the false-positive cases. The clustering algorithms can also be used to compute the baseline energy consumption profile of different customers. The fraud is identified when the new samples substantially vary from these baseline profiles. The clustering process can also be utilized as the unsupervised classification process by calculating the space between the new sample to the middle of the cluster. Fuzzy clustering has been used by correlating the new samples with the odds of fraud. This allows the PDCs to develop and tune the method according to their requirements. Density-based clustering methods have also been used effectively for the NTL detection as they consider different clusters with a little resemblance that can form the dense area and unlike clusters from the less dense area of the space.
5.3.12. Expert Systems
Expert systems are based on the instructions described by the professionals responsible for identifying the NTL in the distribution system [
45,
66,
68,
104]. They are utilized in both supervised as well as unsupervised methods. One of the examples of such systems is FIS. The key aim of these systems is to solve the complex issues by the logic and analysis, mostly represented by if-then rules. These rules are very simple but still achieve high classification performance. Advanced expert systems can merge the latest knowledge clearly and hence update the models very quickly.
5.3.13. Statistical Methods
Control graphs, particularly for the time-series data, have been utilized for observing the individual energy consumption and for describing the areas, where the consumption pattern may be considered as anomalous for time series data. These control graphs investigate the difference between the moving range and the actual consumption. Violation of the rules is the indication of fraud and therefore needs immediate inspection [
32,
66,
69,
75]. Non-parametric cumulative sum control chart and exponentially weighted moving average (EWMA) control chart are few other types of charts that have been explored for NTL detection. These types of maps are famous in industries for the rapid identification of NTL as they provide online information and have the ability of visual examination of data. Such quick detections commonly result in a large number of FPs, therefore, reducing the overall outcome. One of the major limitations of these types of methods is that it fails to identify the fraudulent activity if the consumer is involved in the fraud from its very initial monitoring phase since their very working mechanism is based on detecting the change in consumption patterns. Another limitation of this method is that it interprets the different types of energy consumption changes as the fraud which is not the case in real scenario and hence results in a lot of unnecessary FPs.
5.3.14. Regression Methods
Auto-regressive moving average (ARMA) and auto-regressive integrated moving average (ARIMA) are the regression models that are applied for estimating time series models. The methodology of regression methods depends on the difference between the expected and the calculated value if the regression model has been trained with one class of consumers’ consumption data. The chances of fraud will be higher if the difference between the forecasted and calculated values is higher [
36,
105]. ARIMA and ARMA are two well-known regression models for solving the time series forecasting problems. ARIMA-based models are superior in performance for domestic customers.
5.3.15. Outlier Detection
NTL detection is generally carried out by borrowing many concepts from outlier detection methods [
38,
42,
51,
106,
107,
108]. For example, consider a data set of honest customers in Multivariate Gaussian Distribution (MGD) where every cluster of samples is demonstrated as the Gaussian distribution [
38]. The probability of the new sample belonging to both of the distributions is determined. The likelihood of the samples is evaluated with the threshold value to decide whether the new sample belongs to the anomaly or not. The difficult task in these scenarios is to decide the total number of clusters and the boundaries of the gaussian distribution. K-means clustering and OPF are usually utilized for the outlier detection purpose. The local outlier factor (LOF) has also been used in [
109]. It is the density-based indication of the fraud. LOF is used to compute the local density of the sample and then makes its comparison to the average of the density of the nearest neighbor’s sample. All samples will be considered as anomalies if the local density is considerably less than its neighbors. In this context, it is important to identify the true indication of fraud as a very high LOF is not necessarily an indicator of the fraud. Therefore, new rules should be made and tested before marking a sample as an anomaly. Kaulback-Lieber-Divergence (KLD) has been used in [
110] for NTL detection purposes. It is computed by calculating the distance among the two probability distributions. KLD is utilized for the comparison of the distribution of classes with the standard attained from the historical distribution. KLD is utilized for identifying the smart attacks which conceal the fraudulent consumption usage by adjusting it into the authentic ARIMA models. One obvious benefit of these methodologies is that they can still identify the fraudulent activity even if they were not previously present in the training set.
5.3.16. Network-Based Methods
Network-based methods rely on the information attained from the smart meters and calculation of different physical parameters of the electrical network for efficiently identifying the NTL activity [
11,
111]. Several studies have used the power flow process to calculate the total volume of NTL activity. The area where the fraudulent activity occurs is identified by calculating the energy stability and other parameters with the help of the central observer meter. In contrast, other studies have used distribution state estimation and false data detection for the problems mentioned above. Network-based methods usually are more accurate; however, these methods are not easy to implement. Dedicated sensors are generally required for detecting fraudulent activity. To calculate the minimum number of sensors and their optimal placement in the distribution grid, AI algorithms are generally utilized.
Figure 5 depicts different types of Network-based methods utilized in literature for NTL detection purpose.
5.3.17. Load Flow Approach
The calculation of energy flow in the distribution grid is a clear way to detect NTL activity [
18,
22,
42]. The central observer meter, which is installed for the monitoring of energy meter on the LV section of a distribution transformer, is required in such scenarios. The observer meter’s measurement is then compared with the total energy recorded by the smart meters. The difference between these two readings is computed for computing the overall percentage of technical losses. The chances of NTL activities are higher if the difference between the mentioned readings is higher. Fraudulent activities can be detected with these methodologies up to the secondary substation level. However, the central observer meter is needed to identify every single fraudster customer. In addition to that, the difficult task in these methods is the precise calculation of technical losses in the network. The authors in [
57,
90] used this concept for NTL detection. The different parameters related to meter’s behavior are computed through various methods. These parameters are then matched with that of the regular meter’s parameters to indicate the fraud.
Similarly, for the scenarios in which TLs are not known, the authors in [
18] proposed a new model for calculating network parameters and computing the TLs. The authors in [
39] used a probabilistic power scheme for spotting the NTL activity. The fraudulent activity is identified at the network level with the help of observer meters and the exact location of fraud under the specific observer meter can also be identified. The authors in [
112] proposed a smart substation-based methodology in which both observer meters and smart meters are present. The model will be able to identify the location of the fraudulent activity at the consumers’ level, even if there is not a significant difference between the observer meter reading and the smart meter reading. The authors in [
113] used an identical approach to track network voltage changes by utilizing smart meter data of honest customers. These changes are then used as the network model for computing voltages provided the active power values are known.
5.3.18. State Estimation Approach
Distribution state estimation (DSE) methodologies utilize data from smart meters to observe the grid and hence act as an excellent scheme for correct identification of fraudulent activity [
9,
114,
115]. DSE has been mostly employed at the medium voltage (MV) networks. Fraudulent activity is usually termed as the false data injection (FDI) attacks or as the bad data in the scenarios of state estimation approaches. The significant dissimilarity between FDI and wrong data may include several different bad data. Therefore, FDI is very hard to identify as compared to bad data, which generally appears in a random and isolated fashion. The application of FDI effectively results in fooling the state-estimation-based data detector approaches. The attacker requires substantial information of the grid parameters to initiate the process successfully. The authors in [
57] proposed Kalman filter state-estimator-based centralized solution for locating biases and line currents. The users are expected to be committing fraud if their preferences are higher than the already defined threshold. The Kalman filter ensured privacy by offering a distributed solution. In such scenarios, the operator does not need to acquire permission to access the voltage measurements and power measurement of the users. The proposed solution provides excellent results in the microgrids with the small line spans. In [
52], the fraudulent customer is supposed to have incomplete information of the network topology and hence lacks the ability to enlarge or reduce the values of many smart meters at the uniform spell. These attempts result in non-detection by conventional electricity stability schemes. The author proposed sensor placement, communication devices and smart meters for identifying these types of attacks. The authors in [
114] proposed a weighted least square (WLS) based state estimator approach for calculating a total load of MV/LV transformers from three-phase current, voltage, reactive, and active power values. The considerable variation in estimated and measured values indicate a potential NTL activity. The authors in [
115] proposed a methodology based on network clustering for the detection of bad data. The process is repeated for each of the networks for the identification of bad data and network partitioning.
5.3.19. Sensor Network Approach
The installation of the specific sensors in the power distribution system is an emerging development in the network-oriented-methods. The aim is to reduce the infrastructure expenses and to compute the optimal position and number of sensors to localize and detect NTLs efficiently [
8,
17,
52,
116]. These approaches usually need accurate information on the network structure. They are closely linked to the state estimation approaches, as the objective of the majority of these models is to increase the inspection of the network. Instead of locating the ideal position of smart meters with sensors, the work also examines the positioning of unnecessary smart meters. The issue is resolved by installing the central observer meter and the inspector box before each customer’s smart meter. The central observer meter exchanges the information with customers’ smart meters and compares the energy usage information to detect NTL activity. The fraud is authenticated if the difference between the measured readings is significant.
5.3.20. Hybrid Methods
Hybrid-based approaches are used to implement the techniques and algorithms of both data-oriented and network-based methods for NTL detection with suitable accuracy [
16,
26,
40]. The authors in [
16] used the SVM algorithm along with the central observer meter. The observer meter cross-checks the SVM output to calculate the active power measurements of the network. The difference in the active power measurement and the system’s technical losses are calculated with the SVM algorithm. The inspection is required if the customer is classified as fraudulent, i.e., if the SVM yields positive output and the difference is higher than the predefined limit. Similarly, the authors in [
40] used the same methodology and proposed a combination of DT and SVM for the same purpose. The authors in [
26] proposed the installation of the remote technical unit (RTU) for NTL detection. The power distribution system is divided initially into sub-networks according to the availability of the RTU. The projected methodology identifies the sub-networks with electricity theft utilizing the calculations from smart meters and RTUs directly. A meter tampering is confirmed if the difference between the RTUs and the smart meters is higher than a predefined threshold. In the last stage, SVM and fuzzy c-means are used to identify the individual customers that are committing fraud. The authors in [
34] proposed a network loss analysis method to estimate the number of customers that are involved in fraudulent activities. The suspected boundary region is calculated by rough sets. The authors in [
117] proposed the asymmetric control limit (ACL)-based control charts for addressing the same problem. The upper and lower limits are used to enhance the balance between total energy used by customers, the total energy measured, and the total losses. Another approach proposed in [
118] used ANOVA and state estimation for NTL detection that require RTU data, smart metering data, and different network parameters. A distribution state computation is applied by utilizing the smart meters’ consumption data. The normalized residual procedure is then used to identify the exact location of fraudulent activity at the LV transformer level. The ANOVA is used at the later stage for comparing the outcomes with the previously verified baselines. The findings of ANOVA are then fed back to the state estimator section to replace the bad data with the improved estimates. The authors in [
119] also used the same idea to address the state estimation issues with semidefinite programming. The author in [
120] proposed the opposite framework in which the density of different anomalies per transformer is calculated by an unsupervised anomaly detection algorithm. The weight matrix of the state estimator is then adjusted by that density, which computes the loading position of the transformer utilizing the pseudo-calculations and load forecasting. TL and NTL’s can then be calculated at the individual transformer level. The author in [
121] used a state estimation-based approach along with the supervised approach based on the OPF classifier to evaluate the level of fraudulent activities. The author in [
122] proposed the hybrid method using multivariate control charts, state estimation, and path search algorithms. The state estimation is applied to the MV side utilizing data from the field appliances. The variance in the estimated current/voltage value and measured value are being used for describing the multivariate procedure monitoring issues. The fraud is detected if any of the above-described differences are outside the region.
Table 5 provides a detailed comparison of data-based methods in term of resources, class imbalance, response time, cost required and performance.
6. Limitations of Available Solutions and Future Recommendations
The supervised machine learning algorithms generally perform superior compared to unsupervised machine learning algorithms [
123]. However, the major drawback associated with the supervised machine learning algorithms is the requirement of labelled data, which is not readily available. Another major problem faced by supervised machine learning algorithms is a class imbalance. Since there are pros and cons linked to every supervised machine learning algorithm, it is very crucial to select a suitable algorithm for a particular classification task. For example, SVM performs better when dealing with higher dimensional data and cases where the classes are separable. Another key advantage of SVM-based algorithms is that the outlier does not have much impact on the results. Despite the vast applicability of SVM classifiers, they suffer from few drawbacks such as, they require huge time for processing of data, performs poorly in the scenarios of overlapped classes, and the selection of appropriate kernels and hyperparameters is a strenuous task. Naïve Bayes, on the other hand, are suitable for real-time classification/predictions and perform well with high dimensional data. The key limitation of this algorithm is that the significance of the single feature does not hold prominent as a combination of all the features contributes to the outcome. The advantage of logistic regression (LR)-based algorithms is that these algorithms are simple and effective to implement as tuning of hyperparameters and scaling of features is not needed; however, they perform poorly in the case of non-linear data-set where they are generally outperformed by its counterpart algorithms. Decision tree-based algorithms does not require scaling and normalization of data. They can tackle the missing values and can be easily interpreted. The major drawbacks of DT-based algorithms are that they result in overfitting, sensitive to the class imbalance and need massive time for the training of models. Similarly, ensemble methods like Bagging and Boosting reduces the error due to voting of weak learners to reach the final decision and, at the same time, perform well in the scenarios of imbalanced data sets. Another important aspect of the mentioned category of classifiers is that they can handle huge data and missing values better than conventional algorithms such as SVM and DTs. Furthermore, the outliers have a very minute impact on the final predictions in ensemble methods and hence these models do not result in overfitting to the training data. Despite the mentioned benefits, this method also suffers from few prominent drawbacks such as; they appear as the black box, trees are needed to be uncorrelated and each feature needs to have the predictive ability; otherwise, they are not considered.
Contrary to the supervised machine learning methods, the unsupervised machine learning methods do not require labelled data for the model training purpose. This is because of the reason that these methods are applied in the scenarios where positive samples (fraudster customers data) cases are rare and large number of negative samples (honest customers data) are available. Unlike the supervised ML methods, the unsupervised methods possess the capability of detecting the new fraud cases; hence they can be applied conveniently for NTL detection; however, they normally result in poor performance with a large number of false positives.
Owing to the above mentioned facts, it is evident that the supervised methods can be explicitly used in the scenarios where there sufficient samples of positive class (fraudster) are available while unsupervised methods are suitable when the data for the mentioned class is scarce. Concluding the above discussion, it is important to note that all algorithms respond differently to different types of data. For example, Naïve Bayes performs best when features are highly independent. SVM, on the other hand, is suited for a medium-sized data set with a large number of features. Linear regression and logistic regression are best suited for training the models when there exists a linear relationship between independent and dependent variables. K-NN can be used in the scenarios when the data set is of small size and the relationship between the independent and dependent variables is not known. Hence, different machine learning algorithms respond differently to different types of data sets. Therefore, there is no thumb rule for selecting an algorithm accurately for a classification problem; however, based on the above discussion one can try the most relevant algorithms considering the available data and its stated features.
The detailed review of the literature reveals that there is a scarcity of research that assesses the impact of NTL in non-developed countries. Contrary to that, the developed countries have much less impact of NTL; yet the impact is considerable. It is worthwhile to mention that, there is a lack of research on assessing the financial impact of implementing the network-based methods, i.e., installation of specific sensors and smart meters. The stated assessment is important to infer whether the benefit from NTL reduction from installing new infrastructure exceeds the equipment cost. Most of the published research work on this area of research focuses on a single aspect of NTL sources. The authors of the current research, after a detailed literature review in the current area of research, felt the necessity of a systematic study that considers all types of potential NTL sources and their implications. Furthermore, the applications that incorporate numerous solutions to classify the NTLs from a variety of possible sources are also lacking in the existing literature. The author, therefore, envisages that the future studies should emphasize on developing the applications which utilize the multiple solutions of NTL detection in an integrated manner.
7. Conclusions
This article presents a detailed review of state-of-the-art methodologies for identifying fraudulent activities in PDCs as discussed in three significant repositories: ACM Digital Library, Science Direct, and IEEE explore published since 2000. The study focuses mainly on the proposed solutions, criteria, and drawbacks. The literature review in the current article focused primarily on nor-hardware-based solutions, 79 of 91 studies belongs to non-hardware-based solutions. The summary of the literature revealed a sufficient gap in the category of theoretical methods as there is a strong need to investigate the causes of NTL in developing countries. The developed countries have a much low percentage of NTLs, yet the consequences are substantial. There is an insufficient evaluation of the financial viability in the hardware-based methods, as this is essential for concluding that the reduction from the NTLs activities can recover the cost of equipment. How hardware-based methods communicate with non-hardware-based methods should also be examined in-depth since these methodologies go side by side typically.
Author Contributions
Conceptualization, M.S.S.; methodology, U.U.S.; software, T.A.J. and M.S.S.; validation, N.N.H., N.A.A. and I.K.; formal analysis, T.A.J. and S.B.A.K.; investigation, S.B.A.K.; resources, M.W.M.; data curation, N.A.A. and N.N.H.; writing—original draft preparation, M.S.S.; writing—review and editing, T.A.J. and U.U.S.; visualization, U.U.S. and I.K.; supervision, M.W.M.; project administration, I.K.; funding acquisition, N.N.H., N.A.A. and I.K. All authors have read and agreed to the published version of the manuscript.
Funding
This research received no external funding.
Conflicts of Interest
The authors declare no conflict of interest.
Nomenclature
| Acc | Accuracy |
| ANN | Artificial Neural Network |
| ARMA | Auto-Regressive Moving Average |
| ARIMA | Auto-Regressive Integrated Moving Average |
| ANOVA | Analysis of variance |
| AUC | Area Under Curve |
| BP-MLP | Back propagation multi-layer perceptron |
| CART | Classification and Regression Trees |
| DR | Detection Rate |
| DT | Decision Tree |
| EBT | Ensemble Bagged Tree |
| EWMA | Exponentially Weighted Moving Average |
| FDS | Fraud Detection System |
| FPR | False Positive Rate |
| FNR | False Negative Rate |
| GAM | Generalized Additive Model |
| KLD | Kaulback-Lieber-Divergence |
| K-NN | Kth-Nearest Neighbor |
| LOF | Local Outlier Factor |
| LV | Low Voltage |
| MGD | Multivariate Gaussian Distribution |
| MLP | Multi-Layer Perceptron |
| MV | Medium Voltage |
| NILM | Non-Intrusive Load Monitoring |
| NTL | Non-Technical Losses |
| OPF | Optimum Path Forest |
| PDC | Power Distribution Companies |
| PPV | Positive Predictive Value |
| ROC | Receiver Operating Characteristic |
| RTU | Remote Technical Unit |
| SVM | Support Vector Machine |
| TL | Technical Losses |
| TNR | True Negative Rate |
| TPR | True Positive Rate |
| WLS | Weighted Least Square |
| QUEST | Quick, Unbiased, Efficient, Statistical Tree |
References
- Depuru, S.S.S.R.; Wang, L.; Devabhaktuni, V.; Nelapati, P. A hybrid neural network model and encoding technique for enhanced classification of energy consumption data. In Proceedings of the 2011 IEEE Power and Energy Society General Meeting, Detroit, MI, USA, 24–28 July 2011; pp. 1–8. [Google Scholar]
- Costa, B.C.; Alberto, B.L.A.; Portela, A.M.; Maduro, W.; Eler, E.O. Fraud Detection in Electric Power Distribution Networks using an Ann-Based Knowledge-Discovery Process. Int. J. Artif. Intell. Appl. 2013, 4, 17–23. [Google Scholar] [CrossRef]
- Sharma, T.; Pandey, K.K.; Punia, D.K.; Rao, J. Of pilferers and poachers: Combating electricity theft in India. Energy Res. Soc. Sci. 2016, 11, 40–52. [Google Scholar] [CrossRef]
- Dos Angelos, E.W.S.; Saavedra, O.R.; Cortés, O.A.C.; De Souza, A.N. Detection and identification of abnormalities in customer consumptions in power distribution systems. IEEE Trans. Power Deliv. 2011, 26, 2436–2442. [Google Scholar] [CrossRef]
- Nagi, J.; Mohammad, A.M.; Yap, K.S.; Tiong, S.K.; Ahmed, S.K.; Mohamad, M.; Mohammad, A.M.; Yap, K.S.; Tiong, S.K.; Ahmed, S.K. Nontechnical Loss Detection for Metered Consumers in Power Utility Using Support Vector Machines. IEEE Trans. Power Deliv. 2010, 25, 1162–1171. [Google Scholar] [CrossRef]
- Rengaraju, P.; Pandian, S.R.; Lung, C.-H. Communication networks and non-technical energy loss control system for smart grid networks. In Proceedings of the 2014 IEEE Innovative Smart Grid Technologies (ISGT ASIA), Kuala lumpur, Malaysia, 20–23 May 2014; pp. 418–423. [Google Scholar]
- Depuru, S.S.S.R.; Wang, L.; Devabhaktuni, V. Smart meters for power grid: Challenges, issues, advantages and status. Renew. Sustain. Energy Rev. 2011, 15, 2736–2742. [Google Scholar] [CrossRef]
- McLaughlin, S.; Holbert, B.; Fawaz, A.; Berthier, R.; Zonouz, S. A multi-sensor energy theft detection framework for advanced metering infrastructures. IEEE J. Sel. Areas Commun. 2013, 31, 1319–1330. [Google Scholar] [CrossRef]
- Jiang, R.; Lu, R.; Wang, Y.; Luo, J.; Shen, C.; Shen, X.; Cited, R.; Wang, Z. Energy-theft detection issues for advanced metering infrastructure in smart grid. Tsinghua Sci. Technol. 2014, 19, 105–120. [Google Scholar] [CrossRef]
- McLaughlin, S.; Podkuiko, D.; McDaniel, P. Energy theft in the advanced metering infrastructure. In Proceedings of the Lecture Notes in Computer Science, Bonn, Germany, 30 September–2 October 2009; pp. 176–187. [Google Scholar]
- Messinis, G.M.; Hatziargyriou, N.D. Review of non-technical loss detection methods. Electr. Power Syst. Res. 2018, 158, 250–266. [Google Scholar] [CrossRef]
- Ramos, C.C.O.O.; Rodrigues, D.; De Souza, A.N.A.N.; Papa, J.P.J.P. On the study of commercial losses in Brazil: A binary black hole algorithm for theft characterization. IEEE Trans. Smart Grid 2018, 9, 676–683. [Google Scholar] [CrossRef]
- Chen, S.J.; Zhan, T.S.; Huang, C.H.; Chen, J.L.; Lin, C.H. Nontechnical loss and outage detection using fractional-order self-synchronization error-based fuzzy petri nets in micro-distribution systems. IEEE Trans. Smart Grid 2015, 6, 411–420. [Google Scholar] [CrossRef]
- Lin, C.H.; Chen, S.J.; Kuo, C.L.; Chen, J.L. Non-cooperative game model applied to an advanced metering infrastructure for non-technical loss screening in micro-distribution systems. IEEE Trans. Smart Grid 2014, 5, 2468–2469. [Google Scholar] [CrossRef]
- Punmiya, R.; Choe, S. Energy theft detection using gradient boosting theft detector with feature engineering-based preprocessing. IEEE Trans. Smart Grid 2019, 10, 2326–2329. [Google Scholar] [CrossRef]
- Jokar, P.; Arianpoo, N.; Leung, V.C.M. Electricity theft detection in AMI using customers’ consumption patterns. IEEE Trans. Smart Grid 2016, 7, 216–226. [Google Scholar] [CrossRef]
- Xiao, Z.; Xiao, Y.; Du, D.H.C. Exploring malicious meter inspection in neighborhood area smart grids. IEEE Trans. Smart Grid 2013, 4, 214–226. [Google Scholar] [CrossRef]
- Tariq, M.; Poor, H.V. Electricity Theft Detection and Localization in Grid-Tied Microgrids. IEEE Trans. Smart Grid 2018, 9, 1920–1929. [Google Scholar] [CrossRef]
- Liao, C.; Ten, C.W.; Hu, S. Strategic FRTU deployment considering cybersecurity in secondary distribution network. IEEE Trans. Smart Grid 2013, 4, 1264–1274. [Google Scholar] [CrossRef]
- Buzau, M.M.; Tejedor-Aguilera, J.; Cruz-Romero, P.; Gomez-Exposito, A. Detection of non-technical losses using smart meter data and supervised learning. IEEE Trans. Smart Grid 2019, 10, 2661–2670. [Google Scholar] [CrossRef]
- Messinis, G.M.; Rigas, A.E.; Hatziargyriou, N.D. A Hybrid Method for Non-Technical Loss Detection in Smart Distribution Grids. IEEE Trans. Smart Grid 2019, 10, 6080–6091. [Google Scholar] [CrossRef]
- Ferreira, T.S.D.; Trindade, F.C.L.; Vieira, J.C.M. Load Flow-Based Method for Nontechnical Electrical Loss Detection and Location in Distribution Systems Using Smart Meters. IEEE Trans. Power Syst. 2020, 35, 3671–3681. [Google Scholar] [CrossRef]
- Ramos, C.C.O.; De Sousa, A.N.; Papa, J.P.; Falcão, A.X. A new approach for nontechnical losses detection based on optimum-path forest. IEEE Trans. Power Syst. 2011, 26, 181–189. [Google Scholar] [CrossRef]
- León, C.; Biscarri, F.; Monedero, I.; Guerrero, J.I.; Biscarri, J.; Millán, R. Variability and trend-based generalized rule induction model to NTL detection in power companies. IEEE Trans. Power Syst. 2011, 26, 1798–1807. [Google Scholar] [CrossRef]
- Guerrero, J.I.; Monedero, I.; Biscarri, F.; Biscarri, J.; Millan, R.; Leon, C. Non-Technical Losses Reduction by Improving the Inspections Accuracy in a Power Utility. IEEE Trans. Power Syst. 2018, 33, 1209–1218. [Google Scholar]
- Guo, Y.; Ten, C.W.; Jirutitijaroen, P. Online data validation for distribution operations against cybertampering. IEEE Trans. Power Syst. 2014, 29, 550–560. [Google Scholar] [CrossRef]
- Massaferro, P.; Di Martino, J.M.; Fernandez, A. Fraud Detection in Electric Power Distribution: An Approach that Maximizes the Economic Return. IEEE Trans. Power Syst. 2020, 35, 703–710. [Google Scholar] [CrossRef]
- Nizar, A.H.; Dong, Z.Y.; Wang, Y. Power utility nontechnical loss analysis with extreme learning machine method. IEEE Trans. Power Syst. 2008, 23, 946–955. [Google Scholar] [CrossRef]
- Buzau, M.-M.; Tejedor-Aguilera, J.; Cruz-Romero, P.; Gomez-Exposito, A. Hybrid deep neural networks for detection of non-technical losses in electricity smart meters. IEEE Trans. Power Syst. 2019, 35, 1254–1263. [Google Scholar]
- Ramos, C.C.O.; De Souza, A.N.; Falcão, A.X.; Papa, J.P. New insights on nontechnical losses characterization through evolutionary-based feature selection. IEEE Trans. Power Deliv. 2012, 27, 140–146. [Google Scholar] [CrossRef]
- Nagi, J.; Yap, K.S.; Tiong, S.K.; Ahmed, S.K.; Nagi, F. Improving SVM-based nontechnical loss detection in power utility using the fuzzy inference system. IEEE Trans. Power Deliv. 2011, 26, 1284–1285. [Google Scholar] [CrossRef]
- Faria, L.T.; Melo, J.D.; Padilha-Feltrin, A. Spatial-Temporal Estimation for Nontechnical Losses. IEEE Trans. Power Deliv. 2016, 31, 362–369. [Google Scholar] [CrossRef] [Green Version]
- Monedero, I.; Biscarri, F.; León, C.; Guerrero, J.I.; Biscarri, J.; Millán, R. Detection of frauds and other non-technical losses in a power utility using Pearson coefficient, Bayesian networks and decision trees. Int. J. Electr. Power Energy Syst. 2012, 34, 90–98. [Google Scholar] [CrossRef]
- Spirić, J.V.; Stanković, S.S.; Dočić, M.B.; Popović, T.D. Using the rough set theory to detect fraud committed by electricity customers. Int. J. Electr. Power Energy Syst. 2014, 62, 727–734. [Google Scholar] [CrossRef]
- Depuru, S.S.S.R.; Wang, L.; Devabhaktuni, V.; Green, R.C. High performance computing for detection of electricity theft. Int. J. Electr. Power Energy Syst. 2013, 47, 21–30. [Google Scholar] [CrossRef]
- Yip, S.C.; Wong, K.S.; Hew, W.P.; Gan, M.T.; Phan, R.C.W.; Tan, S.W. Detection of energy theft and defective smart meters in smart grids using linear regression. Int. J. Electr. Power Energy Syst. 2017, 91, 230–240. [Google Scholar] [CrossRef]
- Guo, X.; Yin, Y.; Dong, C.; Yang, G.; Zhou, G. On the class imbalance problem. Electr. Power Syst. Res. 2008, 4, 192–201. [Google Scholar]
- Júnior, L.A.P.; Ramos, C.C.O.; Rodrigues, D.; Pereira, D.R.; de Souza, A.N.; da Costa, K.A.P.; Papa, J.P. Unsupervised non-technical losses identification through optimum-path forest. Electr. Power Syst. Res. 2016, 140, 413–423. [Google Scholar] [CrossRef] [Green Version]
- Neto, E.A.C.A.; Coelho, J. Probabilistic methodology for Technical and Non-Technical Losses estimation in distribution system. Electr. Power Syst. Res. 2013, 97, 93–99. [Google Scholar] [CrossRef]
- Jindal, A.; Dua, A.; Kaur, K.; Singh, M.; Kumar, N.; Mishra, S. Decision Tree and SVM-Based Data Analytics for Theft Detection in Smart Grid. IEEE Trans. Ind. Inform. 2016, 12, 1005–1016. [Google Scholar] [CrossRef]
- Zheng, Z.; Yang, Y.; Niu, X.; Dai, H.N.; Zhou, Y. Wide and Deep Convolutional Neural Networks for Electricity-Theft Detection to Secure Smart Grids. IEEE Trans. Ind. Inform. 2018, 14, 1606–1615. [Google Scholar] [CrossRef]
- Zheng, K.; Chen, Q.; Wang, Y.; Kang, C.; Xia, Q. A Novel Combined Data-Driven Approach for Electricity Theft Detection. IEEE Trans. Ind. Inform. 2019, 15, 1809–1819. [Google Scholar] [CrossRef]
- Saeed, M.S.; Mustafa, M.W.; Sheikh, U.U.; Jumani, T.A.; Khan, I.; Atawneh, S.; Hamadneh, N.N. An Efficient Boosted C5.0 Decision-Tree-Based Classification Approach for Detecting Non-Technical Losses in Power Utilities. Energies 2020, 13, 3242. [Google Scholar]
- Vahabzadeh, A.; Kasaeian, A.; Monsef, H.; Aslani, A. A fuzzy-SOM method for fraud detection in power distribution networks with high penetration of roof-top grid-connected PV. Energies 2020, 13, 1287. [Google Scholar] [CrossRef] [Green Version]
- Lu, X.; Zhou, Y.; Wang, Z.; Yi, Y.; Feng, L.; Wang, F. Knowledge embedded semi-supervised deep learning for detecting non-technical losses in the smart grid. Energies 2019, 12, 3452. [Google Scholar] [CrossRef] [Green Version]
- Jamil, F.; Ahmad, E. Policy considerations for limiting electricity theft in the developing countries. Energy Policy 2019, 129, 452–458. [Google Scholar] [CrossRef]
- Mimmi, L.M.; Ecer, S. An econometric study of illegal electricity connections in the urban favelas of Belo Horizonte, Brazil. Energy Policy 2010, 38, 5081–5097. [Google Scholar] [CrossRef]
- Depuru, S.S.S.R.; Wang, L.; Devabhaktuni, V. Electricity theft: Overview, issues, prevention and a smart meter based approach to control theft. Energy Policy 2011, 39, 1007–1015. [Google Scholar] [CrossRef]
- Bin-Halabi, A.; Nouh, A.; Abouelela, M. Remote Detection and Identification of Illegal Consumers in Power Grids. IEEE Access 2019, 7, 71529–71540. [Google Scholar] [CrossRef]
- Kim, J.Y.; Hwang, Y.M.; Sun, Y.G.; Sim, I.; Kim, D.I.; Wang, X. Detection for Non-Technical Loss by Smart Energy Theft with Intermediate Monitor Meter in Smart Grid. IEEE Access 2019, 7, 129043–129053. [Google Scholar] [CrossRef]
- Fenza, G.; Gallo, M.; Loia, V. Drift-aware methodology for anomaly detection in smart grid. IEEE Access 2019, 7, 9645–9657. [Google Scholar] [CrossRef]
- Lo, C.H.; Ansari, N. CONSUMER: A novel hybrid intrusion detection system for distribution networks in smart grid. IEEE Trans. Emerg. Top. Comput. 2013, 1, 33–44. [Google Scholar] [CrossRef]
- Zhou, Y.; Chen, X.; Zomaya, A.Y.; Wang, L.; Hu, S. A Dynamic Programming Algorithm for Leveraging Probabilistic Detection of Energy Theft in Smart Home. IEEE Trans. Emerg. Top. Comput. 2015, 3, 502–513. [Google Scholar] [CrossRef]
- Zhan, T.S.; Chen, S.J.; Kao, C.C.; Kuo, C.L.; Chen, J.L.; Lin, C.H. Non-technical loss and power blackout detection under advanced metering infrastructure using a cooperative game based inference mechanism. IET Gener. Transm. Distrib. 2016, 10, 873–882. [Google Scholar] [CrossRef]
- No, J.G.; Han, S.Y.; Joo, Y.J.; Shin, J.-H.H.; No, J.G.; Shin, J.-H.H.; Joo, Y.J. Conditional abnormality detection based on AMI data mining. IET Gener. Transm. Distrib. 2016, 10, 3010–3016. [Google Scholar]
- Viegas, J.L.; Esteves, P.R.; Melício, R.; Mendes, V.M.F.; Vieira, S.M. Solutions for detection of non-technical losses in the electricity grid: A review. Renew. Sustain. Energy Rev. 2017, 80, 1256–1268. [Google Scholar] [CrossRef] [Green Version]
- Salinas, S.; Li, M.; Li, P. Privacy-preserving energy theft detection in smart grids: A P2P computing approach. IEEE J. Sel. Areas Commun. 2013, 31, 257–267. [Google Scholar] [CrossRef]
- Ramos, C.C.O.; Souza, A.N.; Chiachia, G.; Falcão, A.X.; Papa, J.P. A novel algorithm for feature selection using Harmony Search and its application for non-technical losses detection. Comput. Electr. Eng. 2011, 37, 886–894. [Google Scholar] [CrossRef]
- Pereira, D.R.; Pazoti, M.A.; Pereira, L.A.M.; Rodrigues, D.; Ramos, C.O.; Souza, A.N.; Papa, J.P. Social-Spider Optimization-based Support Vector Machines applied for energy theft detection. Comput. Electr. Eng. 2016, 49, 25–38. [Google Scholar] [CrossRef] [Green Version]
- Xia, X.; Xiao, Y.; Liang, W. SAI: A Suspicion Assessment-Based Inspection Algorithm to Detect Malicious Users in Smart Grid. IEEE Trans. Inf. Forensics Secur. 2020, 15, 361–374. [Google Scholar] [CrossRef]
- Viegas, J.L.; Vieira, S.M.; Melício, R.; Mendes, V.M.F.; Sousa, J.M.C. Classification of new electricity customers based on surveys and smart metering data. Energy 2016, 107, 804–817. [Google Scholar] [CrossRef]
- Chebrolu, S.; Abraham, A.; Thomas, J.P. Feature deduction and ensemble design of intrusion detection systems. Comput. Secur. 2005, 24, 295–307. [Google Scholar] [CrossRef]
- Saeed, M.S.; Mustafa, M.W.; Sheikh, U.U.; Jumani, T.A.; Mirjat, N.H. Ensemble bagged tree based classification for reducing non-technical losses in multan electric power company of Pakistan. Electronics 2019, 8, 860. [Google Scholar] [CrossRef] [Green Version]
- Axelsson, S. The Base-Rate Fallacy and the Difficulty of Intrusion Detection. ACM Trans. Inf. Syst. Secur. 2000, 3, 186–205. [Google Scholar] [CrossRef]
- Henriques, H.O.; Barbero, A.P.L.; Ribeiro, R.M.; Fortes, M.Z.; Zanco, W.; Xavier, O.S.; Amorim, R.M. Development of adapted ammeter for fraud detection in low-voltage installations. Meas. J. Int. Meas. Confed. 2014, 56, 1–7. [Google Scholar] [CrossRef]
- Guerrero, J.I.; León, C.; Monedero, I.; Biscarri, F.; Biscarri, J. Improving Knowledge-Based Systems with statistical techniques, text mining, and neural networks for non-technical loss detection. Knowl.-Based Syst. 2014, 71, 376–388. [Google Scholar] [CrossRef]
- Yurtseven, Ç. The causes of electricity theft: An econometric analysis of the case of Turkey. Util. Policy 2015, 37, 70–78. [Google Scholar] [CrossRef]
- León, C.; Biscarri, F.; Monedero, I.; Guerrero, J.I.; Biscarri, J.; Millán, R. Integrated expert system applied to the analysis of non-technical losses in power utilities. Expert Syst. Appl. 2011, 38, 10274–10285. [Google Scholar] [CrossRef]
- Nikovski, D.N.; Wang, Z.; Esenther, A.; Sun, H.; Sugiura, K.; Muso, T.; Tsuru, K. Smart Meter Data Analysis for Power Theft Detection. In Proceedings of the 14th International Conference of Machine Learning and Data Mining in Pattern Recognition, New York, NY, USA, 19–25 July 2013; pp. 379–389. [Google Scholar]
- Glauner, P.; Meira, J.A.; Dolberg, L.; State, R.; Bettinger, F.; Rangoni, Y. Neighborhood features help detecting non-technical losses in big data sets. In Proceedings of the 3rd IEEE/ACM International Conference on Big Data Computing, Applications and Technologies (BDCAT 2016), Shanghai, China, 6–9 December 2016; pp. 253–261. [Google Scholar]
- Bandim, C.J.; Alves, J.E.R.; Pinto, A.V.; Souza, F.C.; Loureiro, M.R.B.; Magalhaes, C.A.; Galvez-Durand, F. Identification of energy theft and tampered meters using a central observer meter: A mathematical approach. In Proceedings of the 2003 IEEE PES Transmission and Distribution Conference & Exposition, Dallas, TX, USA, 7–12 September 2003; pp. 163–168. [Google Scholar]
- Nagi, J.; Mohammad, A.M.; Yap, K.S.; Tiong, S.K.; Ahmed, S.K. Non-Technical Loss analysis for detection of electricity theft using support vector machines. In Proceedings of the IEEE 2nd International Power and Energy Conference, Johor Bahru, Malaysia, 1–3 December 2008; pp. 907–912. [Google Scholar]
- Coma-Puig, B.; Carmona, J.; Gavalda, R.; Alcoverro, S.; Martin, V. Fraud detection in energy consumption: A supervised approach. In Proceedings of the IEEE 3rd International Conference on Data Science and Advanced Analytics (DSAA 2016), Montreal, QC, Canada, 17–19 December 2016; pp. 120–129. [Google Scholar]
- Azzini, L.G.B.I.; Giannopoulos, G. A Methodology for Resilience Optimisation. In Proceedings of the 10th International Conference on Critical Information Infrastructures Security, Berlin, Germany, 5–7 October 2015; Volume 9578, pp. 56–66. [Google Scholar]
- Singh, S.K.; Bose, R.; Joshi, A. Minimizing Energy Theft by Statistical Distance based Theft Detector in AMI. In Proceedings of the National Conference on Communications (NCC 2018), Hyderabad, India, 25–28 February 2018; pp. 1–5. [Google Scholar]
- Trevizan, R.D.; Bretas, A.S.; Rossoni, A. Nontechnical Losses detection: A Discrete Cosine Transform and Optimum-Path Forest based approach. In Proceedings of the North American Power Symposium (NAPS 2015), Charlotte, NC, USA, 4–6 October 2015; pp. 1–6. [Google Scholar]
- Ford, V.; Siraj, A.; Eberle, W. Smart grid energy fraud detection using artificial neural networks. In Proceedings of the IEEE Symposium on Computational Intelligence Applications in Smart Grid (CIASG 2014), Orlando, FL, USA, 9–12 December 2014; pp. 1–6. [Google Scholar]
- Toma, R.N.; Hasan, M.N.; Al Nahid, A.; Li, B. Electricity Theft Detection to Reduce Non-Technical Loss using Support Vector Machine in Smart Grid. In Proceedings of the 1st International Conference on Advances in Science, Engineering and Robotics Technology (ICASERT 2019), Dhaka, Bangladesh, 3–5 May 2019. [Google Scholar]
- Glauner, P.; Boechat, A.; Dolberg, L.; State, R.; Bettinger, F.; Rangoni, Y.; Duarte, D. Large-scale detection of non-technical losses in imbalanced data sets. In Proceedings of the IEEE Power and Energy Society Innovative Smart Grid Technologies Conference (ISGT 2016), Minneapolis, MN, USA, 6–9 September 2016; pp. 1–5. [Google Scholar]
- Meira, J.A.; Glauner, P.; State, R.; Valtchev, P.; Dolberg, L.; Bettinger, F.; Duarte, D. Distilling provider-independent data for general detection of non-technical losses. In Proceedings of the IEEE Power and Energy Conference at Illinois (PECI 2017), Champaign, IL, USA, 23–24 February 2017; pp. 1–5. [Google Scholar]
- Tzafestas, S.G. (Ed.) Advances in Intelligent Systems; Springer: Berlin, Germany, 1999; ISBN 9783642365294. [Google Scholar]
- Di Martino, M.; Decia, F.; Molinelli, J.; Fernández, A. A Novel Framework for Nontechnical Losses Detection in Electricity Companies. In Pattern Recognition-Applications and Methods; Springer: Berlin, Germany, 2013; pp. 109–120. [Google Scholar]
- Nagi, J.; Ahmed, S.K.; Nagi, F. Intelligent System for Detection of Abnormalities and Theft of Electricity Using Genetic Algorithm and Support Vector Machines; UNITEN: Kajang, Malaysia, 2008; pp. 122–127. [Google Scholar]
- Singh, S.K. PCA based Electricity Theft Detection in Advanced Metering Infrastructure. In Proceedings of the 2017 7th International Conference on Power Systems (ICPS), Pune, India, 21–23 December 2017; IEEE: Piscataway, NJ, USA, 2018; pp. 441–445. [Google Scholar]
- Messinis, G.; Dimeas, A.; Rogkakos, V.; Andreadis, K.; Menegatos, I.; Hatziargyriou, N.; Electricity, H.; Network, D. Utilizing Smart Meter Data for Electricity Fraud Detection; SEERC: Portoroz, Slovenia, 2016. [Google Scholar]
- Depuru, S.S.S.R. Modeling, Detection, and Prevention of Electricity Theft for Enhanced Performance and Security of Power Grid. Ph.D. Thesis, University of Toledo, Toledo, OH, USA, 2012; p. 141. [Google Scholar]
- Ahmad, T. Non-technical loss analysis and prevention using smart meters. Renew. Sustain. Energy Rev. 2017, 72, 573–589. [Google Scholar] [CrossRef]
- Liu, Y.; Hu, S. Cyberthreat analysis and detection for energy theft in social networking of smart homes. IEEE Trans. Comput. Soc. Syst. 2015, 2, 148–158. [Google Scholar] [CrossRef]
- Mashima, D.; Cardenas, A. Evaluating Electricity Theft Detectors in Smart Grid Networks. In International Workshop on Recent Advances in Intrusion Detection; Springer: Amsterdam, The Netherlands, 2012. [Google Scholar]
- Han, W.; Xiao, Y. A novel detector to detect colluded non-technical loss frauds in smart grid. Comput. Netw. 2017, 117, 19–31. [Google Scholar] [CrossRef] [Green Version]
- Jamil, F. On the electricity shortage, price and electricity theft nexus. Energy Policy 2013, 54, 267–272. [Google Scholar] [CrossRef]
- Winther, T. Energy for Sustainable Development Electricity theft as a relational issue: A comparative look at Zanzibar, Tanzania, and the Sunderban Islands, India. Energy Sustain. Dev. 2012, 16, 111–119. [Google Scholar] [CrossRef]
- Lydia, M.; Kumar, G.E.P.; Levron, Y. Detection of Electricity Theft based on Compressed Sensing. In Proceedings of the 5th International Conference on Advanced Computing & Communication Systems (ICACCS 2019), Coimbatore, India, 15–16 March 2019; pp. 995–1000. [Google Scholar]
- Dineshkumar, K.; Ramanathan, P.; Ramasamy, S. Development of ARM processor based electricity theft control system using GSM network. In Proceedings of the IEEE International Conference on Circuit, Power and Computing Technologies (ICCPCT 2015), Nagercoil, India, 19–20 March 2015; pp. 1–6. [Google Scholar]
- Khoo, B.; Cheng, Y. Using RFID for anti-theft in a Chinese electrical supply company: A cost-benefit analysis. In Proceedings of the Wireless Telecommunications Symposium (WTS 2011), New York, NY, USA, 13–15 April 2011. [Google Scholar]
- Depuru, S.S.S.R.; Wang, L.; Devabhaktuni, V. A conceptual design using harmonics to reduce pilfering of electricity. In Proceedings of the IEEE PES General Meeting (PES 2010), Providence, RI, USA, 25–29 July 2010; pp. 1–7. [Google Scholar]
- Arfeen, Z.A.; Khairuddin, A.B.; Larik, R.M.; Saeed, M.S. Control of distributed generation systems for microgrid applications: A technological review. Int. Trans. Electr. Energy Syst. 2019, 29, 1–26. [Google Scholar] [CrossRef] [Green Version]
- Anas, M.; Javaid, N.; Mahmood, A.; Raza, S.M.; Qasim, U.; Khan, Z.A. Minimizing electricity theft using smart meters in AMI. In Proceedings of the 7th International Conference on P2P, Parallel, Grid, Cloud and Internet Computing (3PGCIC 2012), Victoria, BC, Canada, 12–14 November 2012; pp. 176–182. [Google Scholar]
- Filho, J.R.; Gontijo, E.M.; Delaíba, A.C.; Mazina, E.; Cabral, J.E.; Pinto, J.O.P. Fraud identification in electricity company costumers using decision tree. In Proceedings of the IEEE International Conference on Systems, Man and Cybernetics, The Hague, The Netherlands, 10–13 October 2004; pp. 3730–3734. [Google Scholar]
- Cody, C.; Ford, V.; Siraj, A. Decision tree learning for fraud detection in consumer energy consumption. In Proceedings of the 14th IEEE International Conference on Machine Learning and Applications (ICMLA 2015), Miami, FL, USA, 9–11 December 2015; pp. 1175–1179. [Google Scholar]
- Saeed, M.S.; Mustafa, M.W.B.; Sheikh, U.U.; Salisu, S.; Mohammed, O.O. Fraud Detection for Metered Costumers in Power Distribution Companies Using C5.0 Decision Tree Algorithm. J. Comput. Theor. Nanosci. 2020, 17, 1318–1325. [Google Scholar] [CrossRef]
- Sakhnini, J.; Karimipour, H.; Dehghantanha, A. Smart Grid Cyber Attacks Detection Using Supervised Learning and Heuristic Feature Selection. In Proceedings of the 7th international conference on Smart Energy Grid Engineering (SEGE 2019), Oshawa, ON, Canada, 12–14 August 2019; pp. 108–112. [Google Scholar]
- Nizar, A.H.; Dong, Z.Y.; Zhao, J.H.; Zhang, P. A Data Mining Based NTL Analysis Method. In Proceedings of the IEEE Power Engineering Society General Meeting, Tampa, FL, USA, 24–28 June 2007; pp. 1–8. [Google Scholar]
- Glauner, P.; Meira, J.A.; Valtchev, P.; State, R.; Bettinger, F. The challenge of non-technical loss detection using artificial intelligence: A survey. Int. J. Comput. Intell. Syst. 2017, 10, 760–775. [Google Scholar] [CrossRef] [Green Version]
- Yip, S.C.; Tan, C.K.; Tan, W.N.; Gan, M.T.; Bakar, A.H.A. Energy theft and defective meters detection in AMI using linear regression. In Proceedings of the 2017 IEEE International Conference on Environment and Electrical Engineering and 2017 IEEE Industrial and Commercial Power Systems Europe (EEEIC/I&CPS Europe), Milan, Italy, 6–9 June 2017; pp. 1–6. [Google Scholar]
- Kou, Y.; Lu, C.-T.; Sirwongwattana, S.; Huang, Y.-P. Survey of fraud detection techniques. In Proceedings of the IEEE International Conference on Networking, Sensing and Control, Taipei, Taiwan, 21–23 March 2004; pp. 749–754. [Google Scholar]
- Yip, S.C.; Tan, W.N.; Tan, C.K.; Gan, M.T.; Wong, K.S. An anomaly detection framework for identifying energy theft and defective meters in smart grids. Int. J. Electr. Power Energy Syst. 2018, 101, 189–203. [Google Scholar] [CrossRef]
- Otuoze, A.O.; Mustafa, M.W.; Sofimieari, I.E.; Dobi, A.M.; Sule, A.H.; Abioye, A.E.; Saeed, M.S. Electricity theft detection framework based on universal prediction algorithm. Indones. J. Electr. Eng. Comput. Sci. 2019, 15, 758–768. [Google Scholar] [CrossRef]
- Kharraz, A.; Kirda, E. Redemption: Real-Time Protection Against Ransomware at End-Hosts. In Proceedings of the 20th International Symposium, Atlanta, GA, USA, 18–20 September 2017; pp. 98–119. [Google Scholar]
- Krishna, V.B.; Lee, K.; Weaver, G.A.; Iyer, R.K.; Sanders, W.H. F-DETA: A framework for detecting electricity theft attacks in smart grids. In Proceedings of the 46th IEEE/IFIP International Conference on Dependable Systems and Networks (DSN 2016), Toulouse, France, 28 June–1 July 2016; pp. 407–418. [Google Scholar]
- Otuoze, A.O.; Mustafa, M.W.; Mohammed, O.O.; Saeed, M.S.; Surajudeen-Bakinde, N.T.; Salisu, S. Electricity theft detection by sources of threats for smart city planning. IET Smart Cities 2019, 1, 52–60. [Google Scholar] [CrossRef]
- Kadurek, P.; Blom, J.; Cobben, J.F.G.; Kling, W.L. Theft detection and smart metering practices and expectations in the Netherlands. In Proceedings of the IEEE PES Innovative Smart Grid Technologies, Gothenberg, Sweden, 11–13 October 2010; pp. 1–6. [Google Scholar]
- Weckx, S.; Gonzalez, C.; Tant, J.; De Rybel, T.; Driesen, J. Parameter identification of unknown radial grids for theft detection. In Proceedings of the IEEE PES Innovative Smart Grid Technologies Europe Conference, Berlin, Germany, 14–17 October 2012; pp. 1–6. [Google Scholar]
- Chen, L.; Xu, X.; Wang, C. Research on anti-electricity stealing method base on state estimation. In Proceedings of the IEEE Power Engineering and Automation Conference, Wuhan, China, 8–9 September 2011; pp. 413–416. [Google Scholar]
- Liu, T.; Gu, Y.; Wang, D.; Gui, Y.; Guan, X. A novel method to detect bad data injection attack in smart grid. In Proceedings of the 32nd IEEE International Conference on Computer Communications, Turin, Italy, 14–19 April 2013; pp. 3423–3428. [Google Scholar]
- Silva, L.G.d.O.; Da Silva, A.A.P.; De Almeida-Filho, A.T. Allocation of power-quality monitors using the p-median to identify nontechnical losses. IEEE Trans. Power Deliv. 2016, 31, 2242–2249. [Google Scholar] [CrossRef]
- Spirić, J.V.; Stanković, S.S.; Dočić, M.B. Determining a set of suspicious electricity customers using statistical ACL Tukey’s control charts method. Int. J. Electr. Power Energy Syst. 2016, 83, 402–410. [Google Scholar] [CrossRef]
- Huang, S.C.; Lo, Y.L.; Lu, C.N. Non-technical loss detection using state estimation and analysis of variance. IEEE Trans. Power Syst. 2013, 28, 2959–2966. [Google Scholar] [CrossRef]
- Su, C.L.; Lee, W.H.; Wen, C.K. Electricity theft detection in low voltage networks with smart meters using state estimation. In Proceedings of the IEEE International Conference on Industrial Technology, Taipei, Taiwan, 14–17 March 2016; pp. 493–498. [Google Scholar]
- Aquiles, R.; Gazzana, D.; Passos, L.; Trevizan, R.; Bettiol, A.; Martin, R.; Bretas, A. Hybrid formulation for technical and non-technical losses estimation and identification in distribution networks: Application in a brazilian power system. In Proceedings of the 23rd International Conference and Exhibition on Electricity Distribution, Lyon, France, 15–18 June 2015; pp. 15–18. [Google Scholar]
- Trevizan, R.D.; Rossoni, A.; Bretas, A.S.; Gazzana, D.d.S.; Martin, R.d.P.; Bretas, N.G.; Bettiol, A.L.; Carniato, A.; Passos, L.F.D.N. Non-technical losses identification using Optimum-Path Forest and state estimation. In Proceedings of the IEEE Eindhoven PowerTech (PowerTech 2015), Eindhoven, The Netherlands, 29 June–2 July 2015. [Google Scholar]
- Leite, J.B.; Mantovani, J.R.S. Detecting and locating non-technical losses in modern distribution networks. IEEE Trans. Smart Grid 2018, 9, 1023–1032. [Google Scholar] [CrossRef] [Green Version]
- Hamadneh, N. Logic Programming in Radial Basis Function Neural Networks. Ph.D. Thesis, Universiti Sains Malaysia, Penang, Malaysia, 2013. [Google Scholar]
© 2020 by the authors. Licensee MDPI, Basel, Switzerland. This article is an open access article distributed under the terms and conditions of the Creative Commons Attribution (CC BY) license (http://creativecommons.org/licenses/by/4.0/).


 ,
, 


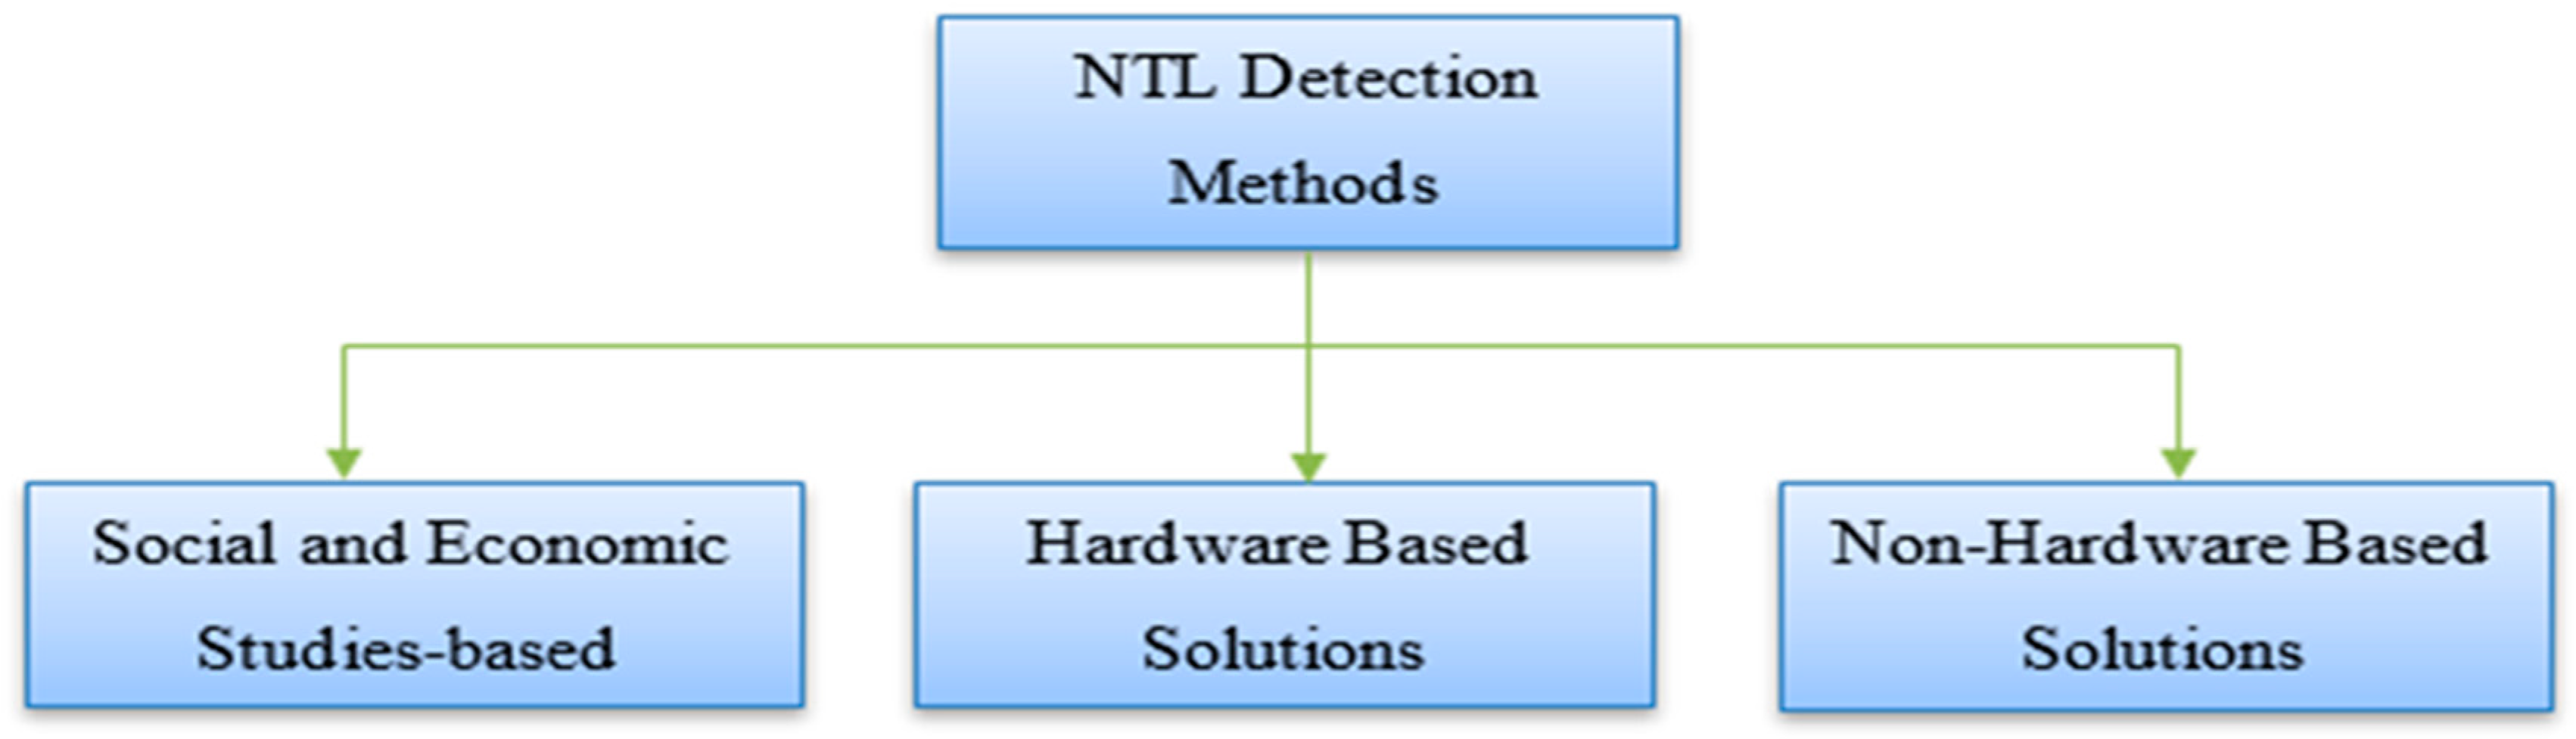