The Influence of Building Renovations on Indoor Comfort—A Field Test in an Apartment Building


VTT Technical Research Centre of Finland Ltd., PO Box 1000, FI-02044 VTT Espoo, Finland
*
Author to whom correspondence should be addressed.
Energies 2020, 13(18), 4958; https://0-doi-org.brum.beds.ac.uk/10.3390/en13184958
Submission received: 11 August 2020
/
Revised: 18 September 2020
/
Accepted: 18 September 2020
/
Published: 22 September 2020
(This article belongs to the Special Issue Energy Performance and Indoor Climate in Buildings)
Abstract
:This article presents a field test of how deep renovation affects indoor climate quality. The studied apartment building was built in 1968 and is located in Finland, within the Nordic climate zone. The deep renovation included façade repair with extra insulation, new windows with trickle vents, new balcony glass and doors, and the installation of an exhaust air heat pump into the existing mechanical exhaust air ventilation. The indoor climate conditions and building envelope tightness were measured before and after the renovation. As a result of these energy renovation measures, the building envelope tightness improved by nearly 40% and the uncontrolled supply of air (draughts) decreased by approximately 24%. The overall energy consumption of the building decreased by 45%. Above all, the long testing period gives credibility to the study. The field test brought up the challenge of supplying an adequate amount of fresh air. This article highlights the fact that windows are part of a mechanical ventilation system if fresh air is not controlled by being led through inlet ducts. The supply air flow and volume must be ensured by correctly dimensioned valves, and therefore we stress the importance of the technical cooperation of technical designers.
1. Introduction
Buildings and building construction account for almost one third of global final energy consumption, as well as for nearly 40% of total direct and indirect greenhouse gas (carbon dioxide (CO2)) emissions [1].
Similarly, in the European Union, buildings are responsible for the largest proportion of energy consumption and associated CO2 emissions [2], and residential buildings account for 23% of total energy consumption in the European Union [3]. Also, two thirds of the buildings in the European Union were built when energy efficiency requirements were limited, and the majority of these buildings will still exist in 2050 [4,5]. As space heating represents a 60–80% proportion of total energy consumption in buildings in a cold climate [6] and as renovation can substantially decrease the demand for space heating, buildings play a key role in achieving long-term climate and energy targets; that is, buildings can play a key role by implementing basic renovations. Renovation not only impacts on the energy consumption of buildings, it also considerably influences the indoor climate conditions. This has been recognised by the European Union [7,8,9], which—besides emphasising the low energy consumption, reductions in CO2 emissions and improved energy efficiency in the building sector [10]—emphasises the indirect benefits achieved by renovations. One of the factors highlighted by the Energy Performance of Buildings Directive (EPBD) [7], is indoor climate conditions, such as indoor air temperature, air humidity, the CO2 level and the sound environment. To achieve this essential factor of the EPBD, a building should meet the energy requirements and should have proper heating and ventilation systems.
Although indoor climate can refer to the thermal, chemical (air quality), actinic, acoustic or mechanical climate, this study concentrates on thermal climate and air quality, for which the World Health Organization (WHO) has given recommendations [11]. Thermal (climate) comfort studies have a long history [12]. Wu et al., described thermal comfort as the thermal experience, air temperature change rate and temperature ramp direction in all conditions [13]. In many studies, thermal comfort has been widely demonstrated to be an important factor for human preferences [14,15,16,17,18,19]. Berglund and Cain [18], studied the perception of air quality and the thermal environment, concluding that physical properties (such as temperature and humidity) and chemical properties (such as contaminants) together determine the level of comfort. However, in their experimental study, Wang and Liu [19], discovered that different emotional states impact on people’s thermal comfort. The results indicated that whether sitting or standing, emotional states significantly impact thermal comfort and physiological parameters [19]. It is also widely acknowledged that females have around a 1.5 °C higher comfort temperature than males [20,21].
Several studies have demonstrated the great potential for energy saving by installing ventilation heat recovery systems [16,22,23,24,25,26,27] and improving the thermal quality of the climate envelope (i.e., insulating attics, walls and foundations, as well as installing double or triple glazing) [16,22,23,24,25,26,27,28,29,30,31,32]. More than half of these studies reported on deep renovation projects in similar climatic conditions to those of this study [22,23,24,25,26,27,30]. Liu et al. [23], studied multi-family buildings in Sweden in order to identify the most cost-effective retrofitting measures and to realise energy and CO2 reductions of 50% and 75% respectively by 2050 [33]. The study showed that at current energy prices and renovation costs, an approximately 7–27% reduction in energy consumption is still possible. Similarly, the study by Fleur et al. [24], investigated life cycle costing (LCC) and optimal energy measures by using an optimisation approach as part of the renovation of a multi-family building in Sweden. The study demonstrated that it is not cost-effective from an LCC perspective to invest in major energy-efficiency measures to reduce the space heating demand. Considering the 40-year life cycle and given framework conditions, the improvement in the thermal performance of the building envelope or the implementation of heat recovery ventilation measures taken to reduce the space heating demand are not regarded as cost-effective measures. However, with a 40% saving target, a balanced mechanical ventilation system with heat recovery has been verified as being cost-effective. Nevertheless, the lowest LCC was achieved when modern windows were installed that had better U-values and a longer technical lifetime than the original windows [24]. In addition to that, the study of La Fleur et al. [24], highlighted that thermal comfort is usually better in a building that has undergone a major energy renovation than it is in a building with poor thermal performance.
It has been widely acknowledged that user behaviour, such as the actions users take or do not take, is one reason for the differences in the expected, modelled and measured performance of buildings [34,35,36,37,38,39]. The study by Dar et al. [34], demonstrated that an approximately 12% deviation from predicted energy consumption can be affected by user behaviour. However, in Sunikka-Blank and Galvin’s study [35], they indicated that occupants consume 30% less heating energy than the calculated evaluation. In old buildings the deviation could be the result of the loss of ventilation being compensated for by using an exhaust fan or heat recovery, for example. Another reason for deviation could be fairly low occupancy per floor area, such as is the case in single-family homes. Additionally, the performance gap could be the result of uncertainties in the planning stage of the renovation, as De Wilde claimed [39]. The results of the study by La Fleur et al. [30], indicated that the energy-saving potential and the choice of renovation measures are significantly affected by assumptions of user behaviour which make the energy renovation planning complex.
On average, people spend around 80–90% of their lives inside buildings [40]. Nevertheless, relatively few studies have investigated the impact of deep energy renovations on the indoor climate quality in residential buildings located in a cold climate [26,27,30,41,42]. However, in California, deep energy renovation, including improved mechanical ventilation systems and air cleaners, resulted in improved indoor climate conditions [43]. Improved thermal conditions were also reported in New Zealand after simply installing standard insulation [44]. Földváry et al. [28], studied the temperature, relative humidity (RH) and concentration of CO2 in 94 apartments before and after basic energy renovation in Slovakia. In contrast, the study discovered that the CO2 concentration was significantly higher in the renovated buildings, resulting in lower occupant satisfaction with indoor air quality (IAQ). As a result. Földváry et al. [28], pointed out that in energy-renovated residential buildings in Central and Eastern Europe, the installation of controlled ventilation systems is recommended.
However, at least five similar studies have investigated the effects of energy renovation on the IAQ in a cold climate. Liu et al. [26], demonstrated the positive effects of energy renovation on the indoor environmental quality and occupant satisfaction in a mechanically ventilated residential building in Sweden. The building also achieved a 39% reduction in space heating demand [26]. The Swedish case study by La Fleur et al. [30,41], demonstrated that thermal comfort improved as a result of the selected renovation strategies while the use of district energy heating was reduced by 35–44%, including the domestic hot water (DHW). Another study by Fleur et al. [41], stated that significant improvements to indoor climate conditions can be achieved by the building’s energy efficiency (e.g., adding thermal insulation and using a heated supply air system) [41]. Both of the studies [30,41] utilised the simulation software IDA-ICE [45], to simulate energy consumption, heating loads and the indoor climate.
Thomsen et al. [42], described a Danish apartment complex that had undergone a comprehensive energy retrofit including a photovoltaic installation on the roof. This case study [42], noted that by improving the envelope and the air conditioning in the studied building (built in 1968) the indoor climate improved significantly and there was a 31% reduction in energy consumption. The earlier complications with insufficient temperature, draughts (a noticeable current of air inside the building) and cold areas in the apartment were reduced, which improved the temperature conditions during the winter. As a result, 88% of the residents were satisfied with the indoor climate conditions after the renovation, while prior to the renovation, only 20% of the residents were satisfied. However, the thermal bridges created a number of problems for the indoor climate. All the above-mentioned studies describe a major energy renovation and its results. However, Kuusk et al. [27], presented a case study analysis of the low-budget renovation of an apartment building in Estonia. The study investigated and measured energy consumption, indoor climate, CO2 concentration, air leakage rate, the thermal transmittance of thermal bridges and the thermal transmittance of the building envelope before and after the renovation. The low-budget renovation reduced the purchased energy by 40% and the heating energy requirement by 50%. However, the performance of the ventilation systems, thermal bridges in external walls or window jambs and the economic viability required further investigations as estimations set before the renovation failed [27]. Besides the four above-mentioned studies, in another study, Kuusk et al. [46], stated that not enough attention was being paid to energy loss through thermal bridges. As a result, they stated that designers should use calculations for thermal bridges because building owners could reduce construction costs [46].
To give an overview and to compare the results of the projects conducted in this field, Table 1 presents some details of these case studies.
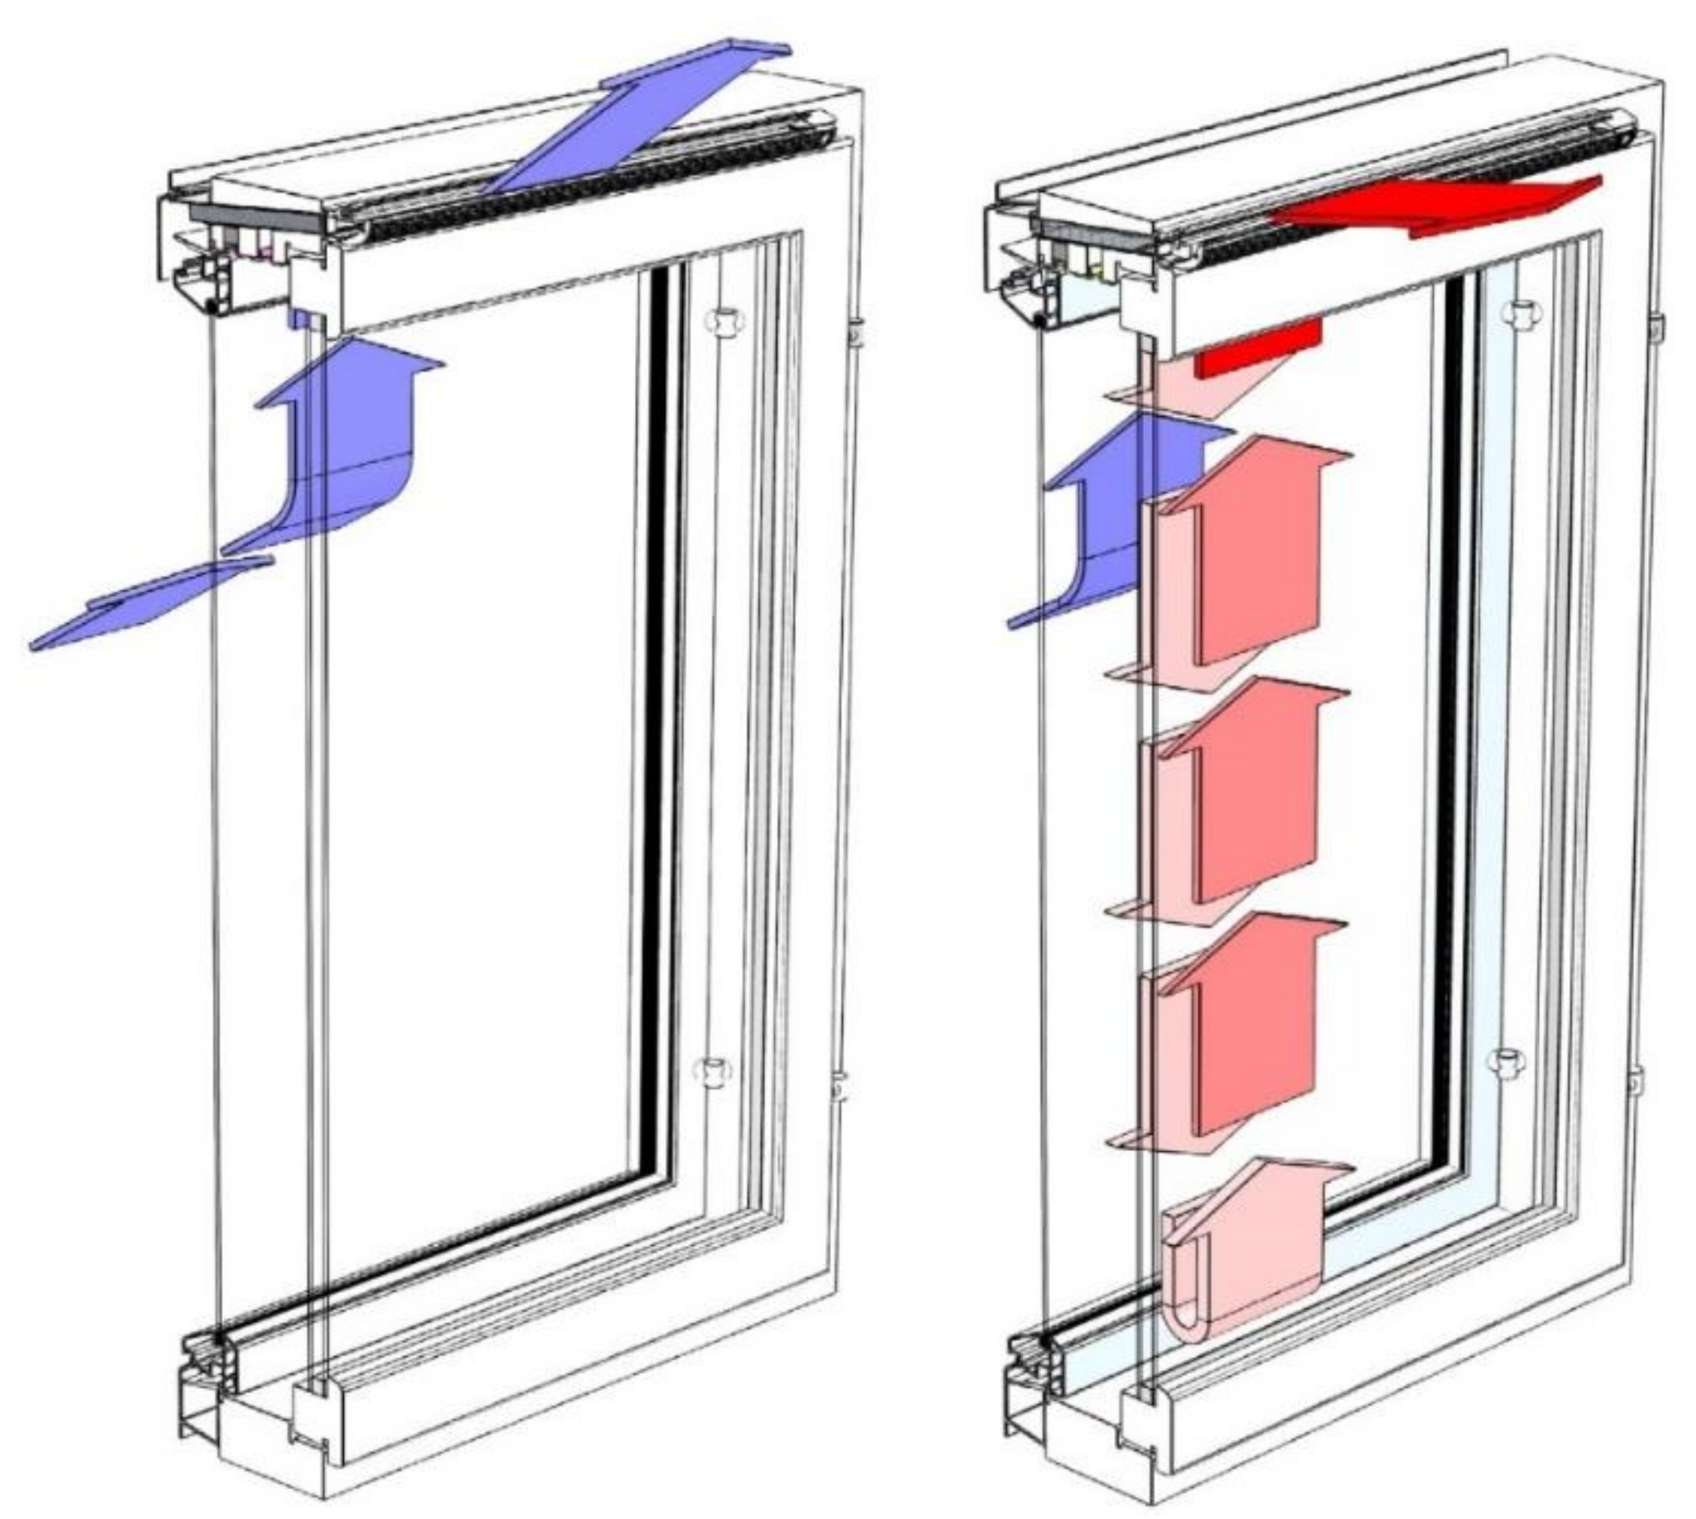
Whereas most of the above-mentioned studies have primarily concentrated on measuring the impact of thermal insulation, new and improved insulated windows and a heat recovery system on indoor climate conditions, there is a gap in the current knowledge regarding the field testing of indoor climate conditions affected by supply air windows and exhaust air heat pumps (EAHPs) as a part of a major energy renovation. In the supply air window, the outdoor air is led through the window frame (see Figure 1).
When the air flows through the window structure, the air flow is heated. To meet the purity requirements of the supply air and to keep the windows cleaner, the outdoor air is usually filtered. To avoid excessive room temperatures, the better performance of windows should be considered when calculating heating demand.
Considering that the energy balance and performance of supply air windows have been presented in multiple studies [47,48,49,50,51,52,53,54,55], the lack of experimental results is surprising. However, EAHPs can be used for space heating [56], a combination of space and DHW heating, or for heating the DHW only. This study focuses on EAHPs used for space and DHW heating as DHW heat pumps using outdoor air as a heat source are uncommon in the Nordic countries [57]. To the author’s knowledge, studies on EAHPs used for space and DHW heating combined with the installation of supply air windows are scarce.
To fill the knowledge gap described above, this article presents the results of a field test relating to the indoor climate quality of a typical Finnish apartment building that has undergone a major energy renovation that included the installation of supply air windows and EAHPs, among other renovation measures. The combination of supply air windows and an EAHP is a quite new and low-budget way to renovate old, prefabricated apartment buildings. The market potential is great, and it is important to ensure the performance of the renovation concept. To date, the emphasis has only been on energy saving; this study raises the issue of the impact on IAQ alongside it. In particular, the long testing period gives specificity and credibility to the study.
2. Methods
This section presents how the impact of extra insulation, supply air windows and EAHPs on indoor climate was studied. First, we introduce the attributes that were measured and the duration of each measurement, then the measuring equipment and, finally, the case building.
2.1. Measurement Strategy
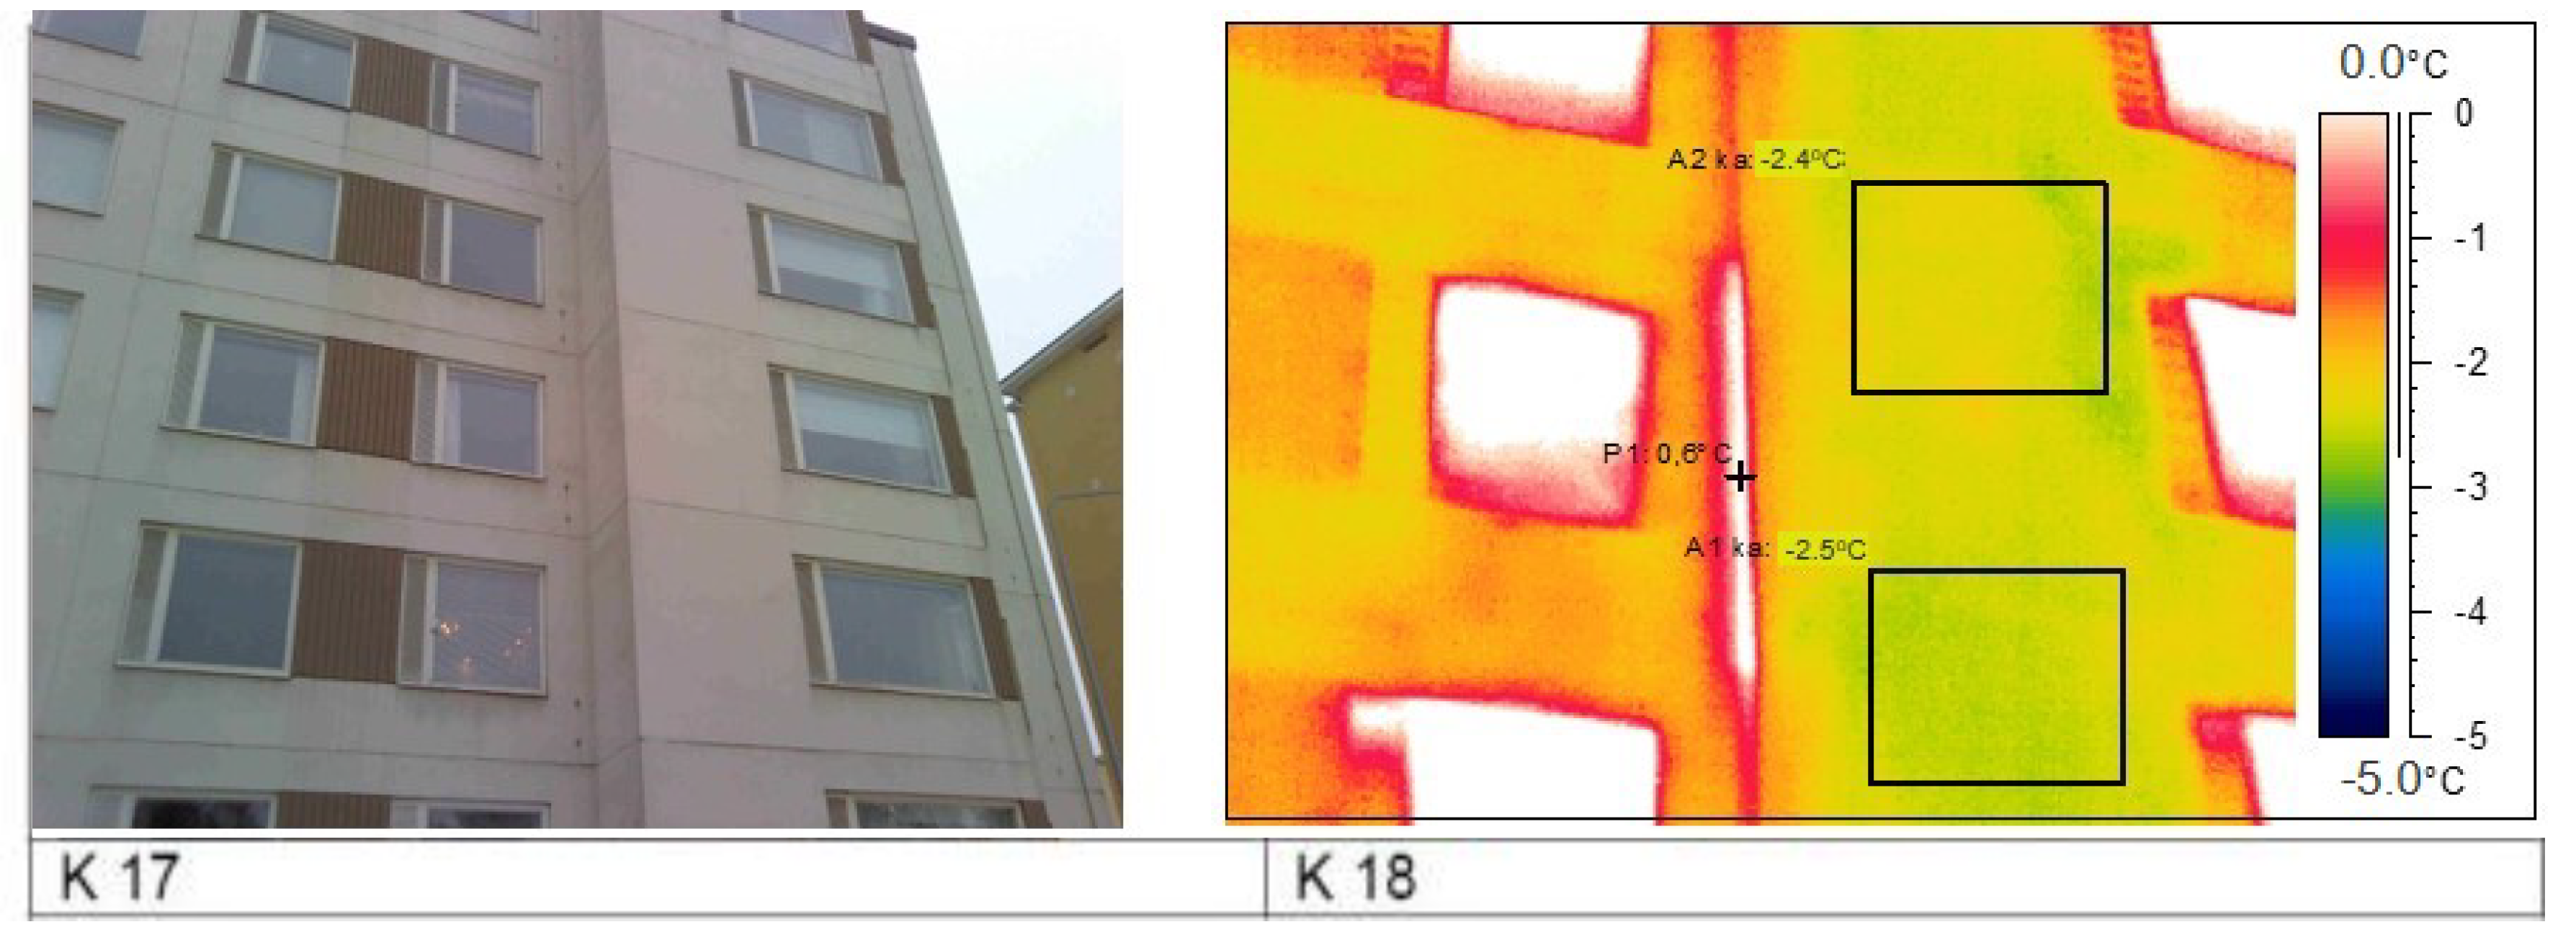
The four apartments in the studied building were previously measured in 2014 using a thermal camera (see Figure 2). Based on the thermal images, the poorest parts of the building envelope were the windows and balcony doors. No significant cold bridges were found in the solid part of the envelope. The selected measurement points in each apartment were near the balcony door, near the windows of the living room and bedroom, and in one corner of the living room.
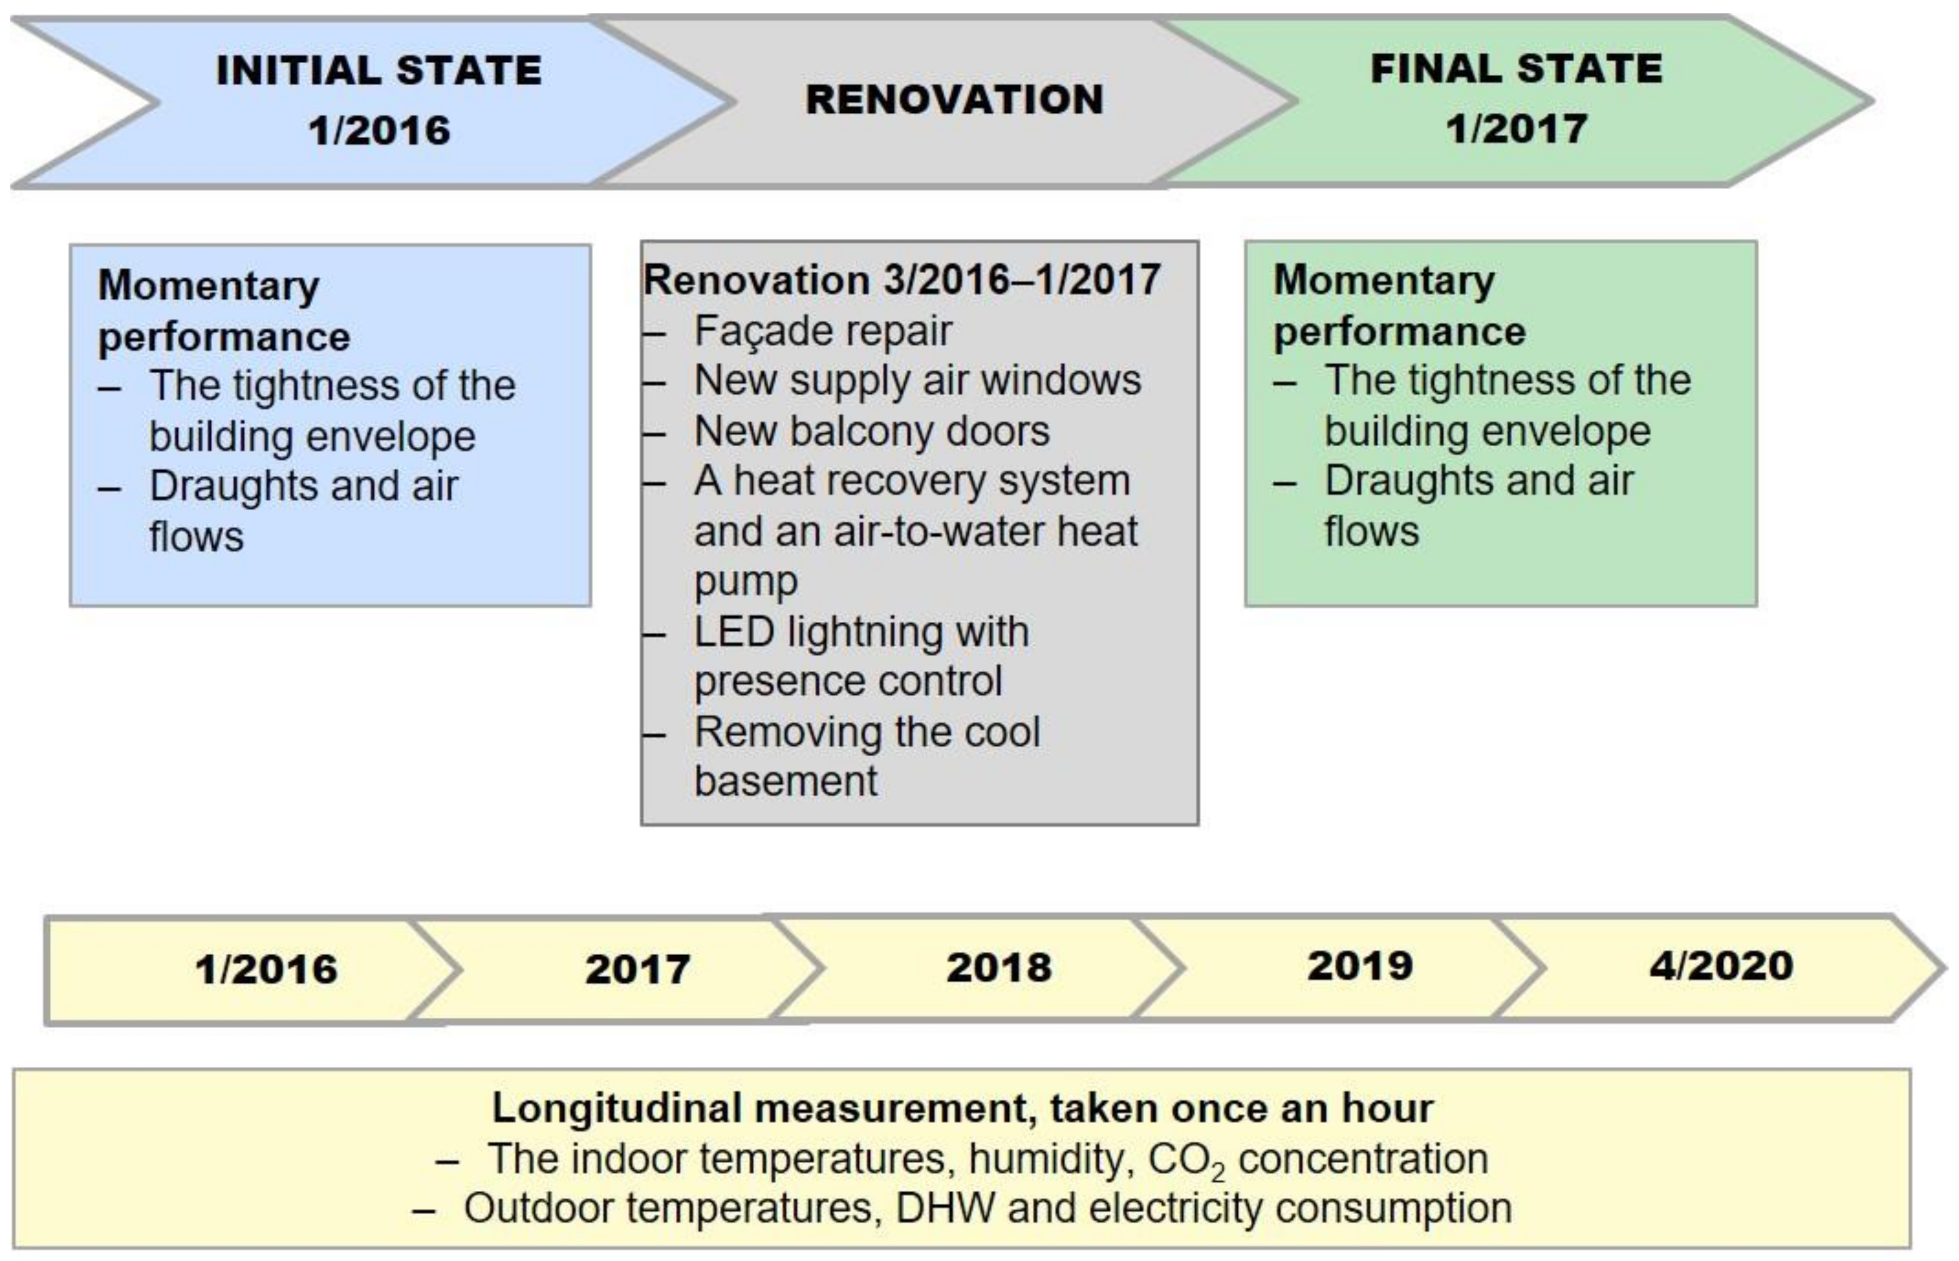
Firstly, momentary on-site measurements were taken for the six apartments before the renovation in 2016 that included measuring the tightness of the building envelope, draughts and air flows. At the same time, the longitudinal measurements of indoor temperatures, humidity and the CO2 concentration of indoor air were started. This longitudinal measurement continued from January 2016 to April 2020 for five of the apartments as one of the apartments was left unoccupied in 2017.
The deep renovation took place from April 2016 to January 2017. The tightness of the building envelope, draughts and air flows were measured again after the renovation, in 2017. The measurement results were analysed and the conclusions about the impact on the indoor climate conditions of the extra insulation, the supply air windows and EAHPs as part of the deep renovation were outlined. See the flow chart in Figure 3.
2.2. Standards Used
The most important standard used in this study is the statute of ‘health conditions of the apartment and other residence spaces’ appointed by the Finnish Ministry of Social Affairs and Health on 23 April 2015 [58]. Finnish requirements are derived from European standards. The statute provides instructions for measuring ventilation, humidity, temperature and draughts, as well as information about the limit values. The standard, which demonstrates the detailed field survey instructions [59], has been taken into consideration even though it is no longer in force. Regarding measurements of air tightness, standard ‘SFS-EN ISO 9972:2015 Thermal performance of buildings’ [60], which replaces standard SFS-EN ISO 13829 [61], has been applied. This standard describes the measurement of the resulting air flow rates over a range of indoor–outdoor static pressure differences. It is intended to measure air leakage from building envelopes.
2.3. Measurement Conditions, Methods and Devices
During the momentary on-site measurements, the outdoor temperature was between −20 and −22 °C before renovation and −1 °C after renovation. Due to seasonal change, the relative outside humidity ranged from 80 to 90% as the wind speed was weak during both measurements.
The Blower Door Air Tightness system [62] was used in the momentary measurement of the building envelope tightness both under pressure and without pressure [63]. The blower door meter’s accuracy is around ±10%.
A SwemaFlow 3000 hot wire anemometer (Farsta, Sweden) with an SWA 3 probe accuracy of ±0.03 m/s and ±0.4 °C was used in the draught measurements, which were implemented by applying the standard SFS 5511 [59]. A SwemaFlow 3000 hot wire anemometer was also used to measure the air flow rate, but with an SWA 125 hood accuracy of ±10%. In this study the draught was measured (the speed of the air flow) in the most draughty spots in the room, which were in front of the balcony as the balcony doors were a poor fit, leading to draughts. The measurements were taken approximately 0.6 m from the balcony door at a height of five centimetres above floor level and lasted for three minutes. Before the measurements, smoke was used as a tracer to locate the most draughty spot in the room. The limiting value for draughts in Finland is generally 0.20 m/s or the draught curve can be used [58].
In a longitudinal study, temperature and RH were measured by using TGP-4500 loggers (Tinytag, Chichester, United Kingdom) which have an accuracy of <±0.4 °C and <±3.0%. The gauge was located on a bookcase in the living room, 1.1 m above floor level. RH and CO2 concentration were measured using a Tinytag CO2 gauge with an accuracy of <±50 ppm + 2% of the measured value. The gauge was placed on a bedside table, 0.5–0.7 m above floor level. However, the impact of the supply air windows on the ventilation was examined by measuring the exhaust air flows using a Tinytag CO2 gauge. The purpose of this measurement is to inspect whether the change in pressure loss has an impact.
Structured interviews for residents and their private information (i.e., changes in health) were not used in this study. However, the measurer discoursed with the residents of the tested apartments during the measurement visits, three times per year (in January, May and September). The measurer also discussed issues with the property manager regularly. This was adequate to meet the demands of the study.
2.4. A Description of the Field Study Building
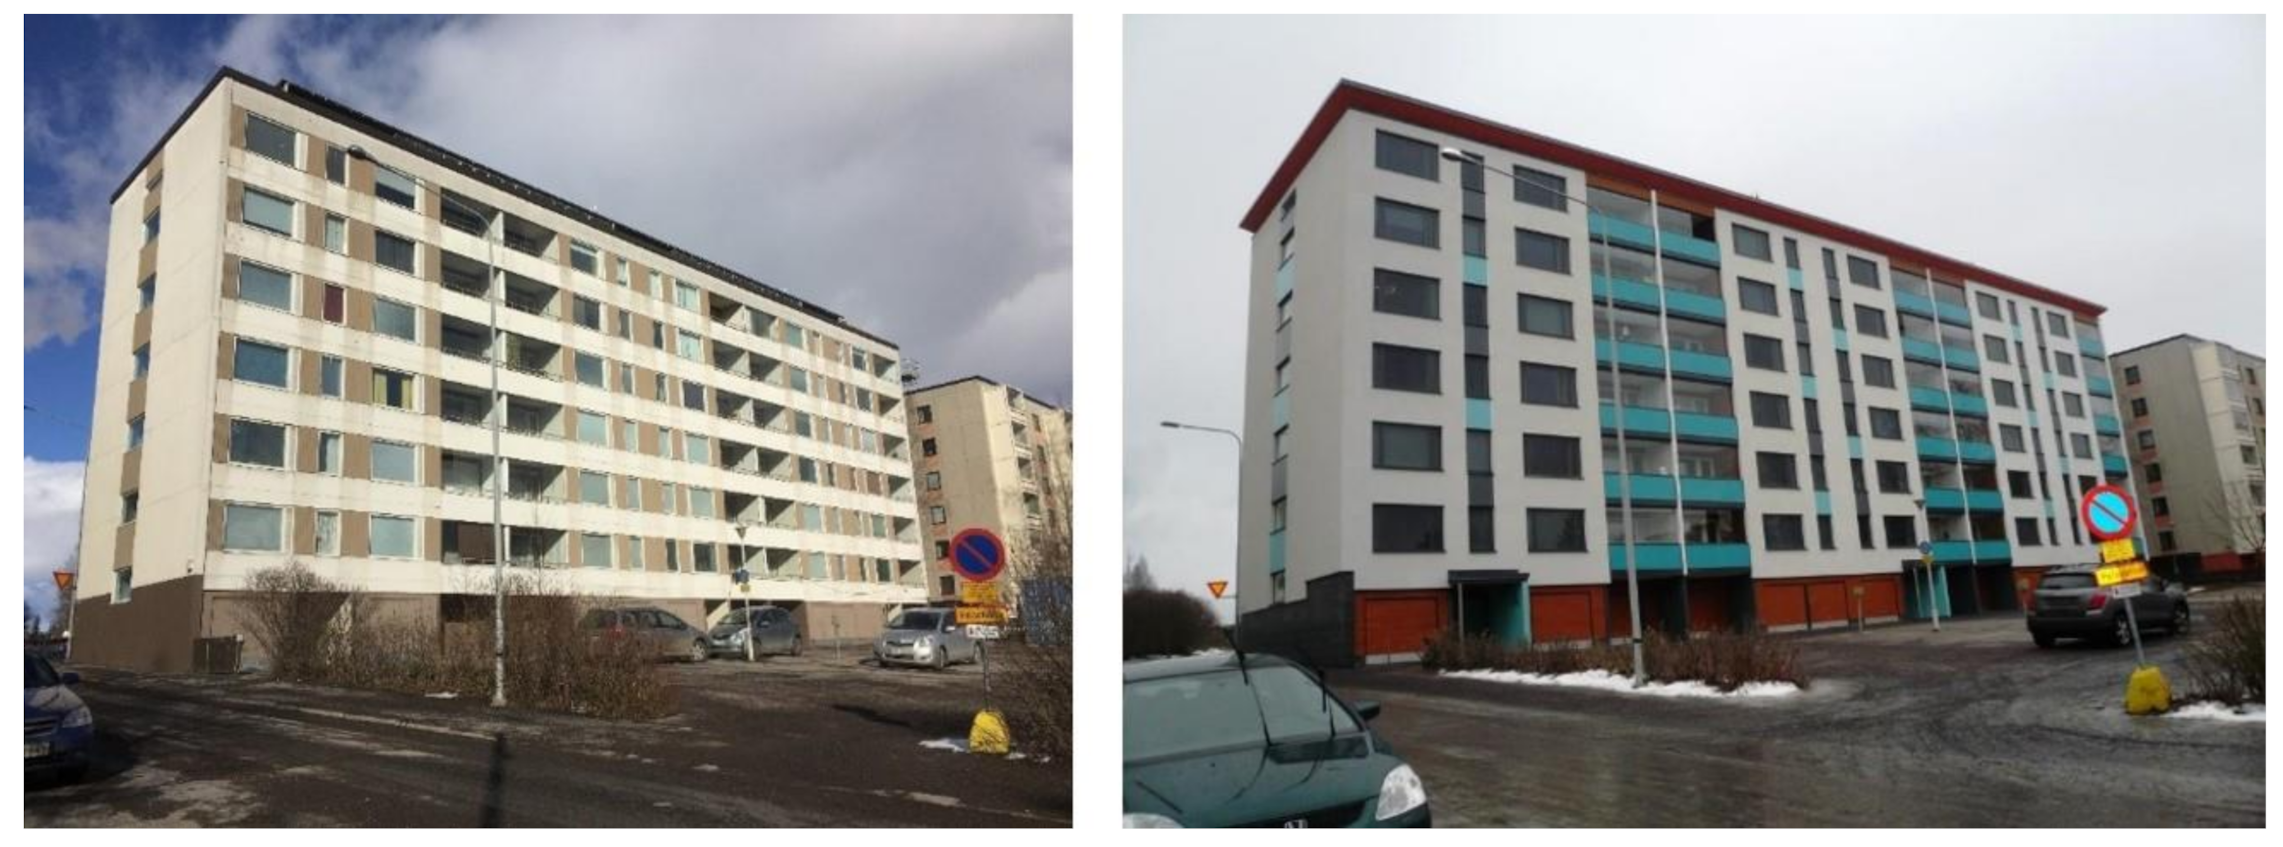
The studied building was a block of flats which were built in 1968, located along a busy road in Tampere, Finland. It has a floor space of 3693 m2 and a volume of 12,275 m3. Figure 4 shows the look of the non-retrofitted building and the retrofitted building. The building comprises six floors with 78 apartments: 36 studios, 36 one-bedroomed apartments and six two-bedroomed apartments. From one to three residents lived in each apartment during the project. The field test studied six of these apartments. They were: one studio and one two-bedroom apartment on the first floor, one studio on the third floor, two one-bedroom apartments on the fourth floor and one on the fifth floor. The third-floor studio was vacant in the measurement period, so its data were excluded from the analysis. The climate in Tampere is characterised by an extreme outdoor temperature of −31 °C (in February 2011 and February 2012) and an average temperature over the last ten years of 5.4 °C.
Before the retrofit, the studied building had a washed, pre-fabricated concrete façade and 80 mm mineral wool insulation. Moreover, the building had mechanical exhaust air ventilation as well as an uncontrolled supply air flow through the structures and windows before the retrofit was completed [63].
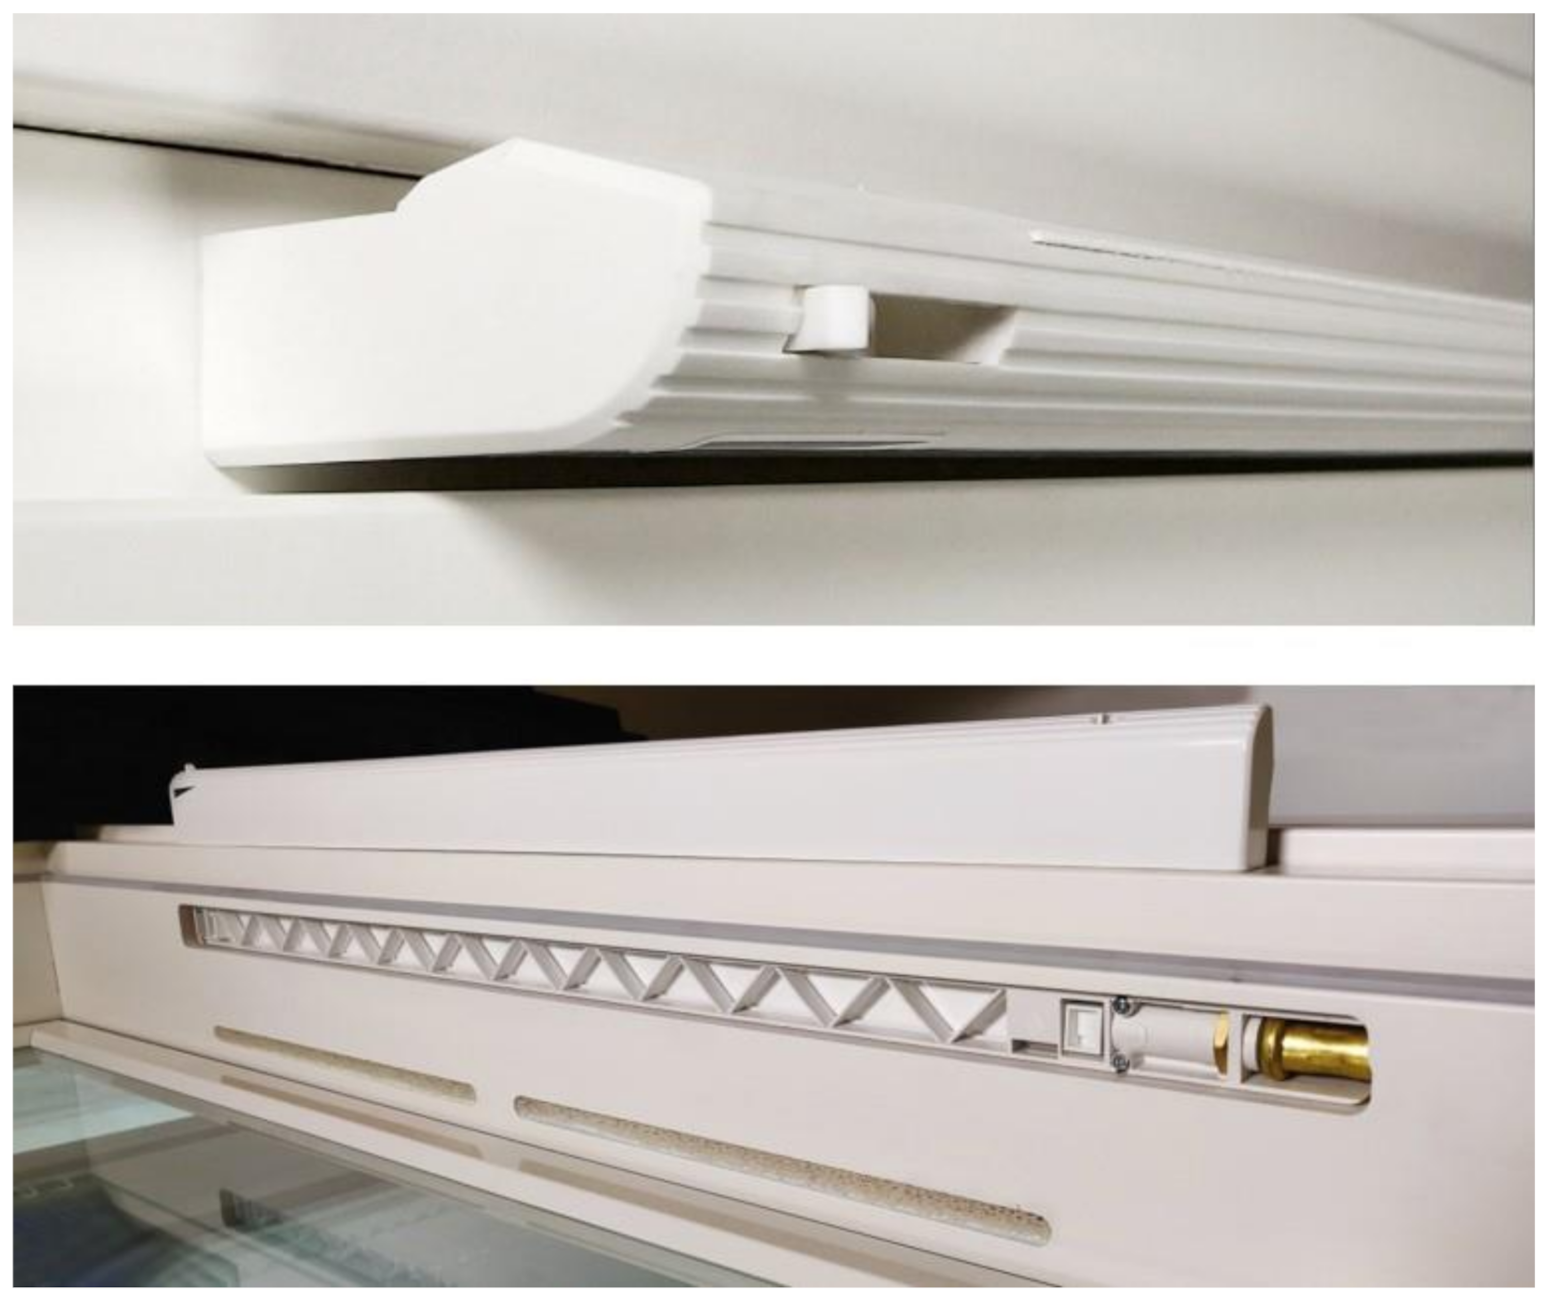
During the retrofit, 100 mm of mineral wool insulation and rendering for external walls were added. Double-glazed windows with a U-value of 2.5 W/(m2 K) were replaced by triple-glazed supply air windows with a U-value of 1.0 W/(m2 K). Also, the balcony doors were changed. Figure 5 presents the trickle vent used in this study, and its operational principle is expounded in [64].
The cool basement was removed due to the low utilisation rate, and all traditional bulbs were replaced by LED lightning with presence control. The building was connected to a district heating system both before and after the retrofit. The ventilation system was upgraded from mechanical exhaust air ventilation to a 40 kW EAHP system. Basic data from the building before and after the retrofit are presented in Table 2.
The total renovation budget including VAT (24%) was 375 euros per square metre. The share of extra energy improvements was 25% (€75/m2). The rest of the budget (€300/m2) was spent on measures that did not affect energy efficiency. The payback time of energy-related investment and its financing is about ten years when the energy saving is annually about 75 kWh/m2 and the energy price is 10 cents/kWh. During 25 years, a housing company will save €185/m2.
3. Results
Several measures were observed in this study by using the described methods (see Section 2). This section presents the impact of the implemented renovation actions on the energy consumption of the building as well as on the envelope tightness, draughts, temperatures and CO2 emissions.
3.1. Energy Consumption
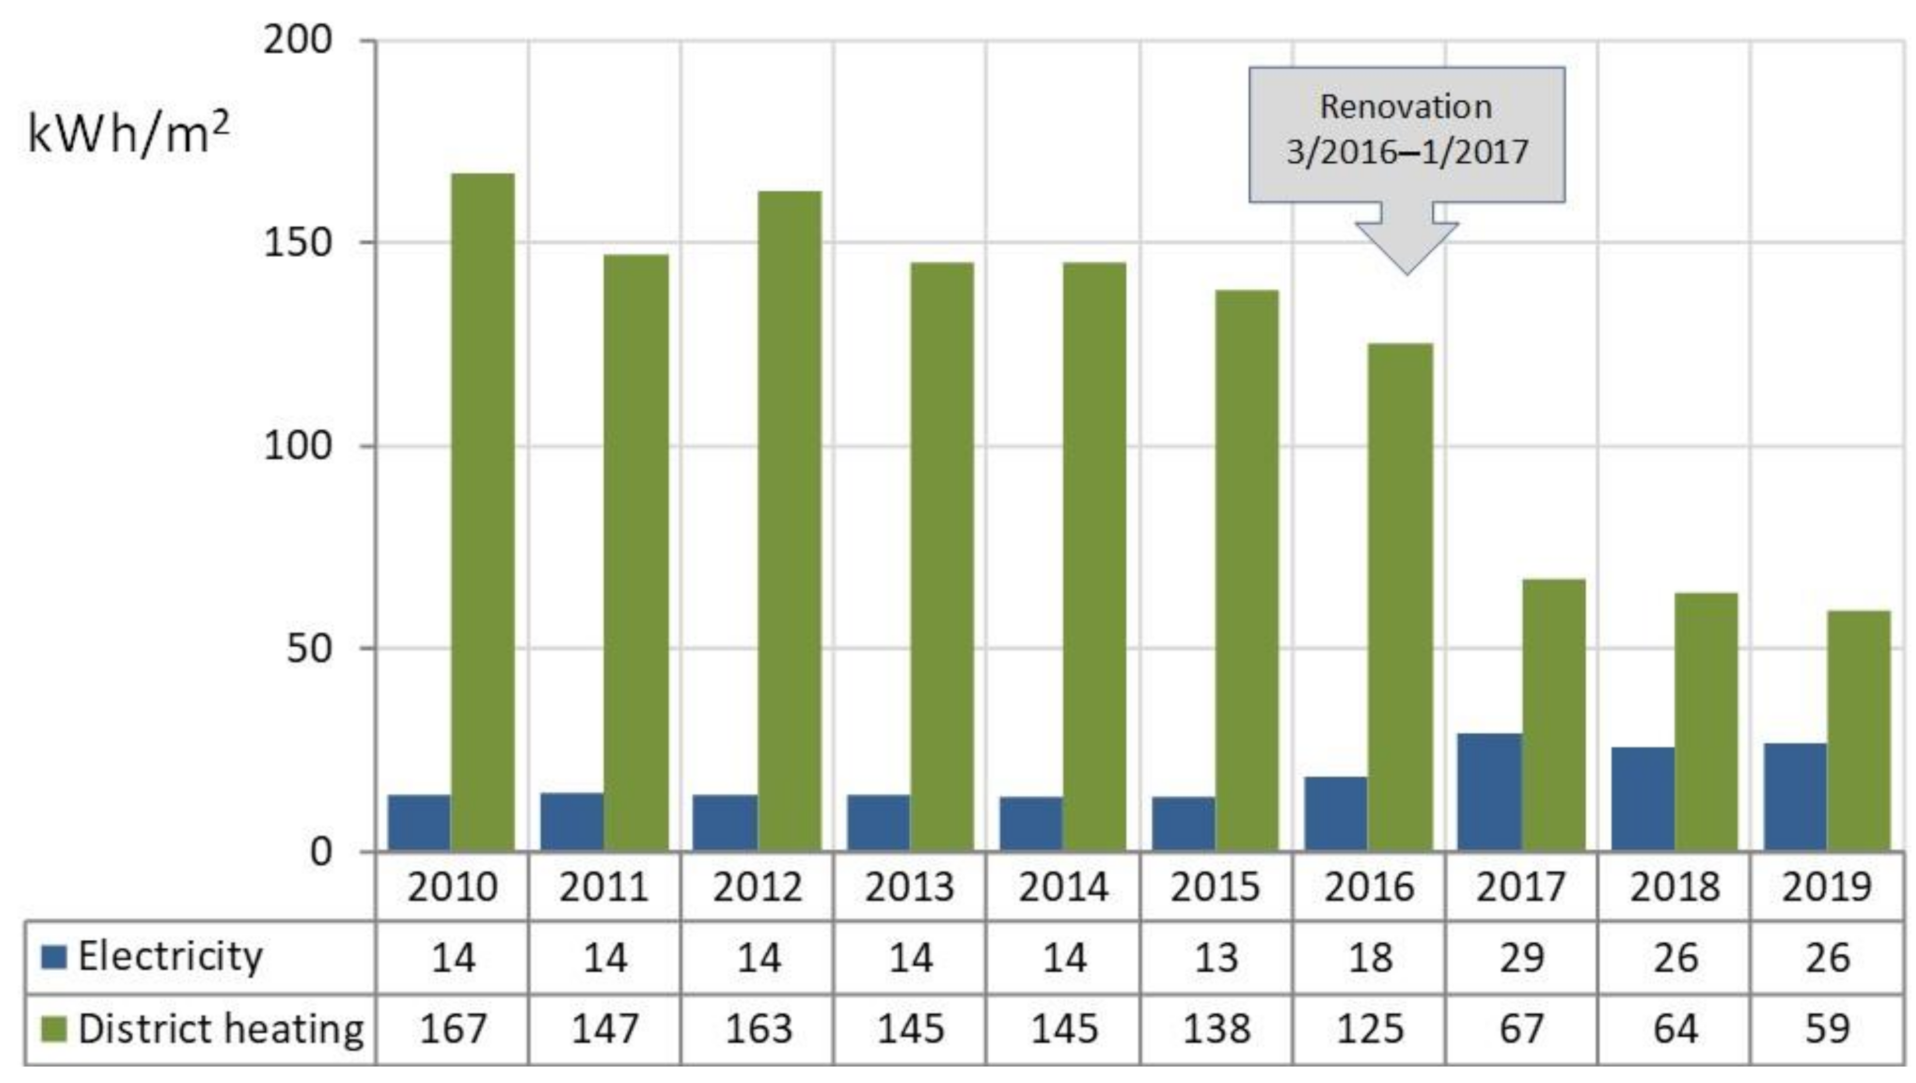
Smart meters registered the district heat and electricity consumption of the case building. The measured district heat consumption includes both space heating and tap water heating. The measured electricity consumption includes the lighting of common spaces, heating of the shared saunas and the operating energy of the lifts, ventilation and heating system but not household electricity consumption. The renovation measures have reduced the consumption of district heating by around 55%. In contrast, total electricity consumption has increased. The renovation project included a number of measures, such as presence-controlled LED lighting for staircases, which reduced electricity consumption. This was a minor improvement compared with the increased electricity consumption of the EAHP. The total electricity consumption of the building (excluding apartment lighting and equipment) increased by 93%. Overall, the ultimate outcome was positive, and the total energy consumption decreased by 45%.
Figure 6 shows the development of specific energy consumption in the period 2010–2019. The renovation project started in April 2016 and was completed at the beginning of 2017.
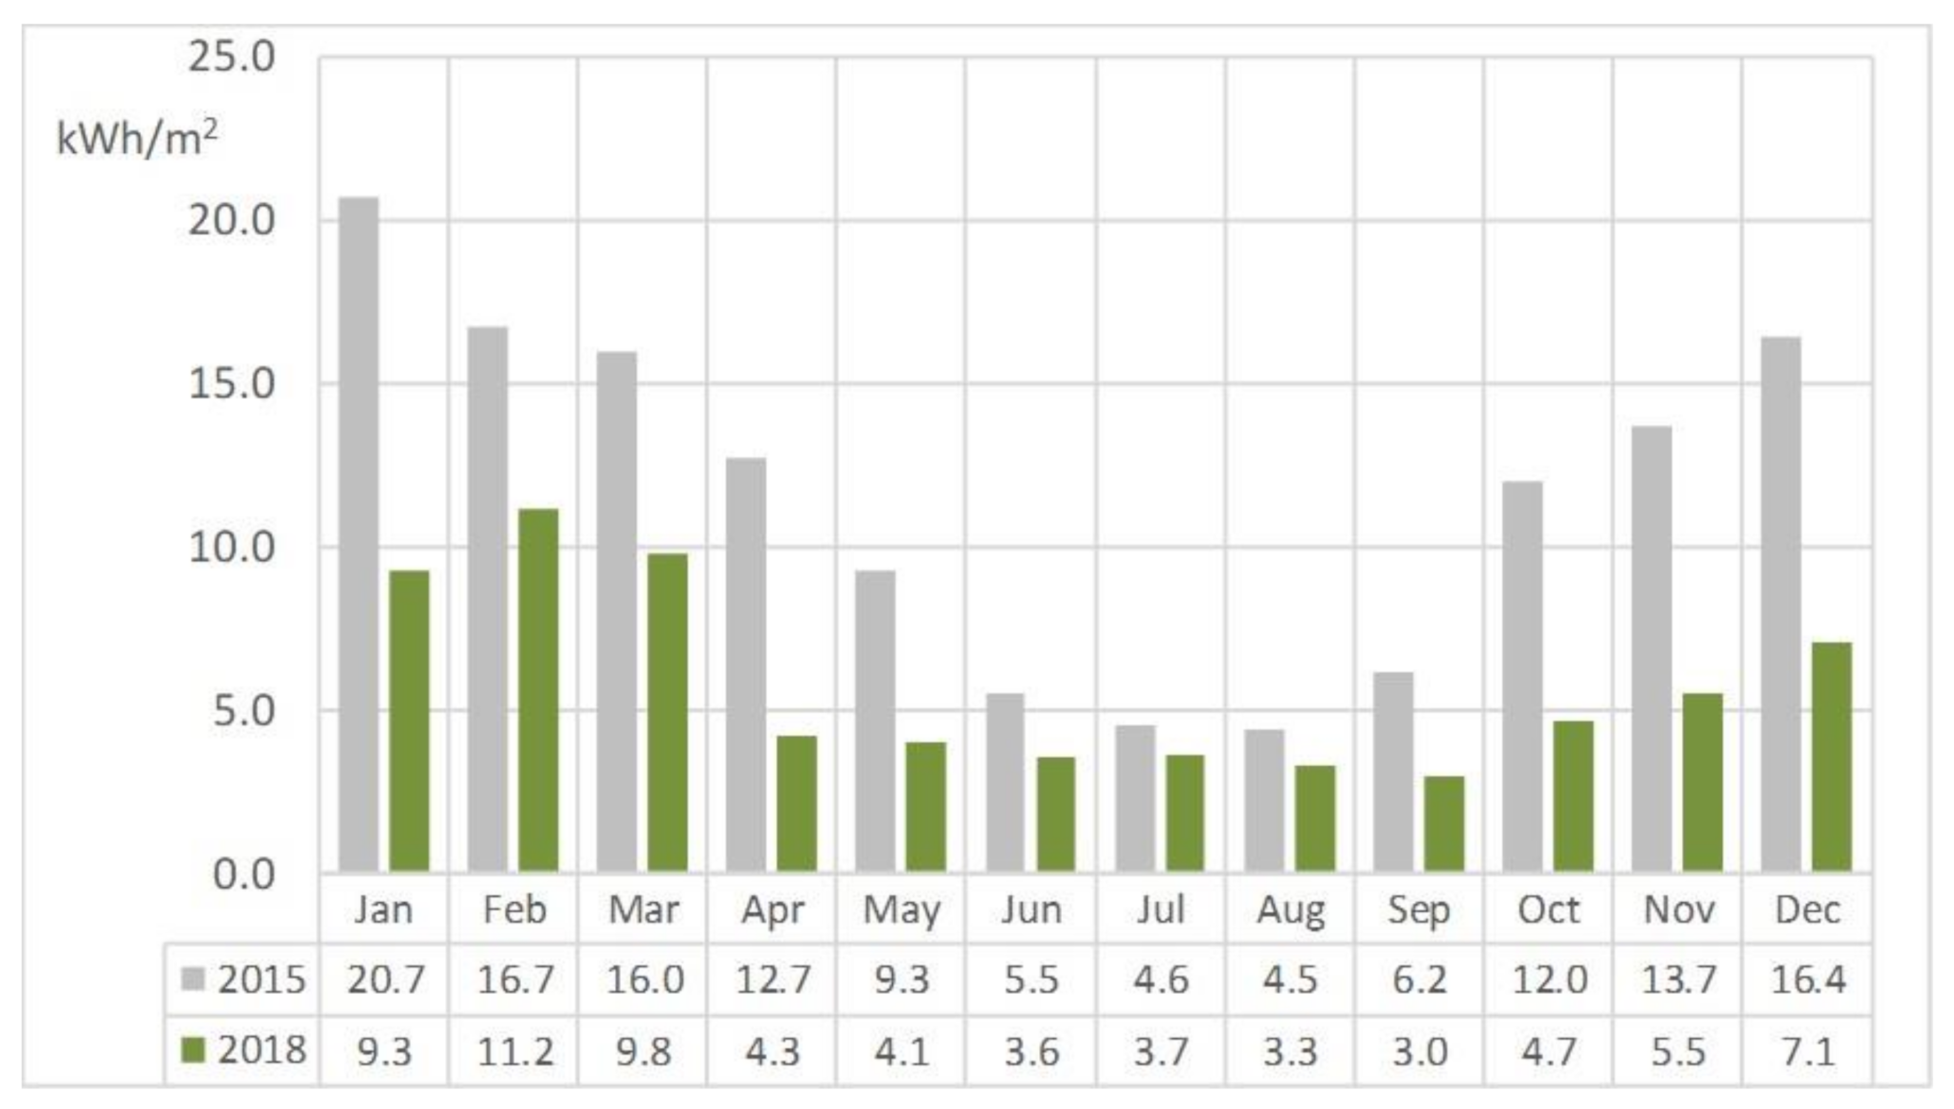
Figure 7 compares monthly district heating consumption in 2015 and 2018, where the effect of the long and cold winter in Finland is explicitly visible. During the heating season in the winter, the use of the EAHP saved approximately 50% of district heating, but during the summer only 25% was saved. Ensuring the desired temperature of hot water requires the use of district heating when the temperature of heat harvested from an EAHP is too low.
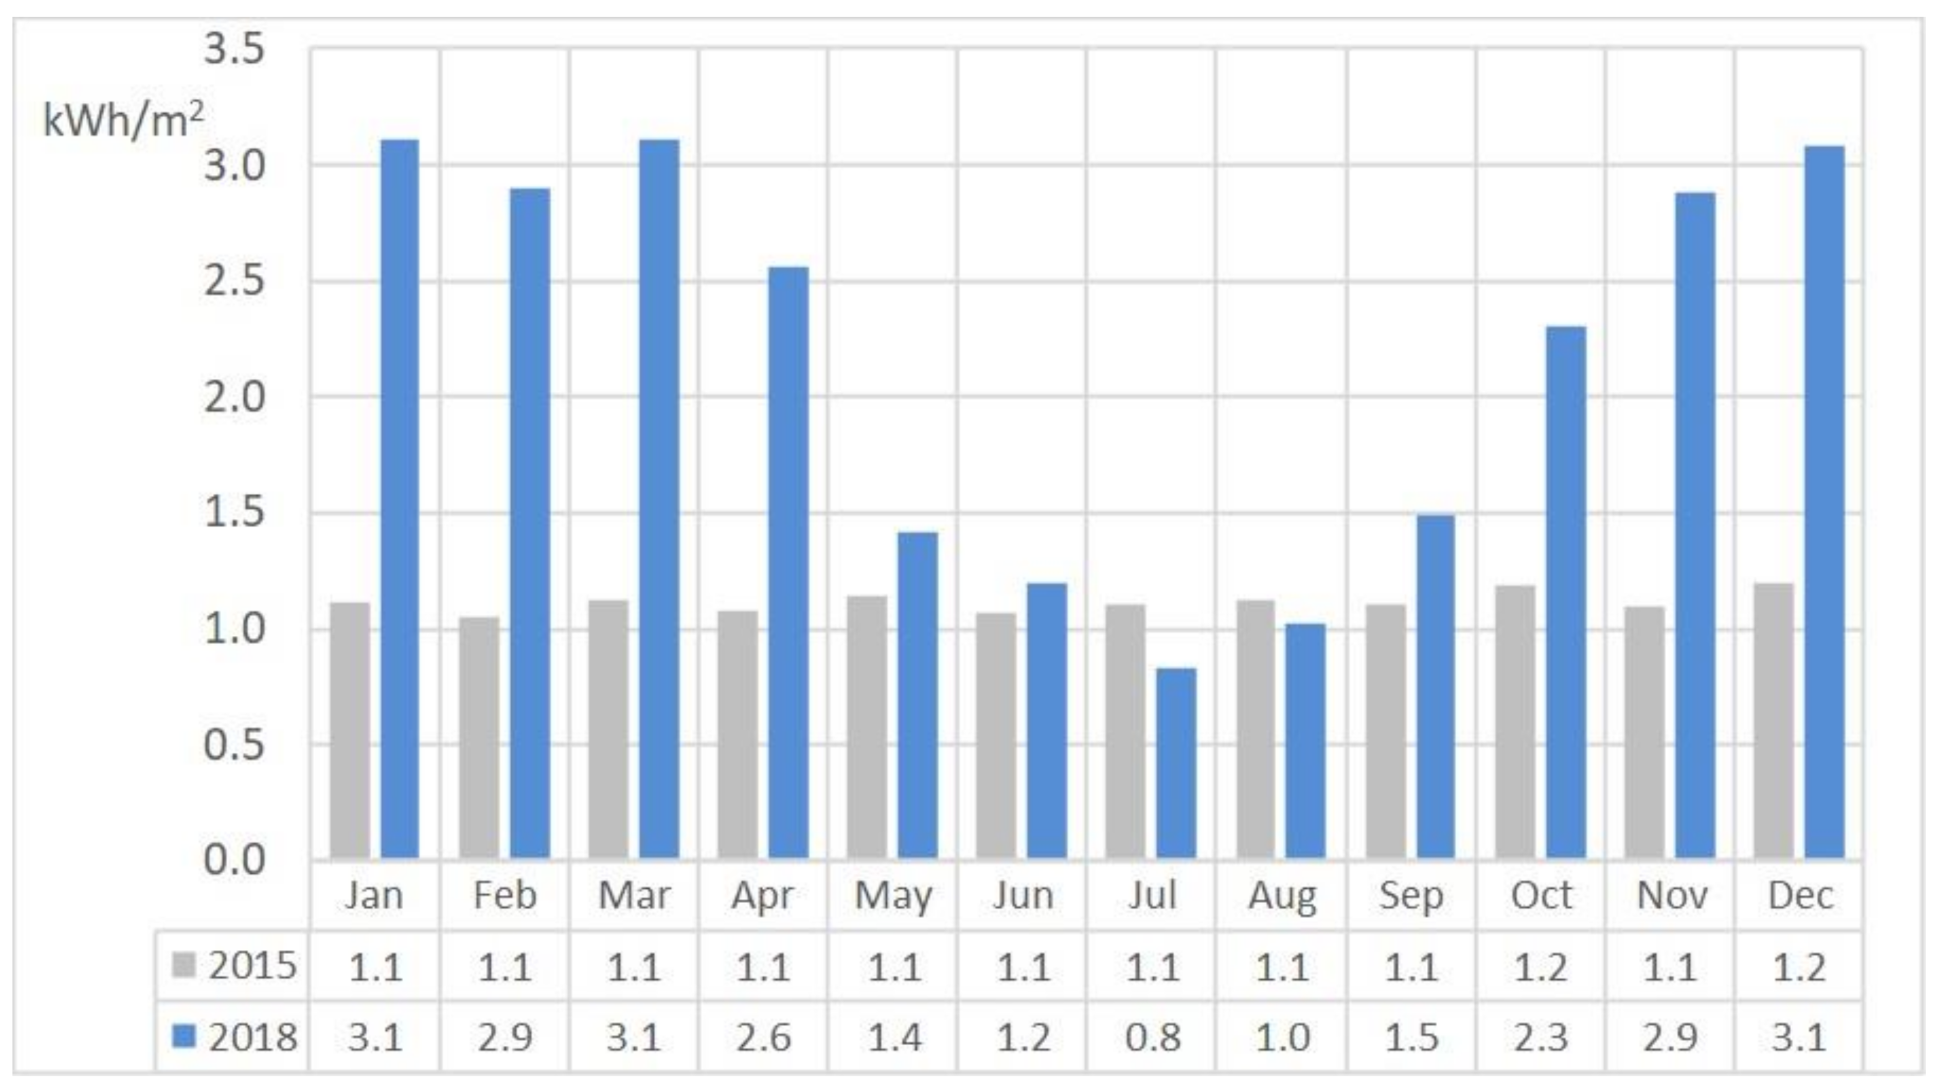
Figure 8 compares monthly electricity consumption for 2015 and 2018. As we can see, electricity consumption decreased slightly in July and August. During the heating season, the increase in consumption was around 170%.
3.2. Building Envelope Tightness
In this study the tightness of the building envelope is described by the air permeability factor q50, which defines the air leakage rate over one hour calculated at 50 Pa air pressure. The smaller the air permeability factor, the greater the tightness of the building envelope. The envelope tightness of the studied building was good, considering it was built when element construction was first introduced (see Table 3). However, following these renovation measures, the tightness of the apartments improved by almost 40%.
In Table 3, n50 is calculated by dividing the mean air leakage rate at 50 Pa by the internal volume of the apartment, and q50 is calculated by dividing the mean air leakage rate at 50 Pa by the envelope area of the apartment.
3.3. Draughts, Temperatures and CO2 Emissions
In most of the apartments the floor-level temperatures increased and the draughts decreased (see Table 4). The temperature value and air flow speed were taken at the same measurement points. The measuring points were 0.05 m above floor level and measurement lasted one to three minutes. The draughts’ velocity decreased by approximately 24% after renovation. However, the velocity, wind direction and outdoor temperature influenced the results of the measurements. The different outdoor conditions before and after renovation cause uncertainty about the results.
Five dwellings received temperature, humidity and CO2 concentration measuring devices in January 2016. The renovation work started in April 2016 and ended in January 2017. The measurements continued until April 2020. These measurements were taken every hour, resulting in more than 37,000 observations being collected for each feature from each dwelling.
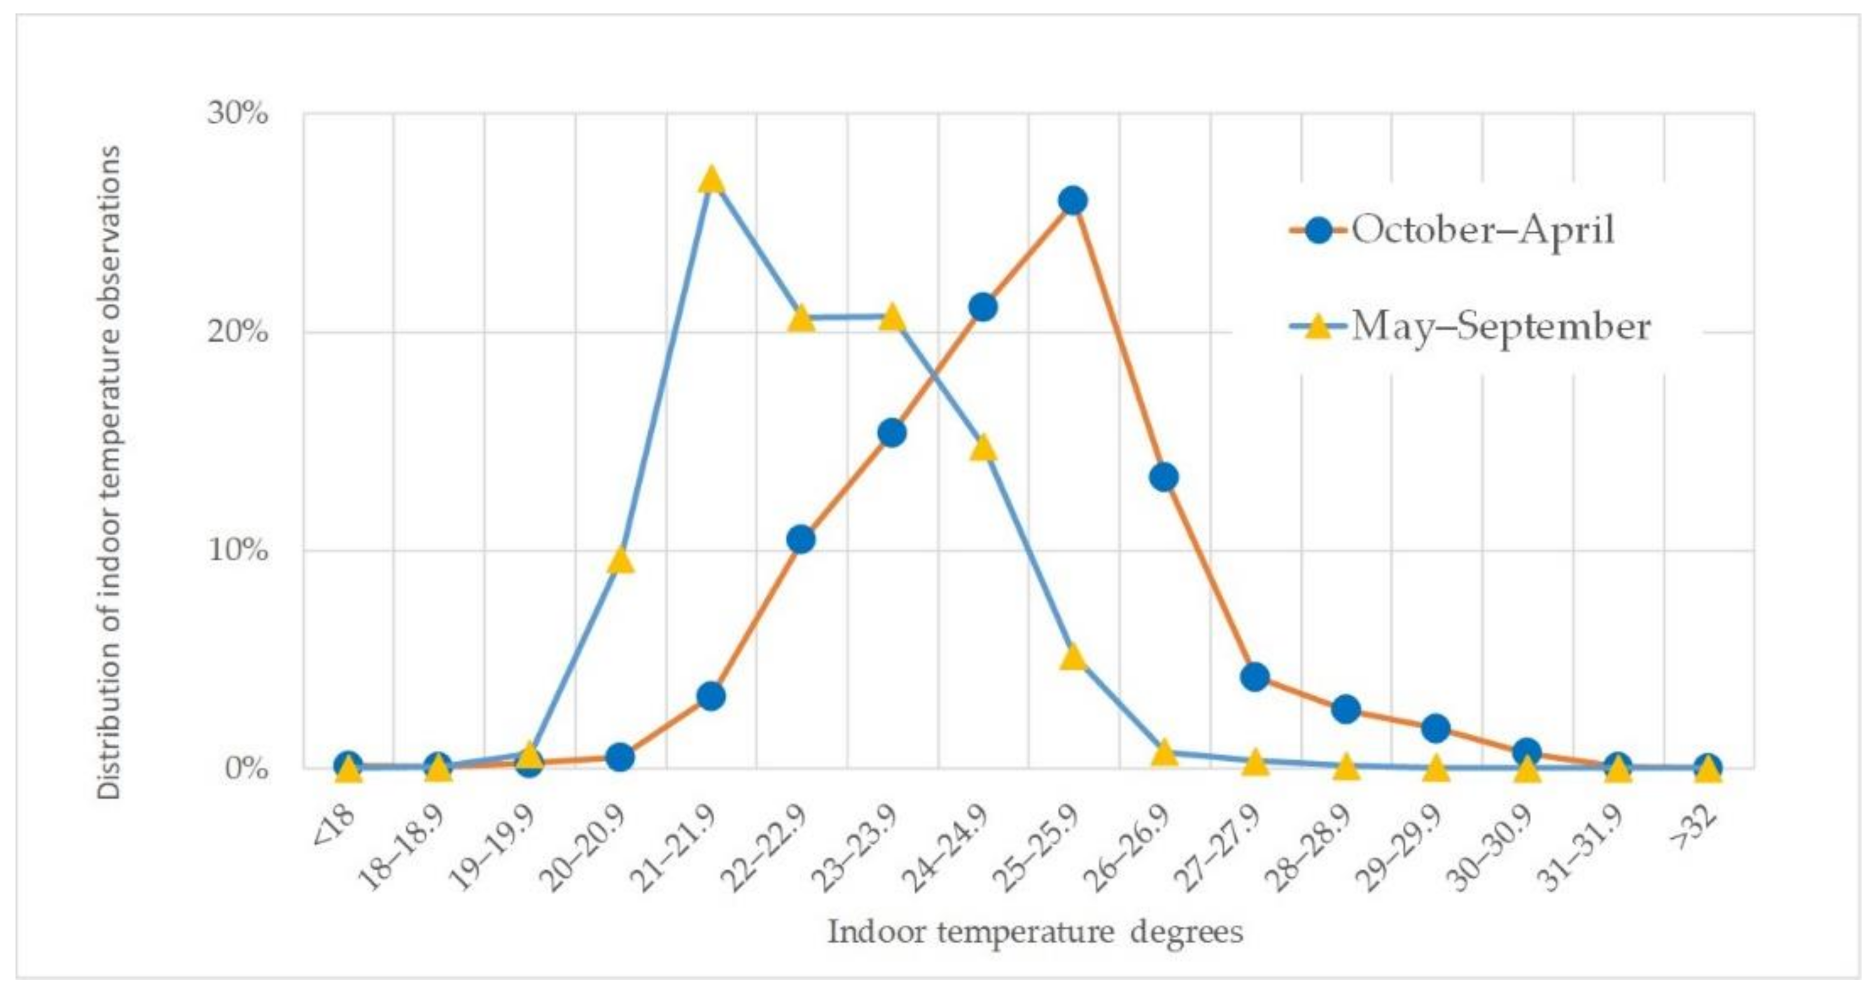
The temperature observations after renovation (from February 2018 to April 2020; total: 136,449) are summarised and classified as heating season or summer season. In Tampere the heating season starts at the beginning of October and lasts until the end of April. The distributions of the observations from the heating season and summer season are presented separately in Figure 9 and averages, as well as standard deviations, are presented in Table 5.
In Finland the Ministry of Social Affairs and Health has issued legal boundaries for living room temperatures [58]. They have to be between 18–26 °C in the heating season and 18–32 °C in the summer. These are extreme upper and lower limits. If these limits are exceeded, the property owner is obliged to take corrective measures. The Finnish Society of Indoor Air Quality and Climate [65], recommends a temperature of 20–22 °C. This is the so-called comfort temperature area.
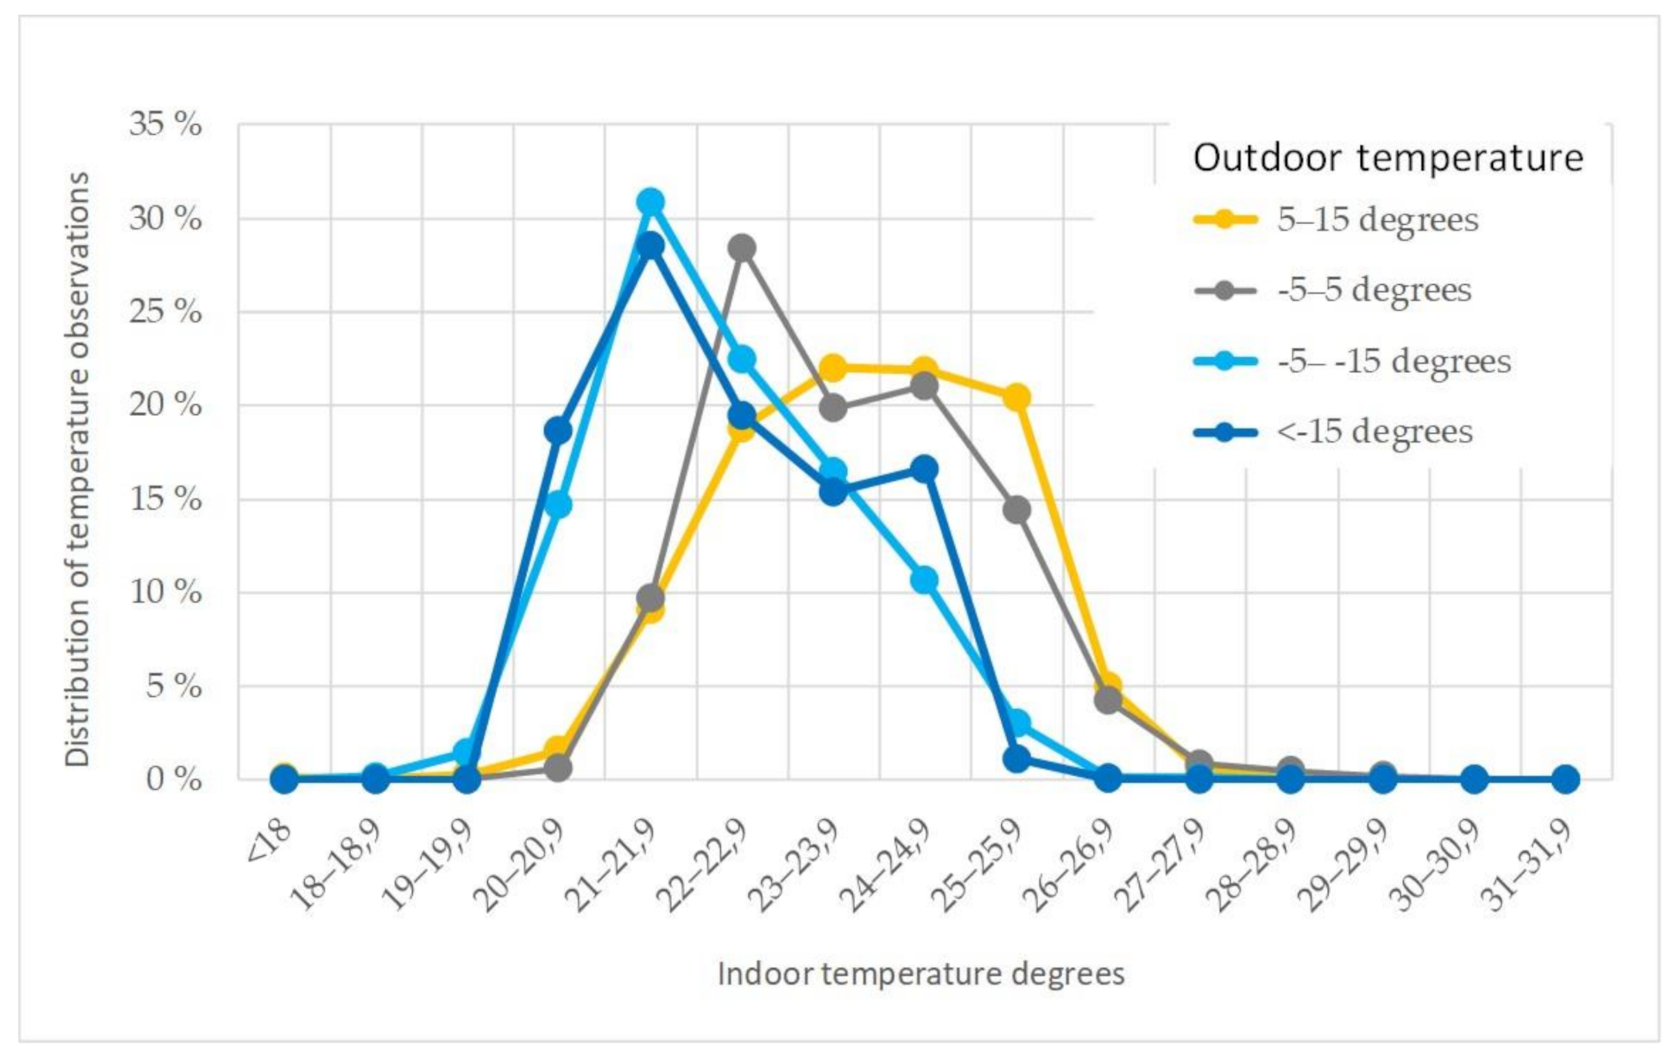
We note that during the heating season, 99% of indoor temperature observations are within the extreme limits, but only 37% are within the comfort area. During the summer season, the indoor temperature is allowed to be higher, 32 °C. All observations fit within the boundaries, but only 4% are within the comfort temperature area (see Table 5). We also note (see Figure 9) that there are only a few observations in which the indoor temperature is below 18 °C (190) and above 32 °C (7). In each of the measured apartments the inside temperature briefly increased above 30 °C, which is a result of the valves not being in the summer position as they should be in warm weather. Also, closed balcony windows cause extremely hot air to enter through the trickle vents during the summer. When the outdoor temperature is below or close to zero, the indoor temperature is 20–22 degrees, as recommended (Figure 10).
Even with the outdoor temperatures ranges, the average indoor temperature is quite stable, ranging from 22.3 to 23.8 degrees (see Table 6).
The Ministry of Social Affairs and Health [58], states that the humidity of living room air over an extended period must not be so high that it poses a risk of microbial growth in the structures, equipment or their surfaces. Finnish regulations and statutes do not provide target values for the RH. However, suggested values are given by several organisations. According to the Finnish Society of Indoor Air Quality and Climate [65], and the WHO [66], RH above 45% promotes the growth of dust mites, at 70%, humidity conditions become favourable for the growth of mould and prolonged humidity above 90% can cause rot damage. The Finnish Organisation for Respiratory Health [67], recommends 30–45% humidity for the heating season.
When the outdoor temperature is cold in the heating season, the indoor humidity is too dry rather than too moist. Only 28% of the observations are within the recommended humidity range. In the case of the dwellings, there were virtually no indications of too low or too high humidity. In warm weather, the situation was little better when 49% of the observations were in the good range (see Table 7).
According to the Ministry of Social Affairs and Health [58], the action limit value for the concentration of CO2 in indoor air is exceeded if the concentration is 1150 ppm (2100 mg/m3) higher than the concentration of CO2 in the ambient air. In Tampere the ambient air concentration is around 350 ppm. The action limit is then 1500 ppm. From the observations, only 1% of measurements in the heating season and the summer season exceeded the limit (see Table 8).
4. Discussion
Housing cooperatives need basic, cost-effective solutions in order to save energy without compromising indoor climate quality. If the building has mechanical extract air ventilation, installing an EAHP and supply air windows is a viable option. This study examines the impact of these measures on the indoor air climate.
Five different measuring methods were used to study the indoor climate of a residential building before and after a retrofit. By combining a blower door, SwemaFlow 3000, and a Tinytag TGP-4500 logger, the indoor environment was studied for human comfort. The measured features comprise temperature, humidity, CO2 concentration, draughts, air flow rates and the tightness of the building envelope. Energy consumption and outdoor conditions were subject to real-time monitoring.
As a result of the energy-technical measures of the renovation, the energy consumption of the studied building decreased by 45%. The results of this field study are similar to a Danish study by Thomsen et al. [42], as well as a Swedish study by La Fleur et al. [30,41], and Liu et al. [26]. In all of these field studies, significant savings in energy consumption were achieved. Thomsen et al. reported a 31% energy consumption reduction (in both heat and DHW energy consumption) and significant improvements in the indoor climate, while La Fleur et al., demonstrated a 34.7% reduction in district heating and DHW demand (a 44% reduction without DHW) due to the increase in the indoor air temperature after the renovation. Similarly, the study by Liu et al. resulted in a 39% reduction in space heating demand. In addition to this, the indoor climate similarly improved in all of the above-mentioned studies, mostly as an indirect effect of the improvement in energy efficiency. However, in this field study the savings in energy consumption were mainly attributable to the EAHP, although the indoor climate was considerably improved by the renovation of the building envelope and the ventilation. The tightness of the building envelope improved by approximately 40%, the draughts (air flow) decreased by 24% and the floor-level temperatures increased. These results are approximations as the outdoor temperature, and wind speed and direction were not identical at different measurement times. Using the same improvements but adding thermal insulation and using a heated supply air system, Fleur et al. [41], had similar kinds of results for draughts, but instead of field study measurements, a questionnaire and IDA-ICE simulation were used. In this study, the air flow remained at the same level as with the mechanical exhaust ventilation after installation of the EAHP. The measured air flows were low and the indoor temperatures of the apartments were high for part of the heating season. Thus, the heating system was balanced again after the renovation during the heating season in 2018 and the room temperatures decreased to a comfortable level. Studies like [30,42], had similar results regarding the higher and more comfortable indoor temperature. However, the temperature rise was not as significant as in this study. One solution for excessive room temperature could be dynamic control of the heating system in order to keep the room temperature at a comfortable level during the heating season. According to Ala-Kotila et al. [68], it would also be possible to achieve further energy savings.
Besides the energy savings, the efficient tightness of the building envelope has other benefits. It avoids the condensation of water in the structures, preventing impurities from flowing into the indoor air from non-compact spaces and avoids the draughts caused by air leaks. The draughts can be also compensated for by increasing the room temperature and adjusting the air conditioning. By reducing the draughts, a convenient indoor air temperature and better energy efficiency of the building can be achieved. The efficient tightness of the building also improves the soundproofing and acoustics, which is desirable in an urban environment. Liu et al. [26], demonstrated reduced noise levels from outside in their study, and this study indicated similar results, even though the building is located along a busy main road. However, this study received feedback from the residents through conversations, while Liu et al. used a structured questionnaire with the response rate of 53%, of which 11 answers came from residents in the retrofitted building and the remaining 31 answers came from other buildings in the area. Conversely, Thomsen et al. [42], did not achieve a similar change for apartment noise compared with the change found in these studies.
In this study the energy consumption of the building decreased by 45% (the annual energy saving is about 75 kWh/m2) with the mentioned measures [63]. La Fleur et al. [24], similarly stated that a 40% saving target is verified to be cost-effective when a balanced mechanical ventilation system with heat recovery has been taken into operation. In this study both of the above-mentioned measures were implemented and the payback time for the energy-related investment and its financing is about ten years, after which it becomes profitable. This study, as well as the study of La Fleur et al. [24], demonstrates that by implementing simple renovation measures, it is possible to accomplish both profitability and thermal comfort.
Many studies have demonstrated that user behaviour is one reason for the differences in the performance of buildings [34,35,36,37,38,39]. Likewise, in this study, a further consideration is that residents should be well instructed about the seasonal supply air window adjustment. In this field study, many apartments had the winter settings switched on during the summer, which caused a heated air flow into the apartments through the window air valves. Property managers, housing committees or maintenance services should be responsible for issuing reminders as well as changing the filters of the window air valves. Overall, the residents of the studied apartments were satisfied with the renovation process, outcome and were particularly satisfied with the attractive appearance of the façade. As an additional benefit of the renovation, the residents communicated a reduction in incoming traffic noise. However, some dissatisfaction was expressed about draughts entering through the vents of the supply air windows.
Although the study included a small number of housing units, the exceptionally long testing period with the extensive number of samples is the existent strength of the study. As an observation, the running period of several years and adjustment of the technical systems were essential for achieving all the benefits. In future studies, the measuring period before the renovation should be 12 months instead of the 4–5 months that was used in order to cover all the seasons.
As this study exposed the challenge of stabilising the indoor temperature in order to avoid the excessive room temperatures, further studies should concentrate on the profitable dynamic control system’s [68], suitability for reducing the power peaks in cases like this. In addition to the better indoor temperature, the building owners who pay the energy bill can gain financial benefits if power peaks are reduced. Also, physically shading windows to achieve lower indoor temperatures should be considered. It is also apparent that any future energy retrofitting studies that include supply air windows, ensuring adequate fresh air by having large enough trickle vents is the most notable technical challenge and must be thoroughly investigated.
5. Conclusions
Finland, as well as the rest of the European Union, is confronting the challenge of renovating an aging building stock. This study offers a field test approach to understanding the effect of deep renovation on the indoor climate quality and its profitability in an apartment building in Finland. The deep renovation included façade repair with extra insulation, new windows with trickle vents, new balcony glass and doors, and the installation of an EAHP into the existing mechanical exhaust air ventilation.
By combining the measurements and occasional occupant conversations, the study has investigated how the building’s energy use and indoor environment have been reformed by comparing the retrofitted and non-retrofitted building.
The retrofit has shown positive effects on energy performance in the building as well as provided a better indoor environment in the building where residents spend a significant amount of their time. However, the study revealed the challenge of excessive room temperatures. In order to avoid that challenge in deep renovations in general, one option could be to reduce the heating power accurately. Instead of a traditional static heating control system, dynamic control that takes into account real-time room temperature could be a solution, avoiding excess temperatures as well as achieving additional energy savings. Another noteworthy outcome of the study was that in order to achieve all the benefits, there needs to be a running period of several years, as well as adjustment of the technical systems.
This study demonstrates that, in addition to energy reduction in the building sector overall, deep renovation also has a role in providing a better indoor environment in residential buildings.
In conclusion, by deep renovation, considerable savings can be achieved compared to the actual investment. Regardless of the challenges that were faced, the residents of the apartments were satisfied with the improved indoor climate. The results of this study can be generalised to those countries where similar prefabricated apartment buildings with mechanical exhaust ventilation are common.
Author Contributions
Methodology: J.L., T.V. and P.A.-K.; data curation: J.L. and T.V.; formal analysis, validation, visualization, conceptualization, writing (review and editing): P.A.-K. and T.V.; investigation, supervision, project administration and writing (original draft preparation): P.A.-K. All authors have read and agreed to the published version of the manuscript.
Funding
This project has received funding from the European Union’s Seventh Programme for Research, Technological Development and Demonstration under grant agreement No ENER/FP7EN/314632/EU-GUGLE.
Acknowledgments
The authors would like to thank the residents and the housing cooperative of the studied building for their kind cooperation as well as anonymous reviewers for their reviews and important comments.
Conflicts of Interest
The authors declare no conflict of interest.
References
- International Energy Agency IEA Buildings: A Source of Enormous Untapped Efficiency Potential. Available online: https://www.iea.org/topics/buildings (accessed on 8 April 2020).
- Pérez-Lombard, L.; Ortiz, J.; Pout, C. A review on buildings energy consumption information. Energy Build. 2008, 40, 394–398. [Google Scholar] [CrossRef]
- Ürge-Vorsatz, D.Ü.; Eyre, N.; Graham, P.; Harvey, D.; Hertwich, E.; Jiang, Y.; Majumdar, M.; Mcmahon, J.E.; Murakami, S.; Janda, K.; et al. Energy End-Use: Buildings; Cambridge Universiuty Press: Cambridge, UK, 2012. [Google Scholar]
- European Commission. An EU strategy on heating and cooling 2016. J. Chem. Inf. Model. 2016, 53, 1689–1699. [Google Scholar] [CrossRef]
- Economidau, M.; Atanasau, B.; Despret, C.; Maio, J.; Nolte, I.; Rapf, O.; Laustsen, J.; Ruyssevelt, P.; Staniaszek, D.; Strong, D.; et al. Europe’s Buildings under the Microscope; BPIE: Brussels, Belgium, 2011. [Google Scholar]
- Pollier, K.; Gynther, L.; Lapillonne, B. Energy Efficiency Trends and Policies in the Household and Tertiary Sectors 2015. Available online: https://www.odyssee-mure.eu/publications/archives/energy-efficiency-trends-policies-buildings.pdf (accessed on 20 June 2020).
- European Commission. Directive (EU) 2018/844 of the European Parliament and of The Council of 30 May 2018 amending Directive 2010/31/EU on the energy performance of buildings and Directive 2012/27/EU on energy efficiency. OJEU 2018, 2018, 75–91. [Google Scholar]
- European Commission. Directive (EU) 2018/2002 of the European Parliament and of the council of 11 December 2018 amending Directive 2012/27/EU on energy efficiency. OJEU 2018, 2018, 210–230. [Google Scholar]
- European Commission. Directive 2010/31/EU of the European Parliament and of the council of 19 May 2010 on the energy performance of buildings (recast). OJEU 2010, 3, 124–146. [Google Scholar]
- Kurnitski, J.; Kuusk, K.; Tark, T.; Uutar, A.; Kalamees, T.; Pikas, E. Energy and investment intensity of integrated renovation and 2030 cost optimal savings. Energy Build. 2014, 75, 51–59. [Google Scholar] [CrossRef]
- World Health Organization. WHO Housing and Health Guidelines. 2018. Available online: https://www.who.int/publications/i/item/9789241550376 (accessed on 20 August 2020).
- Fabbri, K. Indoor thermal comfort perception: A questionnaire approach focusing on children. Indoor Therm. Comf. Percept. A Quest. Approach Focus. Child. 2015, 1–302. [Google Scholar] [CrossRef]
- Wu, Q.; Liu, J.; Zhang, L.; Zhang, J.; Jiang, L. Study on thermal sensation and thermal comfort in environment with moderate temperature ramps. Build. Environ. 2020, 171, 106640. [Google Scholar] [CrossRef]
- Kaczmarczyk, J.; Melikov, A.; Bolashikov, Z.; Nikolaev, L.; Fanger, P.O. Human response to five designs of personalized ventilation. HVAC R Res. 2006, 12, 367–384. [Google Scholar] [CrossRef]
- Fanger, P.O. Indoor Air Quality in the 21st Century: Search for Excellence. Indoor Air 2000, 10, 68–73. [Google Scholar] [CrossRef]
- Spielvogel, L.G. Effects of HVAC on student performance. ASHRAE J. 2006, 48, 12. [Google Scholar]
- Wyon, D.P. Indoor Environmental Effects on Productivity. Proc. IAQ 1996, 96, 5–15. [Google Scholar]
- Berglund, L.G.; Cain, W.S. Perceived air quality and the thermal environment. Proc. IAQ 1989, 89, 93–99. [Google Scholar]
- Wang, H.; Liu, L. Experimental investigation about effect of emotion state on people’s thermal comfort. Energy Build. 2020, 211, 109789. [Google Scholar] [CrossRef]
- Kumar, S.; Singh, M.K.; Mathur, A.; Košir, M. Occupant’s thermal comfort expectations in naturally ventilated engineering workshop building: A case study at high metabolic rates. Energy Build. 2020, 109970. [Google Scholar] [CrossRef]
- Karjalainen, S. Thermal comfort and gender: A literature review. Indoor Air 2012, 22, 96–109. [Google Scholar] [CrossRef]
- Morelli, M.; Rønby, L.; Mikkelsen, S.E.; Minzari, M.G.; Kildemoes, T.; Tommerup, H.M. Energy retrofitting of a typical old Danish multi-family building to a “nearly-zero” energy building based on experiences from a test apartment. Energy Build. 2012, 54, 395–406. [Google Scholar] [CrossRef]
- Liu, L.; Moshfegh, B.; Akander, J.; Cehlin, M. Comprehensive investigation on energy retrofits in eleven multi-family buildings in Sweden. Energy Build. 2014, 84, 704–715. [Google Scholar] [CrossRef]
- La Fleur, L.; Rohdin, P.; Moshfegh, B. Investigating cost-optimal energy renovation of a multifamily building in Sweden. Energy Build. 2019, 203. [Google Scholar] [CrossRef]
- Andersson, A.; Larsson, D. Renovering av Flerfamiljsbostäder Inom Miljonprogrammet ur ett Energi-Och Lönsamhetsperspektiv. 2013. Available online: http://publications.lib.chalmers.se/records/fulltext/179068/179068.pdf (accessed on 15 June 2020).
- Liu, L.; Rohdin, P.; Moshfegh, B. Evaluating indoor environment of a retrofitted multi-family building with improved energy performance in Sweden. Energy Build. 2015, 102, 32–44. [Google Scholar] [CrossRef]
- Kuusk, K.; Kalamees, T.; Link, S.; Ilomets, S.; Mikola, A. Case-study analysis of concrete large-panel apartment building at pre- and post low-budget energy-renovation. J. Civ. Eng. Manag. 2017, 23, 67–75. [Google Scholar] [CrossRef]
- Földváry, V.; Bekö, G.; Langer, S.; Arrhenius, K.; Petráš, D. Effect of energy renovation on indoor air quality in multifamily residential buildings in Slovakia. Build. Environ. 2017, 122, 363–372. [Google Scholar] [CrossRef] [Green Version]
- Lechtenböhmer, S.; Schüring, A. The potential for large-scale savings from insulating residential buildings in the EU. Energy Effic. 2011, 4, 257–270. [Google Scholar] [CrossRef]
- La Fleur, L.; Moshfegh, B.; Rohdin, P. Measured and predicted energy use and indoor climate before and after a major renovation of an apartment building in Sweden. Energy Build. 2017, 146, 98–110. [Google Scholar] [CrossRef] [Green Version]
- Wells, E.M.; Berges, M.; Metcalf, M.; Kinsella, A.; Foreman, K.; Dearborn, D.G.; Greenberg, S. Indoor air quality and occupant comfort in homes with deep versus conventional energy efficiency renovations. Build. Environ. 2015. [Google Scholar] [CrossRef] [Green Version]
- Nantka, M. Indoor climate and energy consumption in buildings with natural ventilation. Archit. Civ. Eng. Environ. 2008, 1, 107–118. [Google Scholar]
- National Board of Housing. Building and Planning. Energy Use in Buildings: Sub- goal 6—Report for the Detailed Evaluation of Good Built Environment; Boverket: Karlskrona, Sweden, 2007. [Google Scholar]
- Dar, U.I.; Georges, L.; Sartori, I.; Novakovic, V. Influence of occupant’s behavior on heating needs and energy system performance: A case of well-insulated detached houses in cold climates. Build. Simul. 2015, 8, 499–513. [Google Scholar] [CrossRef]
- Sunikka-Blank, M.; Galvin, R. Introducing the prebound effect: The gap between performance and actual energy consumption. Build. Res. Inf. 2012, 40, 260–273. [Google Scholar] [CrossRef]
- Hoes, P.; Hensen, J.L.M.; Loomans, M.G.L.C.; de Vries, B.; Bourgeois, D. User behavior in whole building simulation. Energy Build. 2009, 41, 295–302. [Google Scholar] [CrossRef] [Green Version]
- Ryan, E.M.; Sanquist, T.F. Validation of building energy modeling tools under idealized and realistic conditions. Energy Build. 2012, 47, 375–382. [Google Scholar] [CrossRef]
- Calì, D.; Osterhage, T.; Streblow, R.; Müller, D. Energy performance gap in refurbished German dwellings: Lesson learned from a field test. Energy Build. 2016, 127, 1146–1158. [Google Scholar] [CrossRef]
- De Wilde, P. The gap between predicted and measured energy performance of buildings: A framework for investigation. Autom. Constr. 2014, 41, 40–49. [Google Scholar] [CrossRef]
- Klepeis, N.E.; Nelson, W.C.; Ott, W.R.; Robinson, J.P.; Tsang, A.M.; Switzer, P.; Behar, J.V.; Hern, S.C.; Engelmann, W.H. The National Human Activity Pattern Survey (NHAPS): A resource for assessing exposure to environmental pollutants. J. Expo. Anal. Environ. Epidemiol. 2001, 11, 231–252. [Google Scholar] [CrossRef] [PubMed] [Green Version]
- La Fleur, L.; Rohdin, P.; Moshfegh, B. Energy use and perceived indoor environment in a Swedish multifamily building before and after major renovation. Sustainability 2018, 10, 766. [Google Scholar] [CrossRef] [Green Version]
- Thomsen, K.E.; Rose, J.; Mørck, O.; Jensen, S.Ø.; Østergaard, I.; Knudsen, H.N.; Bergsøe, N.C. Energy consumption and indoor climate in a residential building before and after comprehensive energy retrofitting. Energy Build. 2016, 123, 8–16. [Google Scholar] [CrossRef]
- Noris, F.; Adamkiewicz, G.; Delp, W.W.; Hotchi, T.; Russell, M.; Singer, B.C.; Spears, M.; Vermeer, K.; Fisk, W.J. Indoor environmental quality benefits of apartment energy retrofits. Build. Environ. 2013, 68, 170–178. [Google Scholar] [CrossRef] [Green Version]
- Howden-Chapman, P.; Matheson, A.; Crane, J.; Viggers, H.; Cunningham, M.; Blakely, T.; Cunningham, C.; Woodward, A.; Saville-Smith, K.; O’Dea, D.; et al. Effect of insulating existing houses on health inequality: Cluster randomised study in the community. Br. Med. J. 2007, 334, 460–464. [Google Scholar] [CrossRef] [PubMed] [Green Version]
- IDA-ICE. Available online: https://www.equa.se/fi/ida-ice (accessed on 30 January 2020).
- Kuusk, K.; Kurnitski, J.; Kalamees, T. Calculation and compliance procedures of thermal bridges in energy calculations in various European countries. Energy Procedia 2017, 132, 27–32. [Google Scholar] [CrossRef]
- Gosselin, J.R.; Chen, Q. A dual airflow window for indoor air quality improvement and energy conservation in buildings. HVAC R Res. 2008, 14, 359–372. [Google Scholar] [CrossRef]
- Saelens, D.; Roels, S.; Hens, H. Strategies to improve the energy performance of multiple-skin facades. Build. Environ. 2008, 43, 638–650. [Google Scholar] [CrossRef]
- Carlos, J.S.; Corvacho, H.; Silva, P.D.; Castro-Gomes, J.P. Real climate experimental study of two double window systems with preheating of ventilation air. Energy Build. 2010. [Google Scholar] [CrossRef]
- Manz, H.; Schaelin, A.; Simmler, H. Airflow patterns and thermal behavior of mechanically ventilated glass double facades. Build. Environ. 2004, 39, 1023–1033. [Google Scholar] [CrossRef]
- Chow, T.; Lin, Z.; Fong, K.F.; Chan, L.S.; He, M. miao Thermal performance of natural airflow window in subtropical and temperate climate zones—A comparative study. Energy Convers. Manag. 2009, 50, 1884–1890. [Google Scholar] [CrossRef]
- Gloriant, F.; Tittelein, P.; Joulin, A.; Lassue, S. Study of the performances of a supply-air window for air renewal pre-heating. Energy Procedia 2015, 78, 525–530. [Google Scholar] [CrossRef] [Green Version]
- McEvoy, M.E.; Southall, R.G.; Baker, P.H. Test cell evaluation of supply air windows to characterise their optimum performance and its verification by the use of modelling techniques. Energy Build. 2003, 35, 1009–1020. [Google Scholar] [CrossRef]
- Southall, R.G.; McEvoy, M.E. Investigations into the functioning of a supply air window in relation to solar energy as determined by experiment and simulation. Sol. Energy 2006, 80, 512–523. [Google Scholar] [CrossRef]
- Liu, M.; Heiselberg, P.K.; Larsen, O.K.; Mortensen, L.; Rose, J. Investigation of Different Configurations of a Ventilated Window to Optimize Both Energy Efficiency and Thermal Comfort. Energy Procedia 2017, 132, 478–483. [Google Scholar] [CrossRef]
- Madonna, F.; Bazzocchi, F. Annual performances of reversible air-to-water heat pumps in small residential buildings. Energy Build. 2013, 65, 299–309. [Google Scholar] [CrossRef]
- Nordic Council of Ministers. Nordsyn Study on Air-to-Water Heat Pumps in Humid Nordic Climate. 2019. Available online: https://norden.diva-portal.org/smash/get/diva2:1312951/FULLTEXT01.pdf (accessed on 21 June 2020).
- Ministry of Social Affairs and Health. Conditions of Housing and Other Residential Buildings and Qualification Requirements for Third-Party Experts; Ministry of Social Affairs and Health: Helsinki, Finland, 2015; Volume 13, pp. 1576–1580.
- Finnish Standards Association SFS. SFS 5511. LVI 014-10187. Ilmastointi. Rakennusten sisäilmasto. Lämpöolojen kenttämittaukset (ISO 7726:1986; modified); Finnish Standards Association: Helsinki, Finland, 1993; Volume 1, pp. 1–14. [Google Scholar]
- Finnish Standards Association SFS. SFS-EN ISO 9972:2015. Thermal Performance of Buildings—Determination of Air Permeability of Buildings—Fan Pressurization Method; Finnish Standards Association: Helsinki, Finland, 2015. [Google Scholar]
- Finnish Standards Association SFS. SFS-EN 13829. Thermal Performance of Buildings. Determination of Air Permeability of Buildings. Fan Pressurization Method (ISO 9972:1996, Modified); Finnish Standards Association: Helsinki, Finland, 2006. [Google Scholar]
- U.S. Department of Energy. Energy Saver Blower Door Tests. Available online: https://www.energy.gov/energysaver/blower-door-tests (accessed on 25 August 2020).
- EU GUGLE. Fact sheet of BEST 2 Limited Liability Housing Company Kaupinpirtti. Available online: http://eu-gugle.eu/wp-content/uploads/2013/10/eu-guglefactsheetbest2kaupinpirtti-suppea-v2.pdf (accessed on 20 March 2020).
- Scancerco Oy. Biobe ThermoMax A. Trickle vent. Available online: https://scancerco.fi/tuotteet/ilmanvaihtoala/biobe/biobe-thermomax-a-tuloilmaikkunaventtiili/ (accessed on 26 August 2020).
- Finnish Society of Indoor Air Quality and Climate. FiSIAQ. The Finnish Classification of Indoor Environment and Material Emissions. Available online: https://www.sisailmayhdistys.fi/Terveelliset-tilat/Sisailmasto/Fysikaaliset-tekijat (accessed on 3 September 2020).
- World Health Organization. WHO Guidelines for Indoor air Quality: Dampness and Mould. 2009. Available online: https://www.who.int/airpollution/guidelines/dampness-mould/en/ (accessed on 2 September 2020).
- The Finnish Organisation For Respiratory Health. Sisäilman kosteus ja lämpötila. Available online: https://www.hengitysliitto.fi/fi/sisailma/sisailma-asiat-sisailmaongelmat/sisailman-kosteus-ja-lampotila (accessed on 24 May 2020).
- Ala-Kotila, P.; Vainio, T.; Heinonen, J. Demand Response in District Heating Market—Results of the Field Tests in Student Apartment Buildings. Smart Cities 2020, 3, 157–171. [Google Scholar] [CrossRef] [Green Version]
Figure 1.
The principle of the supply air window in summer position (left) and in winter position (right).
Figure 1.
The principle of the supply air window in summer position (left) and in winter position (right).

Figure 2.
The studied apartments in 2014, measured using a thermal camera.

Figure 3.
Renovation and performed momentary and longitudinal studies.

Figure 4.
The studied building before and after retrofitting.

Figure 5.
The trickle vent, Biobe ThermoMax A, used in the supply air windows of this study.

Figure 6.
Annual specific district heat and electricity consumption. The renovation was done from March 2016 to January 2017.
Figure 6.
Annual specific district heat and electricity consumption. The renovation was done from March 2016 to January 2017.

Figure 7.
Specific monthly district heating consumption.

Figure 8.
Specific monthly electricity consumption.

Figure 9.
The distribution of indoor temperature observations in five dwellings from February 2017 to April 2020 (after-renovation values).
Figure 9.
The distribution of indoor temperature observations in five dwellings from February 2017 to April 2020 (after-renovation values).

Figure 10.
The distribution of indoor temperatures at different outdoor temperatures after renovation.
Figure 10.
The distribution of indoor temperatures at different outdoor temperatures after renovation.


Table 1.
The results of the performed renovation measures in studies that investigate the effects of energy renovation on IAQ in a cold climate. All the case buildings were connected to district heating and the renovations included thermal improvements to the building envelope, new windows with better U-values and the installation of a heat recovery system. DH = district heating, MVHR = mechanical ventilation with heat recovery, EAHP = mechanical ventilation with an exhaust air heat pump, DHW = domestic hot water.
| Case, Construction Year(s), Location | Building Envelope | Ventilation System | Roof Insulation | Heating System | New Windows | PV System | Energy Consumption Reduction | Ref. |
|---|---|---|---|---|---|---|---|---|
| Residential building, late 1970s, Sweden | X | MVHR | X | DH | X | 39% | [26] | |
| Multi-family building, 1961, Sweden | X | MVHR | X | DH | X | 35% (incl. DHW) | [30,41] | |
| Apartment buildings, 1966, Estonia | X | EAHP | X | DH | X | 49% | [27] | |
| Apartment complex, 1969, Denmark | X | MVHR | DH | X | X | 31% (incl. DHW) | [42] |
Table 2.
Properties affecting energy consumption and values before the retrofit and after the retrofit.
Table 2.
Properties affecting energy consumption and values before the retrofit and after the retrofit.
| Property | Before | After |
|---|---|---|
| Total floor area | 3693 m2 | 3693 m2 |
| U-value of windows | 2.5 W/m2 K | 1.0 W/m2 K |
| U-value of building envelope | 0.4 W/m2 K | 0.29 W/m2 K |
| U-value of roof | 0.4 W/m2 K | 0.4 W/m2 K |
| U-value of basement | 0.4 W/m2 K | 0.4 W/m2 K |
| Ventilation heat recovery efficiency | – | 70% |
| Heating | District heating | District heating |
Table 3.
The measurements of the building envelope tightness before and after the renovation.
| Building Envelope Tightness | n50 (1/h) | q50 (m3/h per m2) | ||
|---|---|---|---|---|
| Dwelling | Before Renovation | After Renovation | Before Renovation | After Renovation |
| A | 1.6 | 1.2 | 1.3 | 1.0 |
| B | 1.9 | 1.1 | 1.4 | 0.9 |
| C | 2.3 | 1.1 | 1.8 | 0.9 |
| D | 1.8 | Not measured | 1.4 | Not measured |
| E | 2.1 | 1.4 | 1.6 | 1.0 |
| F | 2.2 | 1.3 | 1.7 | 1.0 |
Table 4.
Momentary measurements of the draughts in the rooms before and after the renovation (averages of all apartments).
Table 4.
Momentary measurements of the draughts in the rooms before and after the renovation (averages of all apartments).
| Room and Measurement Point | Draught (m/s) | Temperature (°C) | ||
|---|---|---|---|---|
| Before | After | Before | After | |
| Living room, balcony door | 0.25 | 0.13 | 18.0 | 20.6 |
| Living room, window | 0.10 | 0.05 | 20.5 | 21.1 |
| Living room, corner | 0.07 | 0.05 | 18.9 | 20.7 |
| Bedroom, window | 0.08 | 0.07 | 20.3 | 21.4 |
Table 5.
Average temperatures and temperatures within the boundaries.
| Heating Season: From October to April; Average Outdoor Temperature: 0 ± 6 Degrees | |||
|---|---|---|---|
| Observations | Average indoor temperature | 18–26 °C | 20–22 °C |
| 81,364 | 22.7 ± 1.5 °C | 99% | 37% |
| Summer season: From May to September; average outdoor temperature: 15 ± 5 Degrees | |||
| Observations | Average indoor temperature | 18–32 °C | 20–22 °C |
| 55,085 | 24.8 ± 1.8 °C | 100% | 4% |
Table 6.
The average indoor temperatures connection to ranging outdoor temperature during the heating season after renovation.
Table 6.
The average indoor temperatures connection to ranging outdoor temperature during the heating season after renovation.
| Temperature Interdependence | Below −15 °C | −15 to −5 °C | −5 to 5 °C | 5 to 15 °C |
|---|---|---|---|---|
| Observations | 1215 | 11,478 | 55,984 | 39,322 |
| Average outdoor temperature | −18.2 ± 2.0 | −8.4 ± 2.6 | 0.7 ± 2.4 | 10.1 ± 2.9 |
| Average indoor temperature | 22.3 ± 1.4 | 22.3 ± 1.4 | 22.6 ± 1.5 | 23.8 ± 1.5 |
Table 7.
Average RH observations and the observations within the boundaries.
| Heating Season: From October to April | |||||
|---|---|---|---|---|---|
| Observations | Average humidity | Between 30–45% | Between 45–100% | Between 70–100% | Between 90–100% |
| 78,004 | 26 ± 7% | 28% | 1% | 0% | 0% |
| Summer season: from May to September | |||||
| Observations | Average humidity | Between 30–45% | Between 45–100% | Between 70–100% | Between 90–100% |
| 55,985 | 39 ± 10% | 49% | 35% | 0% | 0% |
Table 8.
Average CO2 concentration and the proportion of observations that exceeded the action limit after renovation.
Table 8.
Average CO2 concentration and the proportion of observations that exceeded the action limit after renovation.
| Heating Season: From October to April | ||
|---|---|---|
| Observations | Average | >1500 ppm |
| 75,481 | 711 ± 197 ppm | 1% |
| Summer season: From May to September | ||
| Observations | Average | >1500 ppm |
| 51,935 | 629 ± 158 ppm | 1% |
© 2020 by the authors. Licensee MDPI, Basel, Switzerland. This article is an open access article distributed under the terms and conditions of the Creative Commons Attribution (CC BY) license (http://creativecommons.org/licenses/by/4.0/).
Share and Cite
MDPI and ACS Style
Ala-Kotila, P.; Vainio, T.; Laamanen, J. The Influence of Building Renovations on Indoor Comfort—A Field Test in an Apartment Building. Energies 2020, 13, 4958. https://0-doi-org.brum.beds.ac.uk/10.3390/en13184958
AMA Style
Ala-Kotila P, Vainio T, Laamanen J. The Influence of Building Renovations on Indoor Comfort—A Field Test in an Apartment Building. Energies. 2020; 13(18):4958. https://0-doi-org.brum.beds.ac.uk/10.3390/en13184958
Chicago/Turabian StyleAla-Kotila, Paula, Terttu Vainio, and Jarmo Laamanen. 2020. "The Influence of Building Renovations on Indoor Comfort—A Field Test in an Apartment Building" Energies 13, no. 18: 4958. https://0-doi-org.brum.beds.ac.uk/10.3390/en13184958
Note that from the first issue of 2016, this journal uses article numbers instead of page numbers. See further details here.