Study of the Bearing Capacity of Stiffened Tall Offshore Wind Turbine Towers during the Erection Phase


1
School of Naval Architecture, Ocean and Civil Engineering, Shanghai Jiao Tong University, Shanghai 200240, China
2
School of Civil Engineering, University of Birmingham, Edgbaston, Birmingham B15 2TT, UK
*
Author to whom correspondence should be addressed.
Energies 2020, 13(19), 5102; https://0-doi-org.brum.beds.ac.uk/10.3390/en13195102
Submission received: 2 September 2020
/
Revised: 23 September 2020
/
Accepted: 25 September 2020
/
Published: 1 October 2020
(This article belongs to the Special Issue Advances in Wind Energy Structures)
Abstract
:Offshore wind energy is a rapidly maturing renewable energy technology that is poised to play an important role in future energy systems. The respective advances refer among others to the monopile foundation that is frequently used to support wind turbines in the marine environment. In the present research paper, the structural response of tall wind energy converters with various stiffening schemes is studied during the erection phase as the latter are manufactured in modules that are assembled in situ. Rings, vertical stiffeners, T-shaped stiffeners and orthogonal stiffeners are considered efficient stiffening schemes to strengthen the tower structures. The loading bearing capacity of offshore monopile wind turbine towers with the four types of stiffeners were modeled numerically by means of finite elements. Applying a nonlinear buckling analysis, the ultimate bearing capacity of wind turbine towers with four standard stiffening schemes were compared in order to obtain the optimum stiffening option.
1. Introduction
Wind energy already significantly contributes to the reduction of greenhouse negative effects while contributing to economic growth in many countries as a leading solution against climate change globally. Offshore wind energy has been developing rapidly in the world, whilst Europe as the leader in offshore wind energy has the potential to realize up to 3400 TWh of offshore wind energy within its waters in 2030 [1]. For offshore wind farms, the use of space is more flexible than that on land. Specifically, the installations are set up far from densely populated areas thus reducing the noise impact on the neighboring communities. Moreover, the large distance between offshore installations and towns reduces the visual impact on communities living on the coast. It is predicted that offshore wind industry is stepping forward into deeper waters, further away from the shore with bigger farms.
For offshore wind turbine towers, monopile is one of the most common design concepts for supporting structural system especially in shallow waters both commercially and technically, having the advantage of simple and straightforward manufacturing. In order to keep the monopile as thin as possible, the tower can be stiffened in different ways by various stiffening schemes to resist all possible loadings e.g., the wind, the current and the wave loadings in marine environments. Recently, a lot of studies have focused on the mechanical characteristics of tower structures under various loadings. Wang et al. [2] studied the effects of the foundation uplift due to seismic loading and shallow foundation by using a new dynamic Winkler model, and they concluded that the moment on the wind turbine tower is overestimated, whilst that on the shallow foundation is underestimated for great soil stiffness. Ko [3] proposed a simplified structural model for wind turbines with tapered towers based on Rayleigh’s method. It was found that the proposed model can be applicable to the scour monitoring for the foundation of offshore wind turbines. Li et al. [4] employed the inverse Finite Element Method to monitor the tower of an offshore wind turbine under both static and dynamic loading conditions. They compared the reference results with the monitored ones by using inverse Finite Element Method analysis. Sadoski et al. [5] reported a comprehensive analysis of the structural response of a 1.5-MW wind turbine steel tower modelled as a near-cylindrical shell structure under seismic loading with realistic axisymmetric weld depression imperfections and concluded that realistic imperfections had a significant effect on the intensities of ground accelerations at which damage initiates, as well as failure location. Jin and Xi [6] presented the structural impacts of the concrete towers with added engineered cementitious composite layers and performed durability analysis to compare the tower designs with and without engineered cementitious composite layers. They found that added engineered cementitious composite layers had the potential to completely remove mild reinforcement for cracking control due to engineered cementitious composites’ exceptional ductility and excellent cracking and fatigue resistance. Fu et al. [7] studied the fatigue reliability of the 1.5 MW wind tower flange and bolt and proposed for fatigue life prediction using a probability density curve based on the probability density evolution method to calculate the reliability of structure. Huo and Tong [8] explored the wind-induced fatigue analysis of the tubular tower by creating a wind-induced response model of wind turbine structures with different speeds and directions. They concluded that the effect of the blades rotating on the fatigue life analysis of the tubular towers is significant and the fatigue life can be decreased in the case of neglecting the influence of the wind direction and the low stress range on the fatigue damage of the tubular towers. Qiu et al. [9] compared the numerical and experimental results to measure intact steel wind turbine towers with different damage locations and different damage degrees. Abraham et al. [10] assessed the influence of nacelle and tower generated flow structures on the near-wake of an operational 2.5 MW wind turbine.
For wind turbine towers, stiffening schemes can be employed to strengthen the tubular towers. Several researchers studied this research topic and proposed various methods to strength the tower structure in order to either decrease the cost of the tower or improve its structural response. Stavridou et al. [11] examined ring stiffeners and vertical stiffening schemes to eliminate the presence of short wavelength buckles of the tower due to bending. Gkantou et al. [12] performed the life cycle assessment of tall hybrid onshore steel wind turbine towers. Yadav and Gerasimidis [13] compared the wavy tower cylinder tower to make a more efficient design and concluded that the sensitivity of these towers is very small compared to that of the circular towers. Koulatsou et al. [14] worked on the optimization of weight reduction of wind turbine towers that satisfy the resonance and buckling criteria and meet the requirement of fabrication, transportation and erection. They concluded that their presented approach is applicable for weight optimization of wind turbine towers. O’Leary et al. [15] studied a mass optimized composite tower design for the national renewable energy laboratory 5 MW reference wind turbine and the application of lightweight fiber reinforced composite materials in the construction of offshore wind turbine support structures; it was found that a single wall composite tower resulted in lowest estimated costs. Dimopoulos and Gantes [16] studied the efficacy of various stiffeners of the wind turbine tower with a manhole cutout in the vicinity of the tower base. It was found that simple stiffening types consisting of either a peripheral frame or two vertical stringers and a ring were particularly efficient.
Tubular wind turbine towers are often employed as supporting structures to resist failure under external loadings; therefore, buckling analysis should be examined to explore their bearing capacity. Jay et al. [17] performed a program of flexural buckling tests of tapered circular steel wind towers with diameters between 0.7 and 1.1 m and maximum diameter-to-thickness ratios between 200 and 350 and concluded that location and orientation of the local buckling region were correlated with the spiral seam welds on the specimens. Alonso-Martinez et al. [18] investigated the reason that local flange failure of a tower led to collapse of the whole tower and concluded that the failure of the tower could be avoided if the material used in the flange could be subjected to the appropriate toughness test. Patil et al. [19] estimated the seismic performance of a typical wind turbine tower under a strong motion and found that yielding is the second most probable failure mechanism followed by development of permanent deformation and global buckling of the tower. Zuo et al. [20] evaluated the dynamic behavior of the NREL 5 MW wind turbine subjected to simultaneous aerodynamic and sea wave loadings. The yielding and buckling of the wind turbine tower could not occur when the wind speeds were within the cut-in and cut-out range in either the operating or parked conditions. Zhang et al. [21] studied the bearing capacity of offshore wind tower pile foundations under wind, current and wave loading including horizontal force, gravity and the moment on the top of the tower. They found that ultimate bearing capacity under horizontal force, vertical and bending loading increases with the increasing diameter–length ratio of the pile foundation. All the aforementioned studies focus on the bearing capacity and the buckling of the wind turbine system, however, they have not considered the buckling analysis and bearing capacities of the wind turbine towers during the critical erection phase. In the present study the bearing capacity of tubular wind turbine steel towers during the erection phase subjected to horizontal, vertical and bending loadings are investigated and the effect of various stiffening schemes in their ultimate bearing capacity in the marine environment is studied.
2. A Numerical Study
2.1. Validation of the Numerical Model
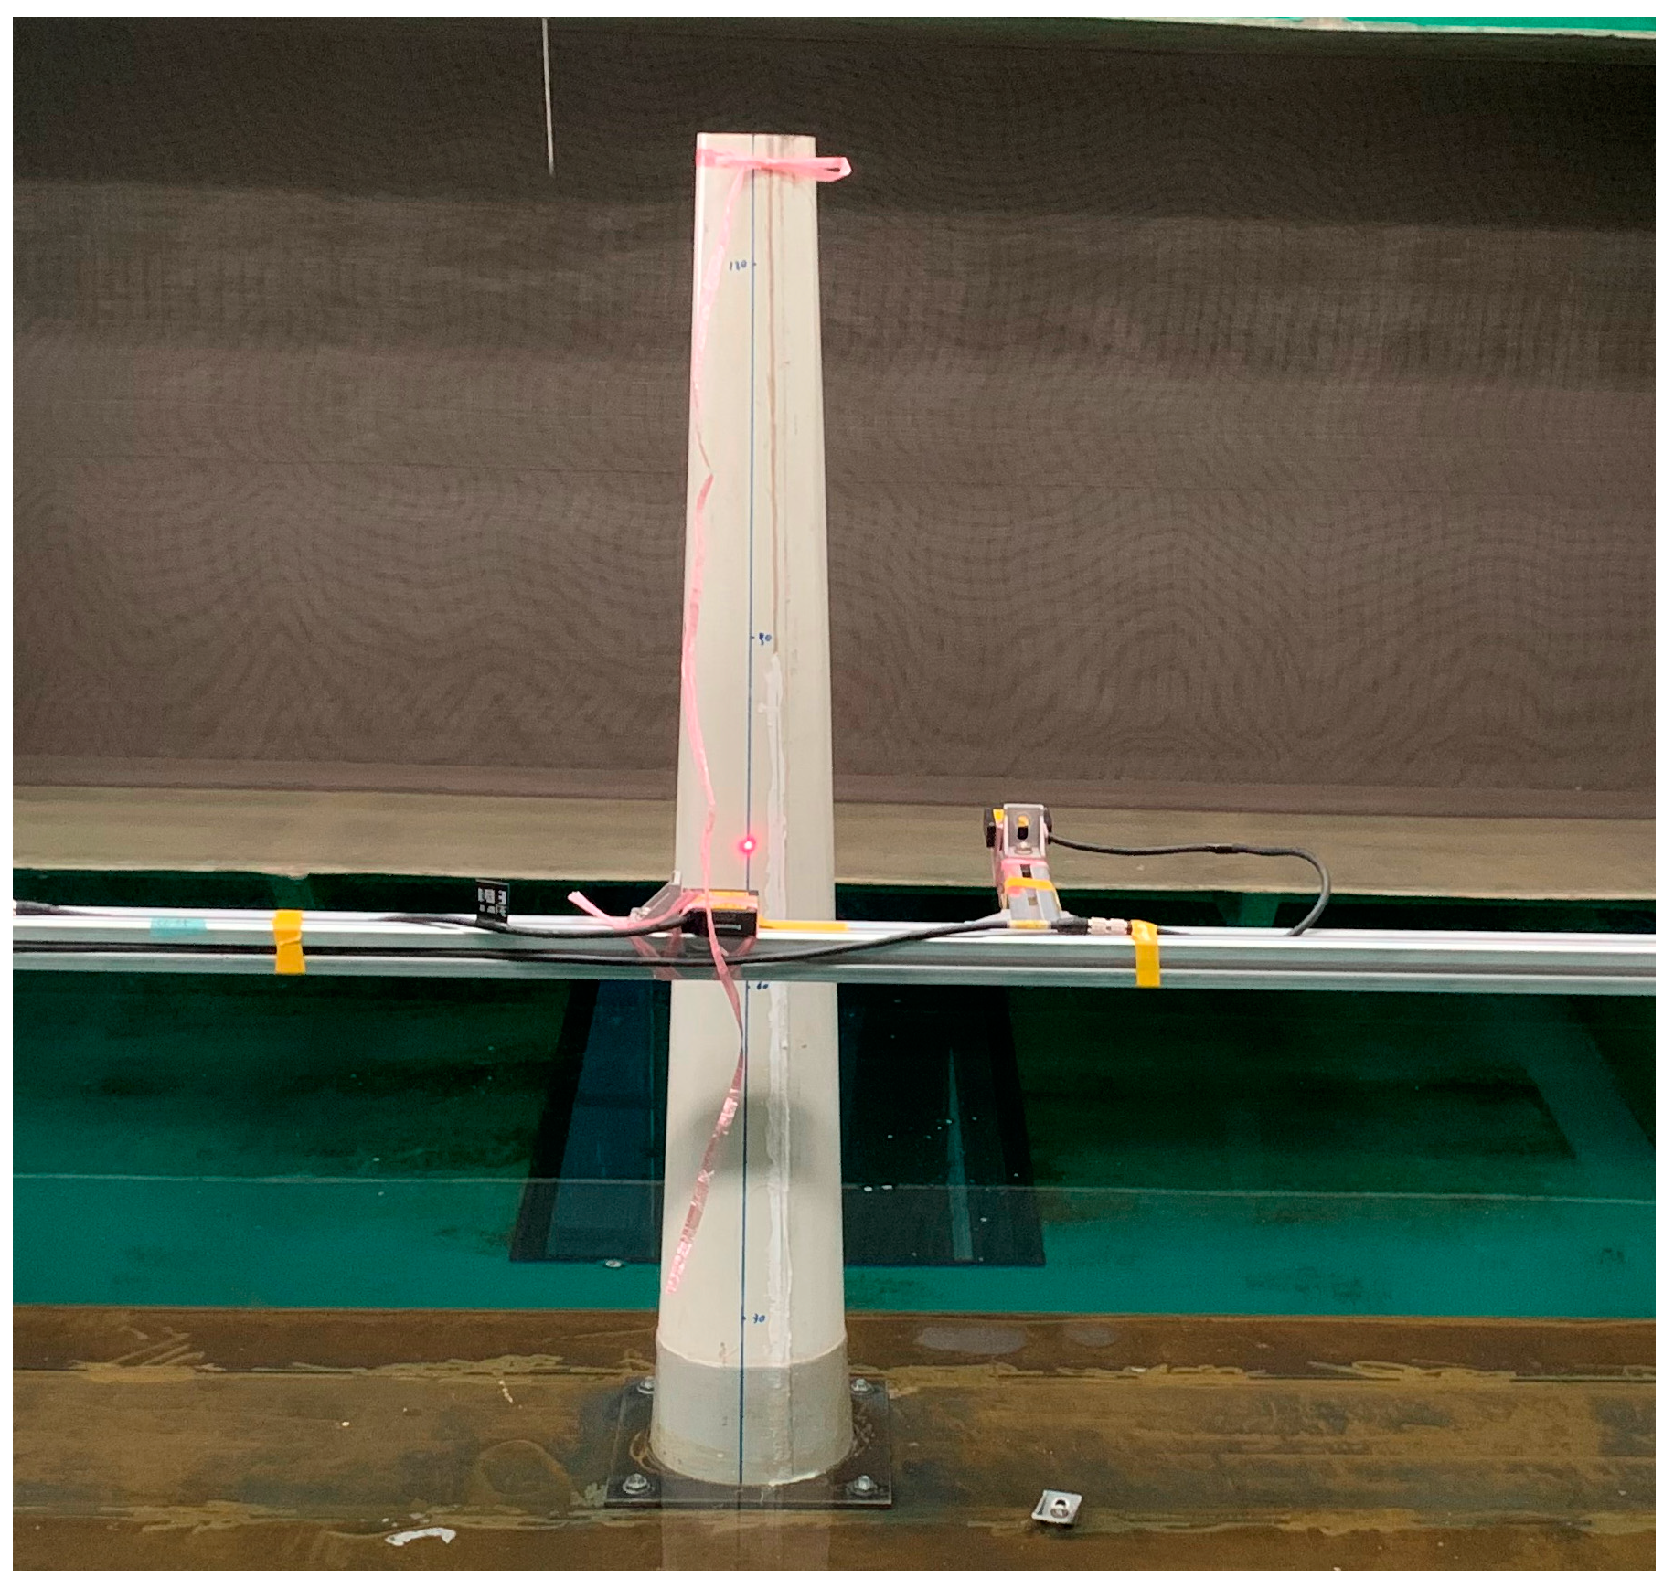
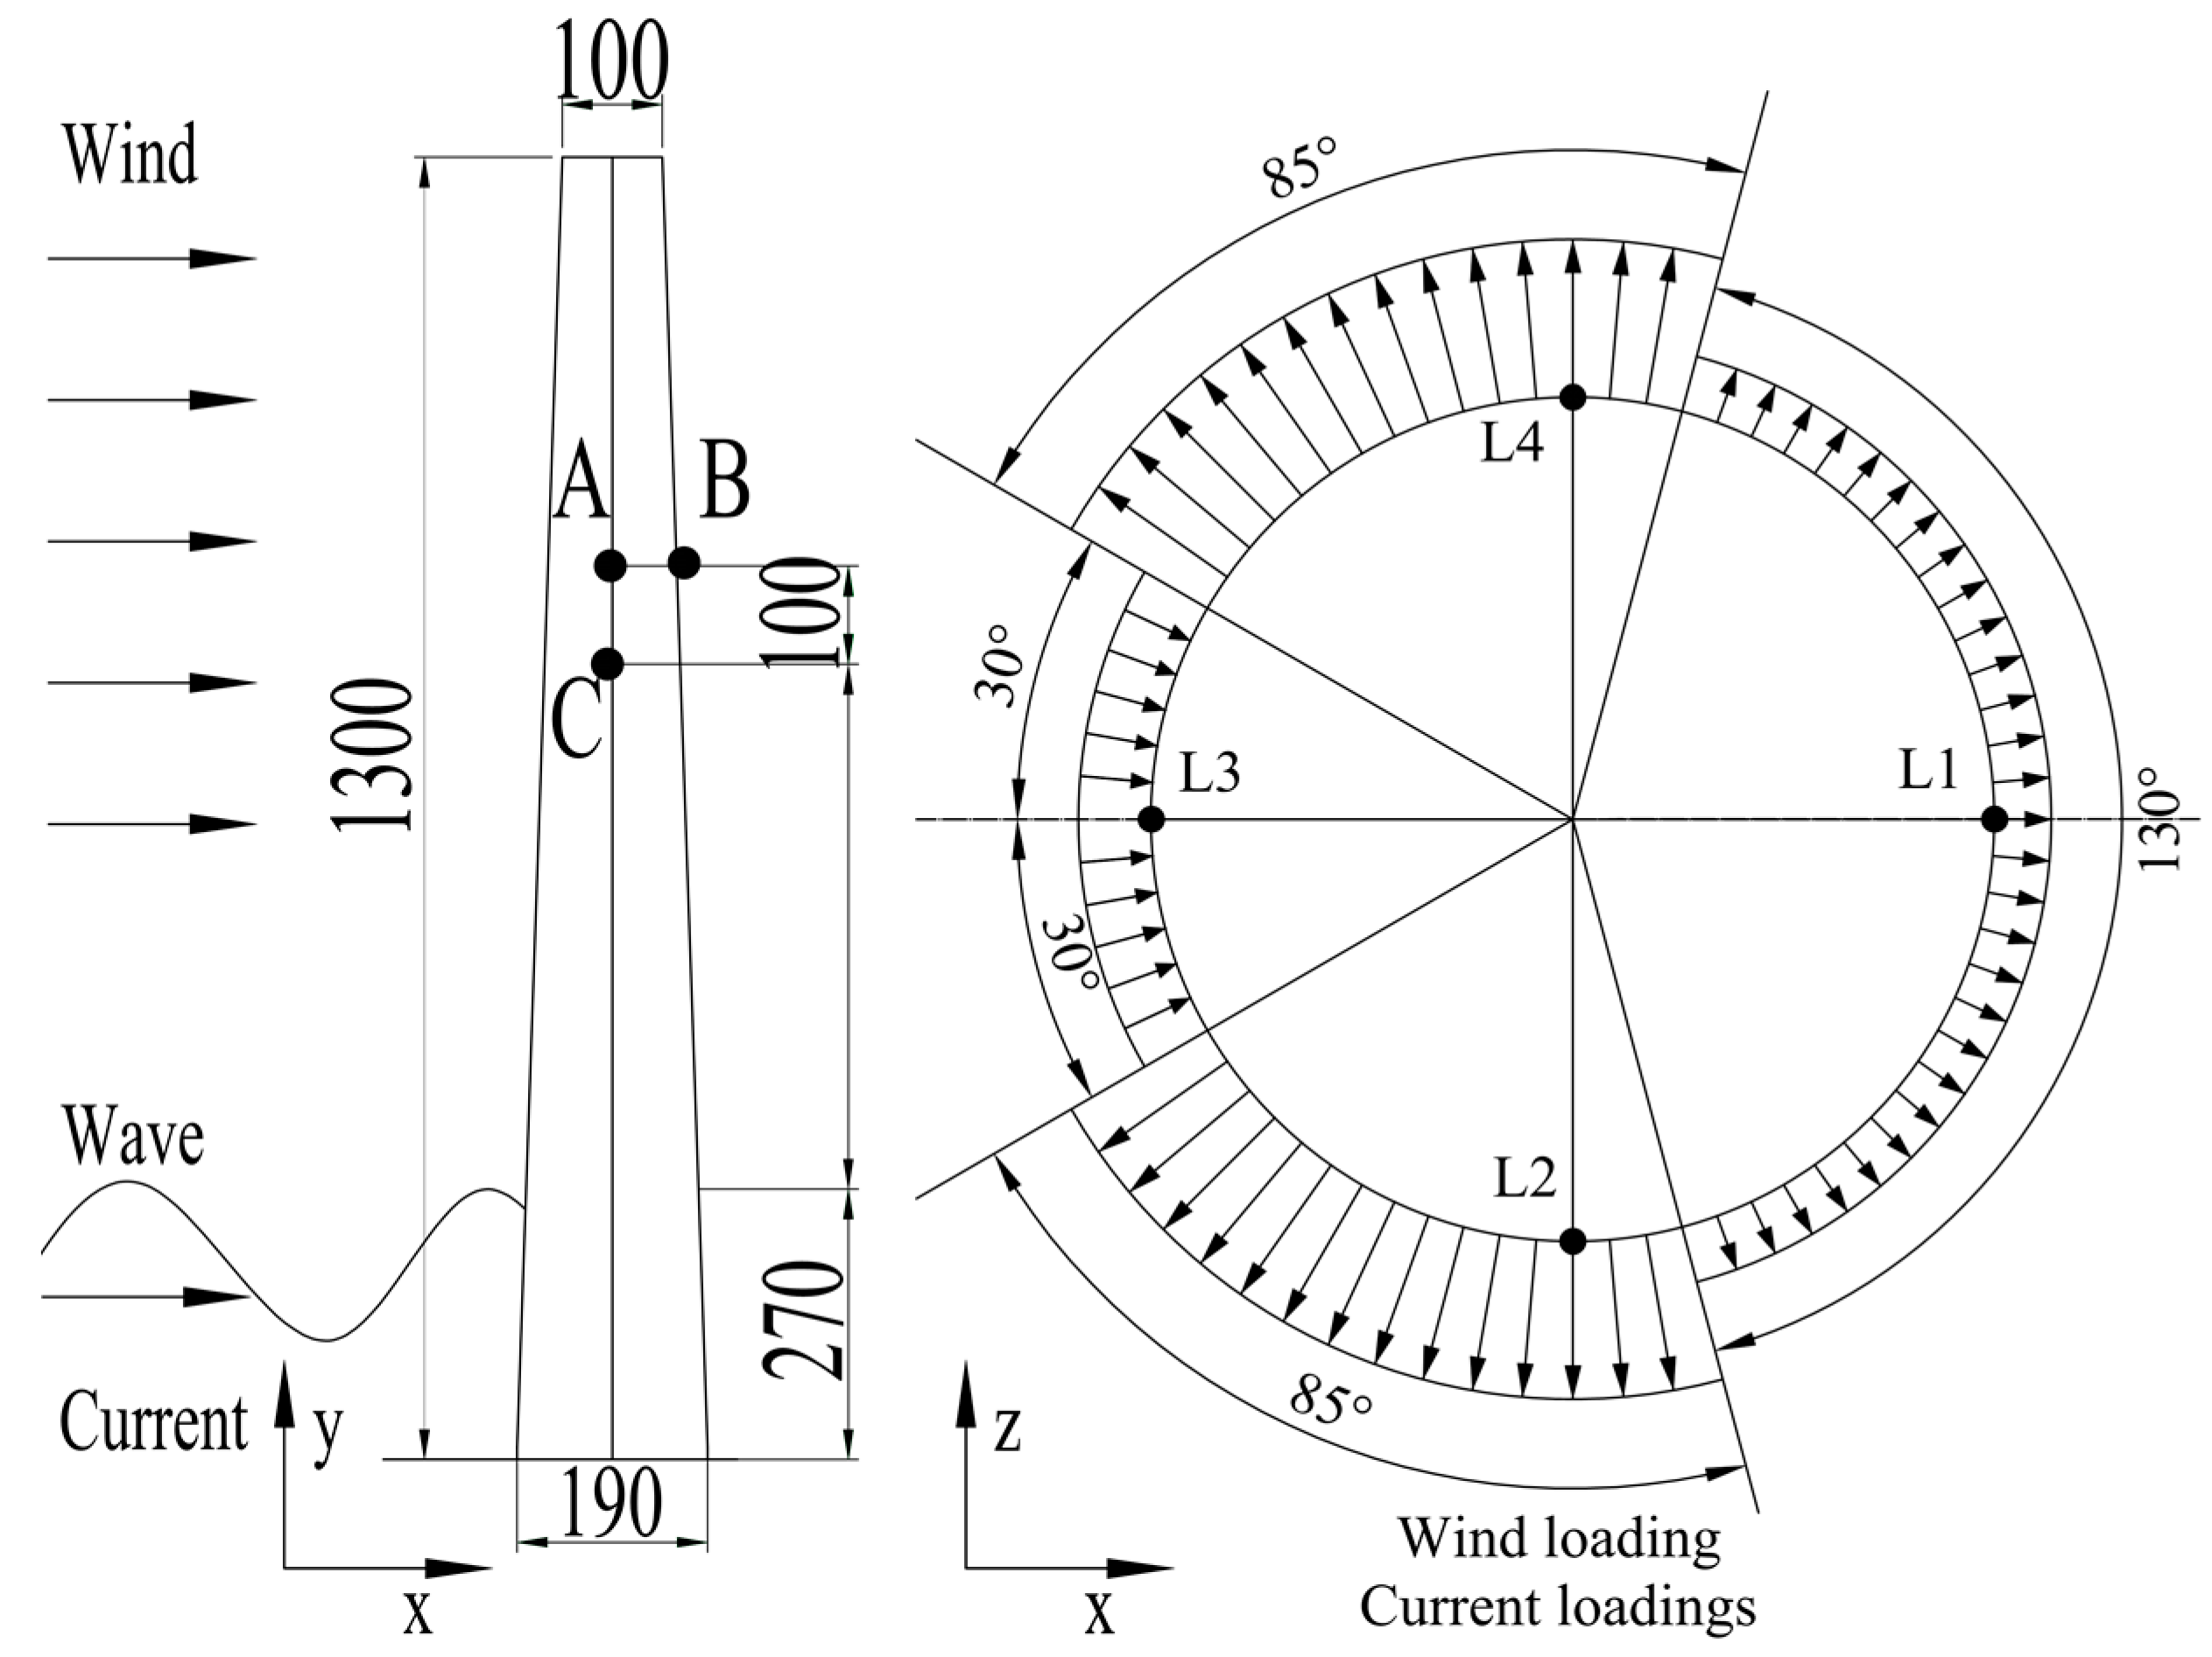
The experiment of the offshore scaled wind turbine tower under wind, current and wave loading was carried out as shown in Figure 1. During the loading state of 11 m/s wind speed, 0.3 m/s current speed, 0.5 s wave period and wave elevation 44 mm, the response of the tower was studied systematically. As a matter of fact, the corresponding wind pressure, current pressure and wave force were calculated by applying Equations (1) and (2). The tower being a cantilever fixed at its lower part was modelled using S4R shell elements by ABAQUS (ABAQUS Inc., Palo Alto, CA, USA) [22]. Steel quality of the tower was considered to be Q235 with density and elastic moduli, respectively, of 7.85 g/cm3 and 206 GPa, and a Poisson’s ratio of 0.3. In this model, according to the inventory data [23,24,25,26], the loading of wind and current around the circumference can be divided into four parts. The angles of the wind pressure and current pressure around the circumference were, respectively, decided to be 60°, 85°, 130° and 85° in these loading states as shown in Figure 2. For wind and current loading, this was considered to be pressure around the tower wall. As the wind tunnel can be set to create a uniform wind field at different wind speeds, in order to apply the wind pressure to the tower model, the Bernoulli equation is applied:
where P is the wind and the current pressure, ρ is the density of the fluid (the density of air and water are, respectively, 1.25 kg/m3 and 1000 kg/m3), and v is the speed of wind or current.
The wave loading was considered as a periodic sinusoidal pressure wave applied on the half section of the tower wall under the water level as shown in Figure 2. It can be obtained by the Morrison’s equation as the offshore wind turbine tower is a slender cylindrical structure fixed at the bottom of the sea. According to Morrison’s equation [25]
where the wave moves along the x-direction as shown in Figure 2, a and u is the acceleration and the velocity of undisturbed wave in the x-direction, respectively. CM and CD are, respectively, the mass coefficient and the drag coefficient for a smooth tubular section (respectively, 2.0 and 1.2 in the present experiment).
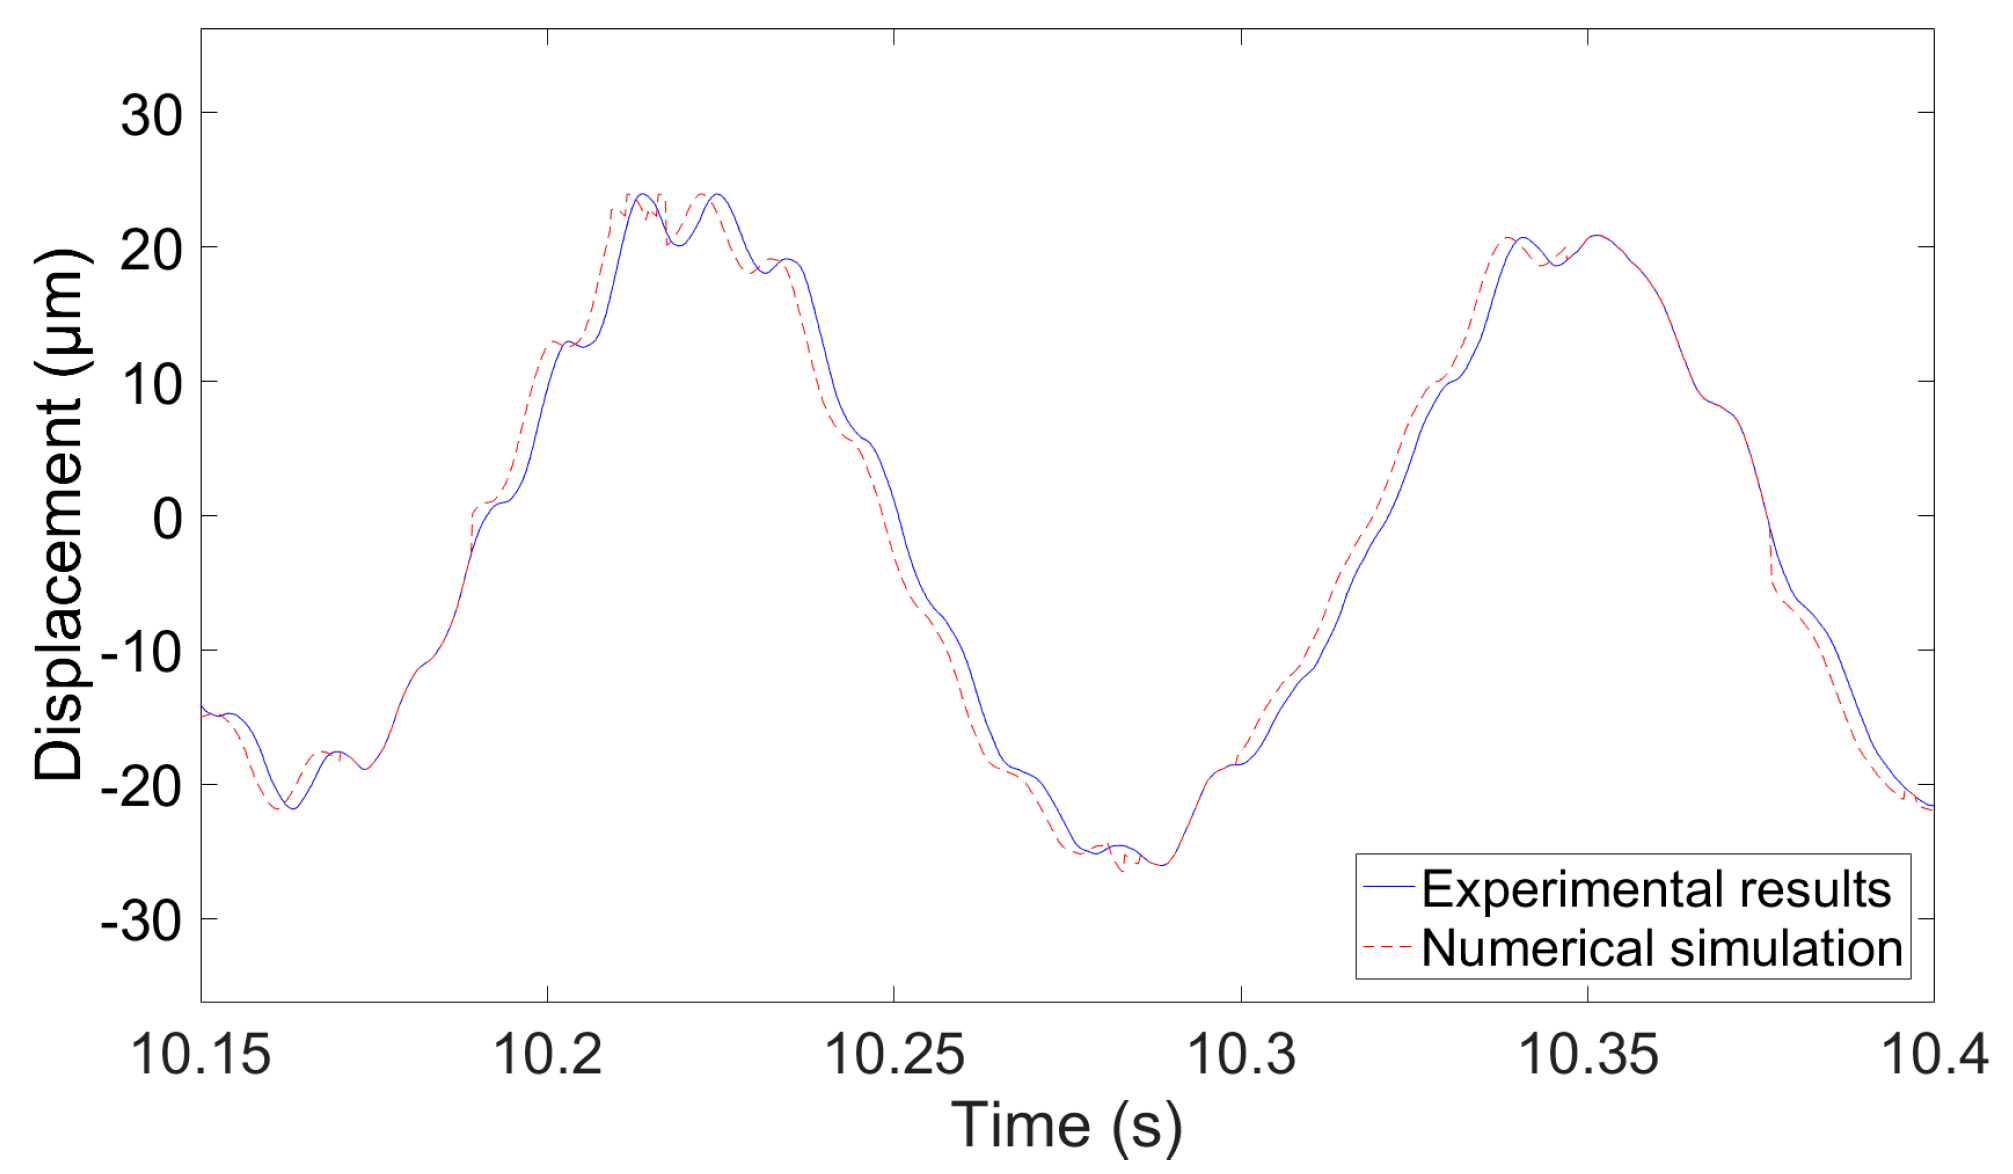
The displacement response at point C of the tower model under wind, current and wave loading were obtained by means of the numerical model in the case of the loading state of a wind speed of 11 m/s, current speed of 0.3 m/s, wave periods of 0.5 s and a wave elevation of 44 mm. In Figure 3 the experimental and numerical results of the displacement of the tower model at point C are displayed, exhibiting a good agreement between numerical and experimental values [27]. Therefore, the numerical model was employed for the analysis of the offshore wind turbine tower under investigation.
2.2. Effect of Direction Angles between Wind and Current
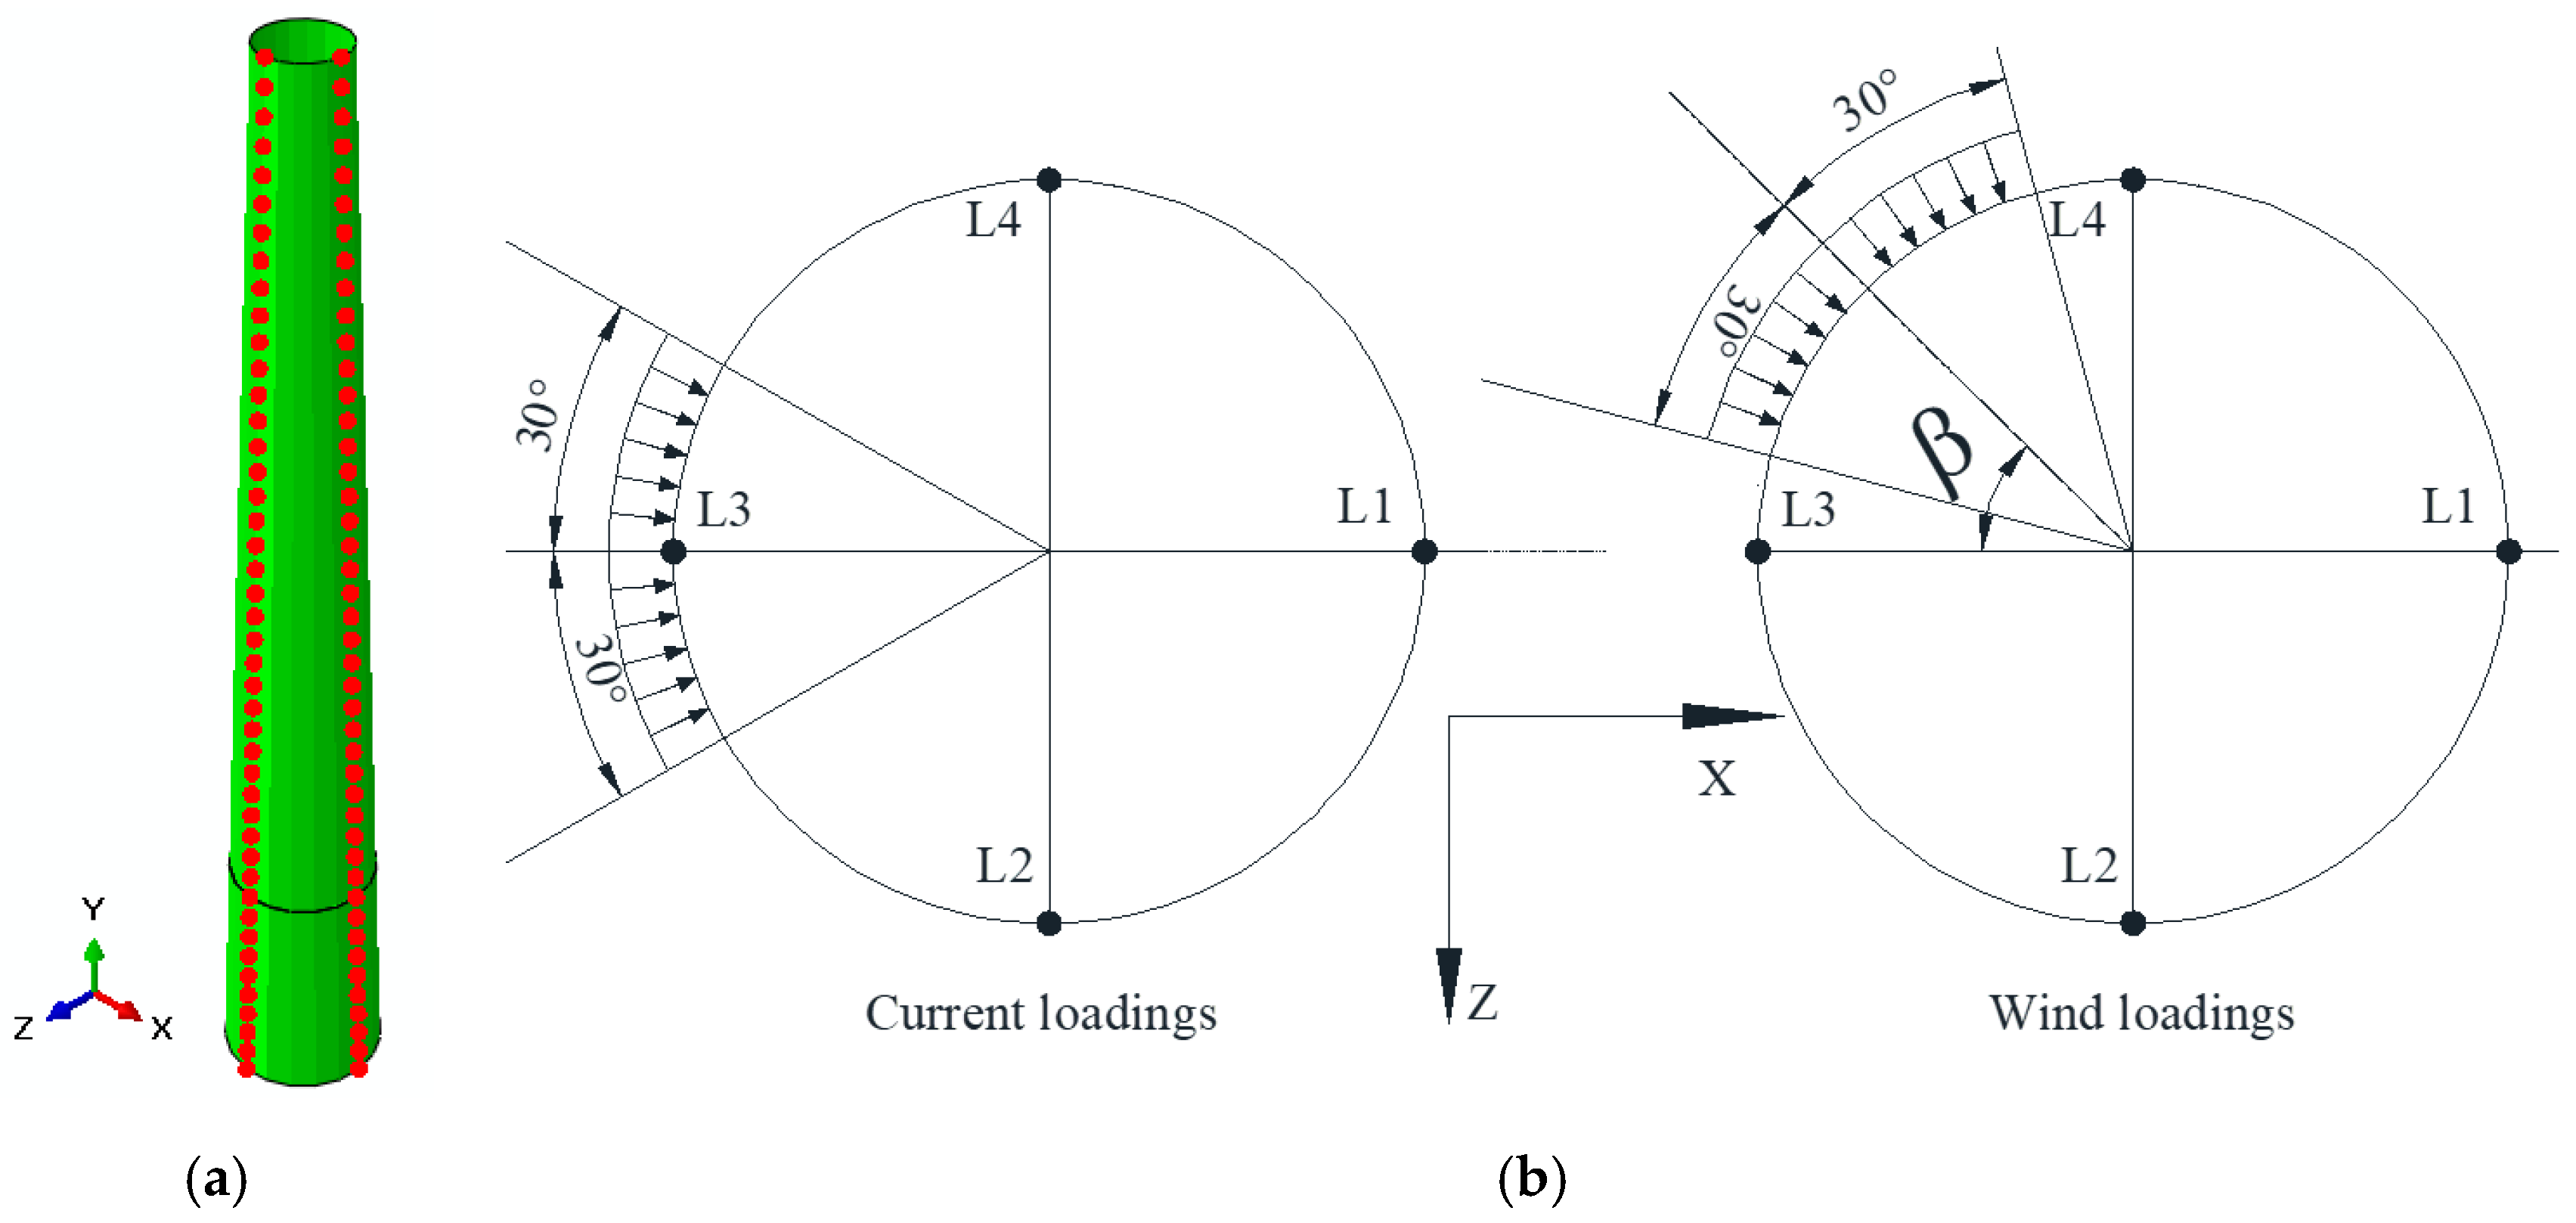
As a matter of fact, in the laboratory only wind, current and wave loading along the same direction can be provided. However, in practice there are different angles among the wind, current and wave direction in the marine environment. Therefore, an advanced numerical model can be employed to study the effect of direction angles between wind and current on the structural responses of the wind turbine tower during the erection phase in the sea. Figure 4 depicts the four lines’ placement on the tower model and the direction angle β between wind and current. For the numerical model, four lines along the tower height are marked to study the effect of various direction angles between wind and current (Figure 4). The lines 1, 3 and 2, 4 are, respectively, obtained due to the orthogonality of the x–y plane, y–z plane and the tower wall as shown in Figure 4.
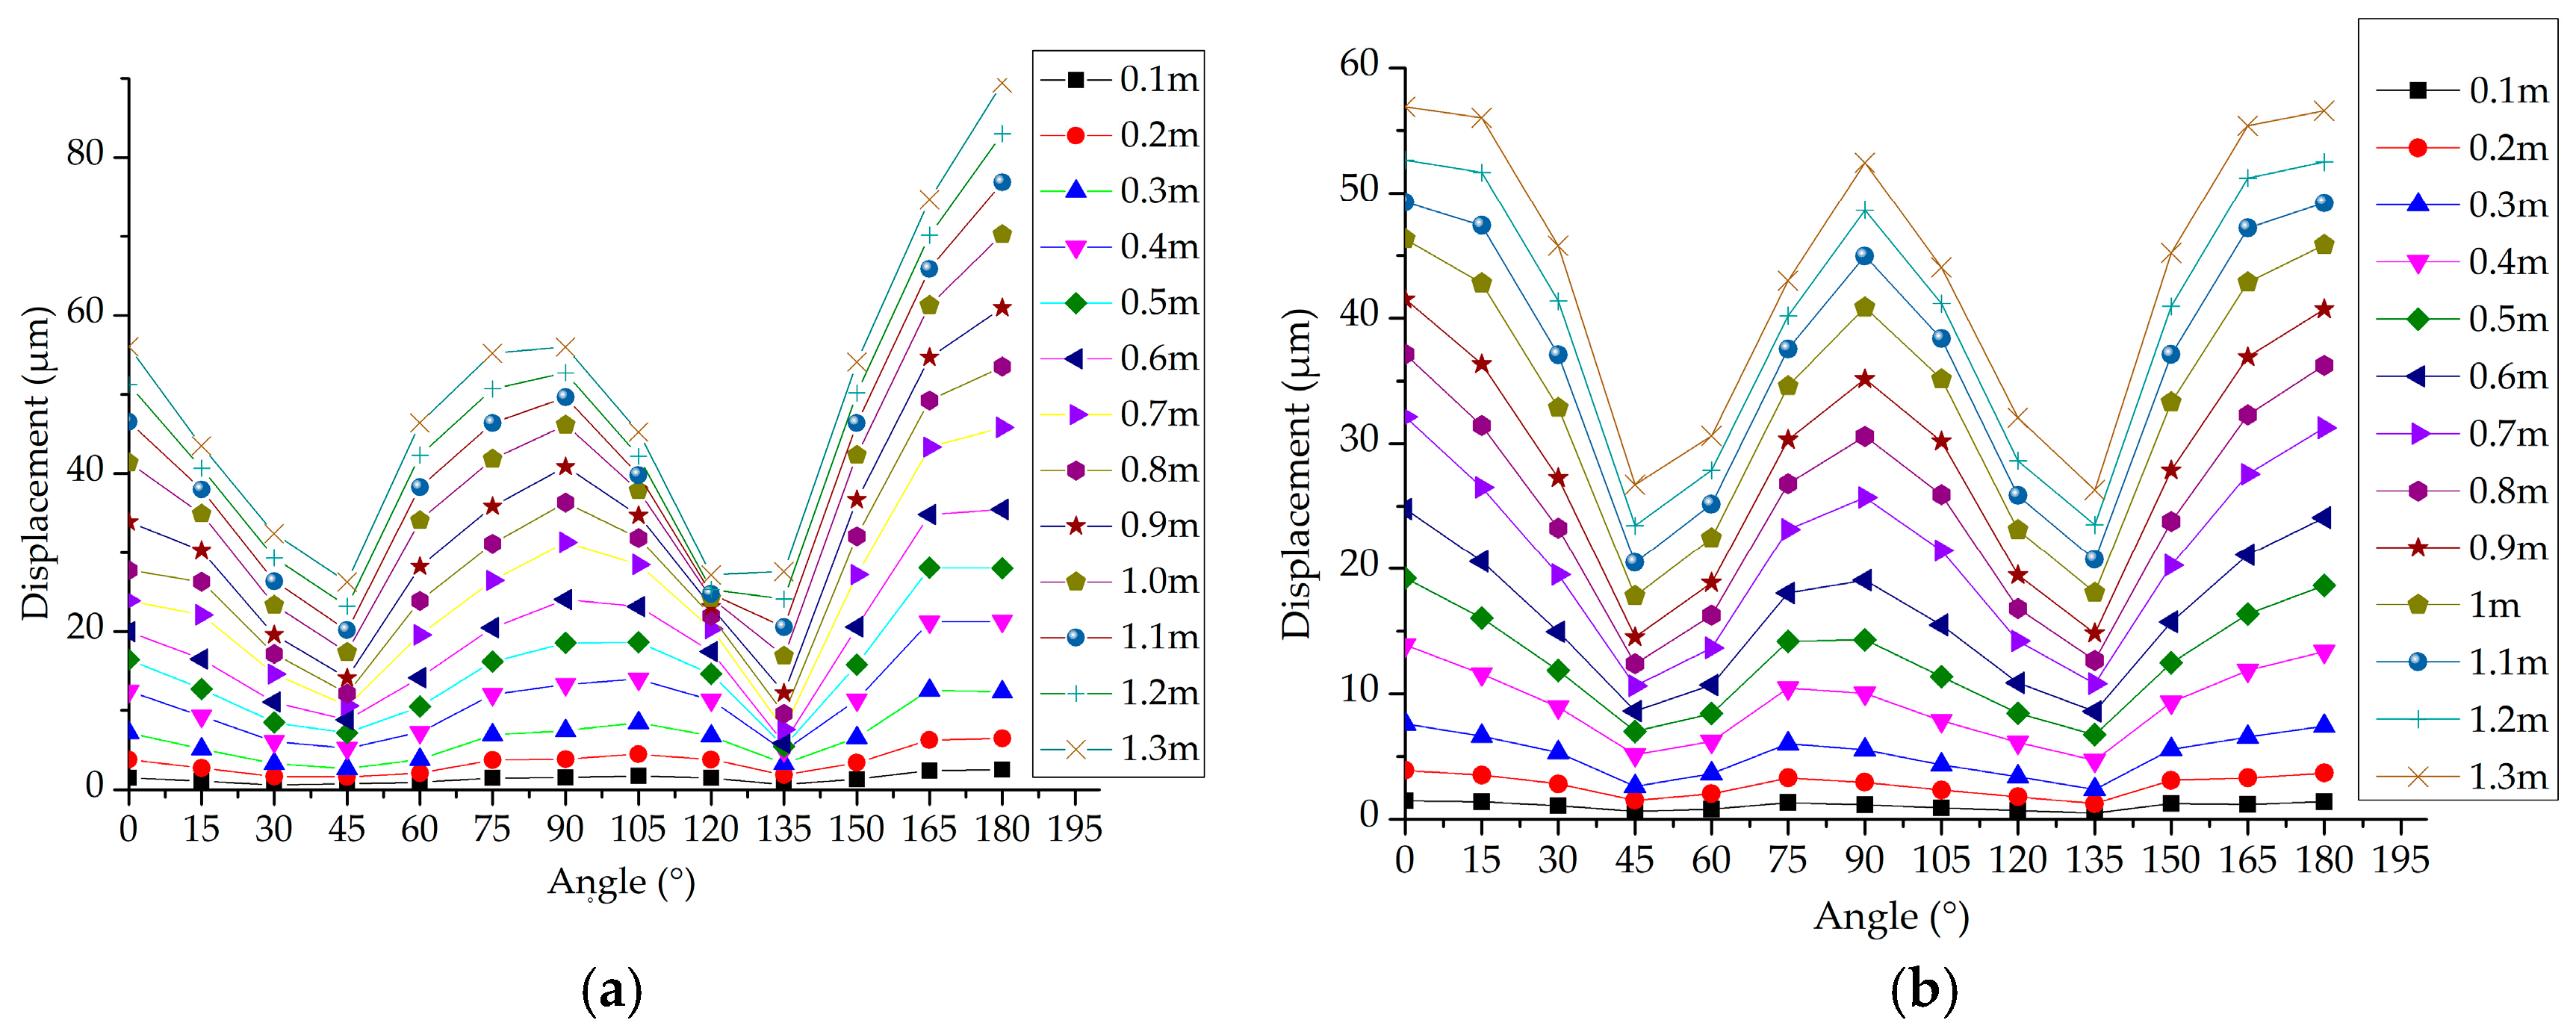
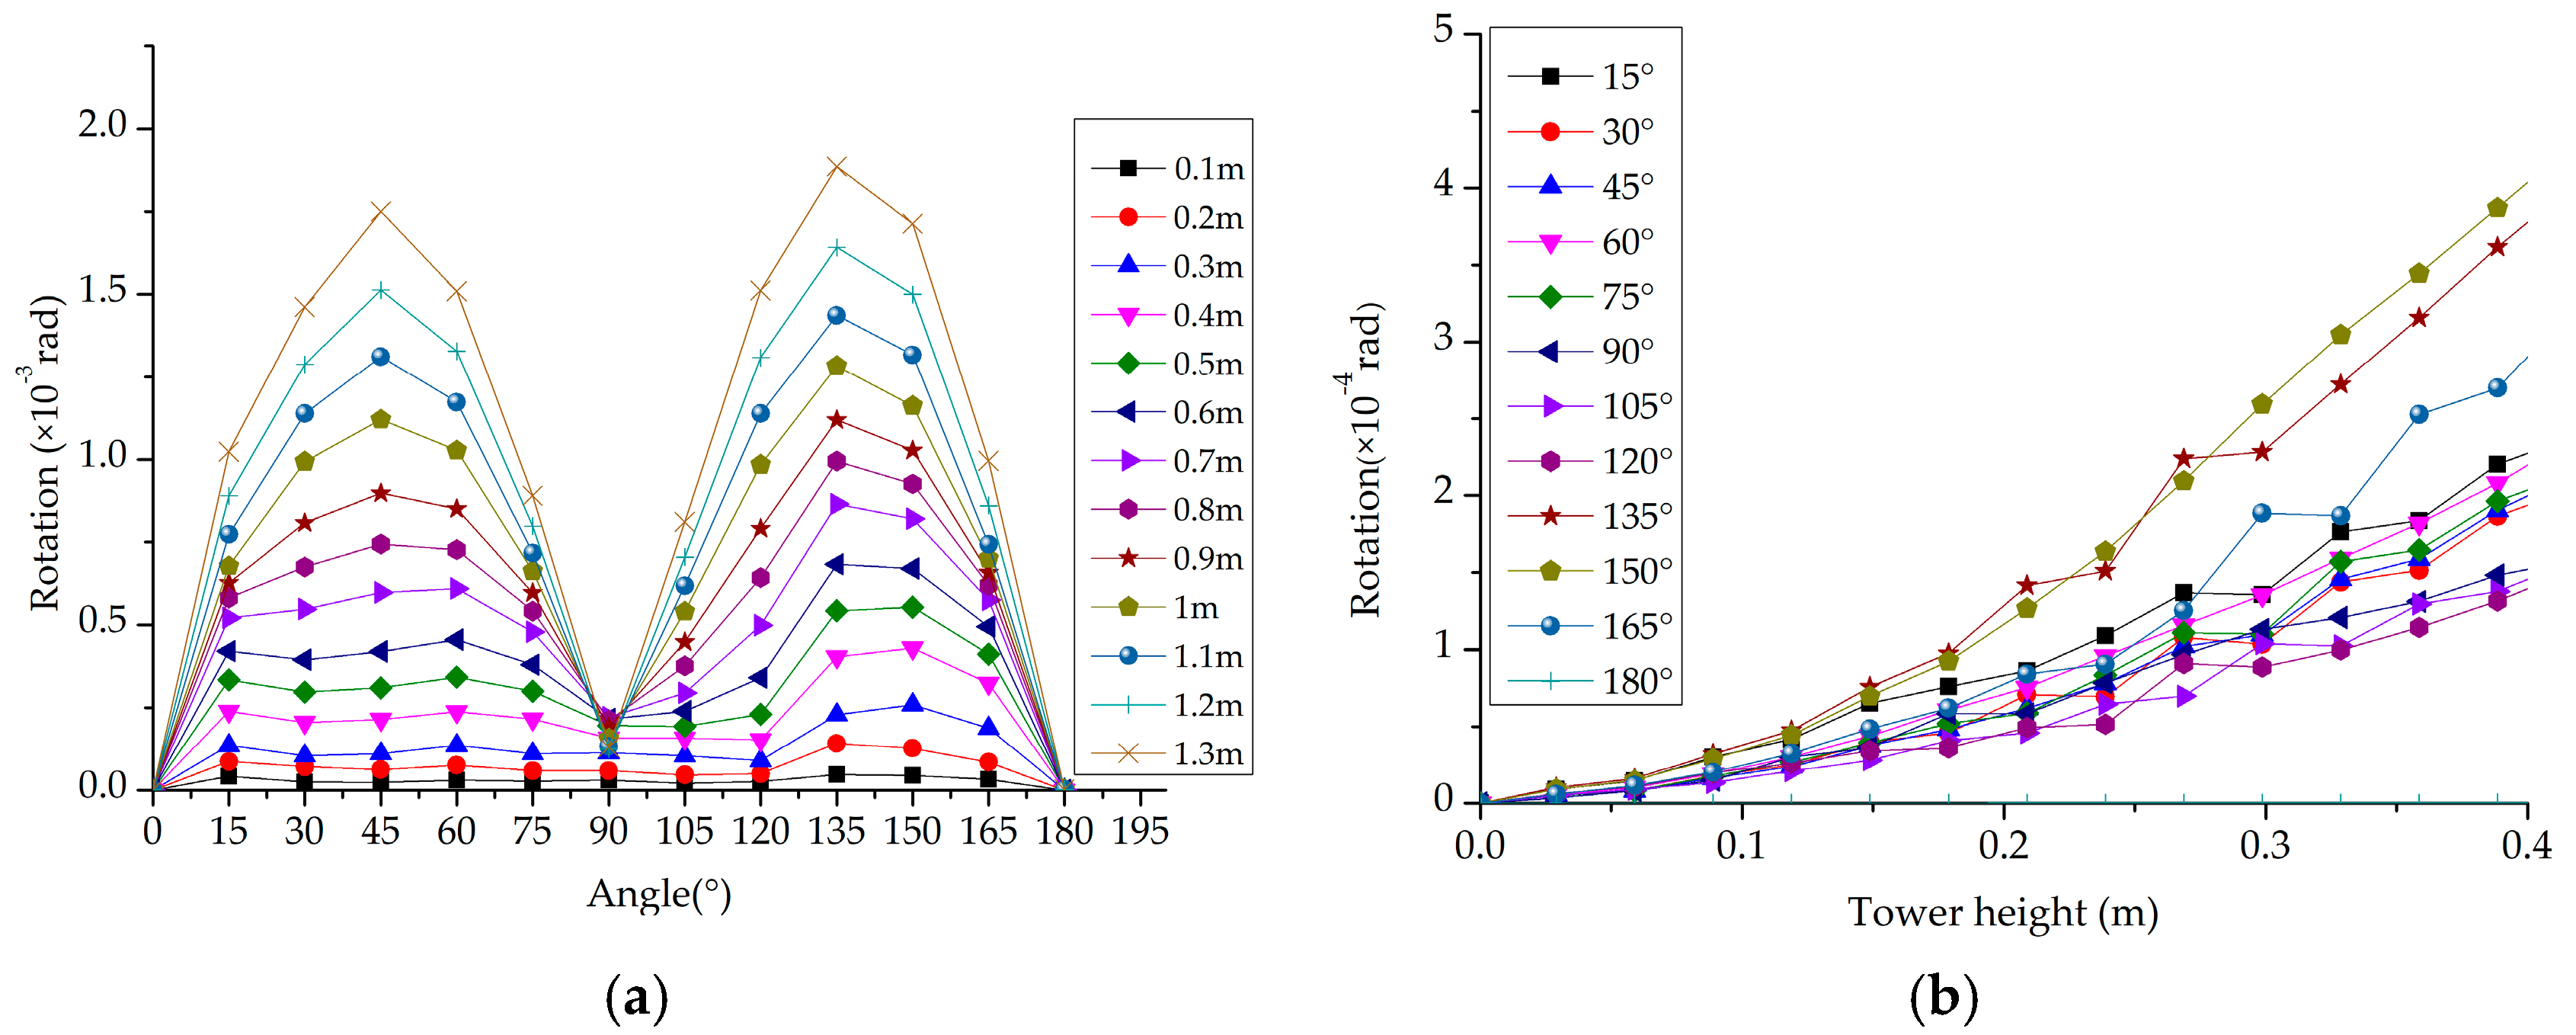
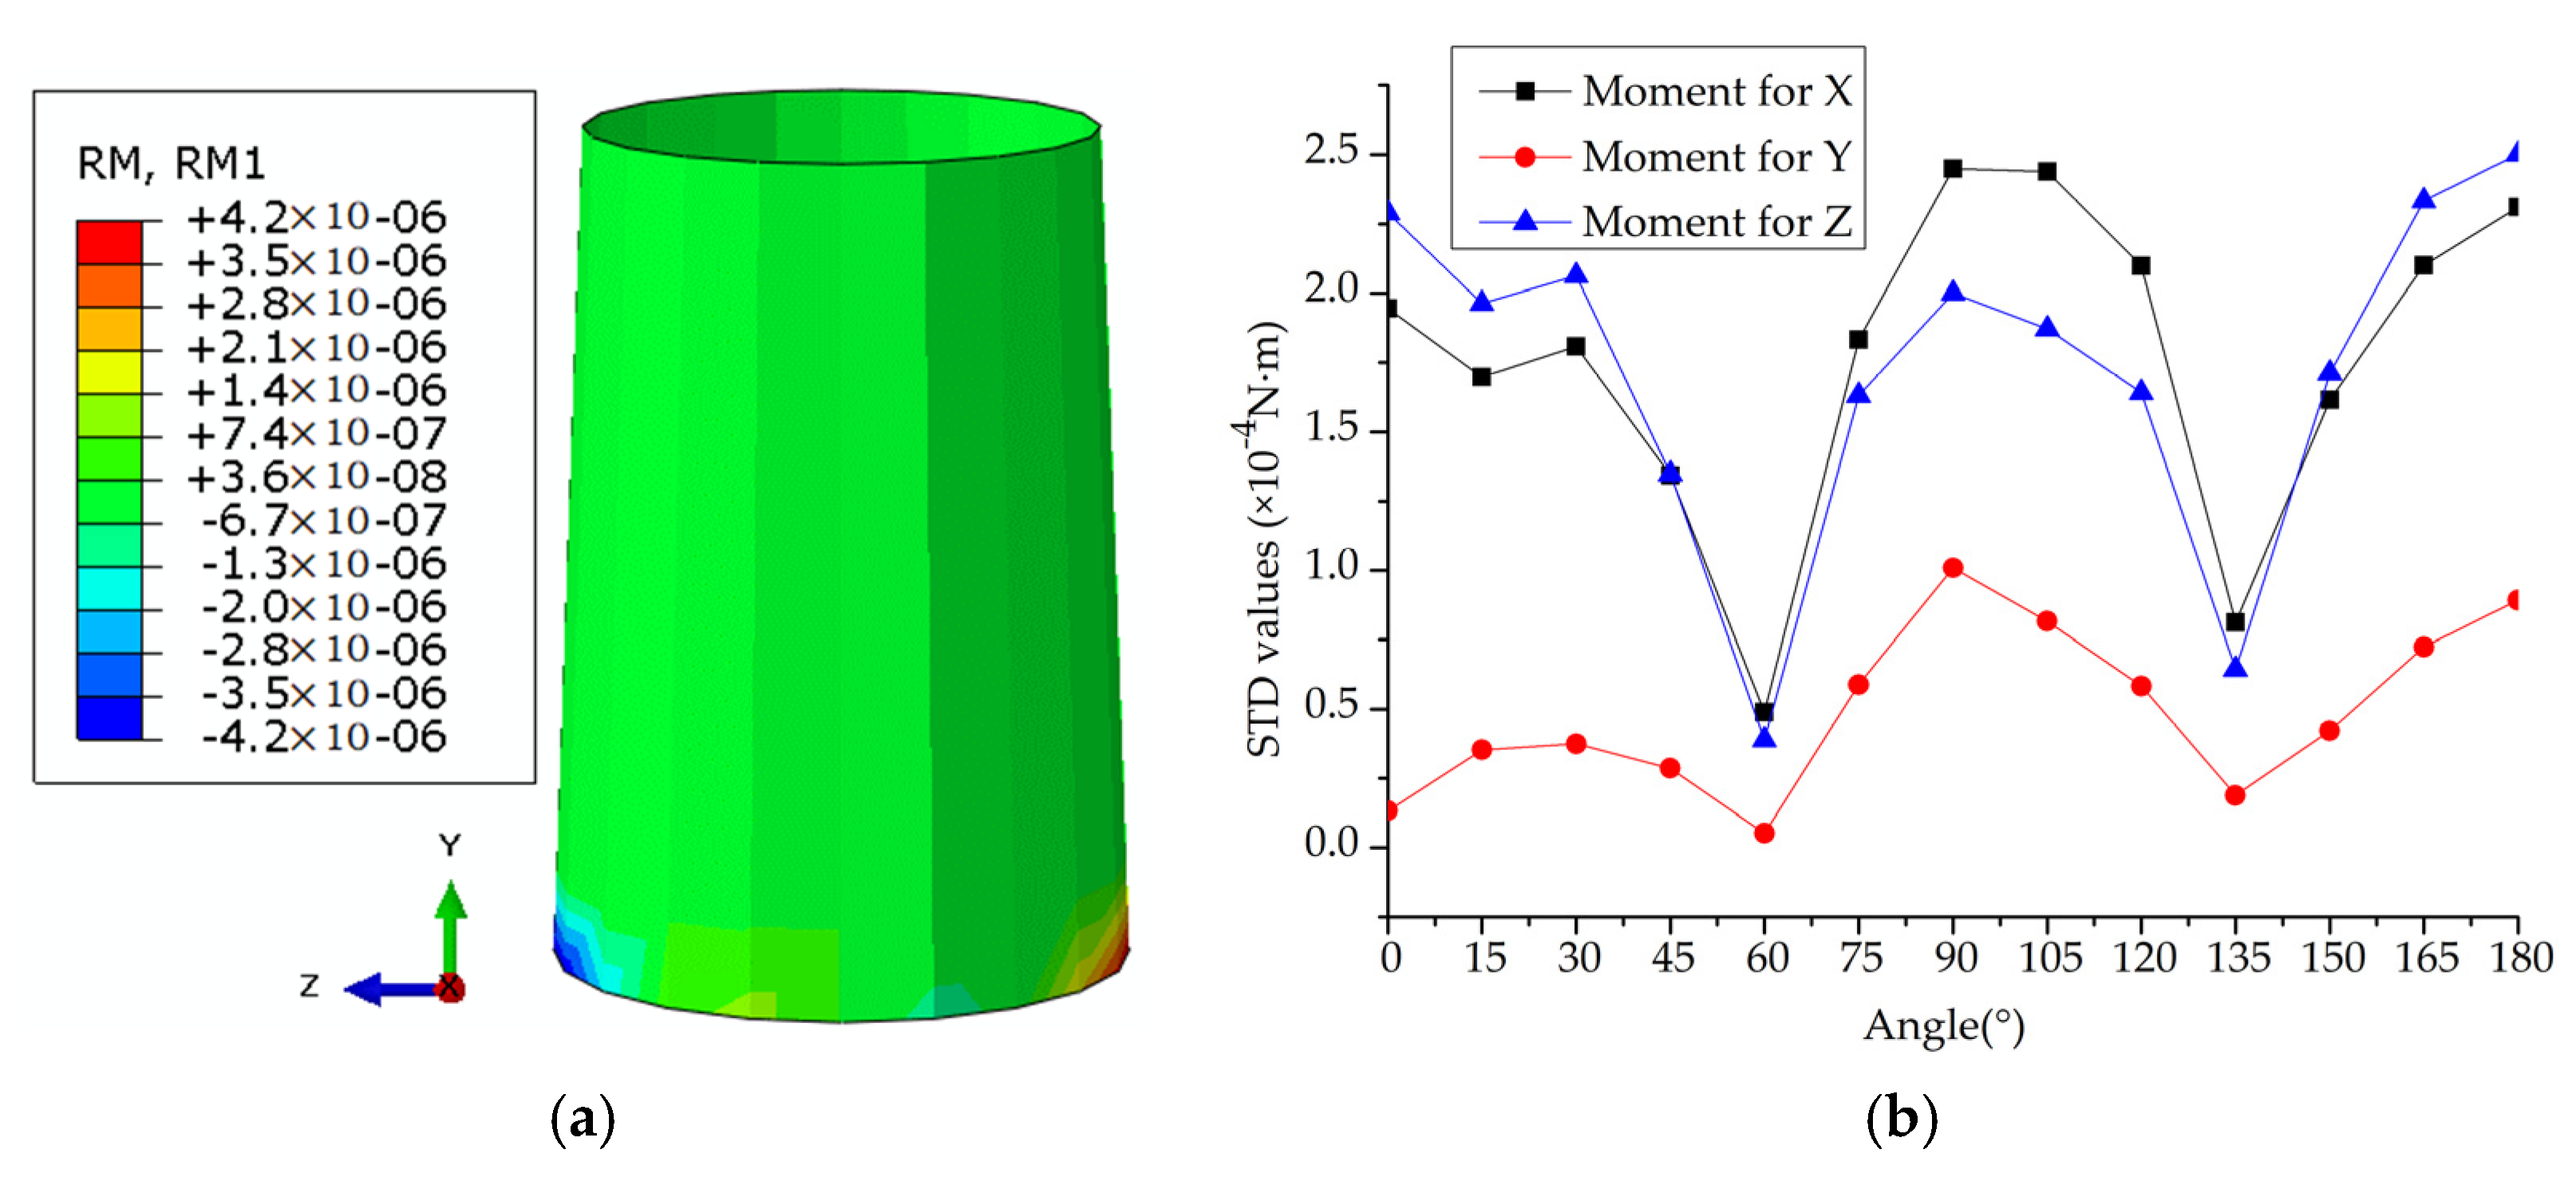
The angle β is defined as the angle between the wind center line and the water current center line around the circumference of the tower at hand. In this case, as the three direction angles between wind and current, wind and wave, current and wave are very mutually variable, to simplify the study of the effect of these direction angles among wind and current and wave, the current and wave are assumed to act in the same x-axis direction as shown in Figure 4 which means that the direction angle between current and wave is 0°. Therefore, in order to study the effects of direction angles between current and wave, respectively, the direction angle between wind and wave can be also assumed to be 0° in the same x-axis direction as shown in Figure 4. In the sea states, wind speed is considered to be 11 m/s, current speed 0.3 m/s and wave period, 0.5 s with an elevation of 44 mm. Then, in order to study the effect of direction angles between wind and current/wave, the direction angle β is considered to range between 0° and 180°, with each increment being 15°. Displacement and rotation of each node in each loading state are obtained by means of the numerical model. The reaction moment at the tower base is also studied in each loading state. Figure 5 depicts the displacements of the tower under various direction angles for different tower heights of Line 1 and Line 2. The rotation of the tower model under various direction angles on Line 1 is displayed in Figure 6. When the direction of wind pressure is in line with or orthogonal to that of current pressure, the displacements of the tower in Lines 1, 2, 3 and 4 can reach peak values with the direction angle increase from 0° to 180°, whilst an opposite trend can be observed where the rotation of the tower for Line 1 is the lowest in the direction angles of 0°, 90° and 180°. The rotation of the tower model is maximized in the direction angles of 45° and 135° as shown in Figure 6a. According to Figure 6b, the rotation of the tower can increase with tower height increase, whereas the rotation of the tower model at each node of the finite element increases unstably from a 0.2 m height to one of 0.4 m as the tower is in the juncture area of wind and current and wave field and, therefore, the rotation of the tower in this juncture area occurs in a swaying manner. To study the effect of the direction angle on the reaction moment of the tower base, the reaction moment of each node of the finite element of the tower base under various loading states around the x-, y- and z-axes can be obtained. Figure 7 shows the contours and the standard deviation values of the reaction moment of the tower base around x-, y- and z-axes. According to Figure 7a, the reaction moments of the tower base exhibit positive and negative values. Therefore, when the stand deviations of the reaction moment under various loading states are greater, it can be seen that the values of the positive and negative reaction moment are spread out over a wider range according to the definition of the stand deviation, which means that the reaction moments around the x-axis and z-axis can reach a maximum under the direction angle of 0°, 90° and 180°. As the wind, current and wave mainly is parallel to the x-o-z plane, the reaction moment of the tower base around the y- axis is less than those of the tower base around the x- and z- axes. The reaction moment of the tower base around y-axis is maximized when the direction angle is 90° and 180° in accordance to Figure 7b.
2.3. Effect of Water Depth
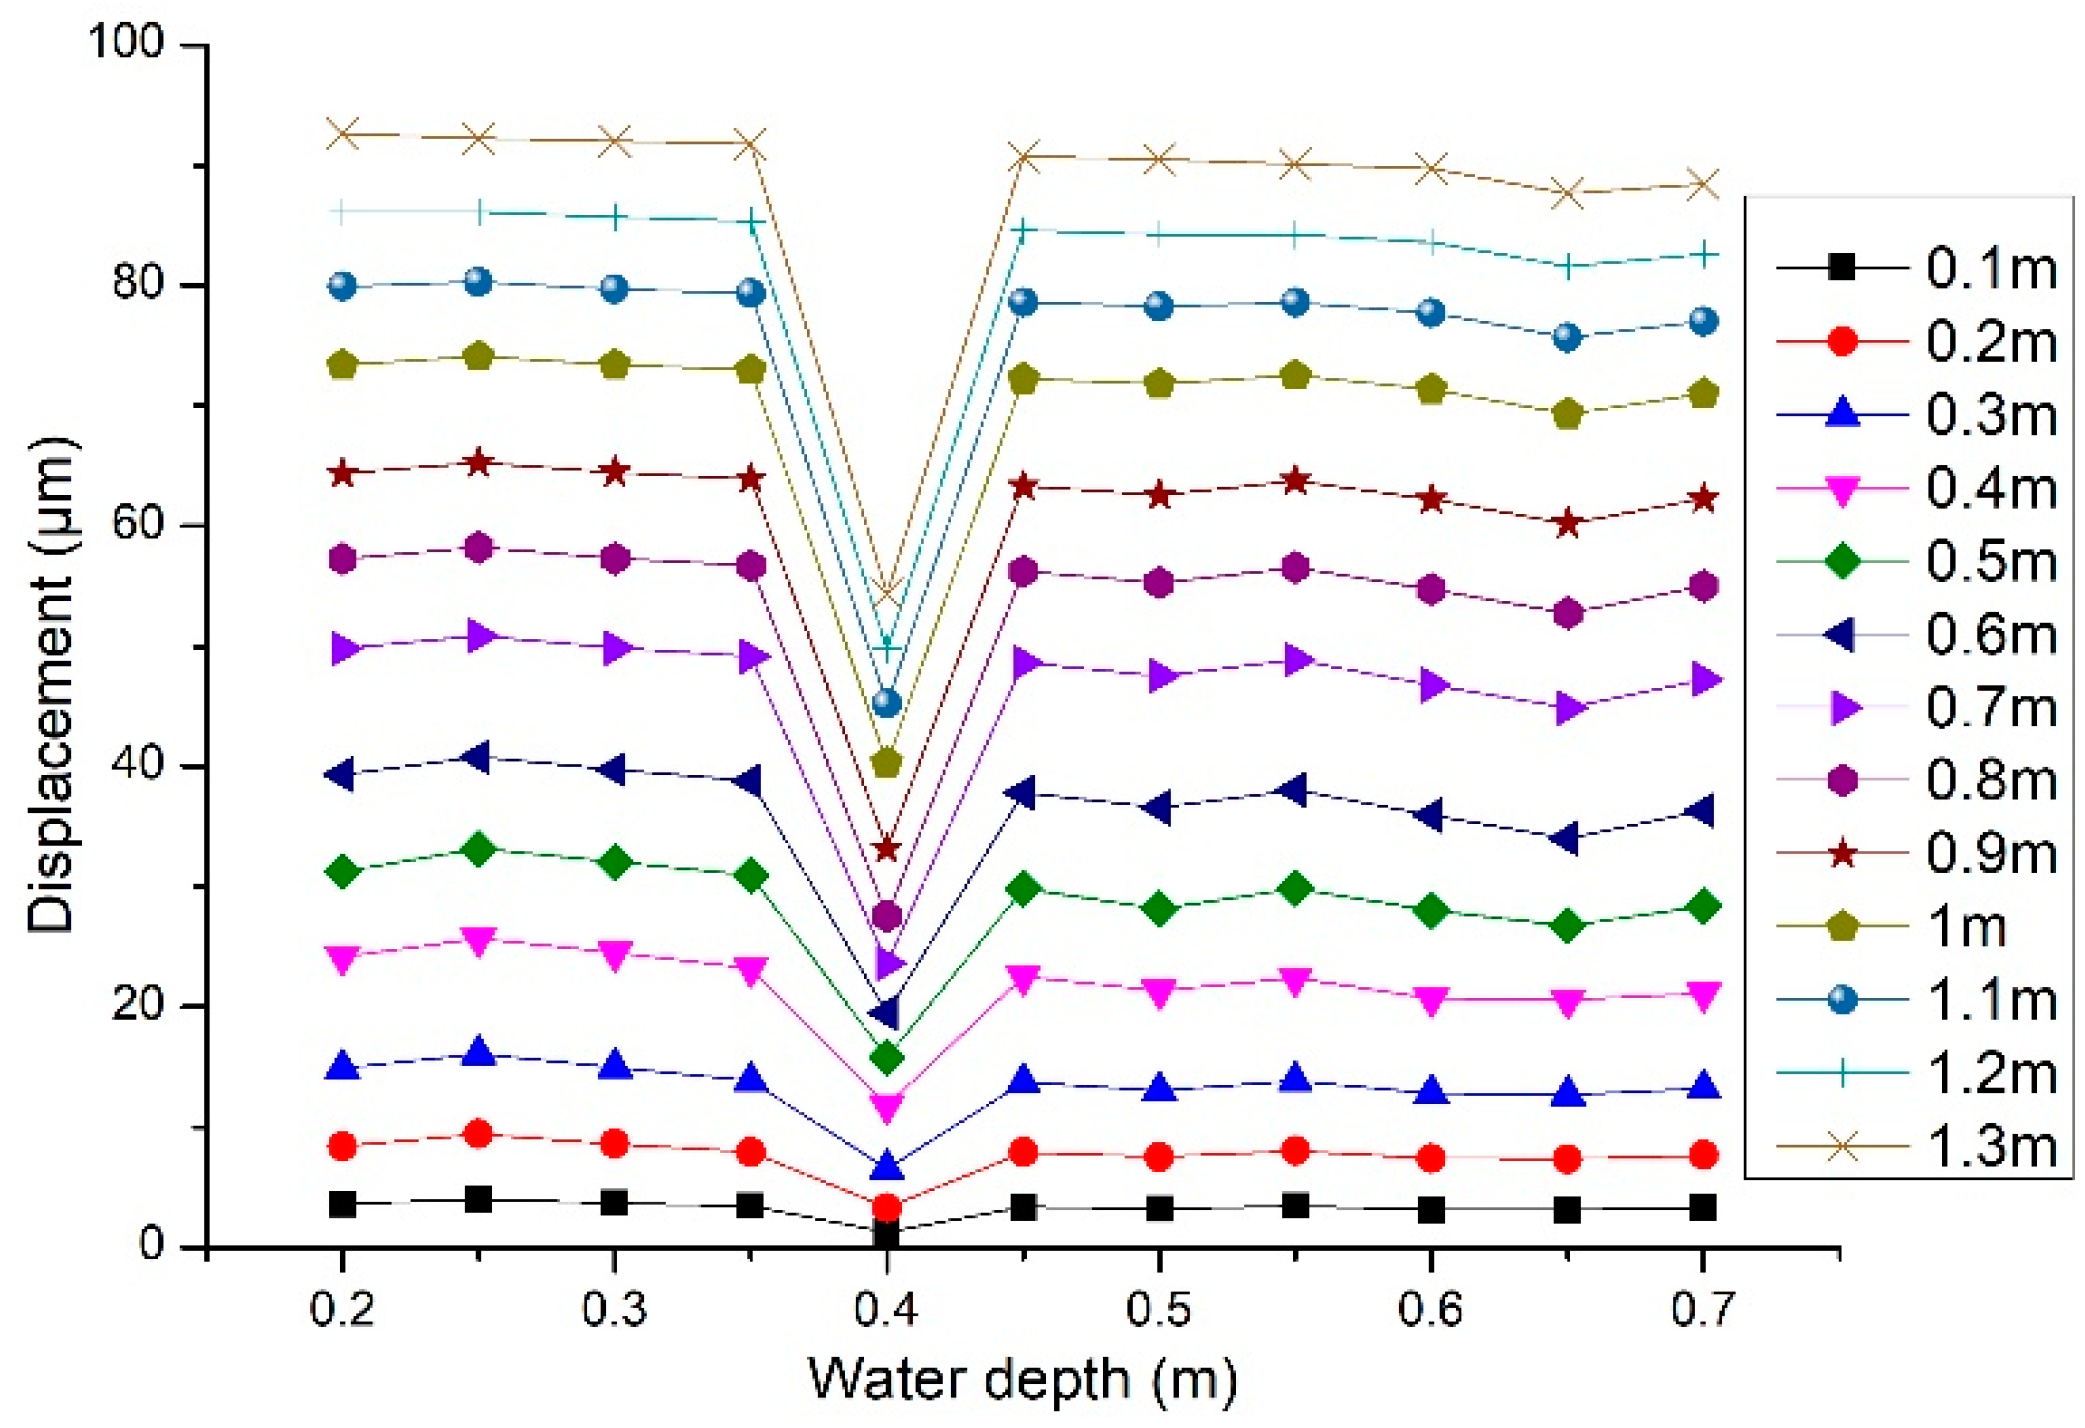
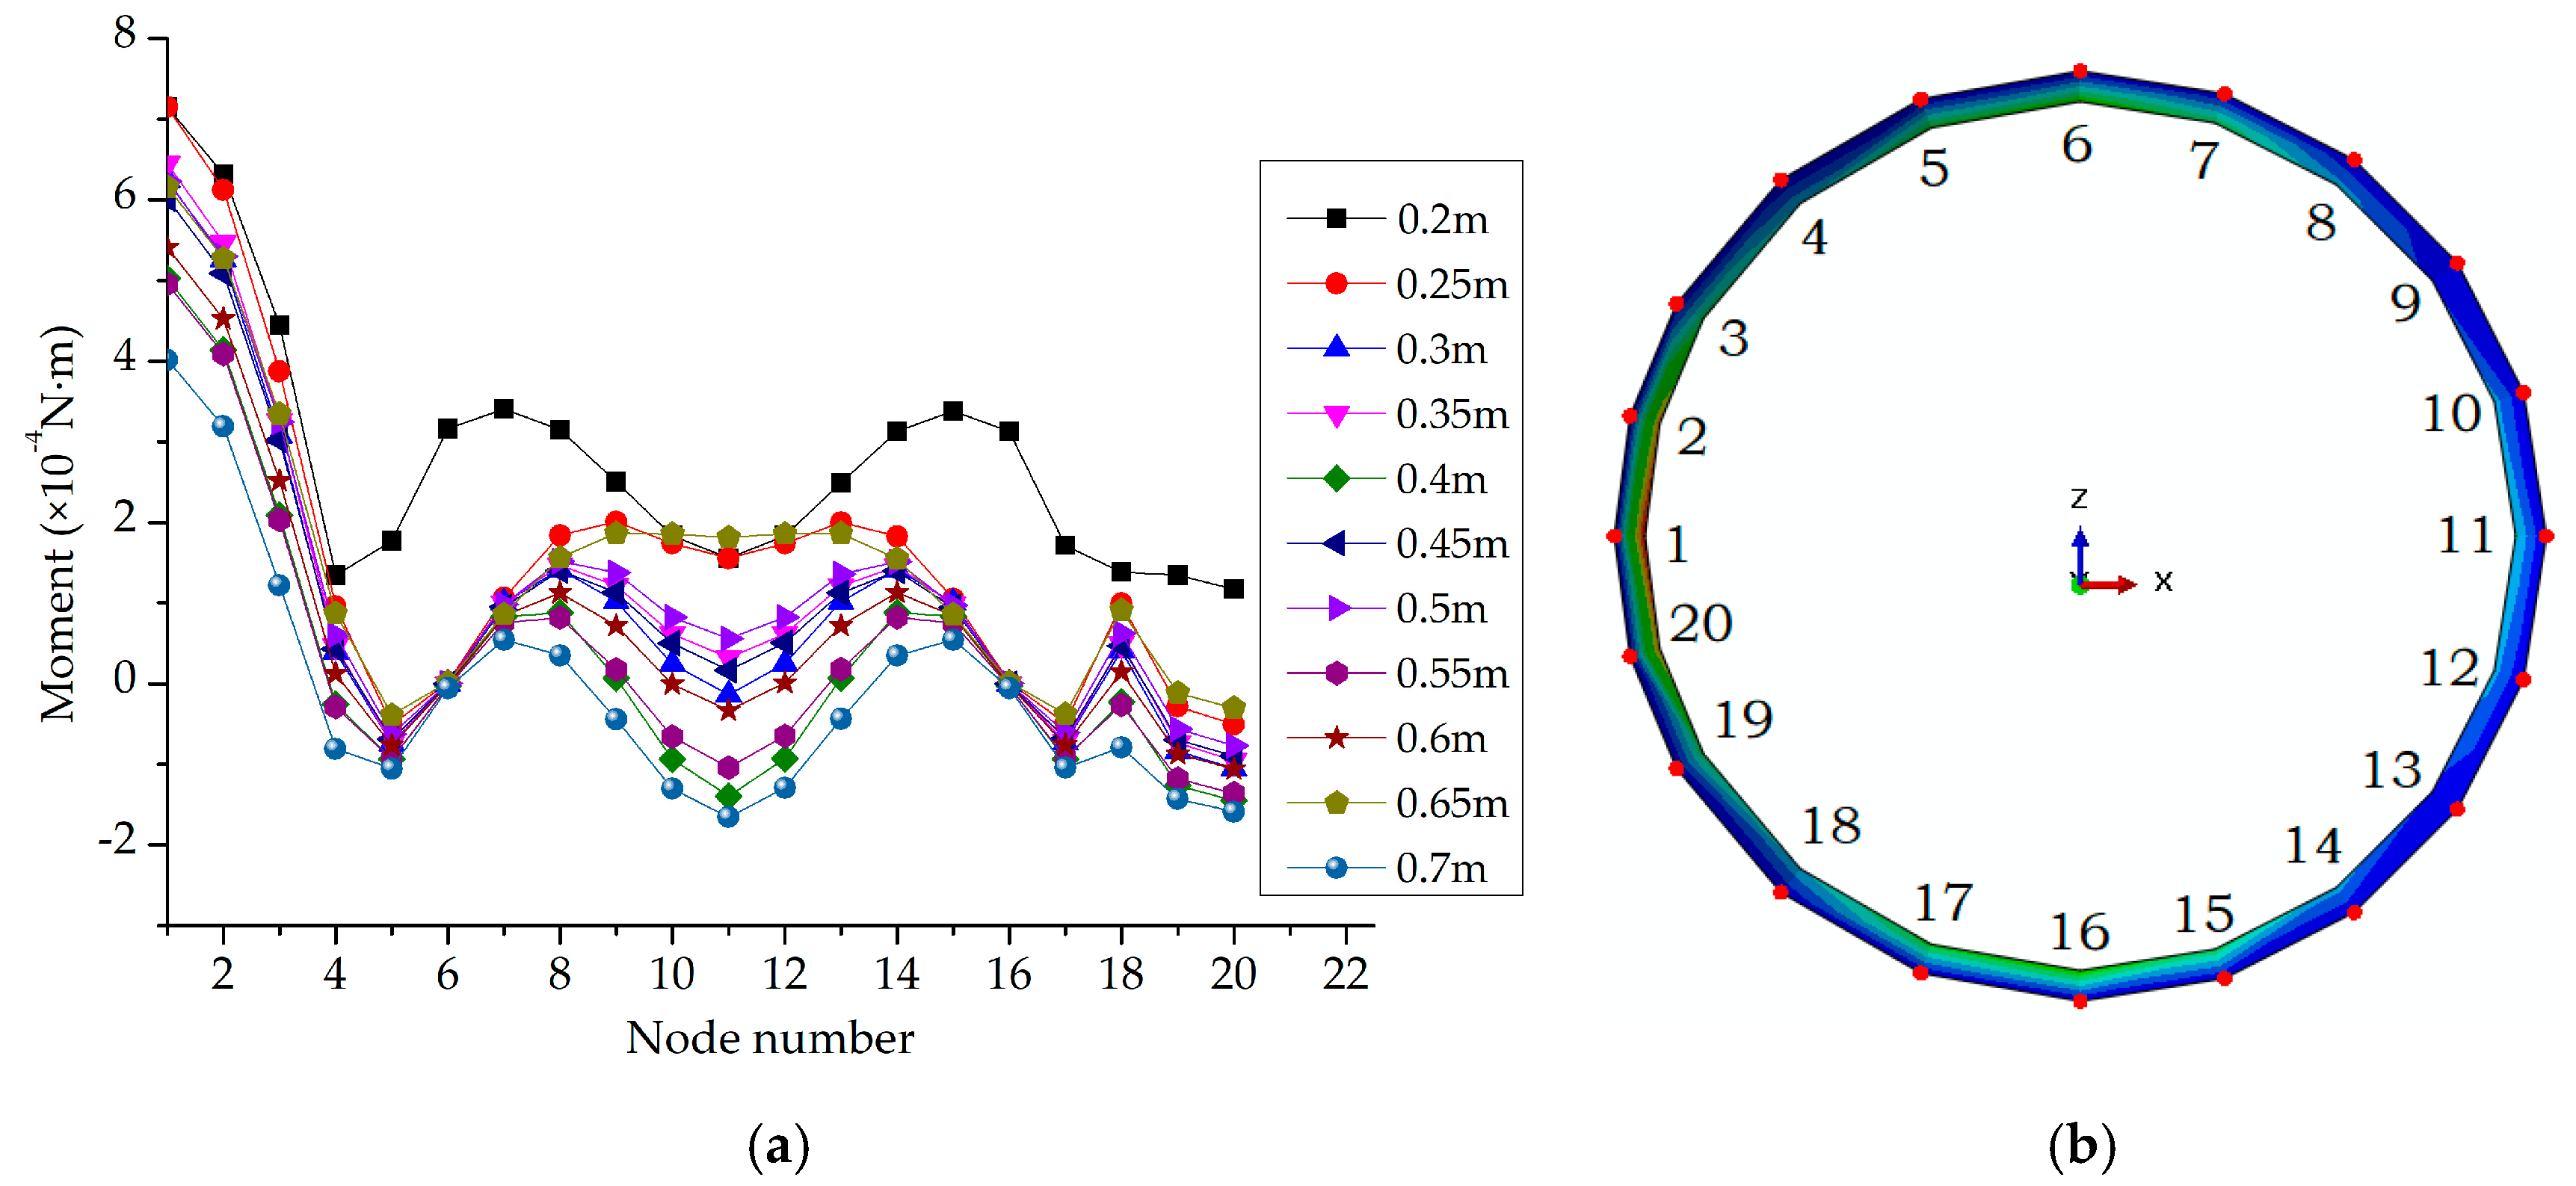
In a marine environment the sea level varies due to flux and reflux. Therefore, the effect of the water depth on the structural responses of the tower during the erection phase should be studied. The sea level range was considered to vary between 0.2 m to 0.7 m in the present model. The displacements of the tower along the Line 1 at each water depth are shown in Figure 8, whilst the base moments of the tower model at each water depth are displayed in Figure 9. It can be observed that displacement of the tower increases on Line 1 when water depth goes up. According to Figure 8, the displacement response of the tower model on Line 1 is minimized when the water depth is 0.4 m. The base moments of the tower model at each water depth are displayed in Figure 9. The x-axis represents the node number around the base circle in a clockwise direction as depicted in Figure 9b. The reaction base moment increases with sea level increases as shown in Figure 9a. All the maximum reaction moments occur on the first nodes of the tower as shown in Figure 9b.
3. Bearing Capacity of the Offshore Tower with Stiffeners
3.1. Tower Models
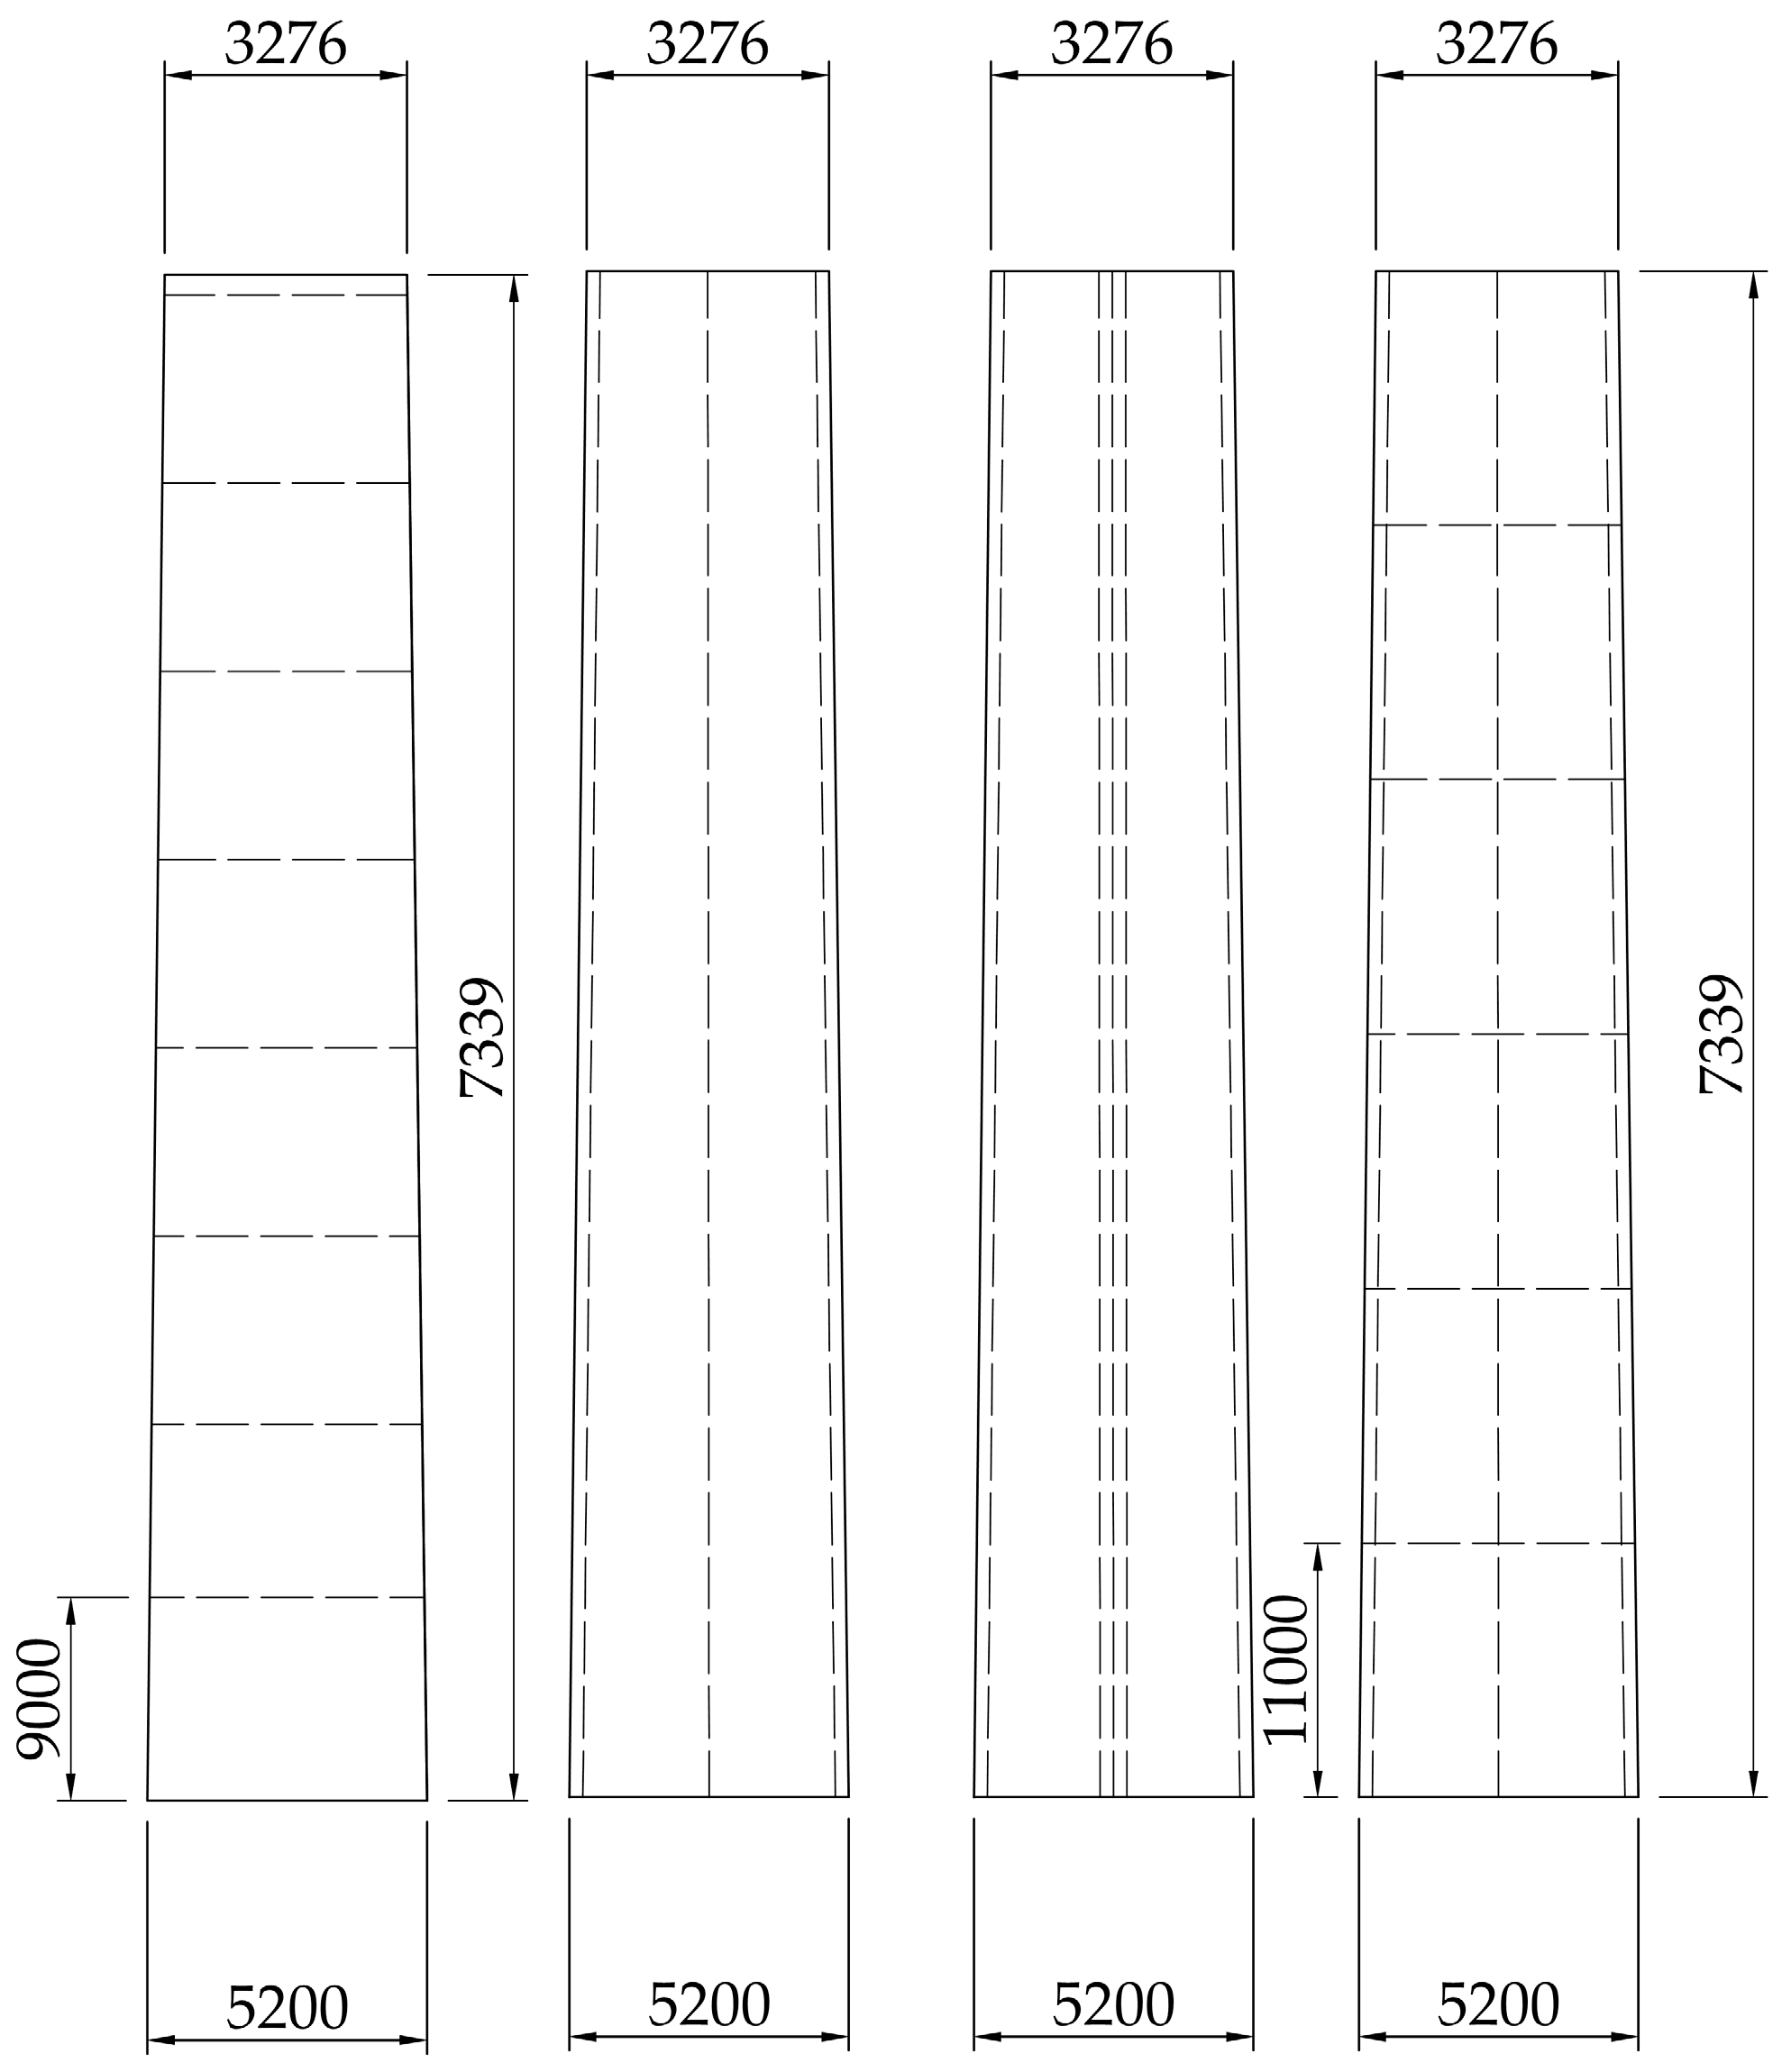
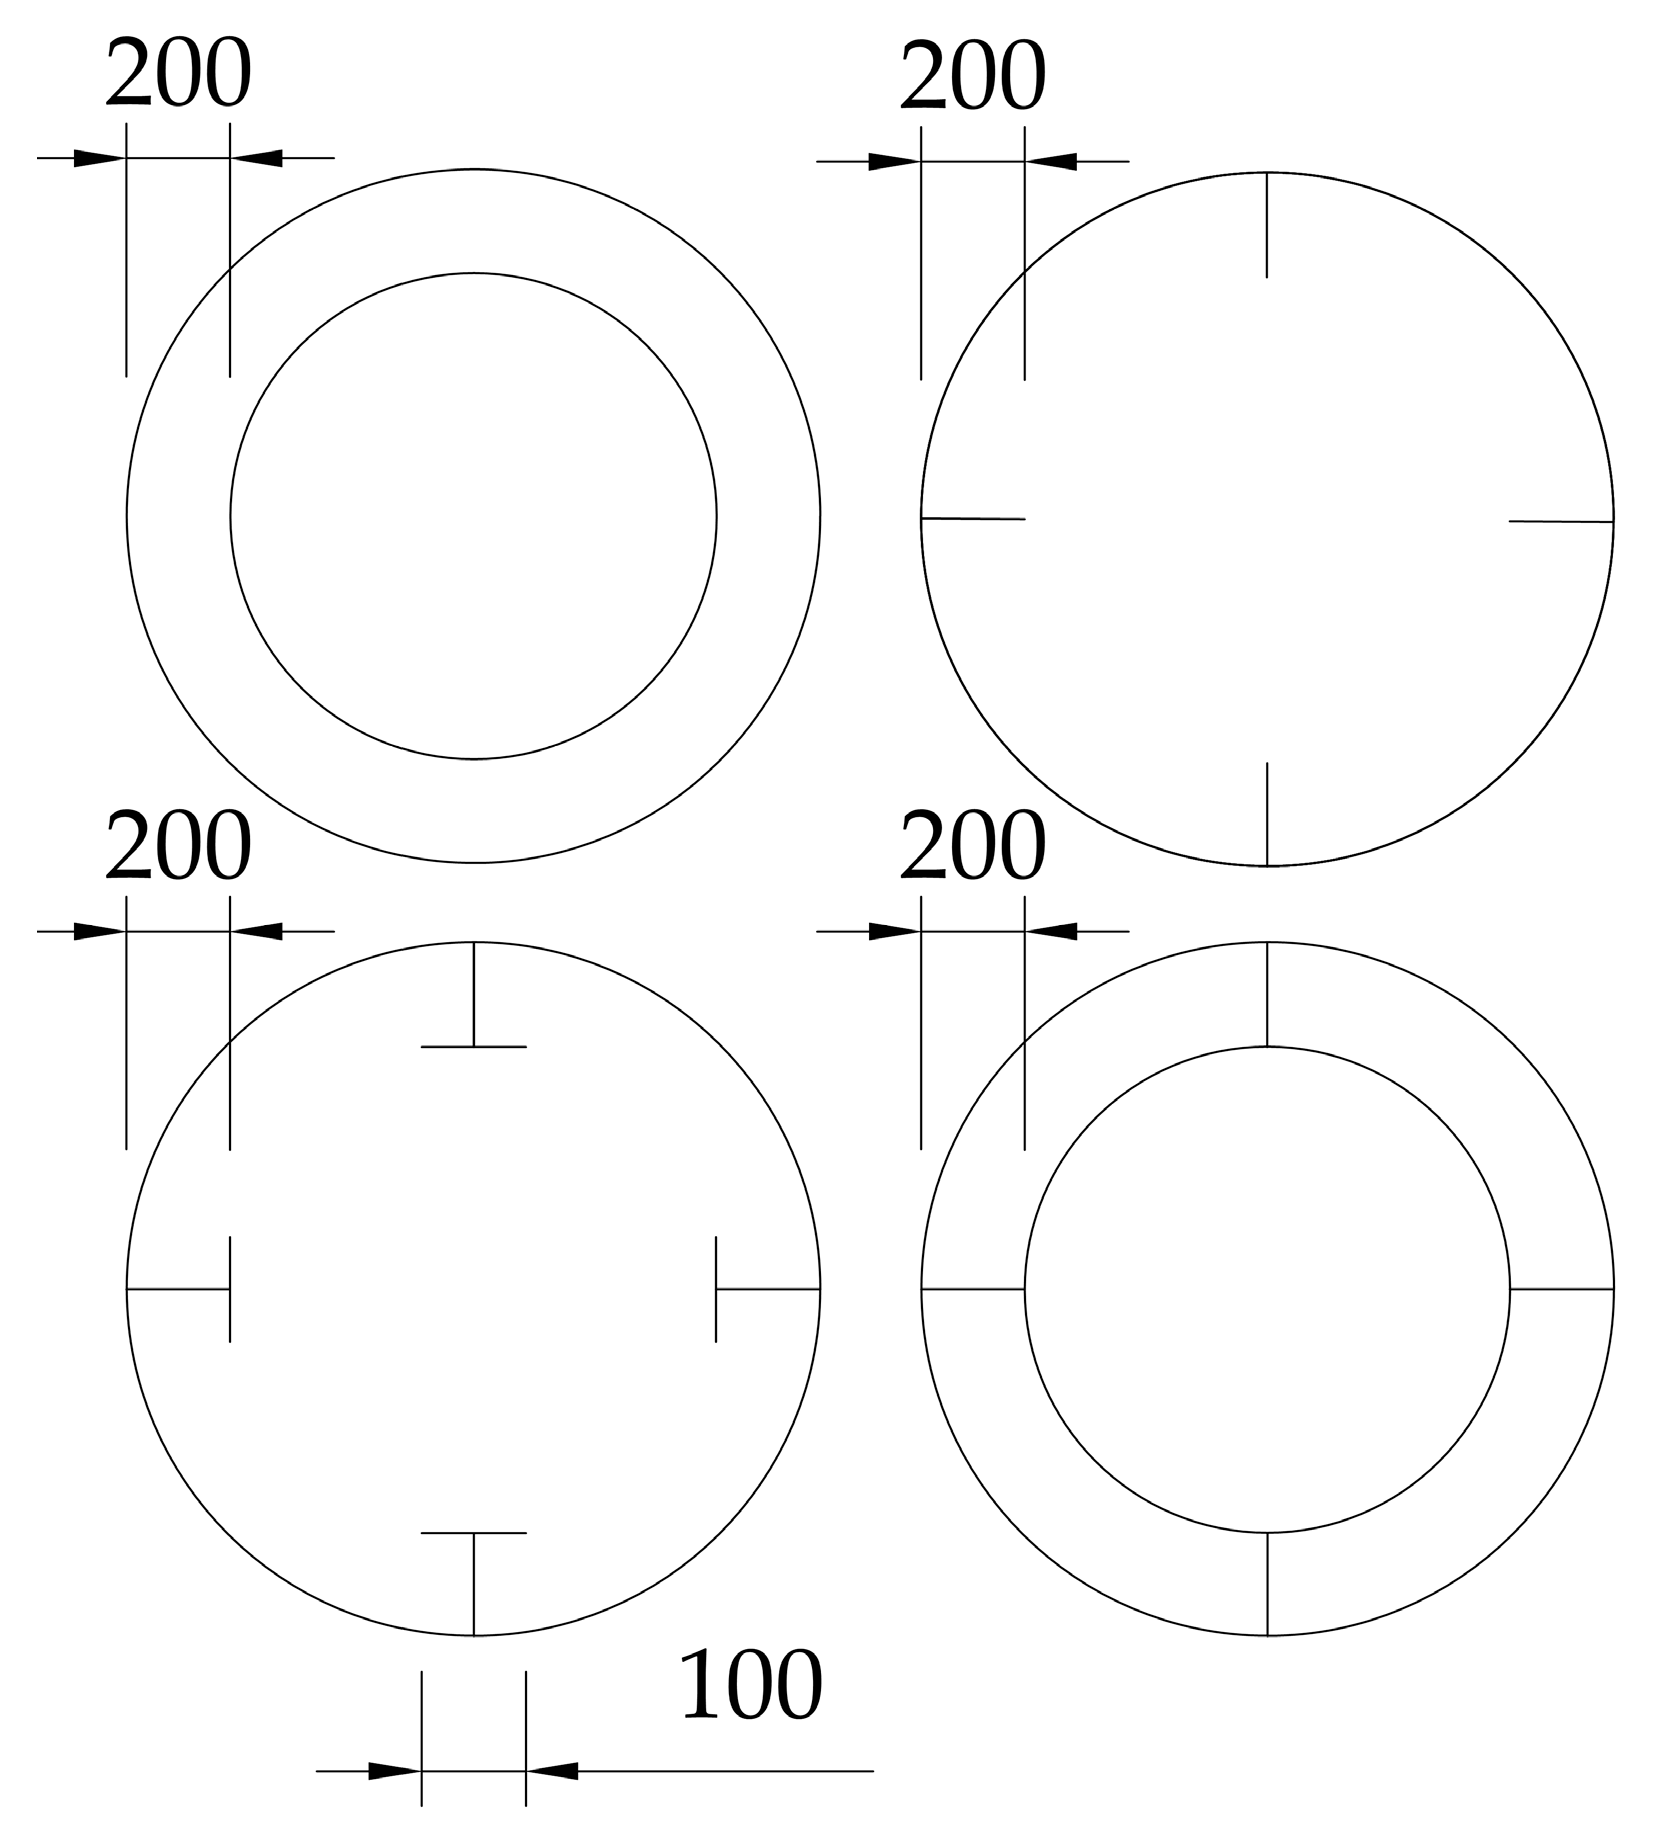
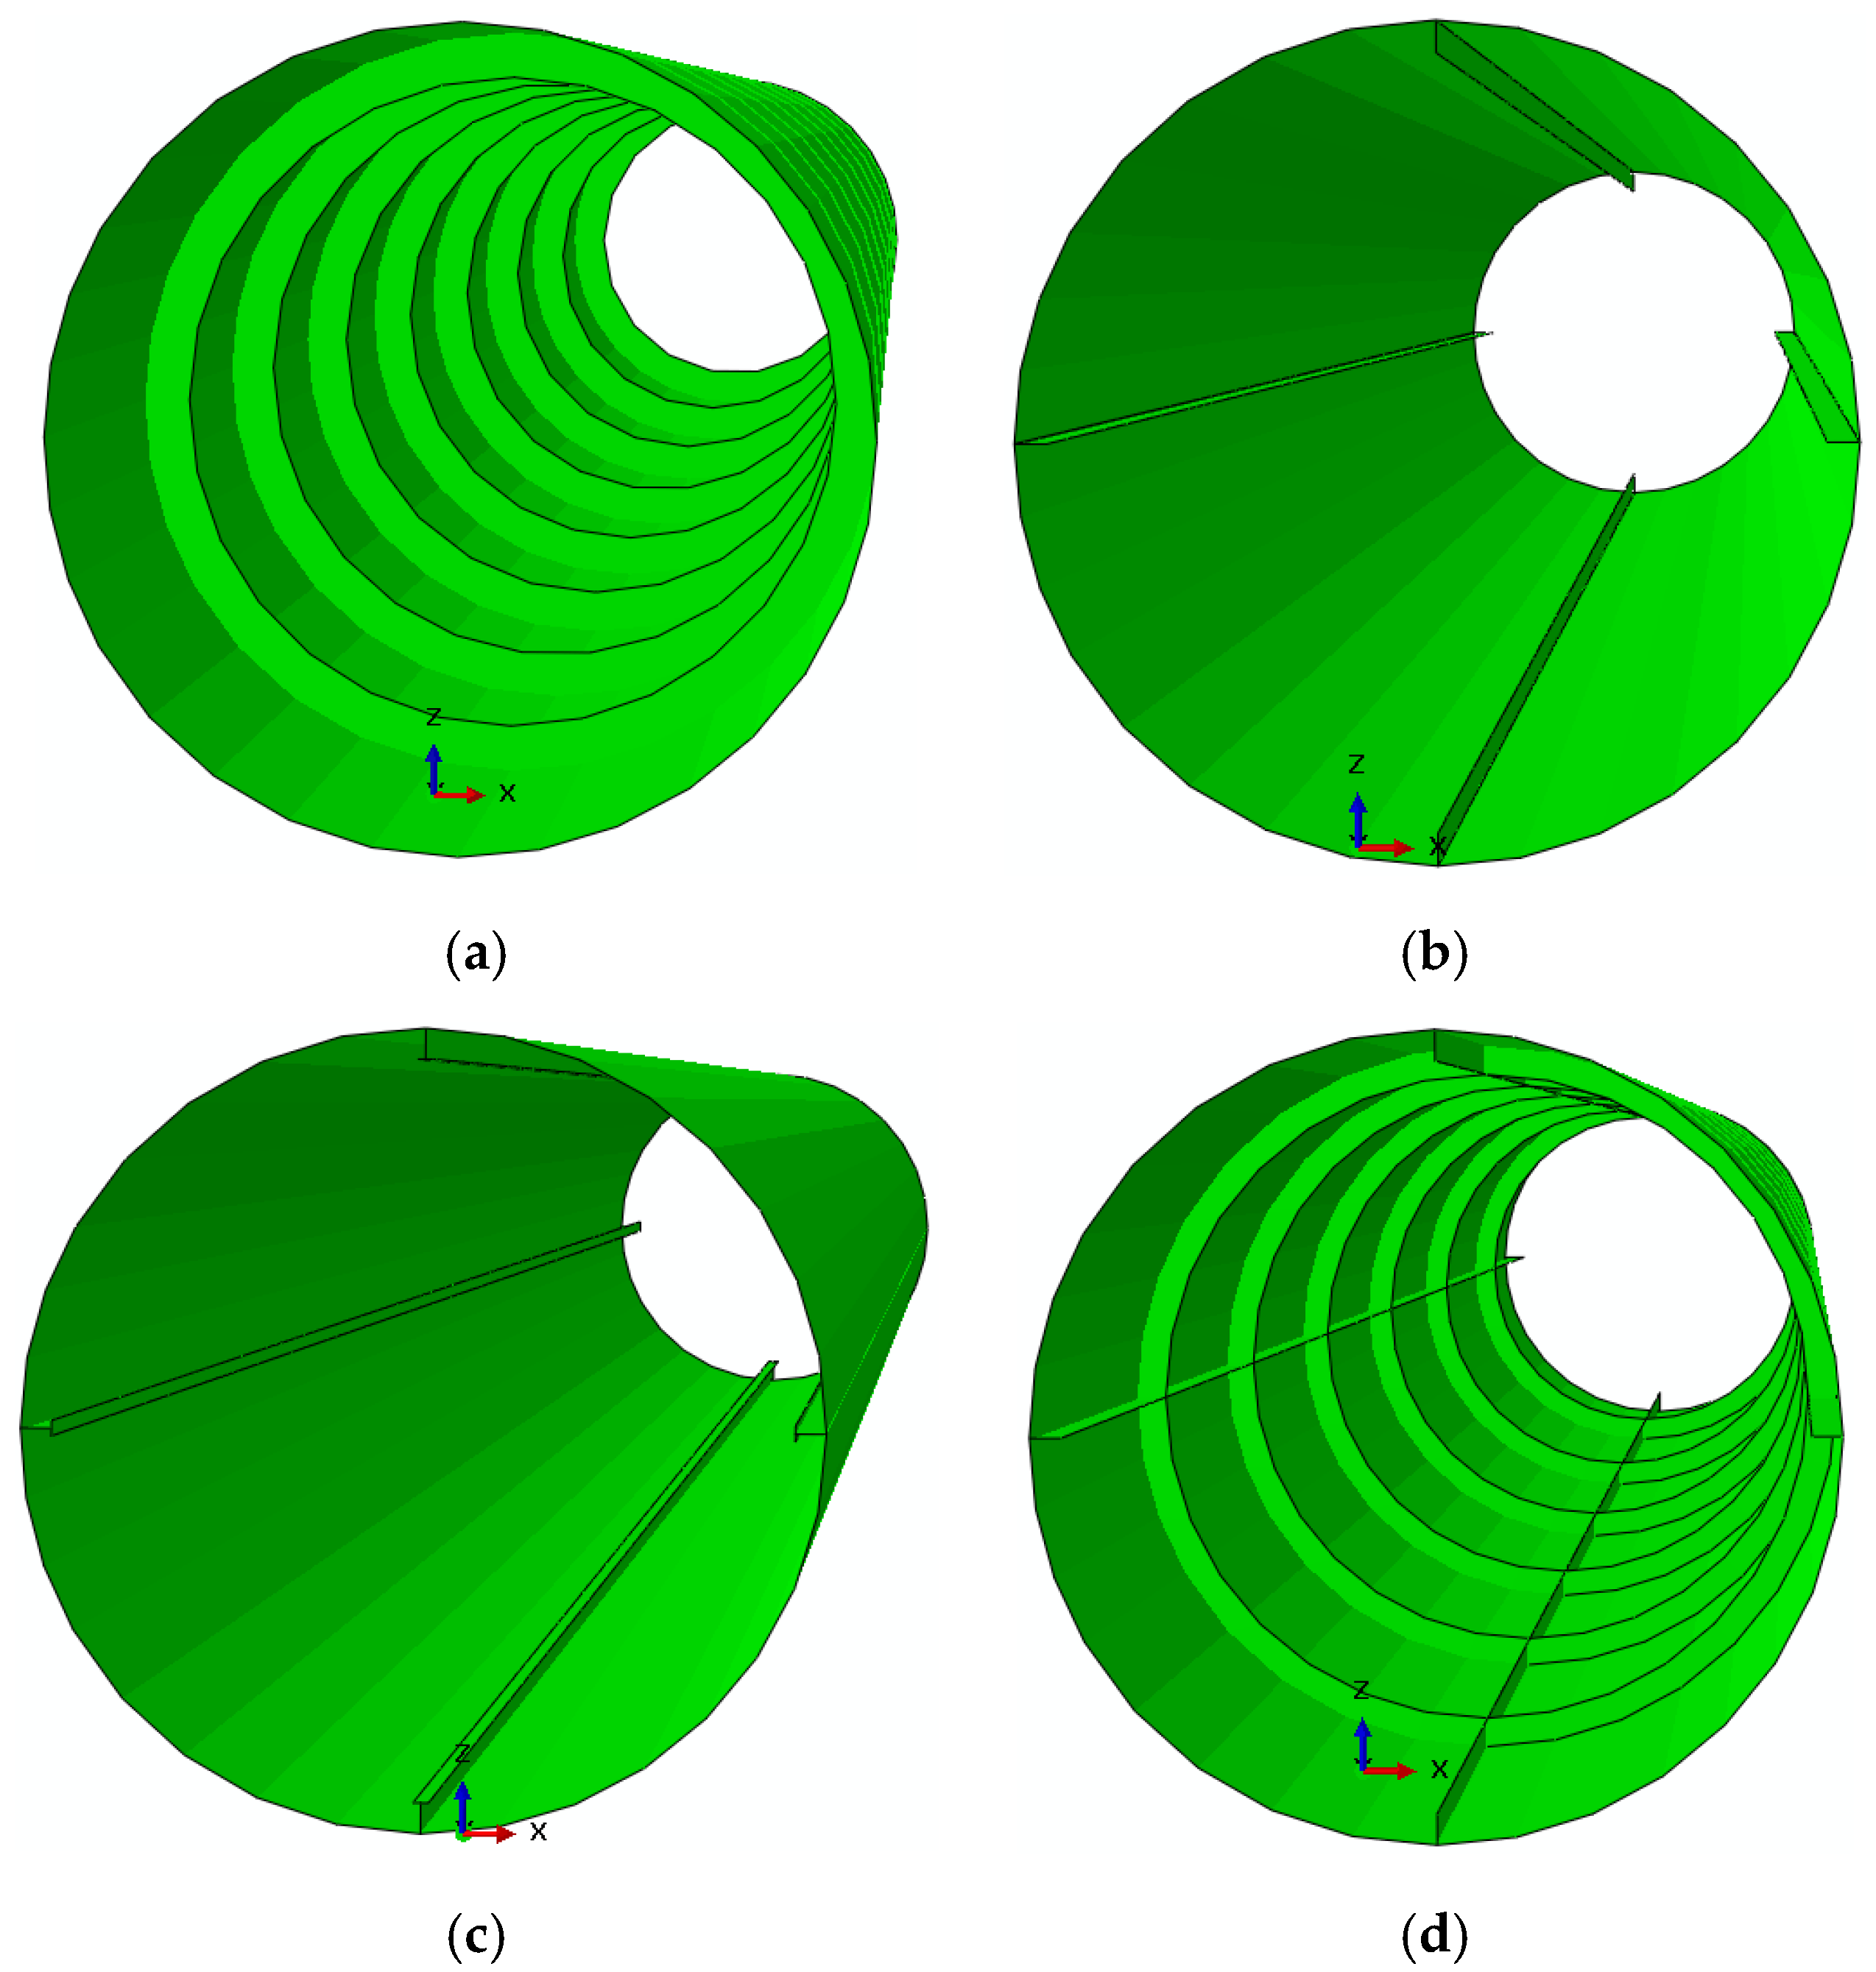
For offshore wind turbine towers, the stiffeners are often employed to stiffen the tower wall. To compare the effect of the various stiffeners schemes on the structural performance of the offshore towers during the erection phase, towers with four stiffening schemes including a tower with rings, a tower with vertical stiffeners, a tower with T-shaped stiffeners and a tower with orthogonal stiffeners regarded, respectively, as tower I, tower II, tower III and tower IV were investigated. Figure 10 and Figure 11 describe the geometry of the offshore wind turbine towers I, II, III and IV at hand. The internal view of the FE model with four types of stiffeners is shown in Figure 12. According to Figure 10 and Figure 11, the height of the tower is 73.39 m, the top and bottom diameters of the towers are, respectively, 3276 mm and 5200 mm. For tower I, its ring spacing is 9 m and it contains eight rings along the tower wall. The width and thickness of these rings are 200 mm and 100 mm, respectively. For vertical stiffeners, its width and thickness are, respectively, 200 mm and 100 mm as shown in Figure 11 and the other edge of the vertical stiffeners is parallel to tower edge as shown in Figure 10. The four vertical stiffeners are distributed uniformly in the tower wall. The lengths of T shaped stiffeners in two sides are, respectively, 100 mm and 200 mm as displayed in Figure 11. The thickness of T shaped stiffeners is 50 mm. For tower IV, the ring spacing of orthogonal stiffeners is 11m and its four vertical stiffeners are also distributed uniformly in a similar way as in Tower II shown in Figure 12. The material property of FE model is Q345 steel as shown in Table 1.
For the FE models of the tower, the tie constraint was used to connect the stiffeners and the shell, i.e., the tower wall. The tower bottoms were considered to be fully fixed. On the top of the tower models, the circle center of the tower top can be setup to couple the top circle of the tower to the reference point. On the top, the tower is subjected to gravity and moment due to the eccentricity of wind turbines and the horizontal force resultant from wind loadings applied to blades of the wind turbine. The gravity, horizontal force and moment applied to the 73.39 m offshore tower are, respectively, 762,140 N, 1.0 × 10⁶ N and 3.9479 × 10⁸ N·mm. The tower should resist the gravity, the moment and the horizontal force on the top and therefore, its bearing capacity of the tower should be evaluated. In the present study, four stiffeners schemes are compared to explore the optimum stiffening option for the tower wall.
3.2. Stiffeners Mass
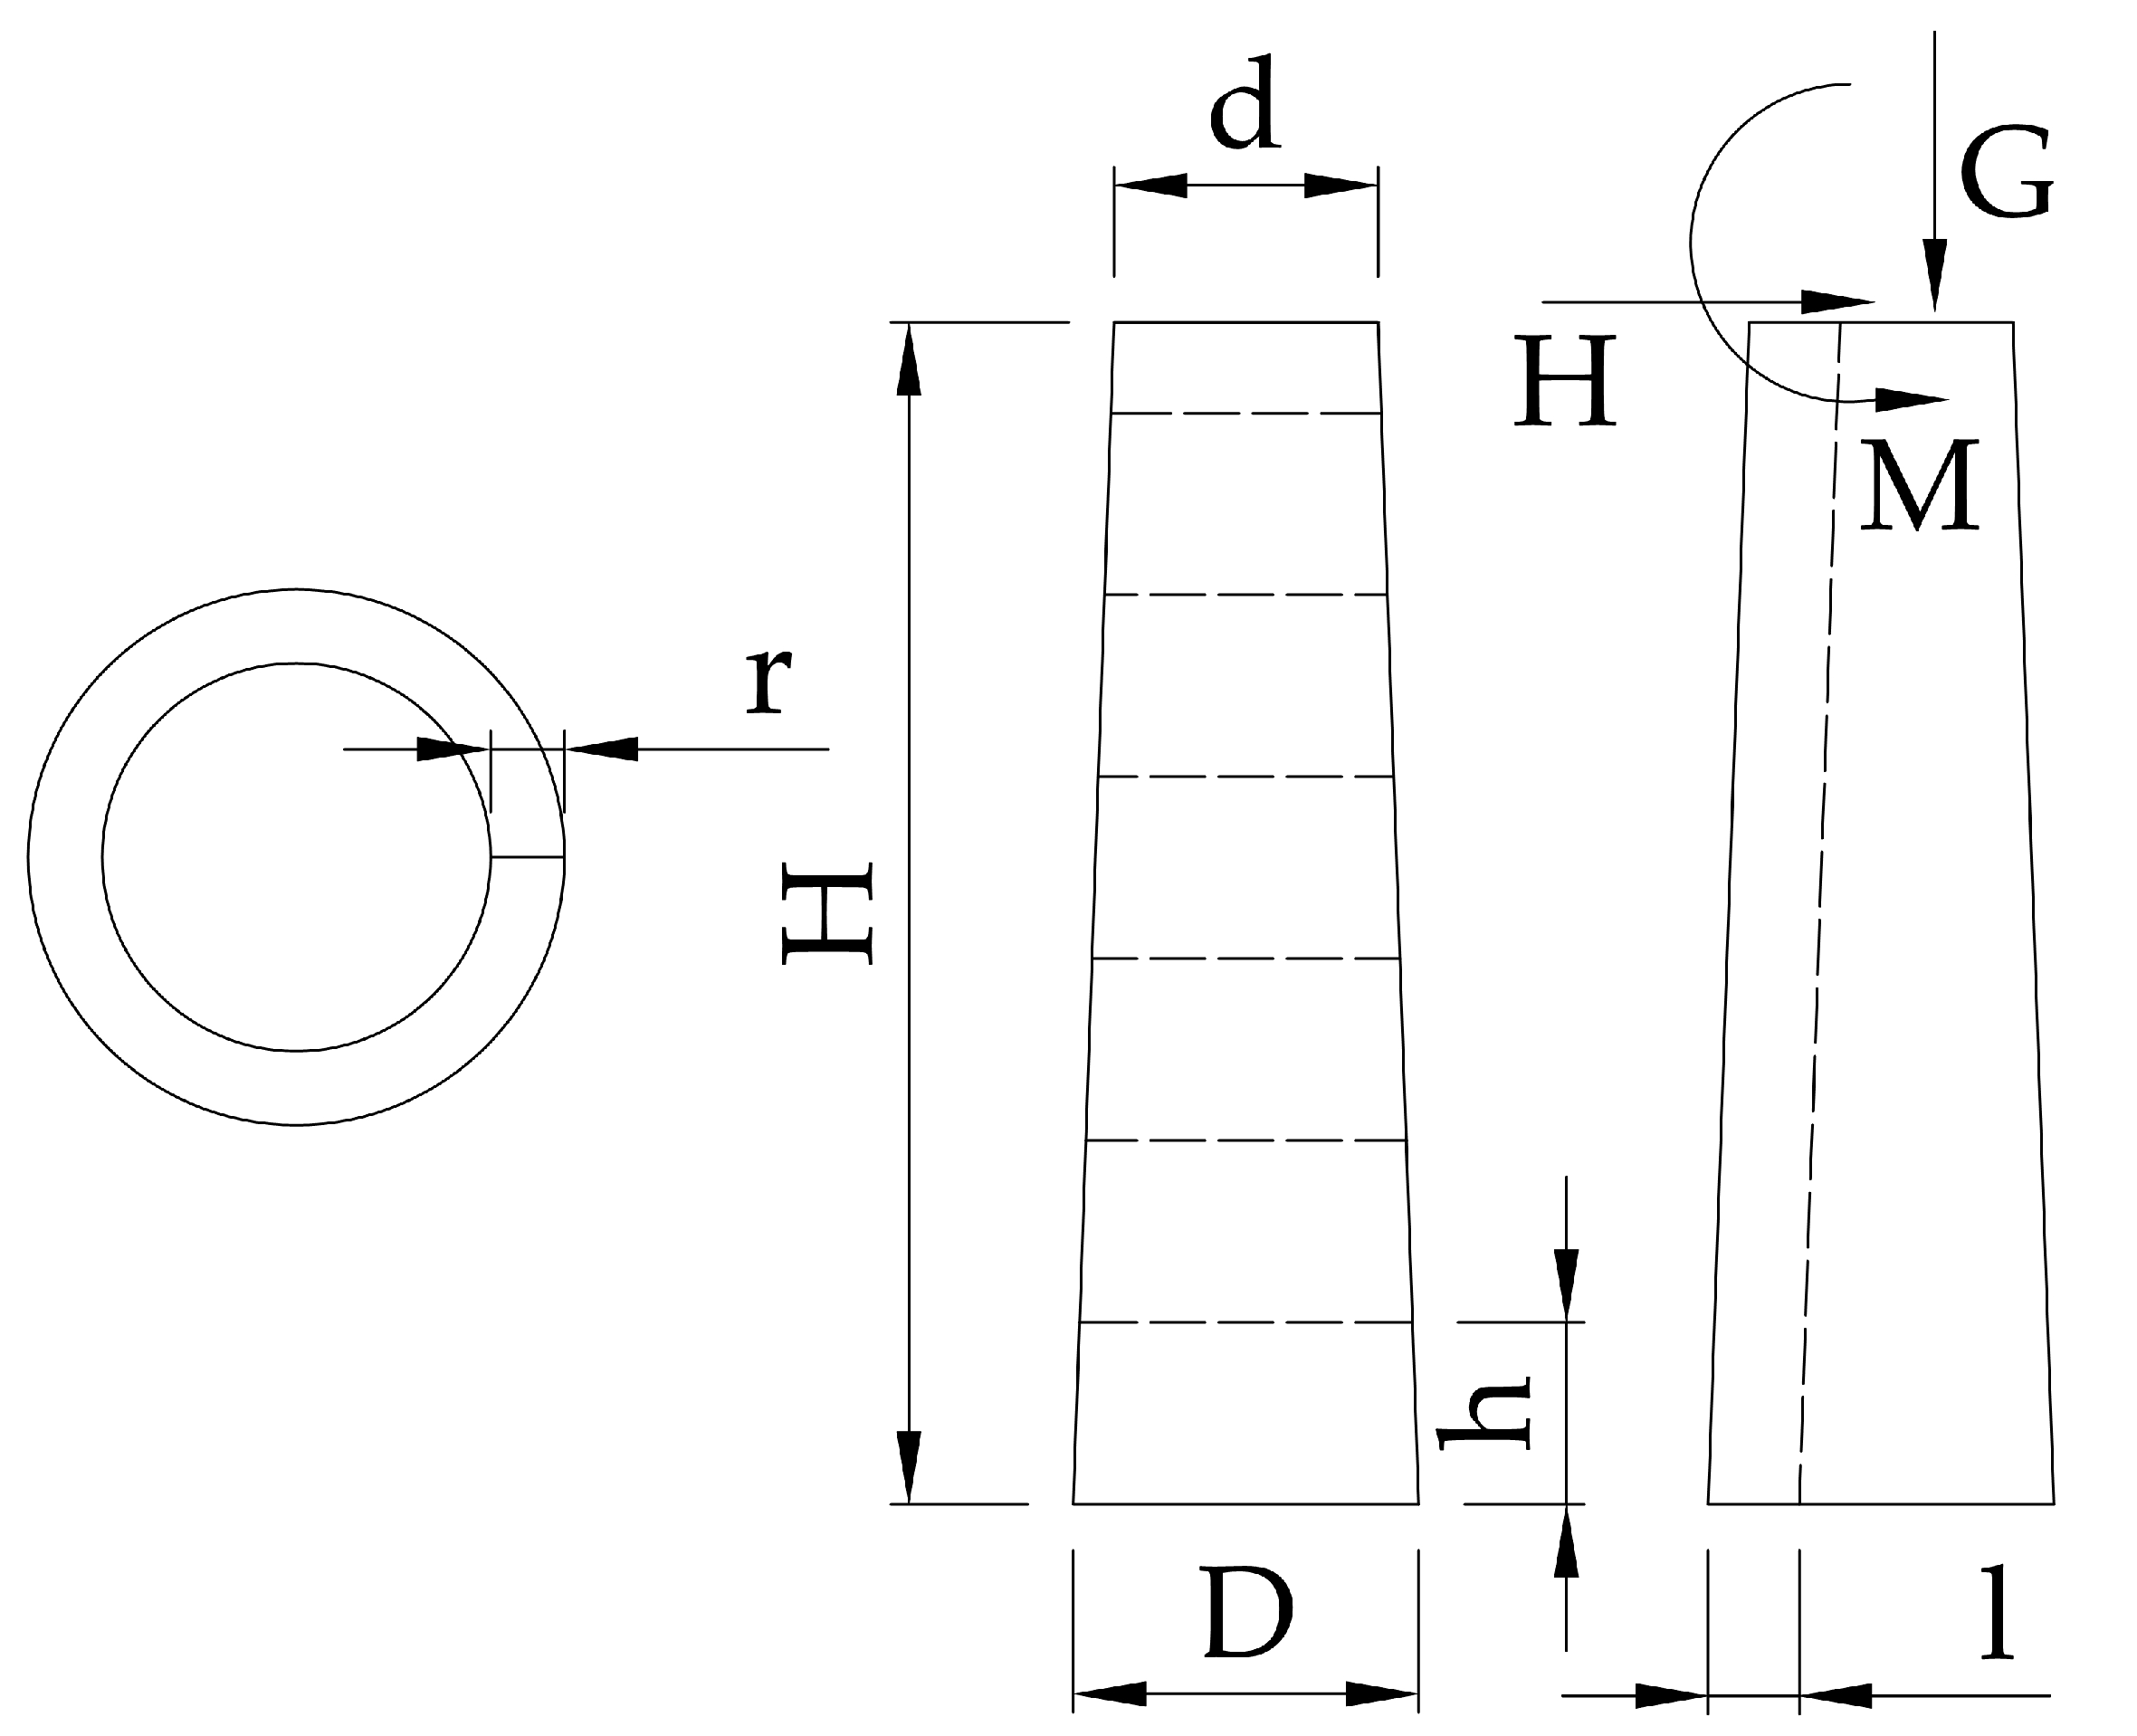
To compare the different stiffening options, the rings, vertical stiffeners, T-shaped stiffeners and orthogonal stiffeners should have all the same mass in order to study their efficacy. As the T-shaped stiffeners and the orthogonal stiffeners geometrically are based on the initially designed rings and vertical stiffeners, their mass can also be obtained by using the mass formula of rings and vertical stiffeners. In Figure 13 the geometry of the tower with rings and vertical stiffeners is presented.
In the model at hand
where Mr is the mass of rings, r the width of the rings, D the diameter of the tower base, d the diameter of the top of the tower, H the height of the tower, h the spacing of rings, T the thickness of the rings and n is the number of the rings.
where Mv is the mass of the vertical stiffeners, m the number of vertical stiffeners, l the width of vertical stiffeners and t the thickness of the stiffeners.
Mv = mlHt
3.3. Buckling Analysis of the Tower
When wind farms or even wind turbines finish operating at the end of their lifetime, wind farm operators often consider repowering them to save funds and enhance sustainability assets [28]. By repowering old wind turbines into a larger size, the amount of energy is increased due to the higher efficiency of new turbines. These repowered wind turbines should however, possess enhanced ultimate bearing capacity that means that offshore wind turbine towers should be upgraded in a meticulous strengthening way.
Figure 13 shows that gravity, moment and horizontal force are applied to the top of the tower stem. The tower shell needs to be designed so that it efficiently bears the gravity load and the moment created from the eccentricity of the wind turbine placed on the top of the tower and the horizontal force being the resultant of the force of wind, the current and the wave loading. Therefore, as the loading states on the wind turbine tower are complicated in engineering practice, the gravity, the horizontal force and the moment are individually applied to each tower model in order to explore the collapse mode under each respective loading state and calculate the ultimate bearing capacity of the offshore tower under operation in marine environments. For the buckling analysis, the subspace method is applied as the eigensolver to obtain buckling modes and eigenvalues in each buckling step. For the nonlinear buckling analysis, the imperfection of the tower wall is applied to the models and certain buckling modes should be employed to acquire the nonlinear buckling modes, whilst the Riks method is used to evaluate the post buckling behavior and the critical loading of each tower. Then, the reactions on the bottom and the displacements on the top are compared to obtain the optimum stiffening scheme option.
3.3.1. On the Effect of Gravity
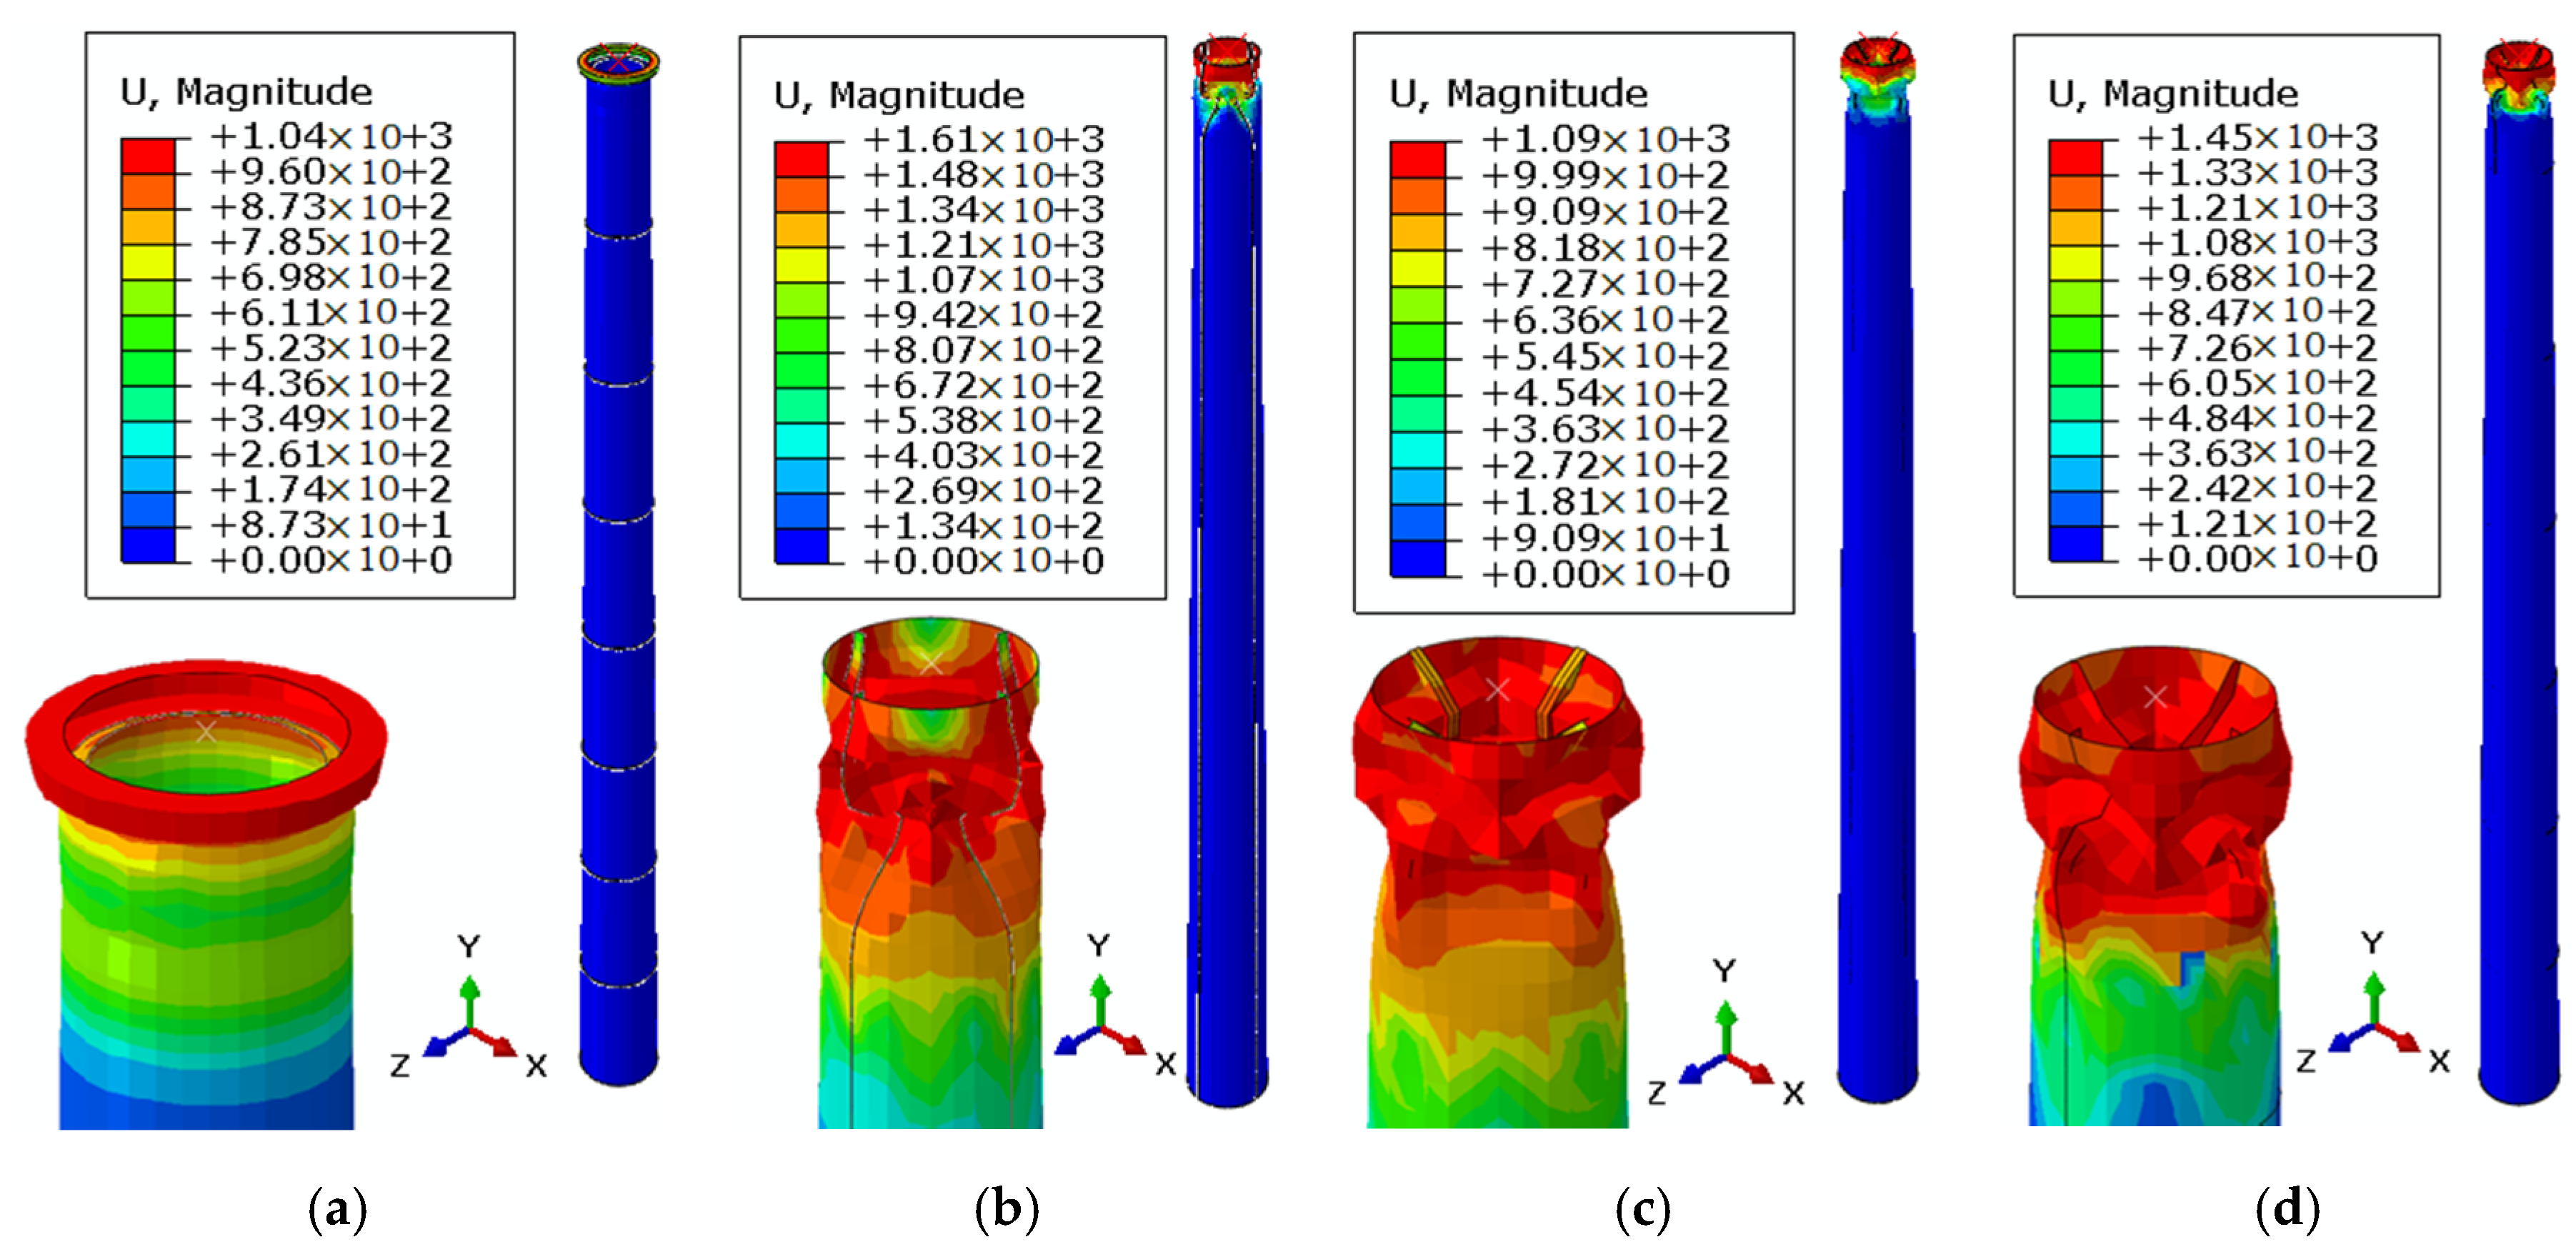
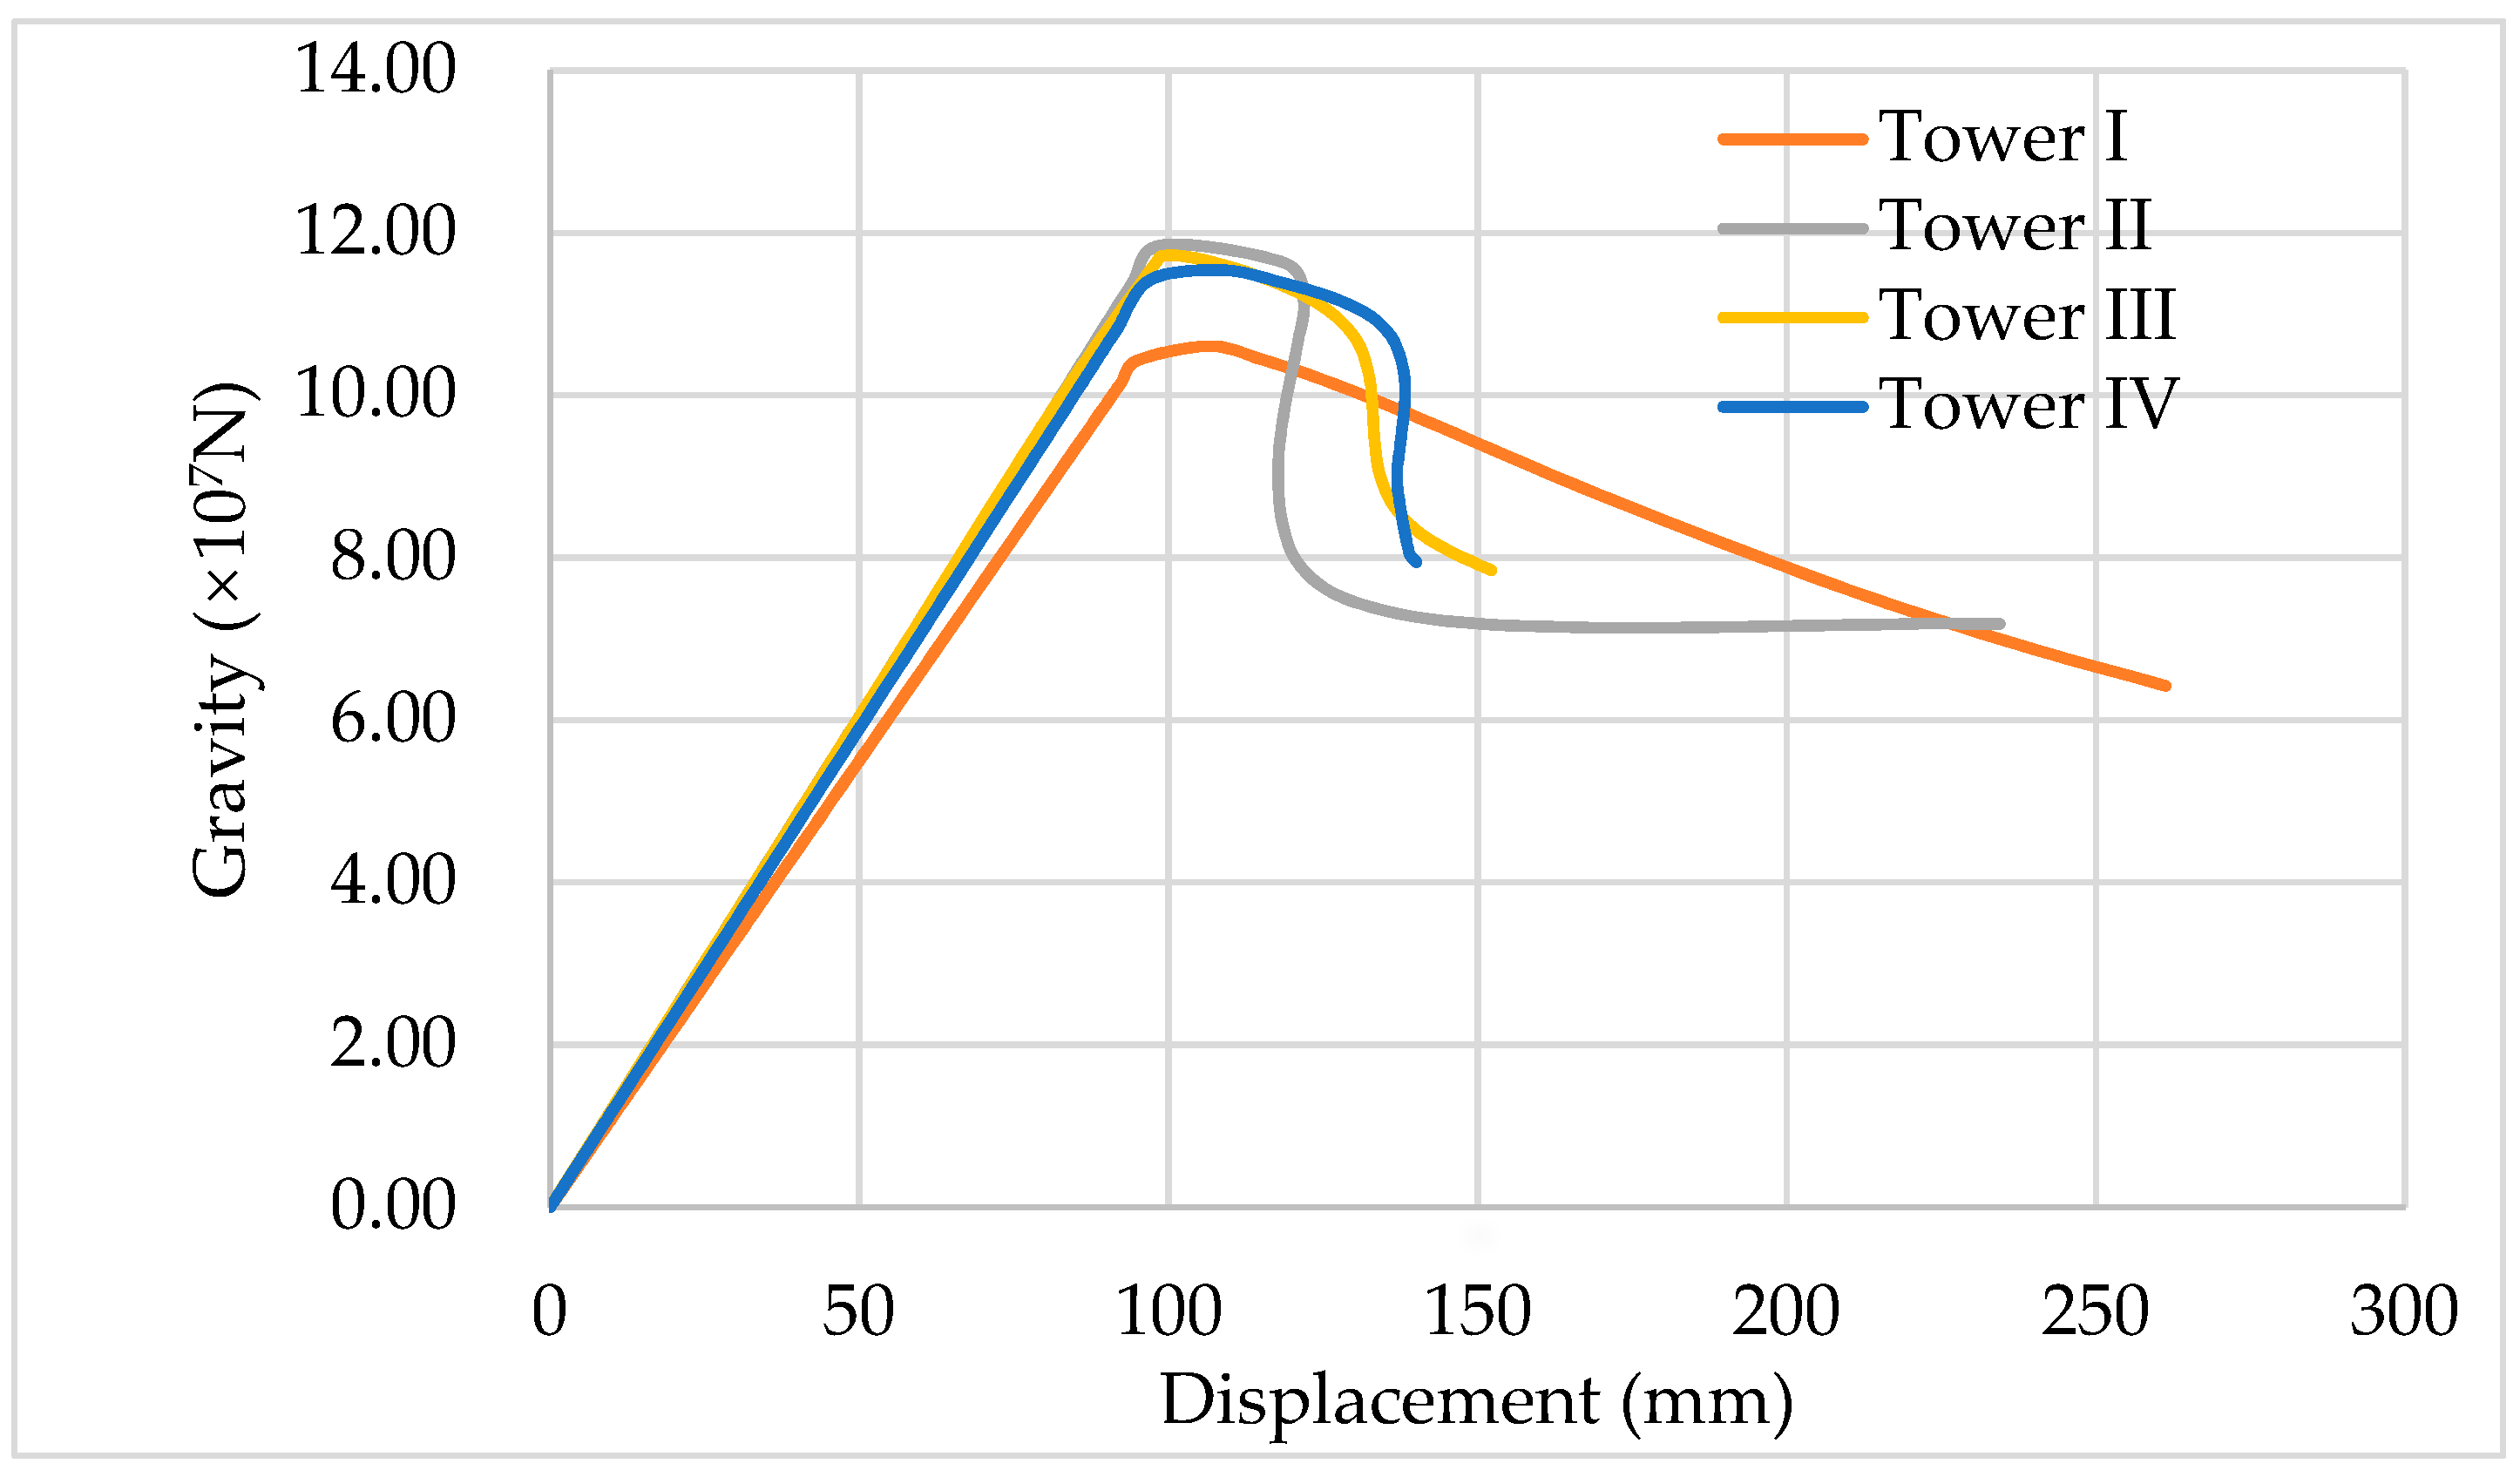
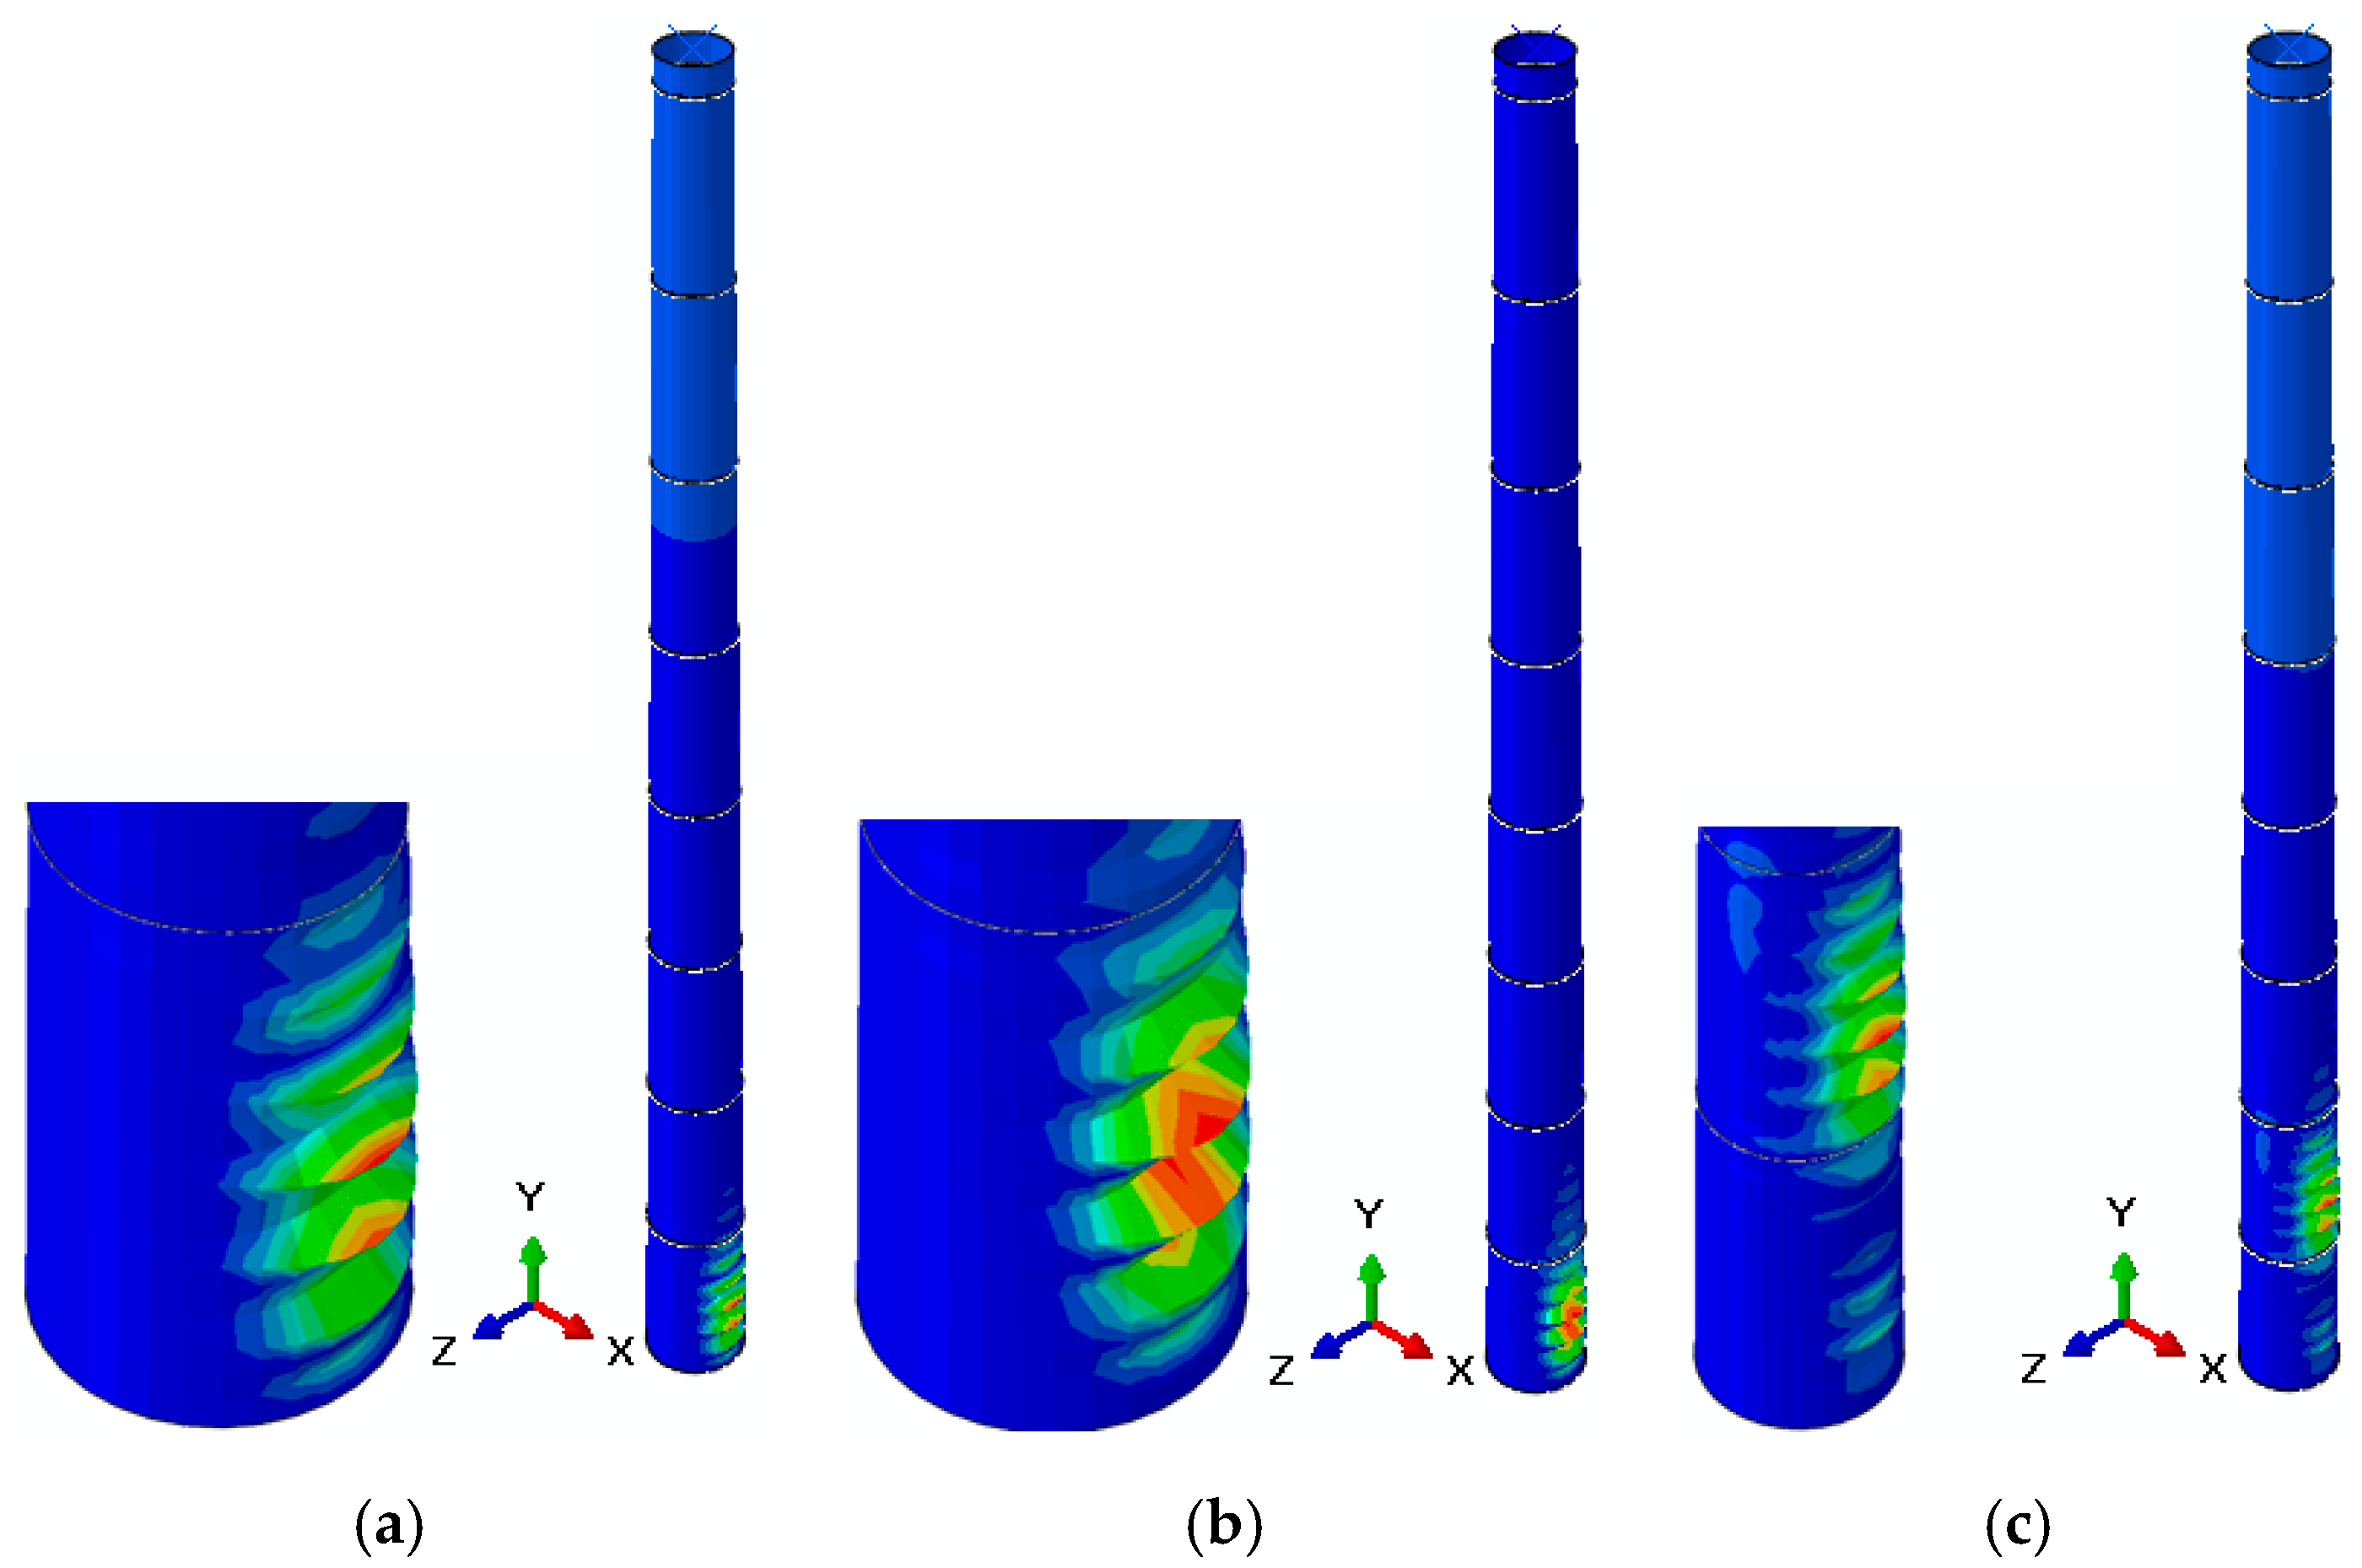
The gravity effect is principally due to the wind turbine placed on the top of the tower. With reference to the bearing capacity of the tower an analysis is performed to study the most appropriate stiffening option. The mass of the stiffeners in all towers I, II, III and IV is 22.07t. The buckling response of the towers under gravity is shown in Figure 14. The nonlinear buckling analysis for gravity loading is depicted in Figure 15. The buckling analysis shows that the modes 1, 2 and 3 of towers I, II, III, IV occur in the y-axis direction (Figure 14). It can be seen that the first and second modes are symmetrical to each other and are global bending modes, whilst the third mode is a local mode. According to Figure 15, the nonlinear behavior of towers I and II, III, IV are different. The shell/tower wall (case I) is principally compressed from the top to the vicinity of the first top ring as shown in Figure 14. For towers II, III and IV, the shell is compressed as shown in Figure 16. Gravity versus displacement of towers I, II, III, IV under gravity of wind turbines can be shown in Figure 16. The displacements in the x-axis in Figure 16 depict the displacement in the y direction and the reaction force is the resultant at the tower bottom. According to Figure 16, the bearing capacity of tower I is 1.08 × 10⁸ N, whereas the bearing capacities of towers II, III and IV are close to 1.18 × 10⁸ N. Therefore, comparing the peak of the curves and the bearing capacities of gravity of towers II, III and IV are close each other, whilst the bearing capacity of tower I is less than those of towers II, III and IV. It can be concluded that vertical stiffeners, T-shaped stiffeners and orthogonal stiffeners are more appropriate stiffening options than rings for gravity bearing capacity.
3.3.2. On the Effect of the Horizontal Actions
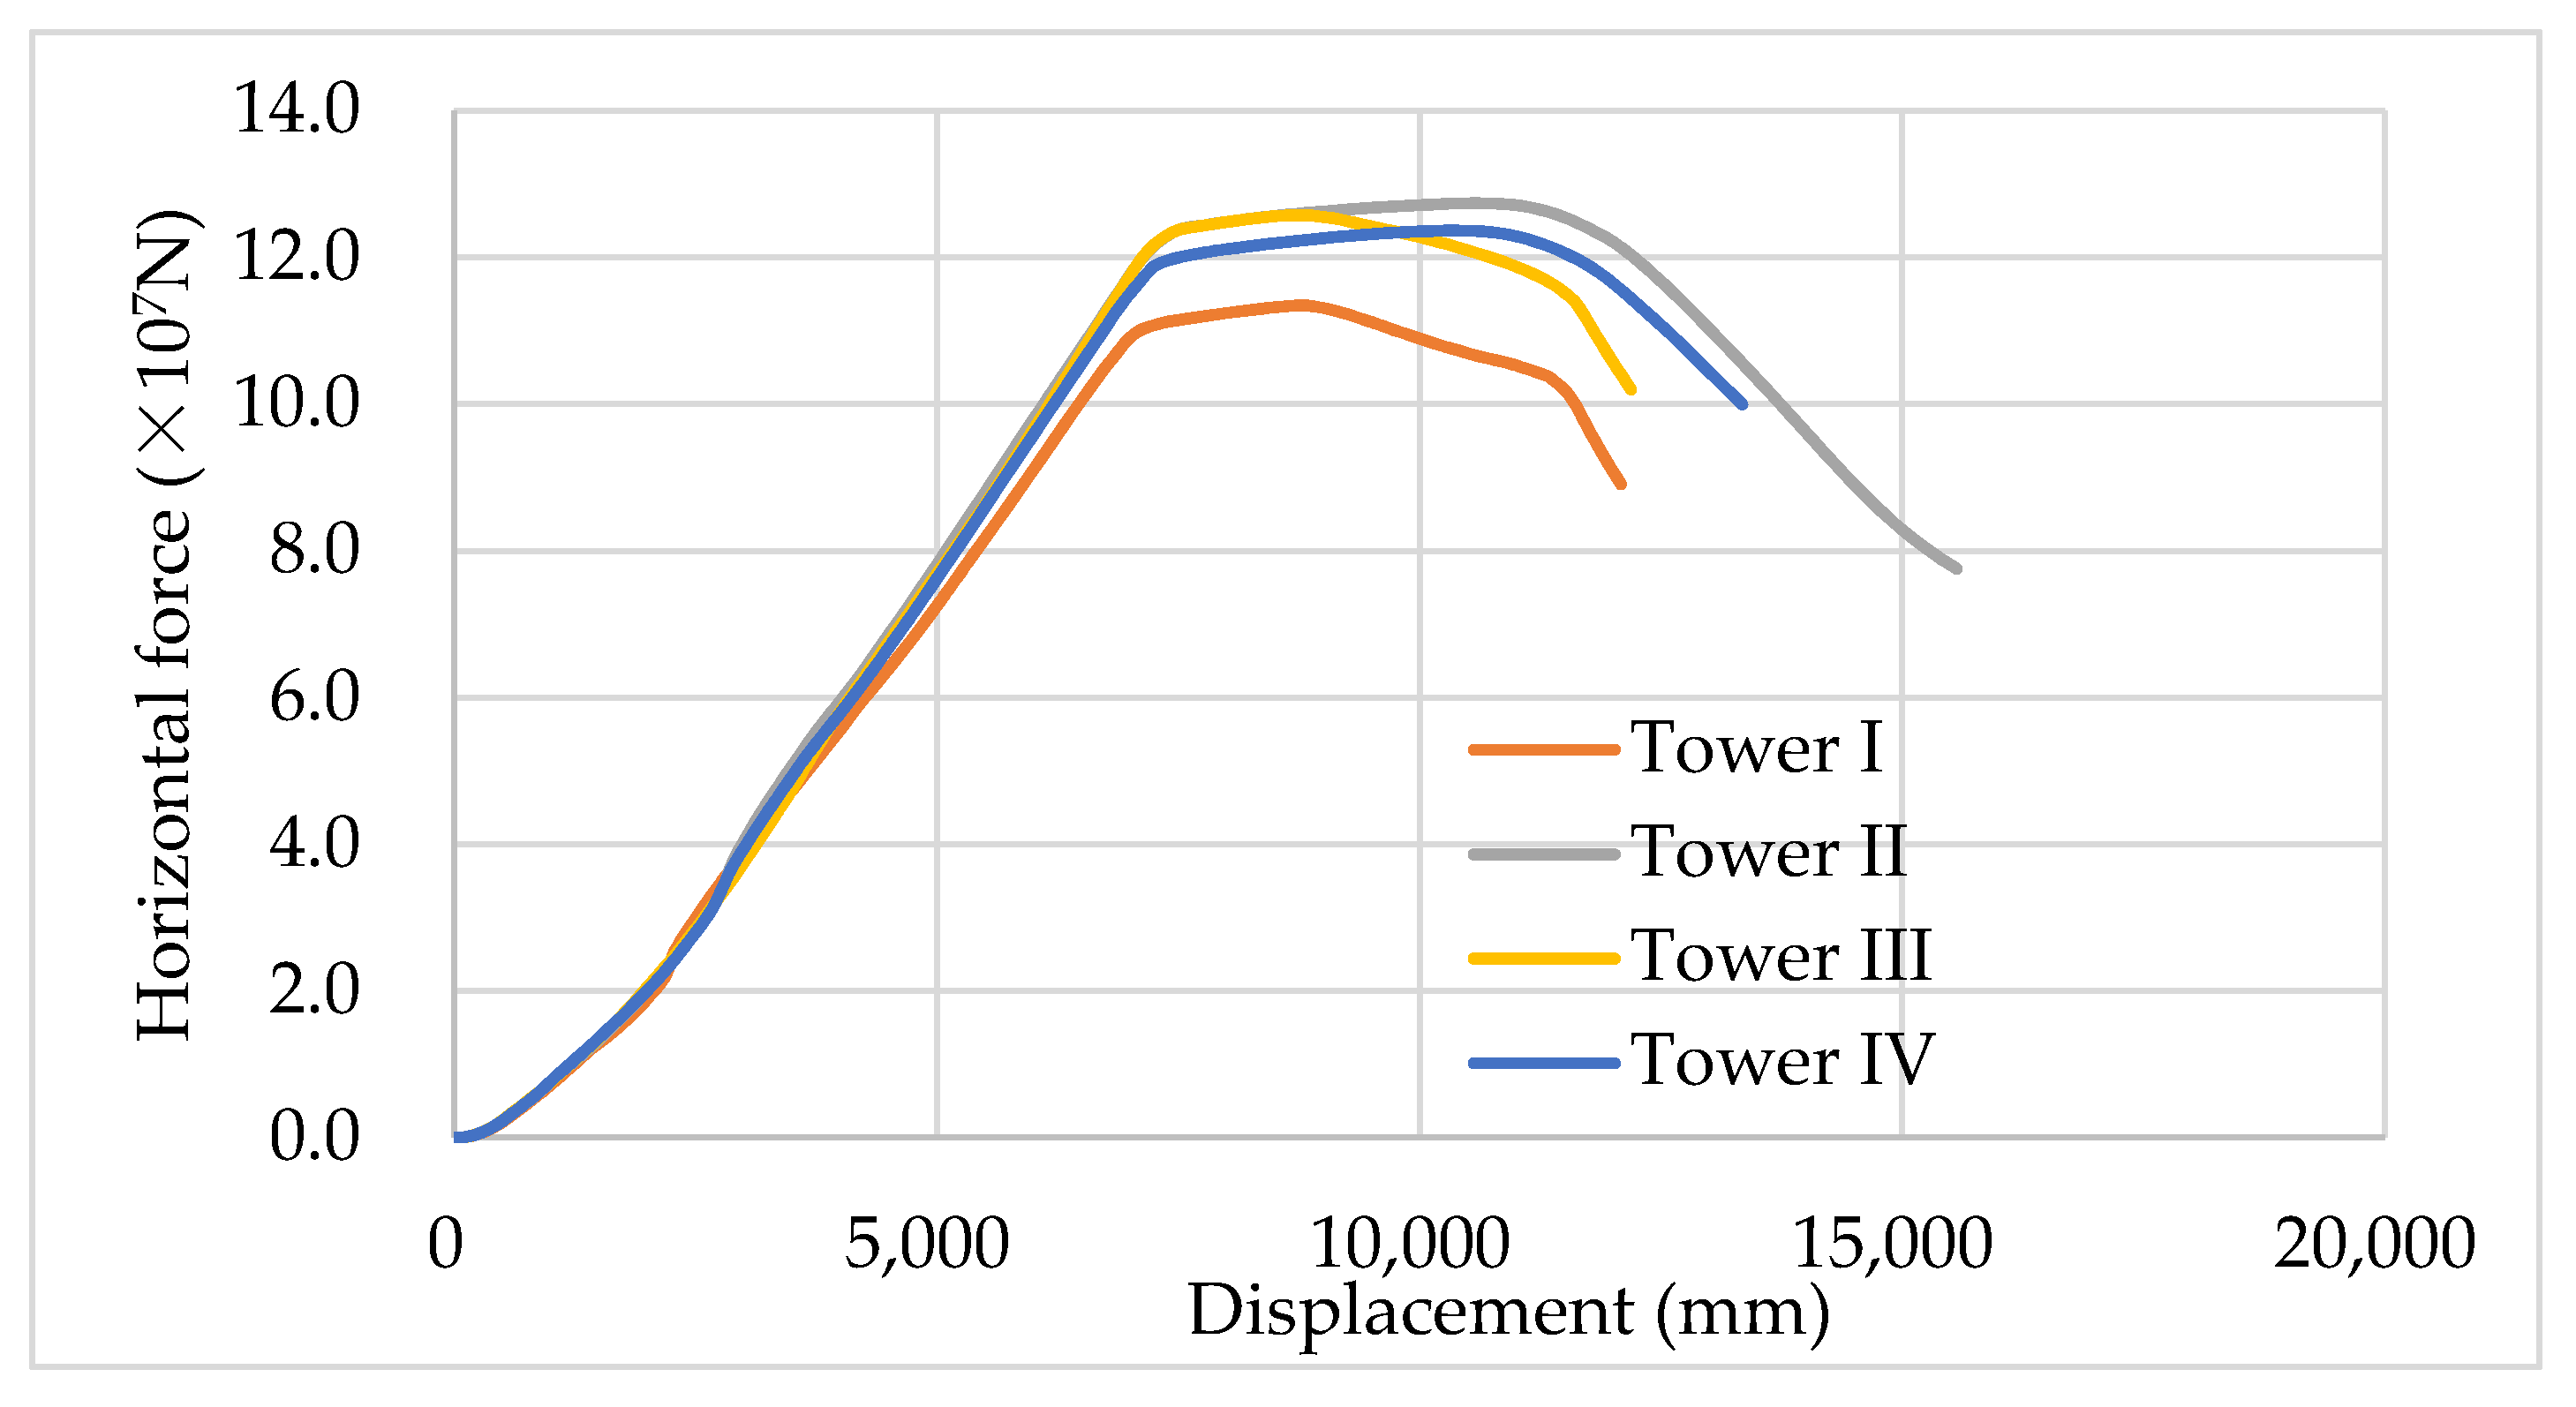
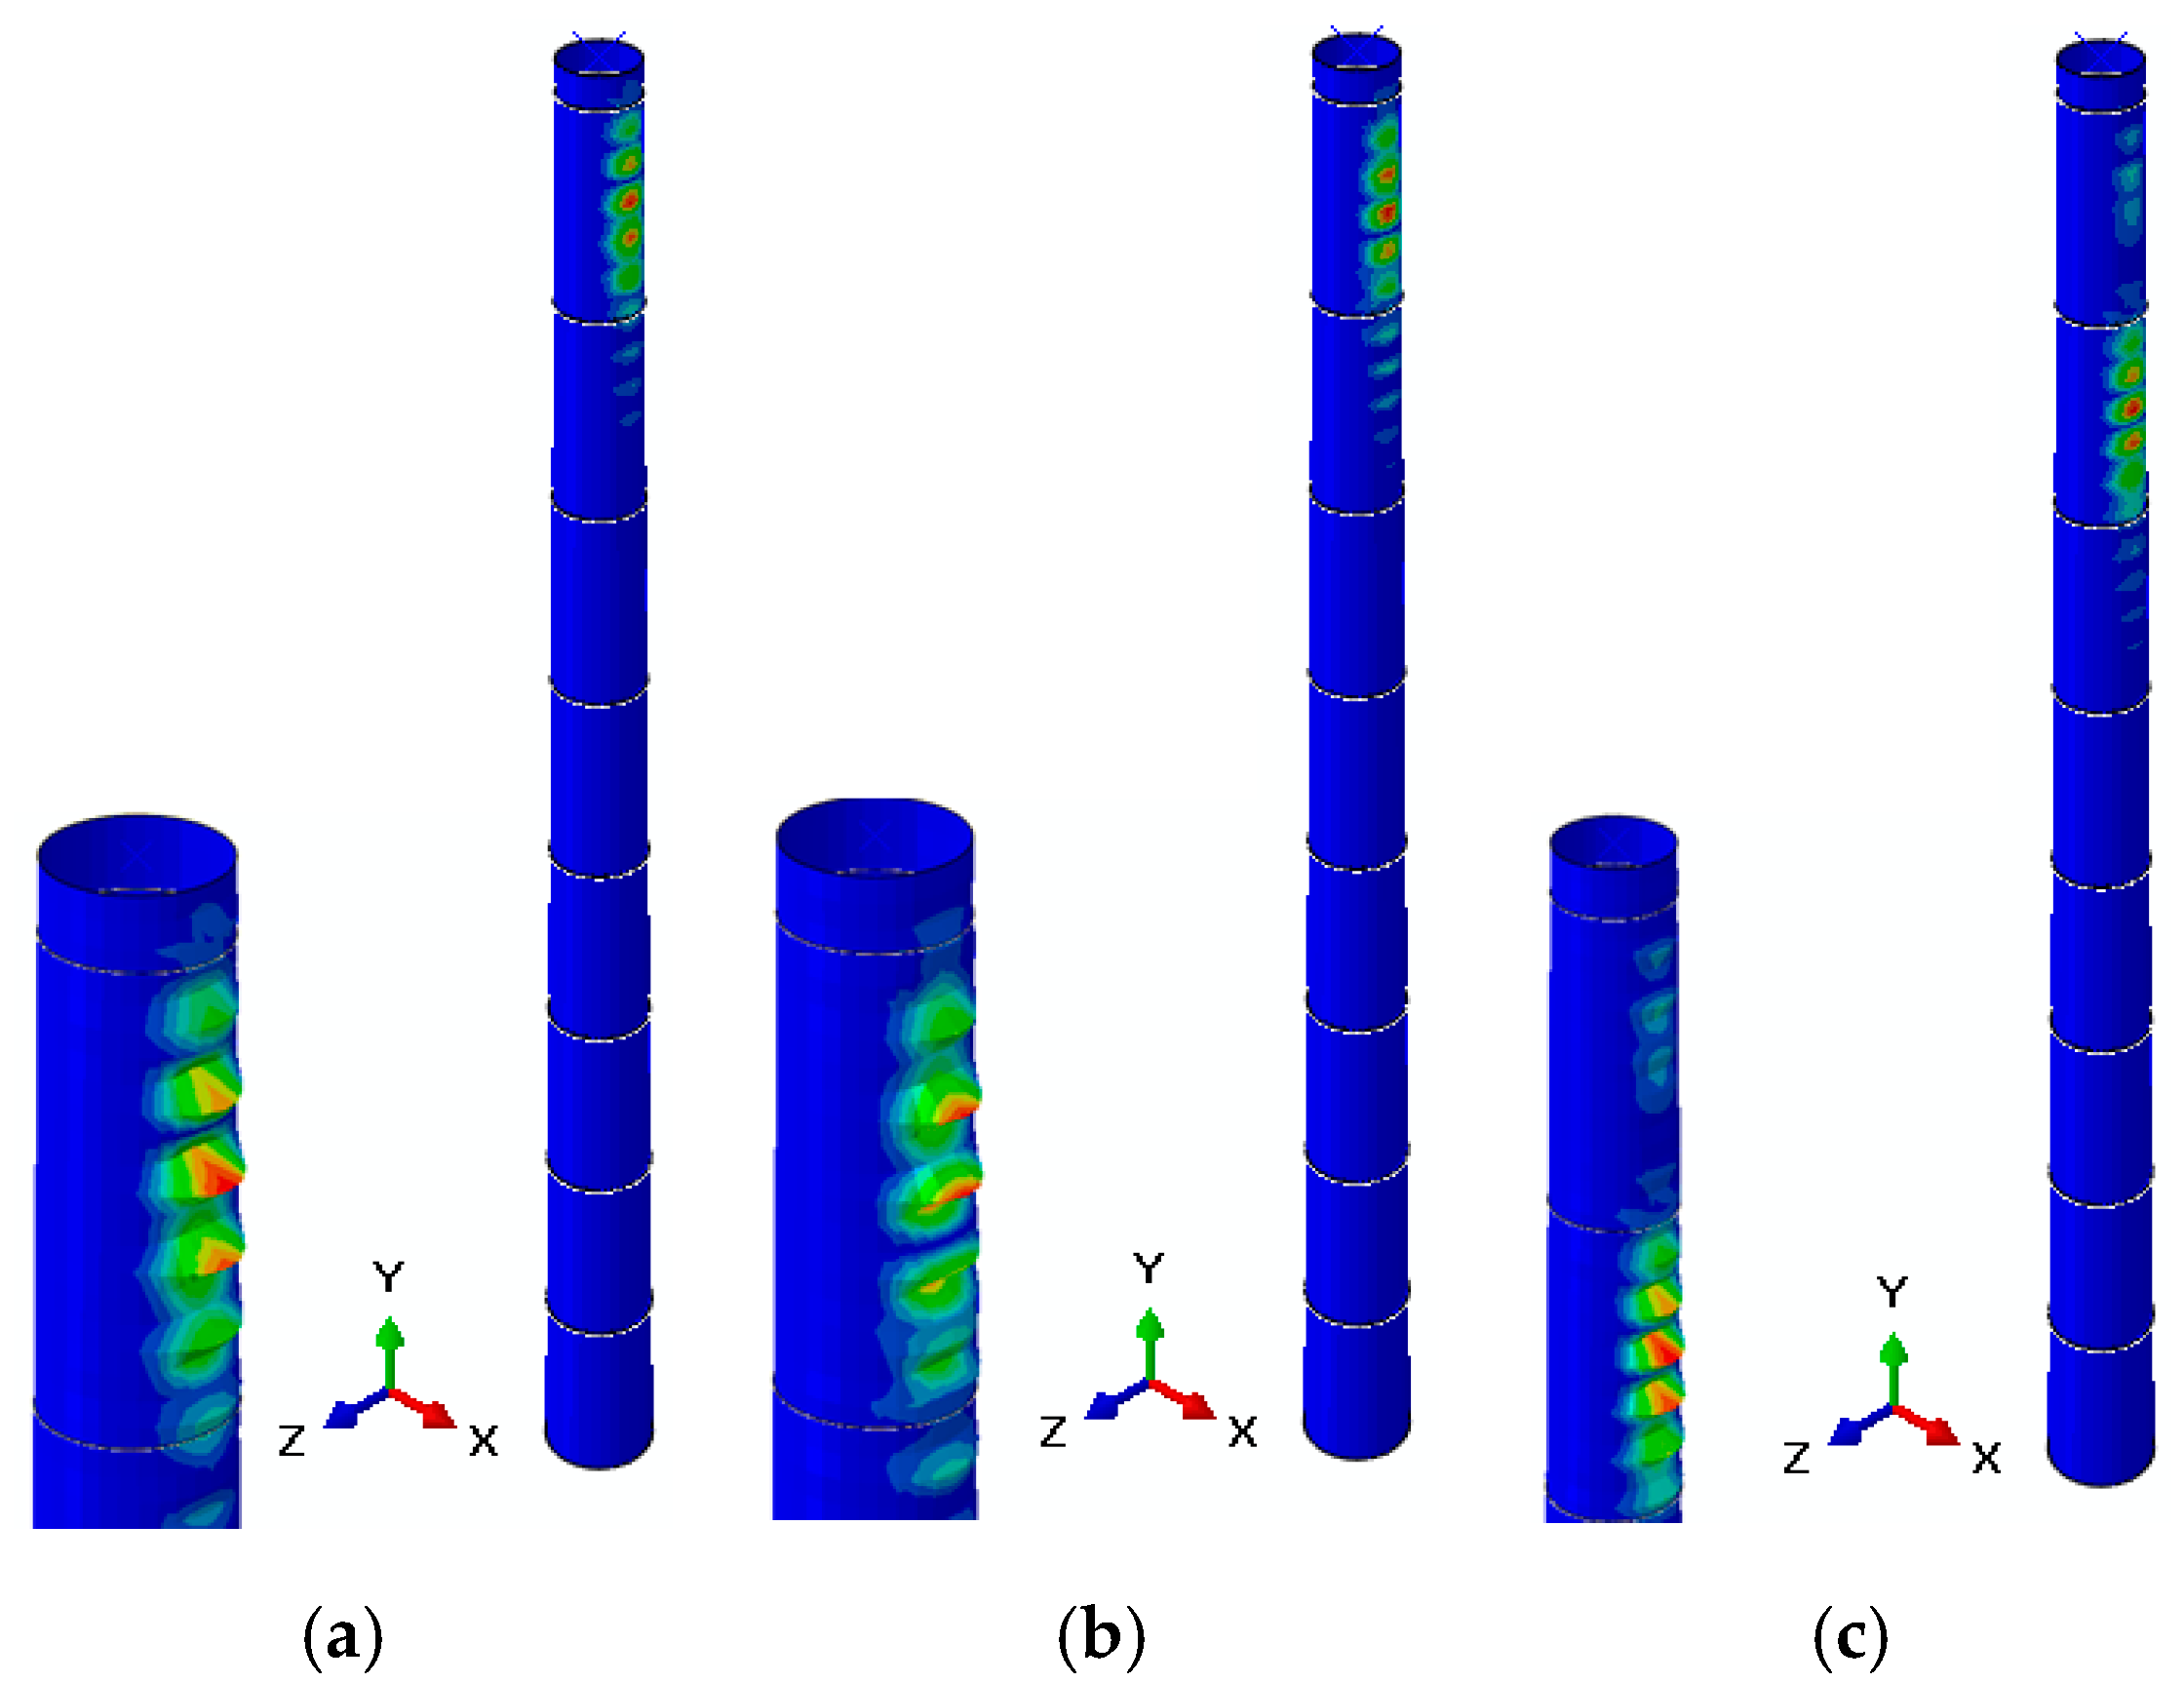
Taking into consideration the horizontal forces’ action on the nacelle/top of the tower, the buckling analysis of tower I is presented in Figure 17, whilst the nonlinear buckling responses of towers I, II, III, IV are depicted in Figure 18, whilst in Figure 19 the horizontal force versus displacements of towers I, II, III, IV are presented. The displacements in the x-axis in Figure 19 represent the horizontal displacements along the x-direction that is shown in Figure 18 (tower top) and the reaction force is the result at the tower root. It can be observed that modes 1, 2 and 3 are local modes in the vicinity of the tower base and they are similar to those of Figure 17. For post buckling behavior, the towers can translate in the x-axis direction due to the horizontal force. The maximum post buckling displacement of tower I is less than that of towers II, III and IV (Figure 18). According to Figure 19, the bearing capacity of towers I and IV are, respectively, 1.1 × 10⁸ N and 1.2 × 10⁸ N and the bearing capacity of towers II and III are close to 1.25 × 10⁸ N. The bearing capacity in the horizontal force of tower I is less than that of towers II, III and IV (Figure 19), whilst the bearing capacity in horizontal force of towers II and III are greater than those of towers I and IV. Therefore, towers II and III could be selected as a more appropriate option for a tower stiffened as such.
3.3.3. On the Effect of the Eccentricity
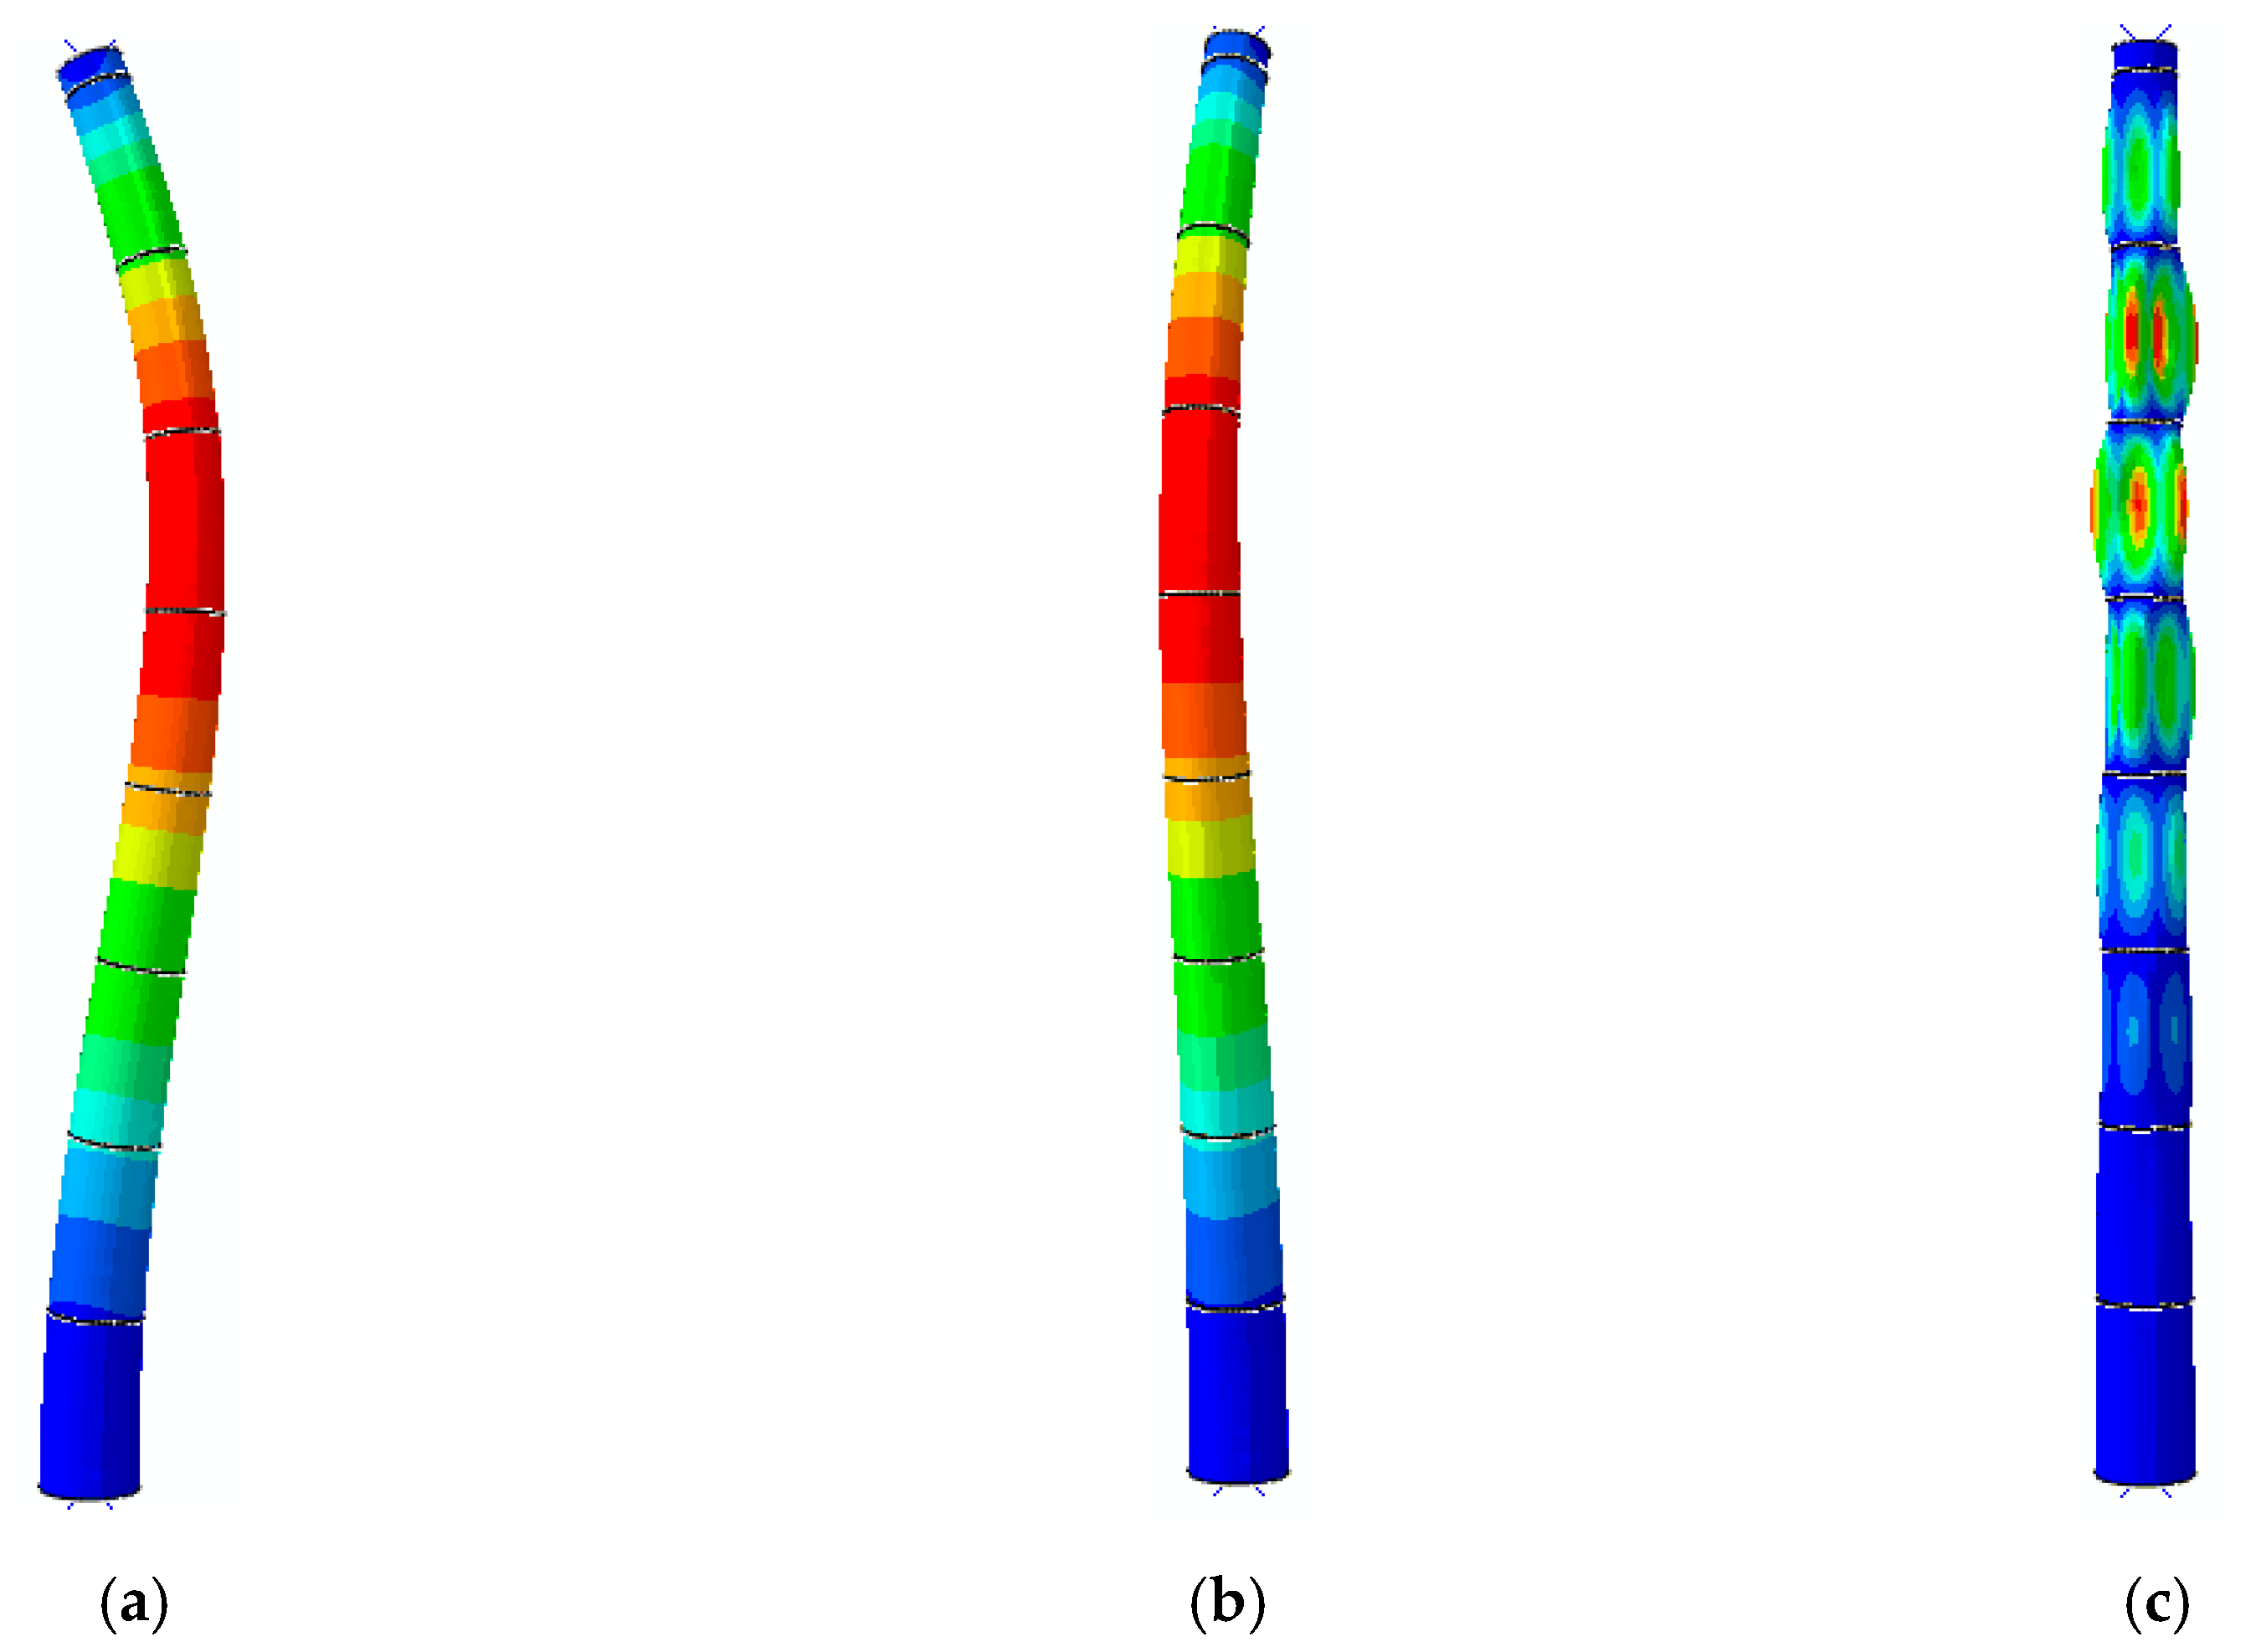
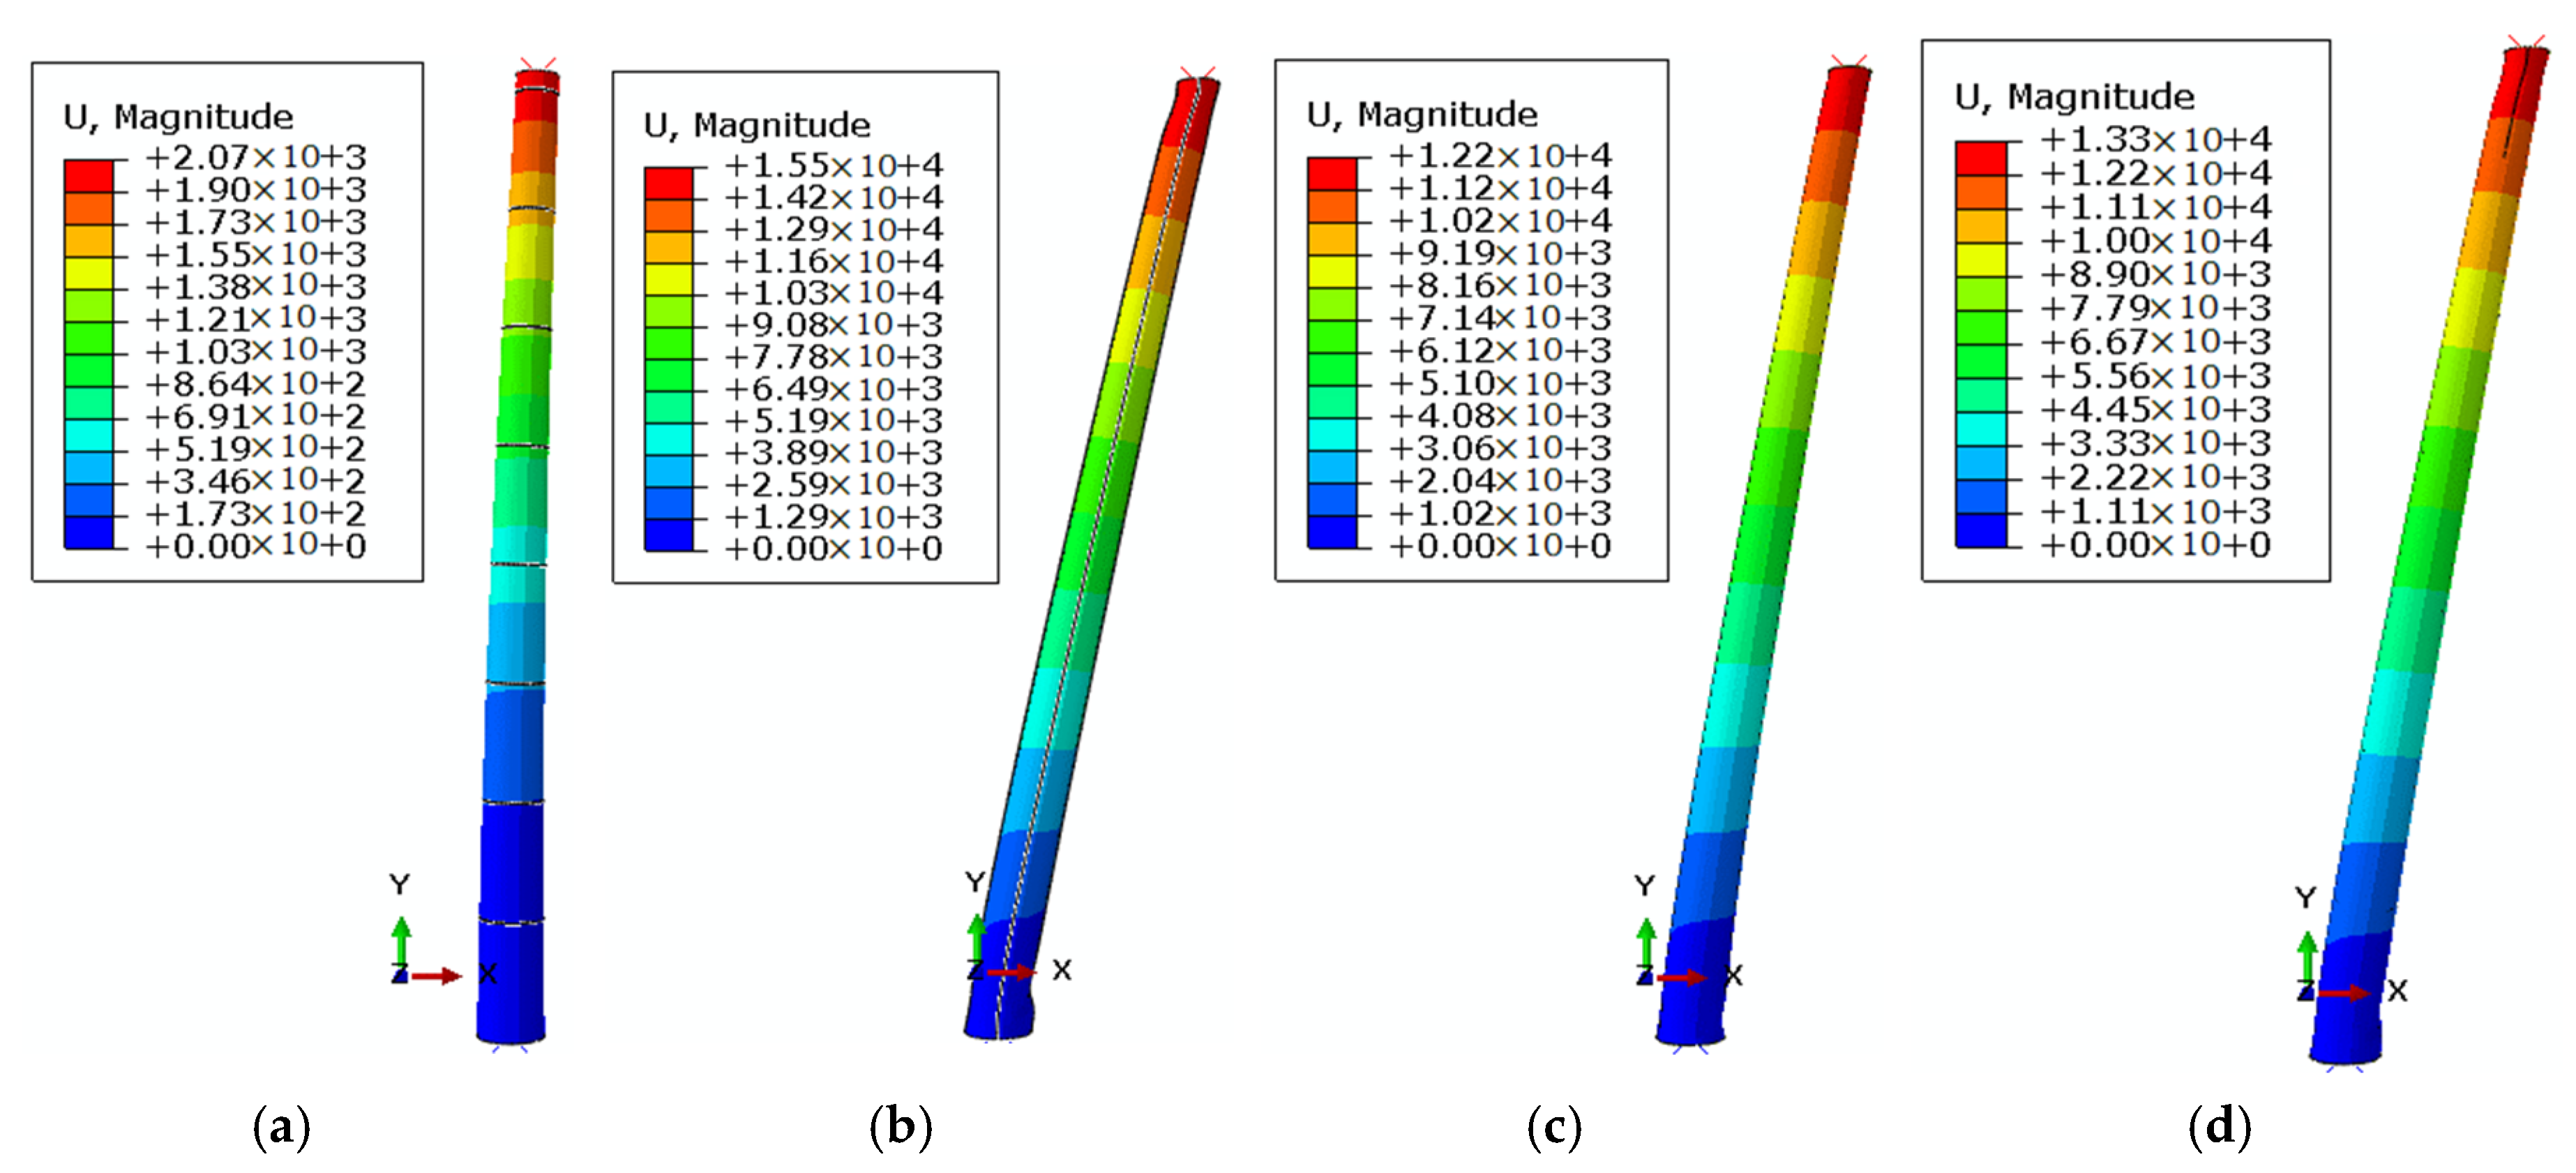
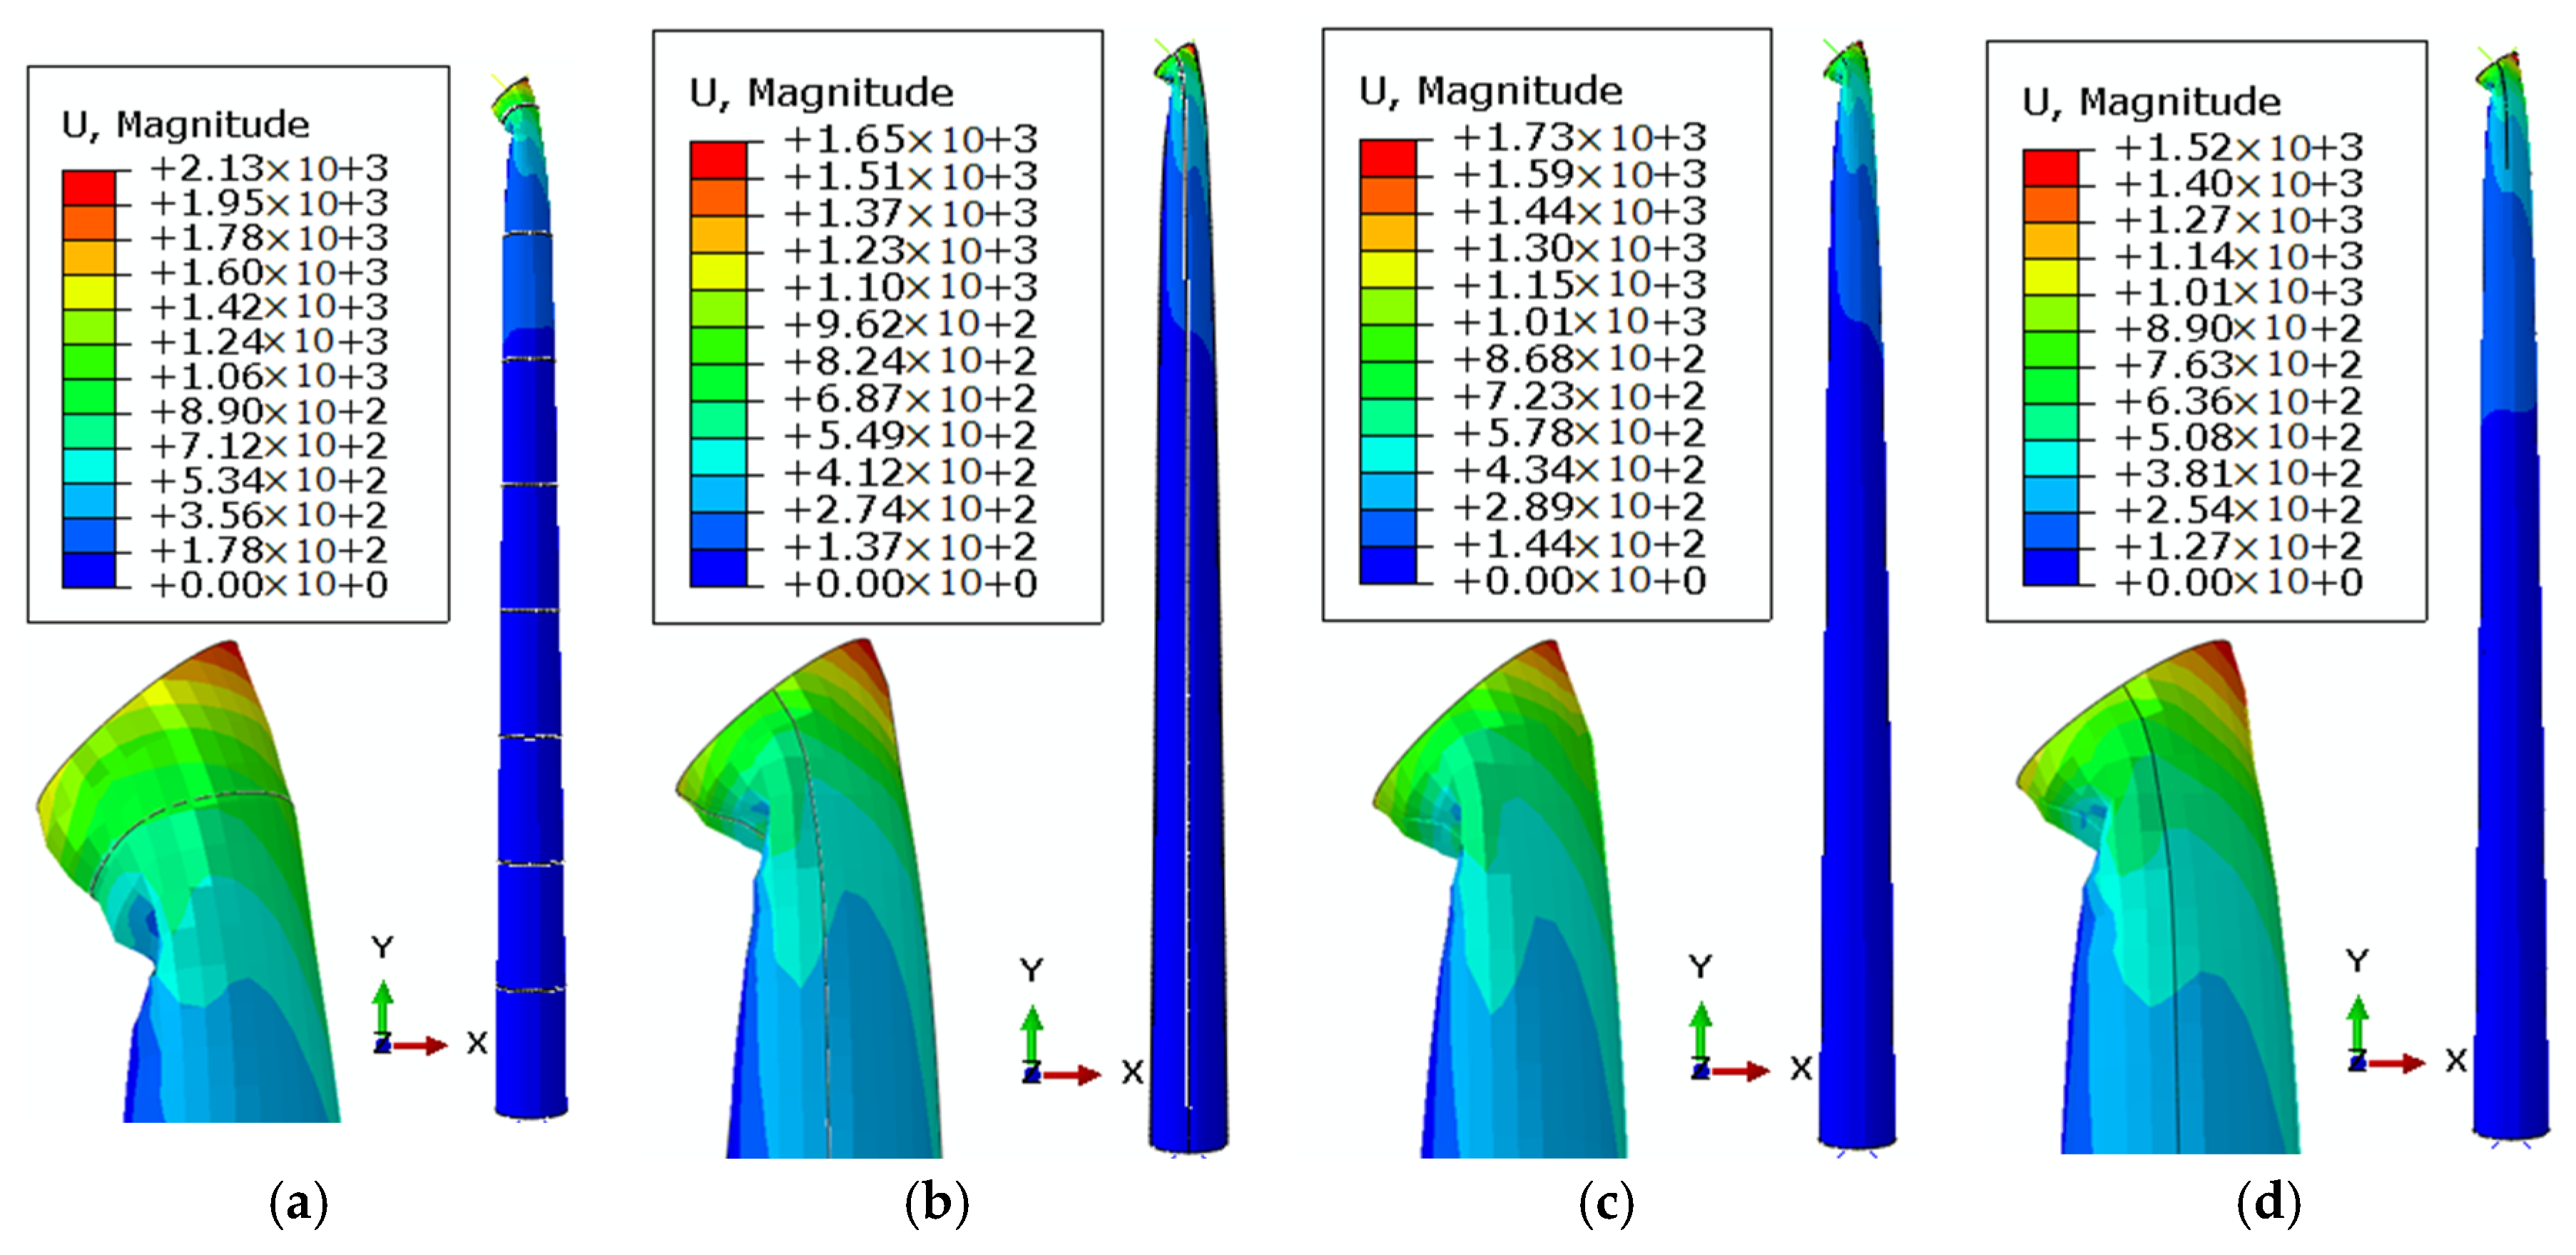
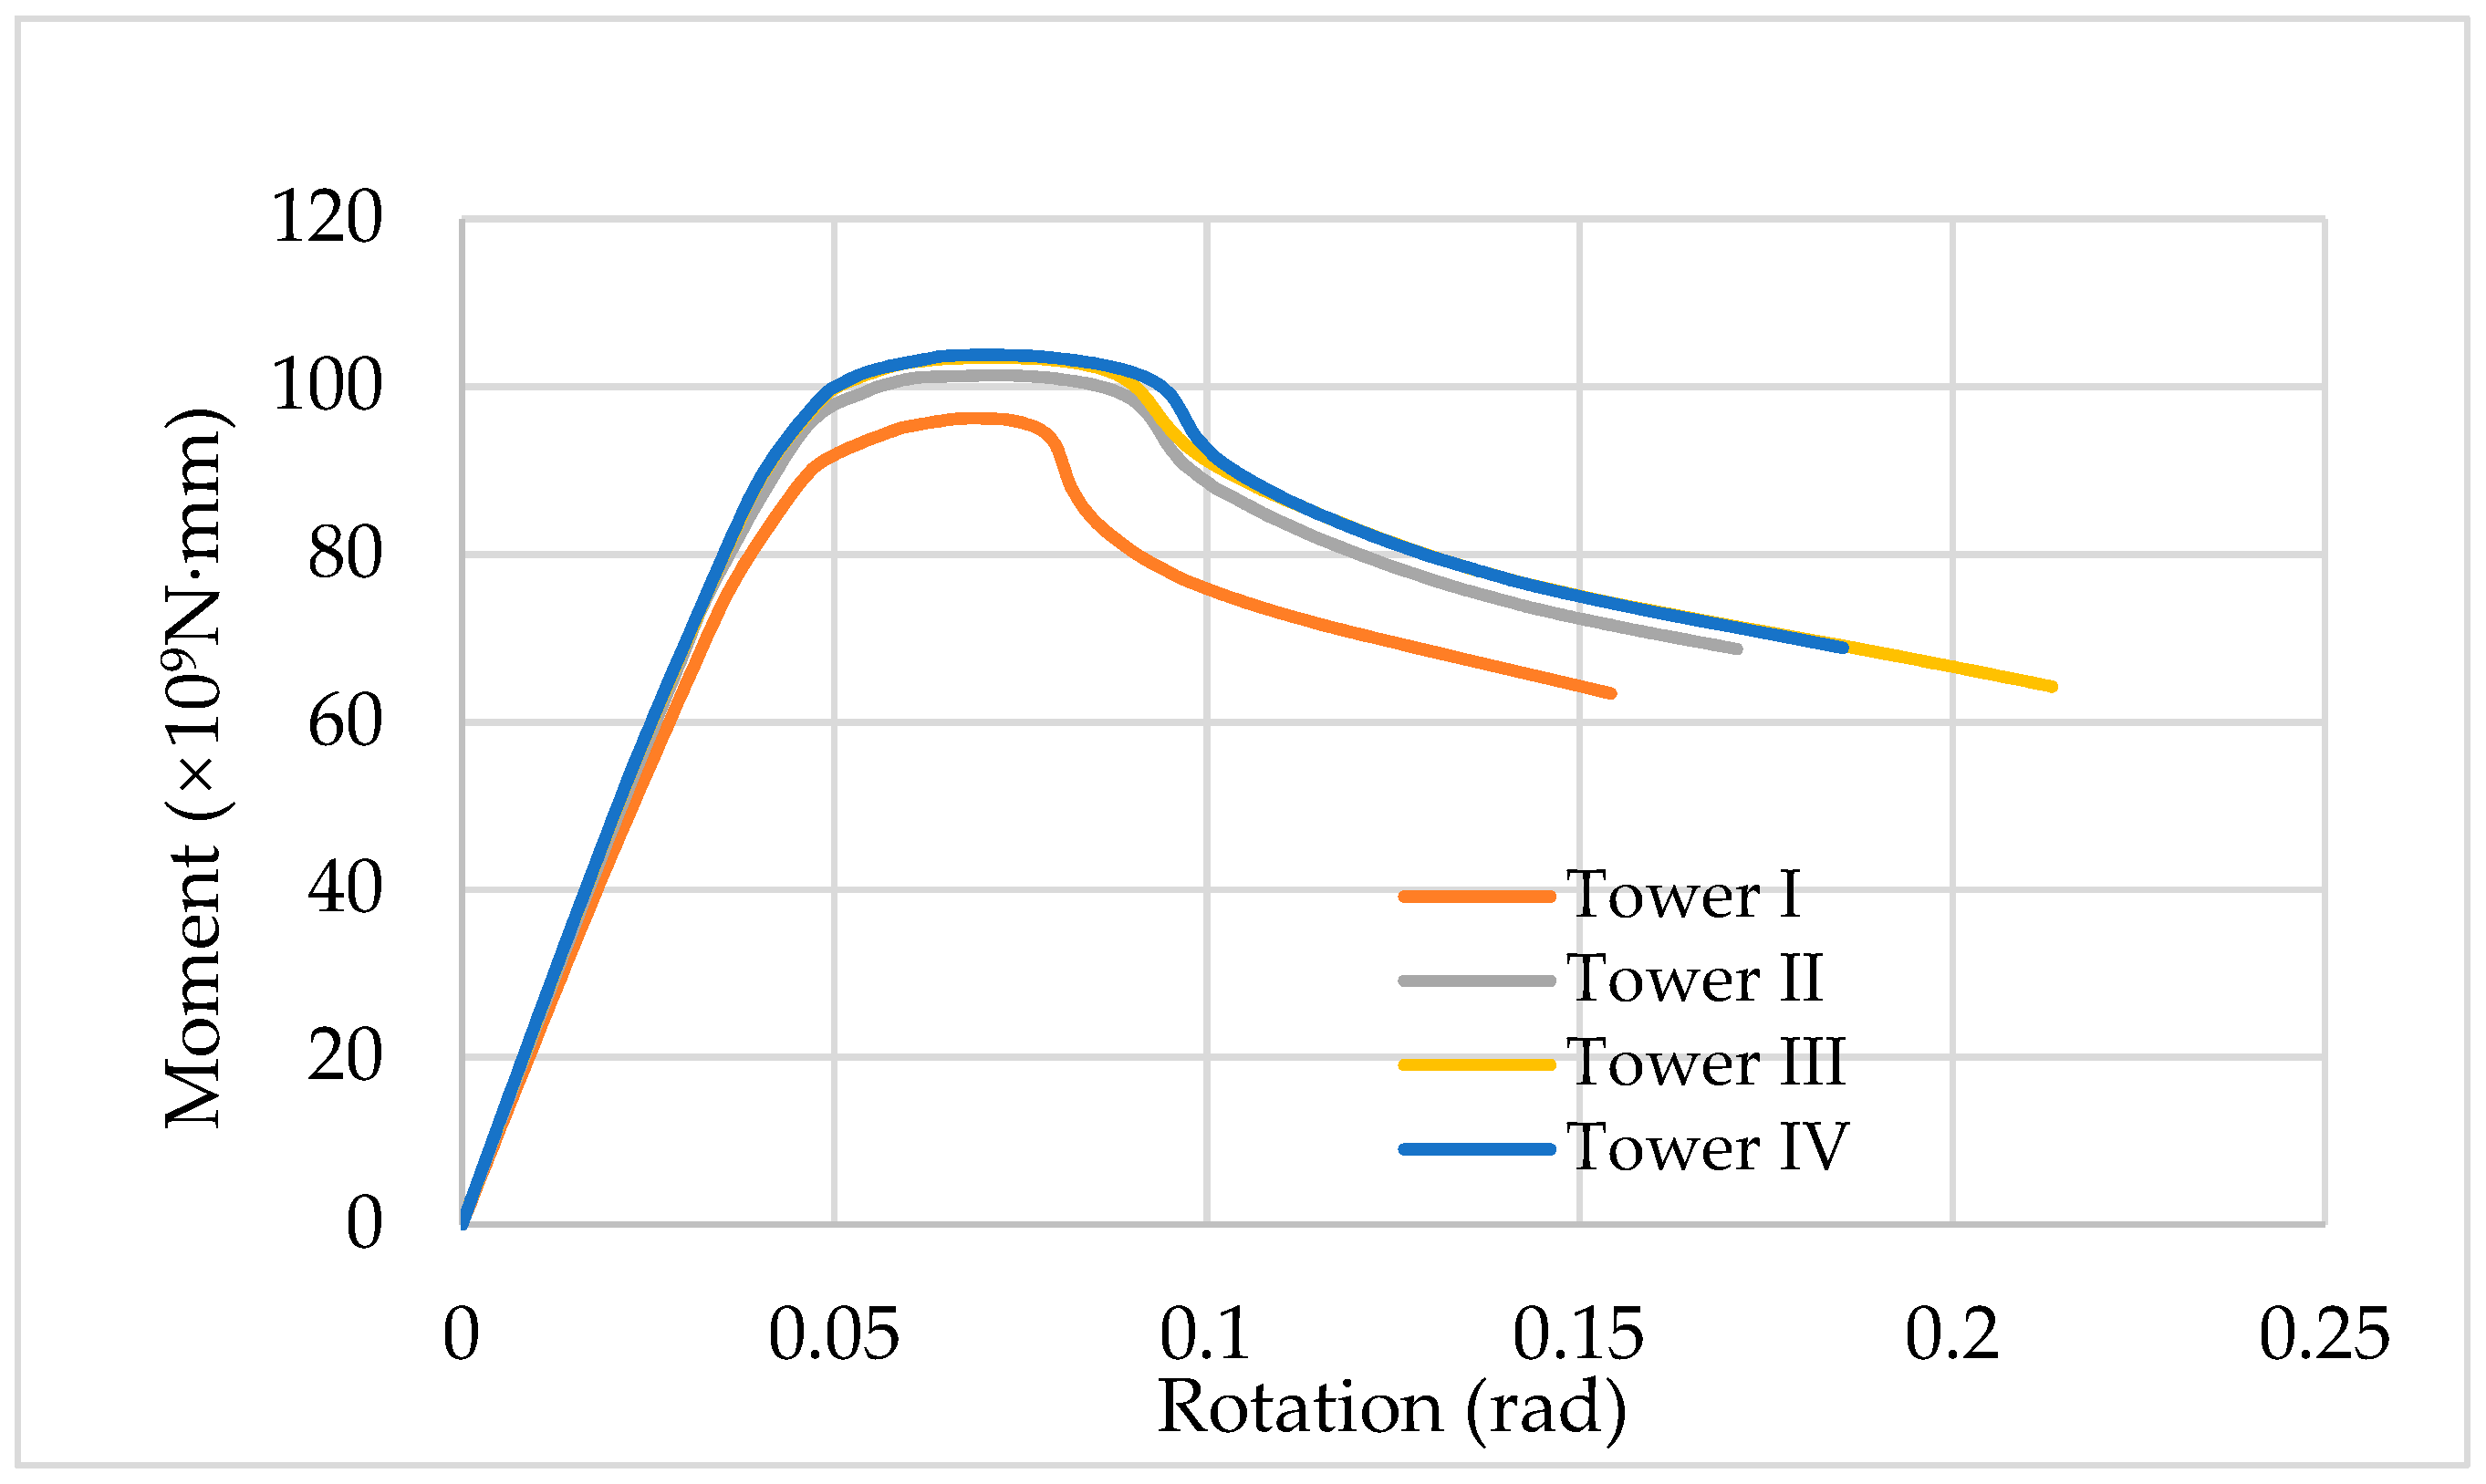
The eccentricity of the wind turbine that is placed on the top of tower from the center of the cross section of the tower leads to the development of an additional bending moment on the structure. With reference to this additional bending moment due to eccentricity, the buckling behavior of tower I is shown in Figure 20; modes 1, 2 and 3 of tower I are local modes in the vicinity of the tower top. Post buckling analysis of towers I, II, III, IV under moment is presented in Figure 21. Nonlinear buckling behavior of towers I, II, III, IV under moment leads to local bending modes and maximum deformation occurs on tower I. The graph of moment versus rotation of towers I, II, III, IV is presented in Figure 22. The rotation in x-axis in Figure 22 represents the rotation angle around the z-direction in Figure 21 of the tower top and the reaction force is the resultant of the tower bottom. According to Figure 21, the bearing capacity of towers I, II, III, IV are, respectively, 9.5 × 10¹⁰ N·mm, 1.0 × 10¹⁰ N·mm, 1.05 × 10¹⁰ N·mm and 1.05 × 10¹⁰ N·mm. Therefore, the bearing capacity of tower I is the minimum and the bearing capacity of towers III and IV are greater than those of tower II. It can be concluded that T-shaped stiffeners and orthogonal stiffeners are the optimal stiffening option for the tower under investigation.
3.4. Strength Analysis of Towers I, II, III, IV
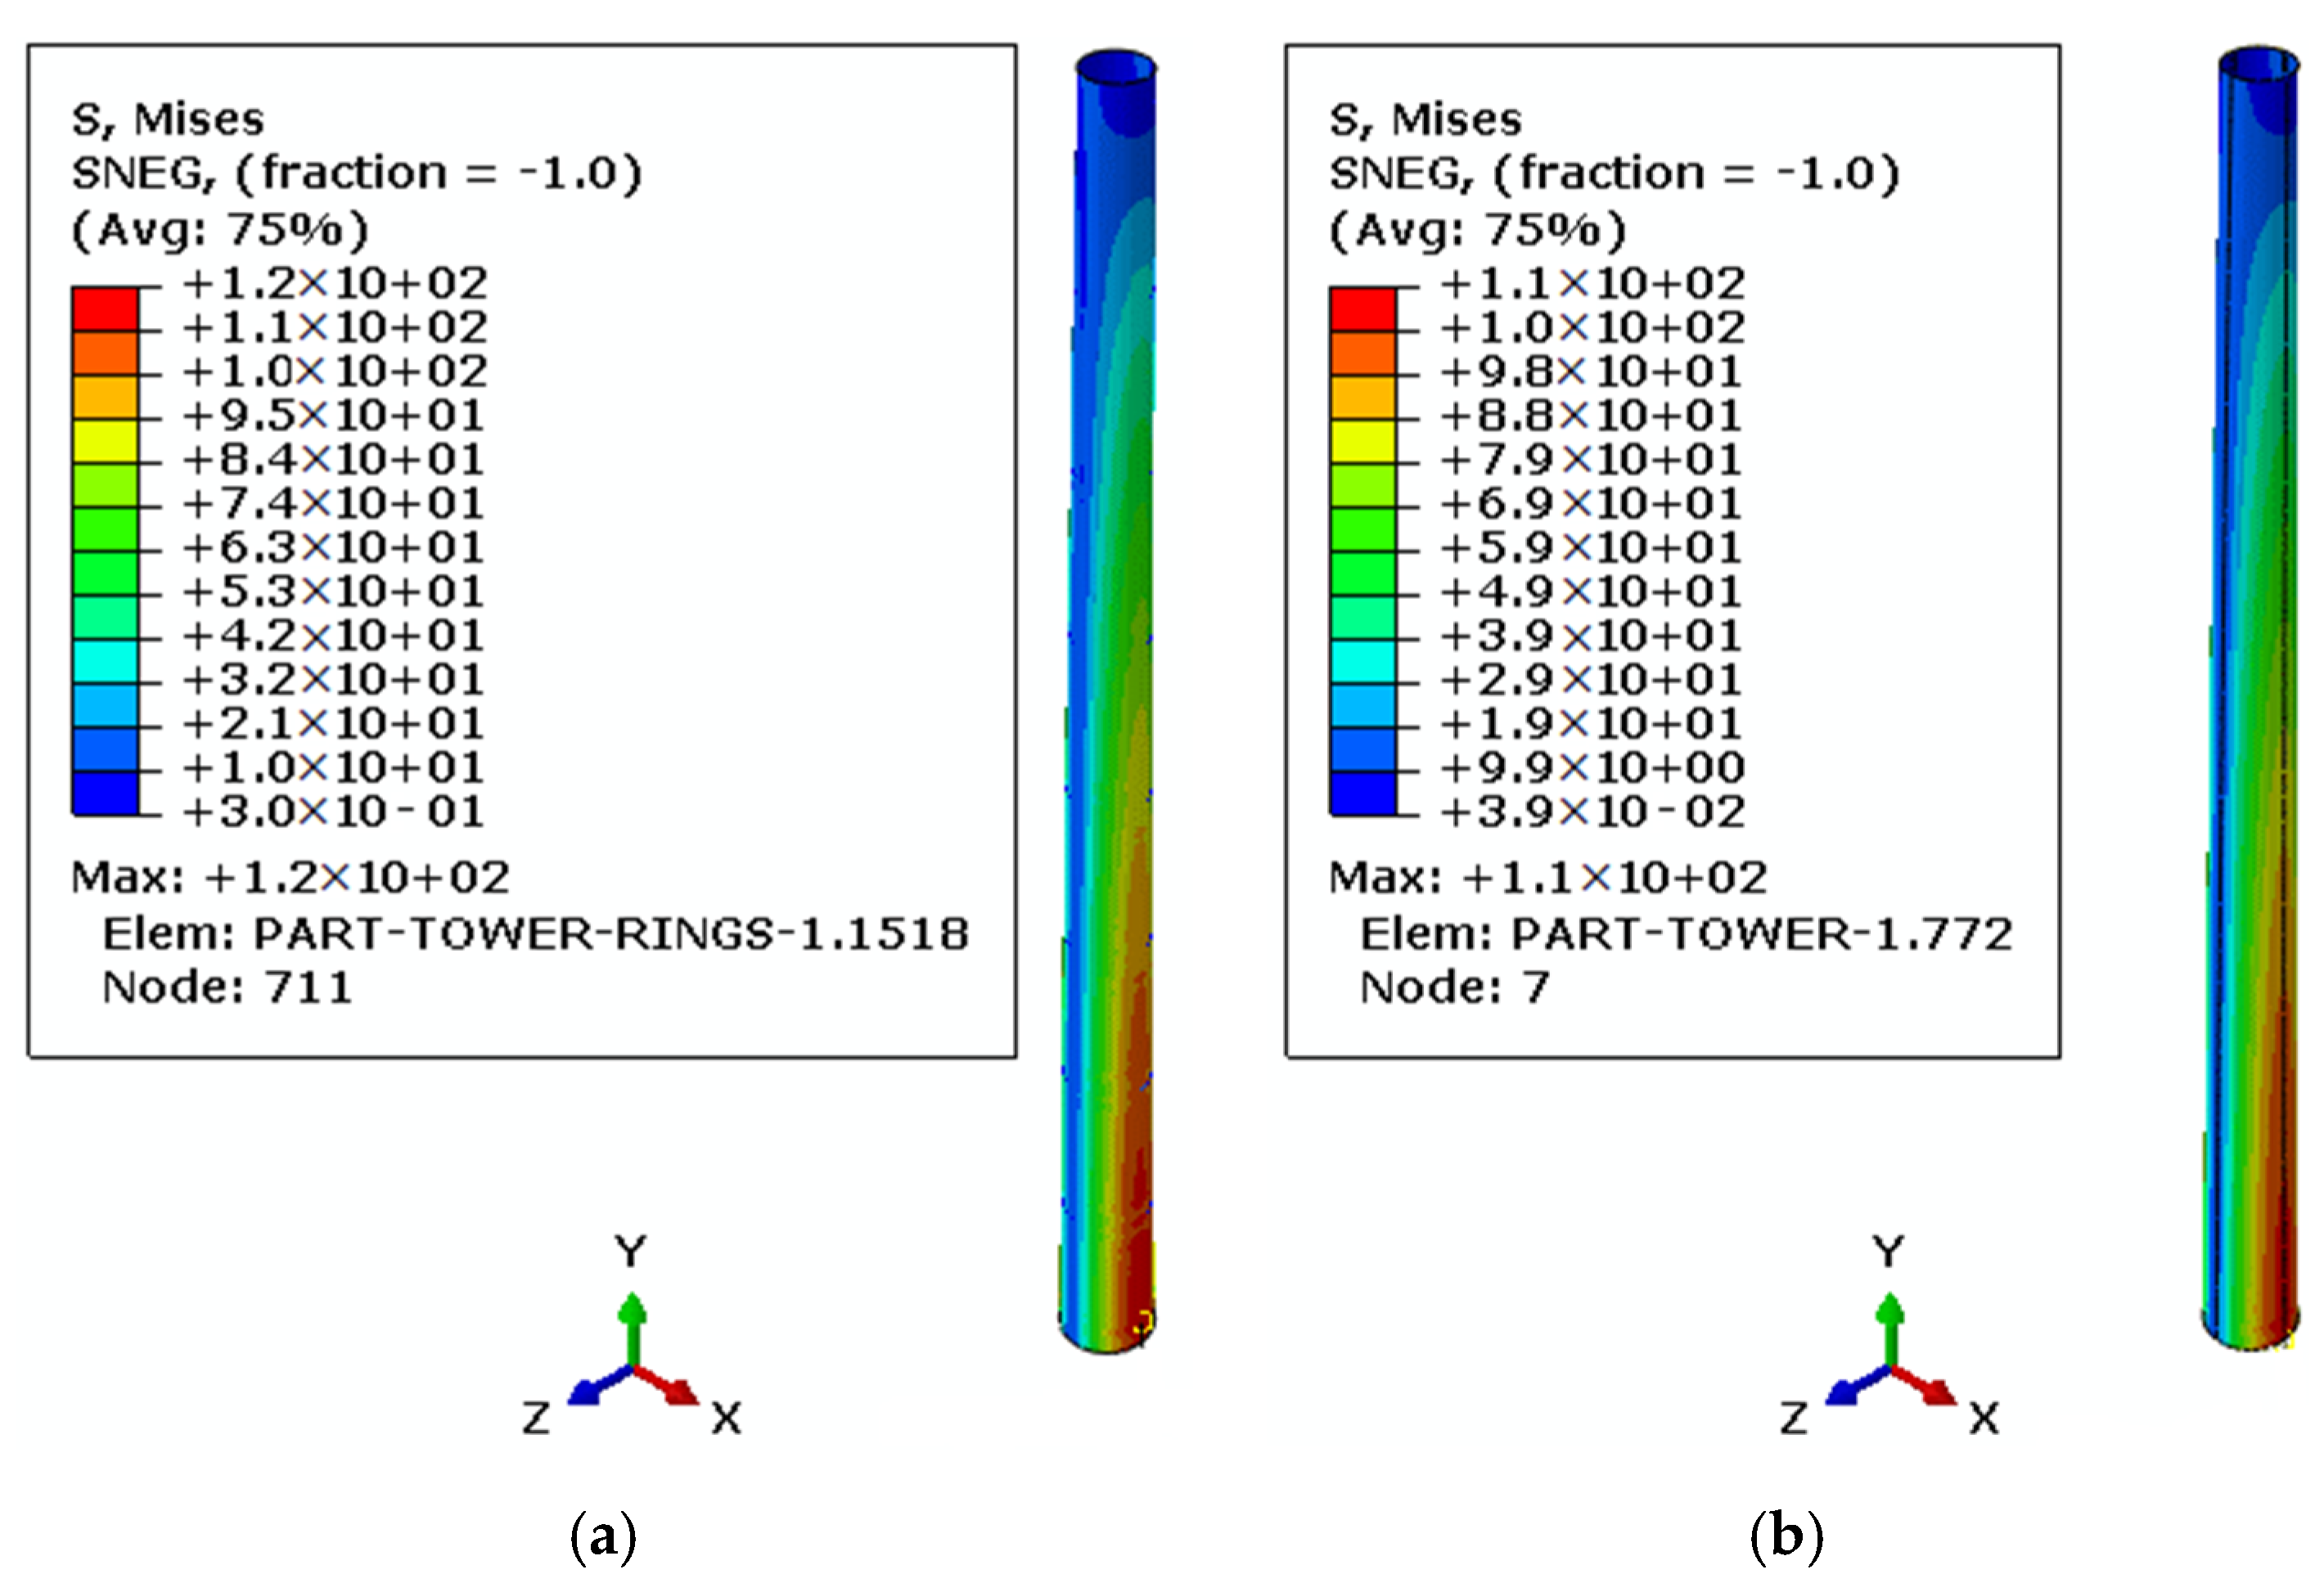
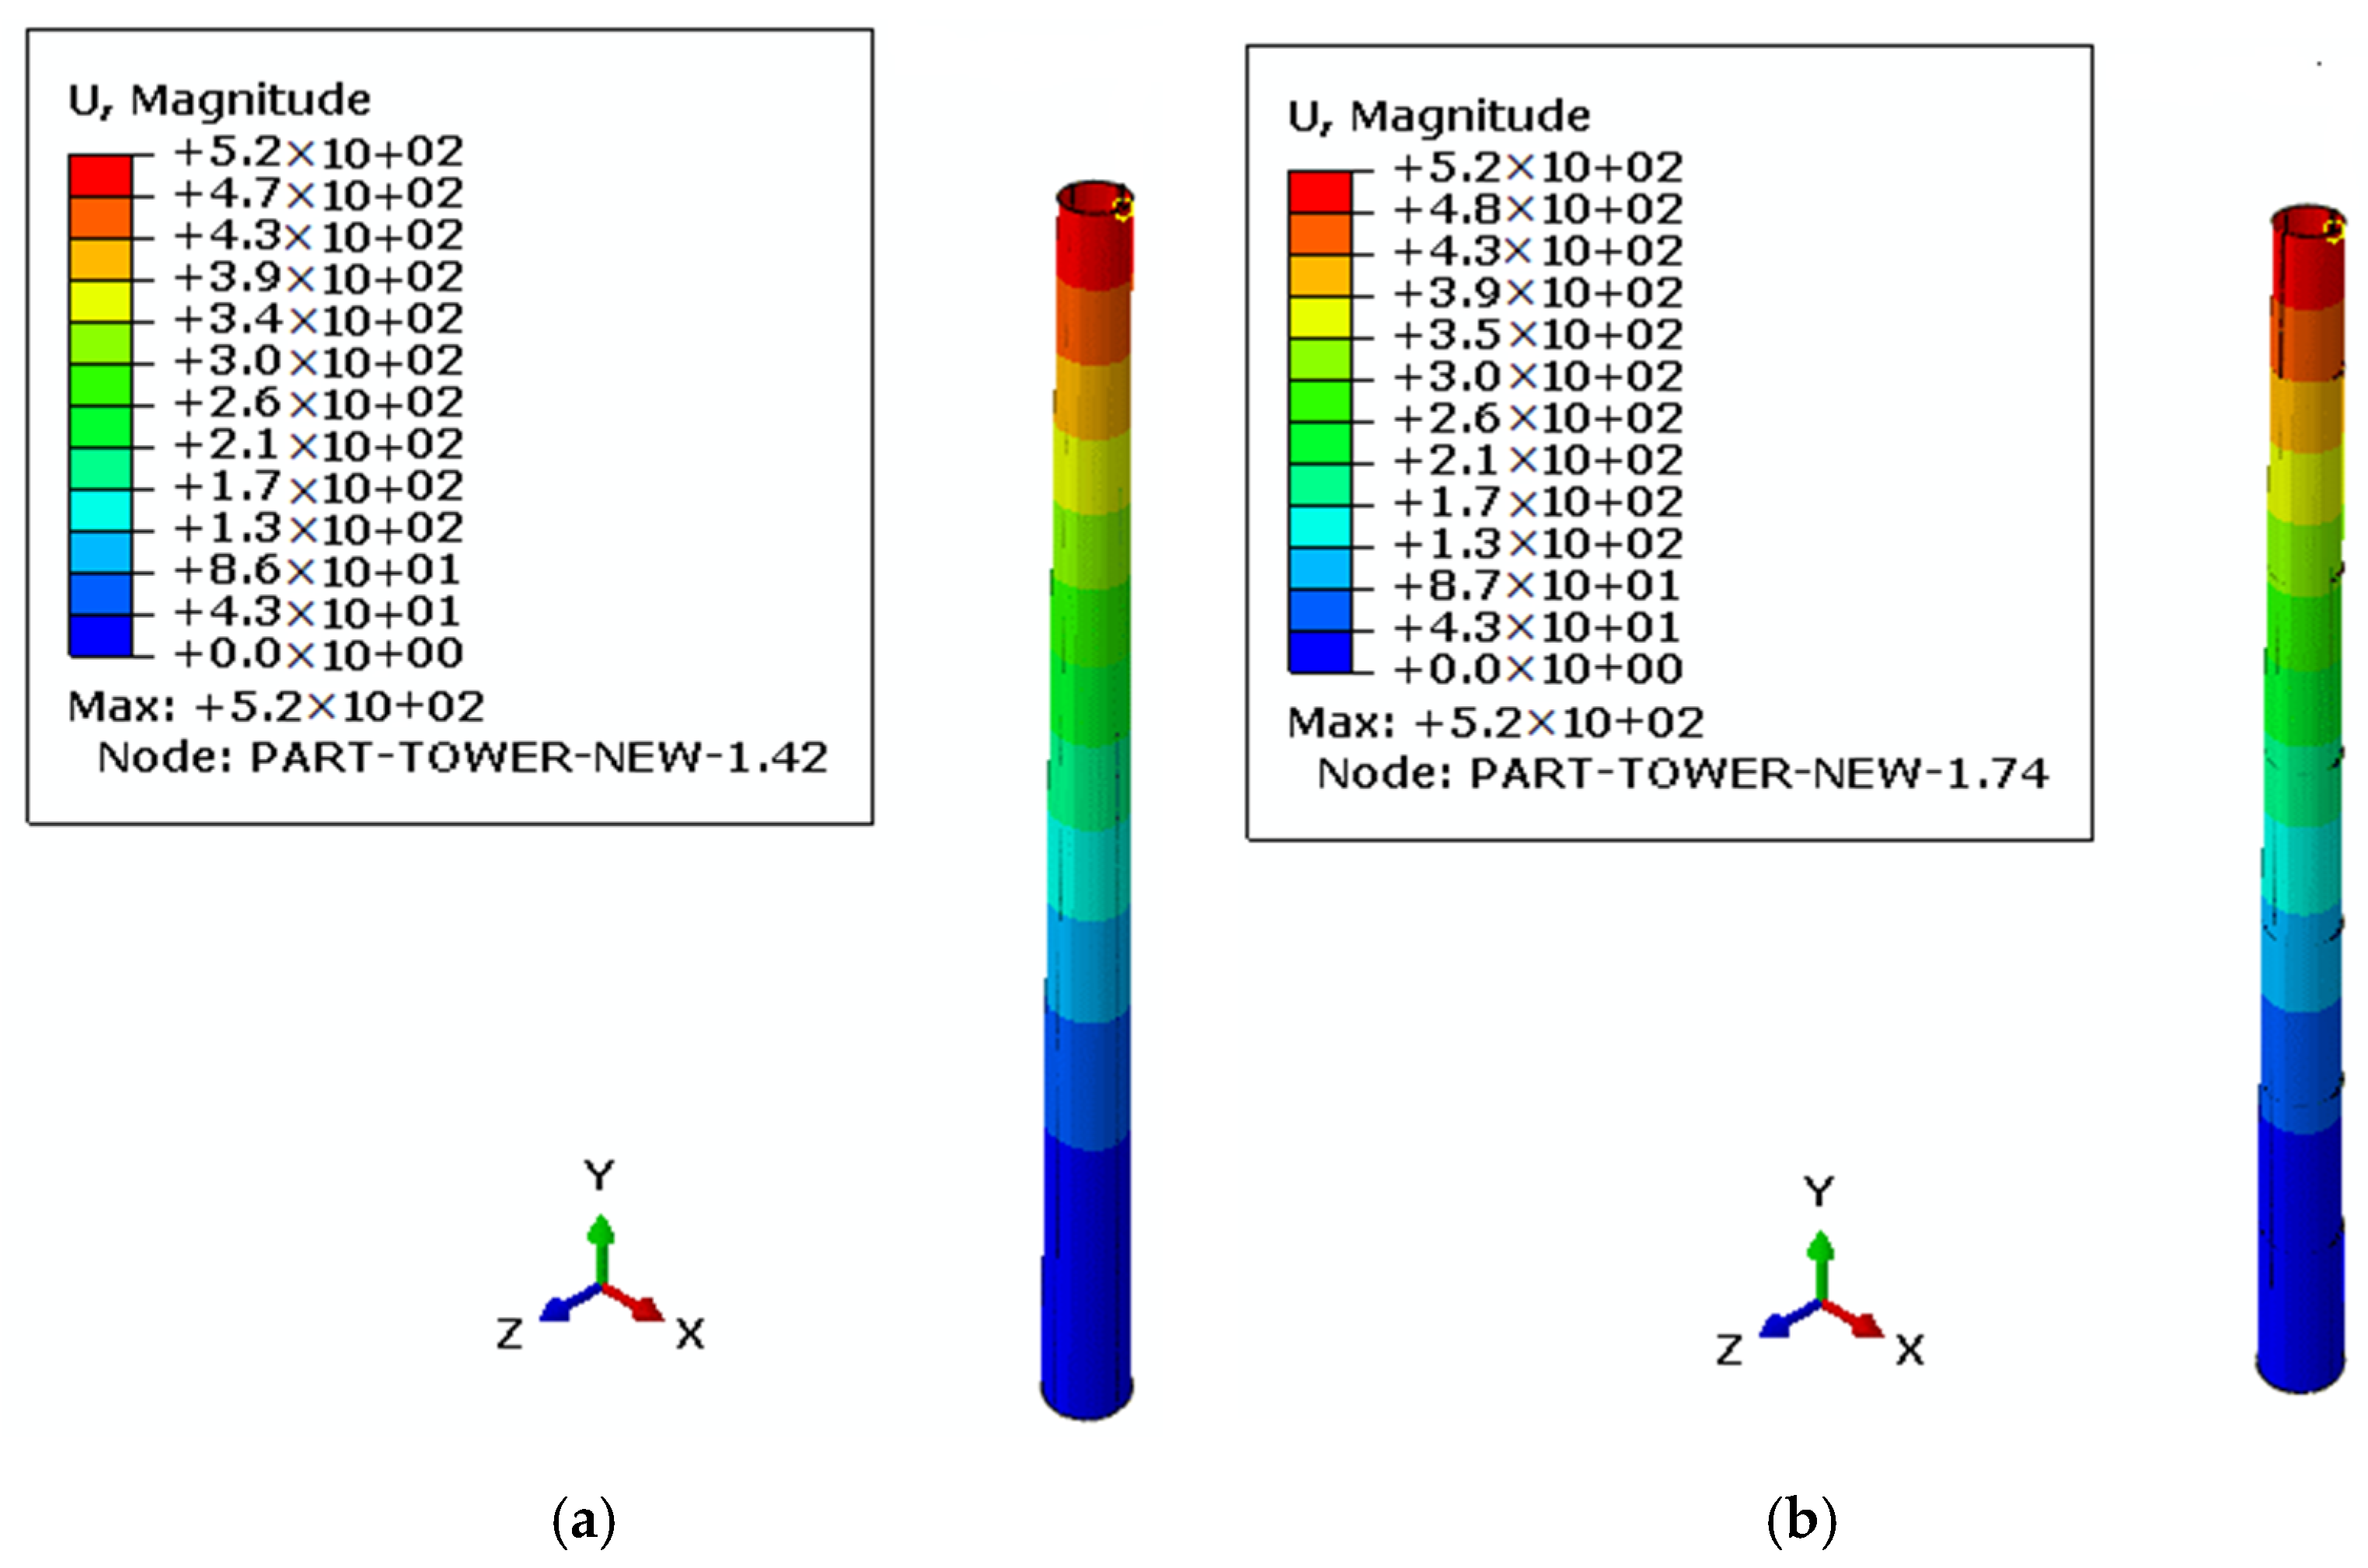
The aforementioned four stiffening schemes can stiffen the tower shell to different extents. Therefore, to exploit the best strengthening option, the structural response of towers I, II, III, IV under the environmental loadings of wind, water current and wave should be performed. Stress contours of towers I and II and displacement contours of towers III and IV in a marine environment are shown, respectively, in Figure 23 and Figure 24. Maximum von Mises stresses and displacements of towers I, II, III, IV under wind, current and wave loading are shown in Table 2. According to Figure 23 and Figure 24, the maximum stresses of towers I, II, III, IV occur at the base of the tower, whilst the maximum displacements of towers I, II, III, IV appear at the top. Maximum stresses and displacements of towers I, II, III, IV are, respectively, 127.2 MPa and 558.8 mm, 118.5 MPa and 526.5 mm, 117.4 MPa and 520.9 mm, 119.4 MPa and 527 mm. It can be observed that maximum stress and displacement of tower I is greater than those of towers II, III, IV in accordance to Table 2. Therefore, vertical stiffeners, T-shaped stiffeners and orthogonal stiffeners are better stiffening options than the one with stiffening rings. The sea states correspond to a 11 m/s wind speed, 0.3 m/s current speed and a 0.5 s wave period with an elevation of 44 mm.
4. Conclusions
In the present paper the angle of the environmental loading and the water depth are considered as variables to study their effect on the structural response of a tubular steel offshore wind turbine tower during the erection phase, i.e., without taking into consideration the loadings from the turbine and blades. Then, a numerical simulation approach is performed on a tall offshore tower aiming to calculate its bearing capacity and to explore the optimum stiffening option of the tower shell.
This investigation led to significant results and in particular, the displacement of the tower along its height can reach peak values when the direction angle of the wind pressure is in line with or orthogonal to that of the sea current pressure. In addition, the rotation of the tower model is at its minimum in the direction angles of 0°, 90° and 180°, whilst its rotation is maximized in the direction angles of 45° and 135°. In the juncture area of wind and sea current and wave field, the rotation of the tower can occur in a swaying manner. The reaction moments around the x-axis and z-axis reach their maximum under the direction angles of 0°, 90° and 180°, whilst the reaction moments around the y-axis can reach their peak values under the direction angles of 90° and 180°.
In the buckling analysis, gravity, horizontal forces and moments are, respectively, considered as the loadings that cause the collapse of the tubular towers due to buckling. Imperfections are also imported to the tubular tower models to obtain the respective nonlinear buckling modes. The bearing capacity of the towers with four different stiffening schemes are compared each other to obtain the optimum stiffening option, and it is concluded that the stiffening ring is the weakest option as a strengthening technique to avoid buckling collapse, whilst the T-shaped stiffener scheme is the most appropriate stiffening option and to enhance the strength of the tubular tower, the vertical stiffener, the T-shaped stiffener and the orthogonal stiffener schemes are better options than the ring schemes.
Author Contributions
Conceptualization, Y.H., J.Y. and C.B.; methodology, Y.H.; software, Y.H.; validation, Y.H.; formal analysis, Y.H.; investigation, Y.H.; resources, Y.H.; data curation, Y.H.; writing—original draft preparation, Y.H.; writing—review and editing, Y.H., J.Y. and C.B.; visualization, Y.H.; supervision, J.Y. and C.B.; project administration, J.Y. and C.B.; funding acquisition, Y.H., J.Y. and C.B. All authors have read and agreed to the published version of the manuscript.
Funding
The first author acknowledges with thanks the research financial support provided by National Natural Science Foundation of China (No. 51808335). The financial support of the present research activity by the European Union’s Horizon 2020 Research and Innovation Programme under the Marie Sklodowska-Curie Grant Agreement No. 793316 is also gratefully acknowledged by the first and third authors. The third author acknowledges also with thanks the IGI Global Challenges Funding Scheme of the University of Birmingham (Project Nr 3035).
Conflicts of Interest
The authors declare no conflict of interest.
References
- Arapogianni, A.; Moccia, J. Wind in Our Sails: The Coming of Europe’s Offshore Wind Energy Industry; European Wind Energy Association: Brussels, Belgium, 2011. [Google Scholar]
- Wang, L.; Ishihara, T. A study of the effects of foundation uplift on the seismic loading of wind turbine tower and shallow foundation using a new dynamic Winkler model. Eng. Struct. 2020, 219, 110745. [Google Scholar] [CrossRef]
- Ko, Y.-Y. A simplified structural model for monopile-supported offshore wind turbines with tapered towers. Renew. Energy 2020, 156, 777–790. [Google Scholar] [CrossRef]
- Li, M.; Kefal, A.; Oterkus, E.; Oterkus, S. Structural health monitoring of an offshore wind turbine tower using iFEM methodology. Ocean Eng. 2020, 204, 107291. [Google Scholar] [CrossRef]
- Sadowski, A.J.; Camara, A.; Málaga-Chuquitaype, C.; Dai, K. Seismic analysis of a tall metal wind turbine support tower with realistic geometric imperfections. Earthq. Eng. Struct. Dyn. 2017, 46, 201–219. [Google Scholar] [CrossRef] [Green Version]
- Jin, Q.; Li, V.C. Structural and durability assessment of ECC/concrete dual-layer system for tall wind turbine towers. Eng. Struct. 2019, 196, 109338. [Google Scholar] [CrossRef]
- Fu, B.; Zhao, J.; Li, B.; Yao, J.; Teifouet, A.R.M.; Sun, L.; Wang, Z. Fatigue reliability analysis of wind turbine tower under random wind load. Struct. Saf. 2020, 87, 101982. [Google Scholar] [CrossRef]
- Huo, T.; Tong, L. An approach to wind-induced fatigue analysis of wind turbine tubular towers. J. Constr. Steel Res. 2020, 166, 105917. [Google Scholar] [CrossRef]
- Qiu, B.; Lu, Y.; Sun, L.; Qu, X.; Xue, Y.; Tong, F. Research on the damage prediction method of offshore wind turbine tower structure based on improved neural network. Measurement 2020, 151, 107141. [Google Scholar] [CrossRef]
- Abraham, A.; Dasari, T.; Hong, J. Effect of turbine nacelle and tower on the near wake of a utility-scale wind turbine. J. Wind Eng. Ind. Aerodyn. 2019, 193, 103981. [Google Scholar] [CrossRef] [Green Version]
- Stavridou, N.; Efthymiou, E.; Gerasimidis, S.; Baniotopoulos, C.C. Investigation of stiffening scheme effectiveness towards buckling stability enhancement in tubular steel wind turbine towers. Steel Compos. Struct. 2015, 19, 1115–1144. [Google Scholar] [CrossRef]
- Gkantou, M.; Rebelo, C.; Baniotopoulos, C. Life Cycle Assessment of Tall Onshore Hybrid Steel Wind Turbine Towers. Energies 2020, 13, 3950. [Google Scholar] [CrossRef]
- Yadav, K.K.; Gerasimidis, S. Imperfection insensitive thin cylindrical shells for next generation wind turbine towers. J. Constr. Steel Res. 2020, 172, 106228. [Google Scholar] [CrossRef]
- Koulatsou, K.G.; Kazakis, G.; Gantes, C.J.; Lagaros, N.D. Resonance Investigation and its Effects on Weight Optimization of Tubular Steel Wind Turbine Towers, The 1st International Conference on Optimization-Driven Architectural Design (OPTARCH 2019). Procedia Manuf. 2020, 44, 4–11. [Google Scholar] [CrossRef]
- O’Leary, K.; Pakrashi, V.; Kelliher, D. Optimization of composite material tower for offshore wind turbine structures. Renew. Energy 2019, 140, 928–942. [Google Scholar] [CrossRef]
- Dimopoulos, C.A.; Gantes, C.J. Comparison of stiffening types of the cutout in tubular wind turbine towers. J. Constr. Steel Res. 2013, 83, 62–74. [Google Scholar] [CrossRef]
- Jay, A.; Myers, A.T.; Mirzaie, F.; Mahmoud, A.; Torabian, S.; Smith, E.; Schafer, B.W. Large scale bending tests of slender, tapered, spirally welded steel tubes. J. Struct. Eng. 2016, 142, 04016136. [Google Scholar] [CrossRef]
- Alonso-Martinez, M.; Felipe, J.M.A.; Alvarez-Rabanal, P.; Díaz, J.J.C. Wind turbine tower collapse due to flange failure: FEM and DOE analyses. Eng. Fail. Anal. 2019, 104, 932–949. [Google Scholar] [CrossRef]
- Patil, A.; Jung, S.; Kwon, O.-S. Structural performance of a parked wind turbine tower subjected to strong ground motions. Eng. Struct. 2016, 120, 92–102. [Google Scholar] [CrossRef]
- Zuo, H.; Bi, K.; Hao, H.; Xin, Y.; Li, J.; Li, C. Fragility analyses of offshore wind turbines subjected to aerodynamic and sea wave loadings. Renew. Energy 2020, 160, 1269–1282. [Google Scholar] [CrossRef]
- Zhang, X.-L.; Liu, J.-X.; Han, Y.; Du, X.-L. A framework for evaluating the bearing capacity of offshore wind power foundation under complex loadings. Appl. Ocean Res. 2018, 80, 66–78. [Google Scholar] [CrossRef]
- ABAQUS/Standard and ABAQUS/Explicit-Version 6.8-1; Abaqus Theory Manual; Dassault System: Vélizy-Villacoublay, France, 2008; Available online: https://www.doc88.com/p-439722564721.html (accessed on 26 September 2020).
- Hu, Y.; Yang, J.; Baniotopoulos, C.; Wang, X.; Deng, X. Dynamic analysis of offshore steel wind turbine towers subjected to wind, wave and current loading during construction. Ocean Eng. 2020, 216, 108084. [Google Scholar] [CrossRef]
- ENV 1991-01-04: Actions on Structures; CEN: Brussels, Belgium, 1991.
- Morison, J.R.; Johnson, J.W.; Schaaf, S.A. The force exerted by surface waves on piles. J. Pet. Technol. 1950, 2, 149–154. [Google Scholar] [CrossRef]
- Newman, J.N. Marine Hydrodynamics; The MIT Press: Cambridge, MA, USA, 1977. [Google Scholar]
- Hu, Y.; Baniotopoulos, C.C.; Yang, J. Effect of internal stiffening rings on the structural response of steel wind turbine towers. Eng. Struct. 2014, 81, 148–161. [Google Scholar] [CrossRef]
- Hu, Y.; Baniotopoulos, C.C.; Yang, J. Repowering Steel Tubular Wind Turbine Towers Enhancing them by Internal Stiffening Rings. Energies 2020, 13, 1538. [Google Scholar] [CrossRef] [Green Version]
Figure 1.
Experimental setup of the tower model.

Figure 2.
Dimensions of the wind turbine tower and wind, current and wave loading profile.

Figure 3.
Comparison of time histories of the displacement at point C of the tower model.

Figure 4.
The four lines placement along the tower model regarding the direction angle β. (a) the finite element model with lines 1, 2, 3 and 4; (b) the angle β between wind and current.
Figure 4.
The four lines placement along the tower model regarding the direction angle β. (a) the finite element model with lines 1, 2, 3 and 4; (b) the angle β between wind and current.

Figure 5.
Displacement of the tower model under various direction angles for different tower heights. (a) Line 1, (b) Line 2.
Figure 5.
Displacement of the tower model under various direction angles for different tower heights. (a) Line 1, (b) Line 2.

Figure 6.
Rotation of the tower model under various direction angles on Line 1. (a) Rotation versus direction angle, (b) rotation versus tower height.
Figure 6.
Rotation of the tower model under various direction angles on Line 1. (a) Rotation versus direction angle, (b) rotation versus tower height.

Figure 7.
Reaction moment of tower base. (a) Contour of reaction moment (N·m), (b) Standard deviation values versus direction angles.
Figure 7.
Reaction moment of tower base. (a) Contour of reaction moment (N·m), (b) Standard deviation values versus direction angles.

Figure 8.
Displacement responses versus water depth of tower model on Line 1.

Figure 9.
Base moment of tower model. (a) Base moment versus node number, (b) Node numbers at tower base.
Figure 9.
Base moment of tower model. (a) Base moment versus node number, (b) Node numbers at tower base.

Figure 10.
Geometric data of the towers with the four stiffening schemes (in mm).

Figure 11.
Geometric data of the stiffeners in the cross-section view of the tower (in mm).

Figure 12.
Internal view of FE model of towers I, II, III, IV. (a) Tower I, (b) Tower II, (c) Tower III, (d) Tower IV.
Figure 12.
Internal view of FE model of towers I, II, III, IV. (a) Tower I, (b) Tower II, (c) Tower III, (d) Tower IV.

Figure 13.
Geometry of the tower with rings and vertical stiffeners.

Figure 14.
Buckling analysis of Tower I under the gravity of wind turbines. (a) Mode 1, (b) Mode 2, (c) Mode 3.
Figure 14.
Buckling analysis of Tower I under the gravity of wind turbines. (a) Mode 1, (b) Mode 2, (c) Mode 3.

Figure 15.
Post buckling behavior of Towers I, II, III, IV under gravity loading: (a) Tower I, (b) Tower II, (c) Tower III, (d) Tower IV, (in mm).
Figure 15.
Post buckling behavior of Towers I, II, III, IV under gravity loading: (a) Tower I, (b) Tower II, (c) Tower III, (d) Tower IV, (in mm).

Figure 16.
Gravity versus displacement of Towers I, II, III, IV under the gravity of wind turbines.

Figure 17.
Buckling analysis of Tower I under horizontal force. (a) Mode 1, (b) Mode 2, (c) Mode 3.

Figure 18.
Post buckling behavior of towers I, II, III, IV under horizontal force. (a) Tower I, (b) Tower II, (c) Tower III, (d) Tower IV, (in mm).
Figure 18.
Post buckling behavior of towers I, II, III, IV under horizontal force. (a) Tower I, (b) Tower II, (c) Tower III, (d) Tower IV, (in mm).

Figure 19.
Horizontal force versus displacement with regard to Towers I, II, III, IV.

Figure 20.
Buckling analysis of Tower I: (a) Mode 1, (b) Mode 2, (c) Mode 3.

Figure 21.
Post buckling behavior of Towers I, II, III, IV: (a) Tower I, (b) Tower II, (c) Tower III, (d) Tower IV, (in mm).
Figure 21.
Post buckling behavior of Towers I, II, III, IV: (a) Tower I, (b) Tower II, (c) Tower III, (d) Tower IV, (in mm).

Figure 22.
Moment versus rotation of Towers I, II, III, IV.

Figure 23.
Stress contours of towers I and II in a marine environment. (a) Tower I, (b) Tower II, (in MPa).
Figure 23.
Stress contours of towers I and II in a marine environment. (a) Tower I, (b) Tower II, (in MPa).

Figure 24.
Deformation contours of towers III and IV in a marine environment. (a) Tower III, (b) Tower IV, (in mm).
Figure 24.
Deformation contours of towers III and IV in a marine environment. (a) Tower III, (b) Tower IV, (in mm).


Table 1.
The material properties of steel.
| Material | Density | Elasticity Module | Poisson’s Ratio | Yield Stress | Plastic Strain |
|---|---|---|---|---|---|
| Steel | 7.85 g/cm3 | 205 GPa | 0.3 | 345 GPa | 0 |
| 428 GPa | 0.1 |
Table 2.
Maximum von Mises stresses and deformations of towers I, II and III, IV.
| Maximum von Mises Stress (MPa) | Maximum Deformation (mm) | |
|---|---|---|
| Tower I | 127.2 | 558.8 |
| Tower II | 118.5 | 516.5 |
| Tower III | 117.4 | 520.9 |
| Tower IV | 119.4 | 527 |
© 2020 by the authors. Licensee MDPI, Basel, Switzerland. This article is an open access article distributed under the terms and conditions of the Creative Commons Attribution (CC BY) license (http://creativecommons.org/licenses/by/4.0/).
Share and Cite
MDPI and ACS Style
Hu, Y.; Yang, J.; Baniotopoulos, C. Study of the Bearing Capacity of Stiffened Tall Offshore Wind Turbine Towers during the Erection Phase. Energies 2020, 13, 5102. https://0-doi-org.brum.beds.ac.uk/10.3390/en13195102
AMA Style
Hu Y, Yang J, Baniotopoulos C. Study of the Bearing Capacity of Stiffened Tall Offshore Wind Turbine Towers during the Erection Phase. Energies. 2020; 13(19):5102. https://0-doi-org.brum.beds.ac.uk/10.3390/en13195102
Chicago/Turabian StyleHu, Yu, Jian Yang, and Charalampos Baniotopoulos. 2020. "Study of the Bearing Capacity of Stiffened Tall Offshore Wind Turbine Towers during the Erection Phase" Energies 13, no. 19: 5102. https://0-doi-org.brum.beds.ac.uk/10.3390/en13195102
Note that from the first issue of 2016, this journal uses article numbers instead of page numbers. See further details here.