Hygrothermal Analysis of Masonry Wall with Reed Boards as Interior Insulation System


1
Institute of Forestry and Rural Engineering, Chair of Rural Building and Water Management, Estonian University of Life Sciences, F. R. Kreutzwaldi 1, Tartu 51006, Estonia
2
School of Engineering, Tartu College, Tallinn University of Technology, Ehitajate tee 5, Tallinn 19086, Estonia
*
Author to whom correspondence should be addressed.
Energies 2020, 13(20), 5252; https://0-doi-org.brum.beds.ac.uk/10.3390/en13205252
Submission received: 6 August 2020
/
Revised: 11 September 2020
/
Accepted: 23 September 2020
/
Published: 9 October 2020
(This article belongs to the Special Issue Energy Performance and Indoor Climate in Buildings)
Abstract
:When the masonry walls of buildings under heritage protection need to be restored and thermally improved, the only option is to use an interior insulation system. This is also the riskiest method of insulating walls in cold climates. Capillary active interior insulation systems have been proven to be the most reliable, minimizing the risk of mold growth and decay caused by condensation. They have also been proven to be less risky in wind-driven rain. The building studied is situated in a heritage-conservation area in downtown Tartu, Estonia, and therefore cannot be insulated from the exterior. This paper compares the hygrothermal performance of four different interior insulation systems with and without a heating cable and vapor barrier. In the first case, Isover Vario KM Duplex UV was placed between reed panels. In the second case, reed panels were used without the vapor barrier. Data loggers were applied between the reed panels and the original wall and inside the room to measure temperature and relative humidity in one-hour intervals. Exterior temperature and relative humidity values were taken from the Estonian University of Life Sciences Institute of Technology weather service station. In addition to the measurements taken in the case study building, calculations were made using heat-air-moisture (HAM) Delphin software to simulate the situation. The use of a smart vapor retarder (Isover Vario KM Duplex UV) with reed panels in the interior insulation system reduced the relative humidity level inside the wall. The vapor retarder improved the drying-potential compared to the interior insulation system without the vapor barrier.
1. Introduction
Society is becoming more aware of the need to reduce greenhouse gas emissions. To achieve this goal, Estonia needs to lower its greenhouse gas emissions by 80% by 2050 compared to emission levels in 1990 [1]. There is currently no regulation of materials used in retrofitting. Some materials may therefore contain large amounts of embodied energy and will not be efficient at conserving energy. The General Principles of Climate Policy until 2050 resolution calls attention to modeling climate-friendly approaches and environmentally friendly solutions to lowering greenhouse gas emissions [1]. Low amounts of energy are used to produce the insulation material described in this paper.
The main purpose of interior insulation is to reduce energy demand and obtain suitable indoor thermal comfort conditions. It has been estimated that 40% of the building stock consists of traditional historical buildings that require additional insulation in order to conform to the demands of the EU regarding the thermal conductance of buildings [2].
Traditional and historical buildings cannot be insulated externally due to strict regulations of the conservation of historical facades. The hygrothermal requirements of interior insulation systems are distinct because of the higher risk of condensation and therefore mold growth and decay. The risk of frost damage to the outer layer of the envelope also increases. It has been proven that using capillary active interior insulation systems presents low hygrothermal risk [3,4,5,6,7]. Several studies have been conducted in Estonia on interior insulation in masonry walls [8,9,10].
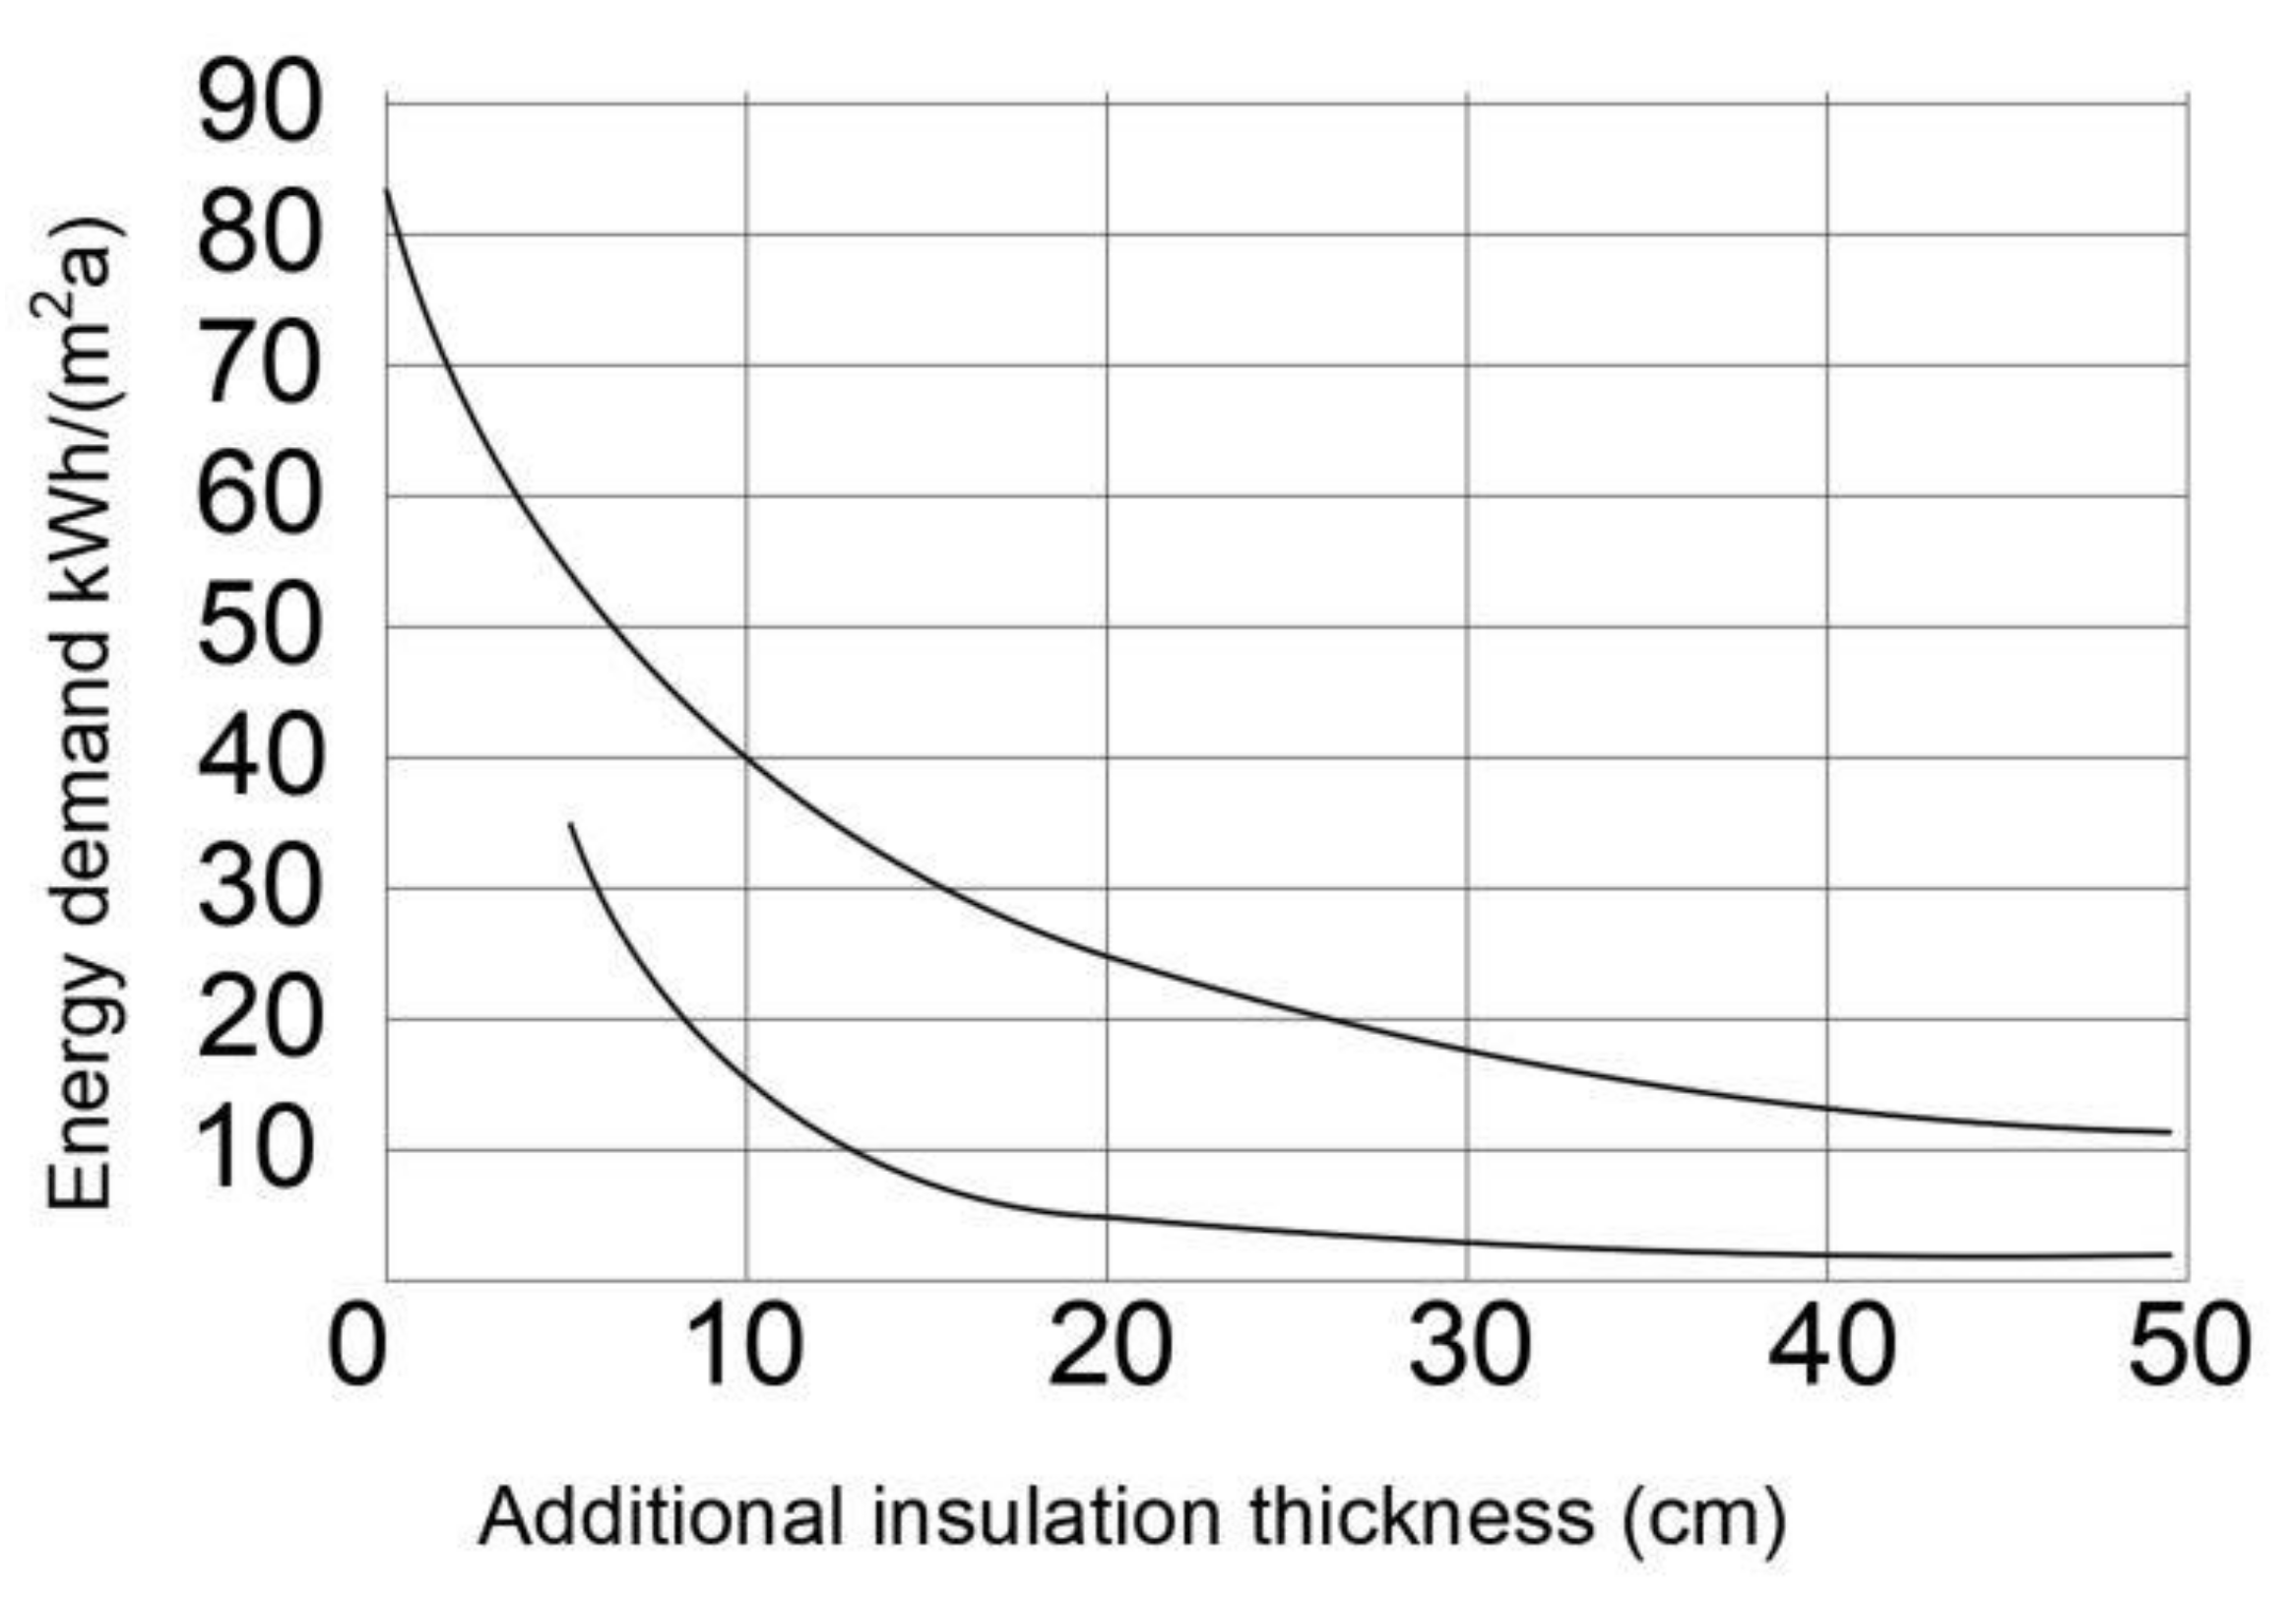
Additional insulation of enclosures may not be cost effective in terms of the materials used because the thickness of the insulation layer may not help reduce heating costs (Figure 1). The amount of embodied energy in the materials used will also increase.
A comparison of the data from the Environmental Product Declarations demonstrates that the non-renewable primary energy content of Multipor (as capillary active insulation material) is 1350 MJ/m3 [12], and for VARIO® XTRA Membrane vapor retarding film energy consumption from cradle to the grave is 26 MJ/m2 [13].
The use of sustainable local building materials such as reed panels can reduce clay-embodied energy content. The amount of energy embodied in reed panels is only 1.7–2.0 MJ/kg [14] or 0.008–0.009 MJ/m3. Reed has been used for centuries as a natural, renewable local building material, as has clay for rammed walls and plastering. Reed is widely available throughout the world. The reed-growing area on the Estonian coastline is 20,059 ha [15]. The optimal temperature for mold growth on reed panels is 20–30 °C and RH 90–100% [16].
The purpose of this study was to determine whether reed panels combined with smart vapor retarder pose a risk of mold and whether the heating cable helps prevent mold.
2. Materials and Methods
2.1. Site Description
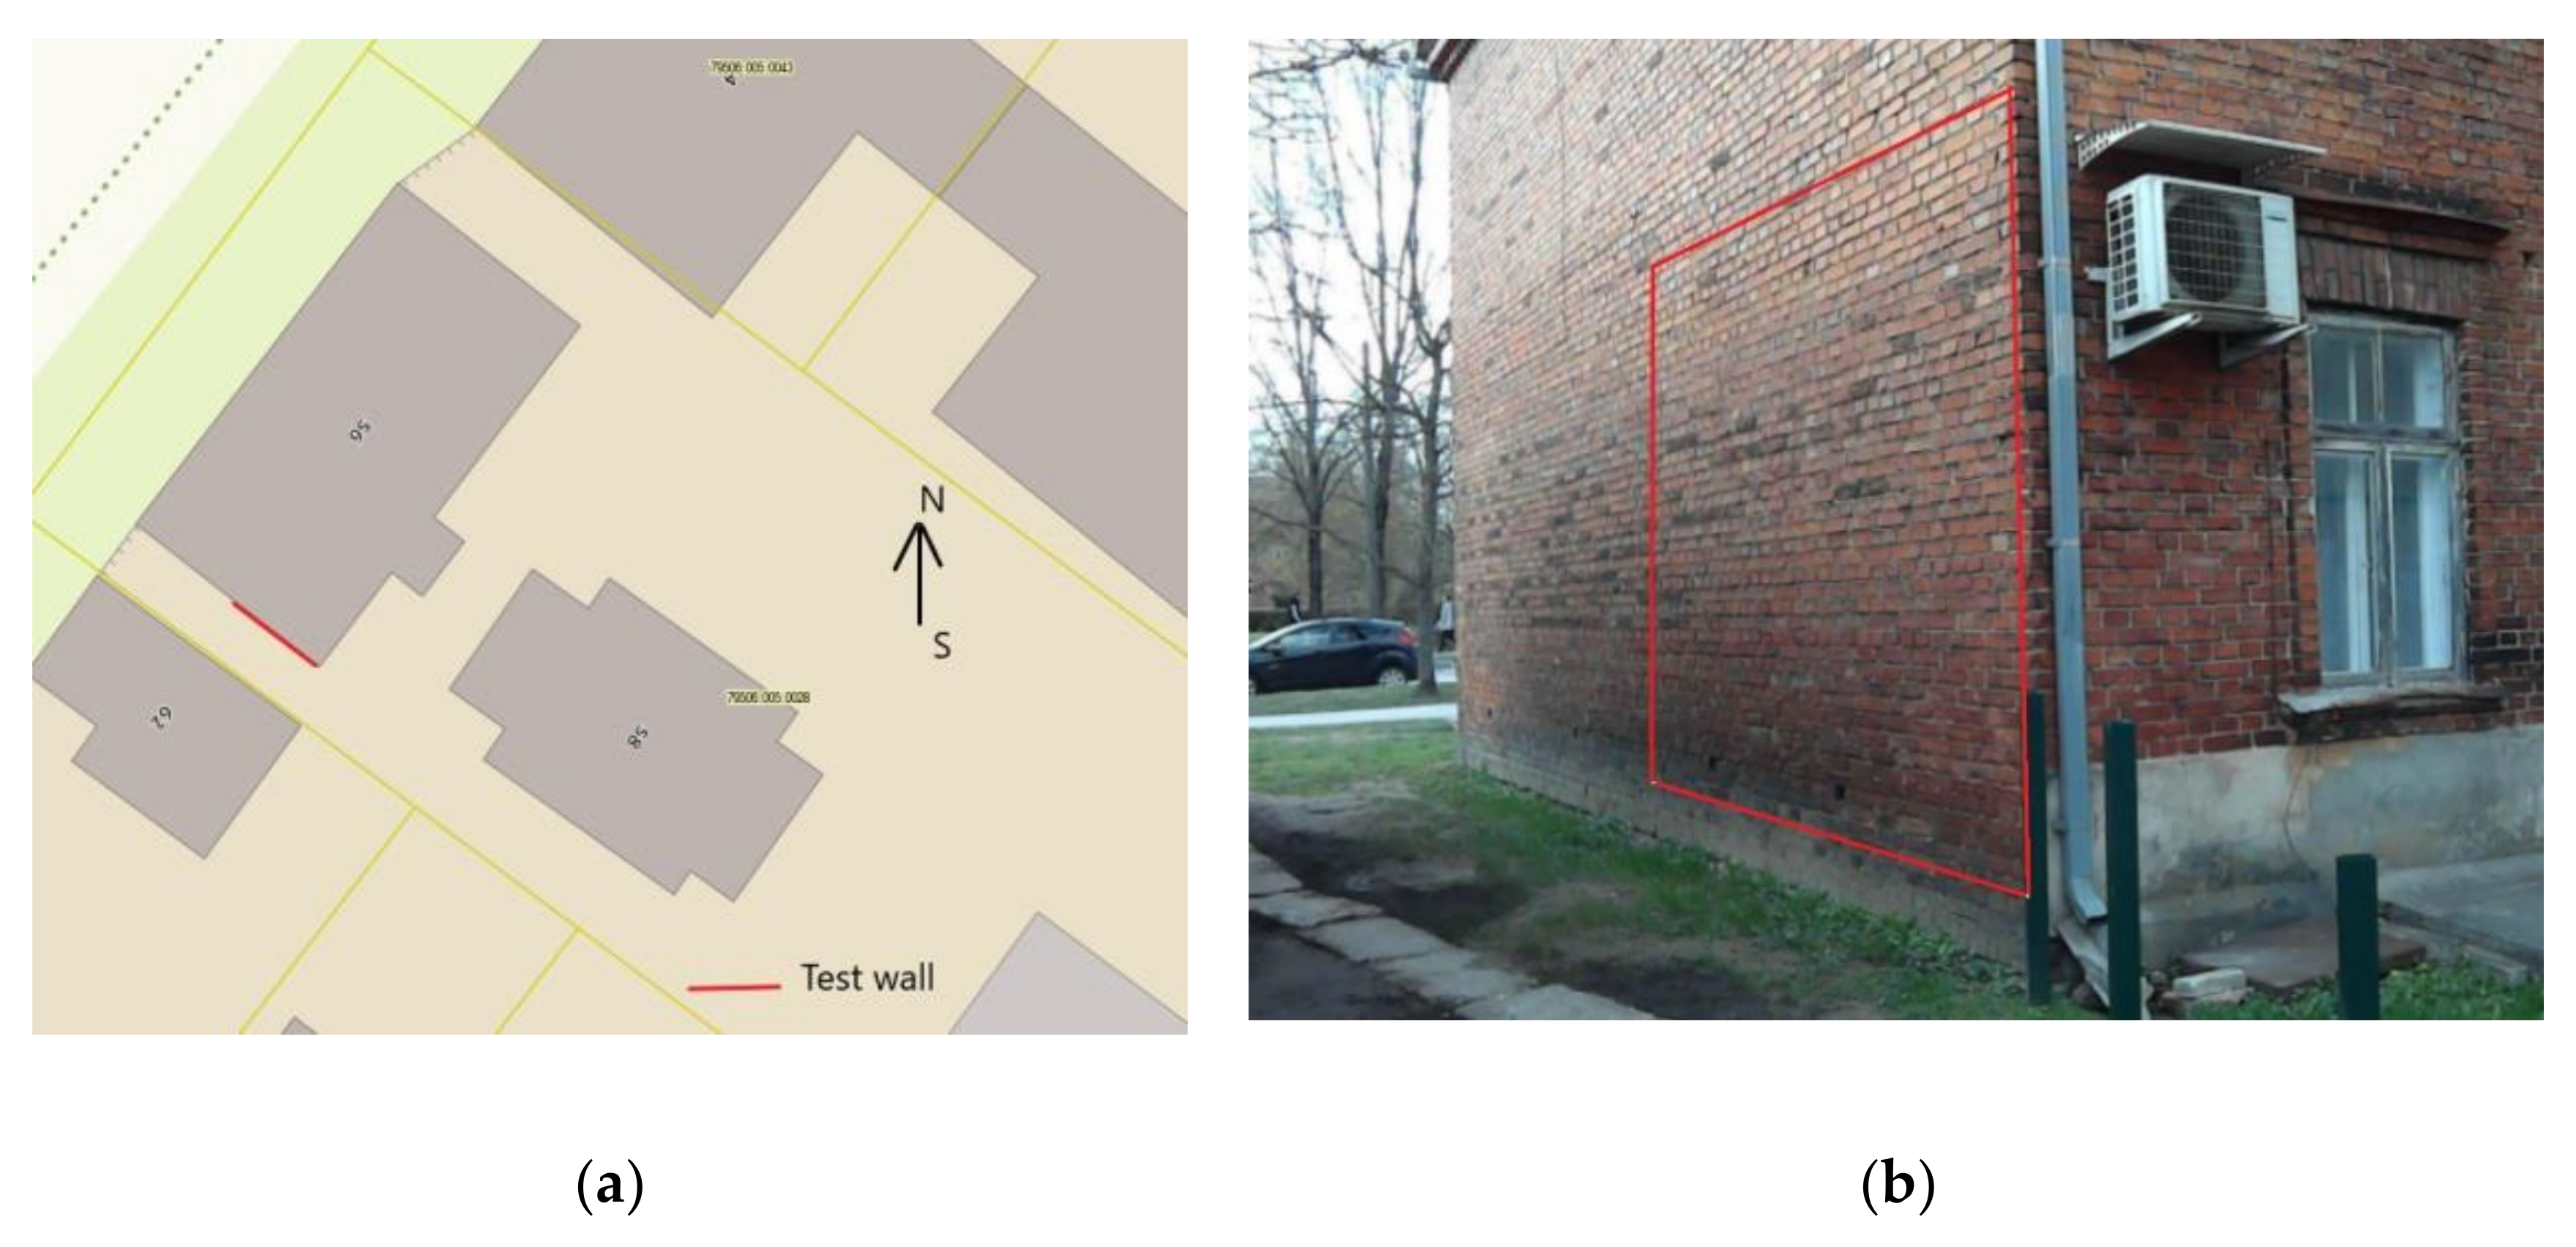
The building studied is located at 56 J. Kuperjanovi Street in downtown Tartu, Estonia (Figure 2a), in the heritage conservation area where walls cannot be insulated externally. The interior insulation system was applied to an existing brick firewall built in 1892 (Figure 2b). There is no mechanical ventilation system in the apartment. The room is heated with the fireplace and air-to-air heat pump displayed in Figure 2b. The single-glazed, double-hung, wood-framed windows date back to 1960.
The layers of the original wall were defined by drilling several holes in the wall and measuring the thicknesses of the different layers. The measurements of the layers from outside to inside were: 410 mm clay brick, 70 mm air gap, 130 mm clay brick, 25 mm lime plaster, 5 mm clay plaster. The partition ceilings were built on timber beams, so the timber joints in the wall would be susceptible to mold if internal insulation is used [17]. The thermal conductance of the original wall is U = 1.98 W/(m2·K), calculated based on EVS 908-1:2016 Guidance for calculation of thermal transmittance of building envelope [18]. The ventilation gap was heavily ventilated, therefore the thermal conductance of the ambient masonry layer was left out of the calculation.
2.2. Materials and Methods
The building process of the test wall is described in Table 1.
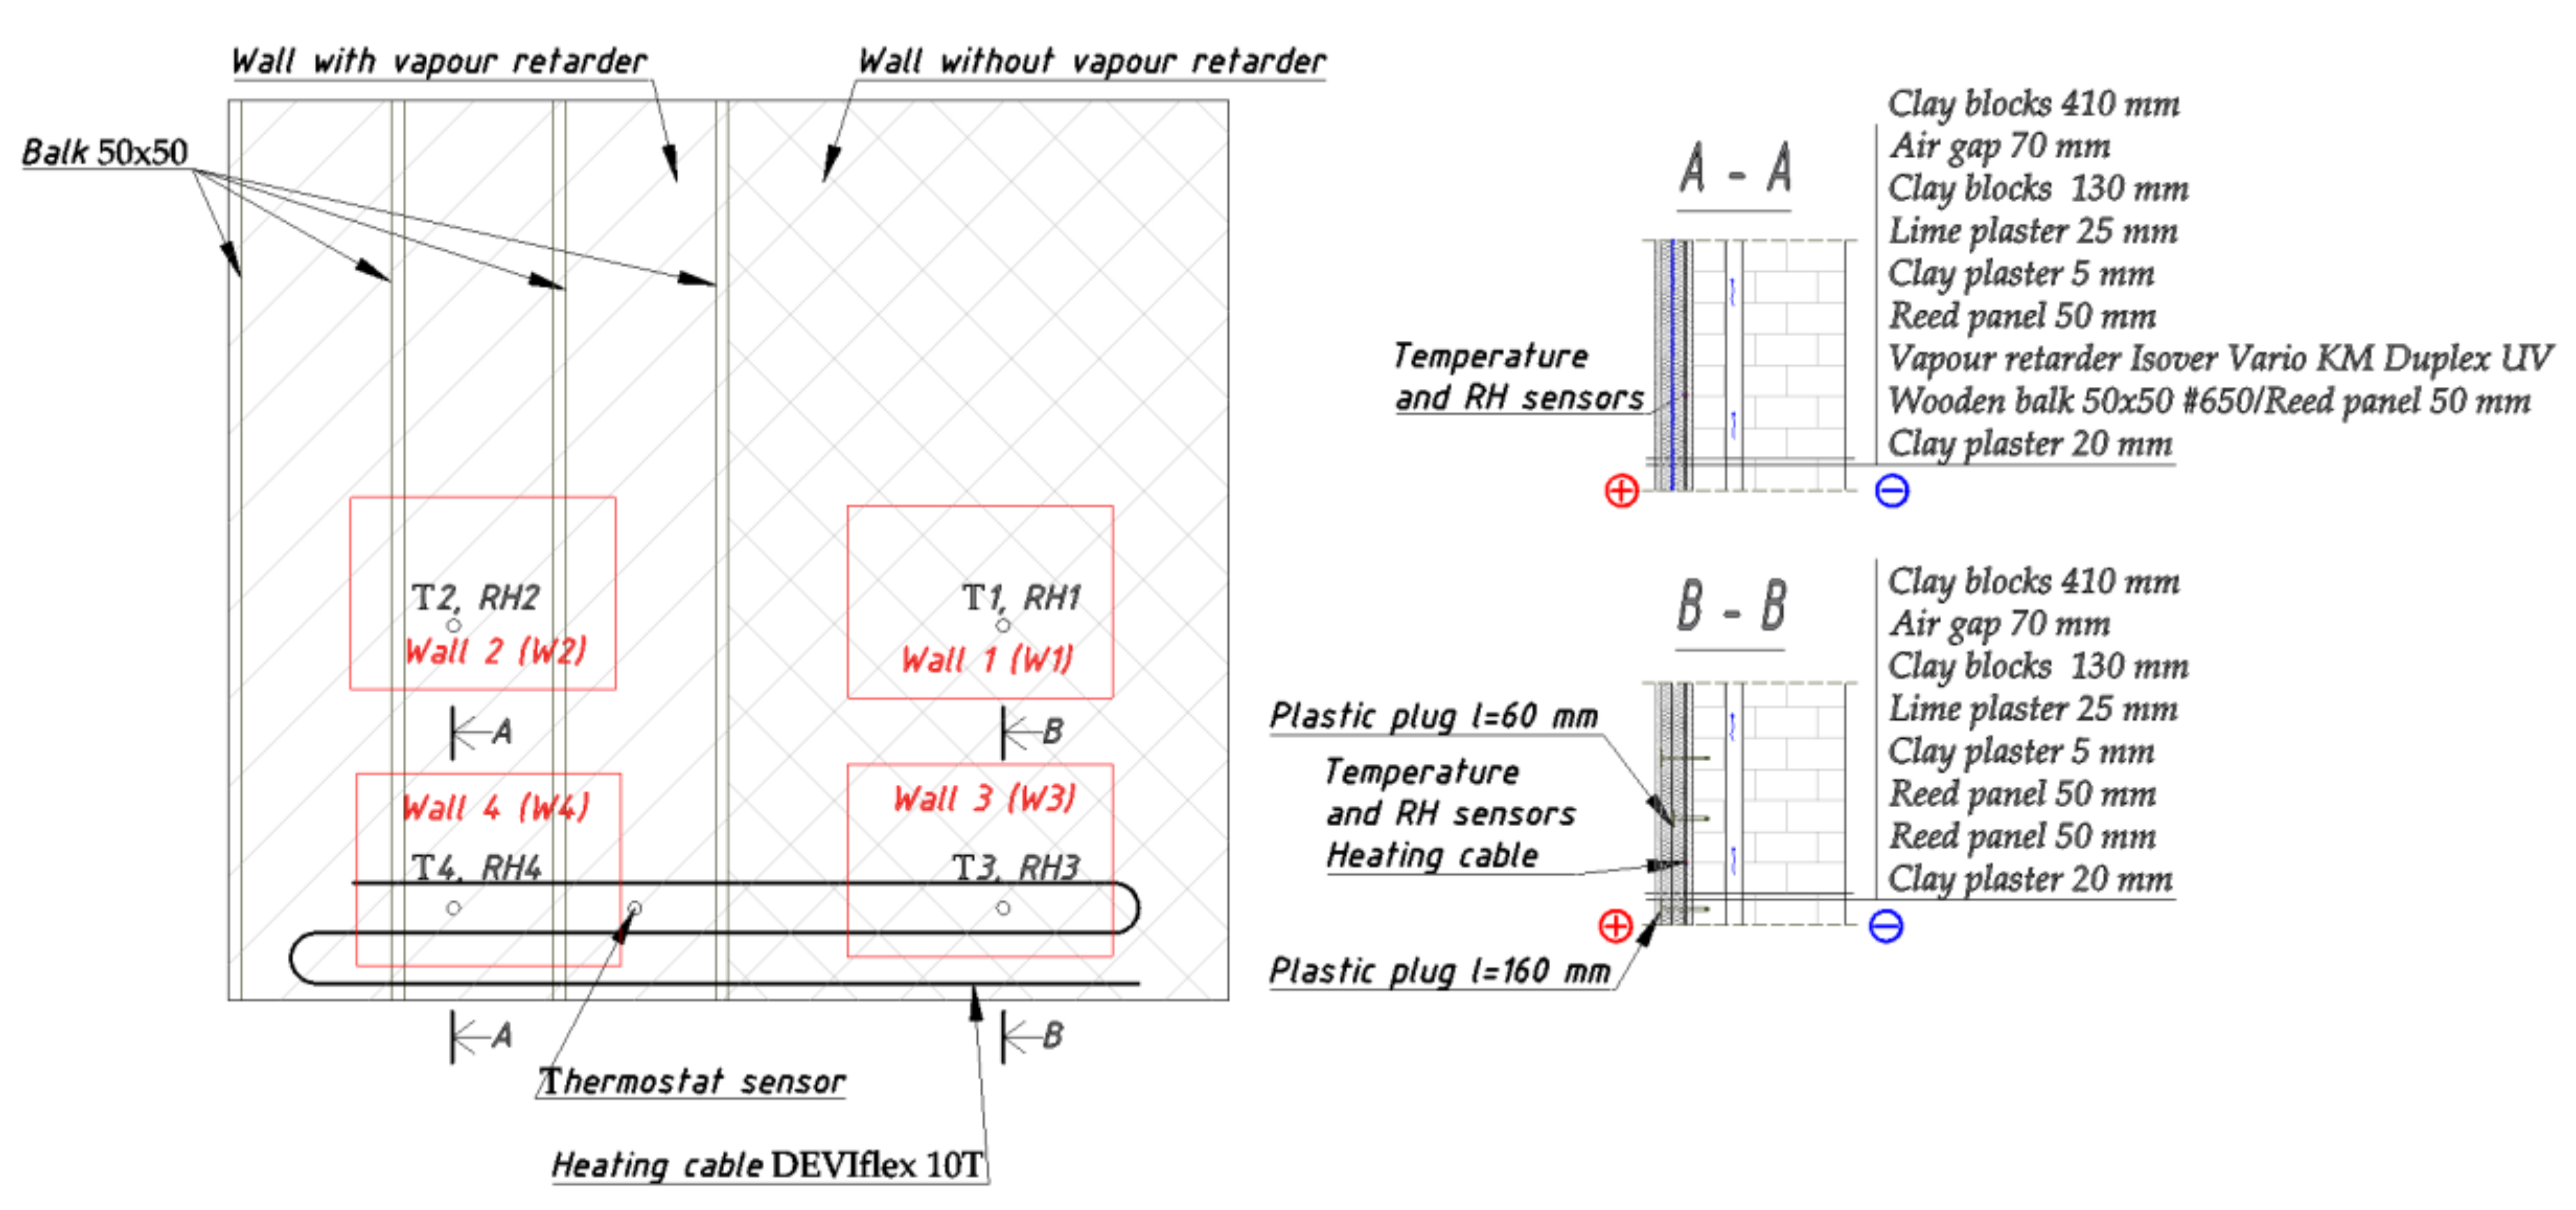
An interior insulation system was built with reed panels (50 × 600 × 2000 mm, density 225 kg/m3 and thermal conductivity λ = 0.057 W/(m·K) [19], vapor-retarder film (Isover Vario KM Duplex UV), heating cable (DEVIflex 10 T, cable output 10 W/m), and about 22–30 mm of clay plaster reinforced with jute fabric. Clay plaster was applied in two stages. A vapor retarder was used in the wall between two layers of reed panels to prevent the risk of condensation and allow the timber joints and wall structure to dry out. The heating cable was applied to minimize the temperature decline caused by air leakage from the basement and to reduce the impact of moisture on the thermal bridges. The first layer of reed panels was applied with plastic wall plugs (diameter = 8 mm, length = 120 mm, 8 pcs/m2). The second layer of reed panels without a vapor retarder was applied with plastic wall plugs (diameter = 8 mm, length = 160 mm, 8 pcs/m2). An additional layer of reed panels with the vapor-retarder film was placed between timber studs (50 × 50 mm) and fixed with metal strips to avoid penetration by the vapor retarder. Timber balks in the wall were also covered with vapor retarder and tape was used to render adjoining parts vapor proof. Figure 3 describes the building process.
Temperature and relative humidity were measured between the original wall and the applied insulation layer and in the room with Ahlborn FHA 646 R type NTC N sensors (d = 5 mm, operative range −30 to +100 °C, 5% to 98% RH). All readings were recorded in one-hour intervals on an Ahlborn Almemo 2890-9 data recorder. The onsite experiment results were tested with the computational approach with heat-air-moisture (HAM) Delphin 5.9 software. The modelled prognosis was completed using a six-year time lapse and the mold test reference year was from Väike-Maarja (100 km from Tartu) [20].
Measuring devices were installed in four areas in the wall: two devices at the height of 370 mm and two devices at the height of 1500 mm (Figure 4). According to one study [20], the distance between different conditions should be at least 1000 mm. Exterior temperature and relative humidity data were collected from the Tartu weather station [21].
The hygrothermal behavior of four different wall structures was compared. Wall 1 (W1) was built without a vapor retarder and without a heating cable, Wall 2 (W2) was built with vapor retarder and without a heating cable, Wall 3 (W3) was built without vapor retarder and with a heating cable, and Wall 4 (W4) was built with vapor retarder and with a heating cable (Figure 4).
Calculated thermal conductance of the interior-insulated test wall was U = 0.43 W/(K·m2) [18]. The original wall’s thermal conductance was U = 1.98 W/(K·m2). The original wall’s thermal conductance was 4.6 times worse.
2.3. Boundary Conditions for Delphin Software
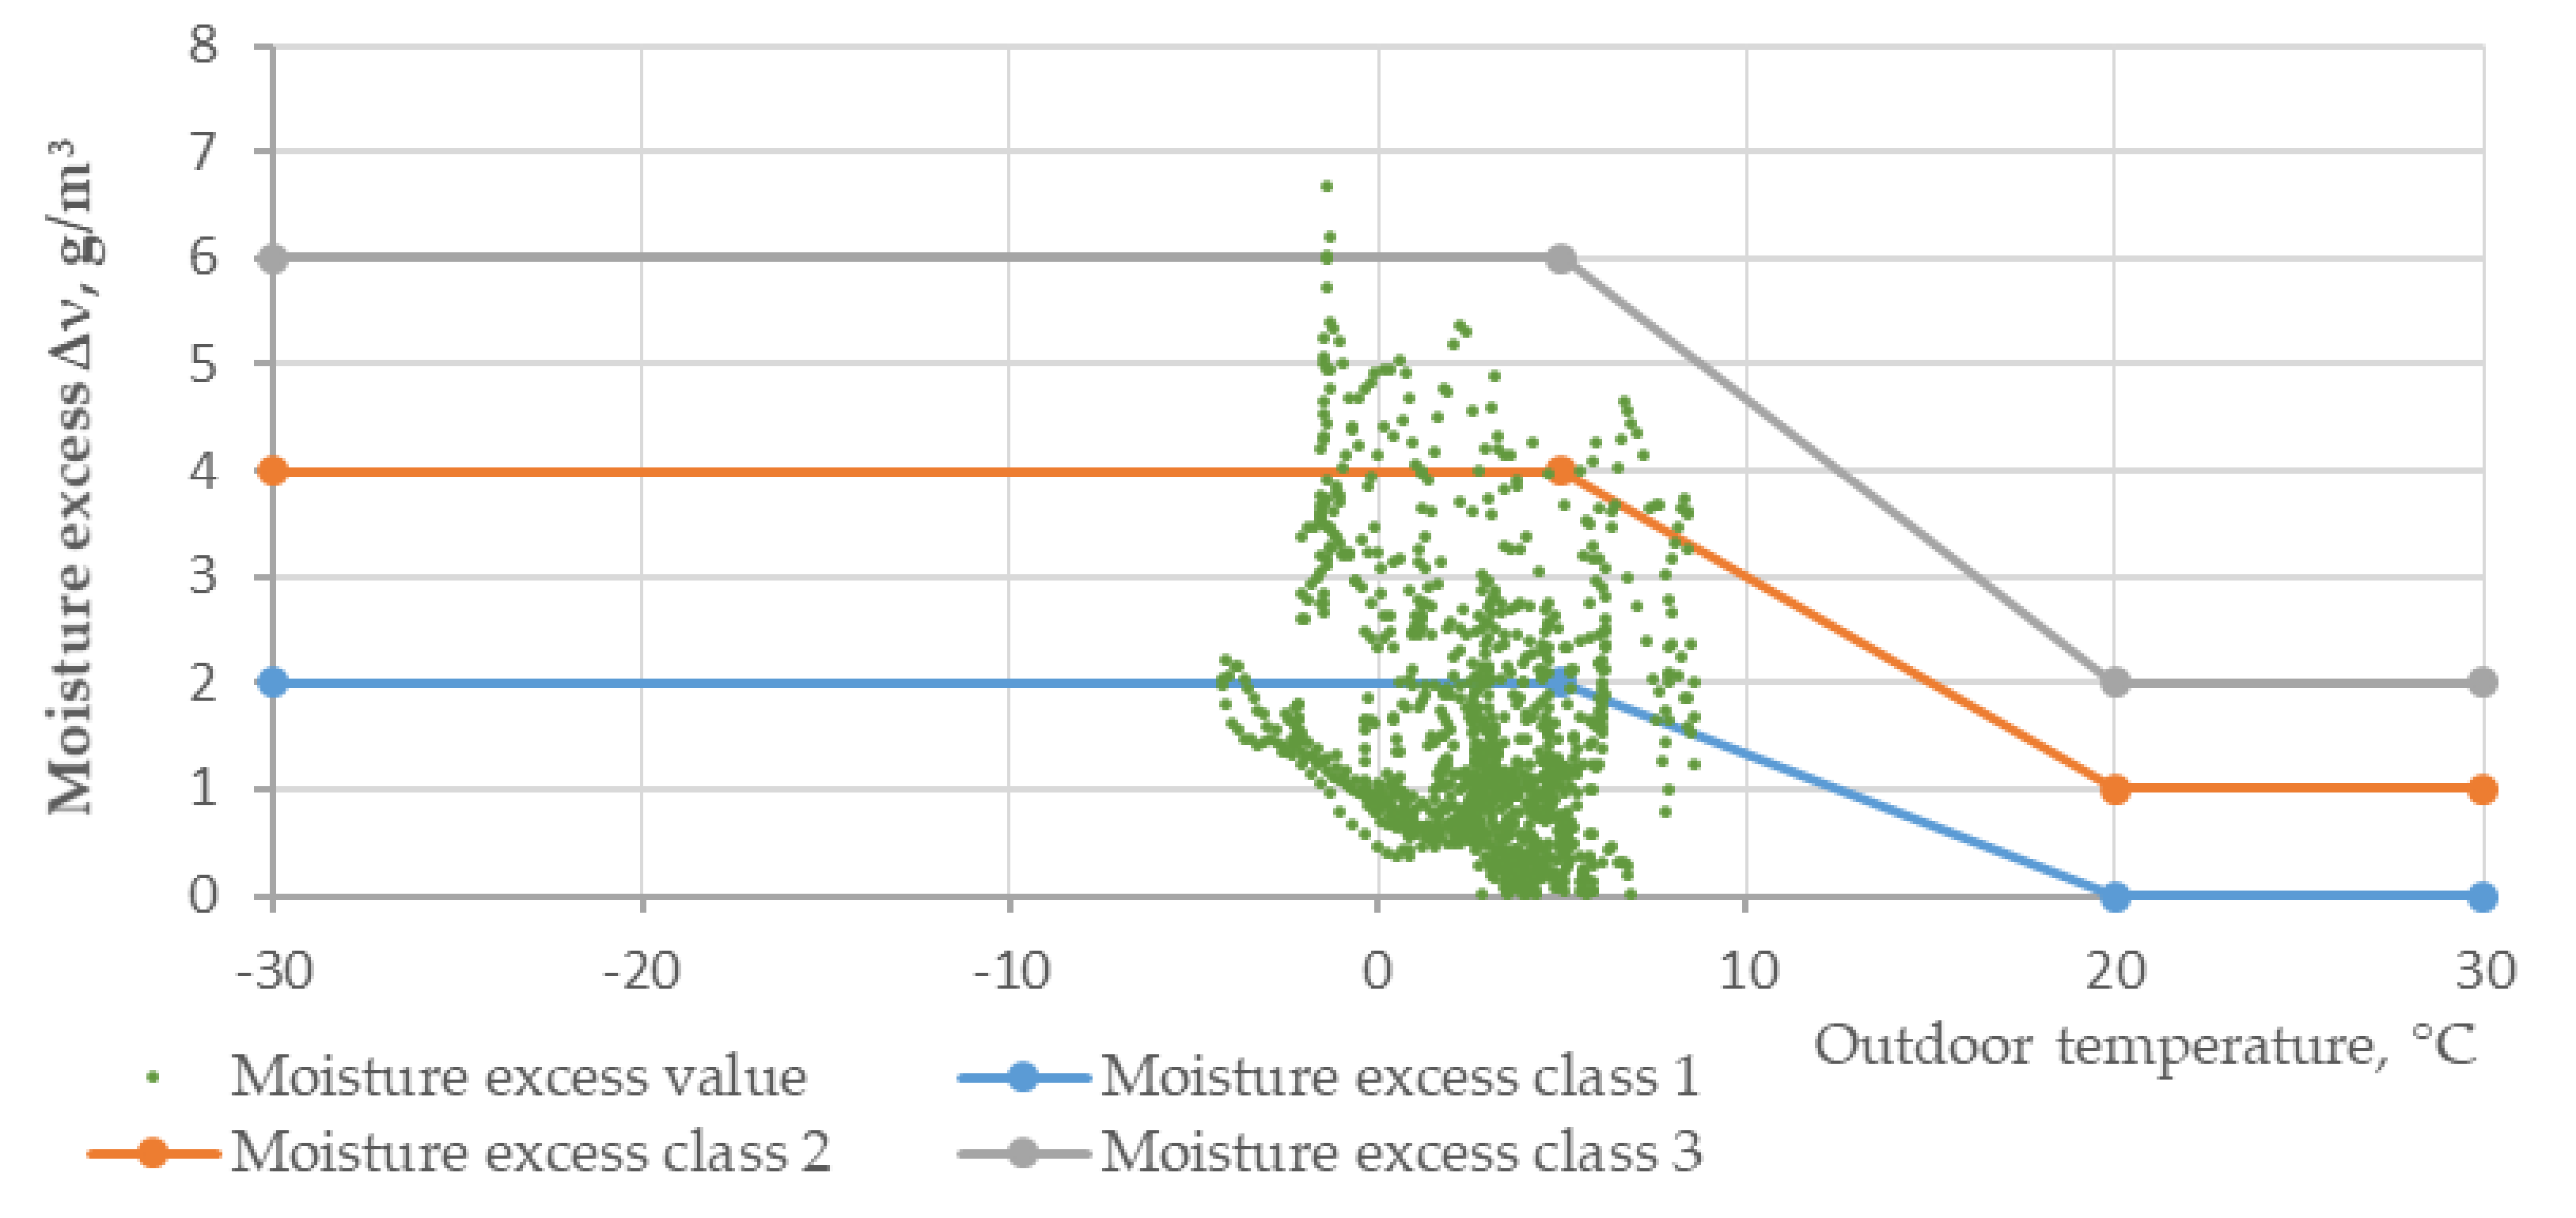
The indoor climate had to be evaluated before using Delphin software. Because the period of measurement of the test wall was short, from 15 December 2019 to 29 March 2020, the interior temperature and relative humidity were calculated over a longer period of time according to class 2 and the mold test reference year. In these indoor climate calculations, only the period between 7 February and 29 March 2020 was used to eliminate unusual indoor climate conditions (high relative humidity due to plastering work and low temperature due to the period of inhabitation) [11]. The apartment falls into moisture excess class 2 (Figure 5) [22]. According to EVS-EN ISO 13788—Hygrothermal performance of building components and building elements—Internal surface temperature to avoid critical surface humidity and interstitial condensation—Calculation methods [22], the average for class 2 is 23 m2 per person. The area in the case study is 19 m2/per person. The period of measurement can therefore be considered sufficient.
The indoor temperature and relative humidity were calculated as internal indoor climate changes according to outdoor climate parameters [11]. The results were entered in Delphin to model a six-year time period with data from the mold test reference year [22]. The Valtio Tekninen Tutkimuslaitos (VTT) mold index was used to evaluate the mold risk [23]. The mold index was calculated according to moisture excess class 2 and the mold test reference year data as the worst-case scenario. The same worst-case mold conditions were applied to the six-year time period.
3. Results and Discussion
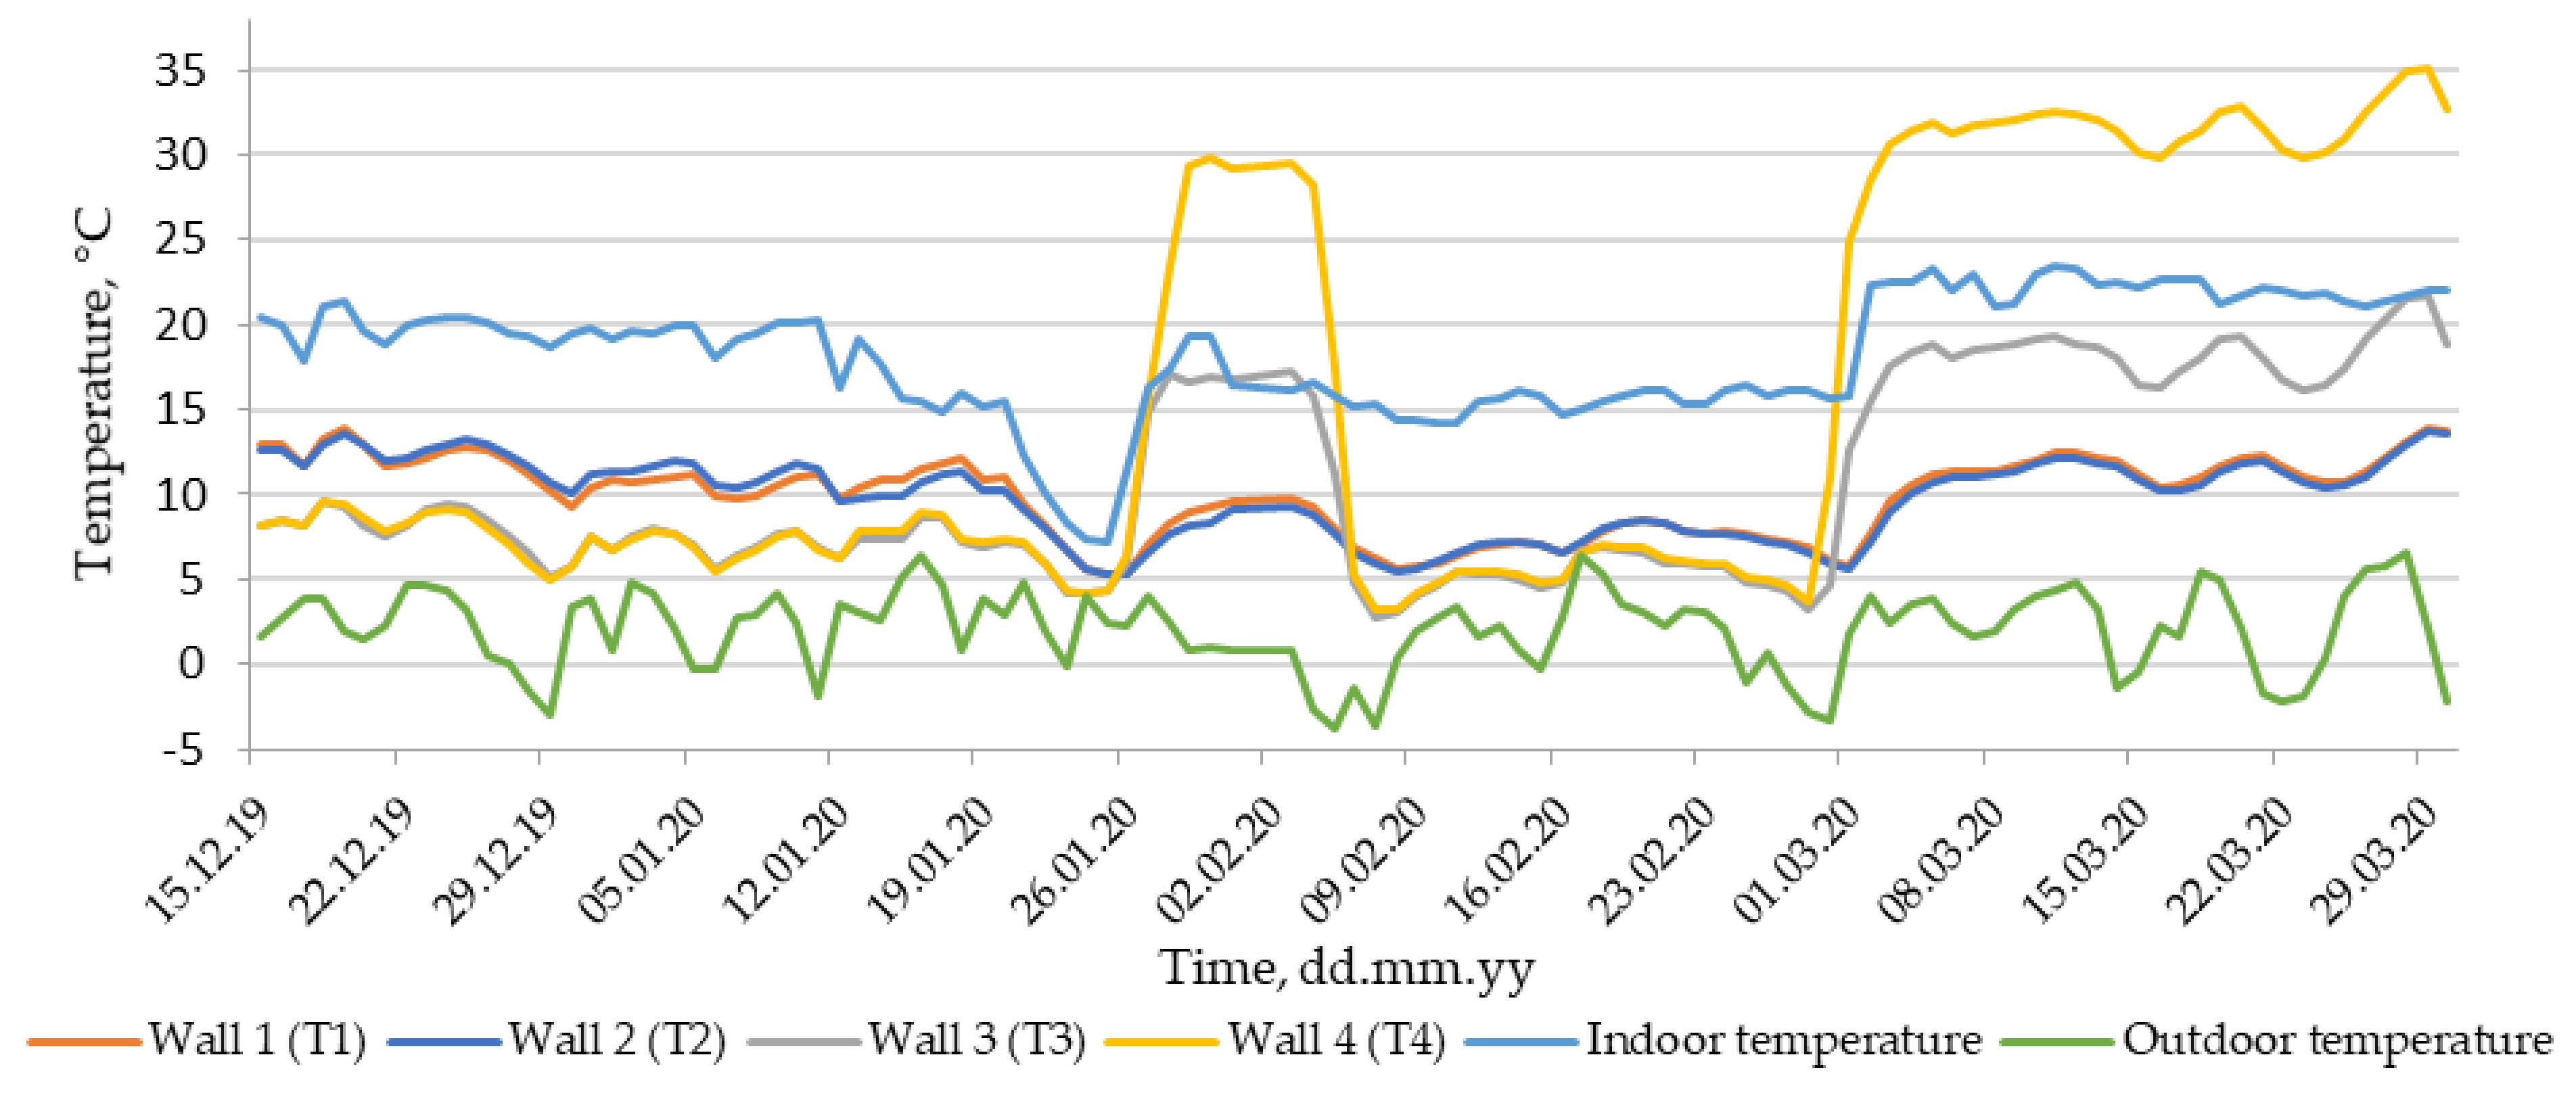
Temperatures measured between the internal layer of the original wall and the insulation are presented in Figure 6. Indoor and outdoor temperatures are also shown.
The tenant lived in the apartment from December until the middle of January and again from the beginning of March. The indoor temperature was mostly above 15 °C during those periods. The indoor temperature dropped exactly when the inhabitant left and turned off the heat (Figure 6). Sensors detected a fixed noticeable temperature rise after the heating cable was plugged in (T3 and T4) on 26 January 2020. A temperature increase of more than 10 °C was measured in Wall 3 (T3) compared to Wall 4 (T4). The increase occurred because of the air gap (caused by removing brick from the outer wall) situated directly behind the T4 sensor. When the heating cable was turned off, similar values were recorded in both the T3 and T4 temperature sensors for walls with and without vapor retarder. The T1 and T2 sensors, which were placed higher, recorded similar values throughout the entire testing period. When the heating cable was turned off, the temperature values of T1 and T2 were constantly higher than T3 and T4 because of the air leakages from the basement and the ventilated air gap. All temperatures between layers depended on the indoor temperature.
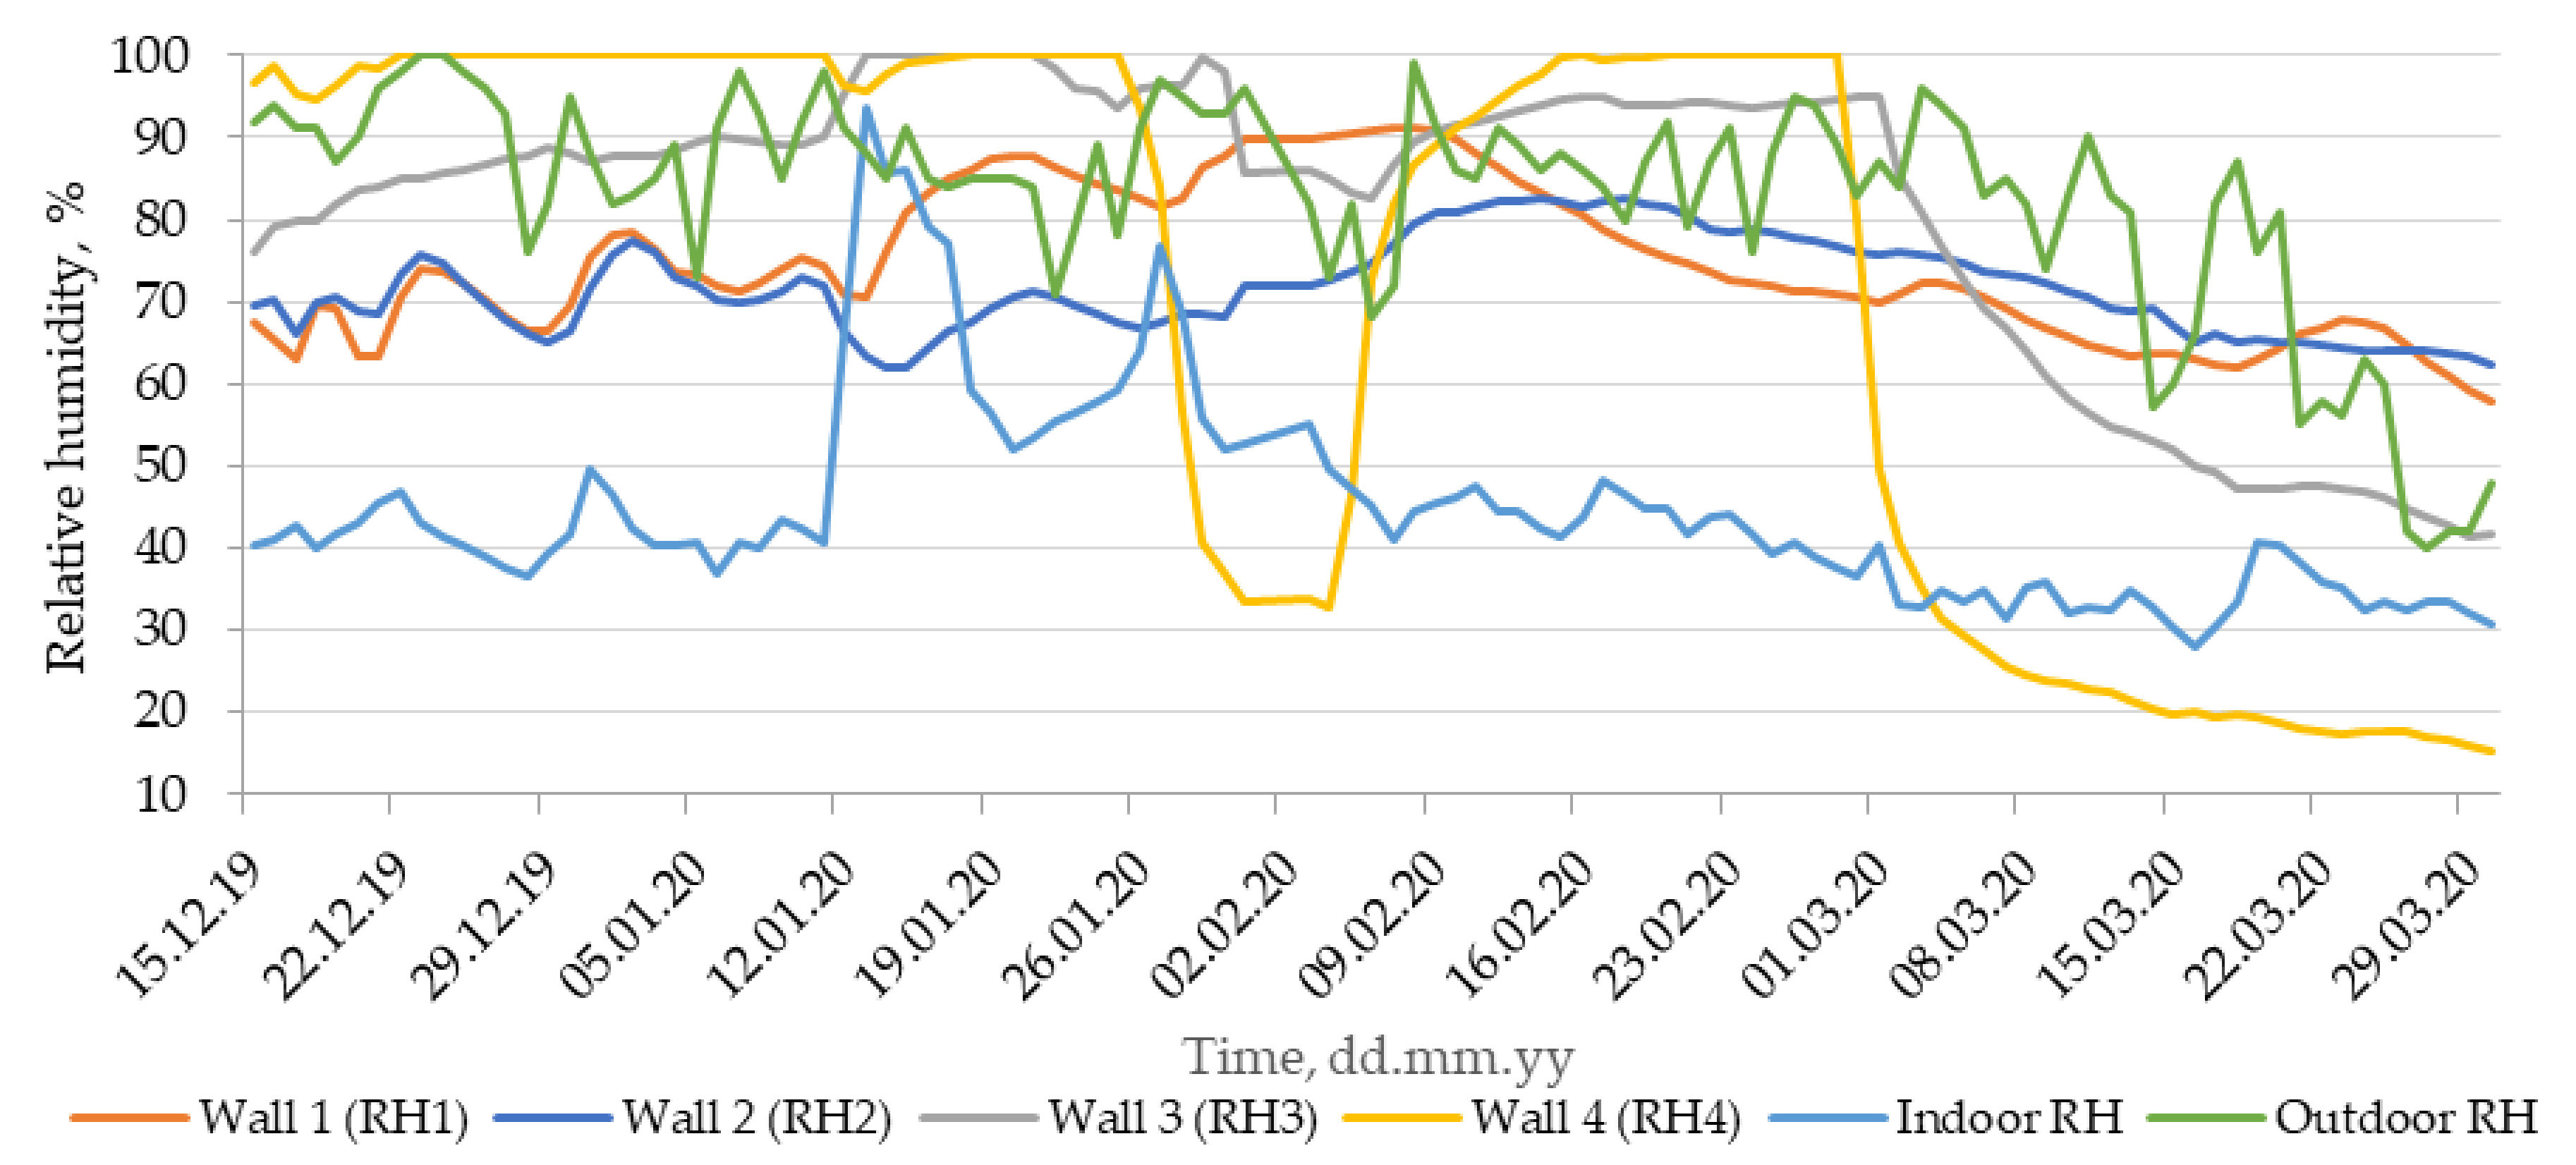
The relative humidity was measured between the internal layer of the original wall and the insulation. Those values, as well as the relative indoor and outdoor humidity, are presented in Figure 7.
The significant drop in relative humidity (Figure 7) was caused by the temperature rise after the heating cable was switched on in Wall 3 and Wall 4. While the wall was being plastered on 12 February 2020, part of the wall with vapor retarder showed lower relative humidity values (Wall 2). A difference of 15% in relative humidity in measuring points RH1 and RH2 (Figure 4) became evident after the vapor retarder was installed in Wall 2 on 13 January, 2020. The relative humidity at point RH2 exceeded the relative humidity in point RH1 after 26 February, 2020 because the part of the wall without vapor retarder dried out faster.
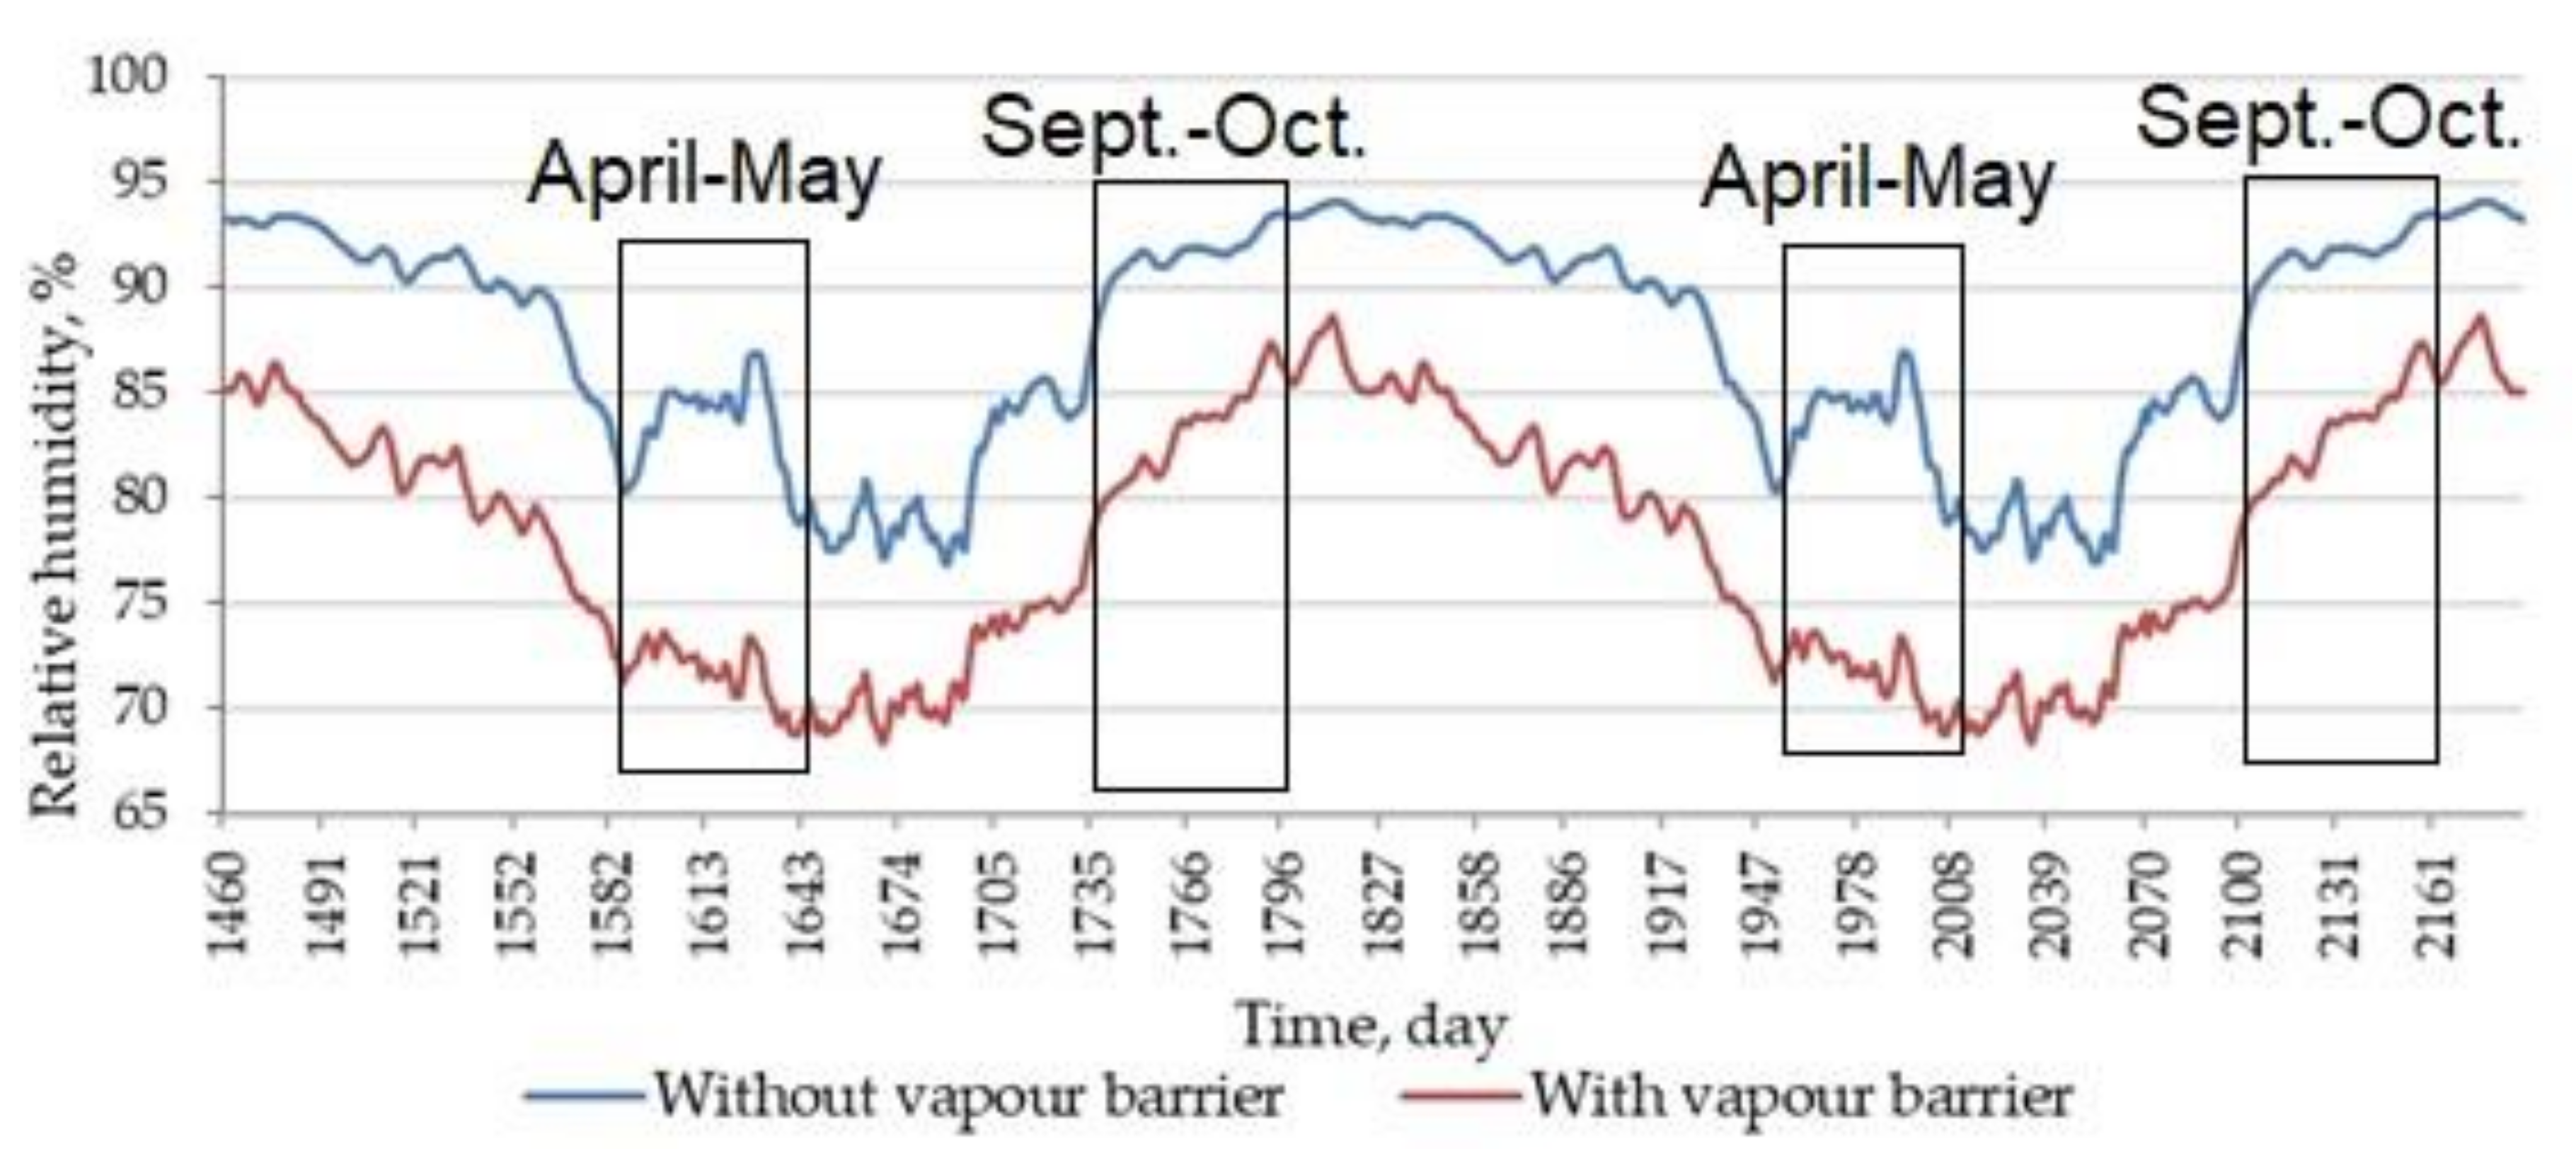
The behavior of the test wall was modeled using Delphin software. Figure 8 compares the differences in relative humidity between walls with and without vapor retarder. The last two years in a six-year time lapse are presented in Figure 8.
The properties of smart vapor retarders cause a smaller difference in relative humidity values in autumn and a larger difference in spring. Relative humidity does not rise above 90% with the vapor barrier (Figure 8).
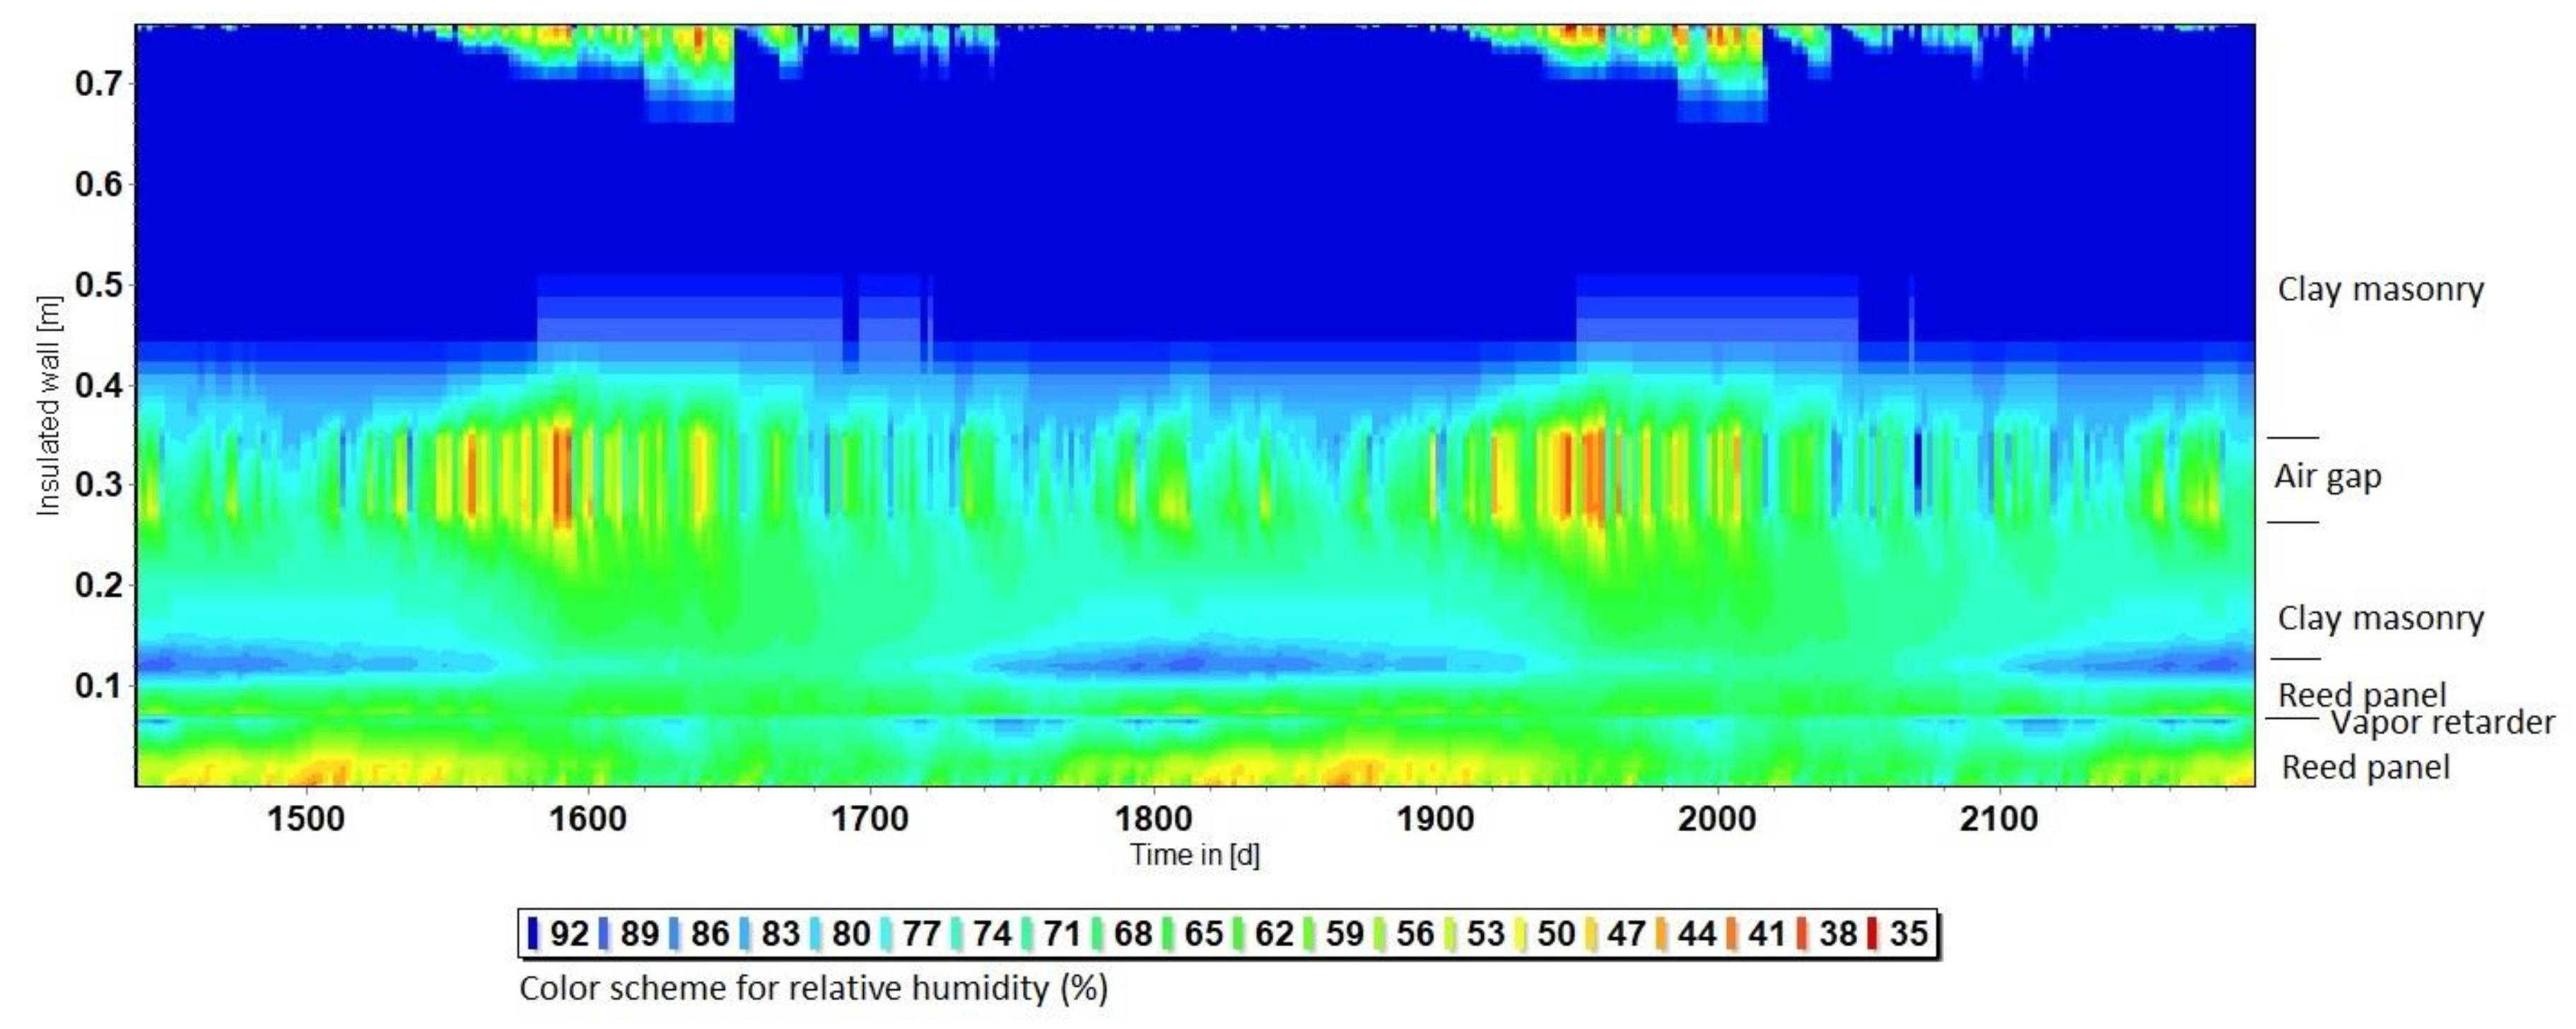
The behavior of the wall with vapor retarder was modeled with a Delphin simulation. The results are presented in Figure 9. The air gap was modeled as being ventilated.
The relative humidity of the exterior masonry is high (Figure 9). The ventilated air gap lowers the relative humidity value of the internal layers. The moisture intake capacity of the exterior masonry should be considered. There are two visible regions with high relative humidity in the applied interior insulation system: one on the interior side of the vapor retarder and one on the outer side of the insulation material. The periods of high relative humidity in the applied interior insulation system are short and the moisture dries out in the summer.
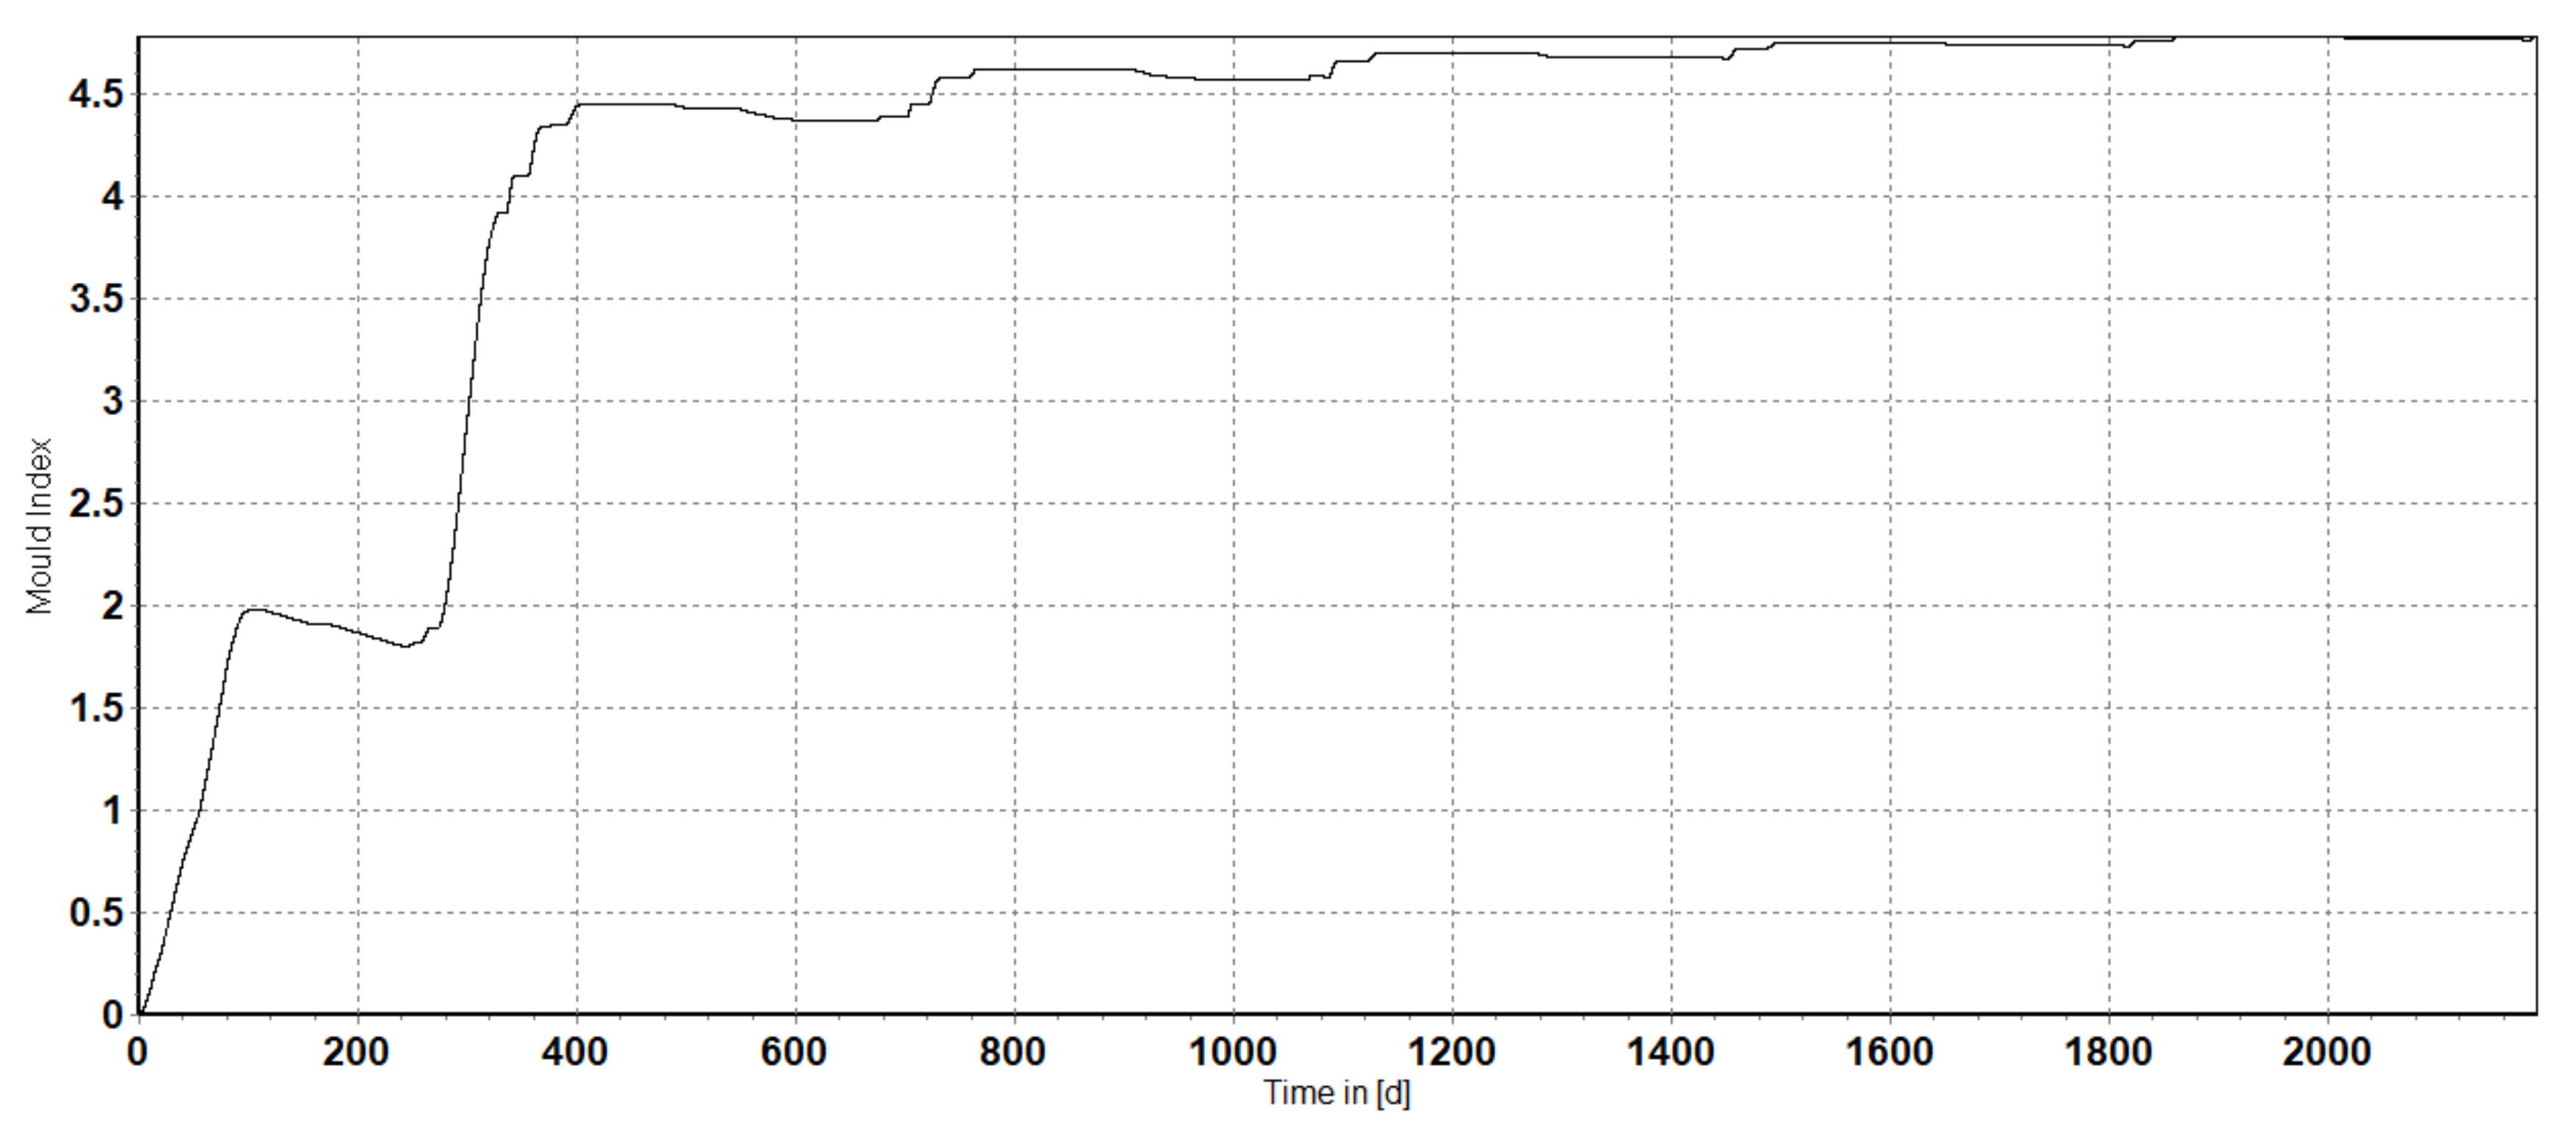
The mold growth index was modeled on the interior side of the vapor retarder (Figure 10), as the model showed that the mold index value was greater there than between the insulation and masonry.
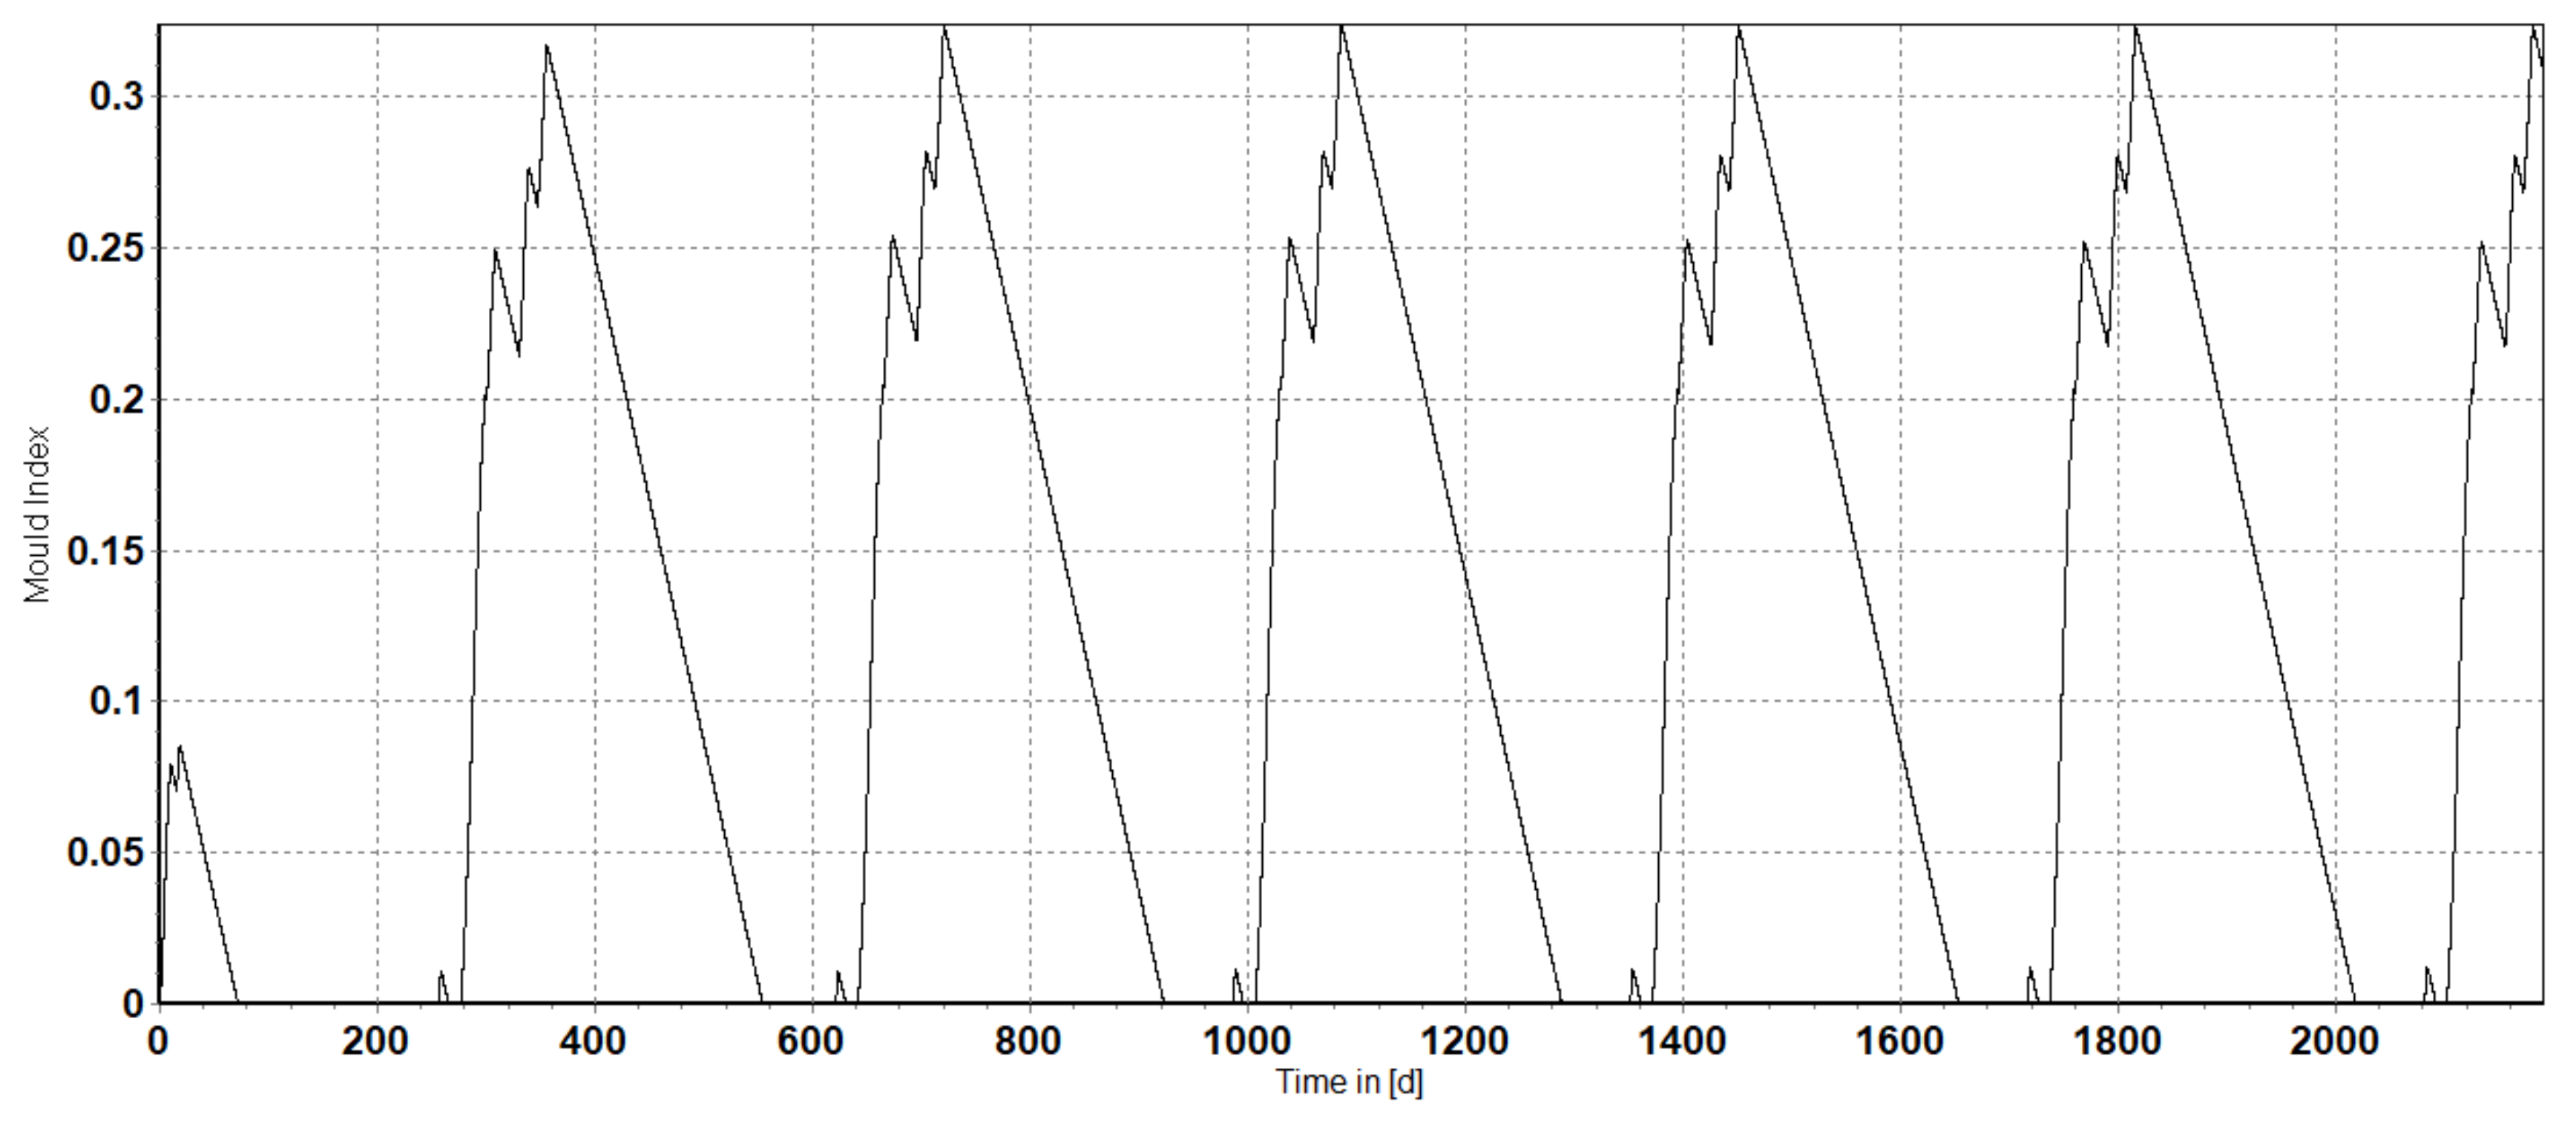
The mold index remains under 1 when vapor retarder is used in contemporary buildings. The mold growth index rises above 1 in the modeled interior-insulated wall without vapor retarder and therefore presents a significantly higher risk of mold growth (Figure 11). We concluded that the wall should not be built without vapor retarder.
4. Conclusions
Vapor retarder prevented an abrupt increase in relative humidity between the insulation material and the masonry even when the relative humidity value in the room increased due to the plastering work. However, the vapor retarder slowed the drying process. Relative humidity dropped below 70% during the measurement period, so we safely conclude that excessive moisture started to dry out. Final conclusions cannot be drawn because the winter was extraordinarily warm. All of the sensors continue to work and collect data, so the research can continue for a longer period of time.
The Delphin software program was used to test the results. Using the ventilated air gap, mold test reference year data, and calculated indoor parameters, Delphin confirmed that the vapor retarder is practical. The mold index should remain below 1 in contemporary buildings. Six consecutive mold test reference years were used to determine that the mold index stayed below 1 between the insulation and the masonry wall as well as on the warmer side of the vapor retarder. Without vapor retarder, the mold index rose rapidly above 1, which indicated that reed panels cannot be used without smart vapor retarder.
The use of the heating cable facilitates the process of drying out excessive moisture in the colder parts of the structure.
Further research areas include discovering the amount of maximum moisture mass in the brick wall and the air change rate of the air gap between the two brick layers of wall. Additional modeling with Delphin software should be performed using condensed test reference year data to forecast whether there is a risk of freezing. Wooden beam ends should also be tested for decay and mold growth.
Author Contributions
Conceptualization, K.K. and T.A.; Methodology, K.K. and T.A.; Software, K.K. and T.A.; Validation, K.K. and M.K.; Formal Analysis, K.K. and T.A.; Investigation, K.K. and T.A.; Resources, K.K.; Data Curation, K.K. and T.A.; Writing—Original Draft Preparation, K.K. and T.A.; Writing—Review & Editing, K.K., M.K., and M.-J.M.; Visualization, K.K., M.K., and M.-J.M.; Supervision, K.K.; Project Administration, K.K.; Funding Acquisition, K.K. All authors have read and agreed to the published version of the manuscript.
Funding
This research was funded by the Estonian Centre of Excellence in Zero Energy and Resource Efficient Smart Buildings and Districts, ZEBE, (2014–2022) funded by the European Regional Development Fund.
Acknowledgments
The authors gratefully acknowledge company Saint-Cobain for providing the materials used.
Conflicts of Interest
The authors declare no conflict of interest. The funders had no role in the design of the study; in the collection, analysis, or interpretation of data; in the writing of the manuscript; or in the decision to publish the results.
References
- Resolution of the Riigikogu General Principles of Climate Policy until 2050. Available online: https://ec.europa.eu/clima/sites/lts/lts_ee_et.pdf (accessed on 9 September 2020).
- Webb, A.L. Energy retrofits in historic and traditional buildings: A review of problems and methods. Renew. Sustain. Energy Rev. 2017, 77, 748–759. [Google Scholar] [CrossRef]
- Zhao, J.; Grunewald, J.; Ruisinger, U.; Feng, S. Evaluation of capillary-active mineral insulation systems for interior retrofit solution. Build. Environ. 2017, 115, 215–227. [Google Scholar] [CrossRef]
- Finken, G.R.; Bjarløv, S.P.; Peuhkuri, R.H. Effect of facade impregnation of feasibility of capillary active thermal internal insulation for a historic dormitory—A hygrothermal simulation study. Constr. Build. Mater. 2016, 113, 202–214. [Google Scholar] [CrossRef] [Green Version]
- Kočí, V.; Jerman, M.; Pavlík, Z.; Maděra, J.; Žák, J.; Černý, R. Interior thermal insulation systems based on wood fiberboards: Experimental analysis and computational assessment of hygrothermal and energy performance in the Central European climate. Energy Build. 2020, 222, 110093. [Google Scholar] [CrossRef]
- Klõšeiko, P.; Varda, K.; Kalamees, T. Effect of freezing and thawing on the performance of “capillary active” insulation systems: A comparison of results from climate chamber study to HAM modelling. Energy Procedia 2017, 132, 525–530. [Google Scholar] [CrossRef]
- Häupl, P.; Jurk, K.; Petzold, H. Inside thermal insulation for historic facades. In Research in Building Physics; Hens, H., Vermeir, G., Carmeliet, J., Eds.; Balkema: Lisse, The Netherlands, 2003; pp. 463–469. [Google Scholar]
- Klõšeiko, P.; Arumägi, E.; Kalamees, T. Hygrothermal performance of internally insulated brick wall in cold climate: A case study in a historical school building. J. Build. Phys. 2014, 38, 444–464. [Google Scholar] [CrossRef]
- Klõšeiko, P.; Kalamees, T. Vabaduse väljak 10 seespoolse lisasoojustuse konsultatsioon, lahenduste väljatöötamine ja niiskustehnilise toimivuse uuring. In Consultation and Hygrothermally Reliable Interiorly Insulated Wall in Vabaduse Väljak 10; Tallinna Tehnikaülikool: Tallinn, Estonia, 2016; (In Estonian). Available online: https://uuringud.tallinn.ee/uuring/vaata/2016/Vabaduse-valjak-10-seespoolse-lisasoojustuse-lahenduse-valjatootamine-ja-niiskustehnilise-toimivuse-uuring (accessed on 1 September 2020).
- Klõšeiko, P.; Kalamees, T. Vabaduse väljak 7 seespoolse niiskustehnilise toimivuse uuring. In Vabaduse Väljak 7 Internal Insulation Moisture—Technical Effectiveness Theory; Tallinna Tehnikaülikool: Tallinn, Estonia, 2015; (In Estonian). Available online: https://uuringud.tallinn.ee/uuring/vaata/2015/Vabaduse-valjak-7-seespoolse-lisasoojustuse-niiskustehnilise-toimivuse-uuring (accessed on 1 September 2020).
- Aru, T. Hygrothermal Assessment of Internally Insulated Brick Walls with Air Cavity Using Reed Panels. Master’s Thesis, Estonian University of Life Sciences, Tartu, Estonia, 2020. [Google Scholar]
- Europan Technical Assessment ETA-05/0093. Deutsches Institut für Bautechnik, 7 June 2018. Available online: https://www.multipor.com/certificates-and-approvals.php (accessed on 22 July 2020).
- ISOVER Saint-Gobain. VARIO® XTRA Membrane. Registration Number The International EPD® System: S-P-01141. Valid 2019.03.03 p.13 VARIO® XTRA Membrane—Isover in Accordance with EN 15804, ISO 14025. 2018, p. 15. Available online: https://www.isover.ee/ (accessed on 22 July 2020).
- Miljan, M.; Miljan, J. Pilliroost toodete energiamahukus. In Pilliroog Ja Selle Kasutamise Võimalused (Reed and the Use of It); Estonian University of Life Sciences: Tartu, Estonia, 2013; pp. 72–78. (In Estonian) [Google Scholar]
- Kask, Ü.; Kask, L. Pilliroo ressursid ja saagikus. In Pilliroog Ja Selle Kasutamise Võimalused (Reed and the Use of It); Tartu Compendium: Tartu, Estonia, 2013; pp. 9–10. (In Estonian) [Google Scholar]
- Pilt, K. Ehituskultuuri tõstes ennetame hallitust. In Keskkonnatehnika; TOIMETUS: Tallinn, Estonia, 2008; pp. 20–23. (In Estonian) [Google Scholar]
- Vereecken, E.; Roels, S. A comparison of the hygric performance of interior insulation systems: A hot box–cold box experiment. Energy Build. 2014, 80, 37–44. [Google Scholar] [CrossRef]
- Hoonete piirdetarindi soojusläbivuse arvutusjuhend. Osa 1: Välisõhuga kontaktis olev läbipaistmatu piire. In Guidance for Calculation of the Thermal Transmittance of Building Envelope. Part 1: Opaque Building Envelope in Contact with Outdoor-Air; EVS 908-1; Estonian Centre for Standardisation: Tallinn, Estonia, 2016. (In Estonian)
- Miljan, M.-J. Pillirooplaatide soojuserijuhtivus. In Pilliroog Ja Selle Kasutamise Võimalused (Reed and the use of it); Estonian University of Life Sciences: Tartu, Estonia, 2013; p. 72. (In Estonian) [Google Scholar]
- Kalamees, T.; Vinha, J. Estonian Climate Analysis for Selecting Moisture Reference Years for Hygrothermal Calculations. J. Therm. Envel. Build. Sci. 2004, 27, 199–220. [Google Scholar] [CrossRef]
- Tartu, Estonia Weather. Available online: http://energia.emu.ee/weather/ (accessed on 20 July 2020).
- Hygrothermal Performance of Building Components and Building Elements—Internal Surface Temperature to Avoid Critical Surface Humidity and Interstitial Condensation—Calculation Methods; EVS-EN ISO 13788; ISO: Geneva, Switzerland, 2012.
- Hukka, A.; Viitanen, H.A. A mathematical model of mould growth on wooden material. Wood Sci. Technol. 1999, 33, 475–485. [Google Scholar] [CrossRef]
Figure 1.
Comparison of additional insulation thickness and energy demand. Reproduced with permission from [11].
Figure 1.
Comparison of additional insulation thickness and energy demand. Reproduced with permission from [11].

Figure 2.
The test building: (a) building location and (b) the original wall from outside (red square).
Figure 2.
The test building: (a) building location and (b) the original wall from outside (red square).

Figure 3.
Building the test wall.

Figure 4.
The plan and cross-sections of the test wall.

Figure 5.
Calculated hourly values of moisture excess in the test apartment from 7 February 2020 to 29 March 2020. Reproduced with permission from [11].
Figure 5.
Calculated hourly values of moisture excess in the test apartment from 7 February 2020 to 29 March 2020. Reproduced with permission from [11].

Figure 6.
Test wall temperatures. Reproduced with permission from [11].
Figure 6.
Test wall temperatures. Reproduced with permission from [11].

Figure 7.
Relative humidity values between the insulation and the original wall modeled with Delphin. Reproduced with permission from [11].
Figure 7.
Relative humidity values between the insulation and the original wall modeled with Delphin. Reproduced with permission from [11].

Figure 8.
Test wall relative humidity. Reproduced with permission from [11].
Figure 8.
Test wall relative humidity. Reproduced with permission from [11].

Figure 9.
Relative humidity values in modeled interior-insulated wall with vapor retarder. Reproduced with permission from [11].
Figure 9.
Relative humidity values in modeled interior-insulated wall with vapor retarder. Reproduced with permission from [11].

Figure 10.
Mold growth index value on the interior side of the vapor retarder. Reproduced with permission from [11].
Figure 10.
Mold growth index value on the interior side of the vapor retarder. Reproduced with permission from [11].

Figure 11.
Mold growth index value between the insulation and the original wall. Reproduced with permission from [11].
Figure 11.
Mold growth index value between the insulation and the original wall. Reproduced with permission from [11].


Table 1.
Test wall building schedule.
| Dates | Process |
|---|---|
| 9 December 2019 | The measuring devices and heating cable were installed. |
| 10–12 December 2019 | The test wall was insulated by applying vapor retarder film on walls 2 and 4. |
| 12–13 January 2020 | Vapor retarder film was applied to walls 2 and 4, those walls were insulated, and the first layer of clay was plastered. |
| 26 January 2020 | The test wall was plastered with the second layer of clay. |
© 2020 by the authors. Licensee MDPI, Basel, Switzerland. This article is an open access article distributed under the terms and conditions of the Creative Commons Attribution (CC BY) license (http://creativecommons.org/licenses/by/4.0/).
Share and Cite
MDPI and ACS Style
Keskküla, K.; Aru, T.; Kiviste, M.; Miljan, M.-J. Hygrothermal Analysis of Masonry Wall with Reed Boards as Interior Insulation System. Energies 2020, 13, 5252. https://0-doi-org.brum.beds.ac.uk/10.3390/en13205252
AMA Style
Keskküla K, Aru T, Kiviste M, Miljan M-J. Hygrothermal Analysis of Masonry Wall with Reed Boards as Interior Insulation System. Energies. 2020; 13(20):5252. https://0-doi-org.brum.beds.ac.uk/10.3390/en13205252
Chicago/Turabian StyleKeskküla, Kadri, Tambet Aru, Mihkel Kiviste, and Martti-Jaan Miljan. 2020. "Hygrothermal Analysis of Masonry Wall with Reed Boards as Interior Insulation System" Energies 13, no. 20: 5252. https://0-doi-org.brum.beds.ac.uk/10.3390/en13205252
Note that from the first issue of 2016, this journal uses article numbers instead of page numbers. See further details here.