A Study for the Optimal Exploitation of Solar, Wind and Hydro Resources and Electrical Storage Systems in the Bormida Valley in the North of Italy


Electrical, Electronics and Telecommunication Engineering and Naval Architecture Department (DITEN), University of Genoa, Via Opera Pia 11a, 16145 Genoa, Italy
Energies 2020, 13(20), 5291; https://0-doi-org.brum.beds.ac.uk/10.3390/en13205291
Submission received: 3 September 2020
/
Revised: 3 October 2020
/
Accepted: 9 October 2020
/
Published: 12 October 2020
Abstract
:The exploitation of distributed renewable energy sources leads to a low-carbon energy transition, mainly based on the optimal integration of hydro, PV and wind power plants with the remaining high-performance fossil-fuel power stations. In the last twenty years, European Union (EU) countries have shown a significant increase of the power installed in new PV and wind power plants, together with the refurbishment of small and medium size hydro stations. In particular, in Italy, PV and wind energy production has strongly increased and nowadays there are regions characterized by a very green energy mix. In this new scenario, energy storage becomes a viable solution to mitigate the variability of renewable energy sources thus optimizing the network operation. The present paper is focused on the Liguria region, in the North of Italy and in particular on the Bormida Valley where nowadays more than the half of the annual electricity consumption is covered by the renewable energy local production. The paper describes the current energy situation and proposes an optimization tool to investigate the possibility of installing new PV and wind power plants, as well as energy intensive storage units based on sodium-sulphur batteries; moreover, different scenarios are analyzed through the definition of economic and environmental key performance indicators.
1. Introduction
The Vision 2050 of the European Commission has set important goals in the energy sector to protect the environment, create affordable and market-based energy services and ensure security, reliability and resilience of energy supply [1]. As envisaged by the European Union (EU), in 2050 the European energy system will be almost fully decarbonized and characterized by the massive presence of energy storage technologies and demand flexibility. Power and energy intensive storage systems will be used to compensate discrepancies between the energy demand and the production, this last mainly deriving from intermittent renewable sources. As far as the demand is concerned, active consumers and prosumers will operate within the energy markets [2], where power capacity and flexibility services will also be offered by private stakeholders managing flexible loads and small size generation units and storage devices, as well as electric vehicles capable of operating in vehicle-to-grid (V2G) and vehicle-to-home (V2H) modes. The power system of the future will be characterized by the integration among different energy carrier networks and will be composed of: (i) bulk generation units (mainly combined cycles and large size hydro power plants), PV and wind farms connected to high voltage networks; (ii) medium size PV and wind plants connected to medium voltage networks, including also smart microgrids at district level; (iii) low voltage microgrids and nanogrids providing energy to detached houses and group of buildings and coupled with thermal and cooling networks [3,4]. The great spread of renewable power plants has completely changed the energy market. Nowadays, as reported by Howlader et al. in Reference [5], traditional fossil-fuel power stations show lower annual utilization factors and partial load operation in many hours of the year. Moreover, in the regions where the presence of renewable power plants is important, null or negative prices can be observed in the energy markets and it can happen that fossil-fuel power stations are turned off and a part of the renewable energy production must be curtailed during low-demand hours [2,6,7].
All the electric system’s levels should be equipped with distributed storage systems: pumped hydro stations, compressed air energy storage (CAES) systems, power-to gas and power-to-heat technologies [2], together with batteries, flywheels, supercapacitors, superconducting magnetic energy storage (SMES), pumped thermal energy storage (PTES) [8,9,10]; while some storage technologies are more suitable for large size installations (e.g., pumped hydro and CAES) [11], batteries have a wide-ranging use and can be installed both in medium and high voltage networks and at building level. As highlighted by Günther et al. [12], in some applications it is profitable to combine different storage technologies, some power intensive and others energy intensive, in order to improve the range of possible services provided by the whole storage system.
The use of storage systems will also increase due to the current and future electrification of the EU economy (in the majority of the sectors: residential, tertiary, industry, transport, etc.) coupled with a higher penetration of energy production from even more cost-effective renewable sources. Indeed, as assessed in References [1,8,13], storage systems permit to flatten the demand curve over the day, to defer infrastructure upgrades and to increase the flexibility of power networks by mitigating daily and seasonal differences between energy demand and renewable source availability. Similar benefits can derive from the implementation of both demand response strategies and smart charging of electric and hybrid vehicle fleets. Finally, it is worth mentioning that energy efficiency in industries and in the residential and tertiary sectors could lead to further changes and improvements to power and energy systems.
Several studies reported in the literature are focused on the integration at regional or national level of different renewable energy power plants. In Reference [14] Martínez-Jaramillo et al. describe the case study of Switzerland, highlighting the benefits from exploiting PV plants and hydro stations (both reservoir or pumped type) as a function of renewables penetration level, whereas in Reference [15] Ramirez Camargo et al. analyze the effects of installing PV plants, wind systems and storage batteries in the residential sector in Germany and Czech Republic. A detailed analysis of the PV residential installation in Italy is reported in Reference [16], while the exploitation of solar, hydro and wind resources in the New York’s state is investigated in Reference [17].
A detailed analysis of the current issues related to the installation of grid scale electricity storage systems (ESS) is reported in References [9,18]: the authors highlight the lack of standards and procedures for connecting, operating and maintaining ESSs and the need of new policies supporting a higher remuneration to ESSs participating to ancillary services and capacity markets. Moreover, they focus the attention on distributed generation coupled with storage and demand response and conclude that only properly planned and managed energy facilities with renewables and storage can provide benefits to the power system, in terms of loss reduction, improved reliability and security and emission reduction.
Among storage batteries, sodium-sulphur (NaS) technology represents a valid option for both stationary applications and power supply, with more than 350 MW worldwide installed [19,20,21,22]. Andriollo et al. in Reference [19] report the installation of NaS batteries in the Italian high voltage network and describe in detail three pilot facilities in the South of Italy, where there has been a massive exploitation of the wind source in large size on-shore wind farms. These batteries provide an energy intensive service since they can be charged and discharged in long time intervals and have the peculiarity of working at high temperature. As highlighted by the project described in Reference [20], related to the integration of NaS and wind technologies, batteries can be used to shift the wind generation from off-peak to on-peak hours, as well as to mitigate the ramp rate of the wind farm output. Another important technology is represented by sodium-nickel chloride (NaNiCl2) batteries which have been installed in the recent years in large scale stationary storage applications in high voltage networks, to provide services such as voltage regulation, load levelling and renewable sources mitigation [23].
In the literature, several studies deal with optimization models developed to design and operate energy storage systems [12,15,24,25,26,27,28,29,30]. In Reference [24] Wogrin et al. propose a mathematical model to optimally design, in terms of best sizing and siting, different storage systems (pumped hydro, CAES, flywheels and lithium-ion batteries) for transmission networks; they take into account possible congestions on the network as well as life-cycle costs of technologies. An overview of different techniques to size battery storage systems is reported by Yang et al. in Reference [27] whereas the definition of optimal configurations of PV-wind-battery systems in the residential sector is studied by Ramirez Camargo et al. in Reference [15]. The optimal sizing of a hybrid system composed of a base storage and a peak storage is presented in Reference [12], while in Reference [26] the focus is on the sizing and the use of short-term storage systems at regional level in Switzerland. The adoption of storage systems to mitigate congestions in distribution networks is highlighted in Reference [29], where Chowdhury et al. develop an optimization model for the location of storage systems in a medium voltage distribution network. As highlighted by Meneses de Quevedo et al. in Reference [31], energy storage systems can be optimally sized and located to reduce wind curtailment; moreover, the penetration of dispersed generation and storage systems in distributed networks is analyzed in order to evaluate their impact also on power losses and voltage deviation with respect to reference values.
Regarding the operational point of view, two optimal operating strategies to manage a hybrid system composed of a wind farm and a pumped-hydro-storage plant are investigated by Eliseu et al. in Reference [25] to maximize both the profits derived from the participation to energy markets and the exploitation of the renewable source. In Reference [28] Rossi et al. propose a unit commitment optimization model used to analyze the role of storage systems in the Italian ancillary market, whereas in Reference [5] Howlader et al. provide a detailed review of the unit commitment models which consider the integration of energy storage systems.
The present paper derives from a research study conducted with the aim of exploring the possibility of increasing the exploitation of solar and wind resources in the Liguria region, in the North of Italy. In particular, the study is focused on the Bormida Valley, a green territory in the backcountry of Savona city. In the paper the current spread of renewable power plants (PV, wind and hydro) in the aforesaid area is described and a mixed-integer linear programming (MILP) model is proposed with a twofold aim: firstly, to determine the profitability of installing new PV and wind plants, and, secondly, to investigate the benefits of using NaS batteries as energy intensive storage systems. Different scenarios are analyzed, as a function of the penetration level of renewables and the capital cost of batteries. The multi-objective optimization model aims to optimally design and manage the whole energy infrastructure in order to reduce the global energy costs of the community living in the valley as well as the CO2 emissions associated with the energy locally produced by fossil-fuel power plants or imported from other regions. For each analyzed scenario, annual key performance indicators are evaluated and optimal strategies to manage dispatchable power plants and storage systems are reported.
The paper is organized as follows—in Section 2, the outcome of the study performed to analyze the current energy situation of the Liguria region and more in detail of the Bormida Valley, is presented. Section 3 describes the MILP model, whereas results are discussed in Section 4. Finally, the main conclusions are outlined in Section 5.
2. The Case Study
The first step of the research here presented has been that of collecting and analyzing the data related to the electricity production and consumption in the Bormida Valley in the Liguria region. This section reports the main results of the analysis, starting from the data related to the Liguria region and, secondly, focusing on the Bormida Valley. It is important to point out that certain data related to the Liguria region have been used to estimate some missing data for the Bormida Valley.
2.1. The Liguria Region as a Whole
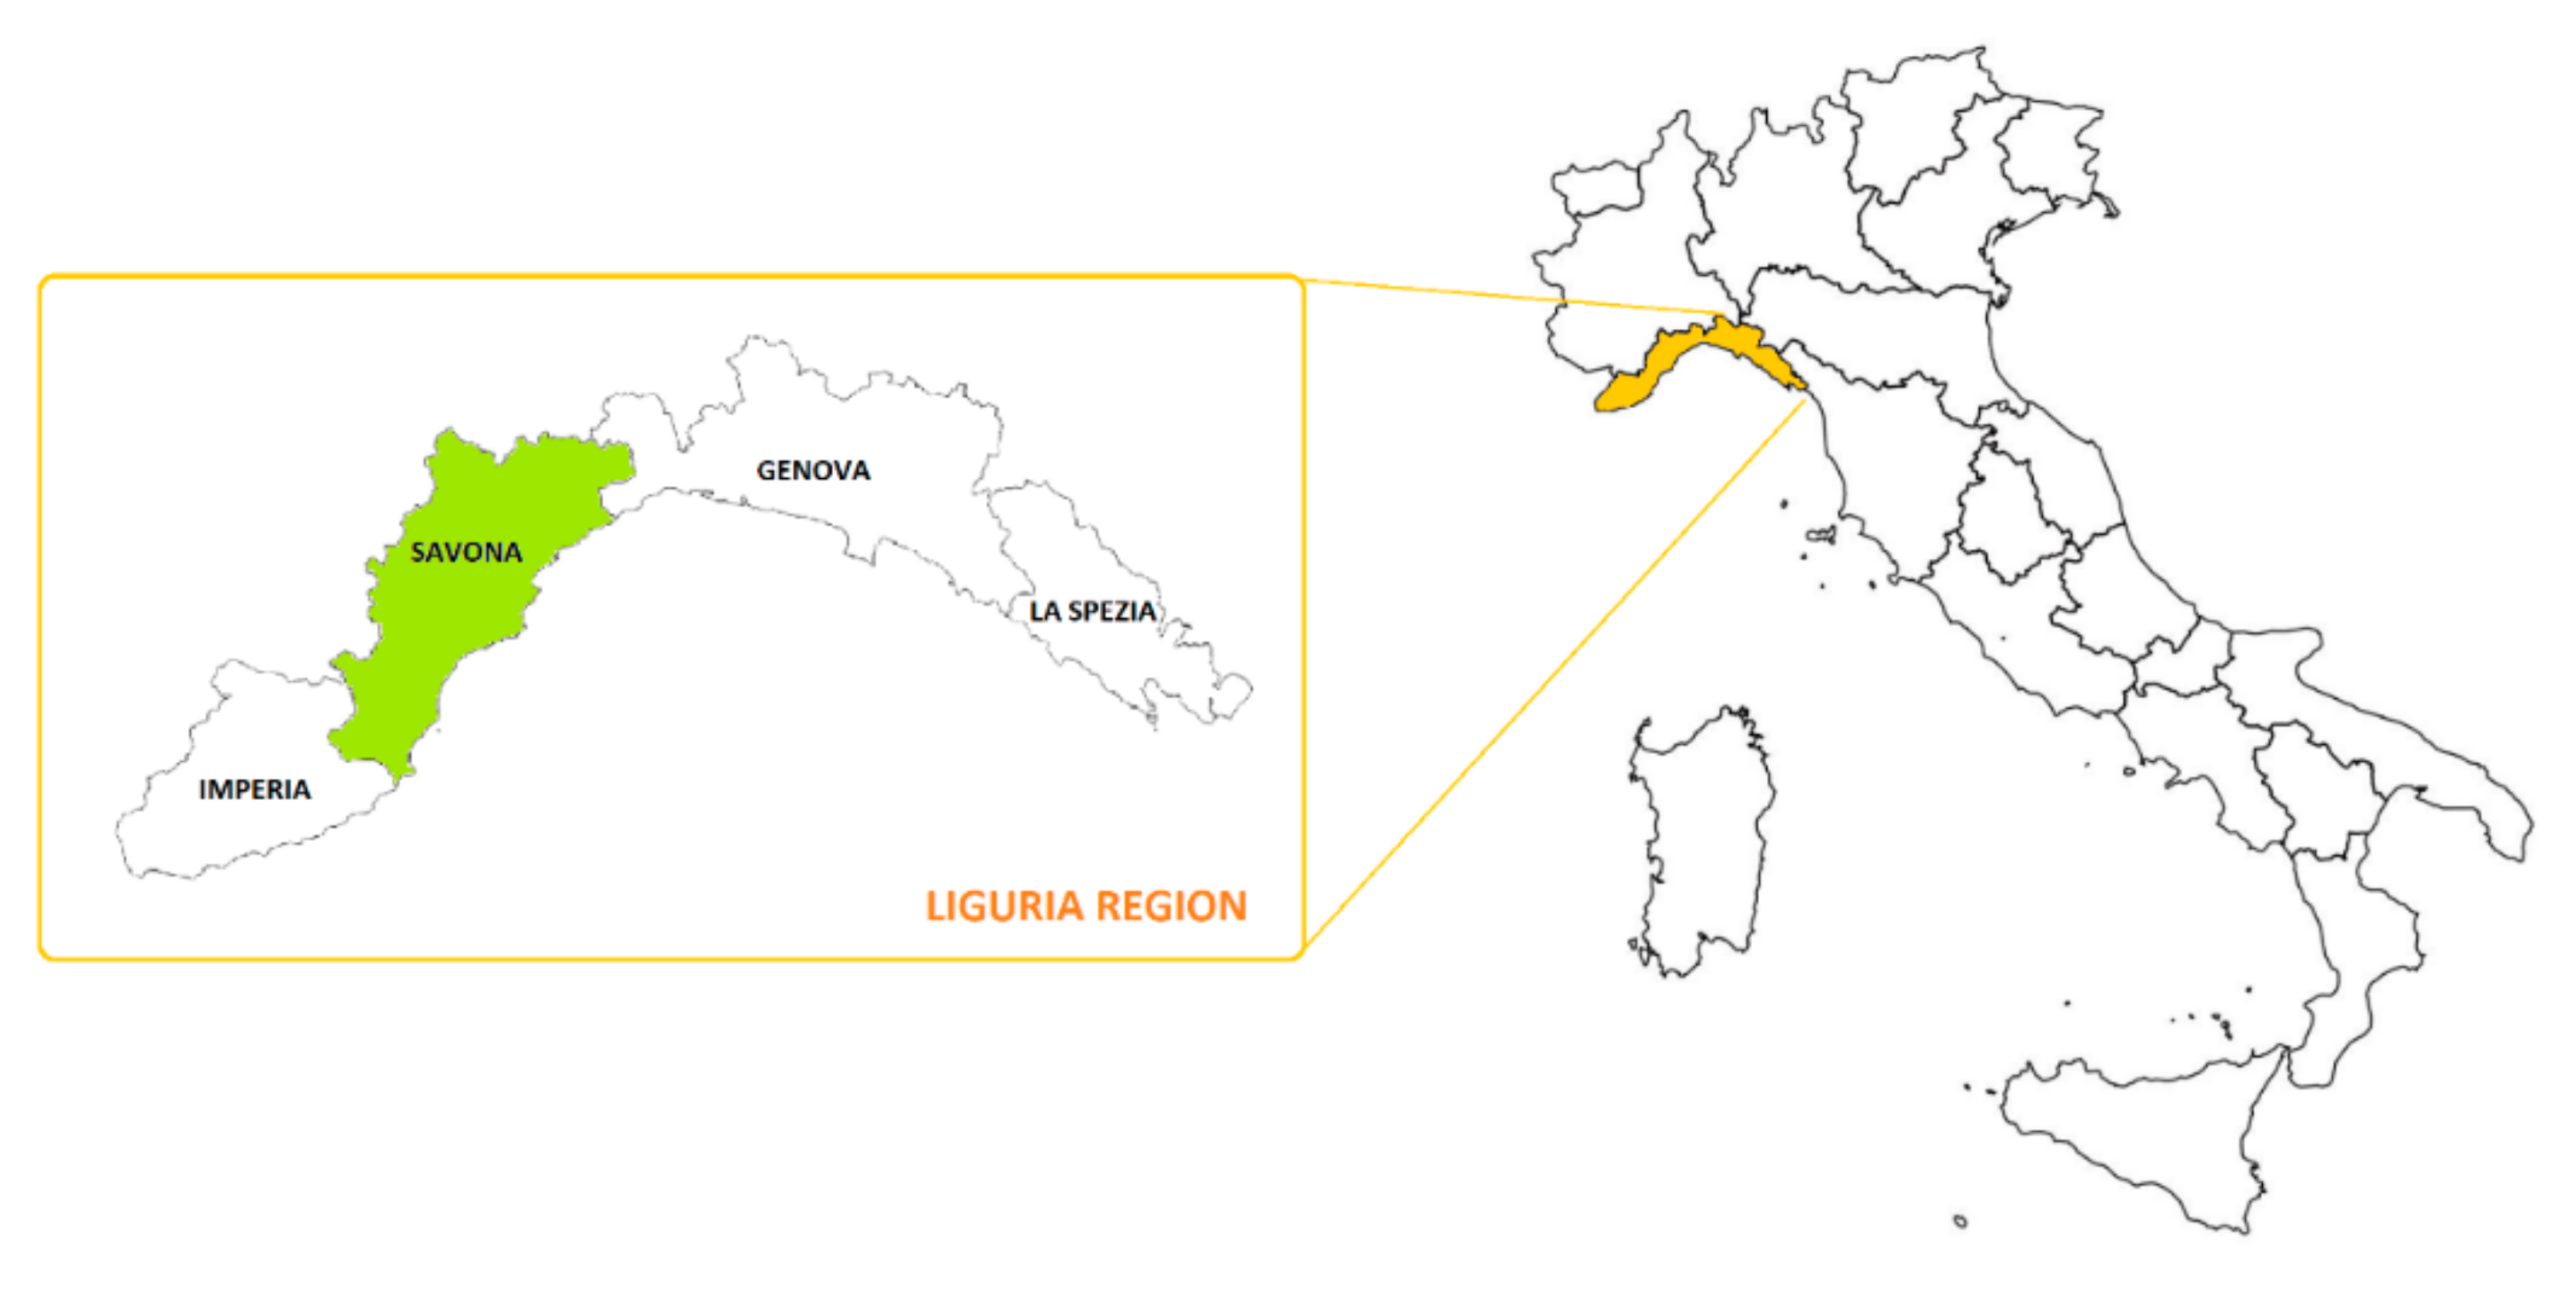
As shown in Figure 1, Liguria is a small region of north-western Italy characterized by a narrow arch of mountainous territory overlooking the Ligurian Sea. It shares borders with France and three Italian regions (Piemonte, Emilia Romagna and Toscana) and has about 1.5 million inhabitants (around 2.6% of the Italian population). From the administrative point of view, Liguria is divided into four parts: the Genoa metropolitan area (GE) and the provinces of Imperia (IM), La Spezia (SP) and Savona (SV). The Bormida Valley belongs to the Savona province.
In Table 1 the main data regarding electricity production and consumption in Italy and in Liguria are shown. Specifically, the reported data refer to the installed power (in renewable power plants and thermal power stations fed by fossil fuels), the gross electricity production and the net consumption. Moreover, for each generation technology the annual average values of Equivalent Operating Hours (EOH) are reported, remembering that EOH is given by the ratio between the annual gross electricity production and the installed power. Data have been elaborated from annual reports developed by GSE and Terna with reference to year 2018 [32,33].
In Italy the renewable energy power plants represent 46% of the total installed power and provide about 40% of the annual electricity production. Among renewables, there are several large-size hydro power plants installed in Alpine and Apennine regions and built in the first half of the last century, together with many PV and wind power plants (installed in the last twenty years) and some refurbished small-size hydro power stations. The electricity production from the geothermal source is mainly present in the Toscana region, with Larderello geothermoelectric power plants. In the last two decades the exploitation of solar and wind resources has increased a lot and nowadays there are numerous installations of small-size (in the residential and tertiary sector) and large-size power plants. On the other hand, thermal power stations mainly consist in large steam power units and combined cycles: the first ones (fed by coal or natural gas) have been built in the second half of the last century, while the majority of combined cycles have been in operation from about twenty years. In the last thirty years some steam power stations have been converted to combined cycles and the oldest ones have been decommissioned. Moreover, Italy has planned to phase-out coal by 2025.
In the Liguria region the situation is slightly different since only 16% of the gross electricity production derives from renewable sources. Indeed there are two important large power stations, one in La Spezia and one in Vado Ligure near Savona, which have been in operation from more than fifty years. In particular, La Spezia power station was originally composed of 4 steam power plants fed by coal and characterized by a global rated power of about 1800 MW, whereas in Vado Ligure there were 4 steam power plants each one fed by coal and with a rated power of 330 MW. The two industrial sites have undergone many changes over the last thirty years and, nowadays, their configuration is largely different. In La Spezia there are two combined cycles (345 MW and 337 MW) and one steam power unit (600 MW) [34], while in Vado Ligure there is only one 800 MW combined cycle [35]. In the past there was also a 295 MW thermoelectric power station near the Genoa port [36] but the plant was decommissioned in 2017. Due to the presence of the aforesaid power plants and considering the not so high electricity consumptions compared to other neighboring regions, Liguria was always characterized by a surplus of electricity production until 2015. In the recent years the situation has significantly changed. The decommissioning of some fossil fuel power stations and the reduction of EOH of steam power plants and combined cycles, mainly due to the increase of the production from renewable sources, have determined a yearly generation deficit from 2016 till 2018.
In Liguria the wind source is mainly exploited in the province of Savona where several wind farms have been installed benefitting from propitious wind conditions along the Alpine and Apennine crest. Small and medium size hydro power plants are present in some Alpine and Apennine valleys of Liguria, whereas the solar source is mainly exploited by PV plants installed on the roofs of residential and tertiary buildings and in industrial sites. Liguria provides around 2% of the national gross electricity production and present wind and hydro power plants characterized by higher EOH with respect to the average national values. Finally, as far as electricity consumption is concerned, Liguria represents 2% of the Italian electricity annual demand.
More details on the Genoa metropolitan area and on the provinces of Imperia, La Spezia and Savona are reported in Table 2, always referring to year 2018. As aforementioned, fossil fuel power stations are concentrated in the provinces of La Spezia and Savona and this last has the highest installed power in renewable plants. In Liguria 97% of the electricity produced with conventional power stations comes from the provinces of Savona and La Spezia, whereas around 69% of the electricity generated from renewable sources is produced by power plants installed in the province of Savona and in the Genoa metropolitan area. Due to the presence of very large thermoelectric units, the provinces of Savona and La Spezia present a low percentage value of electricity produced by renewable sources, respectively equal to 6.7% and 1.9%; on the other hand, the Genoa metropolitan area overcomes 54% and the energy production of the province of Imperia can be considered almost 100% green. But if we consider the installed renewable power per inhabitant, the province of Savona is the greenest, with a value of 358 W per inhabitant, while the Genoa metropolitan area is characterized by the lowest value, equal to 115 W per inhabitant and considerably lower than the nation value of 900 W. PV power plants are evenly distributed along the region, wind turbines are predominant in the province of Savona, while hydro power plants are mainly installed in the Genoa metropolitan area and in the province of Imperia near the border with France.
The electricity demand is higher in the Genoa metropolitan area and in the province of Savona, where the population is larger as well as the number of energy-consuming industrial sites. The province of Savona is that showing the highest per capita electricity demand, mainly due to the presence of industrial sites in the Bormida Valley.
2.2. The Bormida Valley
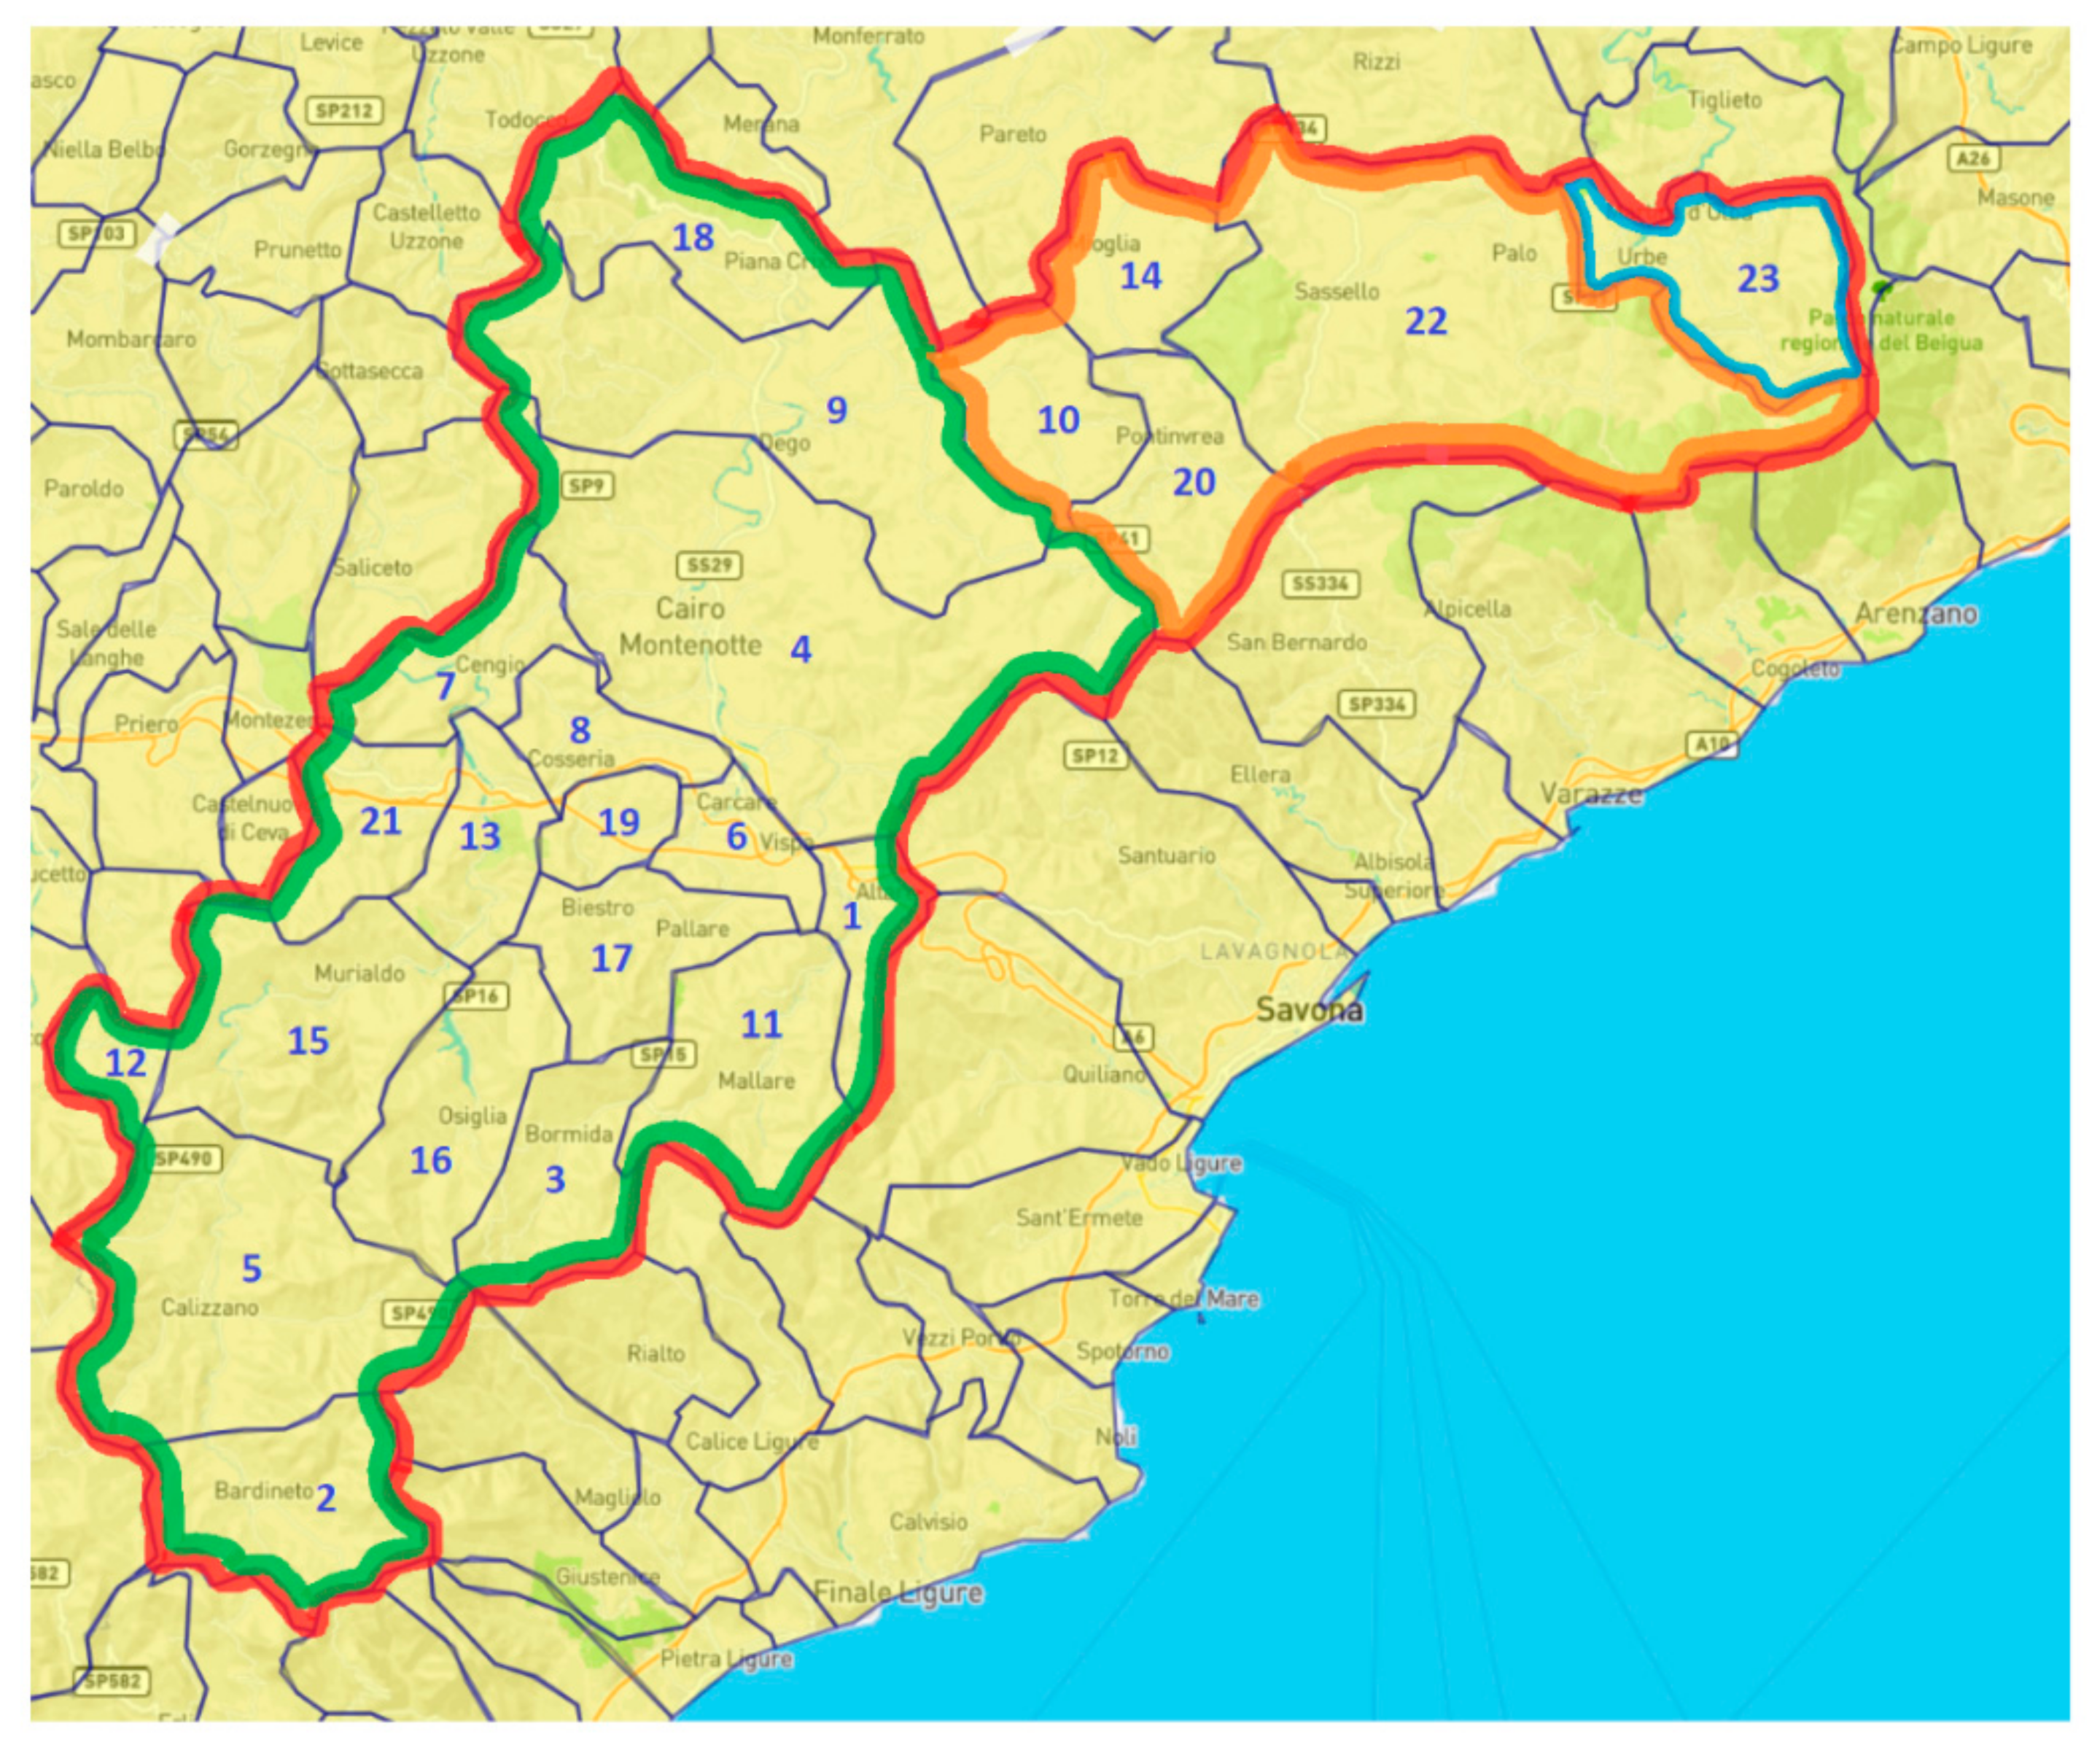
The Bormida Valley is a territory in the inland of Savona, which takes its name from the Bormida river. The valley’s boundaries are marked in green in the map shown in Figure 2. The area is delimited to the north-west by the border with Piemonte region and to the south-east by the watershed of Maritime Alps and Apennines; it is worth mentioning that the Cadibona Pass, which is the gateway to the Bormida Valley for people coming from the Savona city, is considered as the geographical point where Alps and Apennines meet.
The Bormida Valley includes 18 municipalities: Altare, Bardineto, Bormida, Cairo Montenotte, Calizzano, Carcare, Cengio, Cosseria, Dego, Mallare, Massimino, Millesimo, Murialdo, Osiglia, Pallare, Piana Crixia, Plodio, Roccavignale. The main city is Cairo Montenotte. In the present analysis, other 5 municipalities have been considered too—Giusvalla, Mioglia, Pontinvrea, Sassello, Urbe; they belong to the Erro Valley, except from Urbe which is in the Orba Valley. The choice of considering all the aforesaid 23 municipalities is due to the fact that they are strictly correlated from the geographical and social point of view. Hence, these 23 municipalities will be considered as if they were part of the same valley, that is the Bormida Valley. As reported in Table 2, the Bormida Valley covers an area of 732 km2, with more than 42,000 inhabitants which represent around 15% of the people living in the province of Savona and 2.8% of the population residing in the Liguria region.
As far as the energy scenario is concerned, renewable power plants installed in the Bormida Valley account for 51.1 MW with an annual gross electricity production of about 116 GWh which represents 58.2% of the production coming from renewables in the province of Savona. As reported in Table 2, it is important to highlight that the main part of the electricity produced by wind (68%) and hydro (96.9%) sources in the province of Savona comes from power plants installed in the Bormida Valley; the contribution of the PV production is lower (31.3%) even if remarkable. In the Bormida Valley there are also some thermal power plants, in particular cogeneration plants fed by natural gas or coke oven gas but in Table 2 no information about these plants is reported since they are mainly installed in industrial sites and there are no available public data regarding these facilities. In this regard, it is important to remark that some municipalities of the Bormida Valley (Altare, Cairo Montenotte, Carcare, Cengio, Dego, Millesimo) host important factories operating in various sectors (glass factories, metalworking and wood industries, bulk goods and chemical firms, food industries, etc.) and, especially in the 20th century, the valley has represented an internationally recognized industrial area. Nowadays the industrial sector is still active in the valley, even if some historical companies closed down and other ones have been restructured. Besides, the tourism sector has undergone a remarkable change due to the promotion of local natural, historic and artistic treasures; indeed, the Bormida Valley hosts nature reserves characterized by a large variety of habitats (e.g., the Adelasia Nature Reserve in the municipality of Cairo Montenotte), with small lakes and woods and numerous ruins of medieval towers and castles, as well as preserved historic centers.
The main geographical and energy data of the Bormida Valley municipalities are shown in Table 3. Referring to energy data, the figures reported in Table 3 derive from a detailed and long study which has been carried out through the analysis of reports and databases developed by Terna, the Italian Transmission System Operator [33], GSE [32,37] and Tirreno Power Company [38] which owns the majority of hydro power plants installed in the valley. Unfortunately, most of the analyzed reports and websites [32,33] indicate energy data only grouped by region or province and sometimes the databases on renewable energy power plants [37] are not at all updated or maybe list only plants which benefit from incentives. Consequently, to be sure of developing an accurate study, more investigations have been done by both directly contacting companies having in charge the installation and operation of plants and making on-site visits; useful information has been also captured from the geoportal of the province of Savona [39], where indications on installed or undergoing authorization plants are reported directly on the map of the province.
As shown in Table 3, the Bormida Valley has 9.6 MW of installed PV, 32.3 MW of wind turbines and 9.2 MW of hydro power plants. PV plants are characterized by a number of EOH higher than the regional average value but lower than the national one, while wind and hydro power plants show values of EOH higher than the average regional and national ones.
PV plants are present in all the municipalities and they are constituted by panels mainly mounted on the roofs of residential buildings and industrial warehouses; the smallest plant has a peak power of 1.5 kW while the largest one is characterized by an installed power of 940 kW. Some PV plants are also installed on public buildings such as schools, sport centers and city halls.
Wind power plants are only present in 9 municipalities and almost all of them are large size wind farms installed on the top of the hills and in the proximity of the watershed of Maritime Alps and Apennines where windy conditions are more favorable [40]. The installed wind turbines are horizontal-axis three-blades type with a rated power in the range between 800 kW and 2.5 MW, except some small turbines having a power lower than 100 kW and installed in urban areas.
Only 8 municipalities have hydro power plants. Most of them are small size run-of-river power plants, apart from the reservoir plant installed in Cairo Montenotte, having a rated power of 7 MW.
In the future, considering some ongoing projects, the installed power in PV plants and wind farms is expected to rise in the valley; as far as the hydro sector is concerned, probably only some old plants will be repowered or reactivated. This justifies the choice of considering only the increase of PV and wind installed power in the present study.
3. The Mathematical Model
This section contains the detailed description of the developed MILP model by reporting the data of the problem, the objective function, the list of decision variables and the constraints.
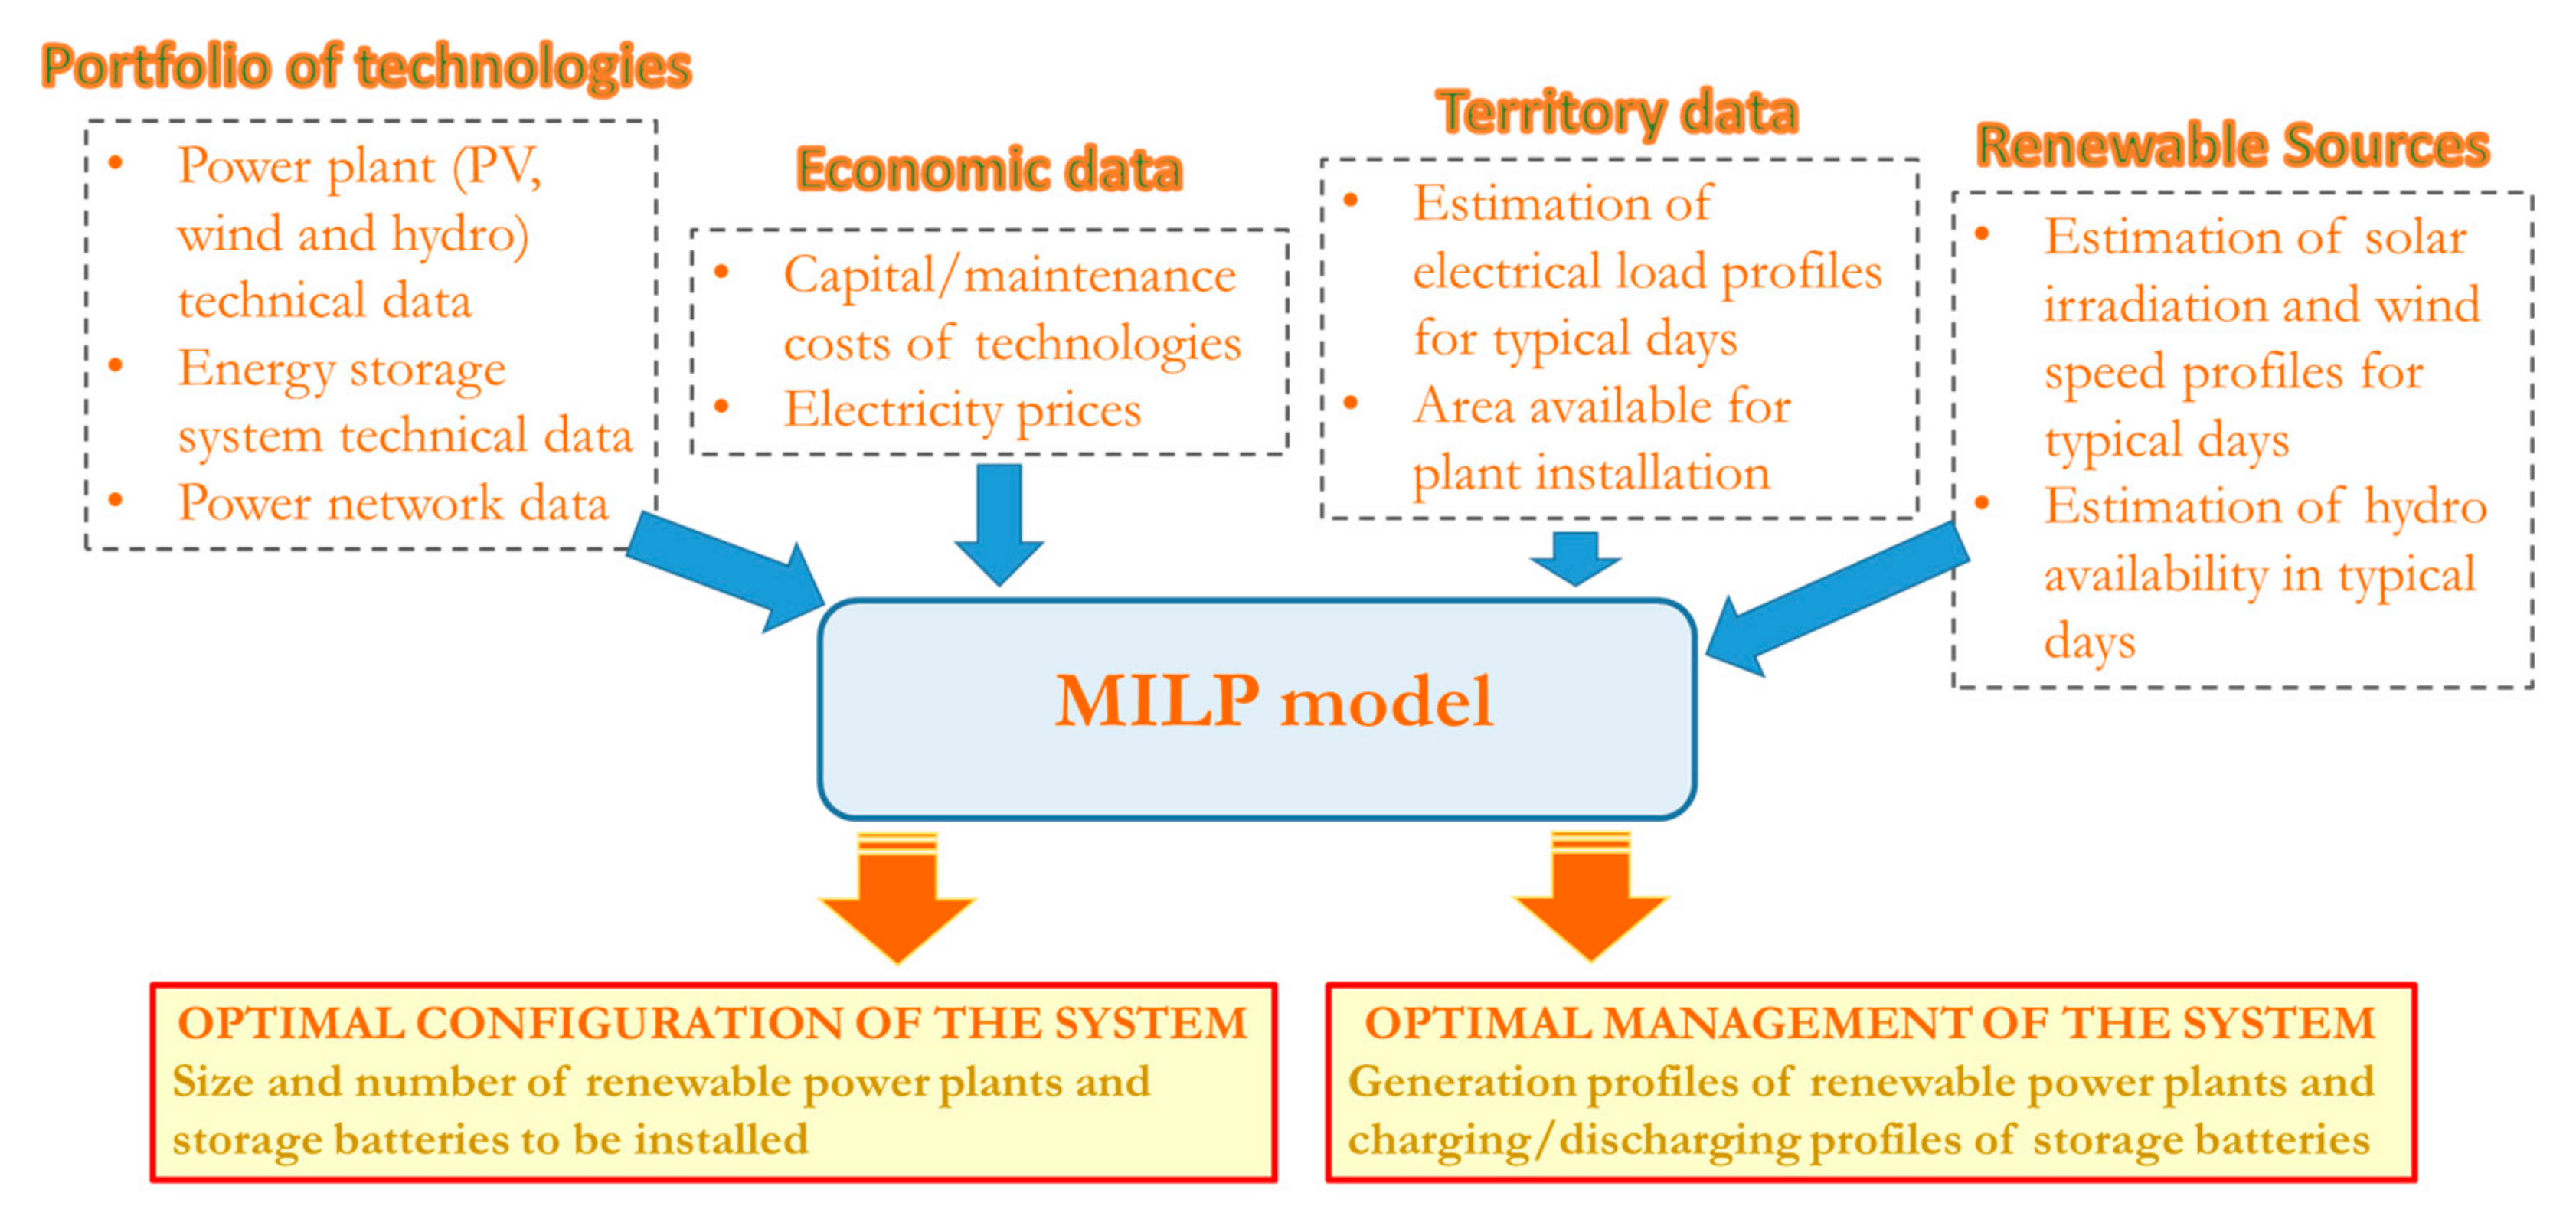
The architecture of the model is highlighted in Figure 3. Referring to a specific territory, characterized by the presence of renewable energy power plants (PV, wind and hydro) and several electrical loads (residential, tertiary and industrial), the model is used to design the installation of new generation plants (PV and wind) and storage systems with the aim of minimizing costs and emissions of the whole area. Moreover, the model also permits to optimally schedule the daily operation of both dispatchable renewable power plants (hydro reservoir) and storage systems.
3.1. Data and Assumptions
The optimization problem is formalized considering a time horizon of one year subdivided into D typical days, each one representing days of the year. Every single typical day is divided into time intervals, each one having a length equal to . The main data of the model are here described referring to each specific subsystem they refer to.
3.1.1. PV Plants
Regarding the PV plants already installed in the examined territory, the model has in input which is the estimated total power generated by the aforesaid plants at time t (∀t = 1..T) of day d (∀d = 1..D).
To model the new PV plants (which could be installed) the main needed data refer to the solar irradiation , forecasted at time t (∀t = 1..T) of day d (∀d = 1..D) and to the maxim number of new PV panels which can be installed. Fixed and pre-assigned tilt and orientation values are assumed for the panel installation and the solar irradiation is considered to be measured on the panel surface. Only one type of panels is here considered and each panel is characterized by the active area () and the peak power (), the latter evaluated at standard test conditions (STC). An average value of plant global efficiency () is assumed for each typical day d (∀d = 1..D); this value depends on the average ambient temperature which characterizes the corresponding typical day in daylight hours. Other data regarding the PV technology are the capital cost per unit of installed power () and the capital recovery factor () evaluated as a function of the discount rate (r) and of the average lifespan of the PV technology () using the formula .
3.1.2. Wind Power Plants
As far as wind energy production is concerned, the estimated power generated by the wind power plants (already installed or in the process of being installed) at time t (∀t = 1..T) of day d (∀d = 1..D) is the main input of the model. It is determined using wind speed average profiles for each typical day and knowing the power curves of wind turbines.
3.1.3. Hydro Power Plants
The model does not consider the possibility of installing new hydro power plants. However, the daily generation profiles of the plants already installed are not fixed a priori but they can be optimally scheduled taking into account the following two sets of data:
- : maximum power which can be generated by the set of the already installed hydro plants at each time of day d (∀d = 1..D), mainly dependent on both the installed power and the available hydro potential strictly related to the precipitation in each season.
- : maximum daily electricity production of the set of already installed hydro plants in day d (∀d = 1..D) estimated through the analysis of historical data and information supplied by the company owner of the majority of the plants [38].
For simplicity, all the power plants are considered to be of reservoir type.
3.1.4. Energy Storage System
The model considers the possibility of installing energy storage units (composed of electrochemical batteries) in the proximity of the renewable energy power plants. Only one type of storage batteries is considered. The main input data regarding this technology refer to the maximum number of storage units which can be installed () and, for each storage units, the rated capacity (), the minimum State of Charge () expressed as a fraction of the rated capacity and the maximum charging/discharging power (, ). Constant charging () and discharging () efficiency values are assumed, whereas the battery capital cost () is evaluated per unit of storable energy. Finally, is the capital recovery factor of the storage system dependent on the discount rate r and the average lifespan of battery storage units.
3.1.5. Power Network
The territory under investigation (considered as a whole entity in the present model) can exchange electricity with the surroundings areas. Moreover, the electricity can also be produced by local fossil fuel power stations here not modelled. indicates the sum between the maximum power which can be imported from adjacent areas and the maximum power injectable into the network by local fossil fuel power stations, whereas is the maximum power which can be exported to adjacent areas. Electricity purchasing and selling average prices, respectively indicated by and , are considered in the model.
3.1.6. Electrical Loads
For each typical day an aggregated load profile is calculated taking into account all the loads present in the examined territory. In particular, denotes the aforesaid estimated electrical load at time t (∀t = 1..T) of day d (∀d = 1..D).
3.2. Decision Variables
The decision variables refer to the installation of new PV plants and battery storage units as well as to the operating scheduling of already installed hydro power plants and of the energy storage system. Here below the list of decision variables is reported for each subsystem.
3.2.1. PV Plants
- : number of new PV panels to be installed.
3.2.2. Hydro Power Plants
- : power generated by the already installed hydro power plants at time t (∀t = 1..T) of day d (∀d = 1..D).
3.2.3. Energy Storage System
- : number of battery storage units to be installed.
- : rated capacity of the energy storage system composed of units.
- : energy content of the storage system at time t (∀t = 1..T) of day d (∀d = 1..D). The set of battery storage units is modeled as a unique storage system.
- : power transferred to the storage system at time t (∀t = 1..T) of day d (∀d = 1..D).
- : power released by the storage system at time t (∀t = 1..T) of day d (∀d = 1..D).
- : binary variable equal to 1 if the storage system is charging at time t (∀t = 1..T) of day d (∀d = 1..D).
- : binary variable equal to 1 if the storage system is discharging at time t (∀t = 1..T) of day d (∀d = 1..D).
3.2.4. Power Network
- : sum between the power imported from adjacent areas and the power locally produced by fossil fuel power stations at time t (∀t = 1..T) of day d (∀d = 1..D).
- : power exported to adjacent areas at time t (∀t = 1..T) of day d (∀d = 1..D).
3.3. Objective Function
The objective function O.F. (to be minimized) of the optimization problem is given by the sum of two terms: the overall annual capital and operating costs K and the costs related to the carbon dioxide emissions associated with the electricity imported from adjacent areas or locally produced by fossil fuel power stations. In (1) represents the unit cost of emissions (expressed as € per ton of carbon dioxide) whereas the parameter is a weight which can be varied between 0 and 1. When is equal to 1 the objective function is given by the sum of capital and operating costs, while when is null only emissions are minimized.
The overall annual costs are calculated as:
while emissions are given by:
where is the emission factor calculated as a function of both the emission factor of the national energy mix and the one of the fossil fuel power stations present in the considered territory.
3.4. Constraints
The main constraints of the optimization problem are reported and described in the following for each subsystem.
3.4.1. PV Plants
As shown in (4) the number of new installed PV panels has to be null or positive and lower than a maximum value which depends on the available area in the examined territory.
3.4.2. Wind Power Plants
There are no constraints for wind power plants since the electricity generation profiles of wind turbines (already installed or in the process of being installed) constitute input data of the optimization problem. In particular, the profiles for the case study described in the present paper have been estimated by using the data provided by the weather and climate database of the Liguria Region [41].
3.4.3. Hydro Power Plants
Constraints (5) and (6) indicate respectively that: the electric power generated by the set of already installed hydro plants has to be null or positive and lower than a maximum value dependent on both the installed power and the available hydro potential in each typical day (5) and the daily electricity production has to be lower than a maximum possible value which characterizes each typical day (6), as also proposed in Reference [17].
3.4.4. Energy Storage System
The number of installed battery storage units NES has to be null or positive and lower than a maximum value (7), dependent on available space and economic availability, while the installed capacity is proportional to NES as shown in (8).
Constraints from (9) to (14) set limits for charging and discharging powers. In particular, constraints (10) and (13) fix upper bounds as a function of the number of installed storage units, while (11) and (14) correlate charging and discharging powers with binary variables, these last used to guarantee that charging and discharging cannot be simultaneous (15).
At each time instant of every typical day the energy content of the whole storage system, made of all the installed battery storage units, must be higher than a minimum value and lower than the total installed capacity (16). Constraints from (17) to (19) represent energy balance equations. In particular, (17) are used to correlate consecutive time instants belonging to the same typical day, (18) calculate the energy content at the first time instant of the d day as a function of the power charged or discharged at the last time instant of the previous day, whereas (19) correlates the first time instant of the optimized horizon to the last one.
3.4.5. Power Network
Constraints (20) and (21) define the feasible ranges for powers and .
3.4.6. Global Energy Balance
Constraints (22) report the energy balance of the whole system. In (22) the terms on the left side can be considered as loads, whereas the terms on the right refer to generation sources. It is important to highlight that the electricity production of new PV plants is calculated as a function of solar irradiance () through appropriate efficiency values (); on the other hand, the production of already installed PV plants () is directly assigned.
4. Results
The optimization model described in Section 3 has been applied to the territory of the Bormida Valley with the aim of evaluating economic and environmental benefits brought by the installation of new PV plants, wind turbines and battery storage units.
4.1. Input Data Analysis
To estimate the electricity production of PV plants already installed (), the PVGIS tool [42] has been used. The area covered by the present PV plants have been estimated knowing the total installed power and assuming a reference panel (= 0.25 kW, = 1.35 m2). As far as the global efficiency is concerned, direct measurements collected at the microgrid of the Savona Campus [3] have been used as reference data to define efficiency values for the new PV installations.
The electricity production of wind turbines has been determined taking into account different elements, such as the types of installed turbines (each one characterized by the power curve [25] provided by the manufacturer) and the wind speed profiles (for every typical day). To estimate the aforesaid profiles, wind data provided by the Liguria Region weather and climate database have been used [41]. Real operating data provided by the hydro power plant owners [38] have been elaborated to determine and quantities.
Energy intensive storage units based on sodium-sulphur (NaS) batteries have been chosen for the possible installation in the Bormida Valley [19,20,22,43]. In particular, the type of NaS battery storage described in Reference [19] and currently installed in the high voltage network in the South of Italy is considered suitable for the present case study. Each battery storage unit is composed of 40 modules (2 strings, each one having 20 modules connected in series) and works at high temperature (between 290 °C and 350 °C). Every module, composed of 224 cells (4 series × (14 parallel × 4 series)), can provide 30 kW maximum. Therefore the storage unit is characterized by the following rated data: rated capacity () equal to 8 MWh, rated power of 1.2 MW (value assumed for both and ), DC voltage equal to about 664 V. The average charging efficiency is assumed equal to 0.905 whereas a value of 0.918 is considered for the average discharging efficiency ; it follows a round trip efficiency (also taking into account auxiliary losses) equal to 0.83 as reported in Reference [19].
As regards economic parameters related to the technologies, 1600 €/kW is the value assumed for whereas a sensitivity analysis has been done varying from 350 €/kWh to a null value (in case of storage system financed by third parties). Electricity purchasing price is assumed equal to 0.222 €/kWh from 8 a.m. to 8 p.m. and to 0.190 €/kWh in the remaining hours, whereas 0.05 €/kWh is the constant average value for the electricity selling price; finally, the discount rate (r) is supposed equal to 0.06.
The time horizon of one year is subdivided into 12 (D) typical days and the single day is divided into 24 (T) time intervals. The load profiles () of the Bormida Valley are not available, so they have been estimated as a function of the national load profiles provided by Terna [33]. In particular, Terna makes available the Italian demand curve (here indicated as ) referred to the third Wednesday of each month. Firstly, the load profiles of Liguria region () have been evaluated as:
where and indicate respectively the gross electricity annual consumptions of the Liguria region (6138 GWh, see Table 1) and Italy (303,443 GWh, see Table 1), while is a correction factor introduced to guarantee that . Then, the load profiles of the Bormida Valley have been estimated as a function of the load profiles of the province of Savona ():
where and indicate respectively the population of the Bormida Valley (42,681, see Table 2) and the province of Savona (276,064, see Table 2), is the gross electricity annual consumption of the province of Savona (1343.7 GWh, see Table 2) while is a correction factor introduced to guarantee that .
4.2. Definition of the Examined Scenarios
Several scenarios have been investigated to analyze a further exploitation of solar and wind resources to produce electricity in the Bormida Valley. Moreover, the affordability of installing energy intensive NaS storage units has also been evaluated. The list of the analyzed scenarios is reported in Table 4 and described more in detail in the following. It is important to say that the examined scenarios have been chosen taking into account both the current national trends of renewable sources exploitation and some projects in progress in the Bormida Valley.
- Scenario 1a
It represents the AS-IS situation characterized by the values of PV, wind and hydro installed power reported in Table 3. No storage systems are installed and the daily operation of hydro power plants is scheduled individually, that is as reported by plant owners. Hence, constraints (5) and (6) are disabled when running the optimization model.
- Scenario 1b
It has the same features of the scenario 1a but the daily operation of hydro power plants (switching on/off and power generation profile) is determined by the optimization model. Indeed, in this scenario as well as in all the following ones, constraints (5) and (6) are enabled.
- Scenarios 2a, 2b, 2c, 2d
These scenarios consider the possibility of increasing by a maximum of 50% the PV installed capacity. In the scenarios 2a and 2c the wind installed capacity is the current one (32.3 MW, see Table 3) whereas in the scenario 2b and 2d additional wind turbines (related to new ongoing authorized projects) are considered too, leading the installed capacity to 82.3 MW (+155%). In scenarios 2a and 2b the capital cost of storage systems is assumed equal to 350 €/kWh [44], whereas the scenarios 2c and 2d are characterized by a lower capital cost, in particular the one for which at least one storage battery unit is installed (respectively equal to 66 €/kWh and 106 €/kWh).
- Scenarios 3a, 3b, 3c, 3d
In these scenarios the PV installed capacity can reach a maximum value of about 19.3 MW (+100%) while, as far as wind capacity is concerned, the same two conditions (+0% and +155%) adopted for the scenarios 2a, 2b, 2c and 2d remain valid. The capital cost of storage is 66.5 €/kWh in the scenario 3c and 104 €/kWh in the scenario 3d.
- Scenarios 4a, 4b, 4c, 4d
A maximum increase of 150% is assumed for the PV capacity in these four scenarios, corresponding to a maximum value of 24.1 MW installed. The capital cost of storage is 70 €/kWh in the scenario 4c and 115 €/kWh in the scenario 4d. New wind turbines can only be installed in the scenarios 4b and 4d.
- Scenarios 5a, 5b, 5c, 5d
These scenarios permit to potentially triple the PV installed capacity (from current 9.6 MW to about 28.9 MW). The capital cost of storage is equal to 84 €/kWh and 111 €/kWh respectively in the scenarios 5c and 5d. New wind turbines can only be installed in the scenarios 5b and 5d.
- Scenario 6
This scenario differs from the scenario 5d since it considers a null capital cost for storage. This case is studied to evaluate the optimal number of battery storage units to be installed taking into account only technical aspects.
In all the scenarios the maximum number of installable battery storage units is assumed equal to 30.
4.3. Optimal Results for the Examined Scenarios
The mathematical model described in Section 3 has been used to optimize the scenarios from 1b to 6, taking 1a as the reference scenario which represents the current situation in the Bormida Valley. The main results of the study are here reported considering the objective function with equal to 1.
In Table 5 the optimal design results are reported. In particular, Table 5 shows: the capital cost (Capex) incurred to purchase and install new PV and wind plants and storage systems, the rated power of new PV and wind plants and the total size of installed storage systems. Capex is calculated as:
where and indicate respectively the optimal values of the decision variables and , while is the estimated investment cost of new wind power plants (those which are in the process of being installed) assumed equal to 50 M€ and to be considered only for scenarios 2b, 2d, 3b, 3d, 4b, 4d, 5b, 5d and 6.
In all the scenarios, except for 5b, 5d and 6, the possible maximum number of PV panels is installed. No battery storage unit is installed when the capital cost is assumed equal to 350 €/kWh, whereas only 1 storage unit is installed when lower capital cost values (see 4.2) are considered. In the scenario 6, which is the one characterized by null capital cost of batteries, the possible maximum number of storage units is installed.
In Table 6 the main optimal operational results are shown trough the calculation of the following key performance indicators.
- Opex: this term indicates the annual operating expense of the examined energy system. Since maintenance costs of power plants are not considered in the present analysis, Opex is given by the difference between the costs associated with the electricity imported from neighboring areas or bought from local fossil fuel power stations and the revenues derived from the electricity exported outside the Bormida Valley:where and indicate optimal values of decision variables and .
- : annual electricity production of PV plants. This indicator computes the production of both already installed and new plants by applying the following formula:
- : annual amount of electricity imported from neighboring areas or produced by local fossil fuel power stations, given by:
- : annual amount of electricity exported outside the Bormida Valley, given by:
- : annual amount of electricity charged to the battery storage units:indicating the optimal values of decision variables .
- : annual amount of electricity discharged from the battery storage units:being the optimal values of decision variables .
- : ratio between the annual “green electricity” locally produced and the annual electricity demand. This indicator permits to evaluate if the valley is mainly a green energy exporter or an energy consumer. It can be calculated as:where is the annual electricity production of hydro power plants:which depends on the optimal values of decision variables , while is the annual electricity production of wind power plants. On the other hand, denotes the annual electricity demand. It is important to say that and are input data of the optimization model but they are written in Table 6, together with the optimal results, in order to provide a detailed view of the global energy balance of the Bormida Valley.
- : this term indicates the annual carbon dioxide emissions, due to the electricity imported from neighboring areas or produced by local fossil fuel power stations, calculated as:
Moreover, in Table 6 the percentage values of reduction or increase of Opex, , and with respect to the AS-IS scenario (1a) are reported for all the optimized scenarios.
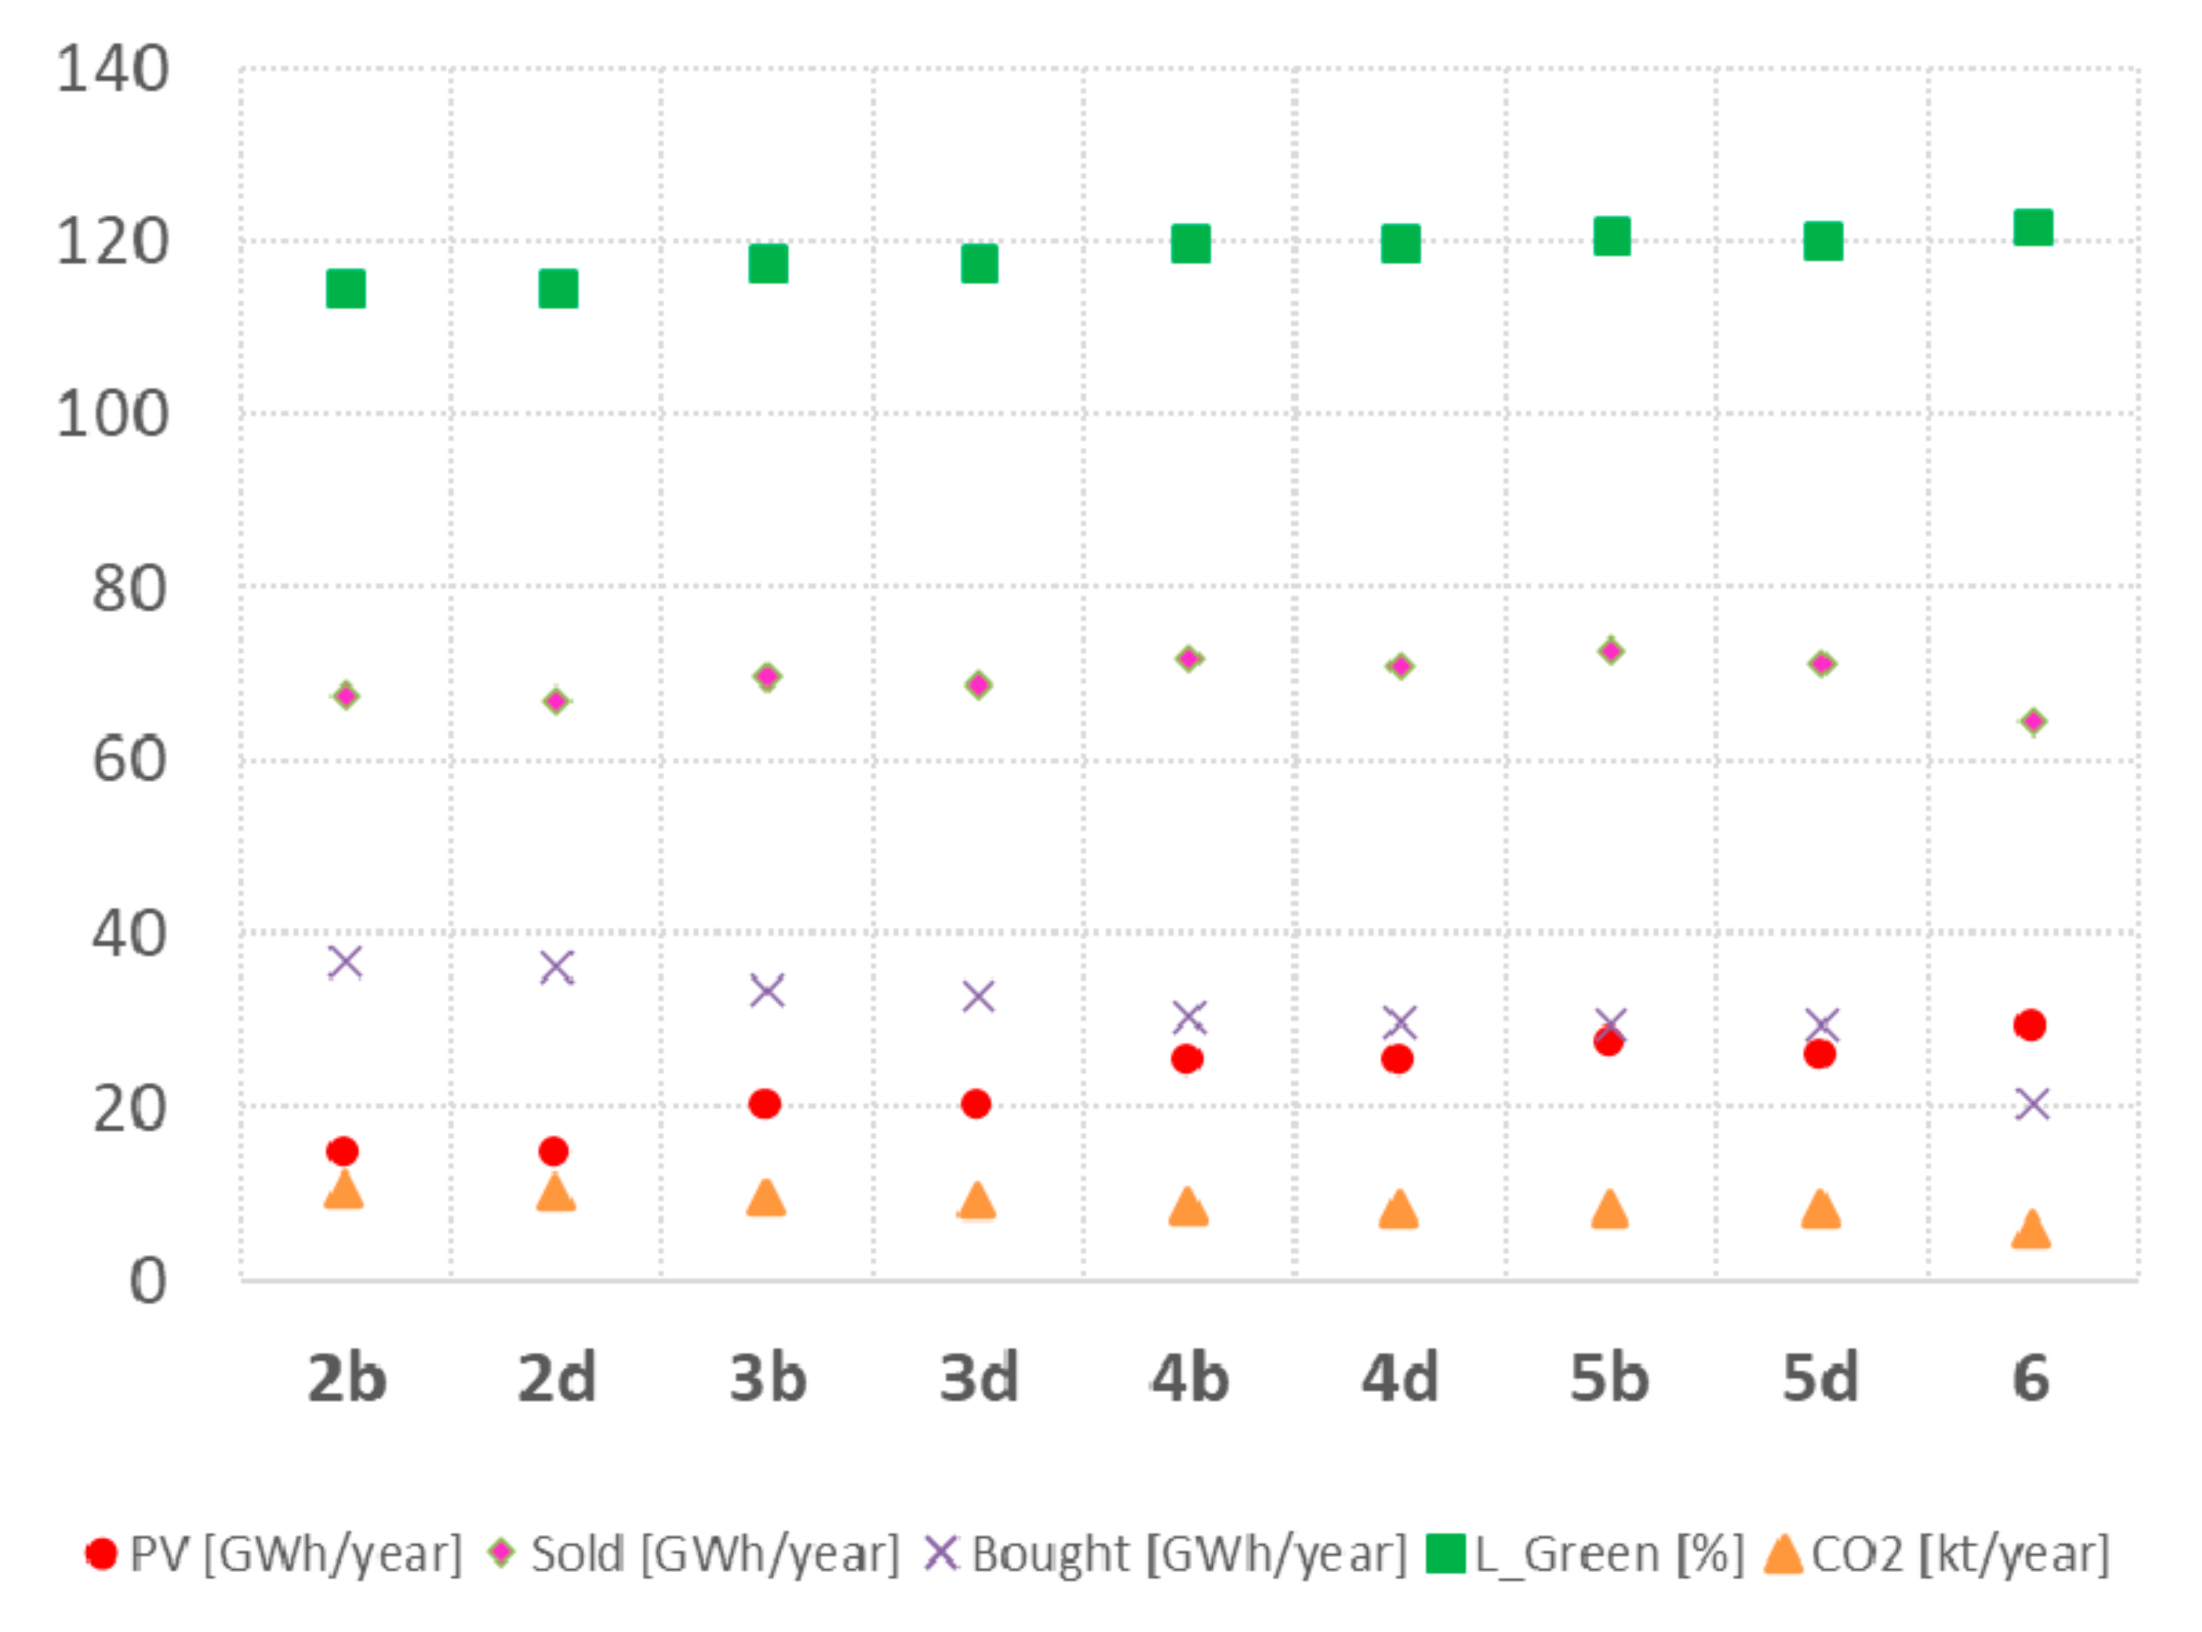
The scenario 1b which consists in the optimal operation of the current situation (scenario 1a) determines a 0.6–0.7% reduction of operating costs, imported energy and emissions. The exported electricity diminishes of about 39%. This proves that an optimized operation of hydro power plants leads to a better management of energy flows.
In the scenarios where no new wind power plants are installed (2a, 2c, 3a, 3c, 4a, 4c, 5a, 5c) the percentage reduction of operating costs passes from 6.2% (2a) to 23.1% (5c). Higher values occur in the scenarios characterized by the installation of new wind turbines: from 79.2% of the scenario 2b to 96.4% of the scenario 6. A similar trend is registered for the decrease of imported (or bought from fossil fuel power stations) electricity and emissions, since both of them refer to power flows coming from adjacent areas and so are strictly correlated to operating costs. Very high percentage increase values can be highlighted for the exported electricity in the scenarios having additional wind power plants.
The presence of one battery storage unit (in scenarios 2c, 2d, 3c, 3d, 4c, 4d, 5c, 5d) permits to better manage the local electricity production with respect to the scenarios without storage (2a, 2b, 3a, 3b, 4a, 4b, 5a, 5b) and, consequently, to diminish the reduction and the increase of imported and exported electricity respectively. The effect of the storage system on the key performance indicators is stronger in the scenario 6 which has a considerable higher number of installed battery storage units.
As far as is concerned, obviously, the scenarios with additional wind power plants are those characterized by higher values of this indicator. In particular, the scenario 6 is the greenest one, having a local electricity production from renewable sources equal to about 122% of the annual electricity demand.
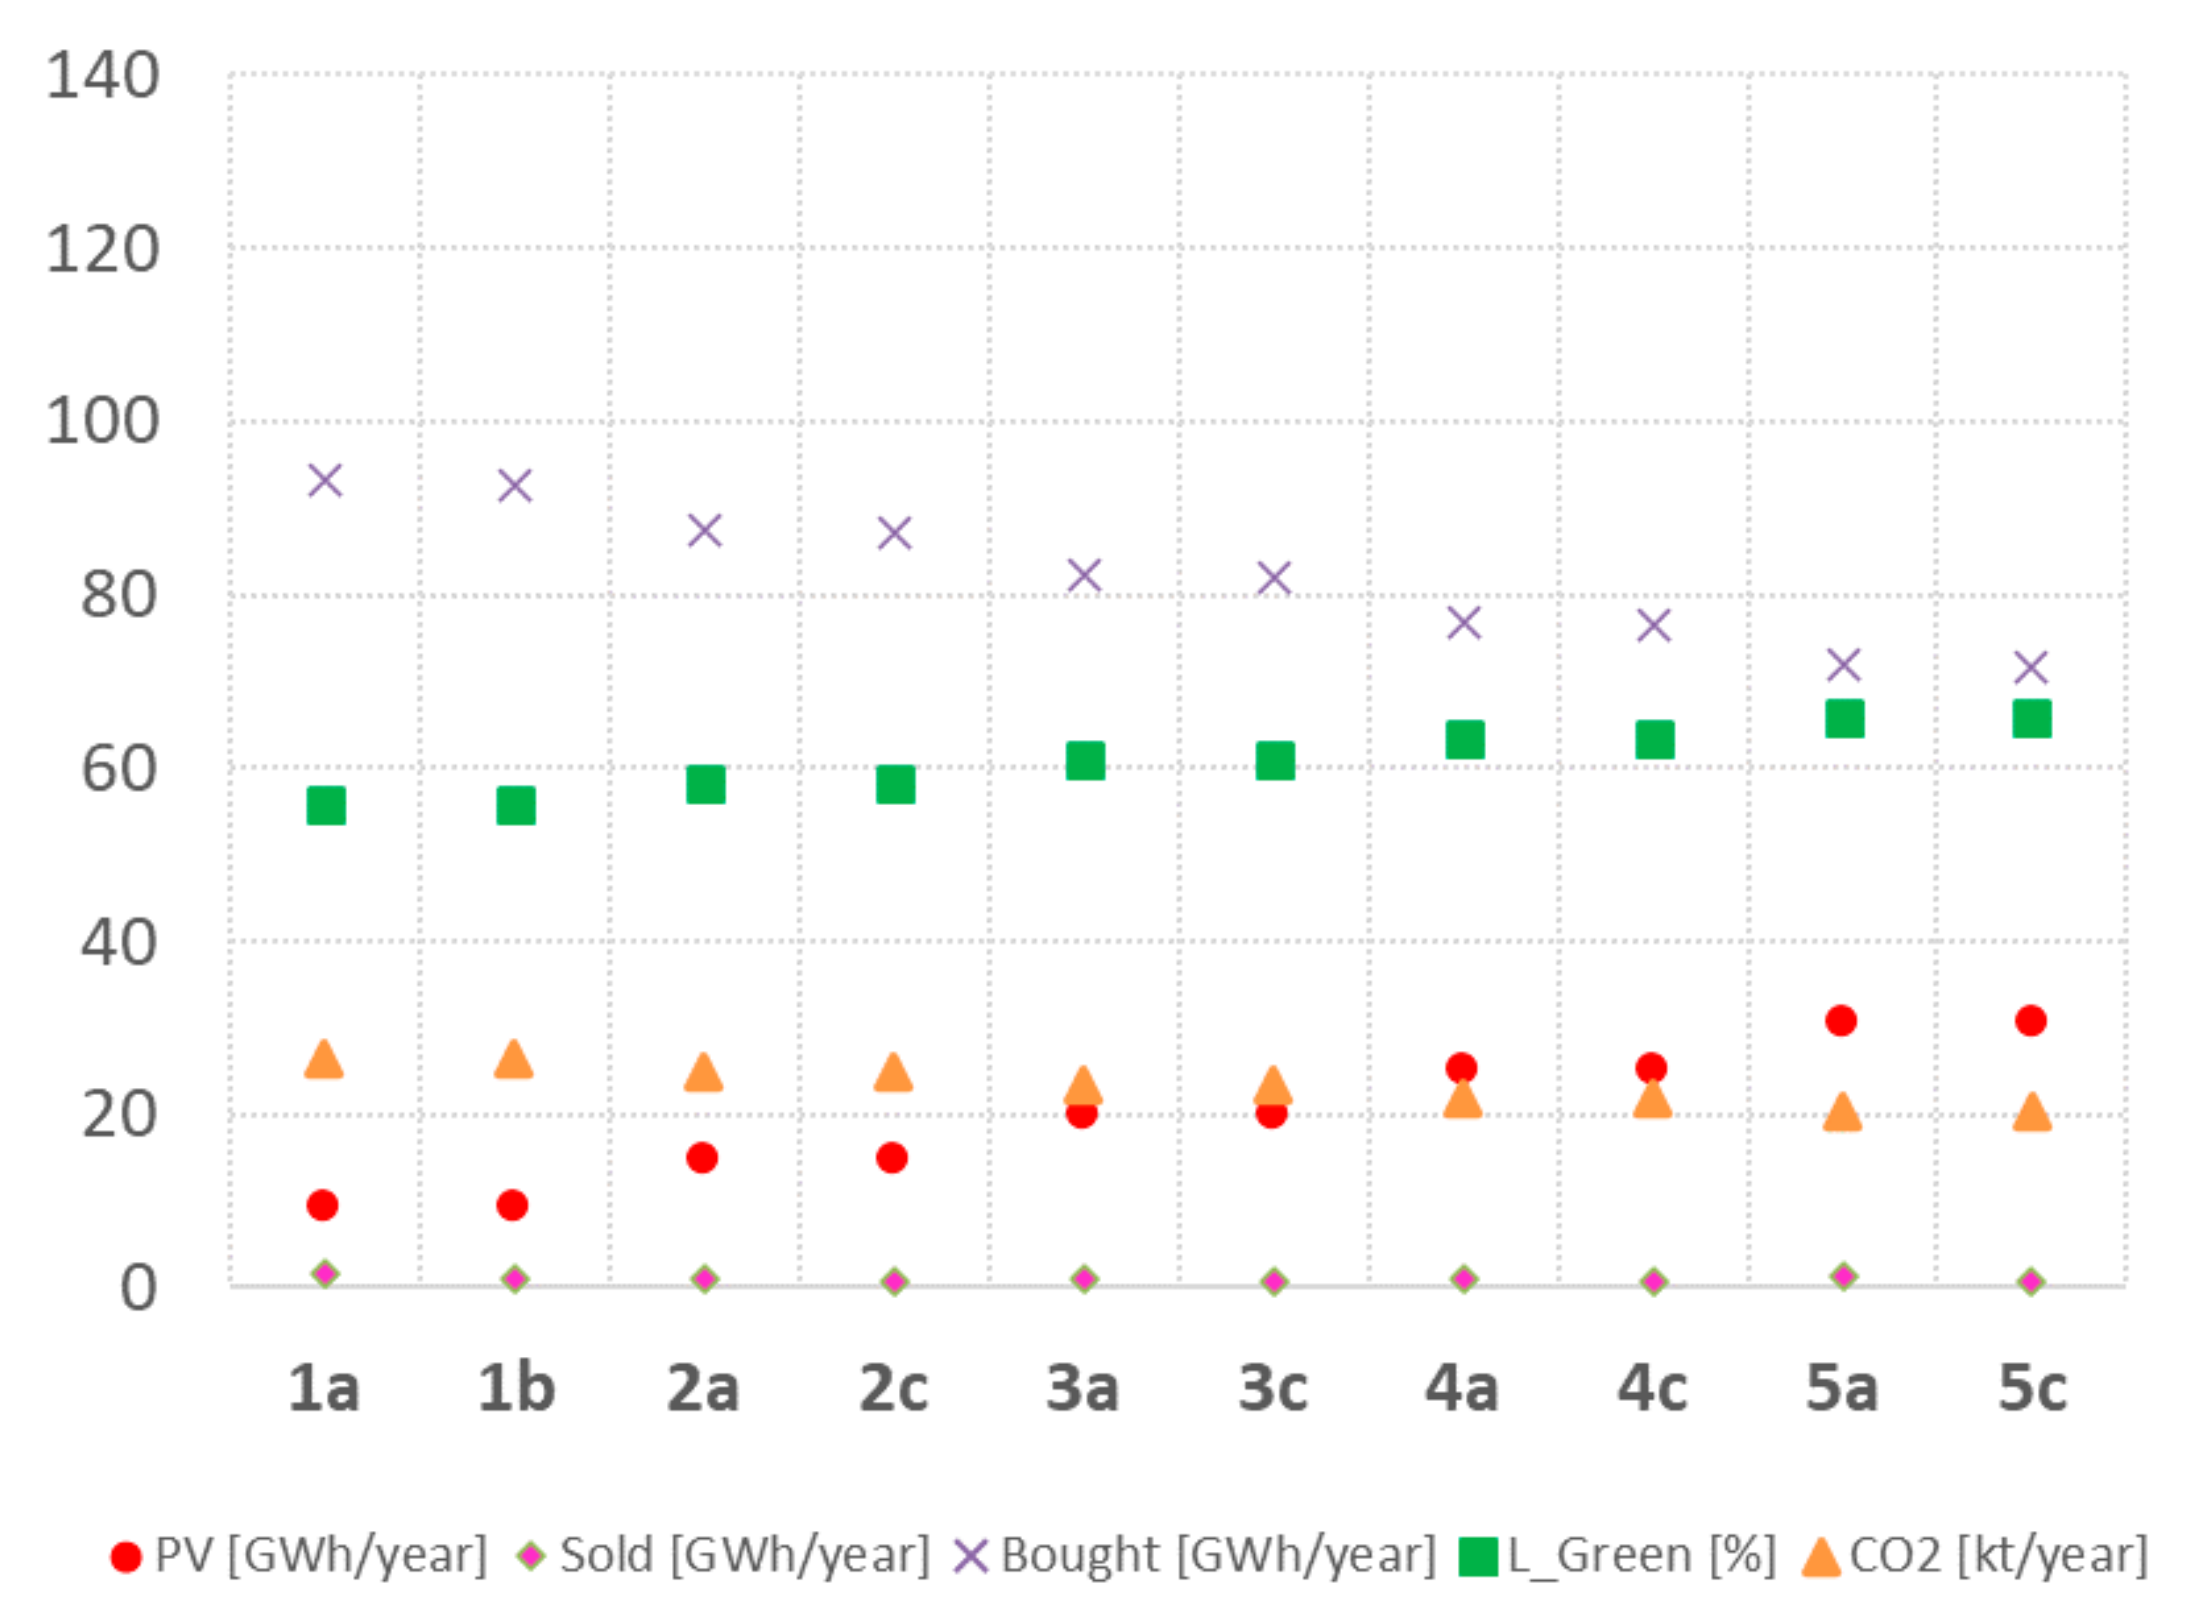
The values of the key performance indicators reported in Table 6 are better highlighted in Figure 4 and in Figure 5. In particular, Figure 4 refers to the scenarios 1a, 1b, 2a, 2c, 3a, 3c, 4a, 4c, 5a, 5c which consider the actual installed wind capacity whereas Figure 5 is relative to the scenarios 2b, 2d, 3b, 3d, 4b, 4d, 5b, 5d, 6 where an increase of 50 MW of the installed wind capacity is assumed. A greater exploitation of the wind resource permits to increase the amount of exported electricity and to reduce the use of electricity coming from other territories or locally produced by polluting fossil fuel power stations. As a consequence, in the scenarios reported in Figure 5, the electricity demand of the Bormida Valley can be satisfied mainly using renewable sources and carbon dioxide emissions can be considerably reduced.
Furthermore, considering both Capex and Opex, it is possible to calculate the payback period (PBPj) which characterizes the jth scenario as:
where the annual saving of the jth scenario is given by the difference between the Opex of the reference scenario (1a) and its Opex. The scenarios with no new wind power plants installed (2a, 2c, 3a, 3c, 4a, 4c, 5a, 5c) have payback periods ranging from 8.9 to 10 years, whereas the other scenarios present lower values (from 4.6 to 5.6 years). The scenario 6 has a payback period equal to 5.3 years.
Finally, considering both economic and environmental aspects, the scenarios 3b and 4b seem to be the ones more feasible among the scenarios characterized by a current capital cost of storage batteries. The scenario 5b is also feasible but maybe the value assumed for the increase percentage of installed PV power could be too optimistic.
Further analyses have been done by varying the weight , from 0 to 1, for all the scenarios. The optimal results remain the same reported in Table 5 and in Table 6 except for values of near to 0. Referring to the scenario 6, when is equal to 0 (objective function given by the annual cost of carbon dioxide emissions) the installed power in new PV plants is equal to 19.29 MW (+200%), the storage system is composed of 30 units (240 MWh) and the annual carbon dioxide emissions are 5.6 t (−78.9%).
4.4. Optimal Scheduling of Hydro Power Plants and Storage Systems
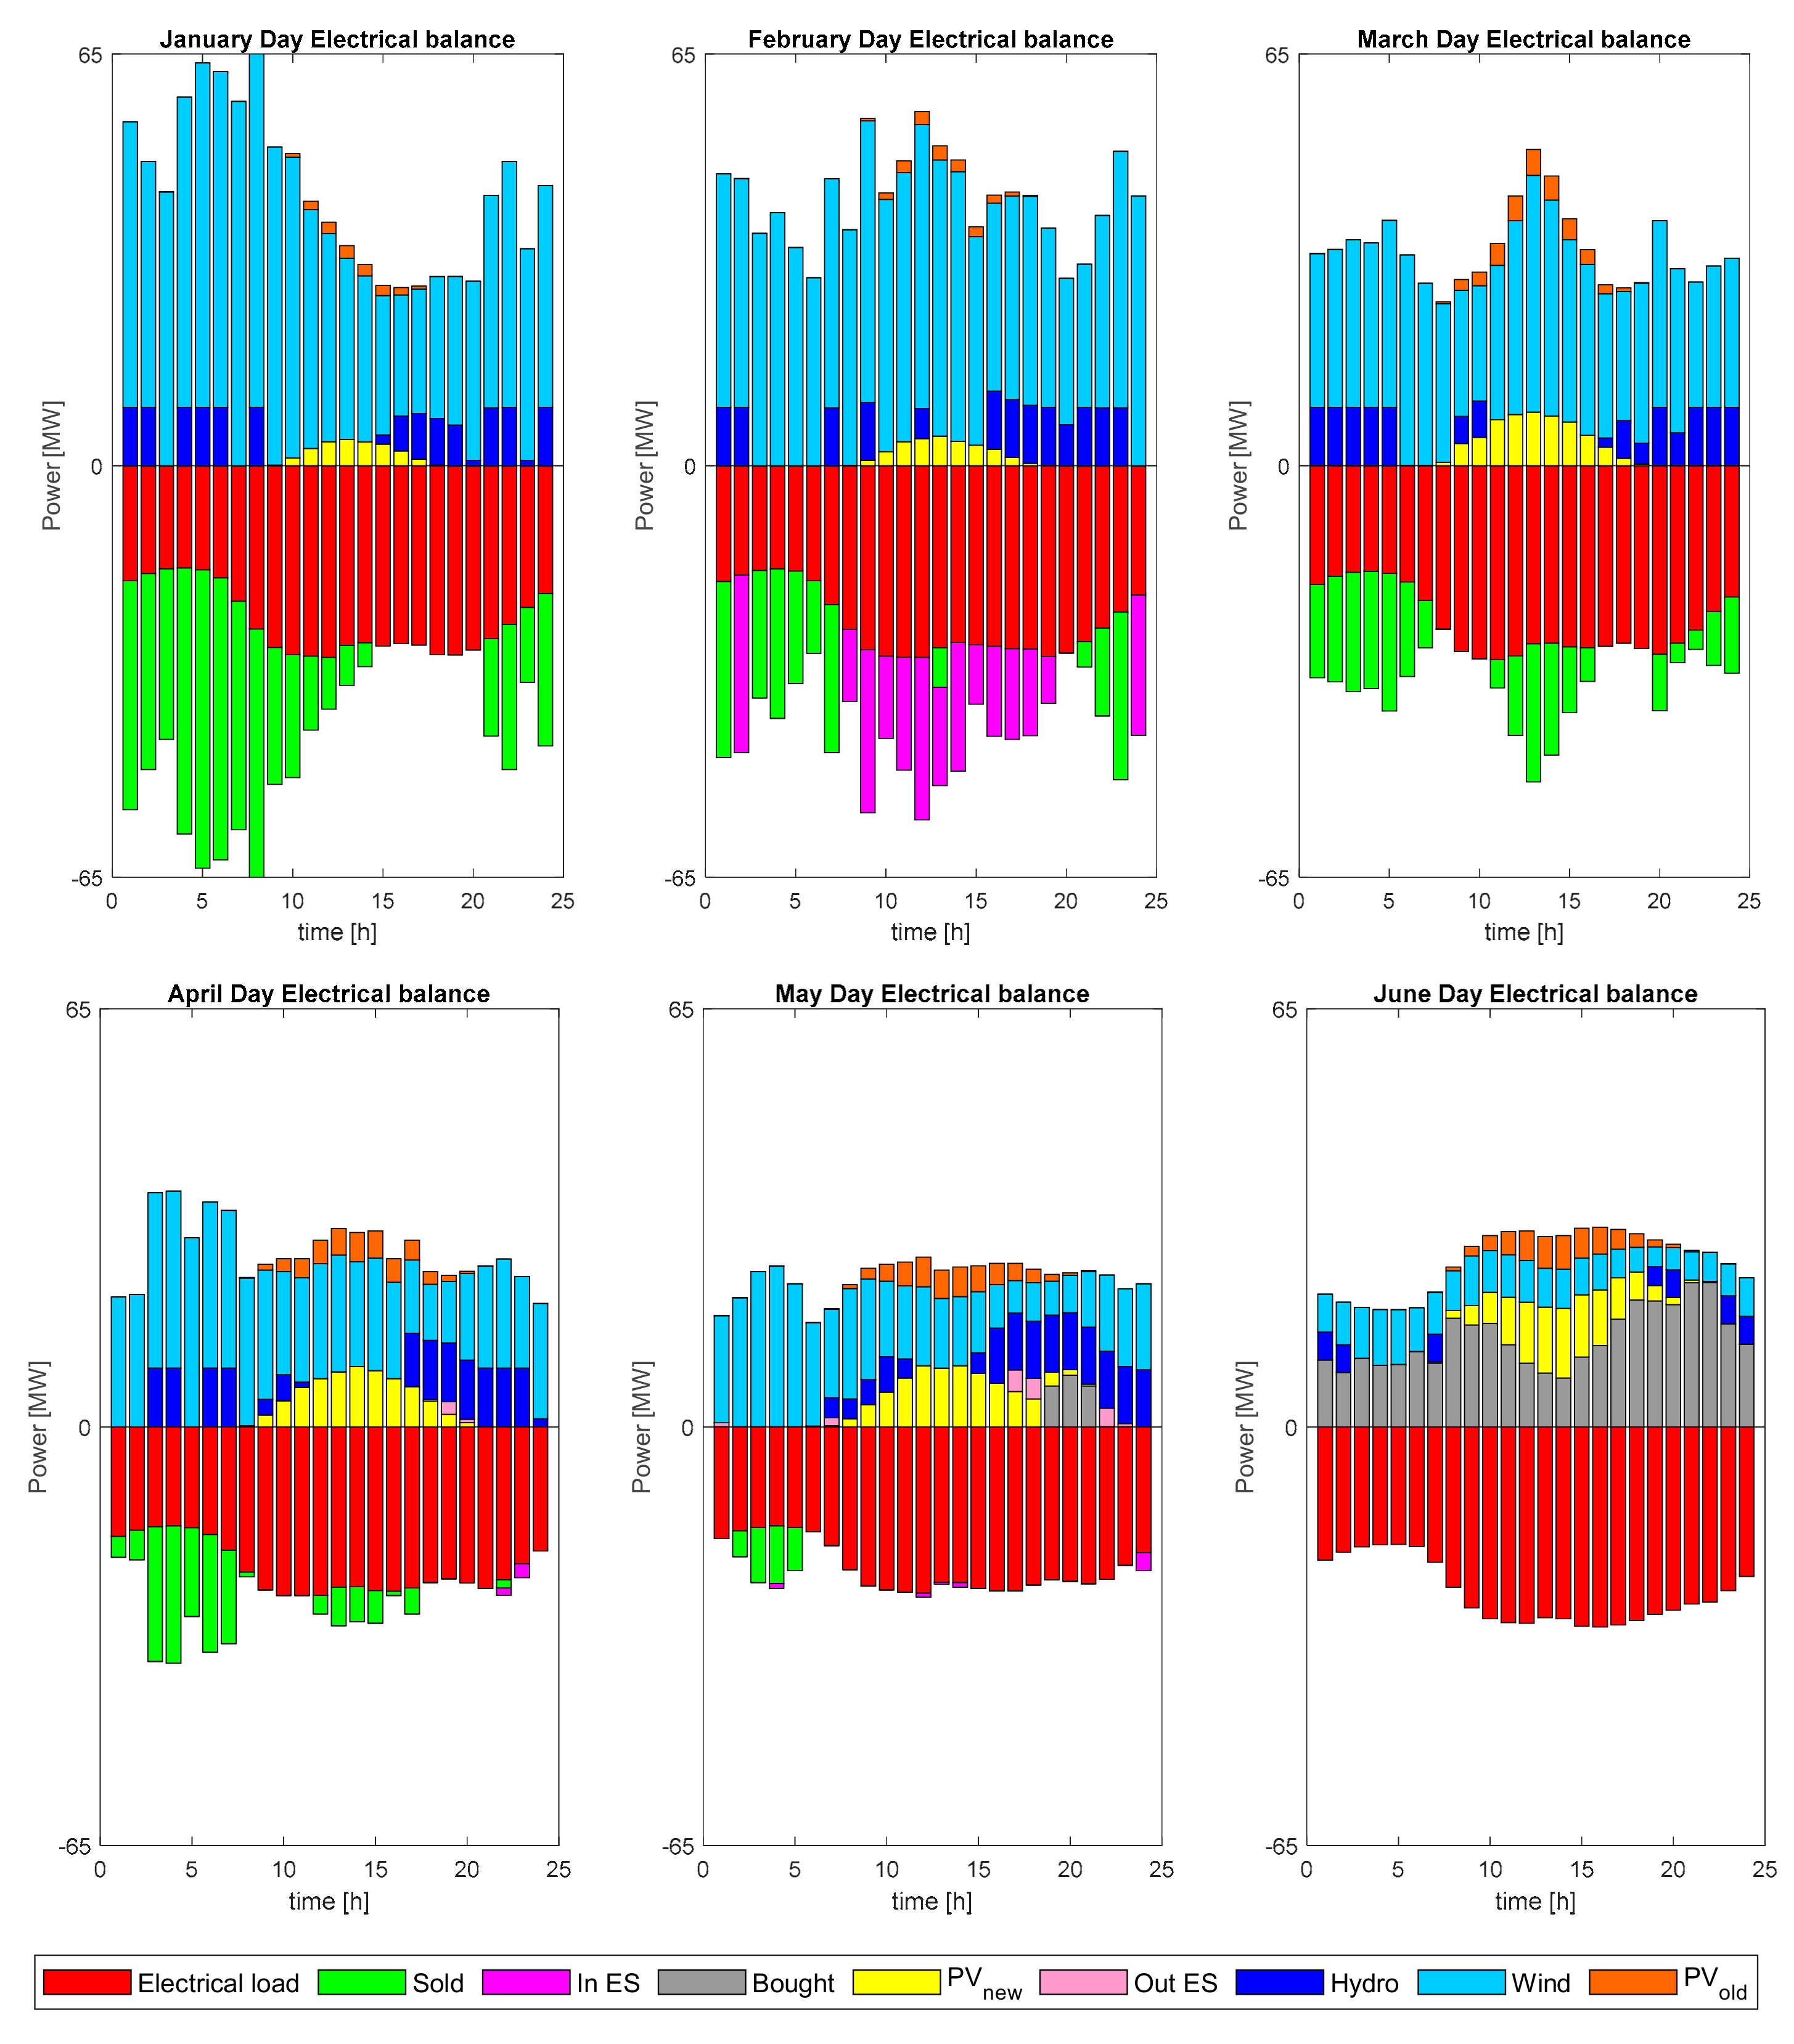
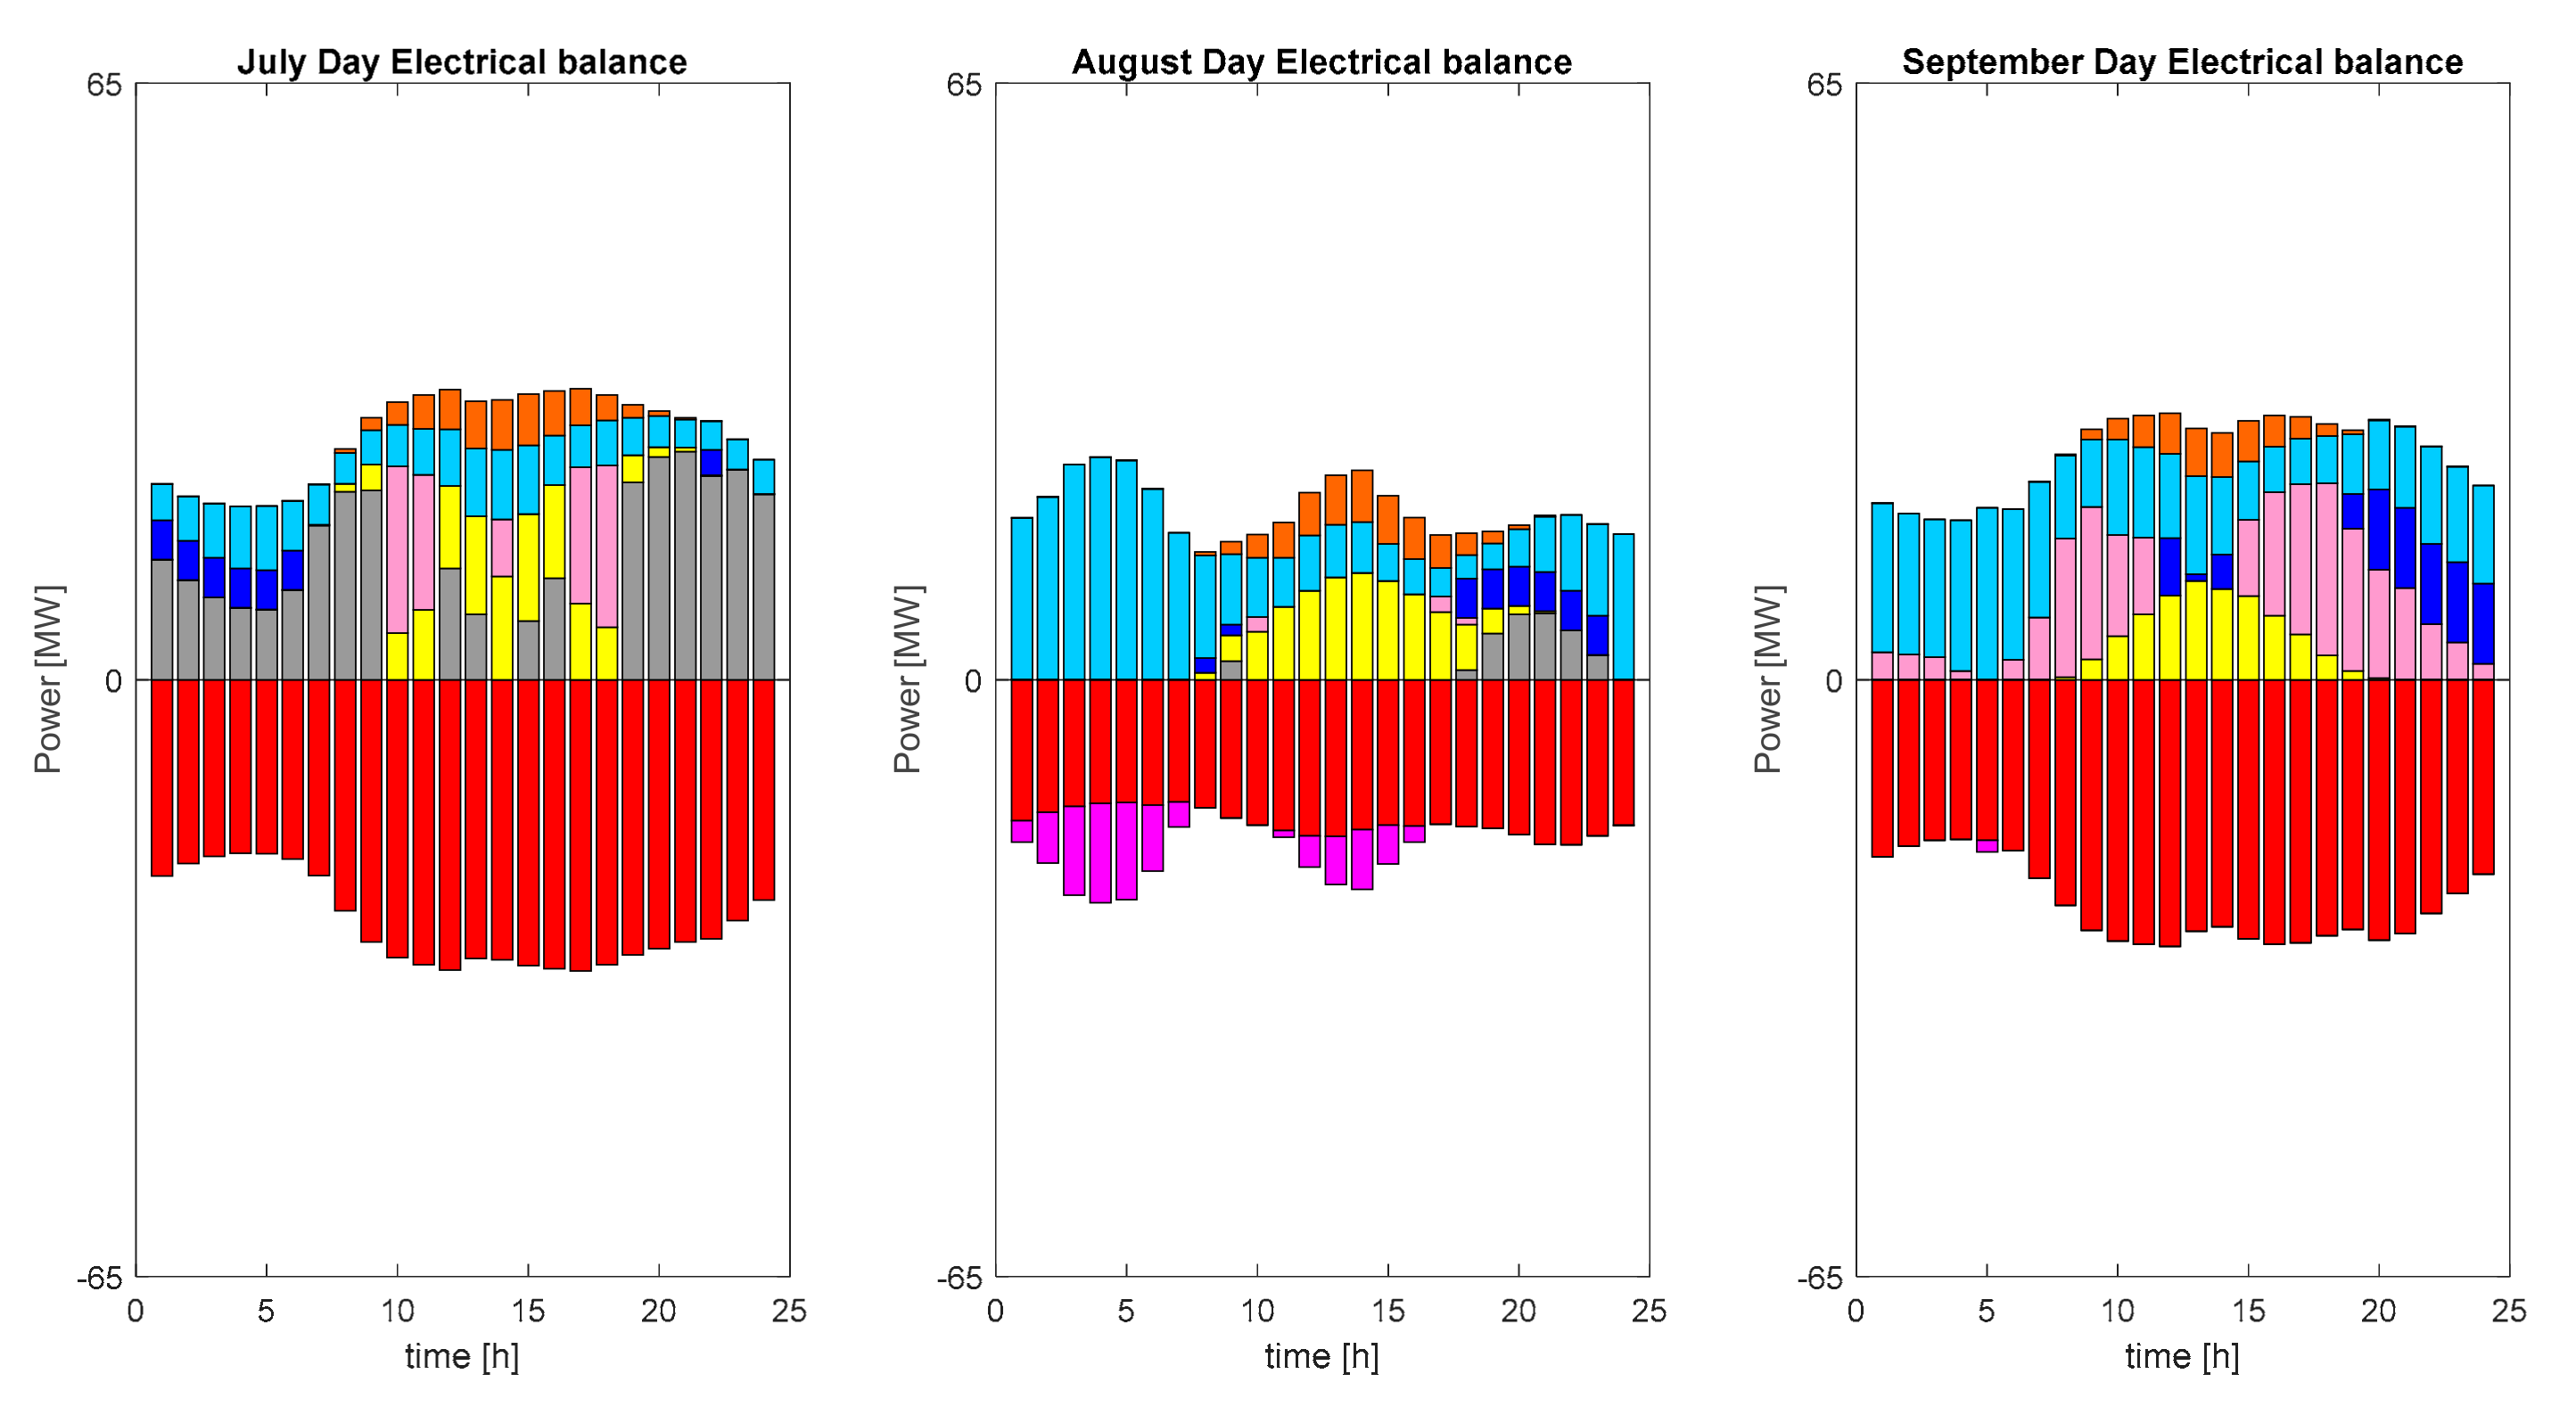
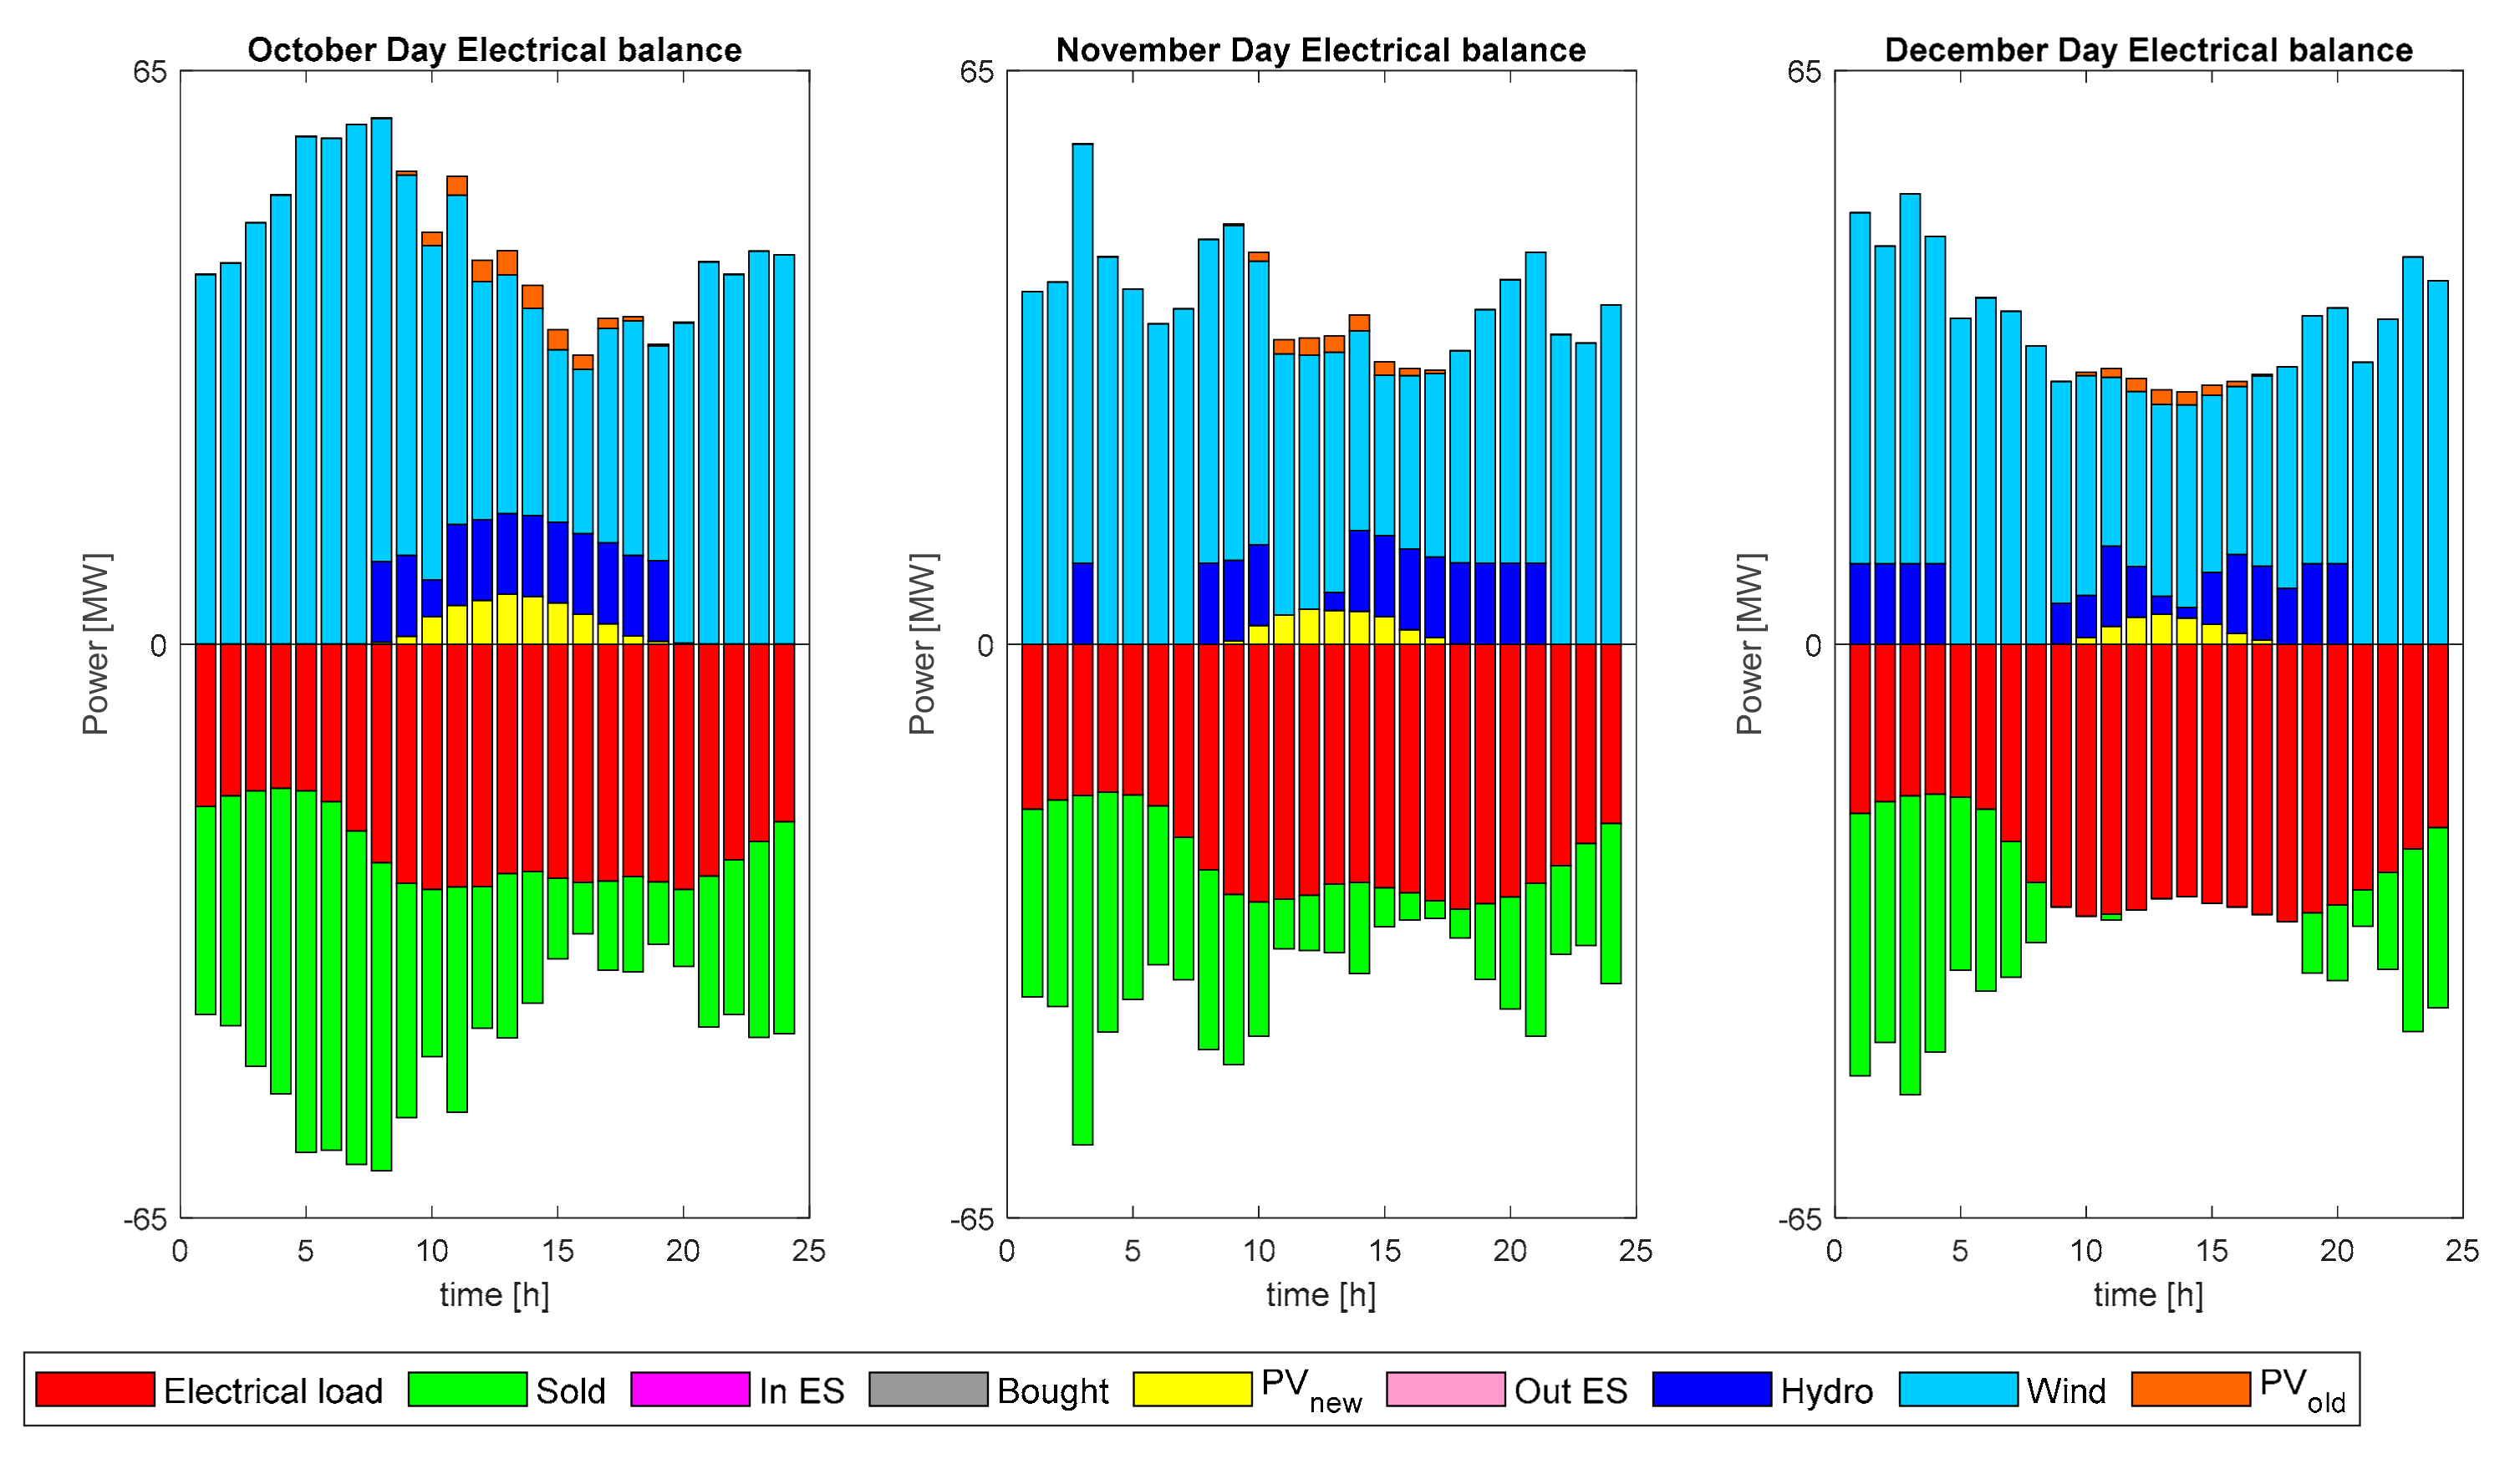
The optimal daily operation of the hydro power plants and the battery storage units is here described referring to the scenario 6. In Figure 6 the daily generation and load profiles of the typical days from January to June are reported, whereas in Figure 7 there are the profiles related to the months from July to December. The electricity production of wind power plants attains the highest values in the fall and winter seasons (October and January) while the PV production (due to both new and already installed plants, these last called “old” in Figure 6 and in Figure 7) reaches maximum values in summer (July and August). The peaks of wind production mainly occur during the night (from midnight to the early morning) whereas the PV peaks are registered during the central hours of the day (between 1 p.m. and 3 p.m.). The demand curve, shown in Figure 6 and in Figure 7 with negative values as well as other consumption terms (exported electricity and electricity charged to the storage system), mainly presents two peaks around 10 a.m. and 7 p.m. while lower values during the night.
The production of hydro power plants is optimally scheduled in order to cover the peaks of the demand and to reduce the amount of bought electricity (imported from outside the Bormida Valley or locally produced by fossil fuel power stations) which is higher in the months from May to August when the production of wind power plants is lower; on the other hand, great amounts of exported electricity characterize the fall and winter months. The battery storage units are mainly charged when the wind production overcomes the load or when the load is lower and discharged when the load is higher than the production from renewables. But it is important to precise some aspects in order to correctly interpret the results shown in Figure 6 and Figure 7. As aforesaid, the optimization model considers a time horizon of one year subdivided into twelve typical days (one for every month), each one being a sort of “average day” representing all the days of the corresponding month. As a consequence of this assumption, the optimal daily scheduling of hydro power plants and storage systems reported in the graphs only provides some general indications about the management of the aforesaid technologies, the aim of the present study being centered on the optimal design of the system more than on the daily optimal operation of plants. Nevertheless the optimization model could be also used as an Energy Management System to determine the optimal scheduling of technologies over a one-day time horizon.
5. Conclusions
This paper has proposed a methodology to optimally design and manage a sustainable energy system, composed of renewable energy power plants and storage batteries, used to provide electricity to a defined territory such as a region or a valley. The methodology is based on a mixed-integer linear programming model used to determine the set of energy technologies to be installed in the examined territory with the aim of minimizing an objective function related to global costs and carbon dioxide emissions. The optimal solution of the problem also provides indications about the daily scheduling of power plants and storage systems.
The developed optimization model has been applied to the Bormida Valley, located in the Liguria region in the North of Italy, which is a territory characterized by a significant presence of renewable power plants (PV, wind and hydro). Firstly, a detailed analysis of the energy data related to the Liguria region and, more specifically, to the Bormida Valley has been developed to provide precise and reliable input data to the optimization model. Secondly, the optimization model has been used to determine the optimal size of new renewable power plants and storage batteries and their optimal daily operation. Several scenarios characterized by different input data (maximum number of installable technologies and capital cost) have been studied and compared through the definition of economic and environmental key performance indicators. In particular, the possibility of increasing the PV and wind installed capacity has been investigated through the evaluation of technical and economic annual indicators such as the electricity produced by renewable sources, the carbon dioxide emissions, the imported and exported electricity, as well as the energy exchanged with storage systems. The best practicable scenarios (3b and 4b) are characterized by investment payback periods of about 5 years and permit to reduce annual operating costs and carbon dioxide emissions respectively of 85% and 65% with respect to the AS-IS situation. In these scenarios the annual electricity locally produced by renewable sources exceeds the electrical demand of the Bormida Valley and, consequently, green energy is exported to other areas. When storage system capital costs will be lower, battery storage units installed closed to the renewable power plants of the Bormida Valley could be used to mitigate the intermittency of PV and wind production with considerable economic and environmental benefits.
The proposed methodology has a general validity and can be adopted for the energy planning of a territory like a valley or a region. The paper has described in detail the different phases of the study, from the data collecting to the definition of the optimization model, providing guidelines to select and evaluate different scenarios. The study has also highlighted that the robustness of the results obtained with the optimization model strongly depends on the accuracy of input data; so, this work has also the goal of focusing the attention on the importance of collecting and frequently updating energy data at city, regional and national level. One of the next step of the present study could be that of including the modelling of the power network of the valley within the optimization tool in order to determine the optimal location of the new renewable power plants and the storage systems. Moreover, some technical and regulatory aspects related to demand response strategies and to the recent definition of the Local Energy Community concept will be introduced with the aim of evaluating benefits and drawbacks correlated with these new energy system architectures.
Funding
This research received no external funding.
Conflicts of Interest
The author declares no conflict of interest.
Nomenclature
| Symbol | Units | Description |
| , , | kWh | Storage capacity |
| kWh | Electricity annual consumption | |
| - | Capital recovery factor | |
| D | - | Days |
| kW | Electrical demand | |
| , , | kWh | Energy |
| t/year | Carbon dioxide emissions | |
| f | - | Correction factor |
| , , , , , , | kW | Power |
| €/kW (PV), €/kWh (ES) | Capital cost | |
| Inh | - | No. of inhabitants |
| K | €/year | Cost |
| kW | Electrical load | |
| No. of years | Lifespan | |
| , | - | Number |
| PBP | No. of years | Payback period |
| kW/m2 | Solar irradiation | |
| r | - | Discount rate |
| - | State of charge | |
| s | m2 | Surface |
| T | h | Time |
| - | Binary variable | |
| € | Cost | |
| , | €/kWh | Price |
| t/year | Carbon dioxide emissions | |
| €/t | Carbon dioxide emission cost | |
| h | Time interval | |
| t/kWh | Emission factor | |
| - | Efficiency | |
| - | Weight factor |
| Subscript | Description |
| ch | Charging |
| d | Day |
| dch | Discharging |
| t | Time |
| Superscript | Description |
| el | Electricity |
| ES | Electrical storage |
| H | Hydro |
| L | Load |
| Lig | Liguria |
| max | Maximum |
| min | Minimum |
| PV | Photovoltaic |
| SV | Savona province |
| W | Wind |
References
- Directorate-General for Energy, EU Commission. Clean Energy for All Europeans. March 2019. Available online: https://ec.europa.eu/energy/topics/energy-strategy/clean-energy-all-europeans_en (accessed on 15 May 2020).
- Auer, H.; Haas, R. On integrating large shares of variable renewables into the electricity system. Energy 2016, 115, 1592–1601. [Google Scholar]
- Bracco, S.; Delfino, F.; Laiolo, P.; Morini, A. Planning & open-air demonstrating smart city sustainable districts. Sustainability 2018, 10, 4636. [Google Scholar]
- Bracco, S.; Delfino, F.; Ferro, G.; Pagnini, L.; Robba, M.; Rossi, M. Energy planning of sustainable districts: Towards the exploitation of small size intermittent renewables in urban areas. Appl. Energy 2018, 228, 2288–2297. [Google Scholar] [CrossRef]
- Howlader, H.; Adewuyi, B.; Hong, Y.Y.; Mandal, P.; Hemeida, A.M.; Senjyu, T. Energy storage system analysis review for optimal unit commitment. Energies 2020, 13, 158. [Google Scholar] [CrossRef] [Green Version]
- Jorgenson, J.; Denholm, P.; Mai, T. Analyzing storage for wind integration in a transmission-constrained power system. Appl. Energy 2018, 228, 122–129. [Google Scholar] [CrossRef]
- Bird, L.; Lew, D.; Milligan, M.; Carlini, E.M.; Estanqueiro, A.; Flynn, D.; Gomez-Lazaro, E.; Holttinen, H.; Menemenlis, N.; Orths, A. Wind and solar energy curtailment: A review of international experience. Renew. Sustain. Energy Rev. 2016, 65, 577–586. [Google Scholar]
- Castillo, A.; Gayme, D.F. Grid-scale energy storage applications in renewable energy integration: A survey. Energy Convers. Manag. 2014, 87, 885–894. [Google Scholar]
- Harold Anuta, O.; Taylor, P.; Jones, D.; McEntee, T.; Wade, N. An international review of the implications of regulatory and electricity market structures on the emergence of grid scale electricity storage. Renew. Sustain. Energy Rev. 2014, 38, 489–508. [Google Scholar]
- Maximov, S.A.; Harrison, G.P.; Friedrich, D. Long term impact of grid level energy storage on renewable energy penetration and emissions in the Chilean electric system. Energies 2019, 12, 1070. [Google Scholar]
- Geth, F.; Brijs, T.; Kathan, J.; Driesen, J.; Belmans, R. An overview of large-scale stationary electricity storage plants in Europe: Current status and new developments. Renew. Sustain. Energy Rev. 2015, 52, 1212–1227. [Google Scholar] [CrossRef] [Green Version]
- Günther, S.; Bensmann, A.; Hanke-Rauschenbach, R. Theoretical dimensioning and sizing limits of hybrid energy storage systems. Appl. Energy 2018, 210, 127–137. [Google Scholar] [CrossRef]
- Tafarte, P.; Kanngießer, A.; Dotzauer, M.; Meyer, B.; Grevé, A.; Millinger, M. Interaction of electrical energy storage, flexible bioenergy plants and system-friendly renewables in wind- or solar PV-dominated regions. Energies 2020, 13, 1133. [Google Scholar] [CrossRef] [Green Version]
- Martínez-Jaramillo, J.E.; Van Ackere, A.; Larsen, E.R. Towards a solar-hydro based generation: The case of Switzerland. Energy Policy 2020, 138, 111197. [Google Scholar] [CrossRef]
- Ramirez Camargo, L.; Nitsch, F.; Gruber, K.; Valdes, J.; Wuth, J.; Dorner, W. Potential analysis of hybrid renewable energy systems for self-sufficient residential use in Germany and the Czech Republic. Energies 2019, 12, 4185. [Google Scholar] [CrossRef] [Green Version]
- Lazzeroni, P.; Moretti, F.; Stirano, F. Economic potential of PV for Italian residential end-users. Energy 2020, 200, 117508. [Google Scholar] [CrossRef]
- Conlon, T.; Waite, M.; Modi, V. Assessing new transmission and energy storage in achieving increasing renewable generation targets in a regional grid. Appl. Energy 2019, 250, 1085–1098. [Google Scholar] [CrossRef]
- Waterson, M. The characteristics of electricity storage, renewables and markets. Energy Policy 2017, 104, 466–473. [Google Scholar] [CrossRef] [Green Version]
- Andriollo, M.; Benato, R.; Dambone, S.S.; Di Pietro, N.; Hirai, N.; Nakanishi, Y.; Senatore, E. Energy intensive electrochemical storage in Italy: 34.8 MW sodium-sulphur secondary cells. J. Energy Storage 2016, 5, 146–155. [Google Scholar] [CrossRef]
- Tewari, S.; Mohan, N. Value of NaS energy storage toward integrating wind: Results from the wind to battery project. IEEE Trans. Power Syst. 2013, 28, 532–541. [Google Scholar] [CrossRef]
- Naziri Moghaddam, I.; Chowdhuri, B.H.; Mohajeryami, S. Predictive operation and optimal sizing of battery energy storage with high wind energy penetration. IEEE Trans. Ind. Electron. 2018, 65, 6686–6695. [Google Scholar] [CrossRef]
- Rodrigues, E.M.G.; Osório, G.J.; Godina, R.; Bizuayehu, A.W.; Lujano-Rojas, J.M.; Matias, J.C.O.; Catalão, J.P.S. Modelling and sizing of NaS battery energy storage system for extending wind power performance in Crete island. Energy 2015, 90, 1606–1617. [Google Scholar] [CrossRef]
- Benato, R.; Cosciani, N.; Crugnola, G.; Dambone Sessa, S.; Lodi, G.; Parmeggiani, C.; Todeschini, M. Sodium nickel chloride battery technology for large-scale stationary storage in the high voltage network. J. Power Sources 2015, 293, 127–136. [Google Scholar] [CrossRef]
- Wogrin, S.; Gayme, D.F. Optimizing storage siting, sizing, and technology portfolios in transmission-constrained networks. IEEE Trans. Power Syst. 2015, 30, 3304–3313. [Google Scholar] [CrossRef]
- Eliseu, A.; Castro, R. Wind-hydro hybrid park operating strategies. Sustain. Energy Technol. Assess. 2019, 36, 100561. [Google Scholar] [CrossRef]
- Dujardin, J.; Kahl, A.; Kruyt, B.; Bartlett, S.; Lehning, M. Interplay between photovoltaic, wind energy and storage hydropower in a fully renewable Switzerland. Energy 2017, 135, 513–525. [Google Scholar] [CrossRef]
- Yang, Y.; Bremner, S.; Menictas, C.; Kay, M. Battery energy storage system size determination in renewable energy systems: A review. Renew. Sustain. Energy Rev. 2018, 91, 109–125. [Google Scholar] [CrossRef]
- Rossi, A.; Stabile, M.; Puglisi, C.; Falabretti, D.; Merlo, M. Evaluation of the energy storage systems impact on the Italian ancillary market. Sustain. Energy Grids Netw. 2019, 17, 100178. [Google Scholar] [CrossRef]
- Chowdhury, N.; Pilo, F.; Pisano, G. Optimal energy storage system positioning and sizing with robust optimization. Energies 2020, 13, 512. [Google Scholar] [CrossRef] [Green Version]
- Nazif Faqiry, M.; Edmonds, L.; Zhang, H.; Khodaei, A.; Wu, H. Transactive-market-based operation of distributed electrical energy storage with grid constraints. Energies 2017, 10, 1891. [Google Scholar] [CrossRef] [Green Version]
- Meneses de Quevedo, P.; Contreras, J. Optimal placement of energy storage and wind power under uncertainty. Energies 2016, 9, 528. [Google Scholar] [CrossRef] [Green Version]
- GSE (Italian Gestore Servizi Energetici) Website. Available online: https://www.gse.it/ (accessed on 12 May 2020).
- TERNA (Italian TSO, Transmission System Operator) Website. Available online: https://www.terna.it/it (accessed on 12 May 2020).
- ENEL SpA. Available online: https://corporate.enel.it/it/futur-e/impianti/la-spezia (accessed on 13 August 2020).
- Tirreno Power SpA. Available online: http://www.centralevadoligure.it/ (accessed on 13 August 2020).
- ENEL SpA. Available online: https://corporate.enel.it/it/futur-e/impianti/genova (accessed on 13 August 2020).
- ATLAIMPIANTI GSE (Italian Gestore Servizi Energetici) Website. Available online: https://atla.gse.it/atlaimpianti/project/Atlaimpianti_Internet.html (accessed on 12 May 2020).
- Tirreno Power Company Website. Available online: http://www.tirrenopower.com/ (accessed on 12 May 2020).
- Open Data Geoportal of the Province of Savona. Available online: http://geoportale.provincia.savona.it (accessed on 24 August 2020).
- Astiaso Garcia, D.; Canavero, G.; Ardenghi, F.; Zambon, M. Analysis of wind farm effects on the surrounding environment: Assessing population trends of breeding passerines. Renew. Energy 2015, 80, 190–196. [Google Scholar] [CrossRef]
- Liguria Region Weather and Climate Database. Available online: http://www.cartografiarl.regione.liguria.it/SiraQualMeteo/script/PubAccessoDatiMeteo.asp (accessed on 12 May 2020).
- Photovoltaic Geographical Information System (PVGIS). Available online: https://ec.europa.eu/jrc/en/pvgis (accessed on 28 August 2020).
- TERNA. Rapporto pubblico anno 2017 II anno di sperimentazione. In Sperimentazione di Progetti Pilota di Accumulo Energetico a Batterie Tipo Energy Intensive; Terna: Roma, Italy, 2018. [Google Scholar]
- IRENA. Electricity Storage and Renewables: Costs and Markets to 2030; International Renewable Energy Agency: Abu Dhabi, UAE, 2017. [Google Scholar]
Figure 1.
Map of the Liguria region.

Figure 2.
Map of the Bormida Valley.

Figure 3.
The architecture of the optimization model.

Figure 4.
Key performance indicators when no new wind turbines are installed.

Figure 5.
Key performance indicators when the installed wind capacity is increased of 50 MW.

Figure 6.
Optimal daily scheduling from January to June typical days.

Figure 7.
Optimal daily scheduling from July to December typical days.


Table 1.
Italy and Liguria region electricity data.
| Italy | Liguria Region | |||||||
|---|---|---|---|---|---|---|---|---|
| Inhabitants | 60,359,546 | 1,550,640 | ||||||
| [GW] | [GWh] (°) | [EOH] | [MW] | [%] (°°) | [GWh] | [%] (°°°) | [EOH] | |
| PV | 20.11 | 22,654 | 1126 | 107.60 | 0.54% | 106 | 0.47% | 982 |
| Wind | 10.26 | 17,716 | 1727 | 56.50 | 0.55% | 130 | 0.74% | 2308 |
| Hydro | 22.90 | 50,503 | 2205 | 92.10 | 0.40% | 267 | 0.53% | 2898 |
| Geothermal | 0.81 | 6105 | 7538 | - | - | - | - | - |
| Total Renewable (*) | 54.30 | 114,415 | 2107 | 280.90 | 0.52% | 568 | 0.50% | 2023 |
| Thermal power plants (**) | 63.80 | 175,294 | 2748 | 1469.90 | 2.30% | 5080 | 2.90% | 3456 |
| Total | 118.10 | 289,708 | 1750.80 | 1.48% | 5648 | 1.95% | ||
| Renewable [%] | 45.98% | 39.49% | 16.04% | 10.06% | ||||
| Demand (***) | 303,443 | 6138 | 2.02% | |||||
° Annual gross electricity production. °° Percentage calculated with respect to the power installed in Italy. °°° Percentage calculated with respect to the electricity produced in Italy. * PV, Wind, Hydro, Geothermal and thermal power plants fed by renewable sources (biomass, biofuels, etc.). ** Thermal power plants fed by renewable sources are not included here. *** Net electricity consumptions.
Table 2.
Electricity data for the Genoa metropolitan area and for the provinces of Imperia, La Spezia and Savona.
Table 2.
Electricity data for the Genoa metropolitan area and for the provinces of Imperia, La Spezia and Savona.
| Liguria Region | ||||||
|---|---|---|---|---|---|---|
| GE | IM | SP | SV | Bormida Valley | % (°) | |
| Inhabitants | 841,180 | 213,840 | 219,556 | 276,064 | 42,681 | 15.5% |
| Area [km2] | 1834 | 1155 | 881 | 1546 | 732 | 47.3% |
| Municipalities | 67 | 66 | 32 | 69 | 23 | 33.3% |
| Total Renewable [MW] (*) | 96.5 | 51.4 | 34.2 | 98.8 | 51.1 | 51.7% |
| Thermal power plants [MW] (**) | 64.7 | 0.4 | 600.2 | 804.6 | (°°) | (°°) |
| Renewable Power [%] | 59.9% | 99.2% | 5.4% | 10.9% | (°°) | (°°) |
| PV [GWh] | 24.2 | 28.8 | 22.2 | 30.6 | 9.6 | 31.3% |
| Wind [GWh] | 8.4 | 5.3 | 5.4 | 111.3 | 75.7 | 68.0% |
| Hydro [GWh] | 126.0 | 96.6 | 12.6 | 31.8 | 30.8 | 96.9% |
| Total Renewable [GWh] (*) | 191.1 | 136.4 | 41.6 | 199.4 | 116.1 | 58.2% |
| Thermal power plants (**) | 162.4 | 2.0 | 2117.3 | 2798.0 | (°°) | (°°) |
| Renewable Energy [%] | 54.1% | 98.6% | 1.9% | 6.7% | (°°) | (°°) |
| Demand [GWh] (***) | 3036.2 | 725.6 | 814.0 | 1343.7 | 207.7 | 15.5% |
| Per capita demand [kWh/inh] | 3609.5 | 3393.2 | 3707.5 | 4867.3 | 4867.3 | |
° Percentages calculated with respect to the corresponding values of the Savona province. °° Missing values (due to no available data about thermal power plants); * PV, Wind, Hydro, Geothermal and thermal power plants fed by renewable sources (biomass, biofuels, etc.). ** Thermal power plants fed by renewable sources are not included here. *** Net electricity consumptions.
Table 3.
Data of the Bormida Valley grouped by municipality.
| Municipality | Inhabitants | Area [km2] | PV [kW] | Wind [kW] | Hydro [kW] |
|---|---|---|---|---|---|
| Altare | 2008 | 11.3 | 455.8 | 4000.0 | - |
| Bardineto | 744 | 29.8 | 4.9 | 1700.0 | - |
| Bormida | 359 | 22.5 | 2.9 | 4000.0 | - |
| Cairo Montenotte | 13,005 | 100.4 | 6310.1 | 11,700.0 | 7000.0 |
| Calizzano | 1455 | 62.5 | 583.8 | - | 75.0 |
| Carcare | 5477 | 10.4 | 165.6 | - | - |
| Cengio | 3418 | 19.0 | 193.8 | - | - |
| Cosseria | 1075 | 12.4 | 324.9 | - | - |
| Dego | 1974 | 66.8 | 154.1 | - | 93.0 |
| Giusvalla | 432 | 19.7 | 26.0 | - | - |
| Mallare | 1094 | 31.7 | 22.5 | 6900.0 | - |
| Massimino | 107 | 7.9 | 60.1 | - | - |
| Millesimo | 3349 | 16.0 | 558.3 | 20.0 | 110.0 |
| Mioglia | 507 | 19.3 | 93.5 | - | - |
| Murialdo | 819 | 39.2 | 62.6 | - | 75.0 |
| Osiglia | 467 | 28.2 | 9.3 | 800.0 | 701.0 |
| Pallare | 926 | 21.3 | 91.0 | - | - |
| Piana Crixia | 806 | 30.5 | 68.3 | - | - |
| Plodio | 631 | 8.7 | 44.0 | - | - |
| Pontinvrea | 818 | 25.0 | 48.8 | 3200.0 | - |
| Roccavignale | 761 | 17.7 | 279.3 | - | - |
| Sassello | 1742 | 100.7 | 65.1 | 3.8 | 400.0 |
| Urbe | 707 | 31.2 | 23.0 | - | 700.0 |
| Total | 42,681 | 731.9 | 9647.7 | 32,323.8 | 9154.0 |
| PV | Wind | Hydro | |||
| [MWh] | 9563.6 | 75,700.7 | 30,805.0 | ||
| [EOH] | 991.3 | 2341.9 | 3365.2 | ||
Table 4.
List of scenarios.
| Scenario | PV Maximum Increase [%] | Wind Increase [%] | Hydro | Storage |
|---|---|---|---|---|
| 1a | 0 | 0 | not optimized * | not considered |
| 1b | Optimized ** | |||
| 2a | 50 | current capex ° | ||
| 2b | 155 | |||
| 2c | 0 | minimum capex °° | ||
| 2d | 155 | |||
| 3a | 100 | 0 | current capex | |
| 3b | 155 | |||
| 3c | 0 | minimum capex | ||
| 3d | 155 | |||
| 4a | 150 | 0 | current capex | |
| 4b | 155 | |||
| 4c | 0 | minimum capex | ||
| 4d | 155 | |||
| 5a | 200 | 0 | current capex | |
| 5b | 155 | |||
| 5c | 0 | minimum capex | ||
| 5d | 155 | |||
| 6 | 200 | 155 | null capex |
* Hydro power plants are daily operated in accordance with guidelines provided by plant owners [38]. ** The operation of hydro power plants is optimally scheduled by considering constraints (5) and (6) in the optimization model. ° 350 €/kWh. °° Minimum capex indicates the value for which the installation of at least one battery storage unit occurs.
Table 5.
Optimal design results.
| Scenario | Capex [k€] | New PV [MW] | New Wind [MW] | [MWh] |
|---|---|---|---|---|
| 1a | - | - | - | - |
| 1b | - | - | - | - |
| 2a | 7718 | 4.82 (+50%) | - | - |
| 2b | 57,718 | 4.82 (+50%) | 50 (+155%) | - |
| 2c | 8246 | 4.82 (+50%) | - | 8 (1 storage unit) |
| 2d | 58,566 | 4.82 (+50%) | 50 (+155%) | 8 (1 storage unit) |
| 3a | 15,436 | 9.65 (+100%) | - | - |
| 3b | 65,436 | 9.65 (+100%) | 50 (+155%) | - |
| 3c | 15,968 | 9.65 (+100%) | - | 8 (1 storage unit) |
| 3d | 66,268 | 9.65 (+100%) | 50 (+155%) | 8 (1 storage unit) |
| 4a | 23,154 | 14.47 (+150%) | - | - |
| 4b | 73,154 | 14.47 (+150%) | 50 (+155%) | - |
| 4c | 23,714 | 14.47 (+150%) | - | 8 (1 storage unit) |
| 4d | 74,074 | 14.47 (+150%) | 50 (+155%) | 8 (1 storage unit) |
| 5a | 30,872 | 19.29 (+200%) | - | - |
| 5b | 76,336 | 16.46 (+171%) | 50 (+155%) | - |
| 5c | 31,544 | 19.29 (+200%) | 8 (1 storage unit) | |
| 5d | 75,184 | 15.18 (+157%) | 50 (+155%) | 8 (1 storage unit) |
| 6 | 79,097 | 18.19 (+188%) | 50 (+155%) | 240 (30 storage units) |
Table 6.
Optimal operational results.
| Scenario | Opex | ||||||||||
|---|---|---|---|---|---|---|---|---|---|---|---|
| [k€/Year] | [GWh/Year] | [%] | [kt/Year] | ||||||||
| 1a | 18,503 | 207.7 | 9.56 | 30.8 | 75.7 | 93.37 | 1.70 | - | - | 55.9 | 26.6 |
| 1b | 18,398 (−0.6%) | 9.56 | 75.7 | 92.71 (−0.7%) | 1.03 (−39.2%) | - | - | 55.9 | 26.4 (−0.7%) | ||
| 2a | 17,361 (−6.2%) | 14.82 | 75.7 | 87.45 (−6.3%) | 1.03 (−39.0%) | - | - | 58.4 | 24.9 (−6.3%) | ||
| 2b | 3846 (−79.2%) | 14.82 | 192.8 | 36.87 (−60.5%) | 67.55 (+3881%) | - | - | 114.8 | 10.5 (−60.5%) | ||
| 2c | 17,307 (−6.5%) | 14.82 | 75.7 | 87.12 (−6.7%) | 0.63 (−62.8%) | 0.48 | 0.40 | 58.4 | 24.8 (−6.7%) | ||
| 2d | 3758 (−79.7%) | 14.82 | 192.8 | 36.26 (−61.2%) | 66.84 (+3839%) | 0.71 | 0.60 | 114.8 | 10.3 (−61.2%) | ||
| 3a | 16,325 (−11.8%) | 20.08 | 75.7 | 82.19 (−12.0%) | 1.04 (38.9%) | - | - | 60.9 | 23.4 (−12.0%) | ||
| 3b | 3103 (−83.2%) | 20.08 | 192.8 | 33.57 (−64.0%) | 69.52 (+3997%) | - | - | 117.3 | 9.6 (−64.0%) | ||
| 3c | 16,270 (−12.1%) | 20.08 | 75.7 | 81.86 (−12.3%) | 0.63 (−62.7%) | 0.48 | 0.40 | 60.9 | 23.3 (−12.3%) | ||
| 3d | 3017 (−83.7%) | 20.08 | 192.8 | 32.98 (−64.7%) | 68.81 (+3956%) | 0.70 | 0.60 | 117.3 | 9.4 (−64.7%) | ||
| 4a | 15,291 (−17.4%) | 25.34 | 75.7 | 76.96 (−17.6%) | 1.06 (−37.3%) | - | - | 63.5 | 21.9 (−17.6%) | ||
| 4b | 2399 (−87.0%) | 25.34 | 192.8 | 30.55 (−67.3%) | 71.76 (+4129%) | - | - | 119.8 | 8.7 (−67.3%) | ||
| 4c | 15,234 (−17.7%) | 25.34 | 75.7 | 76.61 (−18.0%) | 0.63 (−62.6%) | 0.48 | 0.40 | 63.5 | 21.8 (−18.0%) | ||
| 4d | 2304 (−87.5%) | 25.34 | 192.8 | 29.89 (−68.0%) | 70.97 (+4083%) | 0.79 | 0.67 | 119.8 | 8.5 (−68.0%) | ||
| 5a | 14,291 (−22.8%) | 30.60 | 75.7 | 71.96 (−22.9%) | 1.32 (−21.9%) | - | - | 66.0 | 20.5 (−22.9%) | ||
| 5b | 2117 (−88.6%) | 27.51 | 192.8 | 29.37 (−68.5%) | 72.74 (+4187%) | - | - | 120.9 | 8.4 (68.5%) | ||
| 5c | 14,222 (−23.1%) | 30.60 | 75.7 | 71.52 (−23.4%) | 0.80 (−53.1%) | 0.53 | 0.44 | 66.0 | 20.4 (−23.4%) | ||
| 5d | 2203 (−88.1%) | 26.12 | 192.8 | 29.46 (−68.5%) | 71.32 (+4103%) | 0.79 | 0.67 | 120.2 | 8.4 (−68.5%) | ||
| 6 | 658 (−96.4%) | 29.39 | 192.8 | 20.46 (−78.1%) | 64.58 (+3706%) | 9.17 | 8.04 | 121.8 | 5.83 (−78.1%) | ||
© 2020 by the author. Licensee MDPI, Basel, Switzerland. This article is an open access article distributed under the terms and conditions of the Creative Commons Attribution (CC BY) license (http://creativecommons.org/licenses/by/4.0/).
Share and Cite
MDPI and ACS Style
Bracco, S. A Study for the Optimal Exploitation of Solar, Wind and Hydro Resources and Electrical Storage Systems in the Bormida Valley in the North of Italy. Energies 2020, 13, 5291. https://0-doi-org.brum.beds.ac.uk/10.3390/en13205291
AMA Style
Bracco S. A Study for the Optimal Exploitation of Solar, Wind and Hydro Resources and Electrical Storage Systems in the Bormida Valley in the North of Italy. Energies. 2020; 13(20):5291. https://0-doi-org.brum.beds.ac.uk/10.3390/en13205291
Chicago/Turabian StyleBracco, Stefano. 2020. "A Study for the Optimal Exploitation of Solar, Wind and Hydro Resources and Electrical Storage Systems in the Bormida Valley in the North of Italy" Energies 13, no. 20: 5291. https://0-doi-org.brum.beds.ac.uk/10.3390/en13205291
Note that from the first issue of 2016, this journal uses article numbers instead of page numbers. See further details here.