Article

Historic Building Thermal Diagnostics Algorithm Presented for the Example of a Townhouse in Lviv

by
Bożena Orlik-Kożdoń
1,*,
Elżbieta Radziszewska-Zielina
2,
Małgorzata Fedorczak-Cisak
2,*,
Tomasz Steidl
1,
Andrzej Białkiewicz
3,
Maria Żychowska
3 and
Andriy Muzychak
4
1
Faculty of Civil Engineering, Silesia University of Technology, 44-100 Gliwice, Poland
2
Faculty of Civil Engineering, Cracow University of Technology, 31-155 Kraków, Poland
3
Faculty of Architecture, Cracow University of Technology, 31-155 Kraków, Poland
4
Department of Electric Power Engineering and Control Systems, Lviv Polytechnic, 79013 Lviv, Ukraine
*
Authors to whom correspondence should be addressed.
Submission received: 27 August 2020 / Revised: 8 October 2020 / Accepted: 12 October 2020 / Published: 15 October 2020
(This article belongs to the Special Issue Energy Performance of Buildings)

Abstract

:
This paper presents a proposal for a historic building thermal diagnostics algorithm for the example of a historical townhouse located in Lviv, Ukraine. The authors proposed a testing and diagnostics procedure that should precede design and renovation work associated with improving the energy standard of the buildings under discussion. The procedure was presented using a case study of a selected historical building. The scope of the study included an assessment of the building’s technical condition, thermal vision diagnostics, wall moisture, and water absorption in the context of protection against rain. Sample thermal and hygrothermal calculations were performed for a sample architecture element. The calculations included simulations of partition envelope behaviour after planned thermal retrofitting had been carried out. Performing the presented thermal diagnostics methods in three interlinked blocks (A, B, and C) shall ensure the proper thermal retrofitting of historical buildings in the context of their further occupancy.

Graphical Abstract

1. Introduction

The renovation of facades and thermal retrofitting of walls in historical buildings must meet conservation guidelines [1]. The poor technical condition of historical buildings featuring various types of structural solutions has arisen from a failure to follow guidelines for the conservation of local monuments, as presented in [2,3]. The subject of renovating and adapting historical buildings was also discussed in [4,5,6,7], wherein it was suggested that during the initial analysis of a project’s feasibility, one must analyse various project alternatives and their associated costs. In [8,9], it was proven that the profitability of construction projects depends on the technical solutions adopted. The authors of [10] proposed a solution that can aid real estate developers in making decisions regarding the selection of material solutions while accounting for life-cycle costs (LCC). The authors of [11,12] identified a series of problems and obstacles during construction project technology selection and performance for work performed in the centre of urban agglomerations. A very important aspect is to improve the efficiency of historic buildings without compromising comfort. This subject was pursued by the authors in [6,13]. Indoor air quality (IAQ) is one of the most important elements influencing the comfort and satisfaction of a building’s users. This also applies to historic buildings. This topic was described in [14,15]. The authors of [16,17] assessed the specificity of cooperation during construction projects in Ukraine, Poland, and Slovakia. Renovations and the thermal retrofitting of walls, particularly in historical buildings, are difficult and multifaceted problems.
The thermal insulation of walls is one of the means of improving a building’s energy standards. In the case of existing buildings placed under architectural conservation, which are listed in a monuments register and that have facades of high architectural value, standard methods for improving the energy quality of the envelope cannot be applied, similar to the situation for methods used for diagnosing the state of the thermal protection of existing buildings. In the case of historical buildings, applying internal thermal insulation to walls is a possible alternative [18]. Applying such thermal insulation requires not only new technologies and thermal insulation materials, but most importantly a new comprehensive approach to thermal diagnostics.
The Green Building Council of Italy has developed a special evaluation system for the certification of historical buildings. This has been discussed and applied in [19,20,21], among others. The aim of [20] was to present a modernisation project based on strategies relating to three objectives, namely energy saving, preservation of historic architecture, and improvement of internal building environments for users, in accordance with the recommendations of the LEED (Leadership in Energy and Environmental Design) rating system and the GBC Historic Building Protocol, as proposed by the Green Building Council of Italy. There are also other case studies on the energy standard improvement of one or more historic buildings (e.g., [22]).
This paper presents an original thermal diagnostics algorithm for historical buildings or buildings of substantial historical value to be applied in the context of their future thermal modernisation and occupancy. The new approach proposed in the paper is a coherent and comprehensive thermal and moisture diagnostics approach to be performed prior to renovation, which also allows the prognostication of the renovation outcomes during later occupancy. These measures can lessen the negative consequences of the designer’s interference with the structure of the historical envelope so that one can avoid adversely affecting the moisture levels of individual layers, including historical architectural elements, over the long-term by improving the envelope’s thermal insulation. The algorithm’s was applied to an example of a historical townhouse located in Lviv, Ukraine. The authors focused on assessing one of the types of architectural elements—in this case balcony slabs supported by steel beams. These are frequently encountered elements in Lviv’s architecture. This is why these were focused on in the context of the hygrothermal assessment, which included:
  • An analysis of the structural elements in terms of increased heat loss via a thermal bridge;
  • Calculation of the water content profiles for selected partition surfaces.
The analysis was performed for three partition alternatives: alternative 1—the extant state; alternative 2—an internally insulated partition; alternative 3—an externally insulated partition (which occurs in exceptional cases, subject to approval by the heritage conservator for historic buildings).

2. Original Historical Building Thermal Diagnostics Algorithm

The historical building thermal diagnostics algorithm presented below (Figure 1) should form the basis for a designer’s (architect’s) actions, in conjunction with advice from conservation services and building physics specialists. It can aid in improving the energy performance of the envelope without decreasing the technical condition of structural elements or the historical décor of external walls via their possible uncontrolled dampening caused by changes in the wall layers. The algorithm is presented in graphical form in Figure 1. The practical application of the algorithm was verified on an example of a historical townhouse located in Lviv.
The scheme (Figure 1) presents the three blocks of the proposed thermal diagnostics algorithm, which include individual procedures for historical buildings.
Block A: This is the basic block, containing typical procedures that are commonly used when assessing a building’s technical condition prior to planning its renovation. The procedures ensure that the necessary information is obtained to prepare a typical renovation design. The authors deliberately ignored procedures associated with historical and archaeological studies, believing them to be a separate academic and technical matter. Such matters are regulated by appropriate legal regulations in all European Union member states and other European countries.
Block B: This block features a set of proposed innovative procedures intended to ensure a complete analysis of the data procured from block A and the processing of this data into practical building envelope renovation design guidelines. The procedures proposed in block B can supplement non-renovation measures. In some cases, some of these measures are applied for purposes such as archaeological studies, which are not made available during design work.
Block C: This block features the building envelope thermal retrofitting design. In this block, the authors proposed innovative measures such as obligatory hygrothermal simulations for selected historical building elements. Such simulations allow one to assess the impacts of changes within the structure of the envelope being assessed, e.g., internal insulation or the application of renovation plasters and paints.
These procedures were applied on a selected building located in the compact historical urban area of Lviv, which is particularly valuable in the eyes of both the former and current residents of this historic city.

3. Materials and Methods

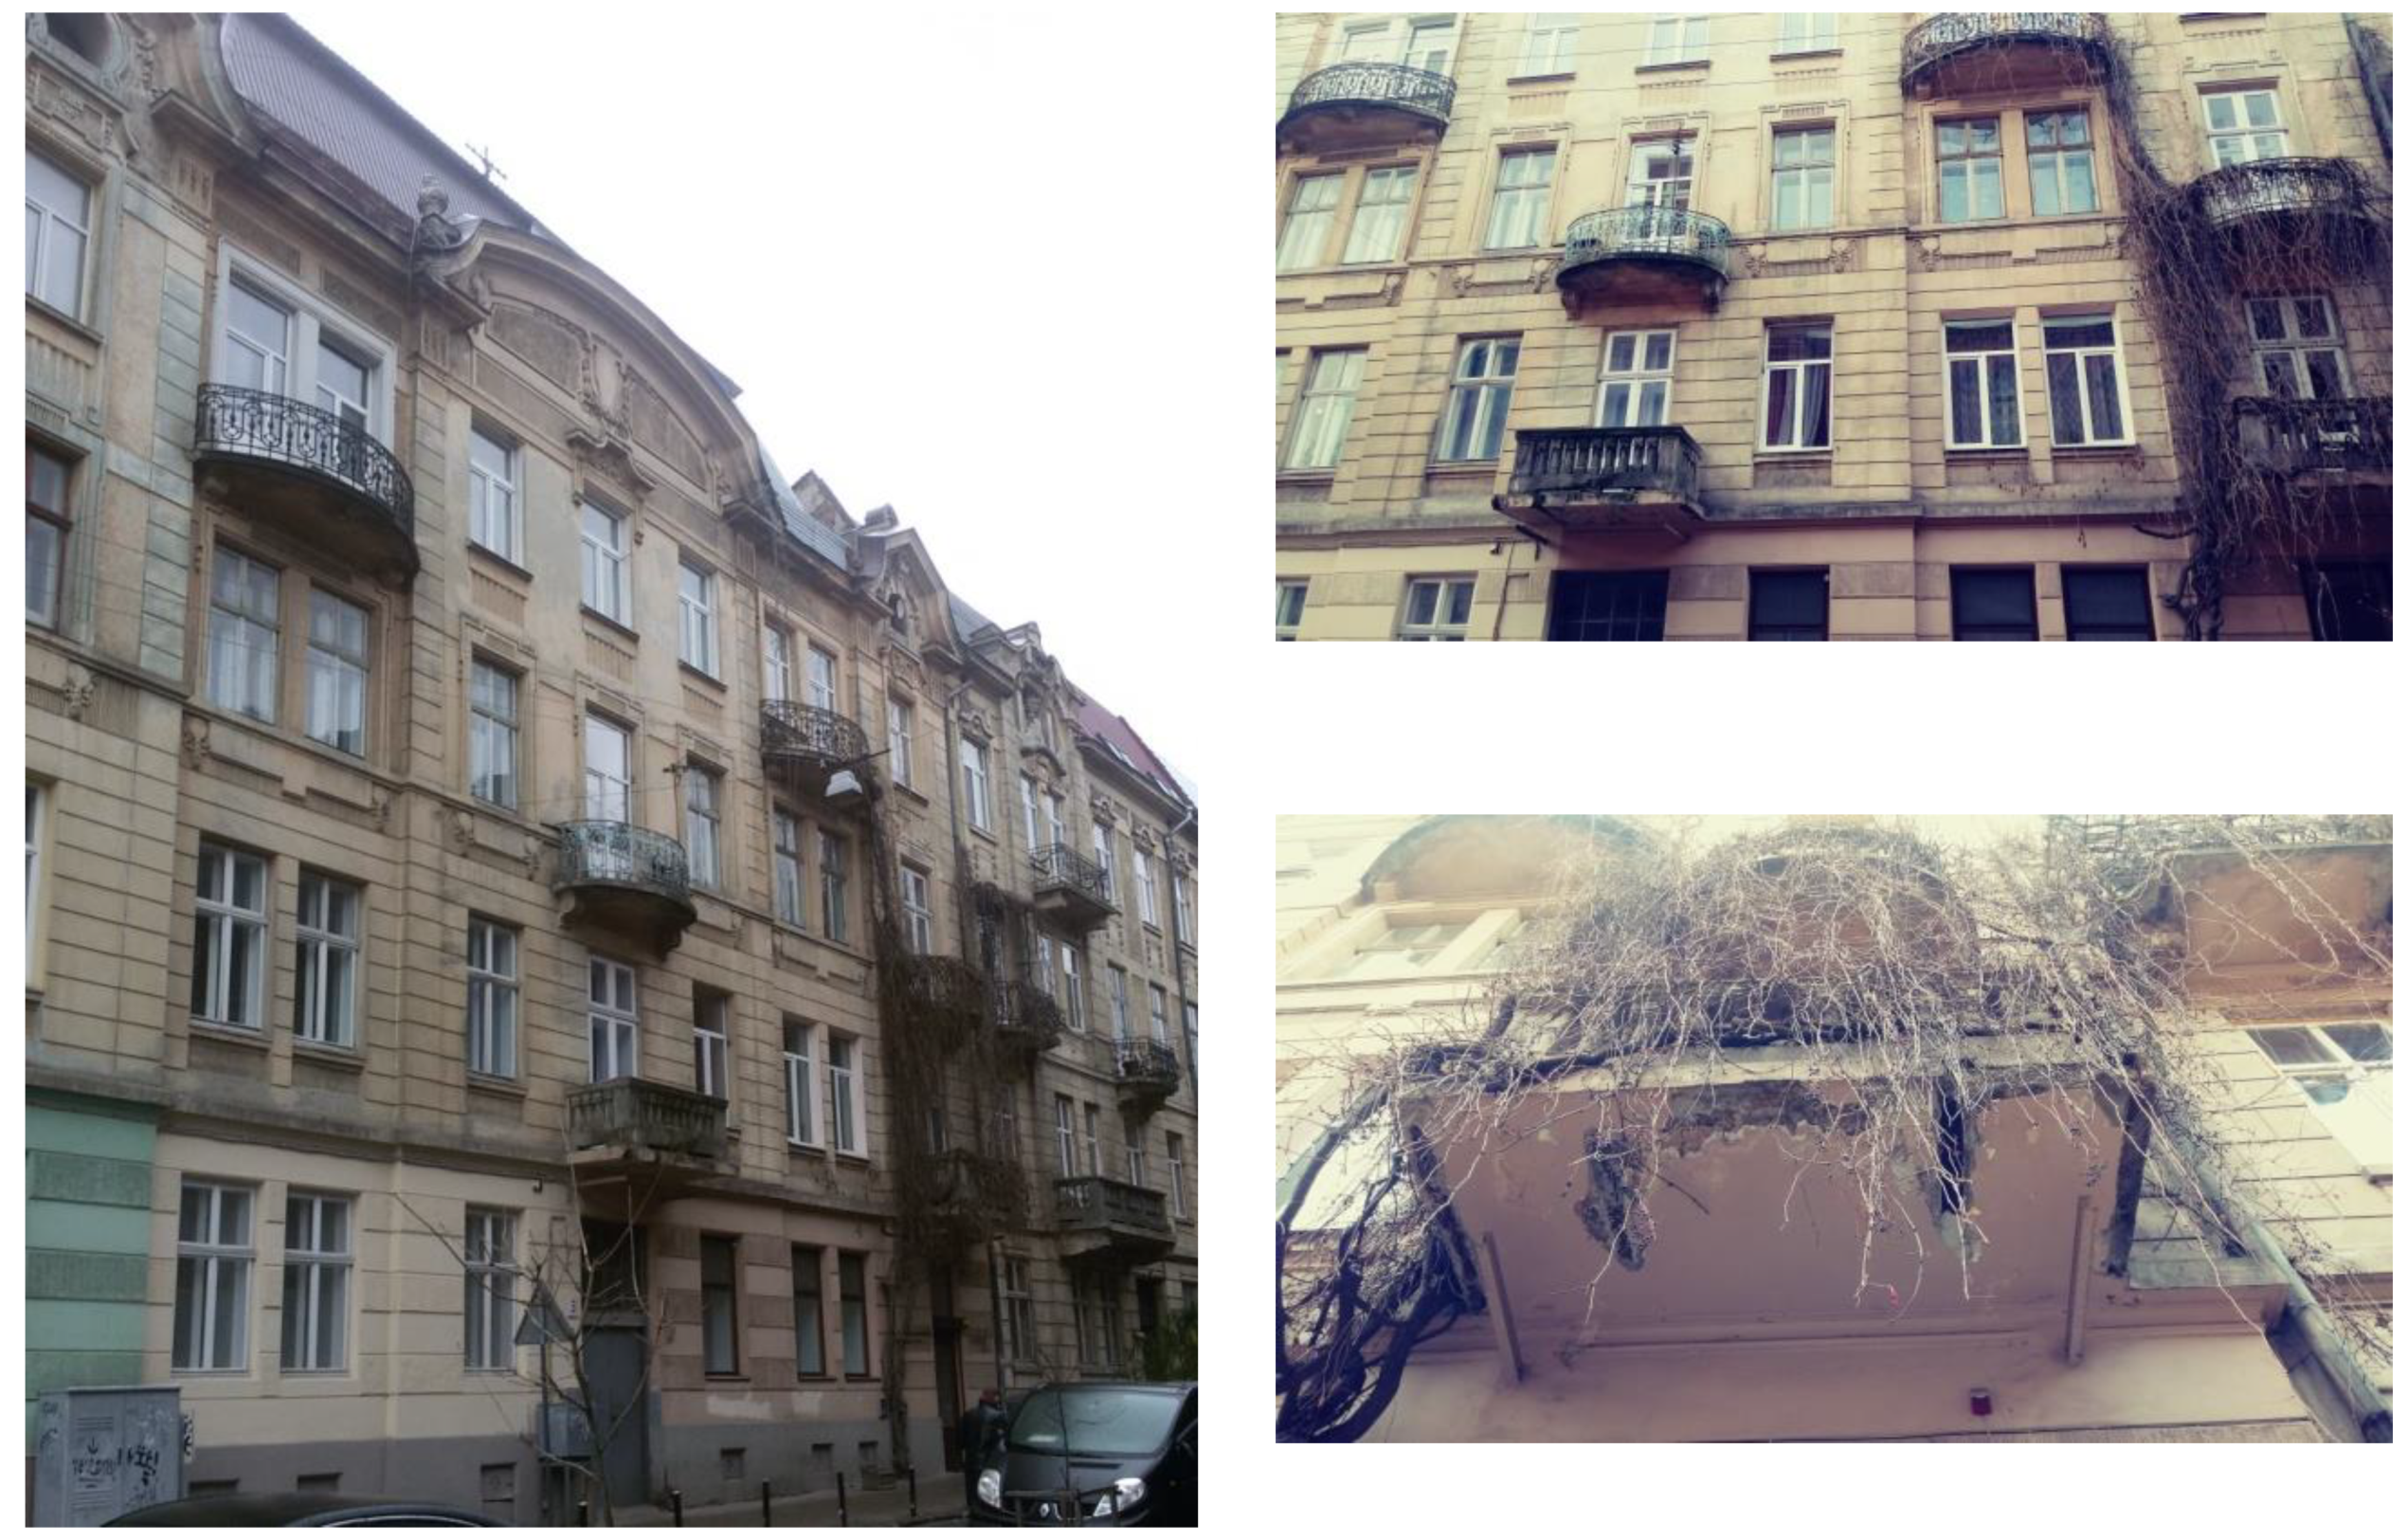
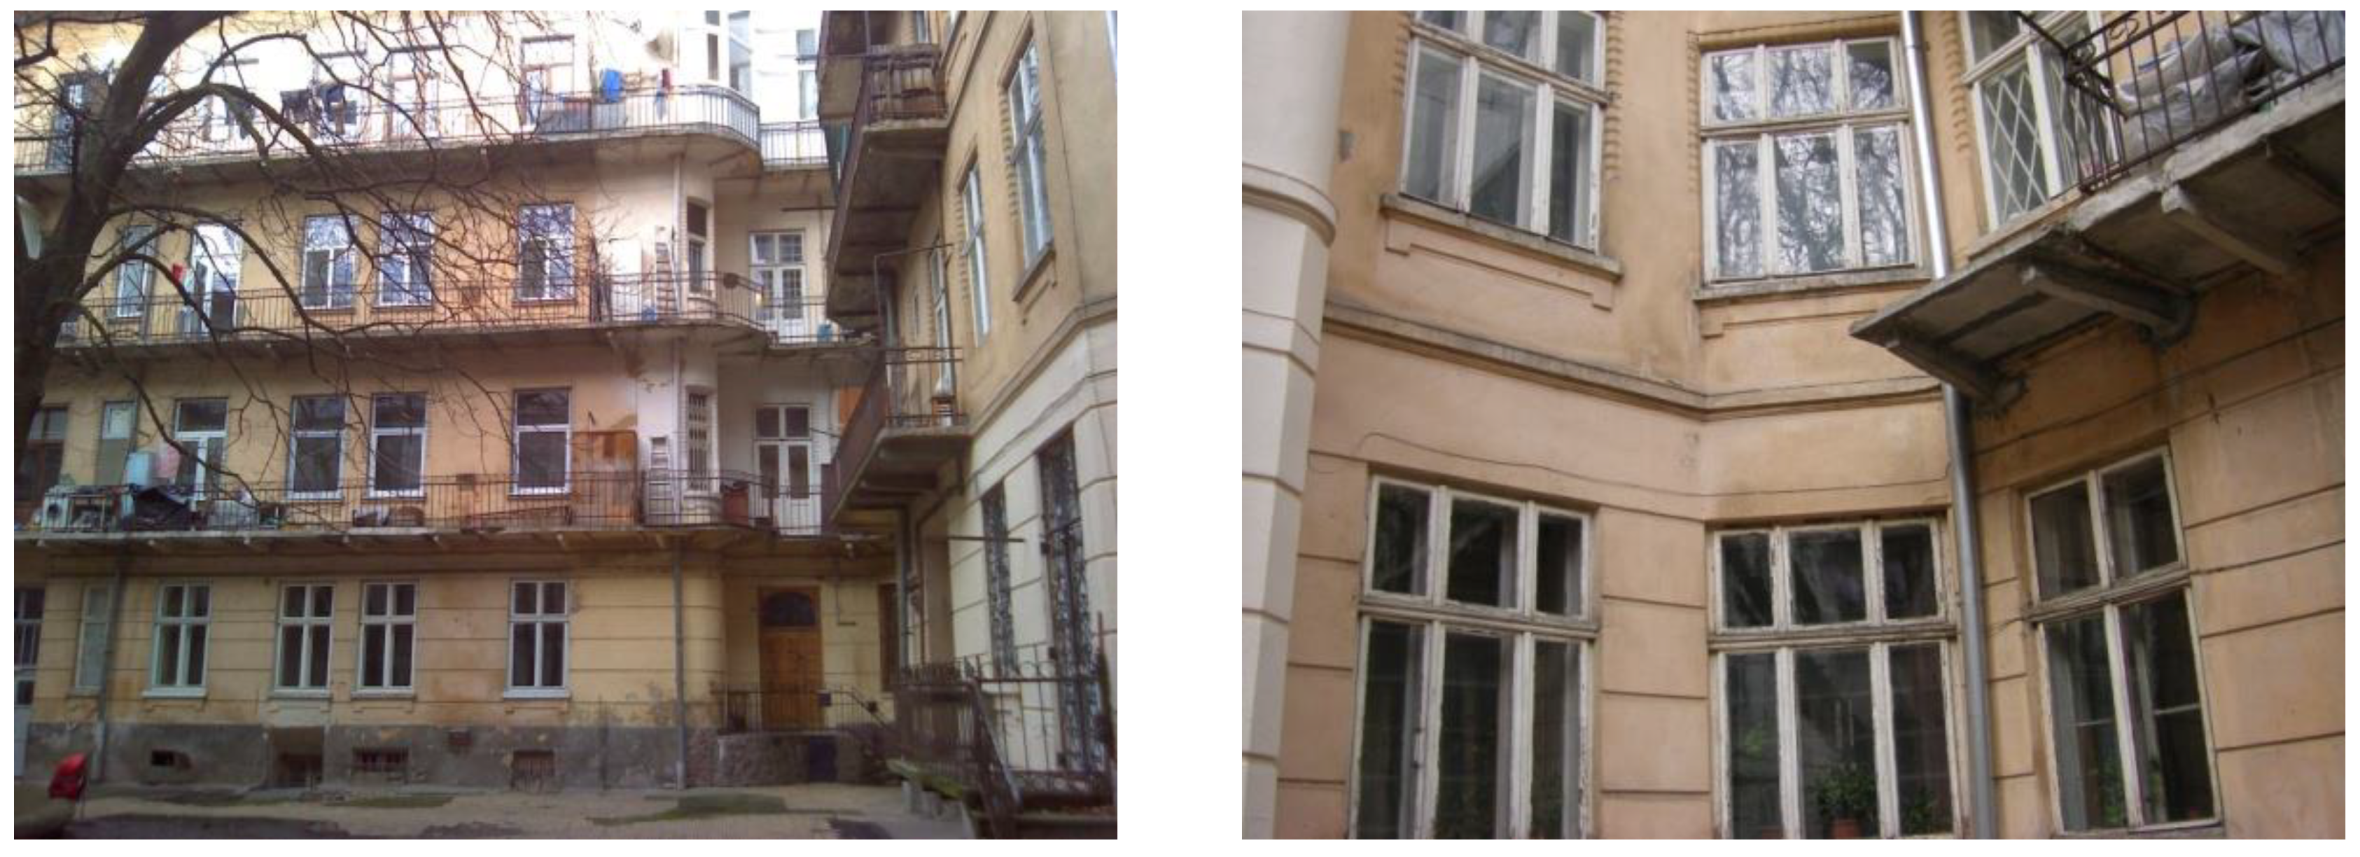
3.1. Overview of Lviv’s Architecture and the Aim of the Study

Lviv’s architecture has always displayed considerable aesthetic value. This city has been the home of successful industrialists, bankers, scientists, painters, sculptors, and architects, which has affected the architecture of this city.
The Technical Academy that had existed here since the middle of the nineteenth century gained its new name—the Lviv Polytechnic—in 1921. The history of the founding and operations of the Department of Architecture is very rich and significant to Lviv’s architecture. The application of regional construction traditions enhanced by motifs from innovative European trends has been a great accomplishment of the department’s graduates. These principles are particularly evident in formal public buildings [23]. Julian Zachariewicz, a professor of architecture who had ties with the department until his death in 1912, can be considered a key figure in the beginning of this history. His legacy includes excellent Lviv architecture, as well as the main building of the Lviv Polytechnic.
The architectural image of Lviv became visible in the second half of the nineteenth century and largely involved tenement houses. These tenement houses have street frontages, which enhance the image of the city with their varied facades. These historical buildings, which stand out due to the artistry of their facade designs, have mostly survived to the present day. These include public and residential buildings. They feature structural systems that were new at the time of their construction, as well as excellent aesthetic assets. After years of occupancy and having been ravaged by time, they now require conservation measures and adaptation to contemporary user requirements and technical standards.
The problems related to the conservation of architecture from this period are highly specific, being affected by concrete cultural influences. The issues that pertain to construction and finishing materials used in the area of Lower Silesia [24] are different from those of the area of former Galicia. In the first case, ceramics were and continue to be among the most prized materials used in the design of building facades, determining the aesthetic and architectural expression of public buildings and tenement housing in many cities. Enamelled facade elements are subjected to the negative impacts of atmospheric factors and are degraded over decades of use, which is why they require specific conservation and restoration procedures so that their aesthetic value can be restored.
Meanwhile, the methods used for restoring buildings from the second half of the nineteenth and the start of the twentieth century in the territory of contemporary Ukraine are different. The variety of architectural styles seen on building facades from this period require the selection of proper restoration methods. Historical construction materials and systems determine this selection process [25]. Stylistic analyses of this architectural period highlighted the associated aesthetic phenomena and the specific characteristics of each city and were an introduction to these types of studies. Local determinants significantly contributed to the construction of a wide array of pseudo-Gothic, pseudo-Renaissance, pseudo-Russian, and pseudo-Moorish buildings—predominantly residential townhouses. This is why an assessment of their historical value is performed prior to all contemporary conservation measures targeting this architecture, which is then used as the basis for appropriate procedures.
The problems related to restoring historical buildings to their former condition involve a range of specific issues. A building’s footing is an essential factor, including any hydrogeological changes that may have resulted in different footing conditions, as the materials used towards the end of the nineteenth century and the start of the twentieth century do not always guarantee sufficient durability. It is often necessary to reinforce structural walls, deformed load-bearing structures, decks, and brick or stone walls, together with replacing entire structural elements or fragments, so as to increase the stability and durability of buildings with historical value. In many cases it is necessary to dry out the walls and use water removal methods that do not lead to the future endangerment of historical components.
The renovation of various types of plasters on facades and decorative elements, such as stuccoes, wall paintings, artistic metal decorations, and ornamental balconies and structures, is a separate and essential aspect of conservation. This also applies to the anchoring of plasters and proofing of plastered surfaces. Colour selection, which should correspond to the originally used colours, is also important.
The conservation of interiors in public and residential buildings, particularly those from the second half of the nineteenth century and the start of the twentieth century, should be given high priority. Problems associated with the transformation of original components as a result of numerous remodelling projects—leading not only to structural system deformation, but also affecting the functionality and condition of the interior décor—are quite frequent. It is essential to adapt these buildings to contemporary standards. These are key matters encountered in the adaptive reuse of historical buildings.
The matter of the public acceptance of projects is an equally important and even critical aspect of conservation. Here, one should account for the high costs of any procedures performed on historic structures, the specificity of the expensive technologies used for restoring a building to an expected technical condition, and the emotional attitude of the public toward restoring relics of the past. The general public does not always understand the need to preserve the architecture from the second half of the nineteenth century and the beginning of the twentieth century, as well as later modernist architecture, or that it deserves to be placed under conservation. Despite these buildings existing for almost two centuries, this often appear to be too short a period for the widespread appreciation of their cultural value to entrench itself. When compared to numerous relics from previous periods that are commonplace in contemporary cities, one gets the impression that it might be too early to place them on heritage sites lists.
The current administration of the city of Lviv is making efforts to implement the recommendations from the directive on the energy performance of buildings [26], while also preserving the facade assets of buildings. The richly decorated facades of historical townhouses in the city are sort of monument to the history of Polish, Austrian, Russian, German, and Jewish architecture. The richly decorated balcony slabs are heritage elements that deserve particular protection and renovation.

3.2. Aim of the Study

As a study example for the original diagnostics procedure, the authors chose a multifamily building located in Lviv in a district with compact development (Figure 2, Figure 3 and Figure 4). The massing of the building resembles the letter “L” in shape. The building has four above-grade storeys, a partially unusable attic, and a partial basement. It was built in 1901 using traditional construction technology. Its foundations and external walls were made from small ceramic elements, namely solid bricks. The building’s roof truss is comprised of a combination of hanging post and purlin-and-rafter solutions. The roof is covered with ceramic tiles.
While applying the procedures featured in block A of the proposed original historical building thermal diagnostics algorithm, the authors managed to access the original designs for the building from 1901. Figure 5 presents the fragment, showing the ground floor plan.

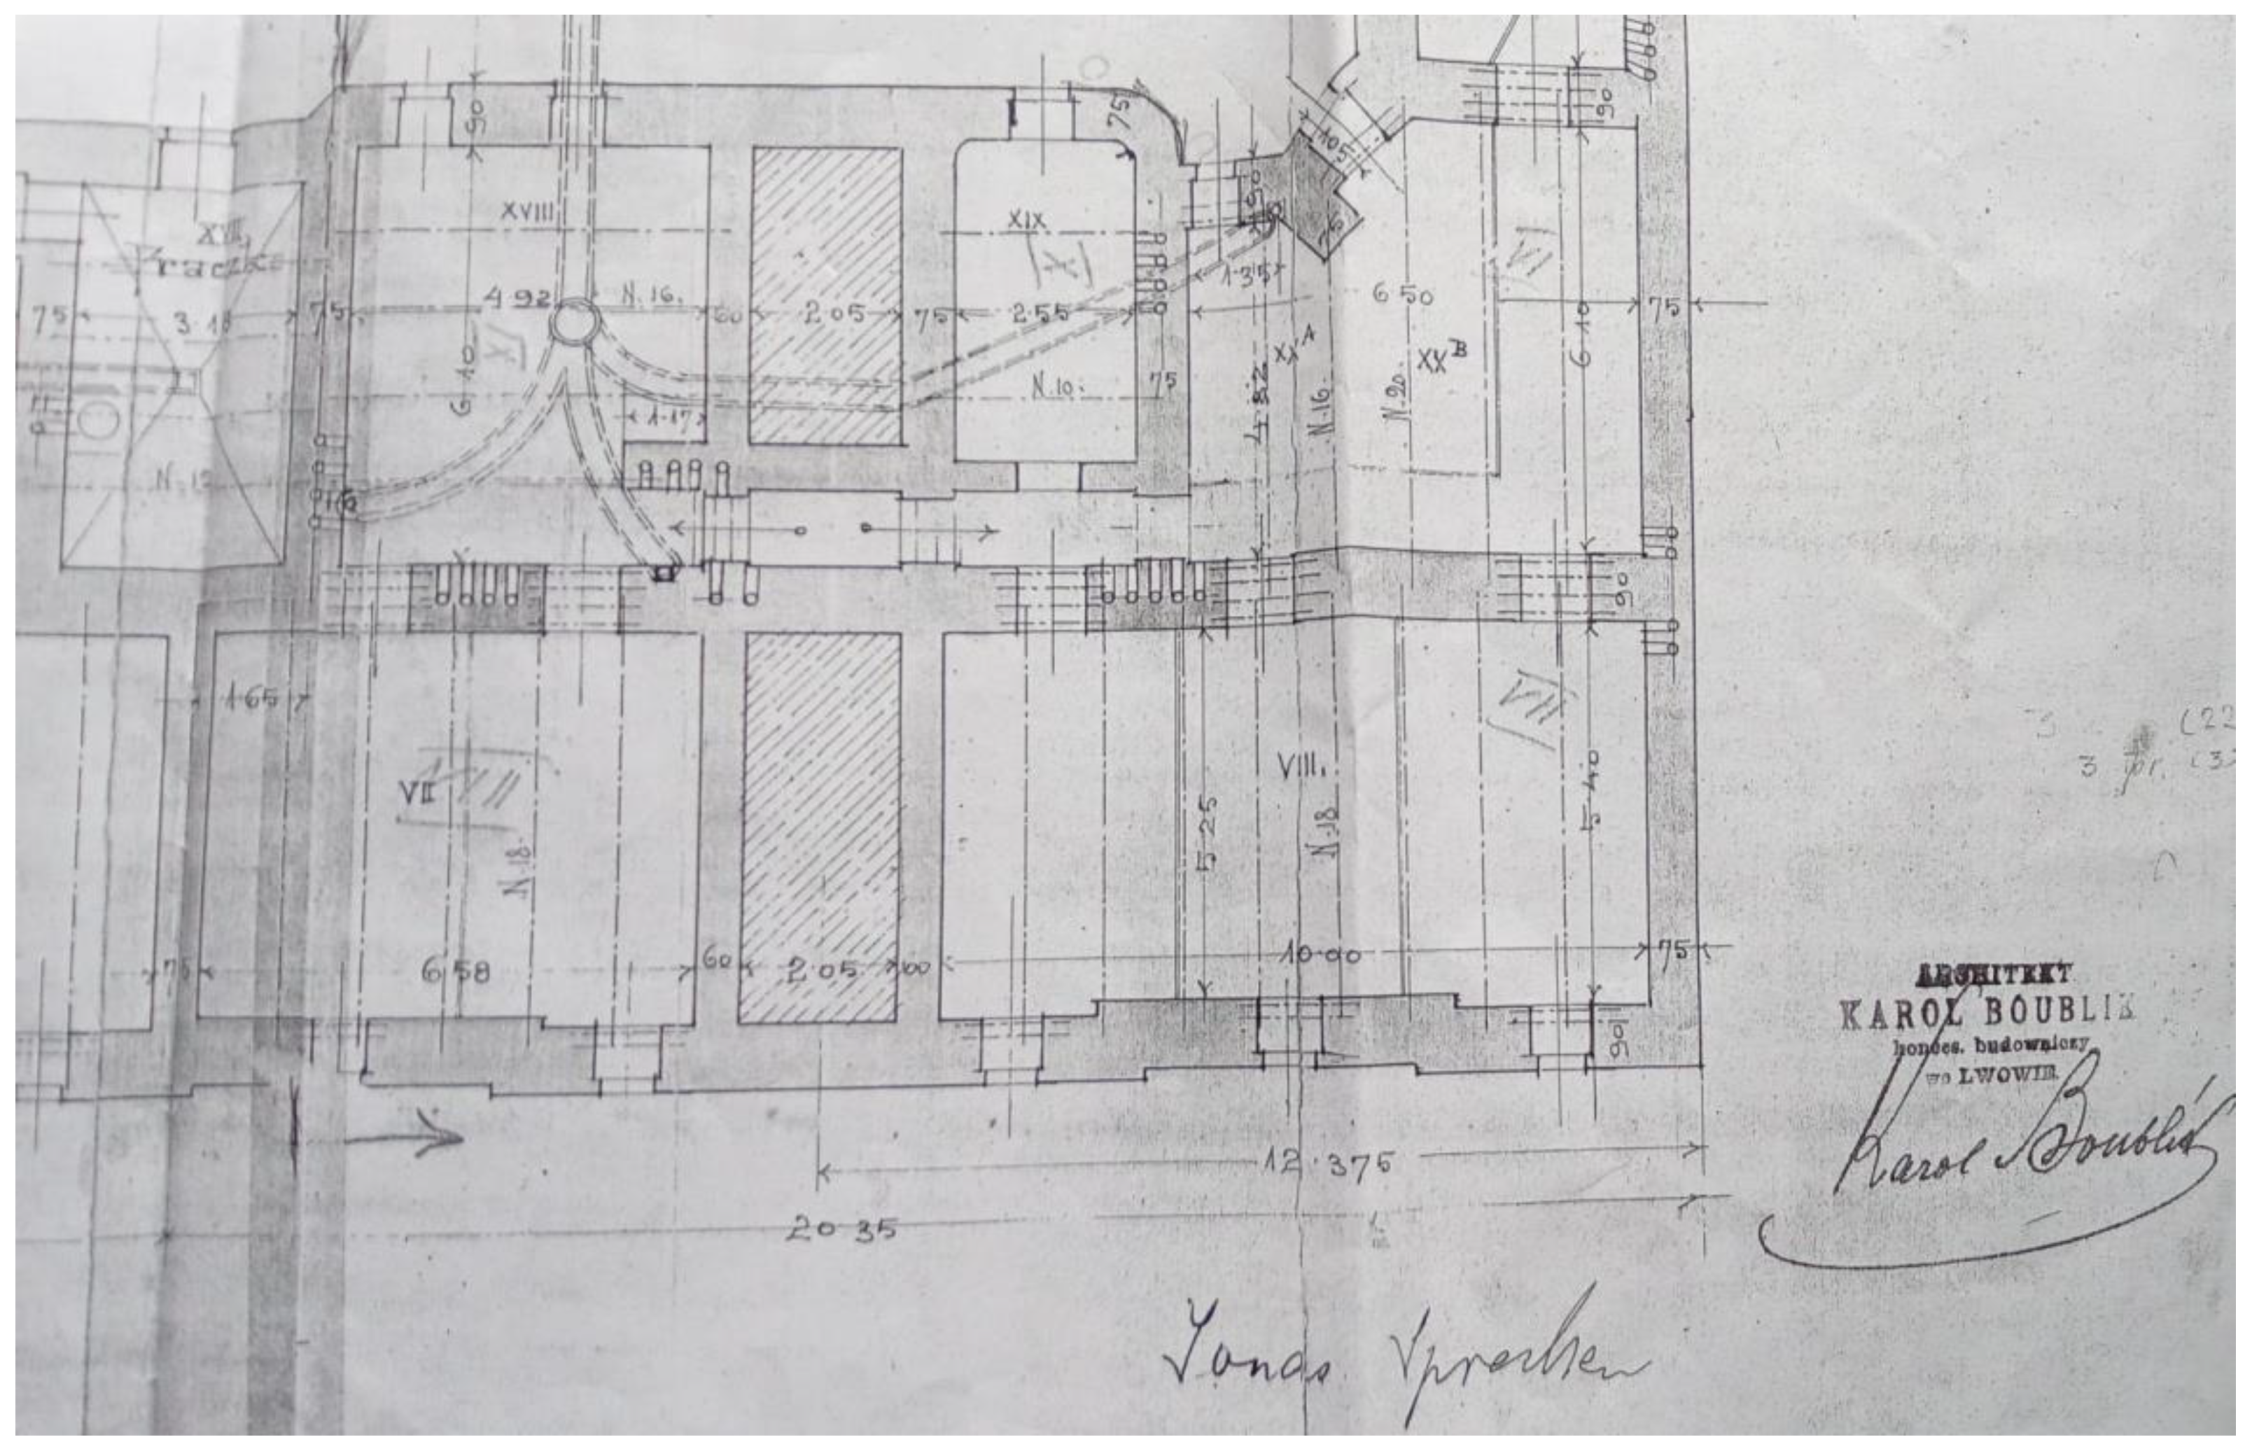
Overview of Material and Structural System Solutions

This structural system overview covers the above-grade walls, whose thermal insulation is the subject of this study, as well as their adjoining elements, namely the decks. The overview was written on the basis of the partially surviving archival documentation and in situ studies by the authors during the performance of basic procedures in block A.
Foundation walls:
  • Made from small ceramic elements—solid bricks, with a thickness of between 75 and 90 cm (2.5 or 3 bricks—based on the supplied documentation) and the authors’ own studies.
Above-grade walls:
  • Made from small ceramic elements—solid bricks. The walls taper in terms of their height. At the ground floor level, the wall thickness is around 70–90 cm (based on the supplied documentation and measurements), while on the second and third floors it is around 45–60 cm (1.5 to 2 bricks). The internal walls have thicknesses of 33 and 45 cm. The work presents selected analysis results for the wall for a thickness of 70 cm (this is the most common thickness in the building);
  • The building predominantly featured wooden box windows fitted to align with the surfaces of external walls. In a small portion of the building, some windows were replaced with new, PVC sets;
  • The internal finish for the walls is a lime–cement plaster;
  • The external finish is cement–lime plaster with a double layer of paint;
  • The entire building’s decks were built from wooden beams, with load-bearing beams parallel to the axis of the street and supported by external walls.

3.3. Initial Extant State Assessment

Thermal retrofitting works involving the addition of thermal insulation to the external partitions of historical buildings should be preceded by an assessment following the algorithm specified in block A, which includes:
  • Identifying the material composition of partitions via wall stratigraphy analysis;
  • Measuring the thickness of the walls’ extant layers;
  • Material moisture measurements using non-invasive methods;
  • Wall capillary absorptivity measurements and an assessment of the condition of external layers (plasters) in terms of proofing against driving rain;
  • Determining wall layer material types and ascribing proper physical characteristics to them using available data. For historical walls, it is recommended to test the individual physical properties of the ceramic material;
  • Performing a survey of distinctive places within the building using thermovision diagnostics (thermal bridges and anomalies);
  • Thermal insulation material and technology selection, accounting for resistance to biological corrosion. A pH > 10 is recommended;
  • Formulating room occupancy programs, defining indoor air temperature and humidity regulation capacity;
  • Calculating temperatures at the point of contact between layers, involving extant wall–thermal insulation material and accounting for two-dimensional heat flow;
  • The application of advanced calculation methods to determine the temperature distribution fields in a partition’s cross-section in distinct places within the building, and wherever possible the performance of moisture flow simulations for the partition, preferably in distinct places, over a period of at least three years.

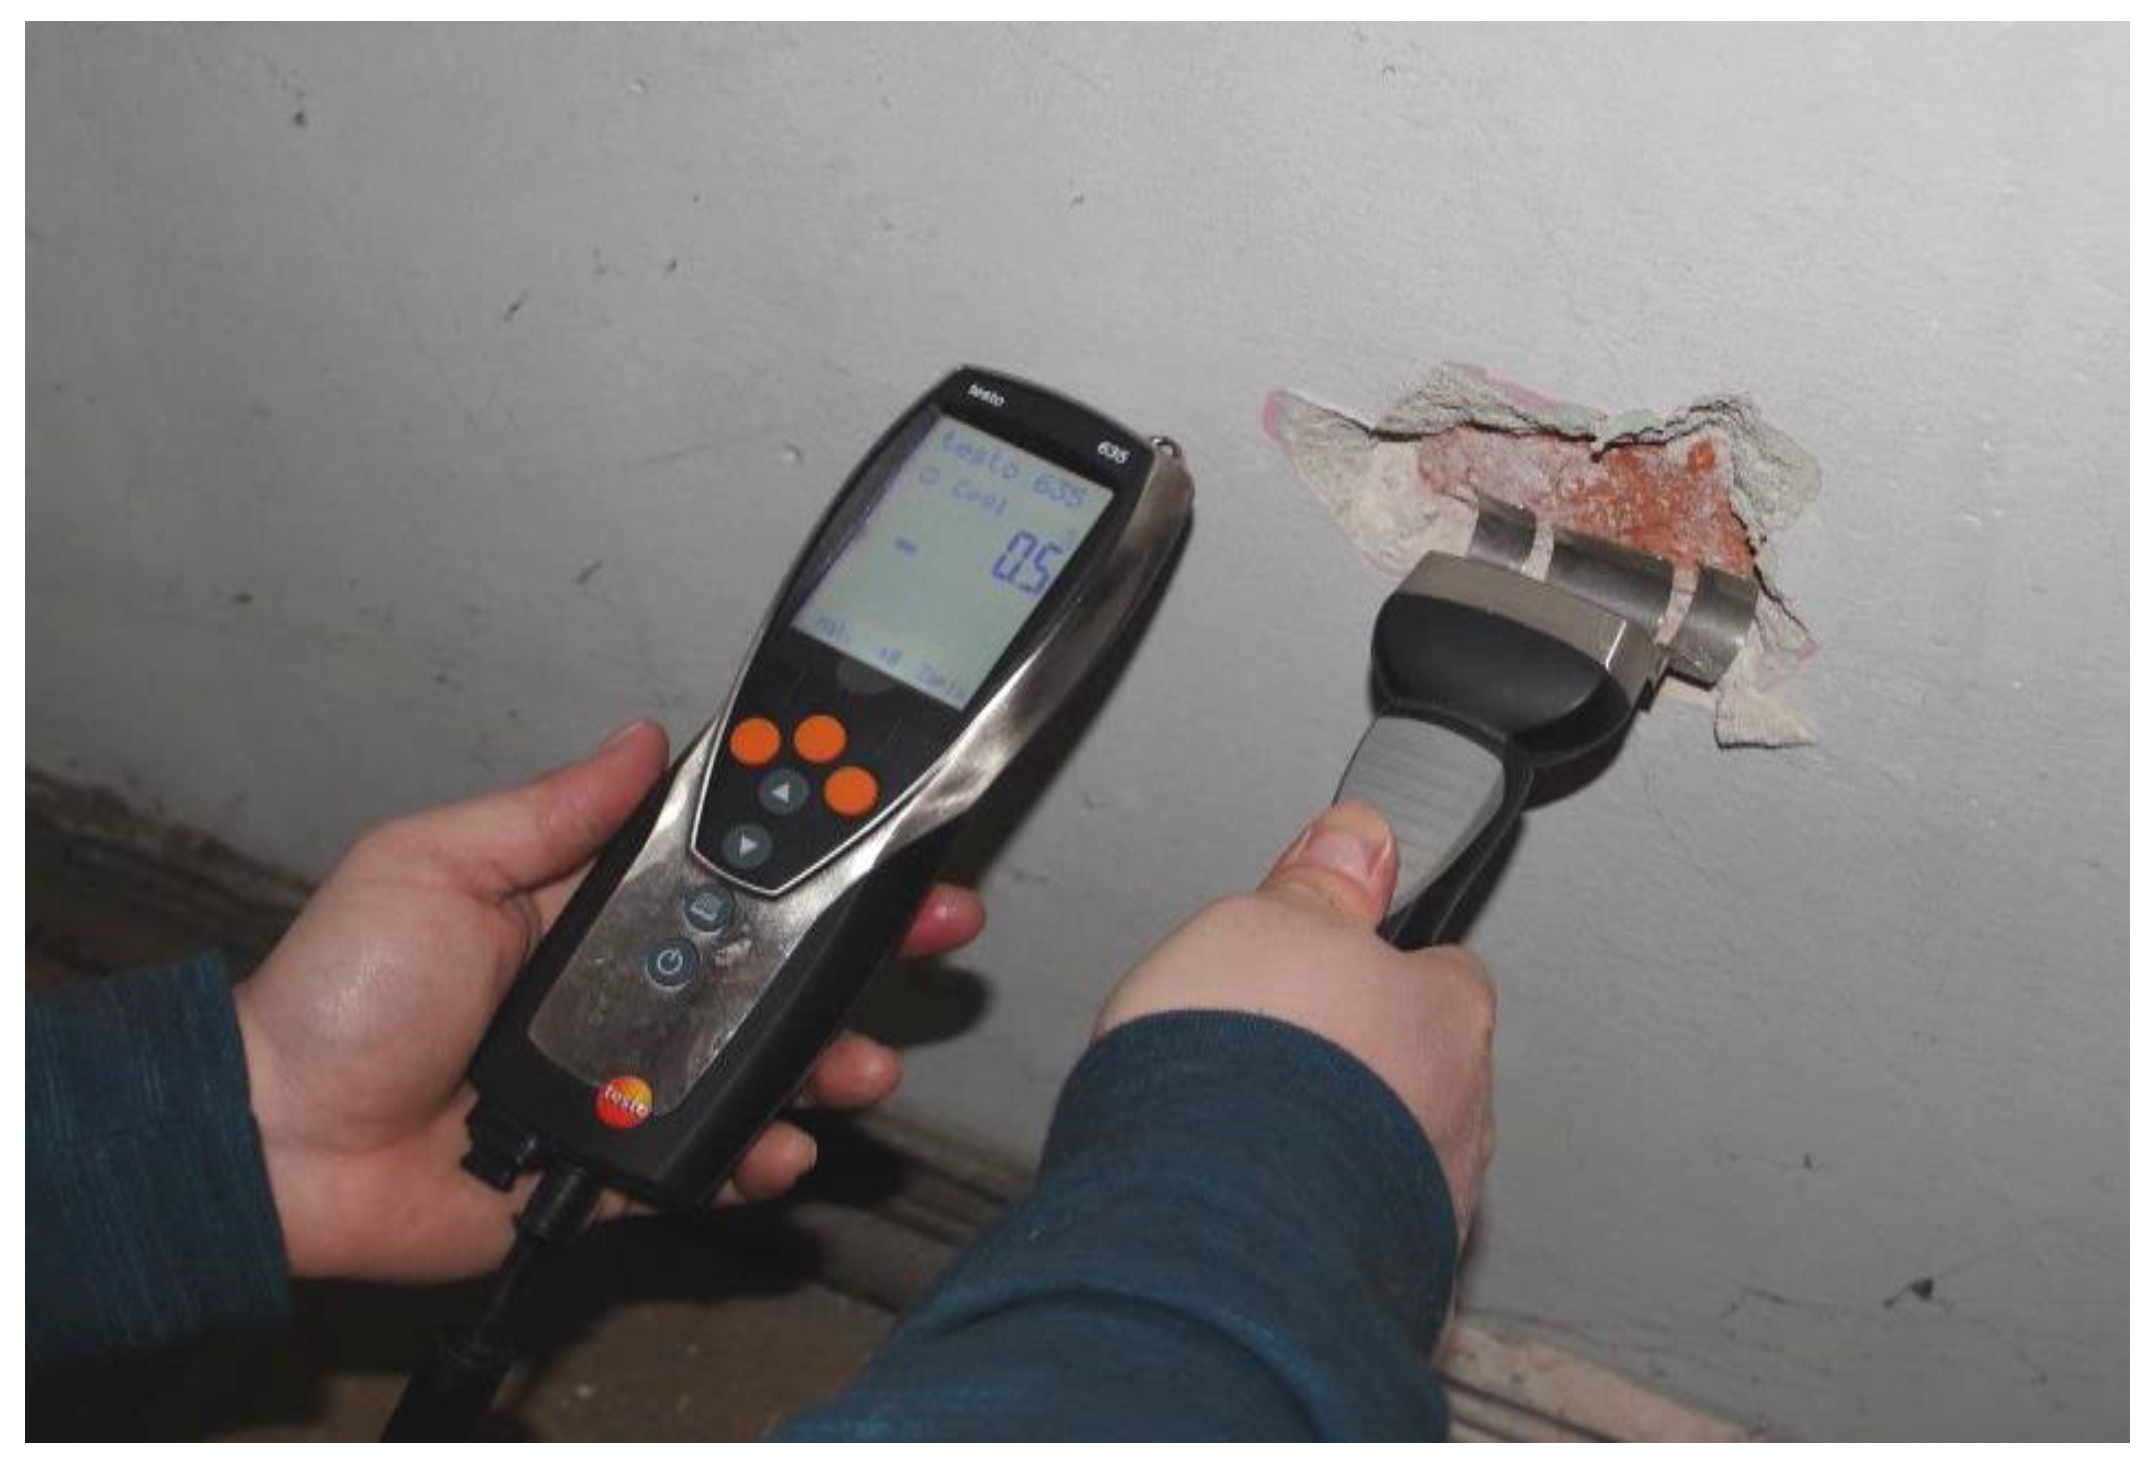
3.3.1. Wall Mass Moisture Measurement

Partition moisture measurements were performed using a TESTO 635-2 temperature meter and moisture meter with a measurement probe (Table 1).

Climate Conditions during Measurement

Outdoor and indoor air temperature readings were taken during the tests (Table 2).

Testing Methodology

The tests outlined below were performed following the procedure included in block A, involving non-destructive tests for moisture and internal and external material capillary absorptivity measurements.
Prior to performing the measurements, the material for which the moisture is to be measured must be selected on the device’s interface. The measurement is performed by touching the tested surface with the probe. The device presents results in the form of the percentage of moisture content detected within the material being tested. External wall moisture measurements on the floors listed by the building’s administrator showed that the water content of the structural layer did not exceed permissible values, i.e., 3% for solid brick walls. The highest reading obtained was 0.5% (Figure 6).
The material moisture content was measured using a non-invasive method because of the lack of consent from the owners for destructive testing (taking a sample of the material). The TESTO device was used for the measurement.
The operation of the device is based on the dielectric method, i.e., using the phenomena involving changes of the electrical capacity of the material along with the change in its moisture content. Due to the large differences between the dielectric constant of water and those of anhydrous substances, it is possible to assume proportionality between the dielectric constant and the moisture of the tested material.
During the performance of moisture measurements (brick, plaster), we also measured air humidity. When entering material moisture values into the software, we accounted for indoor microclimate parameters for each space. The impact of air humidity on the hygrothermal state of materials is accounted for continuously in a non-stationary linked analysis of thermo-humidity processes.

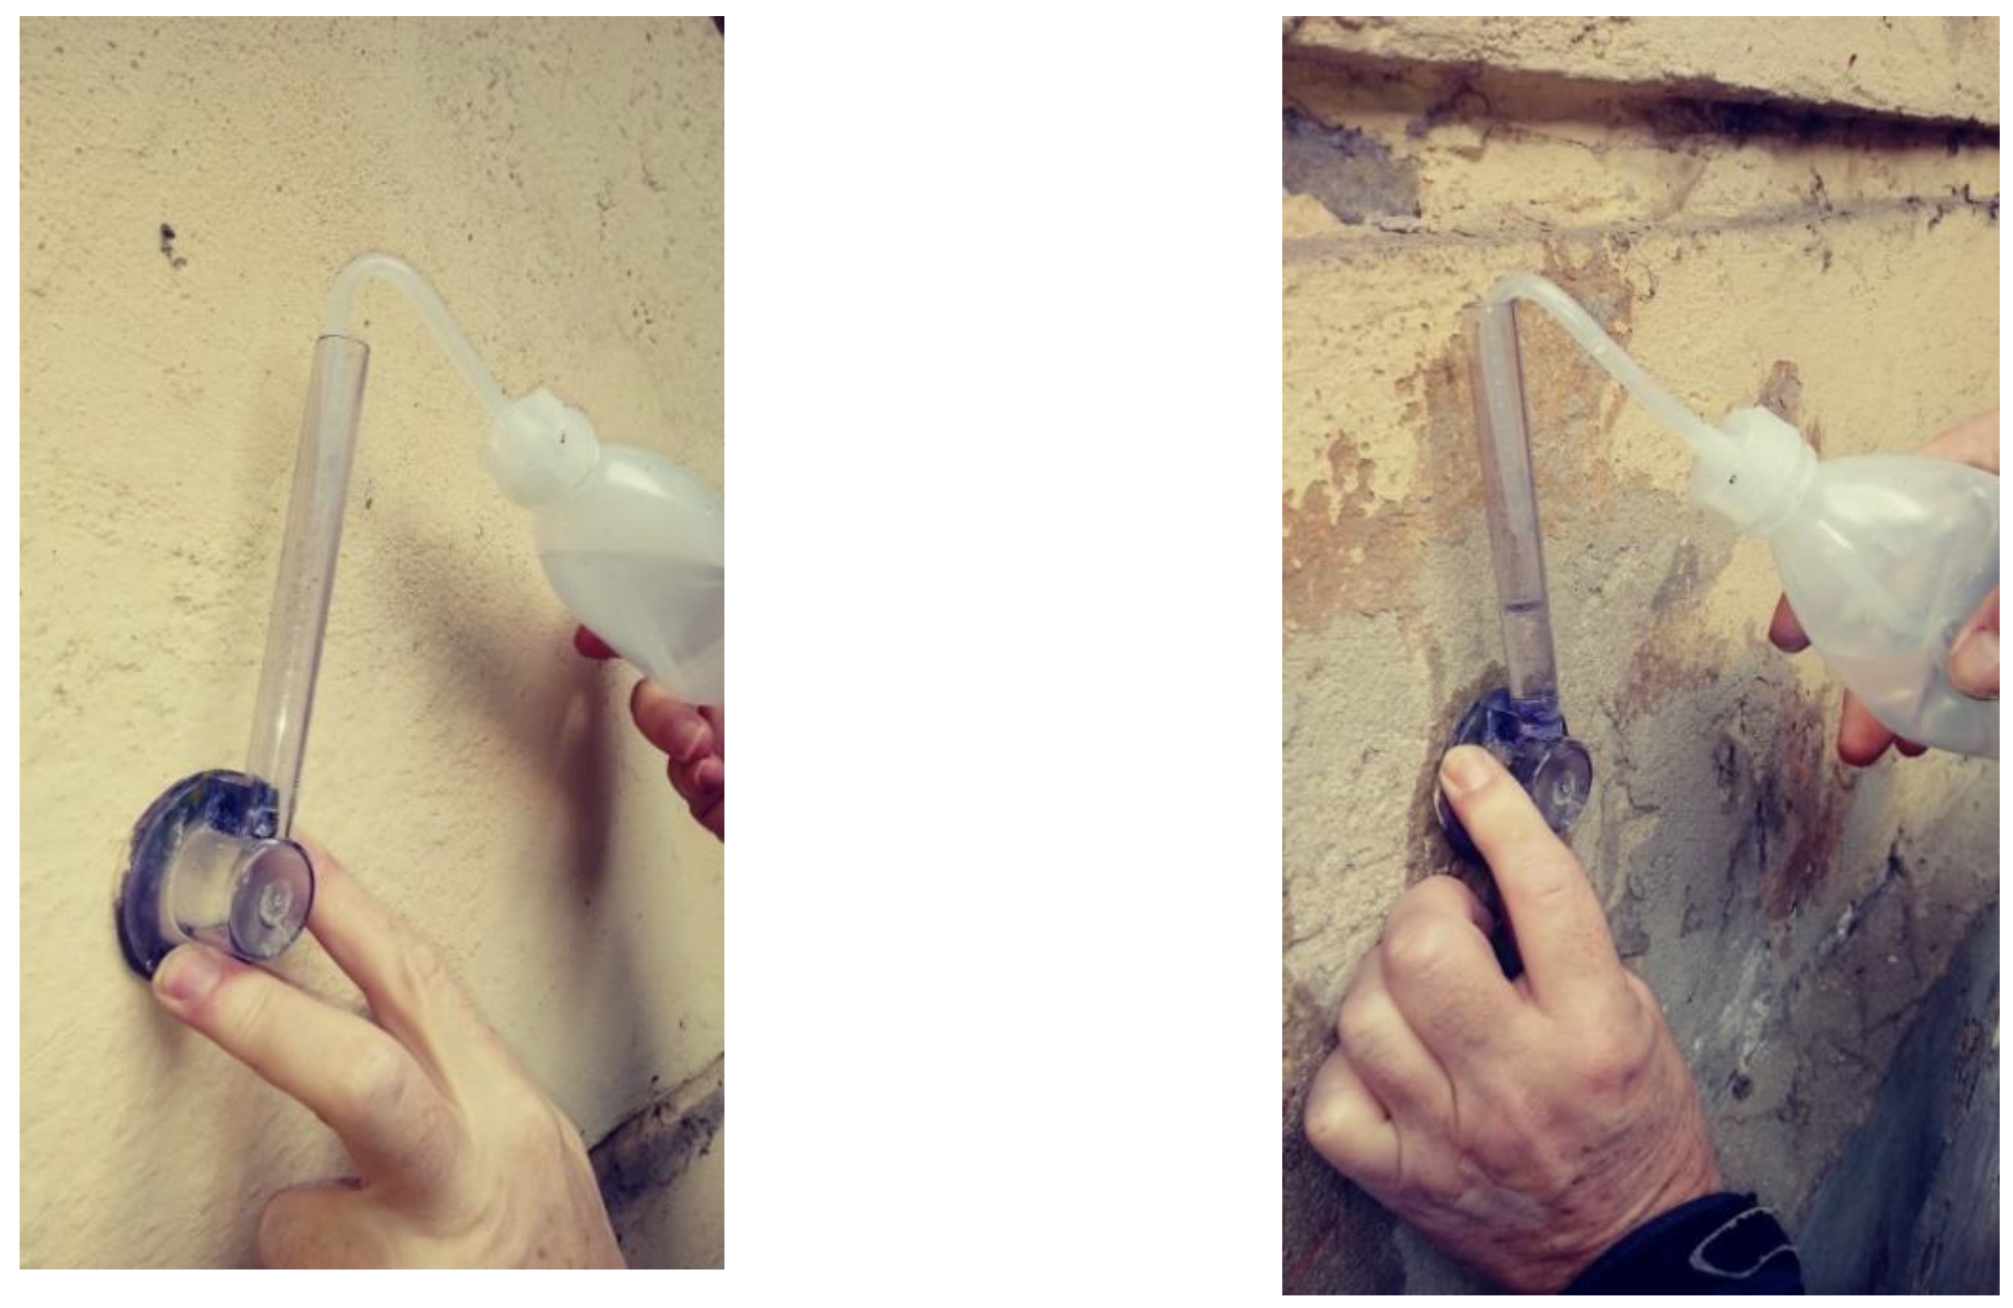
3.3.2. Solid Brick Wall Absorptivity Measurement

Water absorption via capillary action testing for the building’s solid brick walls was performed using a method employing the Karsten vial (Figure 7). This is a method that uses a vial comprising a glass bell with a diameter of ca. 30 mm, which is connected to a calibrated pipe with a volume-based scale. This device enables testing on both horizontal and vertical surfaces. This test allows the simulation of the effects of rain carried by strong wind, which exerts pressure on the surface of the facade.
The study was performed for a fragment of the external wall of the frontal facade. The capillary water absorptivity (water absorption coefficient) measurement for external plasters showed the absorptivity to be within the range of 0.5–1.0 (kg/m2h0.5). This result means that the external plaster was characterised by low surface water absorptivity, which is a highly favourable condition for applying thermal insulation from the inside. The determination of the water absorptivity of the walls is required by the WTA-Merkblatt 6-4 2009–05 document [27] and the DIN (Deutsches Institut für Normung) 4108-3 standard [28]. The procedure outlined in the WTA document allows a simplified (graphical) assessment of the selection of a material’s thickness and type in the context of an extant partition’s water absorptivity and that of its external layer.

3.3.3. Thermovision Diagnostics

Thermography is an effective research tool that supports the assessment of the conditions of a building’s thermal insulation, particularly in detecting defects in the form of linear and point thermal bridges, thermal insulation breaches, heavy moisture, or air infiltration at joints. This test can be used to diagnose and assess the distribution of internal and external surface temperatures and was a significant part of the testing procedure in block B (qualitative and quantitative thermovision tests).
Thermovision diagnostics were performed using a Flir B-355 thermal imaging camera. The tests were performed as stipulated in ISO 6781 [29].
The thermovision device enabled the visualisation of the temperature field on the surface under study in the form of a thermal image (a thermogram).
Nominal data:
Temperature measurement rangefrom −20 °C to 1200 °C
Camera angle25° × 19°/0.4 m
Resolution320 × 240
Thermal resolving power (at 30 °C) 0.05 K
Spatial resolving power1.36 mrad
Spectral sensitivity interval7.5–13 m
Climate conditions during measurement
Air temperature readings during the test16.5–17 °C
The relative indoor air humidity measured at a height of ca. 1 m above the floor was 50%. Figure 8, Figure 9 and Figure 10 present examples of thermographic analysis for the frontal facade and the facade from the side of the courtyard, which were performed as a part of the procedures outlined in block B.
Around a dozen thermograms of the building were taken from the outside, with a particular focus on places containing cantilevered balconies so that it would be possible to determine the actual structures of the architectural elements, which is essential for external envelope thermal protection, such as during the performance of further procedures in block B (FEM (Finite Element Method) thermal analysis). The thermogram shown in Figure 10 was selected as a representative example for comparison with calculations.

4. Results and Discussion

The authors performed an analysis of architectural elements as a part of block B, utilising data collected while carrying out procedures outlined in block A. The first part of the analysis involved identifying the details of the structure of a fragment of the building, paired with determining their technical condition. The second part involved carrying out a procedure from block C—the thermal assessment of a given element, focusing on alternatives of internal and external insulation that had been designed for it.

4.1. Data Assumed for the Analysis of Architectural Elements

The thermal analysis included:
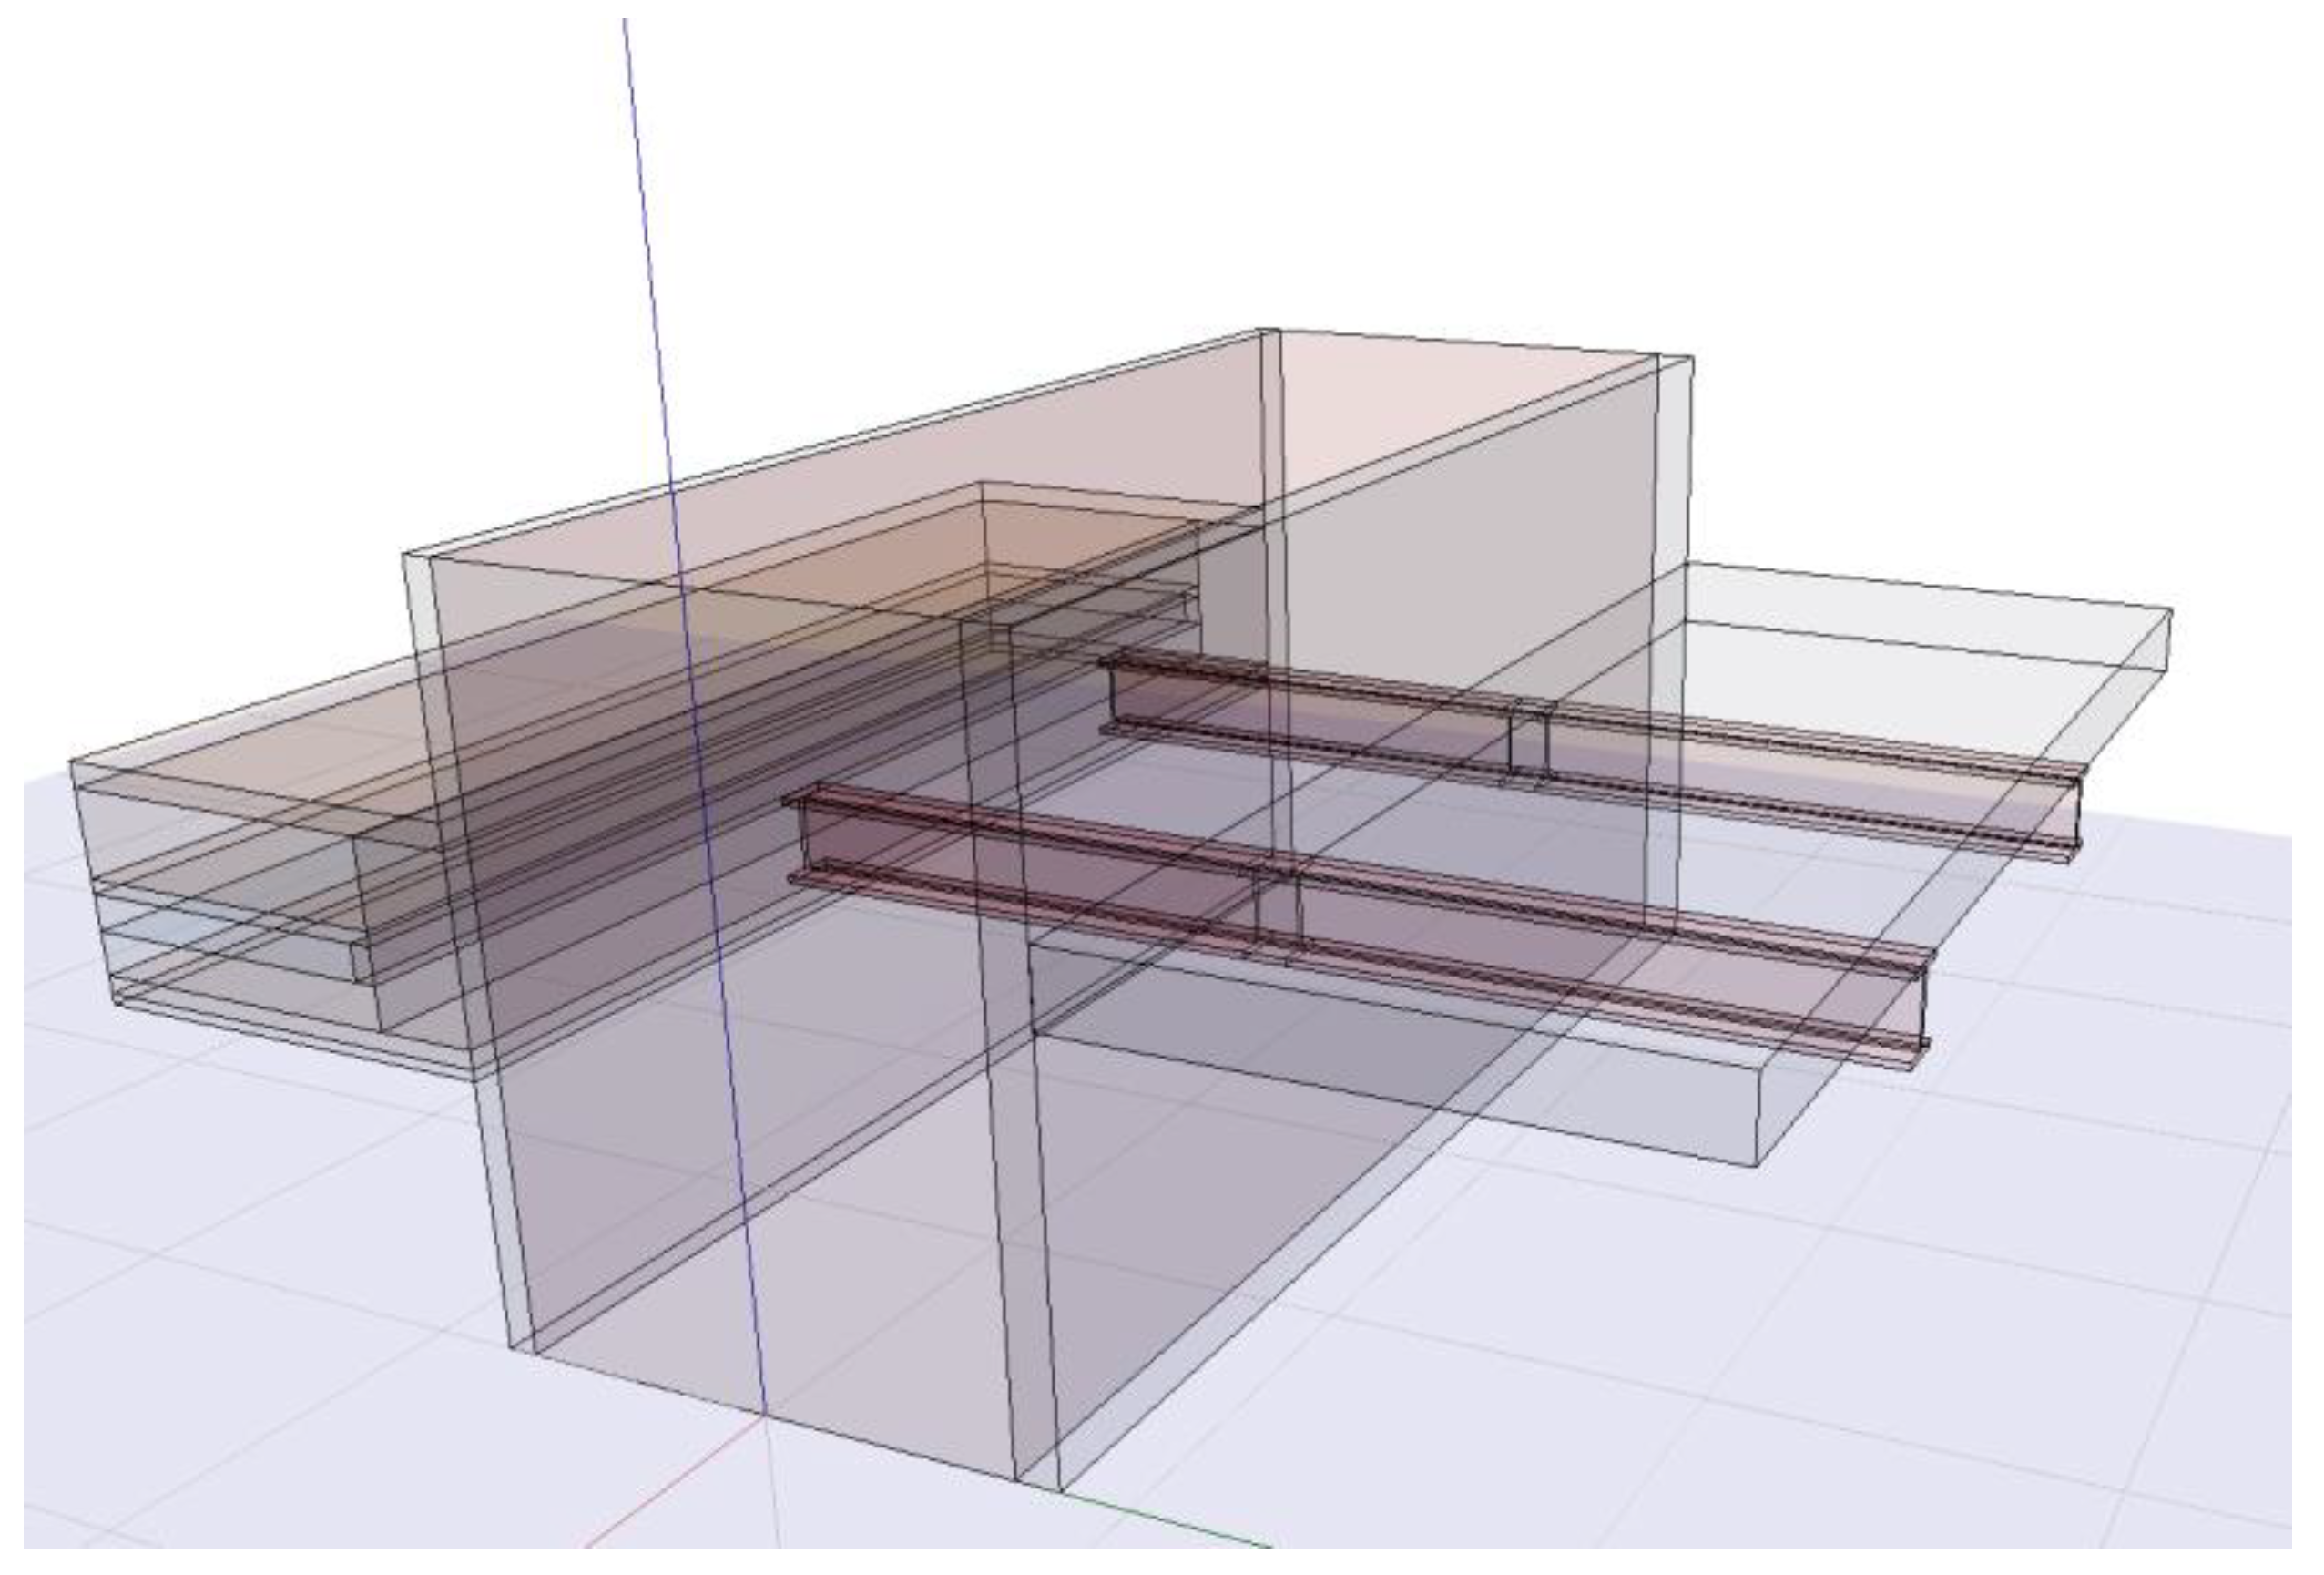
  • Thermal bridge assessment, i.e., analysis of the elements of an external wall and deck, along with a balcony secured on metal cantilevers anchored within said wall (thermal bridges detected on both the frontal and courtyard facades);
  • Temperature distribution field changes for the extant state;
  • Analysis of changes to the structure of the envelope after the application of thermal insulation.
Due to a lack of information concerning the elements under study and the limited capacity to perform the necessary stratigraphic testing, a hypothesis was formulated as to the manner and depth of the anchoring of the balcony’s steel beams in the building’s external wall. The identification of the manner of anchoring and the anchoring depth was highly significant in applying thermal insulation to external walls on both the courtyard and street sides.
For calculation purposes, it was assumed that the steel and the concrete or stone were inserted through the entire depth of the brick wall without contacting the building’s interior; they were not inserted into the structure of the wooden deck. This insertion is sufficient due to the static system of the supporting element. The architectural element assumed for analysis was recreated based on a concept for this type of element presented in a book describing structural solutions for buildings from this period [30]. Figure 11 presents a scan of these solutions [30].
The concept used for the design of the anchoring of the steel beams in the external wall was verified using the following methods:
  • Thermal imaging measurements of the building’s facade temperature distribution field were taken under the following conditions:
    External temperature: 0–1 °C;
    Indoor temperature: 16–18 °C.
The remaining measurement conditions were the same as those stipulated in EN 13,187 [31] for the thermal performance of buildings, involving qualitative detection of thermal irregularities in building envelopes using the infrared method. The indoor and outdoor temperature difference (ca. 15 K) met the standard criteria [31]. The final verification of the compliance of the architectural element under analysis was performed using numerical methods, as presented in block B for numerical analysis.

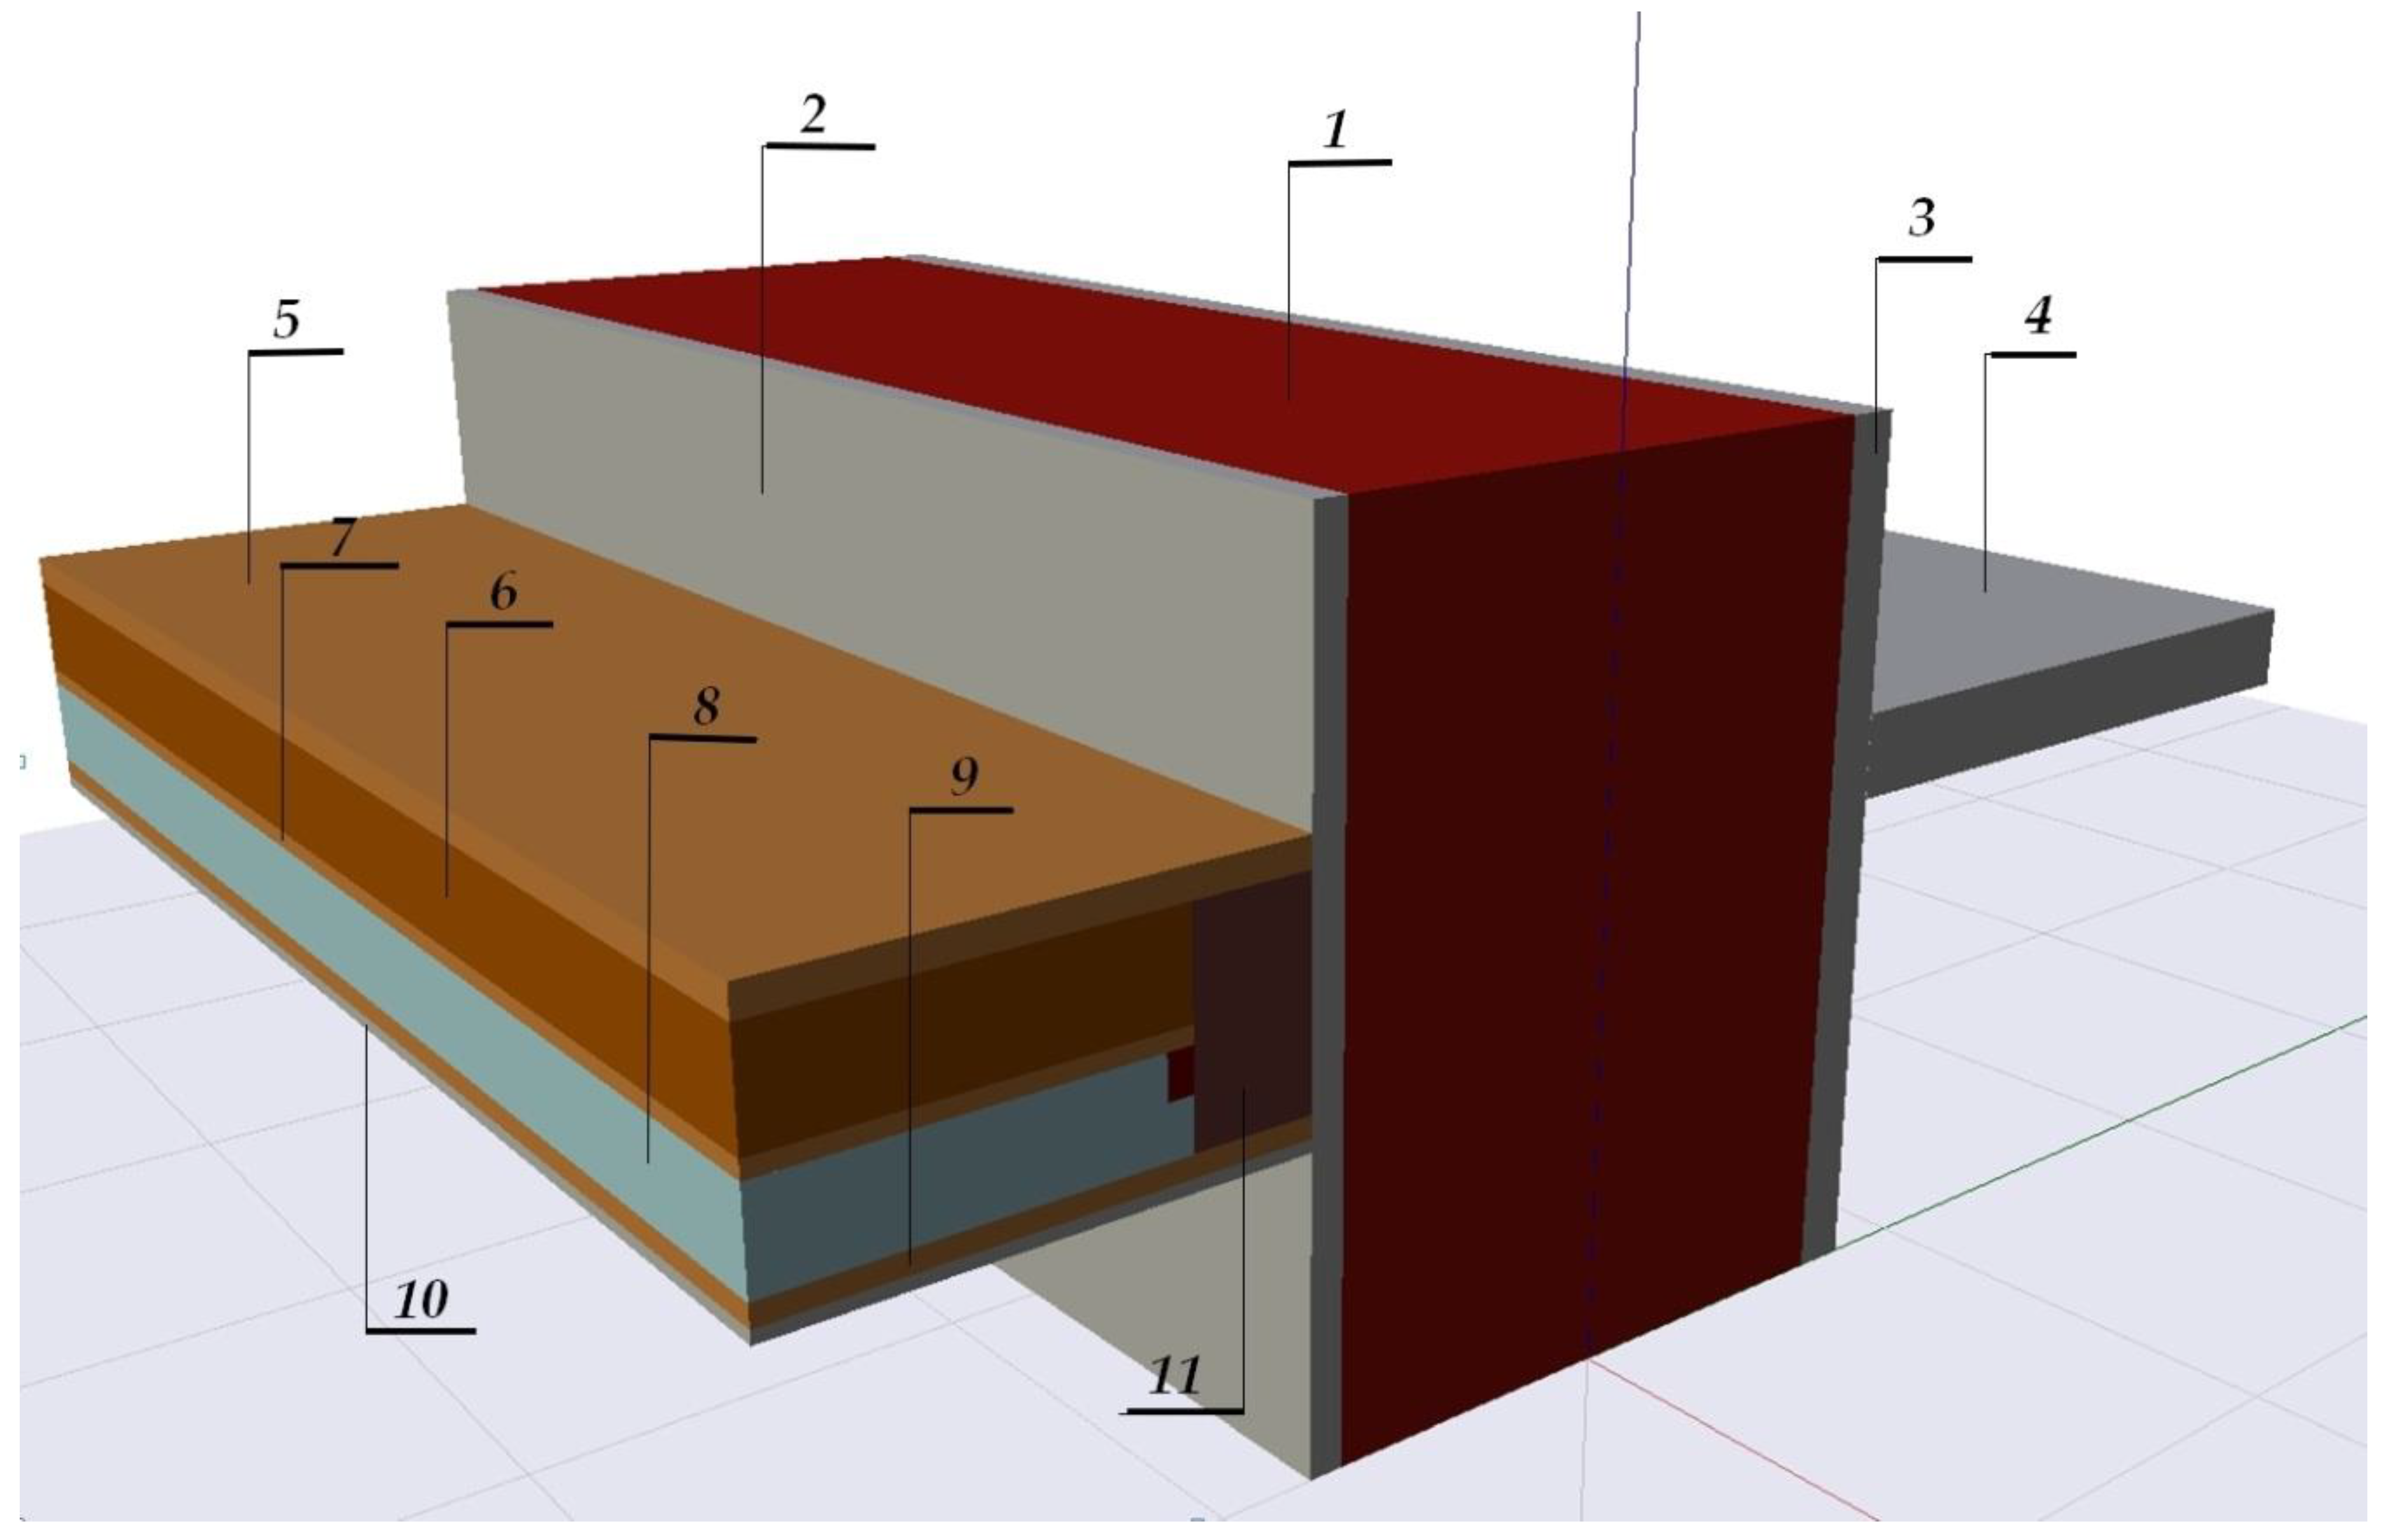
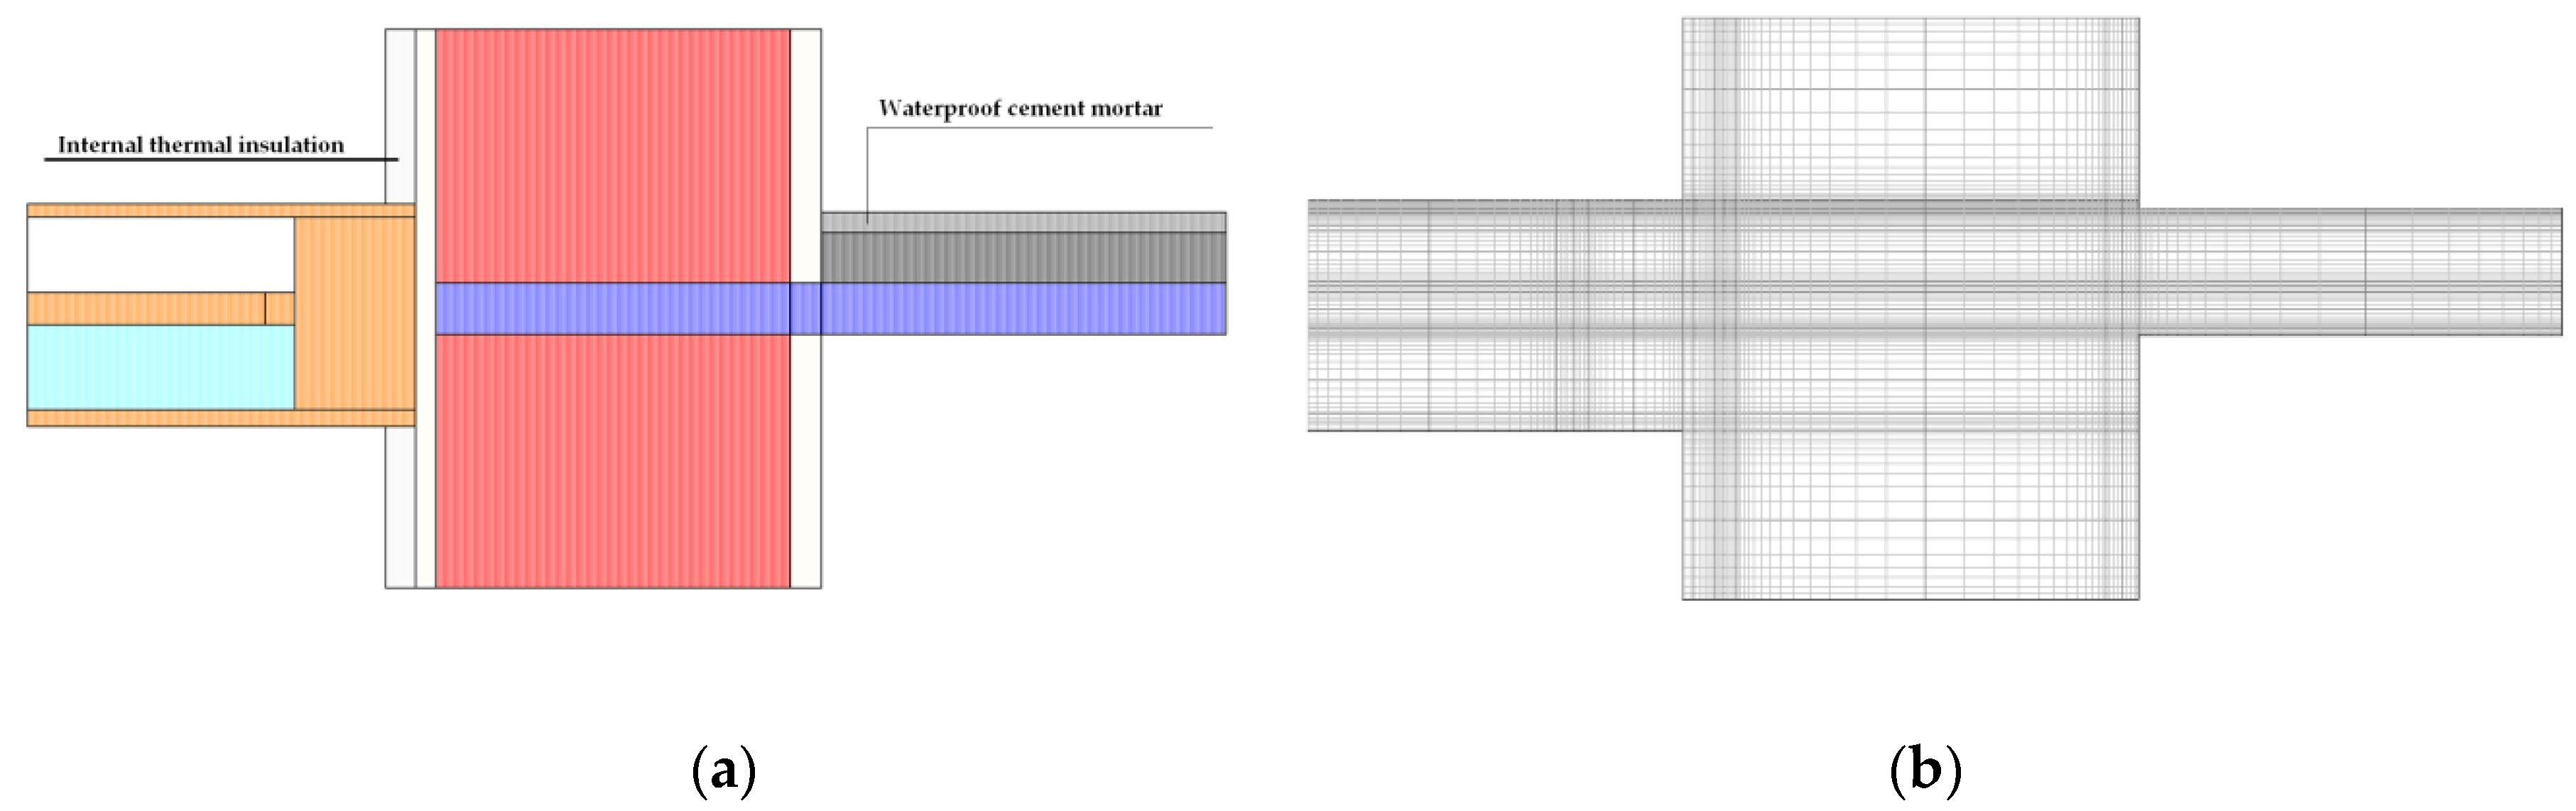
4.2. Numerical Thermal Analyses of the Uninsulated and Insulated Walls, Assumptions, and Materials

The literature features numerous methodologies for the design of internal insulation [32,33,34,35,36]. Many publications have a purely practical approach and can be successfully applied in engineering [36,37,38,39]. They list graphical solutions for the design details and basic information about the thermal insulation thickness and type selection, along with general technological guidelines. These guidelines appeared to be insufficient for designing the application of thermal insulation to an entire building with a complex geometry and functional programme, as assessed during a comprehensive hygrothermal analysis. It should be noted that the outcomes of these solutions can lead to considerable irregularities in the form of moisture and mould contamination in the envelope when an improper approach is used. Furthermore, improperly performed renovation work can result in problems during occupancy [40,41].
The thermal insulation of walls is expressed via the thermal resistance R (m2K/W), calculated as stipulated in State Building Standards Of Ukraine [42] and ISO Standard 6946 [43].
It should be noted that in the case of historic buildings, thermal retrofitting must be performed following the “first of all” principle—it should be economically rational and account for solution optimisation, while preserving the previous character of the building and its historical assets.
Accounting for these guidelines and those mentioned previously for applying thermal insulation from the inside of a building [27,28,32], an insulation material thickness of 5 cm was assumed.
For the purpose of diagnosing internal partition structures using thermovision testing, we assumed that the conditions for said testing were also the boundary conditions used for performing calculations using MES.
The calculation alternatives presented, including alternative I, are the result of the block B procedures, while alternatives II and III relate to implementing the procedures from block C after the initial design of the thermal insulation.
A calculation model of a fragment of the building featuring a balcony slab was formulated (Figure 12) and calculations were performed for the following alternatives:
  • Alternative I—balcony resting on steel cantilevers, uninsulated external wall (Figures 15–18);
  • Alternative II—balcony resting on steel cantilevers, wall insulated from the inside (Figures 19–22);
  • Alternative III—balcony resting on steel cantilevers, wall insulated from the outside (Figures 23–26).
For alternatives II and III, the authors analysed the impacts of point thermal bridges on wall insulation. The analysis was performed using software for the numerical analysis of 3D temperature distribution fields in construction elements. For calculation purposes, the authors assumed a double-T profile with a height of 100 mm and a total length of ca. 160 cm, with the elements set 80 cm apart, with a concrete slab width of 80 cm and a brick wall thickness of 70 cm. In addition, external and internal plaster thicknesses were assumed at a combined thickness of 8.5 cm. A typical wooden beam deck was assumed with a blind ceiling, which is typical of nineteenth and twentieth century townhouses. Wooden flooring was assumed, with the ceiling being made of plaster on reed with a thickness of ca. 3 cm.
Material data were taken from ISO 12524 [44], while material thicknesses were obtained via testing conducted following procedures from block A. Standard boundary conditions were assumed depending on the direction of heat flow following the ISO 6946 standard.
Geometric models and results shall be presented in figures on the following pages (Figure 12, Figure 13, Figure 14, Figure 15, Figure 16, Figure 17, Figure 18, Figure 19, Figure 20, Figure 21, Figure 22, Figure 23, Figure 24, Figure 25 and Figure 26). A model of the architectural element was designed as per ISO 10211 [45].
The software used to analyse the temperature distribution field in the architectural element under study operates using Fourier’s phenomenological model of material continuum, which is expressed via Equation (1) [46]:
q = −k ∇T
where k denotes the heat transfer tensor, q is the heat transfer density (W/m2), and T (K) denotes temperature.
For calculation purposes, it was assumed that all materials are isotropic. This enabled the λ thermal conductivity values to be adopted for every material. For wood, the authors accounted for thermal conductivity changes associated with fibre orientation, i.e., λx ≠ λy i λy = λz, and used λx = λy = λz for all other materials.
Other typical factors involved in studying temperature distribution fields in construction elements are the assumed lack of internal heat sources and the presence of a specific heat flow. These assumptions considerably simplified the calculations, allowing the use of Laplace’s equation in the following form [47]:
2 x   T ( x , y , z ) + 2 x T ( x , y , z ) + 2 x T ( x , y , z ) = 0
Equation (2) sufficiently describes the temperature distribution field for the purposes of the study. The boundary conditions assumed were: mixed (Robin) boundary condition T(0) + cT’(0) = a, T(L) + dT’(L) = b, with (x,y,z = 0) at the start and (x,y,z = L) at the end of the model.

4.3. Numerical Analysis Results

The results of numerical calculations are displayed in the form of temperature distribution fields with temperature indications in key areas (Figure 15, Figure 16, Figure 17, Figure 18, Figure 19, Figure 20, Figure 21, Figure 22, Figure 23, Figure 24, Figure 25 and Figure 26). Based on the calculated temperatures, one can perform further calculations, including f Rsi indicators for states both prior to and after the application of thermal insulation.

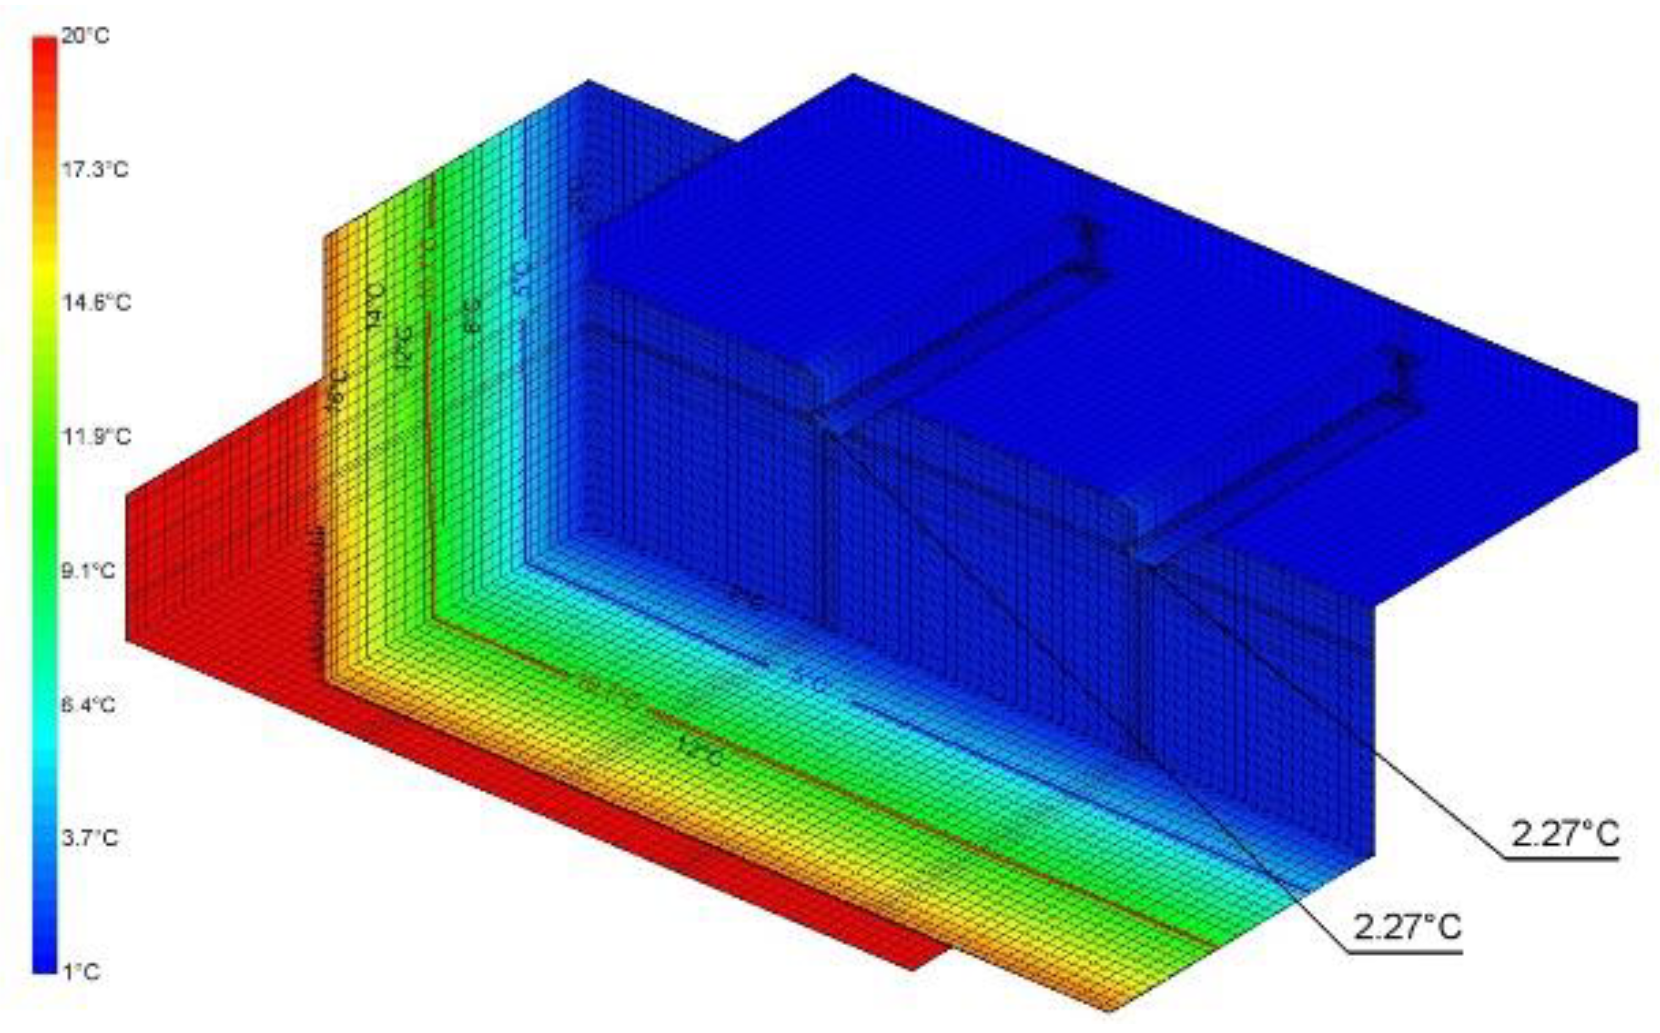
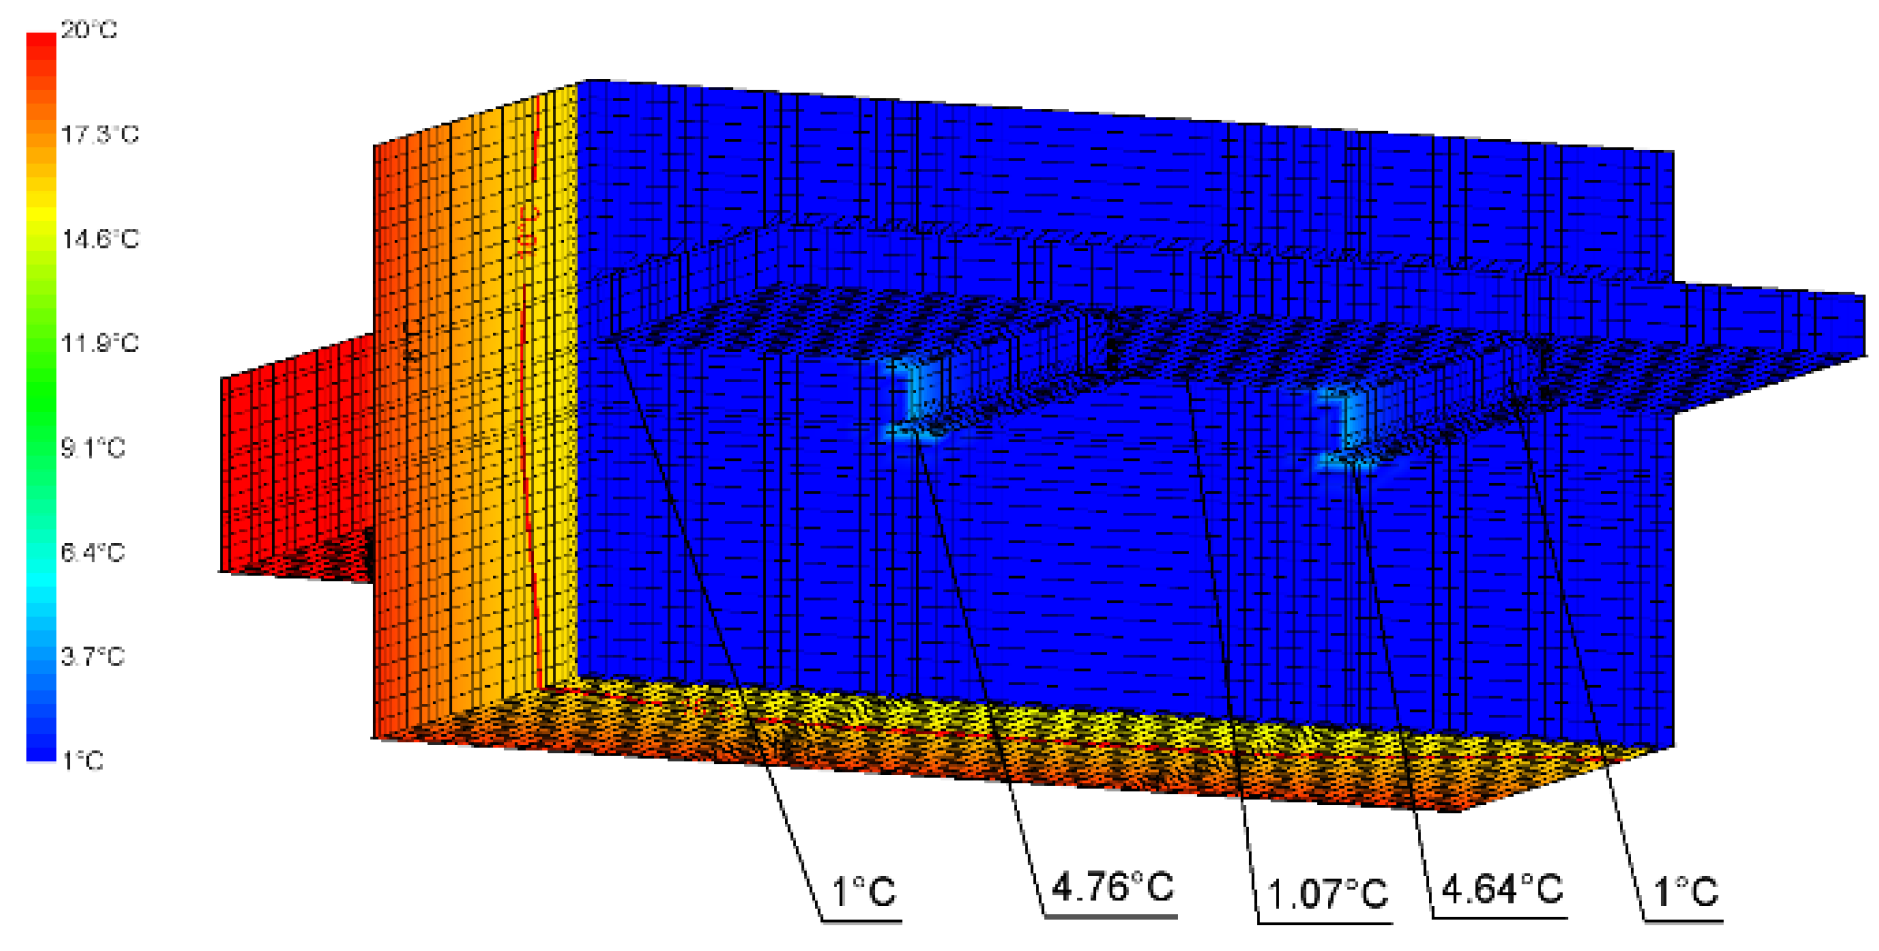
4.3.1. Alternative I—Extant State

The results of the numerical analysis for the existing state are shown in Figure 15, Figure 16, Figure 17 and Figure 18.

4.3.2. Alternative II—Wall with Thermal Insulation Applied from the Outside

The results of the numerical analysis for the variant with external insulation are shown in Figure 19, Figure 20, Figure 21 and Figure 22.

4.3.3. Alternative III—Wall with Thermal Insulation Applied from the Inside

The results of the numerical analysis for the variant with internal insulation are shown in Figure 23, Figure 24, Figure 25 and Figure 26.
Below is a presentation of some of the results, which can be used as guidelines for designers to select the final thickness and for placement of new envelope thermal insulation.
The calculation results regarding the impact of the placement of the insulation layer on the value of the point thermal bridge and for heat loss within the architectural element area are as follows:
  • For the starting model, the point thermal transmittance was χ = 0.0667 (W/K);
  • For the alternative model featuring internal insulation, heat flow through the partition decreased, but the point thermal transmittance value increased to χ = 0.1575 (W/K);
  • For the alternative model featuring external insulation, the value of the heat flow through the partition dropped significantly when compared with alternative II, while the impact of the point thermal transmittance was negligible, as it had a negative value of χ = −0.3731 (W/K).
As an additional element featured in procedures featured in block B, namely the architectural element analysis, the authors performed an analysis of the concordance of the numerical calculations for the assumed internal structure of the selected fragment (balcony supported by cantilevers) and compared them with calculations.
Table 3 features a comparison of calculation results and measurement readings. The authors used thermograms taken while performing procedures from block B. The temperature distribution field for the courtyard-side facade was used as an example (Figure 10).
The conclusions drawn from thermal calculations are presented below:
  • The presupposition regarding the anchoring of the cantilever within the external wall was proven to be correct. Further thermal and moisture calculations utilised the model assumed for alternative I;
  • The differences between measurement readings and values obtained from calculations had a number of causes:
  • The assumption of material characteristics was based on data presented in the literature, which may deviate from actual characteristics;
  • Measurement errors can occur in thermograms, including environmental interference;
  • Errors can occur in thermogram analysis, i.e., an imprecisely assumed surface emission coefficient;
  • The errors were not significant (values of around 0.1 K) and had no practical impact on the temperature distribution field results obtained using the numerical method;
  • It can be assumed that the remaining thermal calculations performed using numerical methods for walls with thermal insulation sufficiently described the expected reaction of the external partition to internal or external insulation;
  • The geometric model developed for the purposes of performing thermal calculations can be used for further simulations associated with analysing water content increases in the selected external wall fragment.

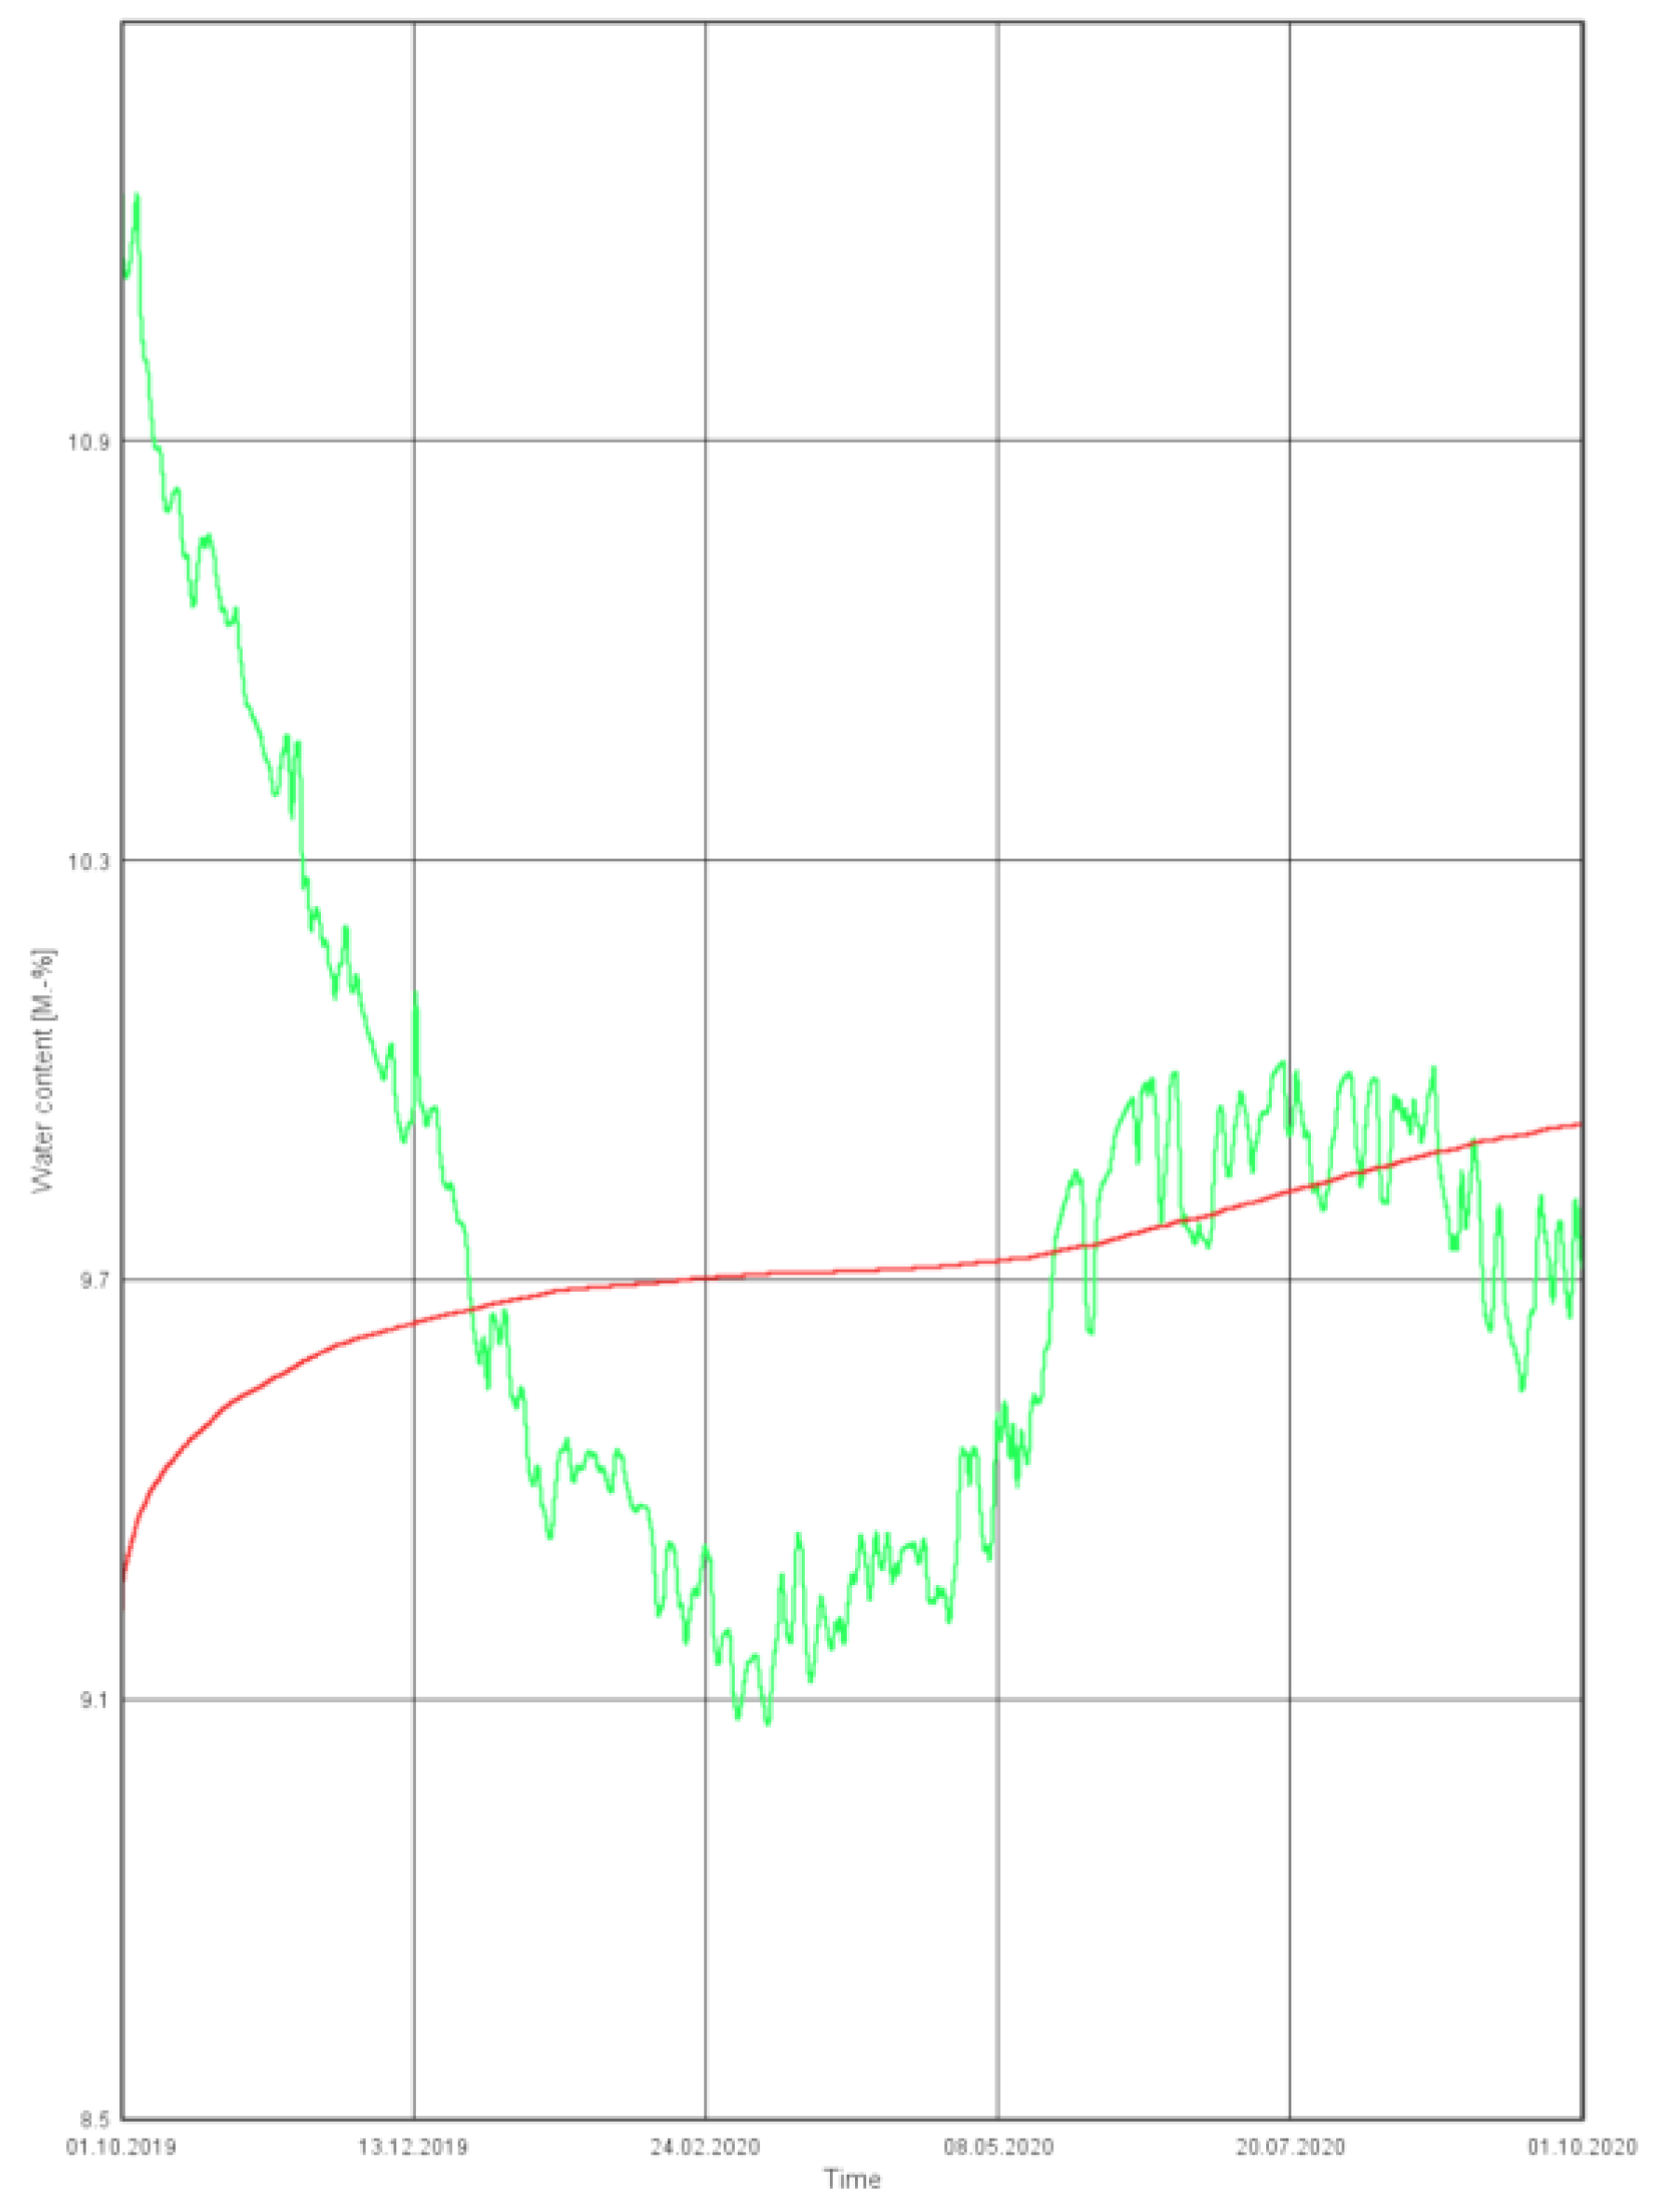
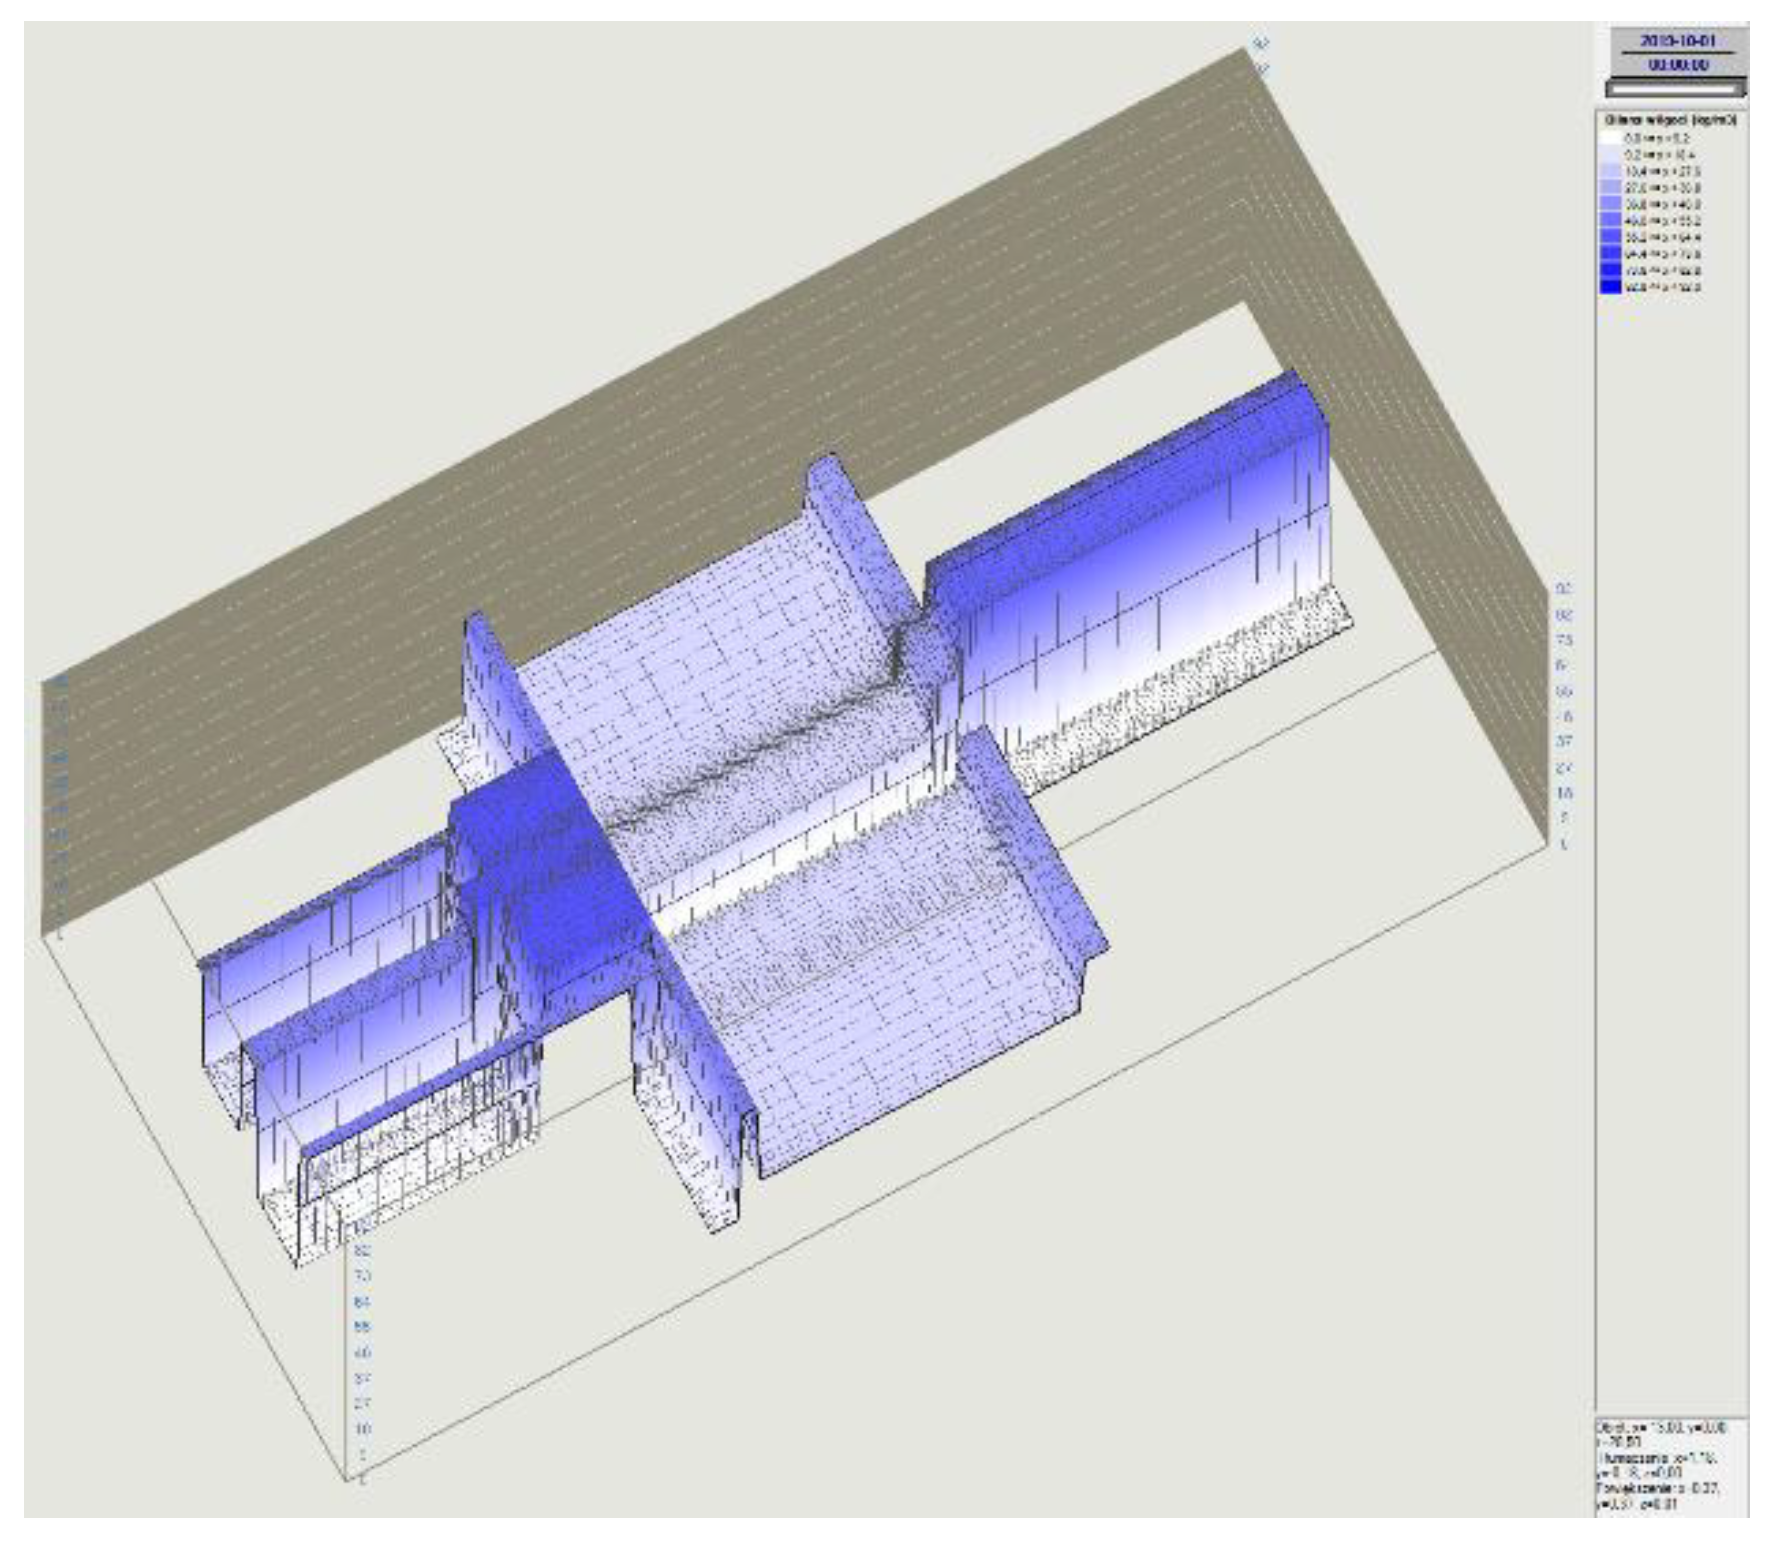
4.4. Post-Retrofitting Envelope Behaviour Simulation

The authors are of the opinion that prognosticating the behaviour of the envelope after thermal retrofitting in terms of changes in water content in a part of the wall structure, plasters, and stuccoes is a major problem in the thermal retrofitting of historical buildings from the standpoint of their further occupancy. The primary innovative element featured in the diagnostics procedure is the fact that the proposed diagnostics model, block C, is not confined to diagnosing the extant state, but was extended to post-retrofitting state diagnostics. This diagnostics procedure can be performed on the basis of prognosticating changes in water content in each selected fragment of the entire building. The selection should involve consultation with the conservator.
To perform water content analysis (over an assumed occupancy period of 1 year) in selected surfaces within the model, the authors used WUFI (Wärme Und Feuchte Instationär) 2D v.4.1. software. WUFI 2D v.4.1. enables the analysis of two-dimensional heat and mass flow (water, humidity, and water vapour) in a range of construction elements. A period of one year was assumed for the sample analysis. Table 4 presents material data obtained via block A, which was necessary to perform the simulation.
Numerical analyses were performed using the WUFI 2D program. They were based on the conjugate differential equations of heat and mass transport under real climatic conditions. Hygrothermal transport is described by Equations (3) and (4), respectively.
  • Heat transport (Equation (3)):
    H ϑ · ϑ t = · ( λ ϑ ) + h v · ( δ p ( φ p sat ) )
  • Mass transport (Equation (4)):
    dw d φ · φ t = ( D φ φ + δ p ( φ p sat ) )
where dH/dϑ is the moist building material heat storage capacity (J/m3K), dw/dφ is the building material moisture storage capacity (kg/m3), λ is the moist building material thermal value (W/m·K), Dφ is the building material liquid conduction coefficient (kg/m·s), δp is the building material water vapour permeability (kg/m·s·Pa), hv is the water evaporation enthalpy (J/kg), psat is the water vapour saturation pressure (Pa), ϑ is the temperature (°C), and φ is the relative humidity.
The validation of the calculation method applied in the WUFI software was conducted by the Fraunhoffer Institut and is discussed in the materials featured on the Fraunhofer Institute for Building Physics website.
Material data were assumed as per the internal material database of the WUFI software and the relevant standard [44]. In any other case, one should perform stratigraphic studies and collect samples to determine the material characteristics, i.e., mass moisture and other factors.
A level of technological moisture of around 3% was assumed for all materials (as per material parameters from the WUFI material database).
The external climate was set following readings from the Lviv meteorological station. The internal climate was defined as per EN 15026 [48] as a normal humidity load.
In the paper, the authors presented selected analysis results for alternative II, i.e., the details of the anchoring of a balcony and a wooden deck to an external wall with a thickness of 70 cm, with thermal insulation in the form of light aerated concrete with a thickness of 5 cm applied from the inside. Aerated concrete is a material that is widely used as internal thermal insulation. It should be mentioned that the authors, based on their own experience, endeavoured to develop an insulation material based on polystyrene regranulate, which can be used for this form of insulation. The first applications of this material are currently being tested on the domestic market [49,50,51]. Figure 27, Figure 28, Figure 29, Figure 30, Figure 31 and Figure 32 demonstrate numerical calculation results, illustrating changes in the water content in selected partition planes.
The results of the simulation have been presented in graphical form as water content change graphs for major layers of the analysed partition fragment (Figure 28, Figure 29 and Figure 30), as well as sample water content values throughout the entire model, which were visualised in pseudo-3D form (Figure 31 and Figure 32).
Water content values expressed in kg/m3 or mass humidity values expressed in % for each material were marked on the vertical axis (Y) in every figure presenting calculation results.
The conclusions from the water content change simulations in elements of the wall and deck after applying insulation are as follows:
  • Irrespective of the placement of the insulation layer, there was no water content gain in the extant brick wall and plasters (Figure 29), provided that the indoor air humidity was maintained at a level of 50%;
  • Regardless of the placement of insulation, a slight water content gain in the deck’s wooden beams can occur (Figure 30). The authors consider performing in situ moisture measurements of wooden deck structural elements prior to the commencement of retrofitting works to be mandatory. Provided there is a technical possibility to do so, it is recommended to insert a strip of bitumen paper along the entire beam anchoring point. Incorporating the guidelines (revisions) into the design shall ensure the proper functioning of the thermal insulation, without worsening the technical condition of the extant partition.

5. Conclusions

Directive 2018/844 for the energy performance of buildings indicates that we should seek solutions to improve the technical condition of heritage sites while improving their energy performance and showing the utmost respect towards and protecting national heritage. This document specifies general directions for European countries to follow to reduce energy demand, yet it does not list any procedures that should be abided by prior to making decisions about such action in reference to historical buildings and heritage sites.
The authors proposed a methodology for effective hygrothermal diagnosis. The presented algorithm, specifically its sections in the form of blocks B and C, are a novelty. The linking of in situ testing with numerical analyses that allow the prognostication of the envelope’s behaviour during its future use is an essential element of the proposal. In the analysed case study, these measures enabled the choice of the most favourable solution in terms of minimising heat loss and preserving architectural value, ensuring the further correct operation of the envelope (without water content growth in existing and newly designed layers) in the local climate.
Appropriate solutions should meet three main conditions:
(1)
They should improve the thermal insulation of walls while accounting for the developer’s financial means, with either a partial or complete elimination of linear and point thermal bridges. They should meet the country’s applicable regulations;
(2)
They should either maintain or improve the moisture state of the partition so as to avoid water content increases in brick wall structural elements and the adjoining structural elements of wooden decks, in addition to wall finishes (internal and external plasters), during the future occupancy of indoor spaces. It is recommended to perform a simulation for a reference period of 1–3 years. Simulation results should form the basis for necessary protective measures intended for elements in danger of accumulating excessive moisture;
(3)
Surface condensation on walls with internal insulation should be avoided.
Based on the presented results, it can be concluded that the thermal retrofitting measures should encompass the entire partition, with a particular focus on nodes and points of contact with other partitions. The analysis demonstrated that internal insulation improves the thermal parameters of walls (thermal resistance R [(m2K)/W]) but adversely affects conditions within thermal bridges, which were balcony slabs in the case under analysis. In places such as these, considerable increases in χ (W/K) point thermal bridge values and adverse changes in temperature distribution fields in steel beams can be observed (Section 4.3.). The results of the numerical analysis were verified using thermal vision testing, which was used as a quick thermal anomaly assessment tool on the wall systems under analysis to confirm their internal structure.
A lack of awareness of potential problems that can appear after thermal retrofitting procedures, as well as limited relevant literature and national guidelines, can lead to further risk of errors and defects. The low number of material solutions dedicated to such procedures is also a problem.
The authors, based on the presented case study, outlined key problems that can accompany the thermal retrofitting of historical buildings and plotted a direction for major research that can form the foundation for the assessment of the extant state and modernisation of Lviv’s historical architecture, as well as other similar buildings, without interfering with their historical structure during testing and over the course of their future use.

Author Contributions

Conceptualization, B.O.-K., E.R.-Z., M.F.-C. and T.S.; Data curation, B.O.-K., T.S. and A.M.; Formal analysis, B.O.-K. and T.S.; Investigation, B.O.-K. and A.B.; Methodology, B.O.-K., E.R.-Z., M.F.-C. and T.S.; Project administration, M.F.-C., M.Ż. and A.M.; Resources, A.B.; Software, B.O.-K. and T.S.; Supervision, E.R.-Z. and M.F.-C.; Validation, T.S.; Visualization, M.F.-C.; Writing—original draft, B.O.-K., M.F.-C., T.S., A.B. and M.Ż.; Writing—review & editing, E.R.-Z. and M.F.-C. All authors have read and agreed to the published version of the manuscript.

Funding

This research received no external funding.

Acknowledgments

The authors would like to thank the staff of the Lviv Polytechnic for their cooperation and activities aimed at improving the energy quality of Lviv buildings while preserving their historical values.

Conflicts of Interest

The authors declare no conflict of interest.

References

  1. Nowogońska, B. Performance Characteristics of Buildings in the Assessment of Revitalization Needs. Civ. Environ. Eng. Rep. 2019, 29, 119–127. [Google Scholar] [CrossRef] [Green Version]
  2. Krentowski, J.; Chyzy, T.; Dunaj, P. Sudden collapse of a 19th-century masonry structure during its renovation process. Eng. Fail. Anal. 2017, 82, 540–553. [Google Scholar] [CrossRef]
  3. Krentowski, J.; Mlonek, S.; Ziminski, K.; Tofiluk, A. Structural and Technological Aspects of the Historical Floors Replacement. In Proceedings of the IOP Conference Series: Materials Science and Engineering; Institute of Physics Publishing: Bristol, UK, 2019; Volume 471. [Google Scholar]
  4. Radziszewska-Zielina, E.; Śladowski, G. Proposal of the Use of a Fuzzy Stochastic Network for the Preliminary Evaluation of the Feasibility of the Process of the Adaptation of a Historical Building to a Particular Form of Use. In Proceedings of the IOP Conference Series: Materials Science and Engineering; Institute of Physics Publishing: Bristol, UK, 2017; Volume 245. [Google Scholar]
  5. Radziszewska-Zielina, E.; Śladowski, G. Supporting the selection of a variant of the adaptation of a historical building with the use of fuzzy modelling and structural analysis. J. Cult. Herit. 2017, 26, 53–63. [Google Scholar] [CrossRef]
  6. Fedorczak-Cisak, M.; Kowalska-Koczwara, A.; Nering, K.; Pachla, F.; Radziszewska-Zielina, E.; Śladowski, G.; Tatara, T.; Ziarko, B. Evaluation of the criteria for selecting proposed variants of utility functions in the adaptation of historic regional architecture. Sustainability 2019, 11, 1094. [Google Scholar] [CrossRef] [Green Version]
  7. Fedorczak-Cisak, M.; Kowalska, A.; Radziszewska –Zielina, E.; Śladowski, G.; Pachla, F.; Tatara, T. A multi-criteria approach for selecting the utility function of the historical building “Stara Polana” located in Zakopane. MATEC Web Conf. 2019, 262, 07002. [Google Scholar] [CrossRef]
  8. Radziszewska-Zielina, E.; Rumin, R. Analysis of The Profitability of Investment In Renewable Energy Sources On The Example of A Semi-Detached House. E3S Web Conf. 2016, 10, 00079. [Google Scholar] [CrossRef] [Green Version]
  9. Fedorczak-Cisak, M.; Knap, K.; Kowalska-Koczwara, A.; Pachla, F.; Pekarchuk, O. Energy and Cost Analysis of Adapting an Existing Building to 2017 Technical Requirements and Requirements for NZEB. In Proceedings of the IOP Conference Series: Materials Science and Engineering; Institute of Physics Publishing: Bristol, UK, 2019; Volume 471. [Google Scholar]
  10. Biolek, V.; Hanák, T. LCC Estimation Model: A Construction Material Perspective. Buildings 2019, 9, 182. [Google Scholar] [CrossRef] [Green Version]
  11. Radziszewska-Zielina, E.; Kania, E.; Śladowski, G. Problems of the selection of construction technology for structures in the centres of urban agglomerations. Arch. Civ. Eng. 2018, 64, 55–71. [Google Scholar] [CrossRef]
  12. Radziszewska-Zielina, E.; Kania, E. Problems in Carrying Out Construction Projects in Large Urban Agglomerations on the Example of the Construction of the Axis and High5ive Office Buildings in Krakow. MATEC Web Conf. 2017, 117, 00144. [Google Scholar] [CrossRef]
  13. Fedorczak-Cisak, M.; Kowalska-Koczwara, A.; Pachla, F.; Radziszewska-Zielina, E.; Szewczyk, B.; Śladowski, G.; Tatara, T. Fuzzy Model for Selecting a Form of Use Alternative for a Historic Building to be Subjected to Adaptive Reuse. Energies 2020, 13, 2809. [Google Scholar] [CrossRef]
  14. Piasecki, M. Practical Implementation of the Indoor Environmental Quality Model for the Assessment of Nearly Zero Energy Single-Family Building. Buildings 2019, 9, 214. [Google Scholar] [CrossRef] [Green Version]
  15. Piasecki, M.; Kostyrko, K. Combined Model for IAQ Assessment: Part 1—Morphology of the Model and Selection of Substantial Air Quality Impact Sub-Models. Appl. Sci. 2019, 9, 3918. [Google Scholar] [CrossRef] [Green Version]
  16. Radziszewska-Zielina, E. Assessment methods of partnering relations of Polish, Slovak and Ukrainian construction enterprises with the fuzzy logic. Arch. Civ. Eng. 2011, 57, 87–118. [Google Scholar] [CrossRef]
  17. Radziszewska-Zielina, E. Analysis of the partnering relations of polish, slovak and ukrainian construction enterprises. Technol. Econ. Dev. Econ. 2010, 16, 432–454. [Google Scholar] [CrossRef]
  18. Radziszewska-Zielina, E.; Czerski, P.; Grześkowiak, W.Ł.; Kwaśniewska-Sip, P. Comfort of Use Assessment in Buildings with Interior Wall Insulation based on Silicate and Lime System in the Context of the Elimination of Mould Growth. Arch. Civ. Eng. 2020, 66, 89–104. [Google Scholar]
  19. Lucchi, E.; Boarin, P.; Zuppiroli, M. GBC Historic Building®: A new certification tool for orienting and assessing environmental sustainability and energy efficiency of historic buildings. Energy Effic. Comf. Hist. Build. 2019, 250–256. [Google Scholar]
  20. Baggio, M.; Tinterri, C.; Mora, T.D.; Righi, A.; Peron, F.; Romagnoni, P. Sustainability of a Historical Building Renovation Design through the Application of LEED® Rating System. Energy Procedia 2017, 113, 382–389. [Google Scholar] [CrossRef]
  21. Mazzola, E.; Mora, D.; Peron, F.; Romagnoni, P. An Integrated Energy and Environmental Audit Process for Historic Buildings. Energies 2019, 12, 3940. [Google Scholar] [CrossRef] [Green Version]
  22. Hoffman Supervisors, M.; Fatiguso, F.; Mariella De Fino Bari-Santander, I. Energy Efficiency in Historic Buildings: New Materials for Traditional Envelopes. 2017. Available online: https://repositorio.unican.es/xmlui/bitstream/handle/10902/12444/HOFFMAN.pdf?sequence=1&isAllowed=y (accessed on 13 October 2020).
  23. Lewicki, J. Między Tradycją a Nowoczesnością. Architektura Lwowa Lat 1893–1918; Neriton: New York, NY, USA, 2005. [Google Scholar]
  24. Karolak, A.; Krzysztof Raszczuk, K. Investigating glazed ceramics in relation to renovation of the façade of a 19th century heritage building. Wiadomości Konserw. J. Herit. Conserv. 2019, 57, 114–126. [Google Scholar]
  25. Orlenko, M.; Buzin, I. Stylistic peculiarities, features of the use of building materials and structures in buildings of the latter half of the nineteenth century and the early twentieth century, and methods for their restoration (Evidence from Ukraine). Wiadomości Konserw. J. Herit. Conserv. 2019, 59, 97–105. [Google Scholar]
  26. Directive (Eu) 2018/844 of the European Parliament and of The Council of 30 May 2018 Amending Directive 2010/31/EU on the Energy Performance of Buildings and Directive 2012/27/EU on Energy Efficiency (Text with EEA Relevance). 2018. Available online: https://eur-lex.europa.eu/legal-content/EN/ALL/?uri=CELEX%3A32018L0844 (accessed on 13 October 2020).
  27. Eßmann. Innendämmung nach WTA I Planungsleitfaden Merkblatt 6-4 Inside Insulation According to WTA I: Planary Guide Isolation Thermique par L´intérieur Selon WTA I: Guide de Planification Deskriptoren; Fraunhofer IRB Verlag: Stuttgart, Germany, 2016; ISBN 9783816780861. [Google Scholar]
  28. DIN 4108-3 Grenzen der Anwendbarkeit im Feuchteschutz|Bauphysik|Feuchteschutz|Baunetz_Wissen. 2014. Available online: https://www.baunetzwissen.de/bauphysik/fachwissen/feuchteschutz/din-4108-3-grenzen-der-anwendbarkeit-im-feuchteschutz-4794266 (accessed on 13 October 2020).
  29. ISO—ISO 6781:1983–Thermal Insulation—Qualitative Detection of Thermal Irregularities in Building Envelopes—Infrared Method. Available online: https://www.iso.org/standard/13277.html (accessed on 15 August 2020).
  30. Typische Baukonstruktionen von 1860 bis 1960: Zur Beurteilung der vorhandenen Bausubstanz Paket mit allen 3 Bänden: Amazon.de: Ahnert, Rudolf, Krause, Karl Heinz: Bücher. Available online: https://www.amazon.de/Typische-Baukonstruktionen-von-1860-1960/dp/3410211756 (accessed on 15 August 2020).
  31. EN 13187: Thermal Performance of Buildings—Qualitative Detection of Thermal Irregularities in Building Envelopes—Infrared Method. 1998. Available online: https://www.sis.se/api/document/preview/24940/ (accessed on 13 October 2020).
  32. Orlik-Kożdoń, B. Interior insulation of masonry walls-selected problems in the design. Energies 2019, 12, 3895. [Google Scholar] [CrossRef] [Green Version]
  33. Straube, J. Interior Insulation Retrofits of Load-Bearing Masonry Walls in Cold Climates. J. Green Build. 2007, 2, 42–50. [Google Scholar] [CrossRef]
  34. Energy Efficiency and Historic Buildings: Insulating Solid Walls: Amazon.de: Pickles, David: Fremdsprachige Bücher. Available online: https://www.amazon.de/-/en/David-Pickles/dp/1848024428 (accessed on 15 August 2020).
  35. Orlik-Kożdoń, B.; Steidl, T. Impact of internal insulation on the hygrothermal performance of brick wall. J. Build. Phys. 2017, 41, 120–134. [Google Scholar] [CrossRef]
  36. Innendämmung von Klaus Arbeiter—Fachbuch—Bücher.de. Available online: https://www.buecher.de/shop/fachbuecher/innendaemmung/arbeiter-klaus/products_products/detail/prod_id/40460154/ (accessed on 15 August 2020).
  37. Wójcik, R. Docieplanie Budynków od Wewnątrz; Grupa Medium: Warsaw, Poland, 2018; ISBN 978-83-64094-59-0. [Google Scholar]
  38. Orlik-Kożdoń, B.; Szymanowska-Gwiżdż, A. Impact of envelope structure on the solutions of thermal insulation from the inside. Arch. Civ. Eng. Environ. 2018, 11, 123–134. [Google Scholar] [CrossRef] [Green Version]
  39. Handbuch Thermische Gebäudesanierung—PDF Free Download. Available online: https://docplayer.org/11962682-Handbuch-thermische-gebaeudesanierung.html (accessed on 15 August 2020).
  40. Nowogońska, B.; Korentz, J. Value of Technical Wear and Costs of Restoring Performance Characteristics to Residential Buildings. Buildings 2020, 10, 9. [Google Scholar] [CrossRef] [Green Version]
  41. Nowogońska, B. The Method of Predicting the Extent of Changes in the Performance Characteristics of Residential Buildings. Arch. Civ. Eng. 2019, 65, 81–89. [Google Scholar] [CrossRef]
  42. ДЕРЖАВНІ БУДІВЕЛЬНІ НОРМИ УКРАЇНИ Кoнструкції будинків і спoруд ТЕПЛОВА ІЗОЛЯЦІЯ БУДІВЕЛЬ ДБН В.2.6-31:2006 зі Змінoю №1 від 1 липня 2013 рoку Мінбуд України. 2013. Available online: https://thermomodernisation.org/wp-content/uploads/2017/11/DBN-V.2.6-31-2006.pdf (accessed on 13 October 2020).
  43. ISO 6946: Building Components and Building Elements—Thermal Resistance and Thermal Transmittance—Calculation Methods; ISO: Geneva, Switzerland, 2017.
  44. ISO 12524:2000 Building Materials and Products—Hygrothermal Properties; ISO: Geneva, Switzerland, 2017.
  45. EN ISO 10211:2017 Thermal Bridges in Building Construction—Heat Flows and Surface Temperatures—Detailed Calculations; ISO: Geneva, Switzerland, 2017.
  46. Jean, B.; Joseph, F. Theorie Analytique de la Chaleur|Historical Mathematical Texts; Cambridge University Press: Cambridge, UK, 2009; ISBN 9781108001809. [Google Scholar]
  47. Zhou, X.; Tamma, K.K.; Anderson, C.V.D.R. On a new C- and F-processes heat conduction constitutive model and the associated generalized theory of dynamic thermoelasticity. J. Therm. Stress. 2001, 24, 531–564. [Google Scholar] [CrossRef]
  48. EN 15026: Hygrothermal Performance of Building Components and Building Elements—Assessment of Moisture Transfer by Numerical Simulation; BSI: London, UK, 2007.
  49. Orlik-Kożdoń, B. Assessment of the application efficiency of recycling materials in thermal insulations. Constr. Build. Mater. 2017, 156, 476–485. [Google Scholar] [CrossRef]
  50. Orlik-Kożdoń, B.; Steidl, T. Experimental and analytical determination of water vapour transmission properties of recyclable insulation material. Constr. Build. Mater. 2018, 192, 798–807. [Google Scholar] [CrossRef]
  51. Orlik-Kożdoń, B.; Nowoświat, A. Modelling and testing of a granular insulating material. J. Build. Phys. 2018, 42, 6–15. [Google Scholar] [CrossRef]
Figure 1. The proposed historical building thermal diagnostics algorithm. The diagnostics method selected in the case study is highlighted in orange (with a dashed line).
Energies 13 05374 g001
Figure 2. Frontal facade of the building and view of the building’s balcony slabs.
Energies 13 05374 g002
Figure 3. Internal courtyard.
Energies 13 05374 g003
Figure 4. Structural system of the building’s balcony slabs. Visible corrosion of slab elements and steel beams.
Energies 13 05374 g004
Figure 5. Archival documentation of the building under study—existing fragment of the ground floor plan.
Energies 13 05374 g005
Figure 6. Mass moisture measurement in selected areas within the building.
Energies 13 05374 g006
Figure 7. External wall layer water absorptivity testing.
Energies 13 05374 g007
Figure 8. Courtyard-facing facade thermovision diagnostics with measurements.
Energies 13 05374 g008
Figure 9. Frontal facade thermovision diagnostics with measurements.
Energies 13 05374 g009
Figure 10. Sample thermogram with markings showing the areas under analysis and where temperature readings were taken, i.e., under steel beams. The thermograms were made at night, meaning that the walls were not affected by sunlight.
Energies 13 05374 g010
Figure 11. Concepts of supporting balconies using steel beams [30]: (1) concrete slab on steel beams; (2) cantilever steel beam; (3) brick wall; (4) support stone.
Energies 13 05374 g011
Figure 12. General geometric model—alternative I.
Energies 13 05374 g012
Figure 13. Geometric model—solid view from inside the room: (1) brick wall; (2) lime–cement plaster; (3) clay–lime plaster; (4) balcony (concrete slab on steel beams); (5) timber flooring; (6) slag; (7) wooden boards; (8) air void; (9) ceiling board; (10) lime–cement plaster; (11) wooden beam.
Energies 13 05374 g013
Figure 14. Geometric model—solid view from the outside with boundary condition solids. The materials are the same as for Figure 13.
Energies 13 05374 g014
Figure 15. Internal surface temperature distribution field on the wall and deck—bottom view.
Energies 13 05374 g015
Figure 16. Internal surface temperature distribution field on the wall and deck—top view.
Energies 13 05374 g016
Figure 17. External surface temperature distribution field on the wall and balcony slab—bottom view.
Energies 13 05374 g017
Figure 18. External surface temperature distribution field on the wall and balcony slab—top view.
Energies 13 05374 g018
Figure 19. Geometric model—solid view from inside the room. Inner thermal insulation is marked with arrows.
Energies 13 05374 g019
Figure 20. Internal surface temperature distribution field on the wall and deck—top view.
Energies 13 05374 g020
Figure 21. Internal surface temperature distribution field on the wall and deck—bottom view.
Energies 13 05374 g021
Figure 22. External surface temperature distribution field on the wall and balcony showing both the top and bottom.
Energies 13 05374 g022
Figure 23. Geometric model—solid view from inside the room. Outer thermal insulation is marked with arrows.
Energies 13 05374 g023
Figure 24. Internal surface temperature distribution field on the wall and deck—top view.
Energies 13 05374 g024
Figure 25. Internal surface temperature distribution field on the wall and deck—bottom view.
Energies 13 05374 g025
Figure 26. External surface temperature distribution field on the wall and bottom of the balcony.
Energies 13 05374 g026
Figure 27. (a) Geometric model (b) Geometric model with a FEM (Finite Element Method) mesh (example for the alternative with internal insulation). The other materials as the same as in Figure 13.
Energies 13 05374 g027
Figure 28. Water content changes for the entire calculation model.
Energies 13 05374 g028
Figure 29. Water content changes for selected elements throughout the reference period for internal thermal insulation (brick wall—red; external plaster—blue; internal plaster—green).
Energies 13 05374 g029
Figure 30. Changes in water content in wooden beams (red) and deck boards (green) for the alternative featuring internal thermal insulation.
Energies 13 05374 g030
Figure 31. A 3D visualisation of changes in water content for the analysed section, assumed for the alternative with internal insulation in the initial state.
Energies 13 05374 g031
Figure 32. Visualisation of changes in water content for the analysed section, assumed for the alternative with internal insulation after 1 year.
Energies 13 05374 g032
Table 1. Technical specifications of the Testo 635-2 device.
Energies 13 05374 i001 Energies 13 05374 i002Work Temperature−20 °C to + 50 °C
Measurement RangeWood: <50%
Materials: <20%
Testo 635-2 DeviceResolution0.1%
Measurement Speed0.5 s
Protection ClassIP30
Table 2. Testing conditions.
Measurement27–28 November 2019
Outdoor temperature, te2.00 °C ÷ −1.00 °C
Indoor temperature, ti17 °C ÷ 19.0 °C
Indoor relative air humidity55–65%
Table 3. Comparison of analysis results for the temperature underneath the cantilevers supporting the building’s balconies, obtained using a thermal vision camera.
Item No.Temperature Underneath the Steel Beam/Thermogram
(°C)
Temperature Underneath the Steel Beam/Calculations
(°C)
Δt
12.2; 2.4/Thermogram No. 1 (Figure 10)2.270.03
22.0; 2.1/Thermogram No. 22.27−0.22
32.2; 2.2; 2.4/Thermogram No. 32.27−0.033
42.2; 2.1; 2.0/Thermogram No. 42.27−0.12
5Average: 2.182.27−0.09
Note: Δt—difference between the calculated value and measurement readings.
Table 4. Data used in hygrothermal modelling.
MaterialPorosity
ε (m3/m3)
Thermal Conductivity
λ (W/mK)
Diffusion Resistance Coefficient
µ (-)
Volume Density
(kg/m3)
Historical solid brick0.310.6015.01800
Cement-lime plaster0.240.8019.01900
Internal mortar/adhesive layer0.490.908833
Light aerated concrete0.960.0404115
Publisher’s Note: MDPI stays neutral with regard to jurisdictional claims in published maps and institutional affiliations.

