Virtual Reality System and Scientific Visualisation for Smart Designing and Evaluating of Lighting


Lighting Technology Division, Electrical Power Engineering Institute, Warsaw University of Technology, 75 Koszykowa St., 00-662 Warsaw, Poland
Energies 2020, 13(20), 5518; https://0-doi-org.brum.beds.ac.uk/10.3390/en13205518
Submission received: 29 August 2020
/
Revised: 26 September 2020
/
Accepted: 16 October 2020
/
Published: 21 October 2020
(This article belongs to the Special Issue Smart City Lighting Systems)
Abstract
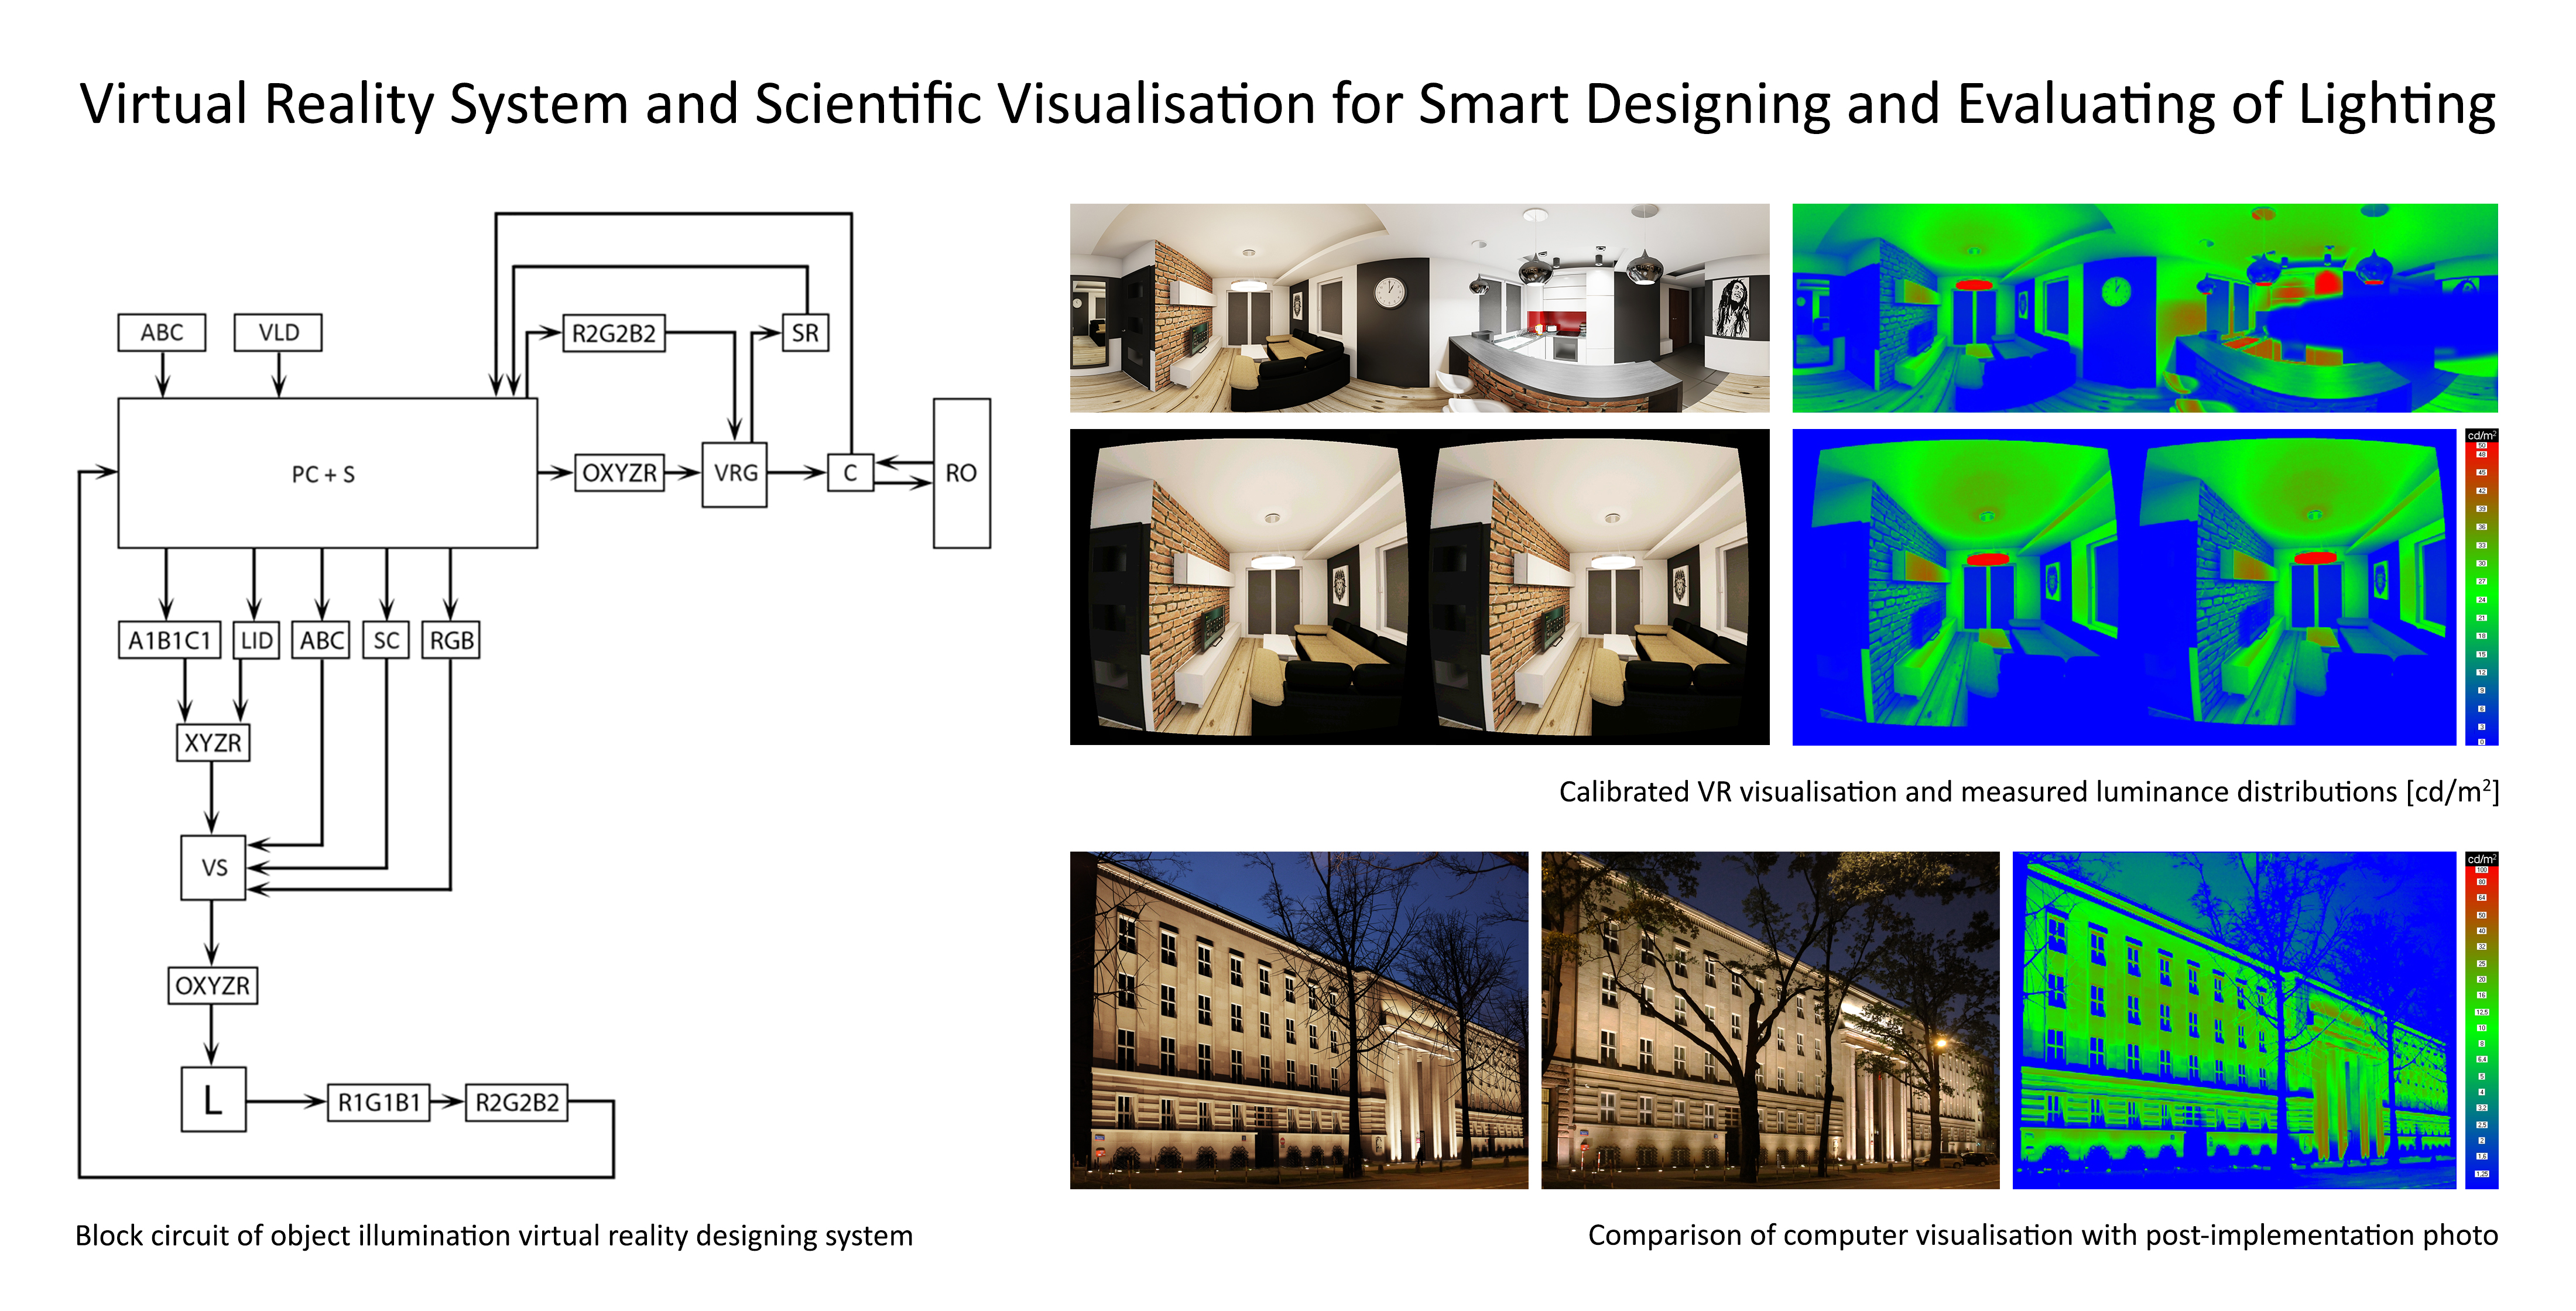
:The current lighting solutions, both in terms of design process and later implementation, are becoming more and more intelligent. It mainly arises from higher opportunities to use information technology (IT) processes for these purposes. Designs cover many aspects, from physiological to including technical. The paper describes the problems faced by any designers while creating, evaluating them, and presenting the final results of their work in a visualisation form. Development of virtual reality (VR) technology and augmented reality, which is now taking place before our eyes, makes us inclined to think how to use this reality in lighting technology. The article presents some examples of applying VR technology in various types of smart lighting designs, for interiors and outdoor objects. The performed computer simulations are compared to reality. Some surveys, in terms of visualization rendering, were carried out. In the article, the current capabilities and main limitations of virtual reality of lighting are discussed, as well as what can be expected in the future. The luminance analysis of the virtual reality display is carried out, which shows that this equipment can be used in lighting technology after the appropriate calibration. Moreover, an innovative lighting design system based on virtual reality is presented.

1. Introduction
Development of computer technology, which has taken place in the last two decades, has significantly changed designing and evaluating of lighting [1,2,3,4]. Currently, it is difficult to imagine performing these tasks without using IT processes [5,6,7,8,9,10]. We can even risk the statement that practically, every design and analysis of lighting use computer simulations. Both interior and outdoor lighting designs are created in virtual space [11]. Designs contain results in both digital and graphic-visualisation form, more or less photorealistic. It depends on the tools used by the designer, what knowledge, graphic experience, and how much time they have to develop such simulations. In turn, investor expectations regarding the realism of virtualization images are constantly growing. It also applies to smarter and smarter solutions, where both the designer’s work and the subsequent design analysis can be presented by using the latest technologies [12].
While the digital form of design gives a chance to assess its compliance with the requirements and standards, the graphic form currently performs an aesthetic task in particular. At the present advancement level of visualisation technology, the designer is only able to evaluate the light climate, analyse various furnishing solutions in the interior, both in terms of materials used and its future arrangement. As far as of outdoor lighting for floodlighting is concerned, it is only possible to visually assess compliance with the principles of building illumination [13]. Visualization images are sometimes supported by a form with the use of a false colour scale, with the legend showing the range of colours and the illuminance or luminance values corresponding to them. Then you can talk about the possibility of preliminary assessment of basic photometric parameters for lighting. The main problem that currently occurs while evaluating the lighting designs made in the photorealistic computer visualisation version is the appropriate form of their presentation. The results are mainly presented in the form of printouts and displayed on electronic media. That is why there is a problem resulting from the physiology of vision.
In daylight, the observer’s eyesight is adapted to the brightness of the surroundings. Therefore, the luminances obtained in lighting designs do not make any real impressions on them. In particular, it applies to the outdoor lighting where the luminances obtained in the designs are at the level of a dozen cd/m2. Nevertheless, the problem also occurs in the interiors where the luminances are higher, similar to the conditions under which the designs are analysed. It arises from the process of accommodation and adaptation of human eyesight and, to a large extent, from the geometric differences of the illuminated object observed as a two-dimensional raster image. Currently, the only proposal to solve this problem is to provide an appropriate observation scenery. For example, it could be a large image displayed in a darkened room, or, as for an electronic medium, bring the observer’s eyes closer to a distance where the image would occupy the same part of the field of view as under real conditions. These solutions are quite troublesome, uncomfortable, and not always possible to be implemented. Not every design can be presented or created under these conditions. It is difficult to imagine a necessity of showing a design only in the evening, in the darkened room, or, for example, in the photometric darkroom, where the only luminances that occur in the observer’s field of view are those projected ones.
The aim of the paper is to analyse the opportunities how to solve these problems through the use of virtual reality (VR) in the process of designing and analysing of lighting. This will open up the way for a later transfer of the developed smart solutions into the augmented reality technology (AR), too.
2. Virtual Reality of Lighting
Initially, virtual reality mainly functioned in the military industry. Soldiers equipped with virtual helmets moved around the virtual battlefield for purely training purposes. Together with the dynamic increase in opportunities to use personal computers for photorealistic visualisations, as well as the development and the decrease in production costs of VR glasses, the benefits arising from applying this technology in entertainment were noticed [14,15]. In recent years, virtual reality has expanded into a wide range of branches of science and industry [16]. Scientific publications on this topic are very common [17,18,19]. At present this technology is widely used in prototyping products [20], in architecture [21,22,23,24,25,26,27,28], as well as in designing interiors and their furnishings [29]. It is used in medicine as a method for improving the doctors’ qualifications in performing any surgeries [30], in rehabilitation [31], in psychology [32], and psychiatry [33] in treating phobias [34], fear or anxiety, dizziness, and balance. Marketing and tourism [35,36] are also very popular VR application areas. The expansion of this technology with the so-called augmented reality offers a large number of chances to teach foreign languages and conduct training courses online, for example, for technicians servicing all devices. The rapid development of mobile devices is also very important for the VR technology growth [37,38].
If computer graphics currently play such a significant role in the designing of lighting, it is worth considering the answers to the following questions:
- Is it possible to use virtual and augmented reality technology in this process?
- Is it possible to transfer the created computer simulations to a three-dimensional space observed with the use of glasses dedicated to this purpose and to evaluate the design there?
A designer, an architect, when using VR equipment and technology, could then "enter" the "interior" of this design, be inside the room, or stand in front of the outdoor object whose floodlighting they are designing [39]. Moreover, they could analyse the variants of the object floodlighting, discussing them in the same technology with the future recipient of the design, avoiding any problems resulting from the accommodation of eyesight as well as the proper field of observation. It would be possible to analyse the lighting variants in many aspects, including aesthetic features, light pollution of the natural environment and energy issues [40,41,42,43,44,45,46,47,48]. Moreover, it would be a smart analysis, fully computer-assisted.
Like in the other fields of technology, electricity consumption for floodlighting purposes is an equally important aspect. Object floodlighting is sometimes perceived as an unnecessary cost spent on energy. This is evidenced by the fact that on the occasion of the annual "Earth Hour" movement organized by the World Wide Fund for Nature, which falls on the last Saturday of March, the illuminations around the world are spectacularly turned off. Although the electricity consumption for floodlighting purposes compared to, for example, the interior lighting, not to mention the air-conditioning devices, is low, this topic should not be neglected and any designs should be thought out in terms of both lighting and energy effect. However, in order to make the smart analysis of lighting possible with the use of VR technology, a series of technically correct controlled tests connected with computer lighting simulation has to be done. This research is very important because the visualisation images will not represent the image attractive only to the human eye any longer. They will become a key factor for evaluation. Therefore, a dedicated smart system should be created and computer simulations displayed in the form of renderings should be checked for their technical correctness.
3. System Description
The aim of this smart system is to enable us to carry out the analysis of luminance distribution cases based on both photometric and geometric data of luminaires manufactured or being at the design stage, required to obtain the illuminance or luminance distribution desired by the designer, with full energy control. While computer software supporting the designing of lighting is currently very popular among designers, the solutions that work in real time with virtual reality glasses are not used now. The assumption is that when designing the lighting, the designer, apart from visual impressions, should receive technical information on luminance levels, illuminance and energy consumption for this purpose. Moreover, light pollution of the natural environment is an important issue as far as designing of outdoor lighting is concerned. The developed system is based on the photometric data of luminaires saved in the form of files. Knowing the geometric model of the object, the average level of illuminance on the object and the total luminous flux of light sources, the utilisation factor can be calculated. This parameter directly determines a degree of use of the luminous flux in the design. Therefore, in principle, it says about the degree of light pollution in the case of outdoor lighting. The higher this parameter is, the less light pollution of the natural environment is. That is why the designer can optimize the design appropriately. The assumption was that the size of the object and the amount of lighting equipment should not make any difference and the process should not be labour- and time-consuming. It was also necessary to be able to analyse the geometrical impact of the luminaire on the object illuminated from any different directions and observation points.
The essence of the proposed method is that a geometric model of the real object (in the future by means of automatic spatial scanning) is created, taking into account the colour component of the materials that are used in the object. While designing, the spectral composition of the light, which currently illuminates the object, is considered. The files of photometric and geometric solids of the luminaires containing the photometric and dimensional data are loaded onto the system in any position and orientation in relation to the virtual object. The colour temperature of light sources and the opportunity to use some colour filters in the full RGB or HSV range are also taken into account. A colour temperature is a very important parameter, especially in the case of modern light sources where it can be continuously modified [49]. The system enables us to make a change with an accuracy of 10 °K within the range of 2000–6500 °K. This is the standard temperature range of light sources used in electric lighting systems. However, extending this range is not a major problem. The problem is the Colour Rendering Index (CRI). At the initial level of advancement of the system, the decision was made not to include this parameter. It should be remembered that most software packages also ignore this parameter. Next, depending on the observer’s position and direction, the obtained luminance distribution is converted into the colour components. The image created on the virtual object in this way is transformed into a differential image observed with the virtual reality glasses. The rest of the shot comes from the continuous recording with the camera.
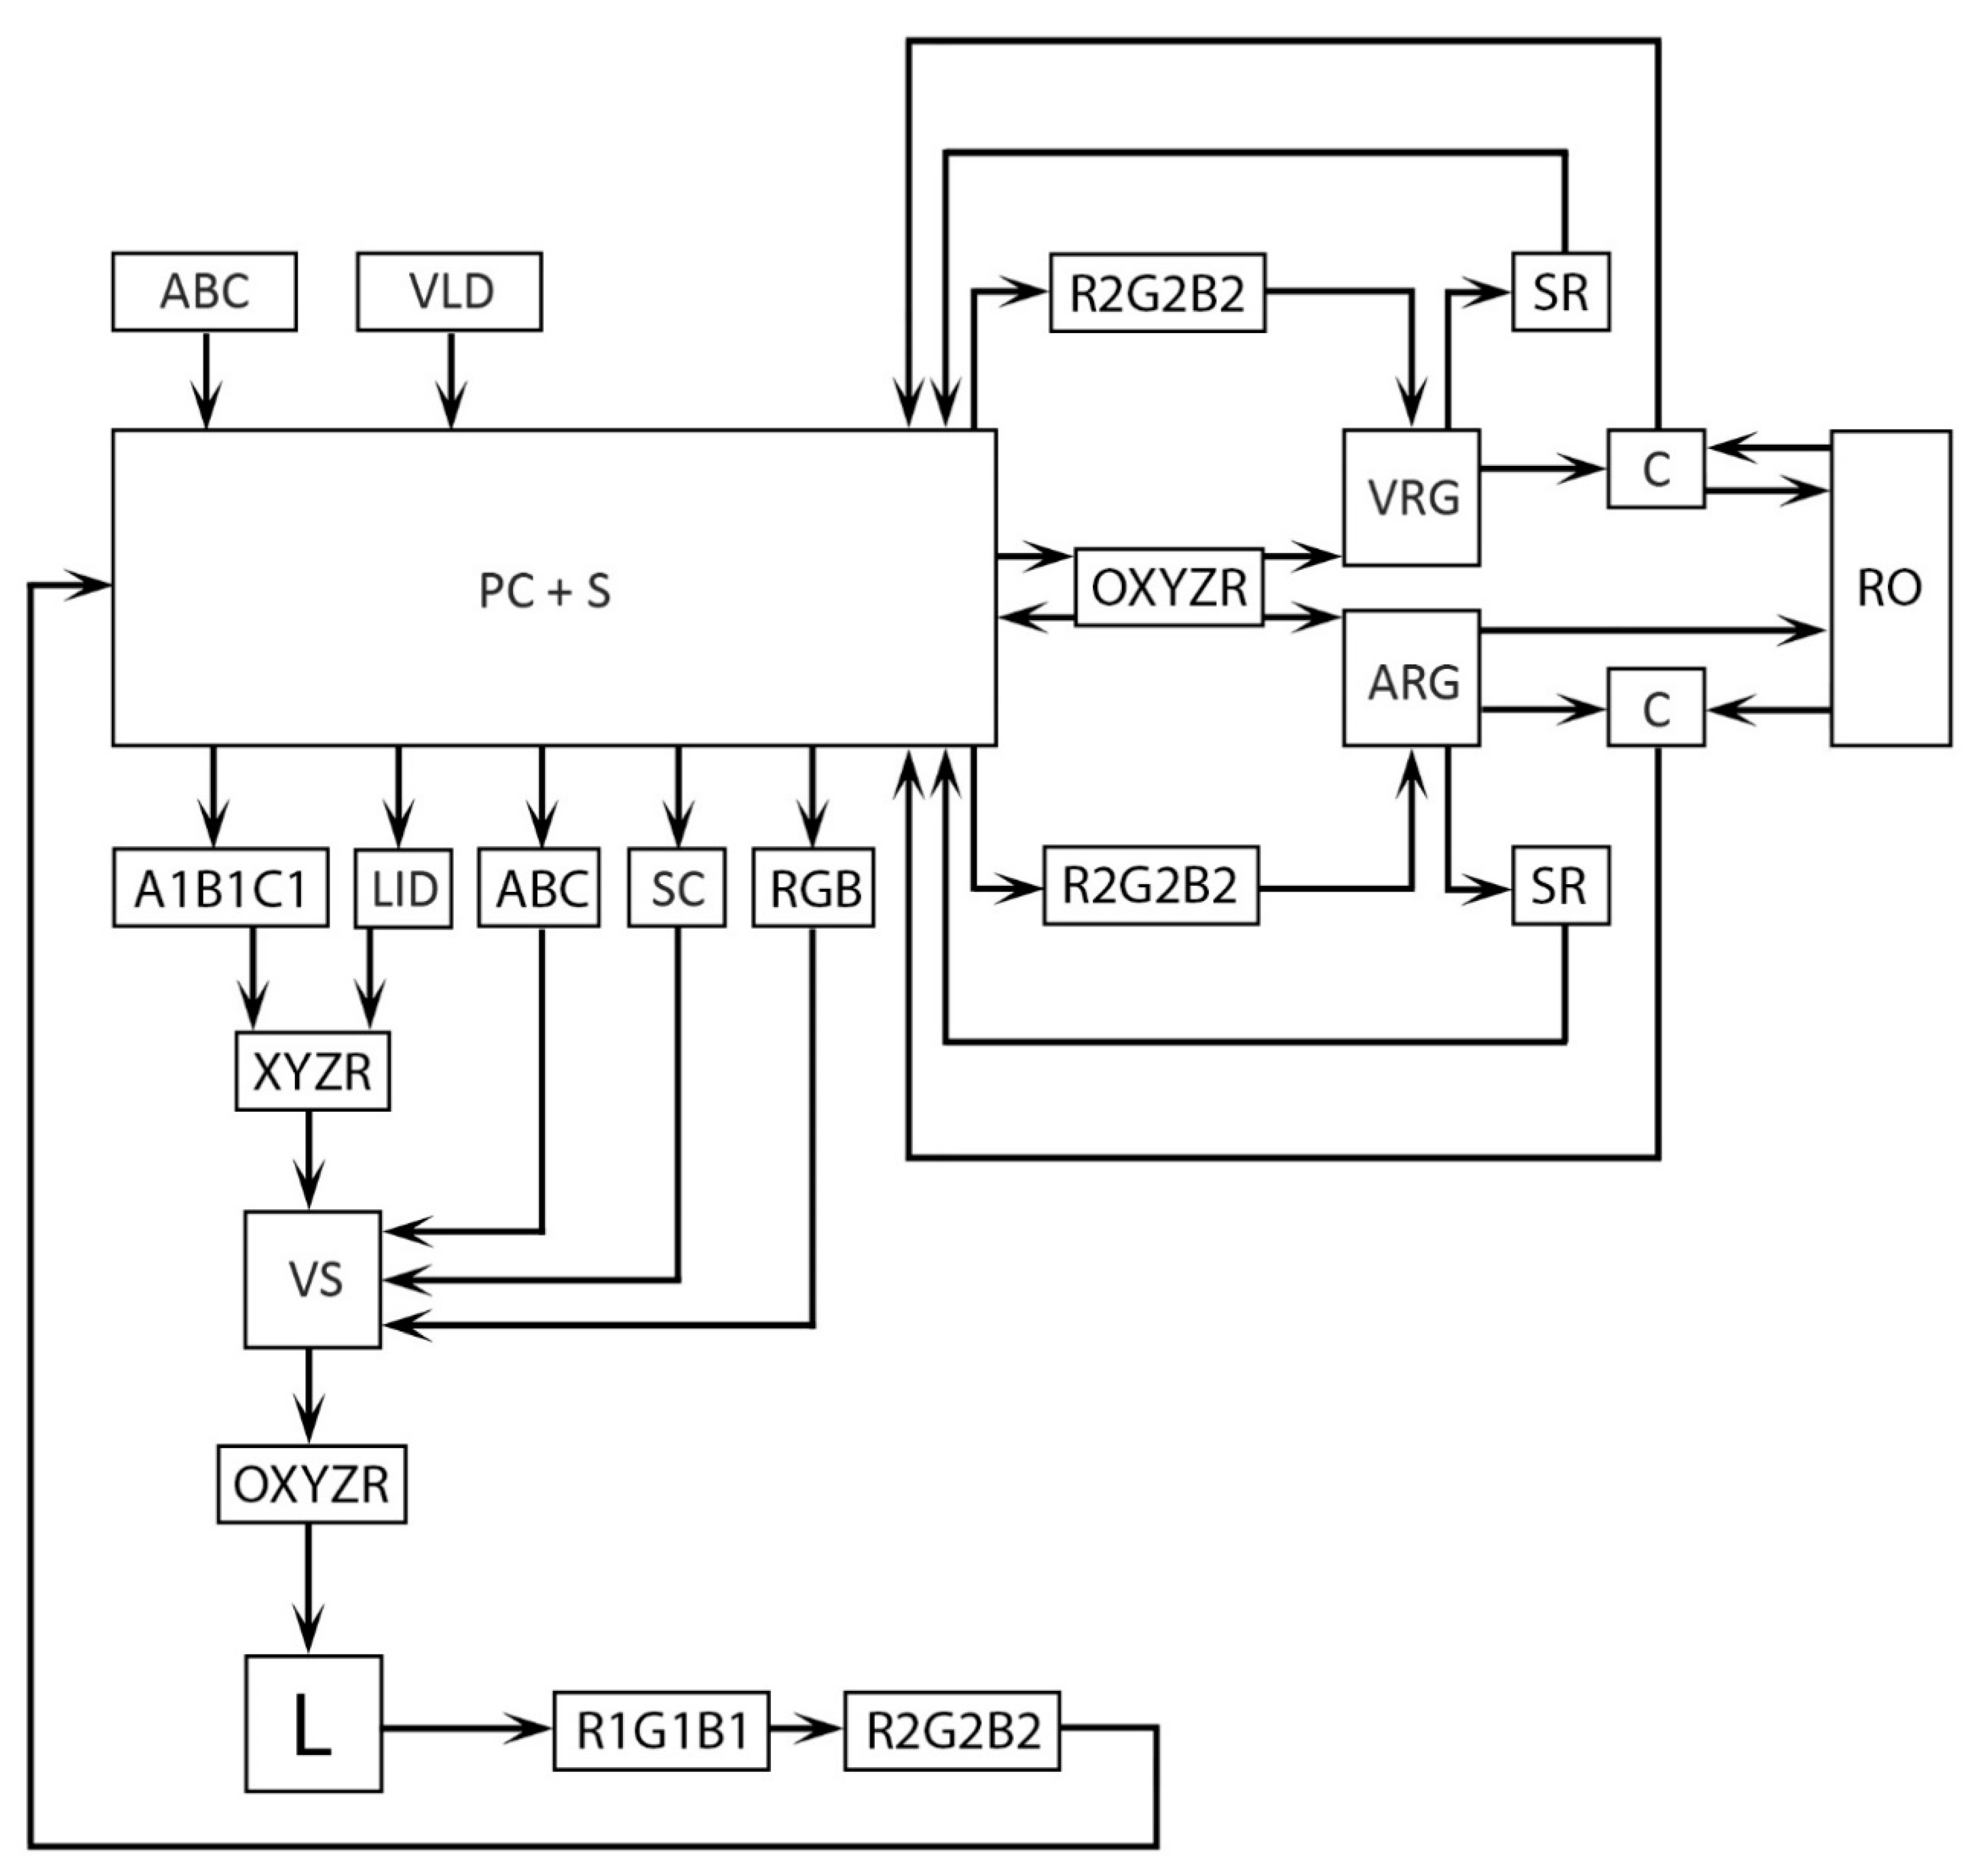
Figure 1 shows a diagram of the block circuit of the system. While tracking the course of signals, initially, the virtual geometric model of the object (ABC) and the virtual luminaire data (VLD) are loaded. The geometric model can be made in any vector graphics software. The files of virtual luminaire data (VLD) contain both luminaire dimensions (A1B1C1) and luminous intensity distributions (LID) as well. Currently, most lighting equipment manufacturers provide geometric models of luminaires. If not, the designer has to build these luminaire on the same principle as the geometric model of the object. The luminous intensity distributions are defined as the IES (the Illuminating Engineering Society) or LDT (EULUMDAT) files. They are popular formats of recording data for luminaires. Based on the downloaded data, knowing the spectral reflectances of the materials used in the object, the RGB colour components of all the materials are calculated. The real reflectances of the materials have to be measured beforehand. Moreover, the reflection feature has to be specified. However, this takes place independently of the system operation. Reflective properties of materials are defined by means of the Specular Level and Glossiness parameters, creating a material gloss curve. This method does not differ from those used in computer graphics.
Later, a virtual scene is built on the system, taking into account the spectral composition of the light (SC), which illuminates the real object (RO), measured with the spectroradiometer (SR). While constructing the virtual scene, the position and orientation (XYZR) of both luminous intensity distributions (LID) and dimensional data (A1B1C1) of the luminaires relative to the virtual object are also taken into consideration. Based on the downloaded data, the luminance at each point of the virtual scene is calculated, creating a complete three-dimensional distribution composed of individual images representing the surfaces of the virtual object.
The picture of luminance distribution L created in this way is converted into the colour components of the image R1G1B1. Then, the differential image R2G2B2 between object colour RGB and calculated luminance colour R1G1B1 is computed. This image is displayed in the virtual reality glasses (VRG). The rest of the image comes from the continuous recording of the image of the real object (RO) with the camera (C).
The measurements and calculations are independent of the observer’s position and orientation (OXYZR) in relation to the virtual scene (VS). This corresponds to the position and orientation in relation to the real object (RO).
The system for shaping the luminance distribution includes a computer (PC) with software (S) adapted to convert the photometric data of luminaires into the luminances and colour components corresponding to them on the virtual model. This type of application has been developed with a different method for designing of lighting [50] and is used in the lighting market. All technical data on the lighting design, such as levels of illuminance, luminance, uniformity, utilisation factor, amount of lighting equipment used, and energy consumption are available to the designer in real time.
The system allows us to freely change the photometric data and their position as well as the orientation in relation to the virtual object where the luminance distribution is indicated. It is also possible to change the geometric shape of the luminaire. The size of the virtual object corresponds to the real architectural object while maintaining the scale required for the luminance distribution calculations. The observer’s position is analysed continuously. The virtual reality glasses display both the shot of the luminance distribution and the image of the luminaire. The complete luminance distribution is also displayed on the computer screen.
It is possible to freely move around the room or the outdoor object, as well to analyse the calculated luminance distribution and the geometric impact of the luminaire on its general architecture.
4. Results of Scientific Visualisations for Virtual Reality and Discussion
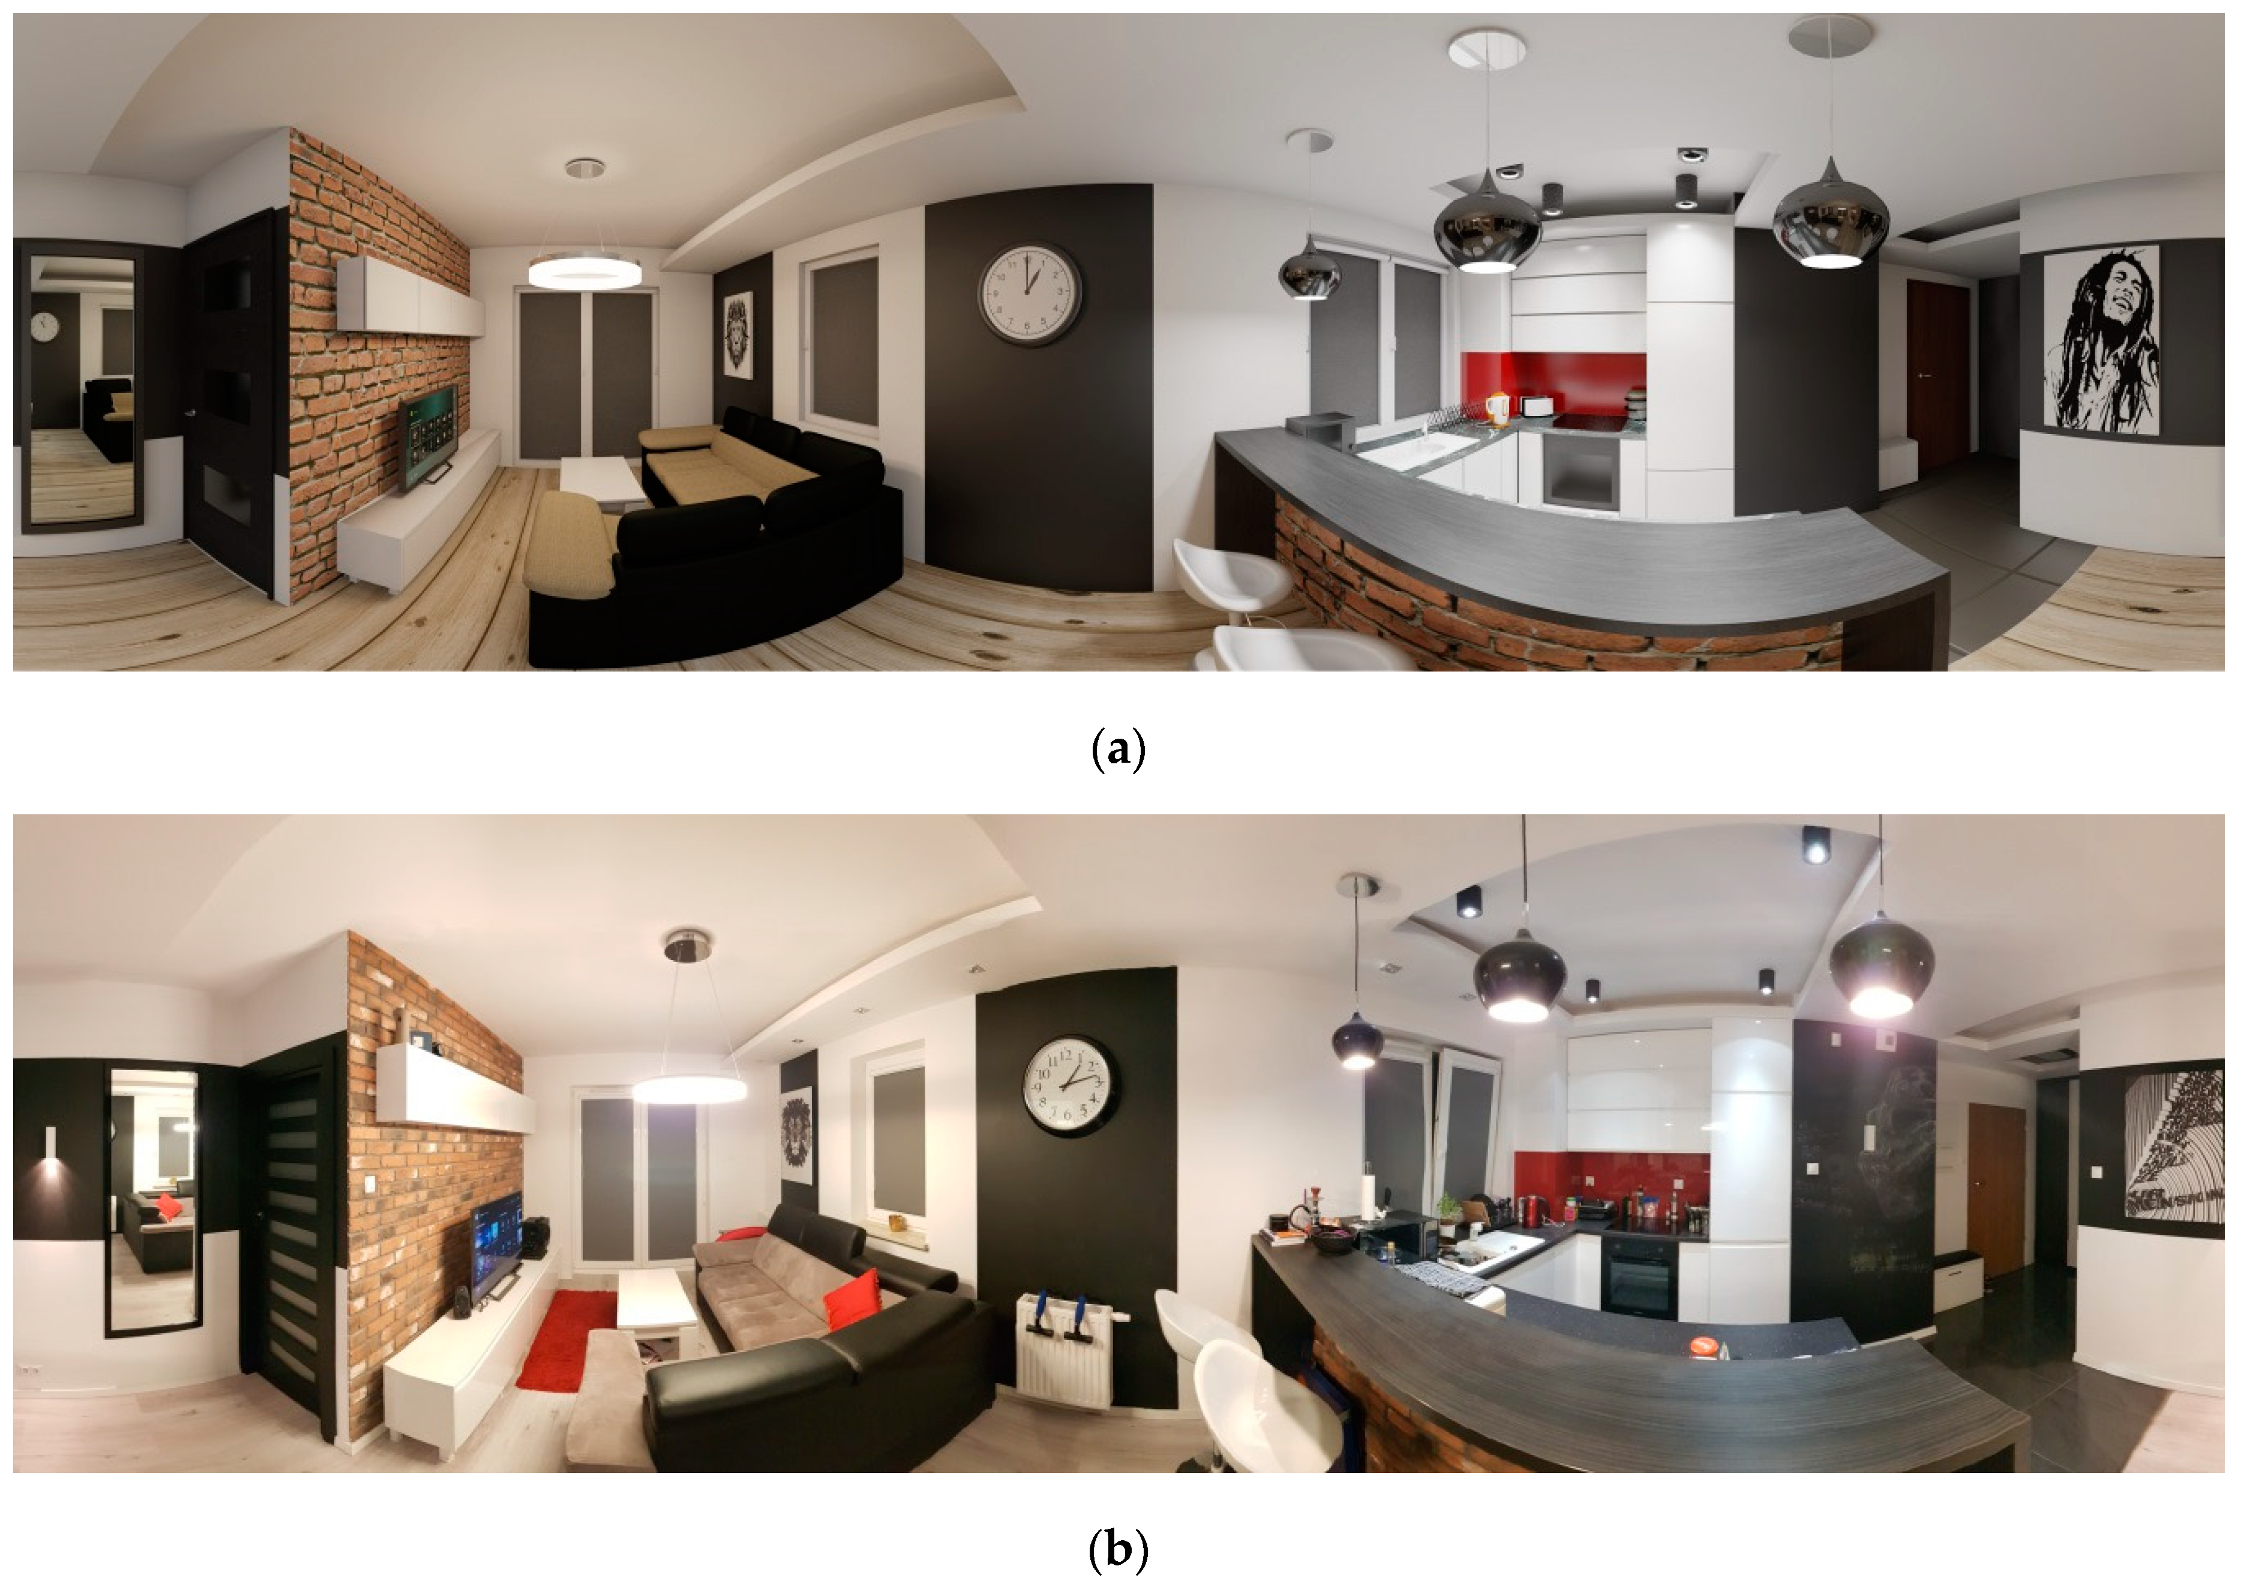
In order to unequivocally state that the idea of the developed system is correct, some research should be carried out to confirm or contradict the thesis that virtual reality can be used in the process of smart designing and evaluating of lighting [49,50,51,52,53,54,55,56,57,58,59,60,61]. Initially, the decision was made to use the indoor scene for testing. A real room with a total surface of S = 40 m2, with a designed modern and energy-saving lighting was rendered. The computer simulations were made as part of a Master’s thesis [62] under the supervision of the author of the article. However, in general the photorealistic visualisation of interiors is not an easy task. It is due to the fact that interiors are characterized by both a large number of objects placed in them and a variety of materials used in these objects. Moreover, the interior lighting calculations are more complicated compared to outdoor lighting. In the interiors of buildings, an indirect component of the illuminance has a high impact on a final effect. In the outdoor scenes, where there are open spaces, the light flux also reflects from objects, but the impact on the final effect is significantly lower. That is why this task is much simpler.
Figure 2 shows a room rendering and a picture of the real room. They are rendering shots on 180 × 360 deg in a spherical mode. The images are not the same in terms of the frame. The bottom and top of the panoramic shots are also distorted in different ways, however, after using a full spherical space mapping, they are displayed correctly (Figure 3). Both images were taken separately for the camera corresponding to the left and right eye. In this way, the use of VR glasses makes it possible to give people the impression of full three-dimensionality and the depth of field in the image.
The performed computer simulations showed that the identification of the computer visualisation was possible at first glance. This was also confirmed by the tests done on a relatively narrow group of respondents. Thirty-two people in total were surveyed [62]. Both the simulation image and the photograph of the object were presented in the virtual reality glasses. This procedure was carried out alternately. The respondents could switch the shots over and analyse them without any restrictions. In both cases, the respondents correctly identified them without any serious problems. Therefore, the research result was not promising. It was surprising that some respondents who observed the real image considered it a computer simulation. However, it might have arisen from the way of presentation connected to the technology to those respondents. Not knowing it, they were oriented to the fact that they always watched computer graphics. In turn, the correct identification of rendering resulted from the quality of the computer simulation mainly.
Moreover, the quality depends on a lot of factors. In general the simulation was carried out correctly. The geometric model did not have any errors; the lighting scene was rendered quite precisely. The photometric data of real light sources were used. The calculations of lighting did not leave much to be desired, either. The illuminance levels in both rendering and real room photo were also the same. However, the illuminance is not a parameter the human eye reacts to. It is the luminance and it depends on a material the object. Furthermore, it is where we should look for the reasons for differences. Comparing the images showing the visualisation and the photograph in Figure 2 and Figure 3, it can be noticed that the luminance levels of the black divan in the photo are higher. It is not so much to the colour of the material as its gloss. Unfortunately, this parameter, although possible to be defined while creating the simulation with the use of two parameters: specular level and glossiness, was not fully controlled. Moreover, a similar situation applies to the worktop. In general the visualisation image is also darker and less-contrast.
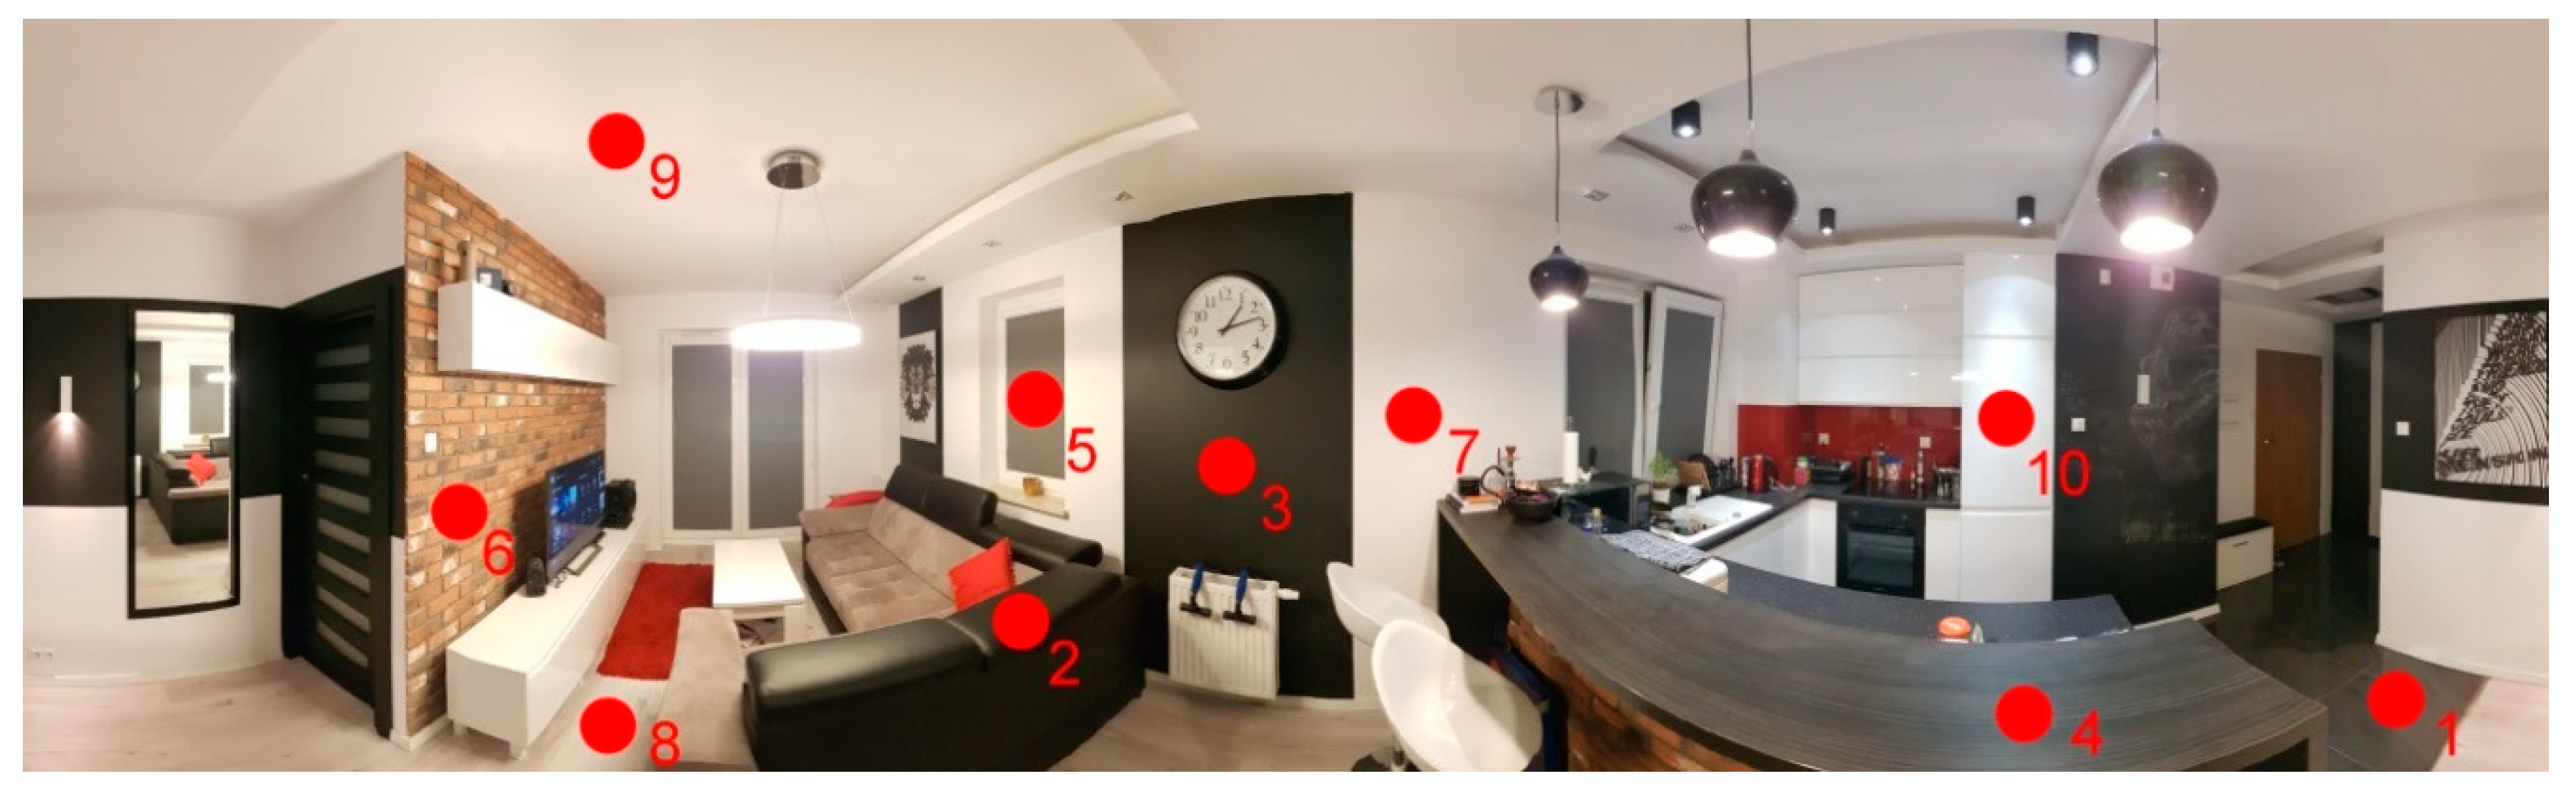
The real luminance measurements also confirmed it. They were taken with a Minolta LS 100 Luminance Meter at the points which were questionable. Figure 4 shows the points where the measurements were taken in the real room and on the VR display, whereas Table 1 shows a comparison of the results—real luminance as well as of rendering and of photo luminances.
The values in Table 1 show that the differences in luminances of images displayed on the VR glasses in some cases exceeded the real measured values more than 10 times in relation to the reality. However, in the done research there was a lack of luminance adjustment between the visualisation images and the photograph as well as the real values. That is why the decision was made to investigate to what extent the luminance calibration of these images could be carried out. The VR technology would be used in the analysis process of lighting only with the correct calibration. Otherwise, it could constitute only a richer form of result presentation, like the traditional multimedia presentations of lighting designs.
In the first step of the calibration the analysis of luminance range of displays was carried out. For this purpose, this time an imaging luminance measuring device was applied, which gives precise results for the entire image, creating raster images on the so-called false colour scale. The professional LMK device by TechnoTeam was used for the tests. The measurements showed that the luminance range of the screen oscillated from 0 cd/m² for the displayed black colour to 480 cd/m2 for the white colour for the screen made in Super AMOLED technology, with FHD+ resolution. Therefore it can be concluded that it fell within the luminance ranges that exist in reality. Moreover, that is why the first condition of the correct analysis of lighting was met. Of course, it should be remembered that, like in the solutions used so far, the glare evaluation with this system [63,64] cannot be taken into consideration because we are still dealing with a computer-generated image that is displayed on an electronic medium whose luminance and dynamic range are top-down limited. The real luminances exceeding the display range, the light sources in particular, will obviously be flattened to the maximum possible to be displayed. The luminances of light sources often exceed the values of thousands or even millions of cd/m2 [65]. Fortunately, as far as the VR technology is concerned, we deal with such a situation. The image is very close to the observer’s eye and at present the already used luminances of a range of around a few hundred cd/m2 cause quick eye strain, and the use of higher values would be dangerous for the eyes. Moreover, it should be remembered that there are processes of accommodation and adaptation of the human eye. As for large luminance differences, they will have an impact on the correct perception of the presented simulations. The eye accommodation time depends on age, but it can be said that it is about 1 second on average. A more complicated situation occurs in the adaptation process. While the change to a pupil width size occurs within a few tenths of a second, the photochemical adaptation is longer, especially in the case of a drastic decrease in the luminance level. In such cases, this time is already counted in minutes. The adaptation in the event of a transition from lower to higher levels is much faster and is approximately 1 minute. The next step of the calibration was aimed at answering the following question: is it possible to adjust the visualisation images and photographs to the real luminance levels?
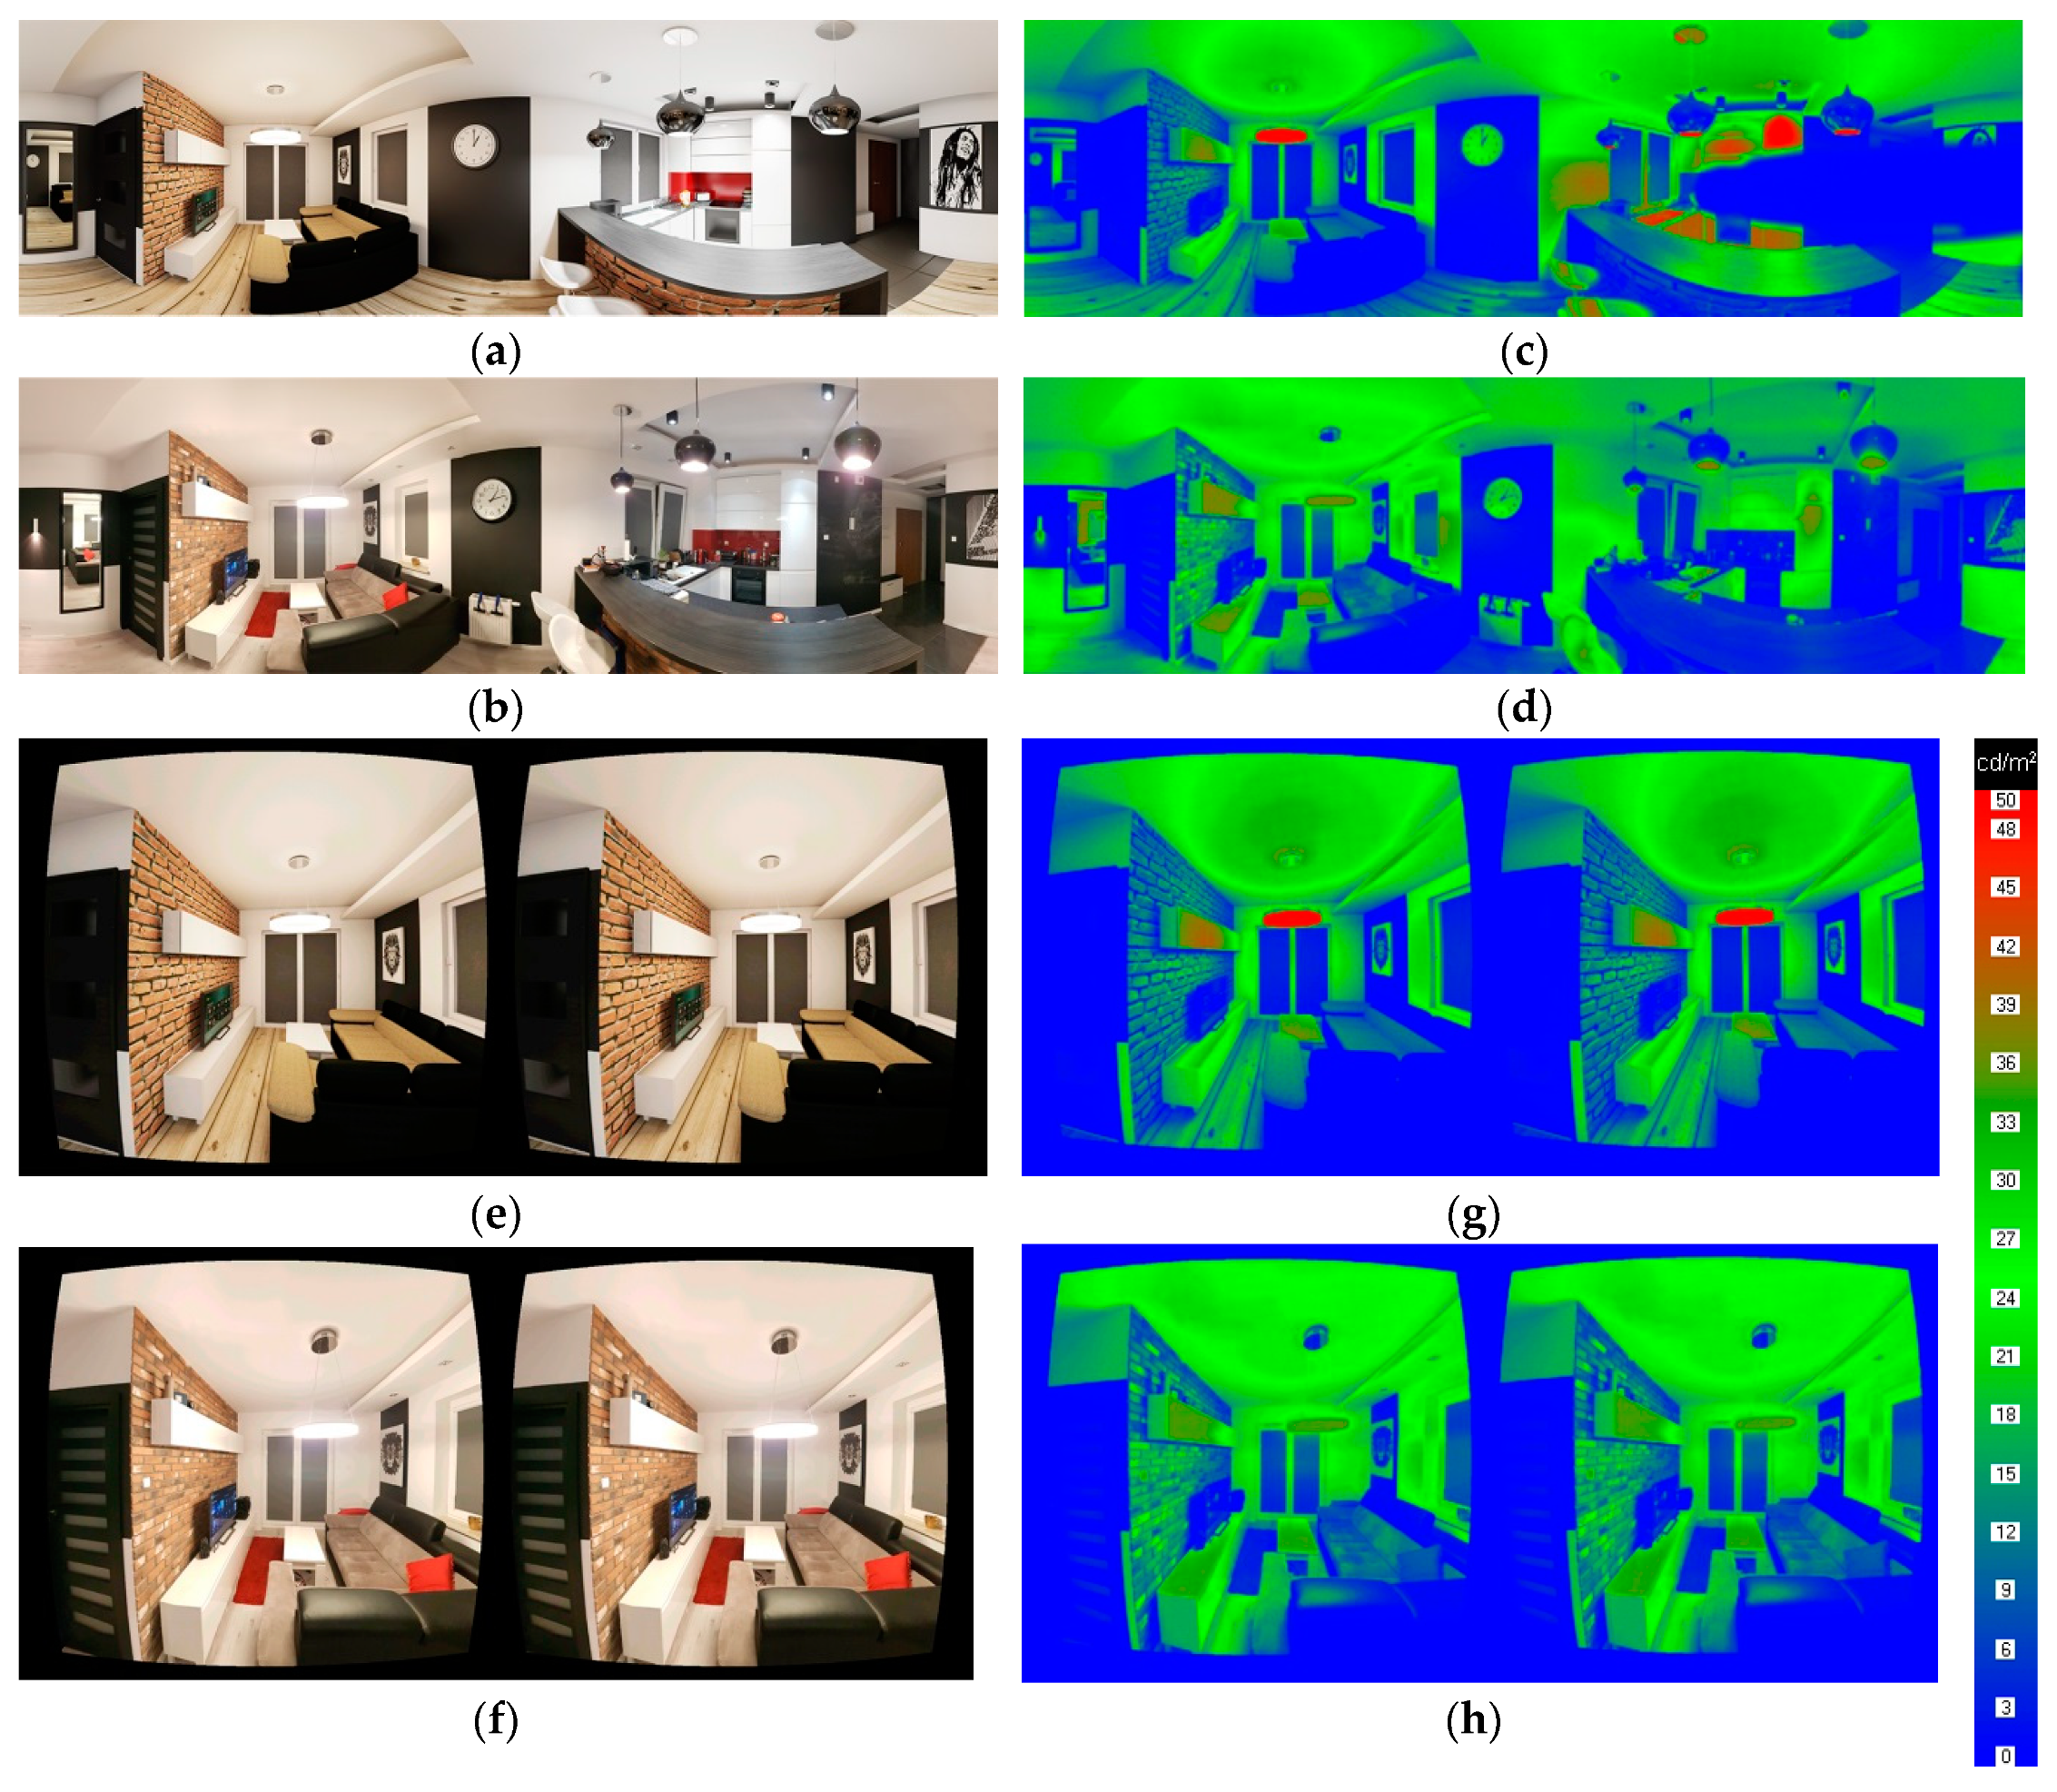
The first natural move was to change the display brightness. In this simple way, the adjustment of the luminance of images, both visualisation and photographic, to those generated in the reality, in the room, could be carried out. This simplest modification to the image display parameter turned out to be sufficient to achieve the same luminance values. Figure 5 shows the brightness-calibrated images of the visualisation (Figure 5a), the photograph (Figure 5b), as well as the luminance distributions generated on the display, corresponding to them (Figure 5c—the visualisation, Figure 5d—the photograph). The measurements were also taken for the images displayed in the VR technology. Figure 5e shows the visualisation, Figure 5f—the photo, Figure 5g—the luminance distribution for the visualisation, Figure 5h—the luminance distribution for the photo.
In the images measured with the imaging luminance measuring device, it could be observed that the performed luminance levels of luminaires in the rendering were higher than in the reality, whereas the visualisation image itself would suggest the opposite situation. In the pictures there were some characteristic light glows around the high luminance. They gave the impression of high luminance values in the human eye. As it turned out, higher than it was technically performed in the raster image and higher than it resulted from the simulation calculations. Therefore, it is also worth carrying out this simple graphic procedure in the simulation images as a substitute for presenting the objects that can cause or just cause a glare phenomenon.
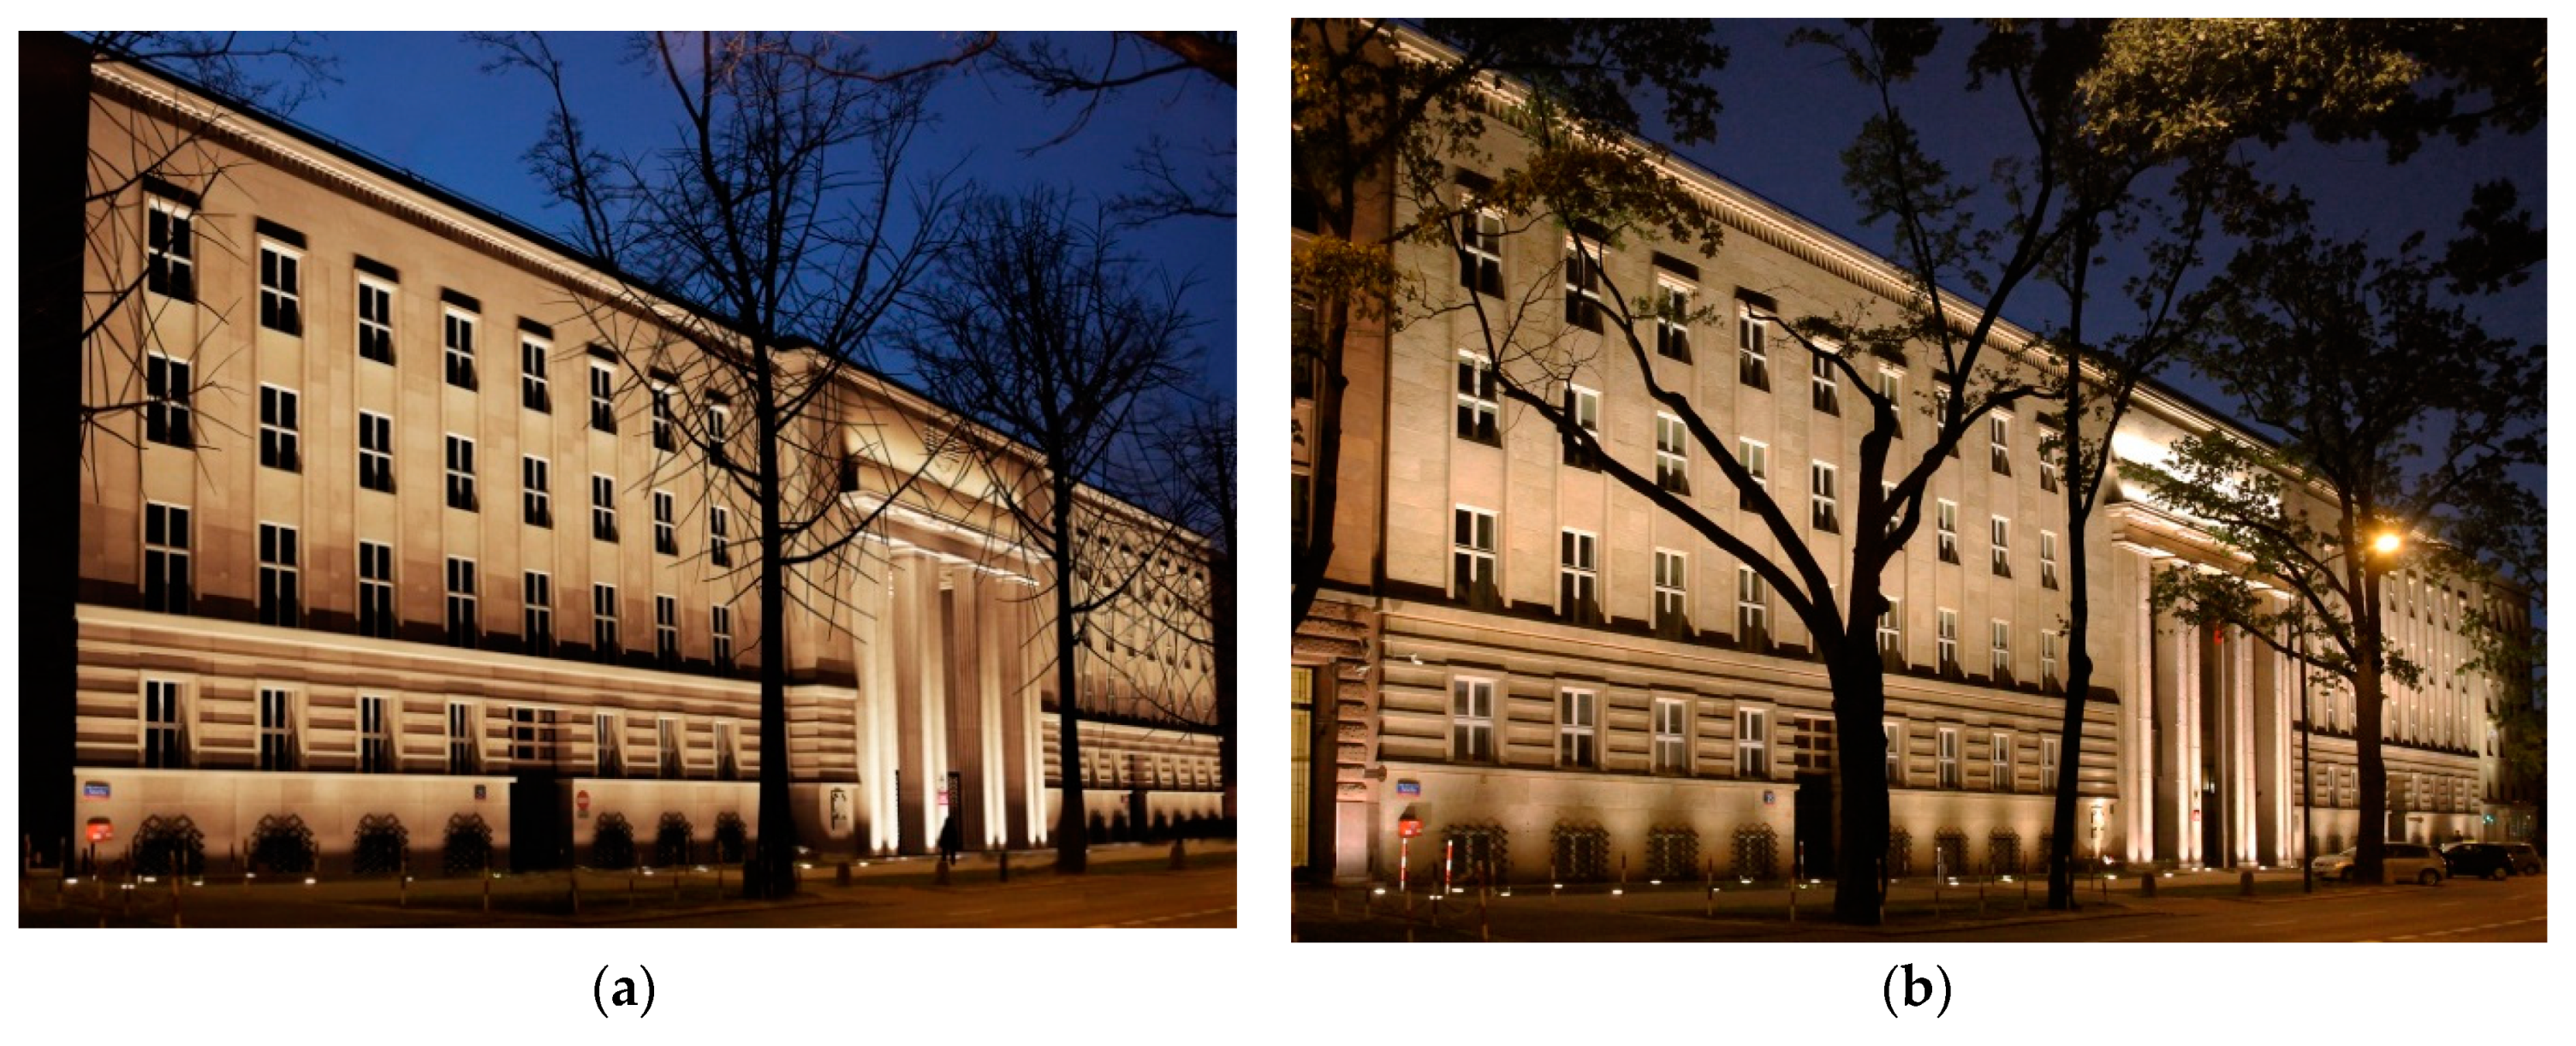
The conclusions that could be drawn from the done research made the author conduct further analyses. This time, the decision was made to check the system in the outdoor scene and major efforts were to accurately render the reality and to calibrate the system. Figure 6 presents a comparison of the computer visualisation of floodlighting design with the post-implementation picture of the object. In this case, the material properties were precisely reproduced. The selected outdoor object is characterized by a more diffusive nature of reflection of the materials which are used in it, and that is why the task was simpler. The real measurement of the reflectance was taken on the basis of two measurements: illuminance and luminance at a point. Thanks to using the simple dependencies L = ρE /π, the reflectance for the object can be determined. Additionally, the virtual scene was integrated into the real photograph, creating the so-called collage. This corresponds to the methodology in which the system operates, where the assumption was that virtuality was connected with the reality.
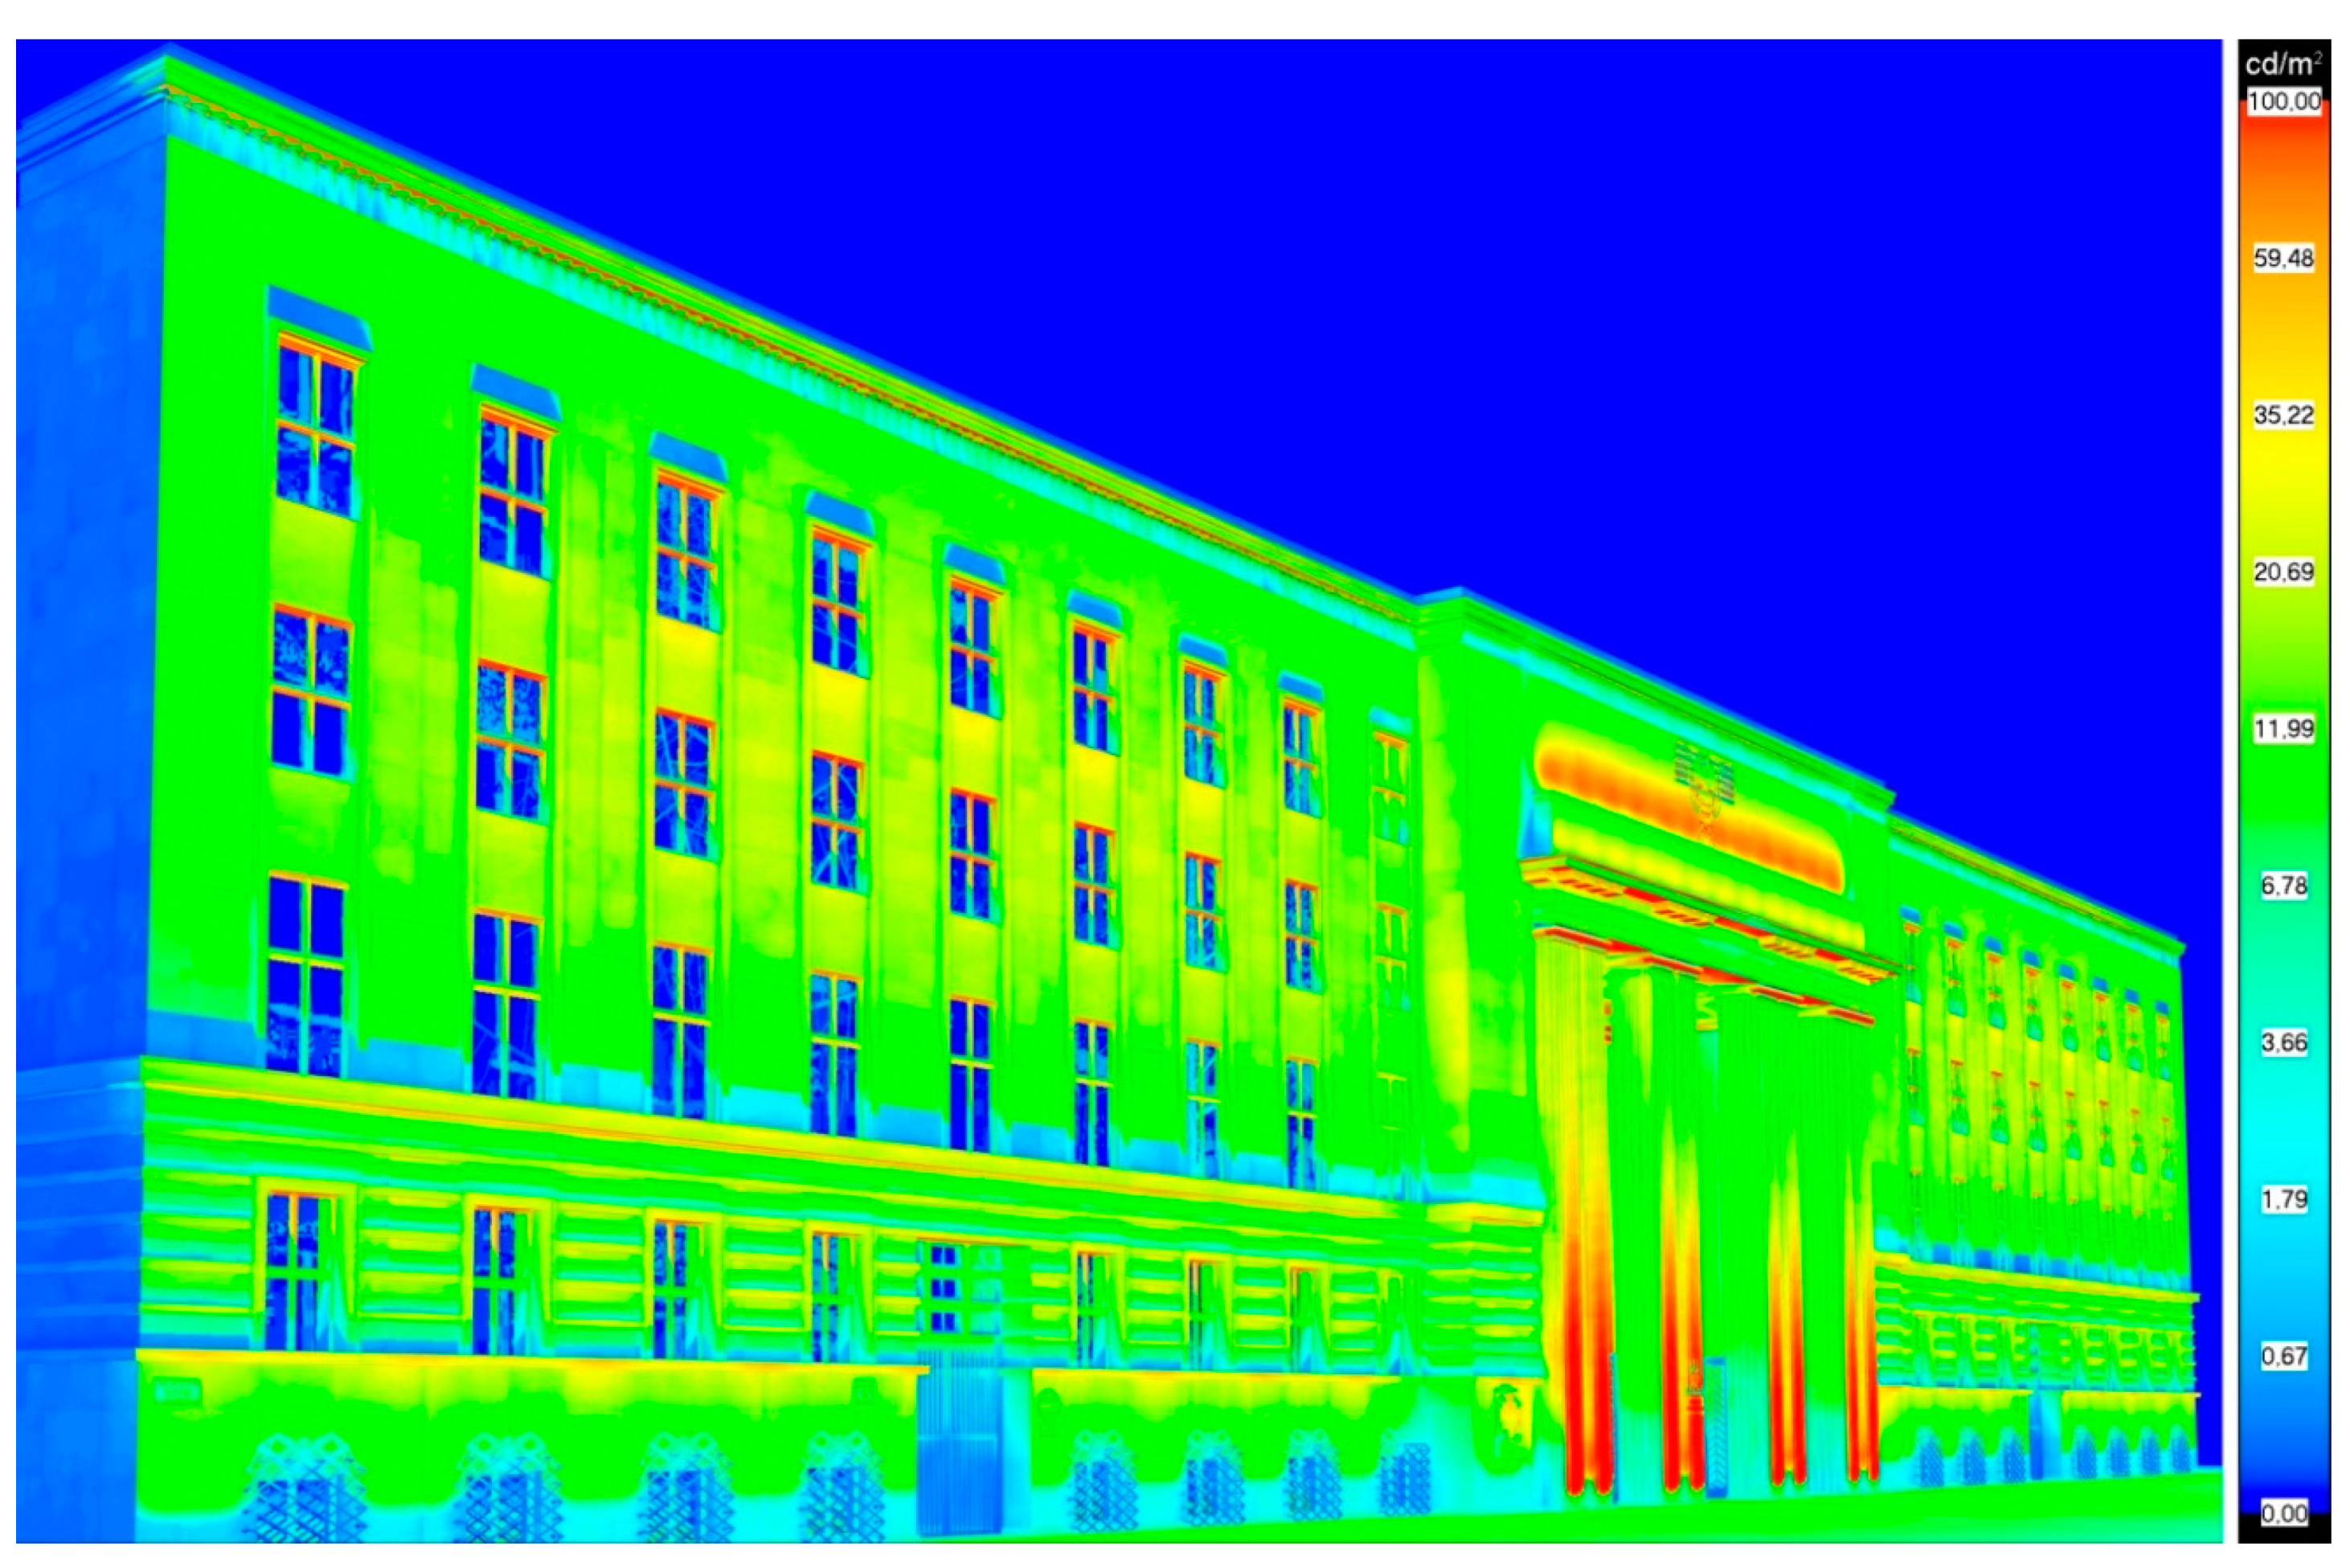
Moreover, the system was appropriately calibrated in accordance with the described method so that the luminances of the tested images were the same and compliant with the calculated ones. Figure 7 shows a comparison of the luminance distribution measured on the VR display screen for the displayed rendering (Figure 7a) and photo (Figure 7b). When analysing these distributions, it can be clearly stated that the computer simulation is very close to the reality.
The luminance measurements of the visualisation and post-implementation picture displayed on the screen of the glasses were also compared with those calculated in the design. Most computer software products allow us to perform the rendering in the form of false colour scale. Only on the basis of such images, is it possible to objectively evaluate the design, since this image is independent of exposure parameters. Unfortunately, this type of analysis may be burdened with some errors. They mainly arise from the incapability of precisely adjusting the colour range on the luminance scale. The yellow colour is explicitly missing in the measurements with the imaging luminance measuring device. Therefore, the approach to the analysis of images should be careful. However, while analysing the images presented in Figure 7 and Figure 8, it can be stated that the general levels are correct. In both cases, a logarithmic scale was applied, and the luminances corresponding to the individual colours are convergent.
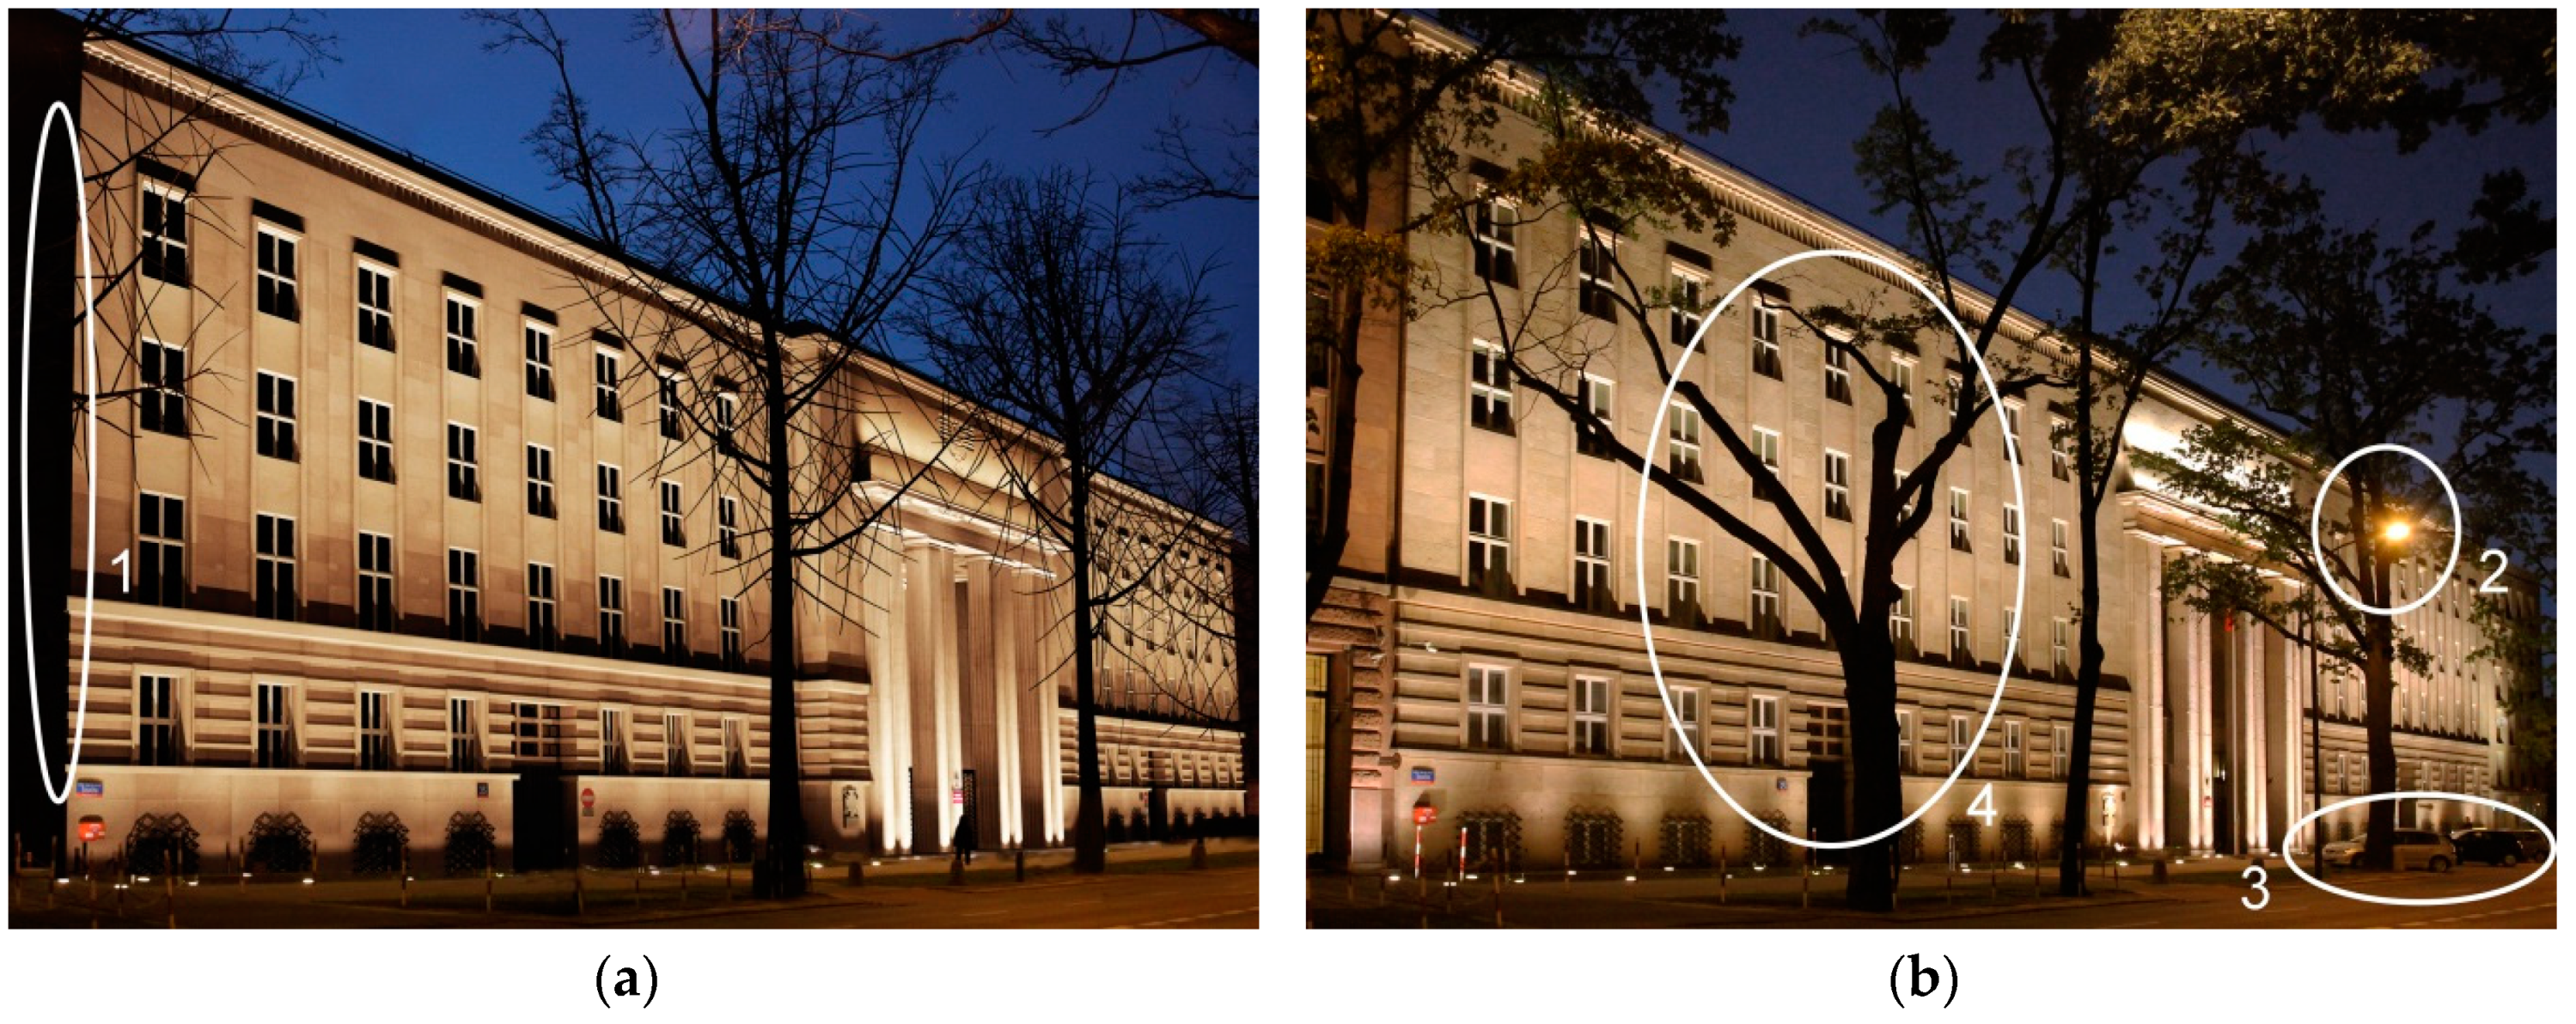
Some surveys by questionnaires were conducted on a larger group of respondents [66]. Moreover, 129 people in total were surveyed; therefore, it can be considered representative. Initially, only a visualisation image was presented and the respondents were asked for their opinion on the design implementation. It was a trick question. The aim was to check whether the surveyed would realise that they were dealing with a computer simulation and not a photo. None of the respondents called into question that the image they were assessing was not reality. The aim of next step was to check whether the surveyed correctly would identify the images while presenting them at the same time. In such a situation, 79 respondents could not clearly state which image a computer simulation was and which a picture was, often confusing them (50 respondents). It should be noted, however, that this time the surveyed observed two images at the same time, comparing them. The display time of the juxtaposed images was 10 s. As it turned out, the details—a shortage of an adjacent object on the right side of the analysed object, as well as of street lamp posts and of cars in the central part of the image—were decisive for the correct distinction between rendering and photograph (Figure 9).
As you can see—it is just a matter of refining the collage. On the other hand, the incorrect identification of photo as a rendering resulted from, how the respondents called it, the “strange” appearance of the tree in front of the object. It has such a form, in fact. However, it is important to remember the result of the first test, in which none of the respondents called into question the technical correctness of the rendering. In the case of juxtaposing the images, the surveyed clearly looked for any differences in them and drew their conclusions on this basis. With longer time, the recognition could have been higher.
5. Further Work
Although the computer simulations currently being developed for research purposes have many simplifications, it can be stated that the system operates correctly. The serious simplification is not to include the colour rendering index (CRI) in the image calculations. Obviously, it is very important for the visual perception of materials. Further work on the system will take this parameter into account. Then the analysis and colour calibration of the display used for the solution will also be necessary. Moreover, the material editing, especially defining the non-diffusive materials, requires improving. Currently, like in most graphic software packages, it is performed with the use of the material indicator curve by defining Specular Level and Glossiness parameters.
Moreover, there are plans to do some work on the system development towards augmented reality.
Then the block circuit of the system will look like what is shown in Figure 10. It is predicted that the camera C will also function as a spatial scanning of the object. Loading the geometric model (ABC) of the object will still be possible but not required.
A product prototype in the form of augmented reality glasses and specialised software for various operating systems will be created. There are also some plans to implement the technology on mobile devices. The user of such a mobile solution will be able to virtually check specific lighting solutions in the environment where they are. For example, in an online store, the user will choose a luminaire, which they visually like, and will be able to check, using the system, how it will look in the room, where it will be installed, and how it will illuminate the interior. The calculations will take into account both daylight in the object and its artificial lighting that will be at the moment of this type of designing, or virtual shopping. Designing of lighting will therefore become even smarter than presented in this article.
6. Conclusions
Currently, designing of lighting is mostly based on computer simulations, often ending with a photorealistic visualisation. However, they are only a graphic enrichment of the designs since the images can be presented on various media. Therefore, each time the analysis of lighting has to be carried out by means of false colour images, with the legend showing which colour corresponds to which luminance or illuminance value. It is reliable and technically correct. Nevertheless, the problem lies in the real perception of lighting by humans, and the developed system based on virtual reality technology solves it. The luminance distributions presented on the screen coincide with the real and calculated luminances. The accommodation and adaptation of the human eye to the conditions under which these designs are presented and the whole size of the illuminated objects are a big problem to the analysis of lighting designs in the form of computer visualizations. The use of VR technology, while maintaining the appropriate time needed for these processes, eliminates these disadvantages. The solution is innovative as evidenced by the granted patent protection for the method and system.
The solution as it stands has several limitations. It does not include the Colour Rendering Index, which is a very important parameter, having an impact on the colour of the perceived materials. Most software products currently used by designers also ignore this fact, however, the visualization side in the software is only an addition. The method for defining the reflective and refractive material properties also needs improving. The main aim of the paper, however, has been to check the opportunities the virtual reality opens up for a lighting designer.
As shown in the research, the respondents distinguished reality from virtuality only with the details and the quality of simulation, material rendering in particular. The use of VR technology for scientific purposes connected to lighting is therefore possible. However, efforts should be put into making the presentation of lighting designs in the form of visualisation not only realistic, but also technically correct above all. Only in such cases, it can be recognised that virtual reality technology in designing of lighting makes sense.
The current problem of designs based on computer visualisations lies in a high labour- and time-consuming nature of their development. It mainly arises from a demand for building a full geometric model of the lighting scene and performing some appropriate calculations for them. The technology of augmented reality, where people observe most surroundings with translucent glasses, will solve this problem in the future. The research shows that adding a carefully made visualisation image to a photograph of its surroundings causes the loss of ability to distinguish, such a collage from a traditional photograph of the illuminated object. That is why very high opportunities to design and evaluate lighting based on augmented reality are now opening up. Lighting designs and their analysis will become even smarter than today.
The system calibration is also an important aspect. Professional virtual reality glasses are compact smart devices. It is difficult to get to their display to calibrate it without damaging them. Therefore, it is worth considering whether the use of mobile devices is not a better solution. Their calibration is very simple. It also gives rise to the conclusion that the proposed solution will be generally available. Prices of professional VR glasses are not exorbitant anymore, however, perhaps a smartphone is not a cheaper, but it is certainly a more popular device.
Taking into consideration the capabilities of virtual and augmented reality, it can be said that lighting technology is a field of science where this technology will dynamically develop and play an important role in the future.
7. Patents
The solution described in the article is subject to patent protection No. PL231873 “The method for shaping luminance distribution and the system for shaping the luminance distribution”.
Funding
This research received no external funding.
Acknowledgments
Article Preparation Charge was covered by the Electrical Power Engineering Institute at The Warsaw University of Technology and the Open Access Charge was covered by the IDUB program at the Warsaw University of Technology.
Conflicts of Interest
The author declares no conflict of interest.
References
- Mansfield, K.P. Architectural lighting design: A research review over 50 years. Light. Res. Technol. 2018, 50, 80–97. [Google Scholar] [CrossRef] [Green Version]
- Veitch, J.A.; Davis, R.G. Lighting Research Today: The More Things Change, the More They Stay the Same. LEUKOS J. Illum. Eng. Soc. N. Am. 2019, 15, 77–83. [Google Scholar] [CrossRef] [Green Version]
- Mazur, D.; Wachta, H.; Leśko, K. Research of cohesion principle in illuminations of monumental Objects. Lect. Notes Electr. Eng. 2018, 452, 395–406. [Google Scholar] [CrossRef]
- Fernandez-Prieto, D.; Hagen, H. Visualization and analysis of lighting design alternatives in simulation software. Appl. Mech. Mater. 2017, 869, 212–225. [Google Scholar] [CrossRef] [Green Version]
- Mantzouratos, N.; Gardiklis, D.; Dedoussis, V.; Kerhoulas, P. Concise exterior lighting simulation methodology. Build. Res. Inf. 2004, 32, 42–47. [Google Scholar] [CrossRef]
- Malska, W.; Wachta, H. Elements of Inferential Statistics in a Quantitative Assessment of Illuminations of Architectural Structures. In Proceedings of the 2016 IEEE Lighting Conference of the Visegrad Countries (Lumen V4), IEEE, Karpacz, Poland, 13–16 September 2016; pp. 1–6. [Google Scholar]
- Baloch, A.A.; Shaikh, P.H.; Shaikh, F.; Leghari, Z.H.; Mirjat, N.H.; Uqaili, M.A. Simulation tools application for artificial lighting in buildings. Renew. Sustain. Energy Rev. 2018, 82, 3007–3026. [Google Scholar] [CrossRef]
- Wachta, H.; Bojda, P. Usability of Luminaries with LED Sources to Illuminate the Window Areas of Architectural Objects. In Proceedings of the 2016 13th Selected Issues of Electrical Engineering and Electronics (WZEE), IEEE, Rzeszów, Poland, 4–8 May 2016; pp. 1–6. [Google Scholar]
- Zaikina, V.; Szyninska Matusiak, B. Verification of the Accuracy of the Luminance-Based Metrics of Contour, Shape, and Detail Distinctness of 3D Object in Simulated Daylit Scene by Numerical Comparison with Photographed HDR Images. LEUKOS J. Illum. Eng. Soc. N. Am. 2017, 13, 177–188. [Google Scholar] [CrossRef]
- Khosrowshahi, F.; Alani, A. Visualisation of impact of time on the internal lighting of a building. Autom. Constr. 2011, 20, 145–154. [Google Scholar] [CrossRef]
- Słomiński, S.; Krupiński, R. Luminance distribution projection method for reducing glare and solving object-floodlighting certification problems. Build. Environ. 2018, 134, 87–101. [Google Scholar] [CrossRef]
- Chew, I.; Karunatilaka, D.; Tan, C.P.; Kalavally, V. Smart lighting: The way forward? Reviewing the past to shape the future. Energy Build. 2017, 149, 180–191. [Google Scholar] [CrossRef]
- Tural, M.; Yener, C. Lighting monuments: Reflections on outdoor lighting and environmental appraisal. Build. Environ. 2006, 41, 775–782. [Google Scholar] [CrossRef]
- Yan, Z.; Lv, Z. The Influence of Immersive Virtual Reality Systems on Online Social Application. Appl. Sci. 2020, 10, 5058. [Google Scholar] [CrossRef]
- Xie, Z. The Symmetries in Film and Television Production Areas Based on Virtual Reality and Internet of Things Technology. Symmetry 2020, 12, 1377. [Google Scholar] [CrossRef]
- Ahir, K.; Govani, K.; Gajera, R.; Shah, M. Application on Virtual Reality for Enhanced Education Learning, Military Training and Sports. Augment. Hum. Res. 2020, 5, 7. [Google Scholar] [CrossRef]
- Zhang, Y.; Liu, H.; Kang, S.C.; Al-Hussein, M. Virtual reality applications for the built environment: Research trends and opportunities. Autom. Constr. 2020, 118, 103311. [Google Scholar] [CrossRef]
- Scorpio, M.; Laffi, R.; Masullo, M.; Ciampi, G.; Rosato, A.; Maffei, L.; Sibilio, S. Virtual Reality for Smart Urban Lighting Design: Review, Applications and Opportunities. Energies 2020, 13, 3809. [Google Scholar] [CrossRef]
- Kalantari, S.; Neo, J.R.J. Virtual Environments for Design Research: Lessons Learned From Use of Fully Immersive Virtual Reality in Interior Design Research. J. Inter. Des. 2020, 45, 27–42. [Google Scholar] [CrossRef]
- Wolfartsberger, J. Analyzing the potential of Virtual Reality for engineering design review. Autom. Constr. 2019, 104, 27–37. [Google Scholar] [CrossRef]
- de Klerk, R.; Duarte, A.M.; Medeiros, D.P.; Duarte, J.P.; Jorge, J.; Lopes, D.S. Usability studies on building early stage architectural models in virtual reality. Autom. Constr. 2019, 103, 104–116. [Google Scholar] [CrossRef]
- Getuli, V.; Capone, P.; Bruttini, A.; Isaac, S. BIM-based immersive Virtual Reality for construction workspace planning: A safety-oriented approach. Autom. Constr. 2020, 114, 103160. [Google Scholar] [CrossRef]
- Eiris, R.; Gheisari, M.; Esmaeili, B. Desktop-based safety training using 360-degree panorama and static virtual reality techniques: A comparative experimental study. Autom. Constr. 2020, 109, 102969. [Google Scholar] [CrossRef]
- Lee, J.G.; Seo, J.; Abbas, A.; Choi, M. End-Users’ Augmented Reality Utilization for Architectural Design Review. Appl. Sci. 2020, 10, 5363. [Google Scholar] [CrossRef]
- Paes, D.; Arantes, E.; Irizarry, J. Immersive environment for improving the understanding of architectural 3D models: Comparing user spatial perception between immersive and traditional virtual reality systems. Autom. Constr. 2017, 84, 292–303. [Google Scholar] [CrossRef]
- Shi, Y.; Du, J.; Ahn, C.R.; Ragan, E. Impact assessment of reinforced learning methods on construction workers’ fall risk behavior using virtual reality. Autom. Constr. 2019, 104, 197–214. [Google Scholar] [CrossRef]
- Buyukdemircioglu, M.; Kocaman, S. Reconstruction and Efficient Visualization of Heterogeneous 3D City Models. Remote Sens. 2020, 12, 2128. [Google Scholar] [CrossRef]
- Obradović, M.; Vasiljević, I.; Durić, I.; Kićanović, J.; Stojaković, V.; Obradović, R. Virtual reality models based on photogrammetric surveys-a case study of the iconostasis of the serbian orthodox cathedral church of saint nicholas in Sremski Karlovci (Serbia). Appl. Sci. 2020, 10, 2743. [Google Scholar] [CrossRef]
- Zhang, Y.; Liu, H.; Zhao, M.; Al-Hussein, M. User-centered interior finishing material selection: An immersive virtual reality-based interactive approach. Autom. Constr. 2019, 106, 102884. [Google Scholar] [CrossRef]
- Ammanuel, S.; Brown, I.; Uribe, J.; Rehani, B. Creating 3D models from Radiologic Images for Virtual Reality Medical Education Modules. J. Med. Syst. 2019, 43, 166. [Google Scholar] [CrossRef]
- Tejera, D.; Beltran-Alacreu, H.; Cano-de-la-Cuerda, R.; Leon Hernández, J.V.; Martín-Pintado-Zugasti, A.; Calvo-Lobo, C.; Gil-Martínez, A.; Fernández-Carnero, J. Effects of Virtual Reality versus Exercise on Pain, Functional, Somatosensory and Psychosocial Outcomes in Patients with Non-specific Chronic Neck Pain: A Randomized Clinical Trial. Int. J. Environ. Res. Public Health 2020, 17, 5950. [Google Scholar] [CrossRef]
- Berton, A.; Longo, U.G.; Candela, V.; Fioravanti, S.; Giannone, L.; Arcangeli, V.; Alciati, V.; Berton, C.; Facchinetti, G.; Marchetti, A.; et al. Virtual Reality, Augmented Reality, Gamification, and Telerehabilitation: Psychological Impact on Orthopedic Patients’ Rehabilitation. J. Clin. Med. 2020, 9, 2567. [Google Scholar] [CrossRef]
- Mazurek, J.; Kiper, P.; Cieślik, B.; Rutkowski, S.; Mehlich, K.; Turolla, A.; Szczepańska-Gieracha, J. Virtual reality in medicine: A brief overview and future research directions. Hum. Mov. 2019, 20, 16–22. [Google Scholar] [CrossRef] [Green Version]
- Trappey, A.; Trappey, C.; Chang, C.-M.; Kuo, R.; Lin, A.; Nieh, C.H. Virtual Reality Exposure Therapy for Driving Phobia Disorder: System Design and Development. Appl. Sci. 2020, 10, 4860. [Google Scholar] [CrossRef]
- Jiménez Fernández-Palacios, B.; Morabito, D.; Remondino, F. Access to complex reality-based 3D models using virtual reality solutions. J. Cult. Herit. 2017, 23, 40–48. [Google Scholar] [CrossRef]
- Shehade, M.; Stylianou-Lambert, T. Virtual Reality in Museums: Exploring the Experiences of Museum Professionals. Appl. Sci. 2020, 10, 4031. [Google Scholar] [CrossRef]
- Huang, K.T.; Ball, C.; Francis, J.; Ratan, R.; Boumis, J.; Fordham, J. Augmented versus virtual reality in education: An exploratory study examining science knowledge retention when using augmented reality/virtual reality mobile applications. Cyberpsychol. Behav. Soc. Netw. 2019, 22, 105–110. [Google Scholar] [CrossRef]
- Jin, Y.-H.; Hwang, I.-T.; Lee, W.-H. A Mobile Augmented Reality System for the Real-Time Visualization of Pipes in Point Cloud Data with a Depth Sensor. Electronics 2020, 9, 836. [Google Scholar] [CrossRef]
- Chamilothori, K.; Wienold, J.; Andersen, M. Adequacy of Immersive Virtual Reality for the Perception of Daylit Spaces: Comparison of Real and Virtual Environments. LEUKOS J. Illum. Eng. Soc. North Am. 2019, 15, 203–226. [Google Scholar] [CrossRef] [Green Version]
- Mattoni, B.; Pompei, L.; Losilla, J.C.; Bisegna, F. Planning smart cities: Comparison of two quantitative multicriteria methods applied to real case studies. Sustain. Cities Soc. 2020, 60, 102249. [Google Scholar] [CrossRef]
- Pracki, P.; Skarżyński, K. A Multi-Criteria Assessment Procedure for Outdoor Lighting at the Design Stage. Sustainability 2020, 12, 1330. [Google Scholar] [CrossRef] [Green Version]
- Zielińska-Dabkowska, K.M.; Xavia, K.; Bobkowska, K. Assessment of Citizens’ Actions against Light Pollution with Guidelines for Future Initiatives. Sustainability 2020, 12, 4997. [Google Scholar] [CrossRef]
- Skarżyński, K. Field Measurement of Floodlighting Utilisation Factor. In Proceedings of the 2016 IEEE Lighting Conference of the Visegrad Countries (Lumen V4), IEEE, Karpacz, Poland, 13–16 September 2016; pp. 1–4. [Google Scholar]
- Zielińska-Dabkowska, K.M.; Xavia, K. Global Approaches to Reduce Light Pollution from Media Architecture and Non-Static, Self-Luminous LED Displays for Mixed-Use Urban Developments. Sustainability 2019, 11, 3446. [Google Scholar] [CrossRef] [Green Version]
- Heydarian, A.; Carneiro, J.P.; Gerber, D.; Becerik-Gerber, B. Immersive virtual environments, understanding the impact of design features and occupant choice upon lighting for building performance. Build. Environ. 2015, 89, 217–228. [Google Scholar] [CrossRef]
- Soori, P.K.; Vishwas, M. Lighting control strategy for energy efficient office lighting system design. Energy Build. 2013, 66, 329–337. [Google Scholar] [CrossRef]
- Skarżyński, K. Methods of Calculation of Floodlighting Utilisation Factor at the Design Stage. Light Eng. 2018, 144–152. [Google Scholar] [CrossRef]
- Giordano, E. Outdoor lighting design as a tool for tourist development: The case of Valladolid. Eur. Plan. Stud. 2018, 26, 55–74. [Google Scholar] [CrossRef] [Green Version]
- Chen, L.Y.; Chen, S.H.; Dai, S.J.; Kuo, C.T.; Wang, H.C. Spectral design and evaluation of OLEDs as light sources. Org. Electron. 2014, 15, 2194–2209. [Google Scholar] [CrossRef]
- Krupiński, R. Luminance distribution projection method in dynamic floodlight design for architectural features. Autom. Constr. 2020, 119, 103360. [Google Scholar] [CrossRef]
- Moscoso, C.; Chamilothori, K.; Wienold, J.; Andersen, M.; Matusiak, B. Window Size Effects on Subjective Impressions of Daylit Spaces: Indoor Studies at High Latitudes Using Virtual Reality. LEUKOS 2020, 1–23. [Google Scholar] [CrossRef] [Green Version]
- Heydarian, A.; Pantazis, E.; Wang, A.; Gerber, D.; Becerik-Gerber, B. Towards user centered building design: Identifying end-user lighting preferences via immersive virtual environments. Autom. Constr. 2017, 81, 56–66. [Google Scholar] [CrossRef]
- Chen, Y.; Cui, Z.; Hao, L. Virtual reality in lighting research: Comparing physical and virtual lighting environments. Light. Res. Technol. 2019, 51, 820–837. [Google Scholar] [CrossRef]
- Navvab, M.; Bisegna, F.; Gugliermetti, F. Evaluation of historical museum interior lighting system using fully immersive virtual luminous environment. Opt. Arts Archit. Archaeol. IV 2013, 8790, 87900F. [Google Scholar] [CrossRef]
- Jiang, L.; Masullo, M.; Maffei, L.; Meng, F.; Vorländer, M. How do shared-street design and traffic restriction improve urban soundscape and human experience?—An online survey with virtual reality. Build. Environ. 2018, 143, 318–328. [Google Scholar] [CrossRef]
- Vitsas, N.; Papaioannou, G.; Gkaravelis, A.; Vasilakis, A.A. Illumination-Guided Furniture Layout Optimization. Comput. Graph. Forum 2020, 39, 291–301. [Google Scholar] [CrossRef]
- Natephra, W.; Motamedi, A.; Fukuda, T.; Yabuki, N. Integrating building information modeling and virtual reality development engines for building indoor lighting design. Vis. Eng. 2017, 5, 19. [Google Scholar] [CrossRef] [Green Version]
- Heydarian, A.; Pantazis, E.; Carneiro, J.P.; Gerber, D.; Becerik-Gerber, B. Lights, building, action: Impact of default lighting settings on occupant behaviour. J. Environ. Psychol. 2016, 48, 212–223. [Google Scholar] [CrossRef] [Green Version]
- Chamilothori, K.; Chinazzo, G.; Rodrigues, J.; Dan-Glauser, E.S.; Wienold, J.; Andersen, M. Subjective and physiological responses to façade and sunlight pattern geometry in virtual reality. Build. Environ. 2019, 150, 144–155. [Google Scholar] [CrossRef]
- Pracki, P. The impact of room and luminaire characteristics on general lighting in interiors. Bull. Polish Acad. Sci. Tech. Sci. 2020, 68, 447–457. [Google Scholar] [CrossRef]
- Murdoch, M.J.; Stokkermans, M.G.M.; Lambooij, M. Towards perceptual accuracy in 3D visualizations of illuminated indoor environments. J. Solid State Light. 2015, 2, 12. [Google Scholar] [CrossRef] [Green Version]
- Oziębło, I. Virtual Reality of the Lighting Project; The Faculty of Electrical Engineering, Warsaw University of Technology: Warsaw, Poland, 3 July 2018. [Google Scholar]
- Villa, C.; Bremond, R.; Saint-Jacques, E. Assessment of Pedestrian Discomfort Glare from Urban LED Lighting. Light. Reseach Technol. 2017, 49, 147–172. [Google Scholar] [CrossRef]
- Słomiński, S. Potential Resource of Mistakes Existing While Using the Modern Methods of Measurement and Calculation in the Glare Evaluation. In Proceedings of the 2016 IEEE Lighting Conference of the Visegrad Countries (Lumen V4), IEEE, Karpacz, Poland, 13–16 September 2016; pp. 1–5. [Google Scholar]
- Słomiński, S. Advanced modelling and luminance analysis of LED optical systems. Bull. Polish Acad. Sci. Tech. Sci. 2019, 67, 1107–1116. [Google Scholar] [CrossRef]
- Krupiński, R. Evaluation of Lighting Design Based on Computer Simulation. In Proceedings of the 2018 VII Lighting Conference of the Visegrad Countries (Lumen V4), IEEE, Trebic, Czech Republic, 18–20 September 2018; pp. 1–5. [Google Scholar]
Figure 1.
Block circuit of object illumination virtual reality designing system: PC + S—Personal Computer with Software, VRG—Virtual Reality Glasses, SR—Spectroradiometer, C—Camera, RO—Real Object, ABC—Virtual Model of Object, VLD—Virtual Luminaire Data, A1B1C1—Luminaire Dimensions, LID—Luminaire Intensity Distribution, SC—Spectral Composition of Light, RGB—Colour Components of Real Object, XYZR—Position and Orientation of Virtual Luminaire Data (VLD), OXYZR—Observer’s Position and Orientation, L—Luminance Distribution, R1G1B1—Colour Compositions of Light (L), R2G2B2—colour compositions of differential image between RGB and R1G1B1.

Figure 2.
Panoramic rendering of: (a) virtual and (b) photograph of real room [62].
Figure 2.
Panoramic rendering of: (a) virtual and (b) photograph of real room [62].

Figure 3.
Rendering shot displayed in: (a) virtual reality glasses and (b) photo rendering room for left and right eye.
Figure 3.
Rendering shot displayed in: (a) virtual reality glasses and (b) photo rendering room for left and right eye.

Figure 4.
Layout of luminance measuring points in interior.

Figure 5.
Calibrated visualisation and photograph images with measured luminance distributions [cd/m2]. (a) Object visualisation in 360 deg technology; (b) Photograph in 360 deg technology; (c) luminance distribution of visualisation in 360 deg; (d) luminance distribution of photograph in 360 deg; (e) VR visualisation for left and right eye; (f) VR photo for left and right eye; (g) VR luminance distribution of visualisation for left and right eye; (h) VR luminance distribution of photo for left and right eye.

Figure 6.
Comparison of: (a) computer visualisation of object with (b) post-implementation photo of analysed object.
Figure 6.
Comparison of: (a) computer visualisation of object with (b) post-implementation photo of analysed object.

Figure 7.
Comparison of luminance measurements of VR display for: (a) rendering and (b) post-implementation photograph.
Figure 7.
Comparison of luminance measurements of VR display for: (a) rendering and (b) post-implementation photograph.

Figure 8.
Computer-generated luminance distribution on virtual object.

Figure 9.
Image details which resulted in making correct identification of: (a) visualisation and (b) photo of analysed object. 1—no adjacent building; 2—street lamp; 3—parked cars; 4—unnatural appearance of tree.
Figure 9.
Image details which resulted in making correct identification of: (a) visualisation and (b) photo of analysed object. 1—no adjacent building; 2—street lamp; 3—parked cars; 4—unnatural appearance of tree.

Figure 10.
Block circuit of object illumination system designing by Virtual and Augmented Reality. ARG—Augmented Reality Glasses.
Figure 10.
Block circuit of object illumination system designing by Virtual and Augmented Reality. ARG—Augmented Reality Glasses.


Table 1.
Luminance levels at measuring points [62].
Table 1.
Luminance levels at measuring points [62].
| Measuring Point | Real Luminance (cd/m2) | Render Luminance (cd/m2) | Photo Luminance (cd/m2) |
|---|---|---|---|
| 1. Kitchen floor | 1.57 | 13.3 | 39.6 |
| 2. Divan (leather) | 1.98 | 2.75 | 17.5 |
| 3. Black wall | 2.47 | 1.97 | 12.7 |
| 4. Worktop | 4.84 | 167 | 51.36 |
| 5. Blind | 7.63 | 21.5 | 25.3 |
| 6. Brick | 10.5 | 82.9 | 155 |
| 7. White wall | 19.43 | 321 | 298 |
| 8. Living room floor | 24.7 | 109 | 165 |
| 9. Living room ceiling | 27.28 | 258 | 306 |
| 10. Fridge | 27.36 | 420 | 303 |
Publisher’s Note: MDPI stays neutral with regard to jurisdictional claims in published maps and institutional affiliations. |
© 2020 by the author. Licensee MDPI, Basel, Switzerland. This article is an open access article distributed under the terms and conditions of the Creative Commons Attribution (CC BY) license (http://creativecommons.org/licenses/by/4.0/).
Share and Cite
MDPI and ACS Style
Krupiński, R. Virtual Reality System and Scientific Visualisation for Smart Designing and Evaluating of Lighting. Energies 2020, 13, 5518. https://0-doi-org.brum.beds.ac.uk/10.3390/en13205518
AMA Style
Krupiński R. Virtual Reality System and Scientific Visualisation for Smart Designing and Evaluating of Lighting. Energies. 2020; 13(20):5518. https://0-doi-org.brum.beds.ac.uk/10.3390/en13205518
Chicago/Turabian StyleKrupiński, Rafał. 2020. "Virtual Reality System and Scientific Visualisation for Smart Designing and Evaluating of Lighting" Energies 13, no. 20: 5518. https://0-doi-org.brum.beds.ac.uk/10.3390/en13205518
Note that from the first issue of 2016, this journal uses article numbers instead of page numbers. See further details here.