Feasibility of a 100% Global Renewable Energy System


1
Department of Design, Monash University-Caulfield Campus, P.O. Box 197, Caulfield East, Victoria 3145, Australia
2
Department of Mechanical and Aerospace Engineering, Monash University-Clayton Campus, P.O. Box 31, Victoria 3800, Australia
*
Author to whom correspondence should be addressed.
Energies 2020, 13(21), 5543; https://0-doi-org.brum.beds.ac.uk/10.3390/en13215543
Submission received: 23 August 2020
/
Revised: 30 September 2020
/
Accepted: 10 October 2020
/
Published: 22 October 2020
(This article belongs to the Special Issue Rethinking Energy: Earth System Science Approaches 2021)
Abstract
:Controversy exists as to whether renewable energy (RE) can provide for all the world’s energy needs. The purpose of this paper is to help resolve this vital question. Official forecasts see a resumption of a business-as-usual world after the pandemic-induced recession, with further economic growth out to at least 2050. The novel approach taken in this paper is to assume that such a world is fueled entirely with RE at global energy levels at or above those of today, and then to examine whether this scenario is feasible. Because the intermittent primary electricity sources, wind, and solar power, would have to supply nearly all this energy, a simplification made for this analysis is that they do supply 100% of all energy, including non-electrical energy needs. It is found that the energy that could be delivered by these two sources is much less than often assumed, for several reasons: The declining quality of inputs; the need for inclusion of uncounted environmental costs; the need for energy conversion and storage; and the removal of existing fossil fuel energy subsidies. It is concluded that a future world entirely fuelled by RE would necessarily be a lower-energy one.
1. Introduction
In recent years, a number of articles have been published in the reviewed literature arguing that renewable energy (RE) can provide for all energy needs (see, e.g., [1,2,3,4,5,6,7]). RE includes all direct and indirect solar energy sources (direct solar, wind, wave, ocean thermal, and hydro energy), plus two non-solar sources, geothermal and tidal energy. On the other hand, other researchers have cast doubt on this claim (see, e.g., [8,9,10,11,12,13,14,15,16,17]). The topic is clearly of vital importance, given the risks of both serious climate change and eventual depletion of fossil fuel (FF) reserves if their use continues at the level of recent years. Even today, FF energy security is seen as a problem.
This paper is an attempt to address the important question: Can RE provide for all energy needs in a growth-oriented business-as-usual (b-a-u) world? The World Bank mid-2020 forecast is that global GDP will fall 5.2% in 2020, but that recovery will occur in 2021, with 4.2% economic growth [18]. The novel approach taken in this paper is to assume a world fueled entirely with RE at primary energy levels at or above those of today, and to examine whether this scenario is feasible. There is no controversy about RE fuelling a world with energy consumption only a small fraction of today’s levels—it already provides around 14% of global energy needs, according to the International Energy Agency (IEA) [19]. Accordingly, the scenario assumes that global energy needs are at or above the level in 2019. This 100% RE level, if attained at all, could be achieved only in several decades time (see Section 3), hence a further assumption is that 100% RE does not occur in a b-a-u world until mid-century.
RE is not the only non-carbon energy source. Nuclear fission energy has a minor and declining share of global electricity [19]. Fusion researcher Richard Kembleton has examined the prospects for fusion power. He concluded that [20] (p. 218): ‘Even the most well-developed current research plans do not lead to commercial fusion energy being widely available before the end of the century, meaning it is a long-term low-carbon solution not a near-term fix for current climate change issues.’ Fusion energy, if and when it is commercially available, will not be not an energy contender in our year 2050 time-frame.’
This introductory section has briefly shown that there is no agreement among energy researchers as to whether RE can provide for all global energy needs. Section 2 examines the constraints on hydro, geothermal, and biomass energy, concluding that even in 2050, their scope will be limited; wind and solar energy must therefore supply nearly all energy in a 100% RE future. Section 3 argues that for high levels of energy use, 100% RE is very unlikely to obtain before mid-century. Section 4 reviews the published literature on the energy return on energy invested (EREOI) for both wind and solar energy, emphasizing the wide range in published values. Section 5 shows that likely values for the EREOI of the global energy system would be significantly lower than today, if all energy needed in a b-a-u world in 2050 was supplied by wind and solar. Finally, Section 6 summarises the findings and draws policy implications for energy and economic growth.
2. General Constraints on Hydro, Geothermal, and Biomass Energy
The leading form of RE today is biomass, mainly fuel wood consumed in low-income countries. In 2017, it accounted for an estimated 9.5% of global primary energy [19]. Although some researchers see modern bioenergy as a major future global energy source [21], strong competition from the other main uses for biomass—food, forage, fibre, and forestry—will heavily restrict its growth, as will the need to preserve biodiversity [22,23]. Further, by 2050, the UN median estimated that global population would rise from the 2020 level of 7.8 billion to around 9.7 billion [24], and non-energy biomass needs can be expected to rise proportionately. Liquid biofuels in 2019 accounted for only 4.1 exajoule (EJ = 1018 joule) globally, with US and Brazil together supplying 62% of the total [25]. Further, expansion of tree-cover for bioenergy plantations in northern climates, while drawing down CO2, would tend to decrease local albedo (by replacing high-albedo snow cover with lower-albedo tree cover), thus raising temperatures [21].
For electricity generation, hydropower dominates RE sources, accounting for 15.6% of global total electricity in 2019. Only 32.7% of global hydro generated (and used) in that year was in Organization for Economic Cooperation and Development (OECD) countries, although the OECD produced most of the world’s wind, solar, and other non-hydro RE electricity [25]. The gross global technical potential for hydro may be large [26], but the exploitable potential (which considers environmental constraints) is far smaller, estimated at around 16,000 terawatt-hours (TWh = 1012 watt-hours) [27], compared with the 2019 hydropower output of 4222 TWh [25]. However, even at this low present level, serious environmental problems are being encountered [14,28,29,30]. Climate-induced changes in stream-flow temporal patterns, reservoir siltation and evaporation, and even Amazon deforestation, could all adversely affect levels of hydroelectricity in coming decades [14]. Further, as Laghari [31] has stressed, in important regions such as the Himalayas, shrinking glaciers from climate change could eventually lower the region’s hydropotential.
Output from the other main dispatchable RE electricity sources, bioenergy and geothermal, are negligible and only growing slowly [25]. As already discussed, sustainable biomass potential for all energy uses, including electricity production, is limited. Global technical potential for geothermal electricity, estimated to be in the range 1.1–22 EJ, is also very small, and could never supply more than a small fraction of even the 2019 electrical output of 237 EJ [25,29,32]. From around 2011, annual global growth in installed capacity has been linear, with about 250 megawatts (MW = 106 watt) added annually [25]. Enhanced Geothermal Systems have been researched for more than two decades, but there is still no widespread utilization of such systems [33]. Induced seismicity is a risk and has halted several projects.
The case of Japan, with a half-century of geothermal power development, is instructive. At an estimated 23,400 MW, Japan has the world’s third largest geothermal potential, after the USA and Indonesia [34]. However, in 2019, only 525 MW was in operation, or a little over 2% of the potential [25]. Yet the average capacity factor for geothermal power from its around 20 power plants has steadily fallen from over 80% in the early 1970s to under 60% by 2010, even given technology advances [34]. This steady decline suggests that the feasible potential may be up to an order of magnitude lower than the published potential. Furthermore, around 80% of the published potential is located inside national parks. There is large global theoretical potential for geothermal heat, but actual use will be restricted, because it can only be used locally [14,34,35].
Table 1 shows the top 10 countries by geothermal capacity in 2019. The world total of 13.9 gigawatts (GW = 109 watt) is small compared with the combined wind/solar capacity of 1219 GW installed by the same date.
The potential for tidal electricity is likewise small. According to van Haren [36], probably less than 100 gigawatts GW of tidal power could be installed globally, compared with about 623 GW for wind power already installed by 2019 [25]. He concluded that its small potential still had significant ecological costs. In 2019, total installed capacity was only 531 MW, almost entirely in France and South Korea [37].
The conclusion is that for a RE future, we must rely heavily on intermittent RE sources, chiefly wind and solar, a conclusion shared by both the US Energy Information Administration [EIA] [38,39,40] and the IEA [19]. These two energy sources would then need to meet nearly all global energy needs, both electric and non-electric [14]. Even if wind and solar energy were not intermittent, some conversion to another energy carrier (possibly hydrogen) would still be needed to meet these non-electric energy demands. Energy losses are inevitably involved in conversion to a non-electric form for storage.
3. Evaluation Under Future Conditions is Needed for a 100% RE Scenario
In 2018, global consumption of primary energy (excluding non-commercial energy) was 583.9 exajoule EJ, up 1.3% from the previous year. Fossil fuel use accounted for 84.3% of this total and was still rising in absolute terms. (Emissions of CO2 from FF combustion and industry rose to 34.17 billion tonnes, a 0.5% increase on 2018 emissions [25]). In 2019 solar and wind combined contributed only 8.0% of global electricity [25]. What will global energy use be in 2050? As is clear from the forecasts made in 2019 for the year 2020, predicting the future, even a year ahead, can be a risky business [38,41].
Global long-range primary energy projections—all made before the coronavirus pandemic impacted the world in 2020—are available from such organisations as the EIA [39,40], BP [42], ExxonMobil [43], the IEA [19], the International Renewable Energy Agency (IRENA) [44], and the Organization of Petroleum Exporting Countries (OPEC) [45]. All have forecast global energy use continuing to rise to some extent out to 2040 and even beyond, mainly driven by continued growth in non-OECD countries. The EIA [39], for example, in their Base Case, forecast a 2040 global primary energy use of 780 EJ, up from 607 EJ in 2015 (both figures including non-commercial energy). Increases are predicted for all energy types, including FFs. Non-OECD nations, which have slower uptake of RE [42], are then forecast to account for nearly two-thirds of total energy use. The single-value OPEC and ExxonMobil forecasts for 2040 are, respectively, 745 EJ and 678 EJ. BP use two scenarios, Evolving Transition, and a lower energy scenario, Rapid Transition. The forecasts for 2040, which exclude non-commercial energy, are 749 EJ and 686 EJ, respectively.
The IEA [46] have assessed future energy use and greenhouse gas (GHG) emissions under two scenarios: The New Policies Scenario (NPS) and the Sustainable Development Scenario (SDS). NPS ‘Incorporates existing energy policies as well as an assessment of the results likely to stem from the implementation of announced policy intentions.’ Under the NPS scenario, primary energy use would increase significantly, to 700 EJ by 2040. SDS goes far further, with ‘an integrated approach to achieving internationally agreed objectives on climate change’. Global energy use at 570 EJ in 2040, would be slightly below its 2019 level. Nevertheless, 60% of primary energy in 2040 would still come from FFs, with their emissions reduced by either carbon capture and storage, or negative emissions technologies. Dynamic energy considerations also suggest that net RE output growth will be constrained [47], particularly if EROEI values for RE are low (See Section 5).
Regardless of future energy levels, all forecasts assumed that strong global economic growth would continue. Such growth would presumably lead to global increases in land use, particularly land for urban development, industry, and transport infrastructure; water for agriculture and cities; and various materials, including copper and elements with limited global resources, that are nevertheless vital for applications such as electronics, but also for PV cells and wind turbine motors. It is true that RE sources other than wind and solar will continue to have some share in future energy production, and in a few countries could even be dominant. However, for simplicity in the ‘what if’ thought experiment which follows, the intermittent primary electricity sources wind and solar (including solar thermal plants) are assumed to not only provide all energy for a still growing global market economy, but to compete for vital RE inputs including land, water, and materials, with the non-energy sectors of the global economy.
4. Review of EROEI Evaluation in the Literature
Knowing the EROEI for wind and solar energy is vital for assessing whether they can together provide energy at levels as least as high as today, and many published papers have discussed their EROEI values. However, it is often very difficult to compare the findings of different researchers. This problem arises, not only because of different conditions in the analyses (rated capacity, year of installation, insolation or wind speed levels, type of PV cells, etc.), but also because different researchers have used different approaches for calculation (process, input–output, or hybrid method) and different boundaries for their analyses. There is also a need to factor in changes in energy inputs as technology develops; EROEI can be time-dependent, based on the maturity of the technology. Unless otherwise stated, the EROEI values in this section refer to electrical energy output/primary energy inputs.
Given this confusion, Hall and colleagues [48,49,50] and de Castro and Capellán-Pérez [51] have attempted stress the importance of EROEI, and to put its calculation on a more consistent footing. Hall [48] argued that EROEI was ‘a unifying principle for biology, economics, and sustainability’. In his book [49], he illustrated its connection to economics, pointing out that for US oil and gas, EROEI and costs are inversely related. Further, the EROEI for RE sources is less than often assumed [50], because of externalities, a point discussed further in Section 5.2.
According to de Castro and Capellán-Pérez [51], the most-used EROEIs are: ‘standard’ (measured at the ‘farm-gate’); final (at the consumer point-of-use); and ‘extended’ (which includes indirect investments as further inputs). They regarded the extended EROEI as being the most relevant. Hall et al. [52] have argued that for functioning of an industrial society, as assumed here, an EROEI value of at least 3 is needed for both corn-based ethanol and oil, measured at the farmgate/mine mouth. Weißbach et al. [53] found an ‘economic threshold’ for EREOI of 7, while Fizaine and Court [54] have even argued that for the US, an EROEI of 11 was needed for economic growth to continue. Once a minimum value of EREOI is assumed, it is, in principle, possible to read off the total energy available from the EROEI vs. cumulative output curves for each RE type. Raugei [55] has, however, warned that the use of single values for minimum EROEI is too simplistic.
4.1. EREOI for Solar Energy
Much controversy surrounds the EROEI values for both wind and solar energy—and for other RE sources as well. Several authors have cast doubt on the ability of PV electricity to even produce a positive return on invested energy, (e.g., [56,57]), when inputs are assessed as equivalent electrical energy, and outputs as electrical energy. Louwen et al. [58] found that PV electricity only achieved the breakeven point for net energy production some time between 1997 and 2018. They stressed that considerable uncertainties existed for both installed capacity and electricity output for PV systems. Floyd and Palmer [59] also researched the variability in net energy analysis of PV systems, and found that ‘most of the apparent divergence between studies is accounted for by six factors—life-cycle assessment methodology, age of the primary data, PV cell technology, the treatment of intermittency, equivalence of investment and output energy forms, and assumptions about real-world performance.’ Insolation levels are very important; a study of rooftop PV systems just across Europe [60] reported EROEI values varying between around 1.6 and 5, depending on location.
Other researchers have argued that PV systems are already returning a high return on energy invested. Pickard [61] performed a simple analysis on PV systems, and found the EROEI value to have a minimum of about five. Raugei et al. [62], in their response to the Ferroni and Hopkirk article [56], claimed that the latter authors had underestimated PV EROEI by ‘an order-of-magnitude’. They disagreed with Ferroni and Hopkirk on the inclusion of labour and capital as input energy costs. While their inclusion is certainly contentious, energy inputs should properly include a share of relevant office energy consumption, as well as travel energy for site visits, meetings, etc., connected with PV installations.
Espinosa et al. [63] even entitled their article ‘Solar cells with one-day energy payback for the factories of the future’. They envisaged such cells being possible by year 2050.
Liu and van den Bergh [64] performed a very comprehensive analysis on the EROEI (and CO2 emissions) for various types of PV cell, either roof- or ground-installed, with an average insolation value of 1700 kWh/m2/year. They found large variations in EROEI, with a range from under 4 to over 15. However, an assumed life of 30 years was used; reducing this lifetime to 20 years significantly lowered the EROEI values.
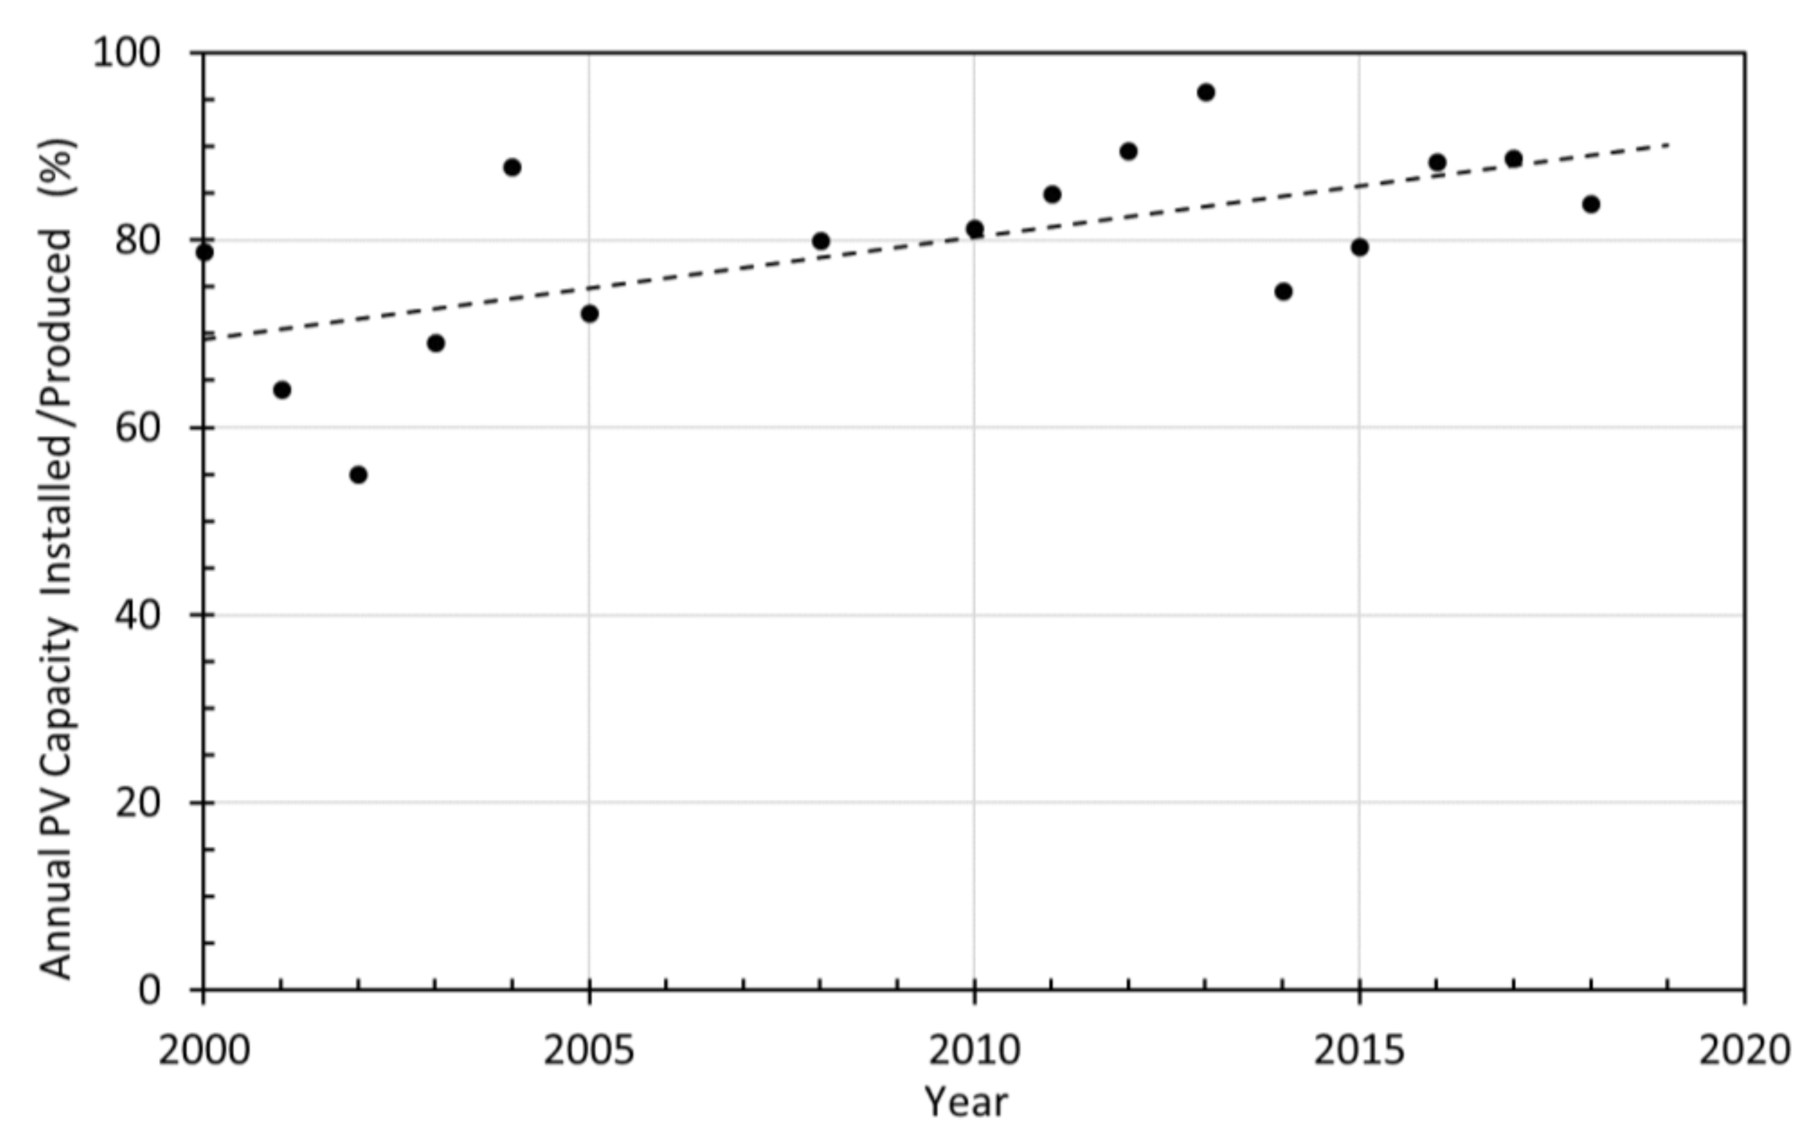
One factor that is nearly always neglected in calculating energy inputs for PV systems is the energy cost of PV cells that are found to be defective. Ferroni and Hopkirk [56] reported that for Germany in 2013, some 30% of PV modules had serious deficiencies, while many more had minor defects. They argued from the return of defective cells that the equivalent average lifetime of PV modules was around 17 years. Indirect evidence that this might be a global problem can be found by comparing annual PV production statistics with those for annual PV energy installation statistics. Since PV cells have almost no other uses, the difference in these values can only be caused by unsold stock changes or defective modules. As additions to PV capacity in 1998 were only 73 MW, compared with 97,680 MW added in 2019, PV retirements are not an explanation. However. as Figure 1 shows, production consistently exceeds installation; the conclusion must be that about 10–20% of annual production either does not produce any output, or that, as suggested by Ferroni and Hopkirk [56], the installation values are in error. Nevertheless, their manufacturing energy input must still be included.
De Castro and Capellán-Pérez [65] analysed the performance of existing Concentrated Solar Power (CSP) plants, all located in areas of favourable annual insolation such as southern Spain and found that their capacity factor was in the same range (0.15–0.30) as for wind and PV energy. They also recorded ‘intensive use of materials—some scarce, and significant seasonal intermittence.’ Their most important finding was the low measured standard EROI, in the range 1.3 to 2.4, probably lower than for PV. Their EROEI values were calculated on a primary energy basis, with output electricity adjusted upwards by an energy ‘quality factor’.
4.2. EREOI for Wind Energy
Estimates of EREOI for wind energy are little better than those for solar energy. Davidsson et al. [67] have reviewed their shortcomings, including the lack of transparency in many assessments. An earlier comprehensive review paper by Lenzen and Munksgaard [68] found that energy return varied from under 1.0 to over 70. Even allowing for differences in the year of analysis, turbine rated output, average wind speeds, and other factors, the nearly two orders of magnitude variation is surprising. More recent evaluations have shown less variation, with wind speed differences the key reason for EROEI differences, as expected.
Kadiyala et al. [69] reviewed 74 wind system cases, and, like Lenzen and Munksgaard [68], reported a wide range of energy payback times (0.13 to 6.5 years). They found that the EROEI was higher for larger turbines (i.e., had lower energy payback times (EPBTs)). Kaldellis and Apostolou [70] reviewed a number of studies for recently installed onshore and offshore turbines in Europe. They found that the specific embodied energy (primary MWh/kW electric rated output) was lower for onshore turbines and decreased with increased rated power output. The EROEI values were similar, averaging 27.0 and 24.4 for onshore and offshore turbines respectively.
The above wind turbine reviews were all based on assembling the findings from a number of studies, and, inevitably, suffer from different assumptions and conventions. Tremeac and Meunier [71] modelled two very different-sized turbines: One 4.5 MW and the other 250 W. The calculated EREOI values were 12.5 and 3.0 for the 4.5 MW and 250 W turbines, respectively, under similar assumed wind regimes. Wind speeds were not given for the hypothetical location, but capacity factors of 25% and 30% were given for the small and large turbine, respectively.
Alsaleh and Sattler [72] performed a detailed LGA and energy analysis on an installed 2 MW Gamesa turbine located in a 400 MW wind farm near Abilene in Texas. They calculated that almost 92% of the total primary energy inputs were for acquisition of the various input materials (steel, concrete, plastics, copper, etc.) and manufacturing the finished turbine (including the 1176-tonne concrete foundation). The EREOI was calculated as 3.4 for a 20-year assumed life, rising to 5.1 for a 30-year life. The measured average wind speed at the site was 5.3 m/sec. If, instead, an 8 m/sec wind speed was assumed, the EROEI calculated rose from 3.4 to 7.9 for a 20-year lifespan. Their EROEI values are significantly lower than in the other studies reviewed, perhaps because of inclusion of items omitted in the other studies.
Although EROEI calculations on existing systems may be of lesser value when considering a 100% solar/wind energy system, it is quite likely that a mixed FF/RE energy system will persist for decades. Given this, careful EROEI analyses of existing wind and solar systems are still vital.
5. Improving EROEI Estimates in a 100% Wind/Solar System
Section 4 has stressed the disagreements in present assessments of EREOI for both solar and wind energy. The following subsections discuss, in turn, four factors that will critically influence EROEI estimates in a hypothetical 100% wind/solar energy system. Improving EREOI estimates is vital for two reasons:
- To estimate total energy potentially available from wind/solar, as discussed in Section 4;
- To assess the viability of any given RE project.
Nevertheless, some of the difficulties presently encountered in EROEI assessment will likely remain, even after these corrections.
5.1. Declining Quality of Inputs
For both solar and wind energy, the theoretical potential must first be reduced by omitting from consideration areas off-limits for energy generation (settlements, national parks, mountainous regions, polar regions, etc.) to obtain the geographical potential. Next, suitable areas will have technical constraints on production because of inevitable losses in converting, for example, wind energy to electricity with a turbine, and also because in many locations the energy produced would not be economically feasible. This further reduction leaves the technical potential [14]. A production curve can, in principle, then be constructed, showing cumulative (global) technical potential as a function of EROEI. Historically, the EROEI has been found to also decline for fossil fuels as a function of cumulative output [51,73].
For wind, EREOI decline will mainly be the result of having to tap progressively lower wind speeds as prime locations are progressively taken up. Given how vast the solar resource is, insolation levels are not likely to be a global constraint. Instead, remoteness from load centres, and lack of both infrastructure and fresh water in desert areas is likely to greatly reduce the geographical potential. An important problem will be the low value of insolation and hence EROEI in many populated areas, particularly Europe and Japan. Land can also be a constraint, with the EU-27 calculated as needing 50% of its land area for a 100% solar energy system [74]. Further, indirect evidence for some land constraints is the increasing popularity of water-based floating PV plants, especially in Japan [75].
Dupont and Jeanmart [76] developed output curves for both solar and wind energy possible in the European Union (EU) as a function of EROEI and showed that present EU energy use has already exceeded potential EU RE production. Their EROEI values were presumably based on existing conditions, not on a 100% wind/solar system. Dupont et al. [77] examined global solar potential, concluding: ‘The resulting constrained solar potential worldwide was estimated at 1098 exajoules per year, of which 98%, 75%, and only 15% can be extracted if the system needs to deliver an energy return on energy invested set at 5, 7.5, and 9, respectively. The resulting global solar potential is substantially lower than most previous estimates.’
An increasingly important component of input energy will be that needed to mine and process the materials needed for PV and wind turbine manufacture. In the expanded economy assumed here by 2050 or so, materials demand for the non-energy sectors of the economy will also expand. Wiedmann et al. [78] have shown the close correlation between global GDP and materials consumption. Mining already consumes some 8–10% of global energy [79].
Moreau et al. [80] studied ‘the availability of metal reserves and resources to build an energy system based exclusively on renewable energy technologies’ for the year 2050. Their analysis is thus relevant for the present study, although the global energy demand in each scenario was much less than present use, and other RE sources were included. Even so, they concluded: ‘The results show that proven reserves and, in specific cases, resources of several metals are insufficient to build a renewable energy system at the predicted level of global energy demand by 2050.’ The list includes cadmium, cobalt, lithium, and nickel where demand is strongly dependent on renewable energy systems growth [80]. The energy costs of mining and processing a given amount of refined material can be expected to rise as progressively lower grade ores must be used [14]. For copper (and according to Alsaleh and Sattler [72], a 2 MW Gamesa wind turbine requires about 8 tonnes of copper for its construction and grid connection), the unit energy costs are already rising. Between the years 2003 and 2016, a 30% rise in global copper output was associated with a 45% rise in input energy costs [79]. A vicious circle can ensue: Any decline in wind/solar EROEI, results in increased energy inputs for a given output, but increased inputs require more minerals to be mined and refined.
Indeed, Van den Bergh et al. [81] have asked whether moving from fossil fuels to RE will merely replace one environmental problem (climate change) by another—mineral scarcity. They coined the term ‘environmental problem shifting’ for this possibility.
5.2. Uncounted Environmental Costs
As Hoegh-Guldberg et al. [82] have pointed out, with around 1.0 °C post-industrial global temperature rise, the world is already experiencing serious adverse effects. Furthermore, adverse changes are not linear with temperature rise, as shown by comparing adverse changes experienced by the first and second 0.5 °C rises. Nevertheless, as discussed by Lade et al. [83], serious climate change is merely one of the environmental challenges Earth faces; others include modification of the global biogeochemical flows, ocean acidification, and biosphere integrity (oceans, fresh water, land). Even though compared with bioenergy or hydropower, wind and solar energy have fewer (uncounted) environmental costs, they are not negligible [13,14,30]. Although wind turbines cause bat and bird deaths, and PV cell production results in toxic wastes, the main environmental costs arise from mining input materials, as discussed in Section 5.1.
Hadian and Madani [84] developed a ‘relative aggregate footprint’ for assessing the environmental sustainability of various energy sources. They found that PV solar energy was only marginally more environmentally sustainable than natural gas. Rehbein et al. [85] have further warned that future RE growth could have a big negative impact on many important locations for global biodiversity.
These costs include adverse effects on wildlife, especially for wind energy, where bird and bat deaths are a problem. In future, however, the most serious environmental costs will probably come from mining progressively lower-quality ores. If ore concentrations decrease by a factor of 10, wastes (and the environmental problems they create) can also be expected to rise by a factor of 10.
5.3. Need for Energy Conversion and Storage
EROEI values are often measured as the ratio of electricity output to primary energy inputs. For dispatchable electricity sources, this underestimates the real EROEI value. However, as already mentioned, given the assumption of a 100% wind/solar system, conversion and storage of at least some of the intermittent electricity output will be needed, because:
- Output, even if constant, will usually not match instantaneous demand load.
- Output will, in fact, vary over time, with periods of over- and under-production, even if the demand load were constant. Expanding the coverage of the solar/wind power grid will smooth output to some extent, but at the cost of extra transmission infrastructure.
Conversion and storage will still be needed even if, as expected, the share of electricity in final energy demand is higher than today. However, this conversion need comes at a heavy energy cost. Energy can be stored in batteries, compressed air, or pumped hydro schemes, but then cannot be directly used for non-electric purposes. In contrast, H2 storage is more versatile, as it can be used in stationary fuel cells to produce combined heat and power. According to Ajanovic and Haas [86], using hydrolysis to produce hydrogen (H2) for direct use as a fuel is about 50–60% energy efficient for the full cycle. Direct H2 use would be far more efficient than re-conversion of the H2 to electricity, with only about 27-38% full-cycle efficiency. There are also further input energy costs and losses associated with storage itself, for example as compressed H2 in tanks or underground caverns.
Some studies (see e.g., [87]), have attempted to quantify the need for storage, but no study has examined a 100% wind/solar energy system. In such a system, much of the energy inputs into both the energy production system and the non-energy economic sectors, will still need to be thermal. The other energy inputs into both systems will be either direct primary electricity, or ‘derived electricity’, that is electricity that has been converted into a form such as H2 for storage, then reconverted back to electricity, perhaps in fuel cells. In a fully developed 100% wind/solar energy system, the output energy can thus be in the form of direct primary electricity, secondary, derived, electricity, or thermal energy. If the energy composition profile for RE energy production inputs matches that for the economy overall, then the energy quality problem for input and output energy will have been resolved.
5.4. Removal of Fossil Fuel ‘Subsidy’
Some analyses have concluded that fossil fuels have much higher EROEI values than all renewables except hydropower [53]. Brockway and colleagues [73] found that published EROEI estimates for FF were typically 25 or more, if both FF output and input energy were assessed in thermal units. Raugei [88], in a response to Weißbach et al., claimed that the energy content of the FFs should be included as energy inputs. However, if at least some fossil fuel reserves remain unused to mitigate climate change, their energy content should be ignored, as it is for wind and solar energy. When the corrections discussed in the preceding three sub-sections are included, the EROEI difference is likely to be even greater. It might also be objected that the EROEI values calculated for FFs would be much lower if the energy costs for carbon capture and sequestration (CCS) were factored in [89]. However, the EROEI values for FFs do not at present include these costs—and so, nor do present EROEI calculations for REs, with their FF inputs, discussed above.
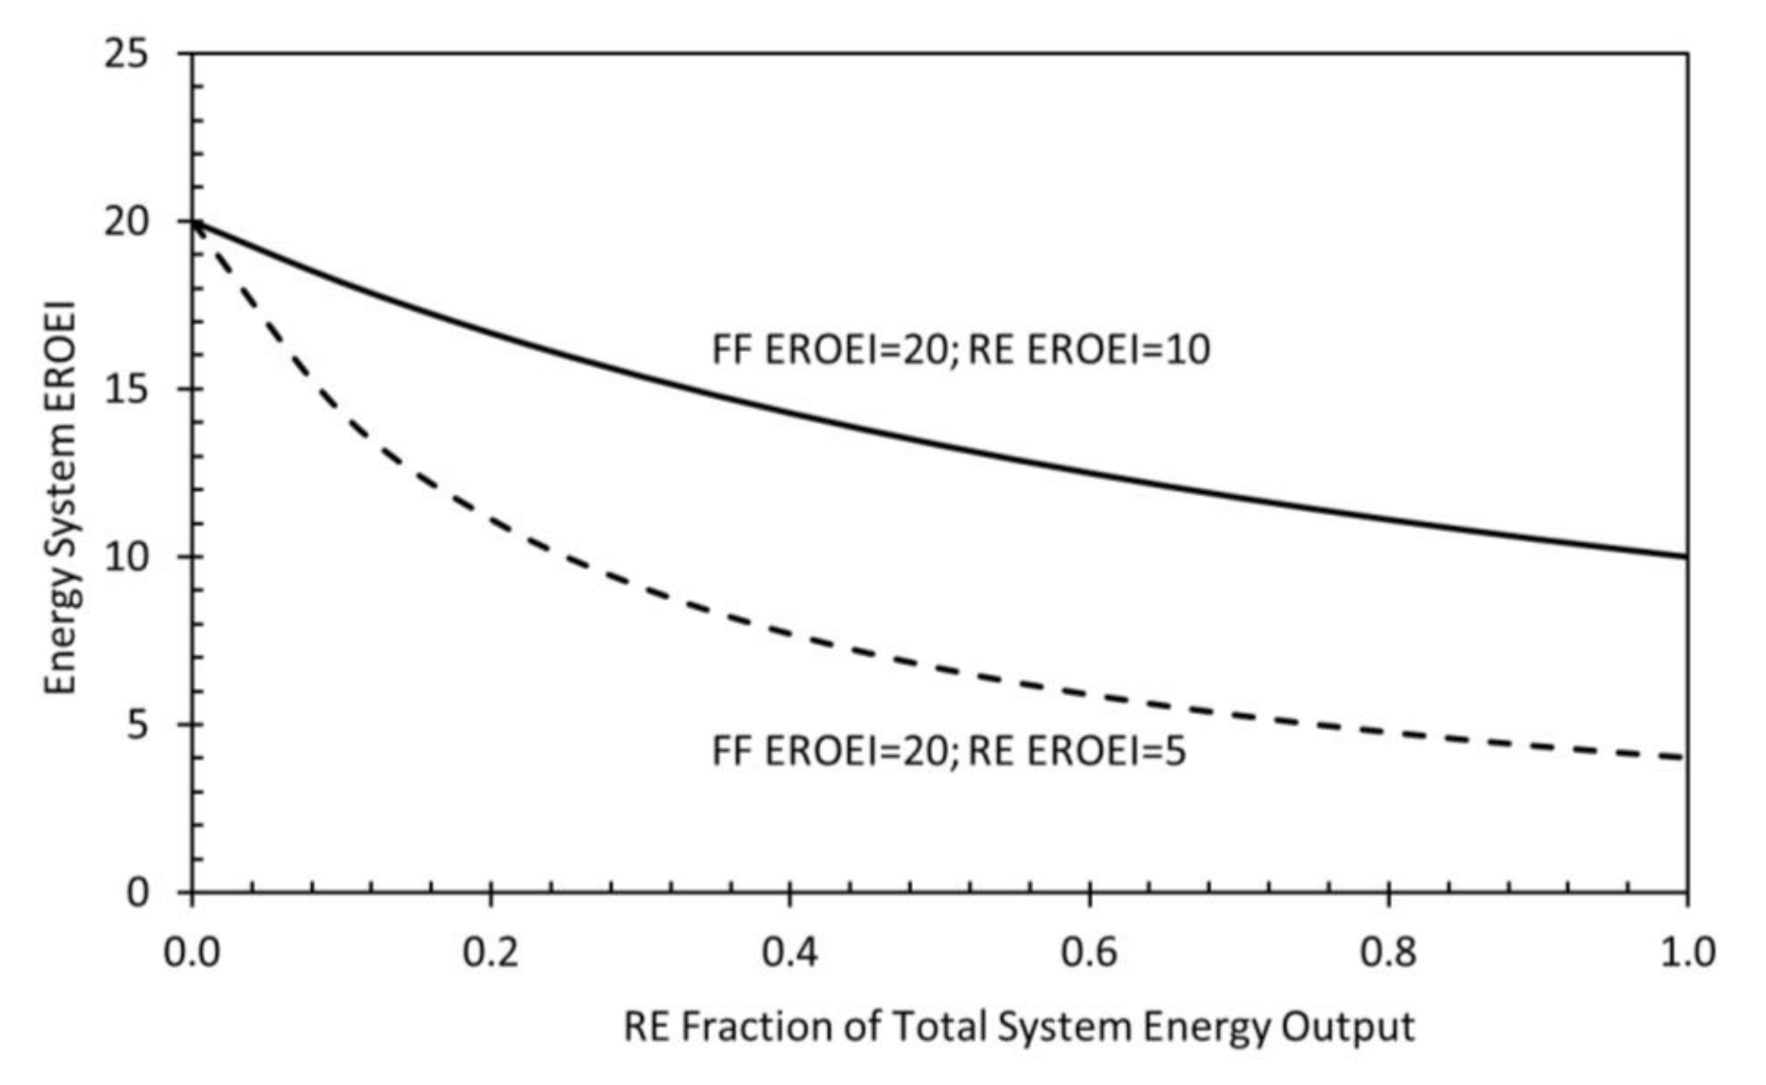
Since the present analysis assumes all energy is renewable, EROEI analyses based on existing conditions, in which most inputs to RE for manufacturing, operation and maintenance (O&M), etc., are largely derived from FFs, will over-estimate values for a 100% RE world. Figure 2 is a conceptual plot of overall energy system EROEI as a function of the share of RE energy for two conditions: The average EROEI for all FFs are two or four times that for wind and solar considered together. For the purposes of this illustrative calculation, a notional average EROEI value of 20 is assumed for FFs [73] for two different RE EROEI values of 5 and 10, shown in Figure 2. Total system energy is defined as the total energy produced (output) by the system, rather than the usual total primary energy input into the system. The sensitivity of the system EROEI, for both cases, is evident, even for modest fractions of RE production.
6. Discussion and Conclusions
This paper has examined the feasibility of wind/solar energy to provide for all Earth’s energy needs in the future. Given the slow pace of FF displacement by RE, the analysis was made for the mid-century, and assumed (as do almost all forecasts) that economic growth will continue up to at least that date.
In the published literature, large variations in EROEI for both wind and solar energy were found. Much of this is inevitable, given that the different analyses considered different relevant climatic factors (wind speeds, insolation levels), different energy converter designs (e.g., different PV cell types), different electric power infrastructure needs, and different years of installation. Even if EROEI procedures could be standardised, EROEI would still vary from one solar or wind farm to another; there is no one value for the EROEI for either wind or solar energy, even for a given country. Further, the published literature has shown a range for the minimum EROEI needed for a b-a-u economy; values from 3 to 11 were found in Section 4.
Placing the analysis in 2050 has several important consequences. On a positive note, there will likely be further technical advances, especially for PV cells and for energy storage. However, other factors will adversely affect wind and solar energy output. First, economic and population growth will result in yet more pressures on land and materials, both major inputs for intermittent RE. Second, as the most optimal sites are steadily used up, new wind farms will face declining wind speeds. For solar energy, although the resource base is vast, in practice, most high-insolation locations, especially deserts, are distant from load centres, and lack the large quantities of fresh water needed for cleaning and for possible conversion of the intermittent electricity generated to hydrogen.
The EROEI for a given solar or wind farm will really only be known after the installation is in operation, as assumed capacity factors are usually too optimistic [65]. However, given the four factors discussed in Section 4, it is safe to say that in a b-a-u world, an energy system based entirely on wind/solar electricity would have a much lower system-wide average EROEI than is the case for wind and solar today. Of course, in some locations, EROEI values will be very favourable; in others, much less so. Given the huge uncertainties, it is not possible to arrive at a precise figure for the technical potential for wind and solar power. However, it is likely that, given the assumption of continued b-a-u economic growth, the world in 2050 could not obtain anywhere near the 600+ EJ of primary intermittent electric energy that such a world would need. Either heavy FF use will need to continue (perhaps with some forms of CO2 removal and/or solar geoengineering) or energy use will need to be greatly reduced.
All the organisations discussed in Section 3 assumed that global economic growth will continue unabated over the next few decades at least, even for the IEA’s SDS. However, some researchers (e.g., [90]) have argued that energy consumption can be decoupled from economic growth, so that, with the right incentives, the energy intensity of the global economy will fall steeply. However, in the transport sector at least, energy efficiency in the IEA countries has fallen slightly over the period 2000-2017 [19], and Parrique et al. [91] have even referred to such decoupling as ‘a myth’. In any case, the historical data show that long-term declines in global energy intensity have invariably been accompanied by rising absolute energy use, in accordance with the ‘Jevons effect’.
If the economic growth condition drops—and, even before the current pandemic, Jackson [92] had suggested that low growth in future will be the ‘new normal’—then global energy use in 2040 could be well below the 2019 value. ‘Degrowth’ proponents (e.g., [93,94,95]) also foresee future energy levels well below their present value. The IEA [41] re-evaluated its short term forecast in late April 2020 in light of the pandemic and foresaw a 6% decrease in global energy use for 2020. Just before the pandemic, Nieto et al. [16] modelled the world from 1995 through to 2050, under three scenarios: BAU, Green Growth, and ‘post-growth’. They concluded: ‘The results reveal the conflict between economic growth, climate policy and the sustainability of resources.’ They found that only a global reduction in economic activity was compatible with avoiding serious climate change. Other researchers (e.g., [96,97,98]) were also sceptical of the claim that a truly green economy is compatible with economic growth. A 100% global green energy economy will likely need to be a smaller economy
Given the severity of climate change and other global environmental challenges, the world in 2050 will likely need to rely heavily on RE sources. As has been shown earlier, nuclear fission energy appears unlikely to play more than a minor role, and fusion energy, not at all, before 2050. However, as argued in this paper, the only way in which wind/solar could meet all (or nearly all) global energy needs is if energy use is drastically curtailed.
Author Contributions
Conceptualization, P.M. and D.H.; methodology, P.M. and D.H.; writing—original draft preparation, P.M.; writing—review and editing, D.H. All authors have read and agreed to the published version of the manuscript.
Funding
This research received no external funding.
Conflicts of Interest
The authors declare no conflict of interest.
Abbreviations
| b-a-u | business-as-usual |
| CO2 | carbon dioxide |
| CSP | Concentrated Solar Power |
| EIA | Energy Information Administration |
| EJ | exajoule (1018 joule) |
| EPBT | energy payback time |
| EROI | energy return on energy invested |
| EU | European Union |
| FF | fossil fuels |
| GHG | greenhouse gas |
| GJ | gigajoule (109 joule) |
| GW | gigawatt |
| H2 | hydrogen |
| IEA | International Energy Agency |
| IRENA | International Renewable Energy Agency |
| IPCC | Intergovernmental Panel on Climate Change |
| Mt | megatonne (106 tonne) |
| Mtoe | million tonne of oil equivalent |
| MWe | megawatt electric (106 watt) |
| NPS | New Policies Scenario |
| O&M | Operation and Maintenance |
| OECD | Organization for Economic Cooperation and Development |
| OPEC | Organization of the Petroleum Exporting Countries |
| ppm | parts per million |
| PV | photovoltaic |
| RE | renewable energy |
| SDS | Sustainable Development Scenario |
| STEC | solar thermal electricity conversion |
| TWh | terawatt-hour (1012 watt-hr) |
References
- Jacobson, M.Z.; Delucchi, M.A.; Cameron, M.A.; Frew, B.A. Low-cost solution to the grid reliability problem with 100% penetration of intermittent wind, water, and solar for all purposes. Proc. Natl. Acad. Sci. USA 2015, 112, 15060–15065. [Google Scholar] [CrossRef] [PubMed] [Green Version]
- Jacobson, M.Z. Roadmaps to transition countries to 100% clean, renewable energy for all purposes to curtail global warming, air pollution, and energy risk. Earth’s Future 2017, 5, 948–952. [Google Scholar] [CrossRef]
- Jacobson, M.Z.; Delucchi, M.A.; Bauer, Z.A.F.; Goodman, S.C.; Chapman, W.E.; Cameron, M.A.; Bozonnat, C.; Chobadi, L.; Clonts, H.A.; Enevoldsen, P.; et al. 100% clean and renewable wind, water, and sunlight all-sector energy roadmaps for 139 countries of the world. Joule 2017, 1, 108–121. [Google Scholar] [CrossRef] [Green Version]
- Davis, S.J.; Lewis, N.S.; Shaner, M.; Aggarwal, S.; Arent, D.; Azevedo, I.L.; Benson, S.M.; Thomas Bradley, T.; Brouwer, J.; Chiang, Y.-M.; et al. Net-zero emissions energy systems. Science 2018, 360, eaas9793. [Google Scholar] [CrossRef] [Green Version]
- Ram, M.; Bogdanov, D.; Aghahosseini, A.; Gulagi, A.; Oyewo, A.S.; Child, M.; Caldera, U.; Sadovskaia, K.; Farfan, J.; Barbosa, L.S.N.S.; et al. Global Energy System Based on 100% Renewable Energy—Power, Heat, Transport and Desalination Sectors; Lappeenranta University of Technology and Energy Watch Group: Lappeenranta, Berlin, Germany, 2019. [Google Scholar]
- Budischak, C.; Sewell, D.; Heather Thomson, H.; Mach, L.; Veron, D.E.; Kempton, W. Cost-minimized combinations of wind power, solar power and electrochemical storage, powering the grid up to 99.9% of the time. J. Power Sources 2013, 225, 60–74. [Google Scholar] [CrossRef] [Green Version]
- Ellabban, O.; Abu-Rub, H.; Blaabjerg, F. Renewable energy resources: Current status, future prospects and their enabling technology. Renew. Sustain. Energy Rev. 2014, 39, 748–764. [Google Scholar] [CrossRef]
- Loftus, P.J.; Cohen, A.M.; Long, J.C.S.; Jesse, D.; Jenkins, J.D. A critical review of global decarbonization scenarios: What do they tell us about feasibility? WIREs Clim. Chang. 2015, 6, 93–112. [Google Scholar] [CrossRef]
- Smil, V. A skeptic looks at alternative energy. IEEE Spectr. 2012, 49, 46–52. [Google Scholar] [CrossRef]
- Smil, V. It’ll be harder than we thought to get the carbon out. IEEE Spectr. 2018, 55, 72–75. [Google Scholar] [CrossRef]
- Trainer, T. Can Europe run on renewable energy? A negative case. Energy Pol. 2013, 63, 845–850. [Google Scholar] [CrossRef]
- Trainer, T. 100% Renewable supply? Comments on the reply by Jacobson and Delucchi to the critique by Trainer. Energy Pol. 2013, 57, 634–640. [Google Scholar] [CrossRef]
- Moriarty, P.; Honnery, D. Can renewable energy power the future? Energy Pol. 2016, 93, 3–7. [Google Scholar] [CrossRef]
- Heard, B.; Brook, B.; Wigley, T.; Bradshaw, C. Burden of proof: A comprehensive review of the feasibility of 100% renewable-electricity systems. Renew. Sustain. Energy Rev. 2017, 76, 1122–1133. [Google Scholar] [CrossRef]
- Capellán-Pérez, I.; De Blas, I.; Nieto, J.; De Castro, C.; Miguel, L.J.; Carpintero, Ó.; Mediavilla, M.; Lobejón, L.F.; Ferreras-Alonso, N.; Rodrigo, P.; et al. MEDEAS: A new modeling framework integrating global biophysical and socioeconomic constraints. Energy Environ. Sci. 2020, 13, 986–1017. [Google Scholar] [CrossRef]
- Nieto, J.; Carpintero, O.; Miguel, L.J.; de Blas, I. Macroeconomic modelling under energy constraints: Global low carbon transition scenarios. Energy Pol. 2020, 137, 111090. [Google Scholar] [CrossRef] [Green Version]
- Pickard, W.F. Energy return on energy invested (EROI): A quintessential but possibly inadequate metric for sustainability in a solar-powered world. Proc. IEEE 2014, 102, 1118–1122. [Google Scholar] [CrossRef]
- World Bank (WB). Global Economic Prospects: June 2020; WB: Washington, DC, USA, 2020; Available online: https://www.worldbank.org/en/publication/global-economic-prospects (accessed on 21 June 2020).
- International Energy Agency (IEA). Key World Energy Statistics 2019; IEA/OECD: Paris, France, 2019. [Google Scholar]
- Kembleton, R. Nuclear fusion: What of the future? In Managing Global Warming an Interface of Technology and Human Issues; Letcher, T., Ed.; Academic Press: London, UK, 2019; pp. 199–220. [Google Scholar]
- Moriarty, P.; Honnery, D. Review: Assessing the climate mitigation potential of biomass. AIMS Energy 2017, 5, 20–38. [Google Scholar] [CrossRef]
- Searchinger, T.D.; Beringer, T.; Strong, A. Does the world have low-carbon bioenergy potential from the dedicated use of land? Energy Pol. 2017, 110, 434–446. [Google Scholar] [CrossRef]
- Moriarty, P.; Honnery, D. Energy accounting for a renewable energy future. Energies 2019, 12, 4280. [Google Scholar] [CrossRef] [Green Version]
- United Nations (UN) World Population Prospects 2019. 2019. Available online: httpsar://population.un.org/wpp/ (accessed on 24 June 2020).
- BP. BP Statistical Review of World Energy 2020; BP: London, UK, 2020. [Google Scholar]
- Hoes, O.A.C.; Meijer, L.J.J.; Van Der Ent, R.J.; Van De Giesen, N. Systematic high-resolution assessment of global hydropower potential. PLoS ONE 2017, 12, e0171844. [Google Scholar] [CrossRef]
- Zhou, Y.; Hejazi, M.; Smith, S.; Edmonds, J.; Li, H.-Y.; Clarke, L.; Calvin, K.; Thomson, A. A comprehensive view of global potential for hydro-generated electricity. Energy Environ. Sci. 2015, 8, 2622–2633. [Google Scholar] [CrossRef]
- Grossman, D.; Galdeiri, D. The sunken rainforest. New Sci. 2019, 21, 42–45. [Google Scholar]
- Moriarty, P.; Honnery, D. What is the global potential for renewable energy? Renew. Sustain. Energy Rev. 2012, 16, 244–252. [Google Scholar] [CrossRef]
- Moriarty, P.; Honnery, D. Ecosystem maintenance energy and the need for a green EROI. Energy Pol. 2019, 131, 229–234. [Google Scholar] [CrossRef]
- Laghari, J.R. Melting glaciers bring energy uncertainty. Nature 2013, 502, 617–618. [Google Scholar] [CrossRef]
- Moriarty, P.; Honnery, D. Energy policy and economics under climate change. AIMS Energy 2018, 6, 272–290. [Google Scholar] [CrossRef]
- Kumari, W.G.P.; Ranjith, P.G. Sustainable development of enhanced geothermal systems based on geotechnical research—A review. Earth Sci. Rev. 2019, 199, 102955. [Google Scholar] [CrossRef]
- JOGMEC. Current Situation of Geothermal Power Generation in Japan; Japan Oil, Gas and Metals National Corporation: 2019. Available online: http://geothermal.jogmec.go.jp/report/file/session_160602_01.pdf (accessed on 13 October 2020).
- Tosha, T.; Nishikawa, N.; Shimada, T. Country Update of Geothermal Energy Development in Japan and the Activity of JOGMEC. 2016. Available online: http://pubs.geothermal-library.org/lib/grc/1032304.pdf (accessed on 24 July 2020).
- Van Haren, H. The pull of the tide. New Sci. 2018, 23, 24–25. [Google Scholar] [CrossRef]
- International Renewable Energy Agency (IRENA). Renewable Capacity Statistics 2020; IRENA: Abu Dhabi, UAE, 2020. [Google Scholar]
- Energy Information Agency (EIA). Short-Term Energy Outlook (STEO). April 2020. Available online: https://www.eia.gov/outlooks/steo/pdf/steo_full.pdf (accessed on 24 July 2020).
- Energy Information Administration (EIA). International Energy Outlook 2019. Available online: https://www.eia.gov/outlooks/ieo/ (accessed on 14 June 2020).
- Energy Information Administration (EIA). Annual Energy Outlook 2020. Available online: https://www.eia.gov/outlooks/aeo/ (accessed on 25 June 2020).
- International Energy Agency (IEA). Global Energy Review 2020: The Impacts of the Covid-19 Crisis on Global Energy Demand and CO2 Emissions; IEA/OECD: Paris, France, 2020. [Google Scholar]
- BP. BP Energy Outlook: 2019 Edition; BP: London, UK, 2019. [Google Scholar]
- ExxonMobil. Outlook for Energy: A View to 2040; ExxonMobil: Irving, TX, USA, 2019. [Google Scholar]
- International Renewable Energy Agency (IRENA). Future of Wind: Deployment, Investment, Technology, Grid Integration and Socio-Economic Aspects. 2019. Available online: https://www.irena.org/-/media/Files/IRENA/Agency/Publication/2019/Oct/IRENA_Future_of_wind_2019.pdf (accessed on 8 July 2020).
- Organization of the Petroleum Exporting Countries (OPEC). 2019 OPEC World Oil Outlook. 2019. Available online: http://www.opec.org (accessed on 19 July 2020).
- International Energy Agency (IEA). Sustainable Development Scenario. 2019. Available online: https://www.iea.org/weo/weomodel/sds/ (accessed on 17 June 2020).
- King, L.C.; van den Bergh, J.C.J.M. Implications of net energy-return-on-investment for a low-carbon energy transition. Nat. Energy 2018, 3, 334–340. [Google Scholar] [CrossRef] [Green Version]
- Hall, C.A.S. Energy Return on Investment: A Unifying Principle for Biology, Economics, and Sustainability; Lecture Notes in Energy Volume 36; Springer: Cham, Switzerland.
- Hall, C.A.S. Will EROI be the primary determinant of our economic future? The view of the natural scientist versus the economist. Joule 2017, 1, 635–638. [Google Scholar] [CrossRef] [Green Version]
- Hall, C.A.S.; Lambert, J.G.; Balogh, S.B. EROI of different fuels and the implications for society. Energy Pol. 2014, 64, 141–152. [Google Scholar] [CrossRef] [Green Version]
- De Castro, C.; Capellán-Pérez, I. Standard, point of use, and extended energy return on energy invested (EROI) from comprehensive material requirements of present global wind, solar, and hydro power technologies. Energies 2020, 13, 3036. [Google Scholar] [CrossRef]
- Hall, C.A.S.; Balogh, S.; Murphy, D.J.R. What is the minimum EROI that a sustainable society must have? Energies 2009, 2, 25–47. [Google Scholar] [CrossRef]
- Weißbach, D.; Ruprecht, G.; Huke, A.; Czerski, K.; Gottlieb, S.; Hussein, A. Energy intensities, EROIs (energy returned on invested), and energy payback times of electricity generating power plants. Energy 2013, 52, 210–221. [Google Scholar] [CrossRef]
- Fizaine, F.; Court, V. Energy expenditure, economic growth, and the minimum EROI of society. Energy Pol. 2016, 95, 172–186. [Google Scholar] [CrossRef]
- Raugei, M. Net energy analysis must not compare apples and oranges. Nat. Energy 2019, 4, 86–88. [Google Scholar] [CrossRef]
- Ferroni, F.; Hopkirk, R.J. Energy Return on Energy Invested (ERoEI) for photovoltaic solar systems in regions of moderate insolation. Energy Pol. 2016, 94, 336–344. [Google Scholar] [CrossRef] [Green Version]
- Ferroni, F.; Hopkirk, R.J.; Guekos, A. Further consideration to: Energy Return on Energy Invested (ERoEI) for photovoltaic solar systems in region of moderate insolation. Energy Pol. 2017, 107, 498–505. [Google Scholar] [CrossRef]
- Louwen, A.; van Sark, W.G.J.H.M.; Faaij, A.P.C.; Schropp, R.E.I. Re-assessment of net energy production and greenhouse gas emissions avoidance after 40 years of photovoltaics development. Nat. Comm. 2016, 7, 13728. [Google Scholar] [CrossRef]
- Palmer, G.; Floyd, J. An exploration of divergence in EPBT and EROI for solar photovoltaics. BioPhys. Econ. Resour. Qual. 2017, 2, 15. [Google Scholar] [CrossRef] [Green Version]
- Martinopoulos, G. Are rooftop photovoltaic systems a sustainable solution for Europe? A life cycle impact assessment and cost analysis. App. Energy 2020, 257, 114035. [Google Scholar] [CrossRef]
- Pickard, W.F. A simple lower bound on the EROI of photovoltaic electricity generation. Energy Pol. 2017, 107, 488–490. [Google Scholar] [CrossRef]
- Raugei, M.; Sgouridis, S.; Murphy, D.; Fthenakis, V.; Frischknecht, R.; Breyer, C.; Bardi, U.; Barnhart, C.; Buckley, A.; Carbajales-Dale, M.; et al. Energy Return on Energy Invested (ERoEI) for photovoltaic solar systems in region of moderate insolation: A comprehensive response. Energy Pol. 2017, 102, 377–384. [Google Scholar] [CrossRef]
- Espinosa, N.; Hosel, M.; Angmo, D.; Krebs, F.C. Solar cells with one-day energy payback for the factories of the future. Energy Environ. Sci. 2012, 5, 5117. [Google Scholar] [CrossRef]
- Liu, F.; van den Bergh, J.C.J.M. Differences in CO2 emissions of solar PV production among technologies and regions: Application to China, EU and USA. Energy Pol. 2020, 138, 111234. [Google Scholar] [CrossRef]
- De Castro, C.; Capellán-Pérez, I. Concentrated Solar Power: Actual Performance and Foreseeable Future in High Penetration Scenarios of Renewable Energies. Biophys. Econ. Resour. Qual. 2018, 3, 14. [Google Scholar] [CrossRef]
- Statista. Annual Solar Module Production Globally from 2000 to 2018. 2020. Available online: https://0-www-statista-com.brum.beds.ac.uk/statistics/668764/annual-solar-module-manufacturing-globally/ (accessed on 27 June 2020).
- Davidsson, S.; Höök, M.; Wall, G. A review of life cycle assessments on wind energy systems. Int. J. Life Cycle Assess. 2012, 17, 729–742. [Google Scholar] [CrossRef]
- Lenzen, M.; Munksgaard, J. Energy and CO2 life-cycle analyses of wind turbines—Review and applications. Renew. Energy 2002, 26, 339–362. [Google Scholar] [CrossRef]
- Kadiyala, A.; Kommalapati, R.; Huque, Z. Characterization of the life cycle greenhouse gas emissions from wind electricity generation systems. Int. J. Energy Environ. Eng. 2017, 8, 55–64. [Google Scholar] [CrossRef] [Green Version]
- Kaldellis, J.K.; Apostolou, D. Life cycle energy and carbon footprint of offshore wind energy. Comparison with onshore counterpart. Renew. Energy 2017, 108, 72–84. [Google Scholar] [CrossRef]
- Tremeac, B.; Meunier, F. Life cycle analysis of 4.5MW and 250W wind turbines. Renew. Sustain. Energy Rev. 2009, 13, 2104–2110. [Google Scholar] [CrossRef]
- Alsaleh, A.; Sattler, M. Comprehensive life cycle assessment of large wind turbines in the US. Clean Technol. Environ. Pol. 2019, 21, 887–903. [Google Scholar] [CrossRef]
- Brockway, P.E.; Owen, A.; Brand-Correa, L.I.; Hardt, L. Estimation of global final-stage energy-return-on-investment for fossil fuels with comparison to renewable energy sources. Nat. Energy 2019, 4, 612–621. [Google Scholar] [CrossRef] [Green Version]
- Capellán-Pérez, I.; de Castro, C.; Arto, I. Assessing vulnerabilities and limits in the transition to renewable energies: Land requirements under 100% solar energy scenarios. Renew. Sustain. Energy Rev. 2017, 77, 760–782. [Google Scholar] [CrossRef] [Green Version]
- Sahu, A.; Yadav, N.; Sudhakar, K. Floating photovoltaic power plant: A review. Renew. Sustain. Energy Rev. 2016, 66, 815–824. [Google Scholar] [CrossRef]
- Dupont, E.; Jeanmart, H. Global potential of wind and solar energy with physical and energy return on investment (EROI) constraints; application at the European level (EU 28 countries). In Proceedings of the ECOS 2019-32nd International Conference on Efficiency, Cost, Optimization, Simulation and Environmental Impact of Energy Systems, Wroclaw, Poland, 23–28 June 2019. [Google Scholar]
- Dupont, E.; Koppelaar, R.; Jeanmart, H. Global available solar energy under physical and energy return on investment constraints. Appl. Energy 2020, 257, 113968. [Google Scholar] [CrossRef]
- Wiedmann, T.; Lenzen, M.; Lorenz, T.; Keyßer, L.T.; Steinberger, J.K. Scientists’ warning on affluence. Nat. Comm. 2020, 11, 3107. [Google Scholar] [CrossRef] [PubMed]
- Calvo, G.; Mudd, G.; Valero, A.; Valero, A. Decreasing ore grades in global metallic mining: A theoretical issue or a global reality? Resources 2016, 5, 36. [Google Scholar] [CrossRef] [Green Version]
- Moreau, V.; Dos Reis, P.C.; Vuille, F. Enough metals? Resource constraints to supply a fully renewable energy system. Resources 2019, 8, 29. [Google Scholar] [CrossRef] [Green Version]
- Van den Bergh, J.; Folke, C.; Polasky, S.; Scheffer, M.; Steffen, W. What if solar energy becomes really cheap? A thought experiment on environmental problem shifting. Curr. Opin. Environ. Sustain. 2015, 14, 170–179. [Google Scholar] [CrossRef]
- Hoegh-Guldberg, O.; Jacob, D.; Taylor, M.; Guillén Bolaños, T.; Bindi, M.; Brown, S.; Camilloni, I.A.; Diedhiou, A.; Djalante, R.; Ebi, K.; et al. The human imperative of stabilizing global climate change at 1.5 °C. Science 2019, 365, 1263. [Google Scholar] [CrossRef] [PubMed] [Green Version]
- Lade, S.J.; Steffen, W.; de Vries, W.; Carpenter, S.R.; Donges, J.F.; Gerten, D.; Hoff, H.; Newbold, T.; Katherine Richardson, K.; Rockström, J. Human impacts on planetary boundaries amplified by Earth system interactions. Nat. Sustain. 2020, 3, 119–128. [Google Scholar] [CrossRef]
- Hadian, S.; Madani, K. A system of systems approach to energy sustainability assessment: Are all renewables really green? Ecol. Indic. 2015, 52, 194–206. [Google Scholar] [CrossRef]
- Rehbein, J.A.; Watson, J.E.M.; Lane, J.L.; Sonter, L.J.; Venter, O.; Atkinson, S.C.; Allan, J.R. Renewable energy development threatens many globally important biodiversity areas. Glob. Chang. Biol. 2020, 26, 3040–3051. [Google Scholar] [CrossRef]
- Ajanovic, A.; Haas, R. Economic prospects and policy framework for hydrogen as fuel in the transport sector. Energy Pol. 2018, 123, 280–288. [Google Scholar] [CrossRef]
- Sinn, H.-W. Buffering volatility: A study on the limits of Germany’s energy revolution. Eur. Econ. Rev. 2017, 99, 130–150. [Google Scholar] [CrossRef]
- Raugei, M. Comments on “Energy intensities, EROIs (energy returned on invested), and energy payback times of electricity generating power plants”. Making clear of quite some confusion. Energy 2013, 59, 781–782. [Google Scholar] [CrossRef]
- Sgouridis, S.; Carbajales-Dale, M.; Csala, D.; Chiesa, M.; Bardi, U. Comparative net energy analysis of renewable electricity and carbon capture and storage. Nat. Energy 2019, 4, 456–465. [Google Scholar] [CrossRef] [Green Version]
- Lovins, A.B.; Ürge-Vorsatz, D.; Mundaca, L.; Kammen, D.M.; Glassman, J.W. Recalibrating climate prospects. Environ. Res. Lett. 2019, 14, 120201. [Google Scholar] [CrossRef]
- Parrique, T.; Barth, J.; Briens, F.; Kerschner, C.; Kraus-Polk, A.; Kuokkanen, A.; Spangenberg, J.H. De-Coupling Debunked; European Environmental Bureau: Brussels, Belgium, 2019. [Google Scholar]
- Jackson, T. The post-growth challenge: Secular stagnation, inequality and the limits to growth. Ecol. Econ. 2019, 156, 236–246. [Google Scholar] [CrossRef]
- Alexander, S.; Yacoumis, P. Degrowth, energy descent, and ‘low-tech’ living: Potential pathways for increased resilience in times of crisis. J. Clean. Prod. 2018, 197, 1840–1848. [Google Scholar] [CrossRef]
- Kallis, G. Radical dematerialization and degrowth. Phil. Trans. Roy. Soc. A 2017, 375, 20160383. [Google Scholar] [CrossRef] [PubMed] [Green Version]
- Alexander, S.; Floyd, J. The political economy of deep decarbonization: Tradable Energy Quotas for energy descent futures. Energies 2020, 13, 4304. [Google Scholar] [CrossRef]
- Capellán-Pérez, I.; de Castro, C.; González, L.J.M. Dynamic Energy Return on Energy Investment (EROI) and material requirements in scenarios of global transition to renewable energies. Energy Strategy Rev. 2019, 26, 100399. [Google Scholar] [CrossRef]
- De Castro, C.; Mediavilla, M.; Miguel, L.J.; Frechoso, F. Global solar electric potential: A review of their technical and sustainable limits. Renew. Sustain. Energy Rev. 2013, 28, 824–835. [Google Scholar] [CrossRef]
- Moriarty, P.; Honnery, D. Three futures: Nightmare, diversion, vision. World Futures 2018, 74, 51–67. [Google Scholar] [CrossRef]
Figure 1.
Annual installed PV capacity as a % of annual PV production (MW) vs. year. Sources: Adapted from [25] for installed capacity and [66] for annual production. Line of best fit shown.

Figure 2.
Energy system energy return on energy invested (EROEI) for a fixed fossil fuel (FF) EROEI of 20 and renewable energy (RE) EROEI values of 10 and 5 as a function of RE in the total system energy output.
Figure 2.
Energy system energy return on energy invested (EROEI) for a fixed fossil fuel (FF) EROEI of 20 and renewable energy (RE) EROEI values of 10 and 5 as a function of RE in the total system energy output.


Table 1.
Installed 2019 geothermal electric capacity, various countries.
| Country | Installed Capacity (MW) |
|---|---|
| US | 2555 |
| Indonesia | 2131 |
| Philippines | 1928 |
| Turkey | 1505 |
| NZ | 965 |
| Mexico | 936 |
| Kenya | 823 |
| Italy | 800 |
| Iceland | 753 |
| Japan | 525 |
| World | 13,931 |
Source [25].
Publisher’s Note: MDPI stays neutral with regard to jurisdictional claims in published maps and institutional affiliations. |
© 2020 by the authors. Licensee MDPI, Basel, Switzerland. This article is an open access article distributed under the terms and conditions of the Creative Commons Attribution (CC BY) license (http://creativecommons.org/licenses/by/4.0/).
Share and Cite
MDPI and ACS Style
Moriarty, P.; Honnery, D. Feasibility of a 100% Global Renewable Energy System. Energies 2020, 13, 5543. https://0-doi-org.brum.beds.ac.uk/10.3390/en13215543
AMA Style
Moriarty P, Honnery D. Feasibility of a 100% Global Renewable Energy System. Energies. 2020; 13(21):5543. https://0-doi-org.brum.beds.ac.uk/10.3390/en13215543
Chicago/Turabian StyleMoriarty, Patrick, and Damon Honnery. 2020. "Feasibility of a 100% Global Renewable Energy System" Energies 13, no. 21: 5543. https://0-doi-org.brum.beds.ac.uk/10.3390/en13215543
Note that from the first issue of 2016, this journal uses article numbers instead of page numbers. See further details here.