Economic Viability of Renewable Energy Communities under the Framework of the Renewable Energy Directive Transposed to Austrian Law


1
AIT Austrian Institute of Technology, Giefinggasse 4, 1210 Vienna, Austria
2
Energy Economics Group (EEG), Technische Universität Wien, Gusshausstraße 25-29, E370-3, 1040 Vienna, Austria
*
Author to whom correspondence should be addressed.
Energies 2020, 13(21), 5743; https://0-doi-org.brum.beds.ac.uk/10.3390/en13215743
Submission received: 14 October 2020
/
Revised: 26 October 2020
/
Accepted: 27 October 2020
/
Published: 2 November 2020
(This article belongs to the Section C: Energy Economics and Policy)
Abstract
:This study is concerned with the national transposition of the European Renewable Energy Directive into Austrian law. The objective is to estimate the economic viability for residential customers when participating in a renewable energy community (REC), focused on PV electricity sharing. The developed simulation model considers the omission of certain electricity levies as well as the obligatory proximity constraint being linked to grid levels, thus introducing a stepwise reduction of per-unit grid charges as an incentive to keep the inner-community electricity transfer as local as possible. Results show that cost savings in residential RECs cover a broad range from 9 EUR/yr to 172 EUR/yr. The lowest savings are gained by customers without in-house PV systems, while owners of a private PV system make the most profits due to the possibility of selling as well as buying electricity within the borders of the REC. Generally, cost savings increase when the source is closer to the sink, as well as when more renewable electricity is available for inner-community electricity transfer. The presence of a commercial customer impacts savings for households insignificantly, but increases local self-consumption approximately by 10%. Despite the margin for residential participants to break even being narrow, energy community operators will have to raise a certain participation fee. Such participation fee would need to be as low as EUR/month for customers without in-house PV systems in a purely residential REC, while other customers could still achieve a break-even when paying 5 EUR/month to EUR/month in addition. Those results should alert policy makers to find additional support mechanisms to enhance customers’ motivations to participate if RECs are meant as a concept that should be adopted on a large scale.
1. Introduction
In order to achieve the ambitious European climate goals until 2030—a 40% cut in greenhouse gas emissions from the levels of 1990, a minimum of 32% share for renewable energy, and at least 32.5% improvement in energy efficiency—significant efforts are required [1]. In 2019, the European Union presented a thorough update of its energy policy framework to enable a sustainable energy transition. This novel rulebook is known as the Clean Energy for All Europeans Package, which is comprised of eight legislative acts that are meant to bring benefits from both environmental and economic perspectives [2]. European countries are given a maximum timeframe of two years to transpose these guidelines into national law. Initiatives to achieve a sustainable energy future are currently even further intensified at European level due to the COVID-19 pandemic. The European Commission proposes a new recovery instrument called Next Generation EU, which offers, amongst others, financial support for investments and reforms concerning green and digital transitions [3], to transform the EU into a clean, energy efficient, low carbon and climate resilient society [4]. In this way, the COVID-19 challenge is turned into an opportunity, not only by supporting recovery, but also by investing in the future, since the European Green Deal [5] and digitalisation will boost jobs and growth [3]. The latest developments are expected to have a positive influence on the future deployment of energy communities, which shall be empowered on a regional and local level [5]. These novel concepts are specifically addressed within the individual acts and directives of the Clean Energy for All Europeans Package (CEP). Thereby, two different types of energy communities are distinguished: Citizen energy communities (CECs)and renewable energy communities (RECs), as addressed in the Electricity Market Directive (EMD) [6] and the Renewable Energy Directive (RED) [7], respectively. The major differences in the two kinds of energy communities lie in the types of energy used and the necessity of proximity of the participants. CECs are restricted to electricity, while the proximity of participants is of no concern. RECs, on the contrary, consider all types of specifically renewable energy, but the proximity of participants is a binding constraint. In order to actively contribute to achieving energy and climate goals efficiently, the establishment of CECs and RECs might be part of the solution. With regard to the objective of increasing shares of renewable energy in the system—while, at best, limiting additional grid burden to a minimum by maximising local self-supply—it may be worthy to put specific focus on RECs.
As national transpositions to enable RECs will not be consistent across European countries, this study aims at introducing the specifics of the transposition into Austrian law, which is expected to come into force in 2021. While RECs may not be considered a novel business opportunity for established stakeholders to gain extensive financial profits, as specified in the RED (“…the primary purpose of which is to provide environmental, economic or social community benefits for its shareholders or members or for the local areas where it operates, rather than financial profits”) (RED, Article 2, (16c)), a certain economic viability is of significant importance for REC participants, in order to achieve a wide roll-out across citizens of all income categories. In order to ensure financial incentives, Austrian legislators aim to omit certain levies for renewable electricity transfer in RECs, as well as introducing a reduction charges accounting for use of the electricity grid, depending on the geographical proximity of the source and sink.
Therefore, the first and major research question of this paper is whether participating in a REC in Austria, under the announced national transposition of the RED, is economically viable. Thereby, focus is put on sharing renewable electricity generated by either in-house or stand-alone PV systems. For this purpose, a simulation model is developed that enables quantification of the financial benefits obtained by household customers through REC participation. With respect to the planned implementation of the proximity constraint by grid levels, the simulation model is set up such that keeping the electricity transfer as local as possible is ensured and remunerated accordingly. The profitability of REC participation for residential customers is investigated for three different energy community set-ups: (i) purely residential, (ii) residential with additional stand-alone PV plant and (iii) residential with stand-alone PV plant and a commercial customer. In this way, beneficial REC compositions can be derived. Moreover, the second research question concerns a variety of factors that can influence the profitability of REC participation. To that end, the actual financial value of the stepwise reduced grid charges is investigated (leaving only a reduction of levies as financial incentives to REC participation), as is the influence of the retail electricity price. Moreover, based on the participants’ financial benefits through REC participation, the height of a potential participation fee that would still allow (at least most) residential customers to achieve a break-even, is estimated. With this work, a bridge is built between the legislative framework and practical implementation.
Since this study is concerned with the economic viability of RECs for residential customers under the novel European guidelines transposed into Austrian law, the remainder of this section addresses two major topics-namely energy communities in a legal and an economic context, and legislation concerning energy communities in Austria. Section 1.1 starts with a selection of scientific literature concerned with residential energy communities in general, before the focus is put on studies that address the topic of energy communities in the legal context (Section 1.1.1). Before addressing relevant literature elaborating on the second important topic in this study-namely the economic viability of energy communities-in Section 1.1.3, Section 1.1.2 points out that motivations to take part in energy communities do not necessarily need to be (purely) economic (a selection of important studies in this field of research is provided for the sake of completeness, since the RED states that financial gains should not be the primary purpose of RECs). Then, the focus is set specifically to Austria, and the national developments in legislation for energy communities are briefly detailed in Section 1.2, in order to understand legislative efforts up to this point. With respect to the current developments concerning the national transposition of the RED, the Austrian interpretation of the ’proximity constraint’ for REC participants is addressed in Section 1.2.1, since this part of the legislation is specifically important for the future implementation of RECs—not only in terms of the geographical extent, but also regarding the respective financial benefits. Finally, Section 1.3 points out this work’s progress beyond the current state-of-the art.
1.1. Scientific Research in Energy Communities
In order to make way towards a sustainable energy future, the deployment of various renewable energy generation technologies has been promoted throughout recent years. Significant progress is recorded, especially in the field of solar photovoltaic (PV) [8], yet high installation rates are still required to reach the ambitious climate and energy goals. Despite significant opportunities provided by installing solar PV, including suitable remuneration schemes (at least in the European Union) [9], deployment is still hampered in many countries [10,11,12]. In order to overcome the obstacles hampering increased solar PV diffusion, attractive business models [13,14] and tailor-made promotion policies [15,16] are of crucial importance. At the same time, [17] points out the necessity to move away from feed-in-tariff (FiT) schemes, instead developing prosumer-focused (prosumers are customers that not only purchase electricity, but also generate (and sell) electricity themselves) business models, in order to maintain PV growth rates. A recent approach to increase the adoption of PV systems in the residential sector is implemented by the Italian government, offering significant tax deductions with respect to the human and economic shock effected by the COVID-19 pandemic [18].
The drive for generally increasing the shares of renewable energy in the system, specifically focusing on PV deployment and maintaining growth rates while moving away from FiT schemes, as well as putting prosumers in the spotlight, points to the promising concept of energy communities (renewable energy in energy communities is not limited to solar PV. However, solar PV is one of the most suitable electricity sources in terms of residential customer installations, offering building-integrated or building-attached implementations). Individual countries already allow for the establishment of energy communities within the borders of individual multi-apartment buildings. However, to enable energy communities beyond building borders, further legislative amendments are required. As of 2019, in Europe, the supranational directives RED and EMD—both parts of the CEP—provide a legal basis for energy community implementation between multiple buildings. National transpositions are to be presented obligatory in timely manner, within a maximum of two years [2]. In addition to that, the COVID-19 crisis also leads to increased efforts to boost a sustainable energy future, and practices of investments around clean-tech and divestment from fossil fuels are increasingly adopted [19]. The increased adoption of clean energy generation technologies can be significantly supported by energy community deployment.
1.1.1. Energy Communities with Respect to the Legal Framework
With the recent developments in the legal sector, research activities have already been triggered. Ref. [20] states that the unique characteristics of energy communities have been overlooked so far, raising multiple legal issues. Nevertheless, with the CEP in Europe, an unprecedented framework with potential to support energy communities is established. The actual legal strength of these new rules will be tested by their transposition into national laws and actual implementation [20]. Based on energy community lighthouse projects (still being the exception, not the rule), the fitness of the new rules of the RED to promote the wide deployment of RECs is discussed in [21]. In this context, recommendations are elaborated with regard to the transposition of the RED into national law. Similarly, [22] carries out a cross-country comparison between the existing regulatory frameworks of nine European countries, in order to point out the major opportunities and challenges for renewable energy prosumers. Furthermore, [23] addresses the challenges of new policy and regulatory framework design, specifically for renewable energy communities under the peer-to-peer trading framework. While the RED undoubtedly provides valuable opportunities for sustainable energy community development, such as empowering vulnerable consumers [24], novel barriers also arise. Such barriers and opportunities—in particular considering PV systems—are addressed in [25]. Nevertheless, as indicated by [20], the legal quality of the ’empowerment framework’ created for energy communities will become apparent after the realisation of pilot projects, which are currently in the planning phase [26].
1.1.2. Motivation of Participants
Besides a comprehensive legal framework, the second vital ingredient for a successful deployment of the energy community concept is the participants themselves. Motivation to participate is multifaceted, comprising political, environmental, social, technological, and economic reasons [27]. According to [28], environmental protection is seen as the most important reason to support energy generation from renewable sources, whereas the willingness to pay is positively associated with education, energy subsidies and state support. The public’s acceptance of renewable energy and general willingness-to-pay (WTP) is evaluated in multiple studies [29,30,31], independent from the topic of energy communities. Ref. [32] finds that the WTP towards renewable energy from solar PV or wind is significantly higher, compared to other renewables.
1.1.3. Economic Viability of Energy Communities
Despite good intentions and a certain WTP for renewable energy [29]—especially for solar PV [32]—the financial aspect still plays an important role, especially when it comes to opening renewable energy usage and energy community participation across all income categories. The profitability of participating in energy communities to share renewable energy or conduct joint investments is investigated by a variety of studies. The profitability of PV sharing for residential customers within individual multi-apartment buildings is addressed in [33], while [34] focuses on pricing and resource allocation between customers and the owner of the generation/storage units. In [35], the impact of increased self-consumption by combined PV and battery storage on the electricity bill is investigated. Ref. [36] goes one step further and determines the actual added value of extending energy communities from individual buildings to a residential neighbourhood.The impact of hiring a contractor is explored in [37]. The economic viability of participating in an energy community significantly depends on a variety of different factors, such as the energy community set-up (i.e., the considered energy mix and the composition of participants), among others. Scientific research is conducted in this area in order to determine the suitability of different renewable energy technologies for energy communities of different characteristics [38] and the optimal utilisation of local resources and decentralised generation technologies [39]. Ref. [40] not only focuses on the optimal energy technology configuration, but also determines the optimal building mix.
1.2. History of Energy Communities in Austria
The story of energy communities in Austria dates back to 2017, with adaptations to the Electricity Industry and Organisation Act [41] that legally enables the establishment of energy communities within individual multi-apartment buildings. The establishment of energy communities beyond the border of individual buildings is not legally enforced, yet is sort of a grey area, as there exists the possibility of installing direct lines between buildings. Due to a lack of practical experience and the in-existence of a contact point for questions concerning legislative loopholes and technical implementation, the concept of energy communities behind the meter have not taken hold yet and are the exception to date.
In order to prevent such negative development for energy communities between multiple buildings, much thought is currently being put into a meaningful national transposition of the RED into Austrian law. The difficulty in this task lies in interpreting the often generally formulated guidelines and incorporating them smoothly into the existing legal framework. One of the most debated points in the transposition of the RED is the criterion of proximity for REC participants. “Renewable energy community means a legal entity which is effectively controlled by shareholders or members that are located in the proximity of the renewable energy projects that are owned and developed by that legal entity” (RED, Article 2, (16a)). Transparency is crucial for defining a REC proximity constraint for potential energy community participants. Basically, there exist three different approaches to embody ’proximity’ in a geographical context:
- First, geographical proximity could be defined by specifying a certain perimeter for RECs. However, such a definition has certain drawbacks, as it would not be transparent on what grounds the centre of the perimeter is set, and to what dimensions this perimeter is bound to. Moreover, such national transposition would lead to the discrimination of residents living in geographically remote areas which are commonly found in Austria.
- Second, there is the possibility of defining geographical proximity through political districts or postal codes. This approach has the outstanding advantage that potential participants would be immediately aware of with whom they could form an energy community. However, for smaller districts or villages, energy community establishment would be significantly restrained for no technical reason, which could also be described as discriminative.
- Third, energy communities could be geographically constrained by grid levels. If more grid levels are used for inner-community electricity transfer, more heterogeneous RECs can be formed. If the extent of RECs is constrained by using the low-voltage grid only, industrial and commercial customers, wind farms and most hydro power plants could not participate, due to their usual connection to higher grid levels. In the case that the RECs were constrained by the medium-voltage grid, a greater diversity of customers and generation units could be taken into account, thus increasing synergy effects. The negative side of this approach is that customers do not yet have the ability to verify to which branch of the low-voltage grid their dwelling is connected to, making it almost impossible to know who they could establish a REC with. Therefore, this approach would require full disclosure of grid operators concerning the existing grid structure, as well as grid development plans.
Besides the proposed geographical definitions of ’proximity’, there also exists the option of a societal proximity definition. However, such approach is currently not considered by legislators.
1.2.1. The Austrian Transposition of the ’Proximity’ Constraint
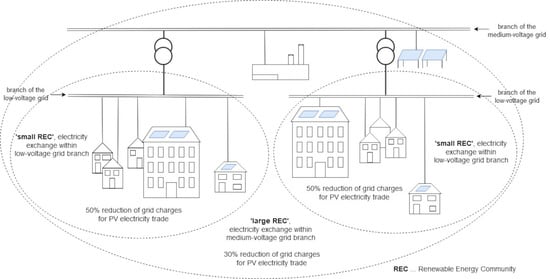
In the national transposition of the RED into Austrian law, proximity is to be defined by grid levels, as announced by the according Austrian ministry (Ministry of Climate Protection, Environment, Energy, Transport, Innovation and Technology (currently BMK, formerly BMNT)) [42,43]. As it is the objective to geographically constrain RECs as little as possible but as much as necessary to fulfil the transnational requirements, RECs are not constrained to the low-voltage grid. Instead, the medium-voltage grid can also be used for electricity transfer within RECs. Thus, the medium-voltage grid poses the upper limit of the geographical extent of RECs (this information can be extracted from the draft concerning legislative amendments to enable RECs, which is currently being reviewed in Austria) [44]. However, as incentive to keep electricity transfer as local as possible, it is decided to introduce a stepwise reduction of per-unit grid charges. For electricity transfer within the low-voltage grid, the according charges are reduced significantly. If the medium-voltage grid is used, grid charges are still cut, but to a lesser extent. Moreover, to incentivise REC participation, customers will be exempted from the electricity levy and the green electricity levy.
1.3. Progress beyond the State of the Art Based on Future Legislative Amendments
The provided literature review shows that there exist a variety of studies concerned with the economic viability of energy communities, both within the borders of individual buildings and beyond. However, scientific research is scarce when it comes to RECs or CECs in the legal context. To date, only purely theoretical studies can be found which elaborate on the two different forms of energy communities introduced in the CEP [20], analyse existing lighthouse projects and their compliance with the new rules of the RED [21], or compare existing regulatory frameworks in terms of their favourability towards collective prosumers [22]. Concluding, studies that present energy communities in a legal or regulatory context are purely theoretical up to this point. Yet, what would be of specific interest in times of legislative amendments in order to address the novel European guidelines, are studies that analyse the implications of legislative and regulatory amendments in a practical context. This identified gap is closed in this study, by evaluating the economic viability of RECs based on the national transposition of the RED into Austrian law. Here, the Austrian interpretation of the proximity constraint is a specialty that has not been presented in literature so far. Thus, this study is highly relevant, as it bridges the gap between the novel legislative background for RECs in Austria and practical implementation as the first of its kind.
Although making profit is not the primary objective of RECs, a certain economic viability will be necessary to achieve a broad roll-out of this novel concept, instead of being reserved for wealthy citizens only. Therefore, based on the current knowledge concerning the national transposition of the RED, this study aims to quantify the economic viability of participating in a REC in Austria, thereby also analysing the impact of different community set-ups. This is done by developing a simulation model taking into account different ‘levels’ of RECs: (i) in-house electricity sharing, (ii) electricity transfer at a local level (within the low-voltage grid) and (iii) electricity transfer at a regional level (within the medium-voltage grid). Thereby, a specific highlight is the implementation of the proximity constraint for REC participants, with a stepwise reduction of charges for grid usage. A variety of case studies is provided to achieve a broad selection of results which are applicable to many different situations. The focus is mainly on residential customers and PV system implementation-building-attached or stand-alone. The results are of value for multiple stakeholders concerned with RECs. This is not only important for policy decision makers to estimate the potential success of a broad REC roll-out in Austria, but also for potential participants who are interested in achieving at least a break-even in order to prevent false expectations. Moreover, contractors can also estimate, whether it might be worthy to develop business cases for RECs specifically. This study is at the pulse of time, combining the currently developed legislative basis for RECs with case studies of practical implementation.
2. Model and Method
In order to determine the economic viability of REC participation for residential customers, a simulation model is developed and explained in Section 2.1. Based on Section 2.1, Section 2.2 introduces profitability calculations, prices and costs. In order to explore the impact of different community set-ups, a variety of different case studies is introduced in Section 2.3. Finally, Section 2.4 explains how the simulation model is validated.
2.1. Simulation Model
As explained, the proximity constraint for RECs will be implemented through grid levels, by making the medium-voltage grid the limit to inner-community electricity transfer. In order to incentivise local electricity transfer, grid charges are reduced in two steps: in the case that REC electricity is distributed between generation units and participants using the low-voltage grid only, grid charges are reduced to a greater extent, compared to when using the medium-voltage grid as well. In that case, grid charges are also reduced, but to a lesser extent.
Based on this background, the simulation is set up in a three-stage process, which is illustrated in Figure 1 and explained in detail in the following:
Stage 1: The first stage of the simulation takes place within the borders of individual buildings. Single-family houses (SFHs) with their private PV systems cover as much of their load as possible by PV self-consumption at no cost (it is assumed that investments in PV systems are conducted in the past, and have no impact on the current situation). Residents of multi-apartment buildings (MABs) with a collective PV system (PV systems on multi-apartment buildings’ roofs are assumed to be owned by an external agent, e.g., a contractor, who sells the generated PV electricity) also benefit from consuming in-house PV electricity, as the public grid is not needed for electricity transfer, leading to a complete omission of per-unit grid charges. In the case of a PV system in MABs, the generated PV electricity is distributed to the individual residents in two steps: In the first step, each resident is allocated a fixed share of the generated electricity (static allocation); in the second step, surplus PV electricity and residual load are mapped dynamically to the residents (static and dynamic allocation of PV electricity within the borders of multi-apartment buildings is taken into account in this study with regard to the Electricity Industry and Organisation Act [41], which allows in-house PV trading since 2017). Static and dynamic allocation is explained in more detail in Section 2.1.1.
Stage 2: The second stage of the simulation process represents electricity transfer between customers and generation units connected within low-voltage levels. This means that, if a certain number of participants and generation units is connected within the same branch of the low-voltage grid, the simulation maps load and generation within this so-called ’small REC’ dynamically (for an explanation, see Section 2.1.1). In this case, grid costs are reduced significantly due to local self-supply from renewable sources within a branch of the low-voltage grid.
Stage 3: In the third stage of the simulation process, the residual load and surplus generation remaining uncovered or unused from stage two of the simulation are merged. This means that the participants and generation units of individual ’small RECs’ are considered to be part of a ’large REC’, if their low-voltage grid branches are connected by a branch of the medium-voltage grid. Moreover, there is also the possibility of larger generators or customers to be part of the ’large REC’, in case they are connected to the according branch of the medium-voltage grid. Grid costs for electricity transfer between participants within the borders of this third stage are also reduced, due to regional electricity consumption; however, the reduction is smaller compared to that in stage two.
After stage three of the simulation model, it is assumed that the residual load is covered by conventional grid consumption, whereas private owners of PV systems feed the surplus generation that they were not able to sell to REC peers into the grid for a small remuneration of EUR/kWh. For better understanding, the whole simulation procedure described above is illustrated in Figure 2. The costs for electricity within the different stages of the simulation model, as well as the method of billing and accounting for selling and purchasing electricity in RECs, are presented in Section 2.2.
2.1.1. Static and Dynamic PV Electricity Allocation
Static allocation is a process, in which each resident is allocated a fixed share of the generated PV electricity at each timestep, independent of the demands of fellow REC members.
For dynamic allocation, two general cases can be distinguished:
- Total generated PV electricity > total load: This means that the total load can be covered. The electricity of the individual generation units is used on a pro-rata basis to cover the load. The pro-rata basis is calculated by dividing the electricity generation of the individual generation units by the total generation.
- Total generated PV electricity < total load: This means that the load can only be covered to some extent. The individual loads are covered on a pro-rata basis, thereby fully using the available PV generation. The pro-rata basis is calculated by dividing the individual loads by the total load.
By mapping generation and load dynamically as described above, the discrimination of individual customers and/or generators can be avoided. Moreover, customers are incentivised to shift their load towards times of high generation.
2.2. Mathematical Formulation
In order to determine the actual economic viability of REC participation, the conventional (conventional in this context means that no REC is established) electricity costs of individual customers are determined (for all cost calculations it should be noted that fixed charges are not considered, as those charges are not affected by REC implementation). Hereby, residents who own a PV system-in this study it is assumed that only a selection of SFHs are equipped with a privately-owned PV system (the specifics of the energy community are given in Section 2.3), and other customers need to be distinguished, as the amount of self-consumed PV electricity mitigates conventional electricity costs in the first place. Moreover, revenues for feeding the surplus PV generation into the grid need to be taken into account. The corresponding calculations are given in Equation (1). The nomenclature is provided in Abbreviations.
For comparison, and based on the outputs of the different stages of the simulation model, the costs for electricity of all customers are calculated for the case of establishing a REC (Equation (2)). The prices for electricity transfer differ, depending on the theoretical flow of electricity (from source to sink). In this case, three different community electricity prices are distinguished (a detailed breakdown of electricity costs is given in Section 2.2.1): (i) the price for PV electricity purchase in multi-apartment buildings with an in-house PV system (), (ii) the price for electricity transfer in ’small’ RECs, using the low-voltage grid only (), and (iii) the price for electricity transfer within the ’large’ REC using the medium-voltage grid (). Depending on the customers’ shares of the load covered in the individual stages of the REC, costs are calculated accordingly.
SFH owners with private PV system profit twofold from REC participation: They do not only benefit from buying electricity within the REC at lower costs, but they can also sell their self-generated electricity at a significantly higher price to REC peers than what they would gain for conventional grid feed-in. Therefore, for SFH owners with private PV systems, the total costs for electricity need to be adjusted for revenues gained by selling electricity to other energy community participants. The surplus electricity that is not used within all stages of the REC is then fed into the grid. The revenues are determined as follows (Equation (3)).
The annual costs for electricity purchase within an established REC, adjusted for the potential revenues of SFH owners with private PV systems, are given in Equation (4).
Finally, the actual difference in costs for electricity with and without establishing a REC (Equation (5)), can be determined. Thus, the theoretical (it is theoretical because it is likely that participating in a REC comes with additional costs, such as a participation fee, which are not included in the calculations) profitability of RECs is determined for all participants.
2.2.1. Prices and Costs
In order to fully understand the electricity prices for different levels of the REC, the basic structure of the Austrian retail electricity price is introduced in the following. It basically consists of three different parts:
- (i)
- Costs for energy: In general, energy costs in Austria differ from supplier to supplier and depend on the provided energy mix. In this study, electricity prices are taken from a Viennese electricity supplier, offering tariffs within a span of 4 c/kWh between the lowest and the highest energy price for residential customers (Table 1).
- (ii)
- Costs for grid usage [45]: Apart from one-off charges, such as the network access charge and the network provision charge, there exist charges for grid usage, grid losses and measurement services, which need to be paid monthly. Charges for grid usage are split into an energy-related component ( EUR/kWh) and a fixed component. Charges for grid losses are only paid per kilowatt hour and measurement services are charged on a fixed basis.
- (iii)
- Taxes and levies [45]: These encompass the electricity levy in EUR/kWh, the green electricity levy and the biomass subsidy (which are both split into a fixed and an energy-related component), the fixed green electricity surcharge and CHP surcharge. In addition, there is the user fee (charge for the use of public land for supply lines for electricity, natural gas and district heating), which differs for the federal states 6% (based on the net grid charges) in Vienna), and finally the value added tax (VAT) of 20%.
When it comes to establishing RECs, the costs for electricity transfer within the REC lie below conventional costs for grid electricity purchase. Besides the omission of the electricity levy and the green electricity levy in the case of renewable electricity transfer within a REC, the charges for grid usage are situation specific (assumptions concerning financial relief for RECs are in line with the official presentations of the according ministry [43]). For electricity usage within the borders of individual multi-apartment buildings (MABs), the public grid is not used for the electricity transfer and, so, the grid charges are set to zero. For electricity transfer within the low-voltage grid, it is assumed that the grid charges are reduced by half. Within the medium-voltage grid, grid charges are reduced by 30% (these assumptions are in line with [46]. Generally, it needs to be remarked that no absolute number has been given concerning the reduction of grid charges). The cost components of all described cases are provided in Table 1.
The price for residential surplus PV electricity fed into the grid is set to EUR/kWh, due to the necessity of moving away from high remuneration for PV electricity feed-in.
2.3. Case Study Definition
In order to explore a beneficial community set-up, a variety of case studies is taken into account to estimate economic viability.
- Case study 1: In the first use case, it is assumed that only household customers (i.e., residing in SFHs or MABs) with or without an in-house PV system, are considered as participants of the REC.
- Case study 2: The second use case extends the first by considering a stand-alone PV plant for increased renewable electricity generation.
- Case study 3: The third use case again extends the second by additionally taking into account a commercial customer.
Concerning residential customers, ten SFHs and three MABs are considered. Two of the MABs accommodate ten apartments each, while the third MAB includes fifteen units. The apartments are allocated real measured load profiles at a 15-min resolution, depicted in Figure 3. The annual load of the SFHs ranges between 5954 kWh and 8635 kWh. The total load of the three MABs is 33,157 kWh, 33,442 kWh and 57,042 kWh, respectively. For the commercial customer (Figure 3e), a standard load profile [52] is used and scaled up to an annual energy consumption of 25,000 kWh. Concerning renewable generation within the REC, it is assumed that a selection of the SFHs is equipped with privately-owned PV systems. Two of the multi-apartment buildings are also equipped with in-house PV systems, owned by an external entity (e.g., a contractor) that sells the generated PV electricity primarily to the building residents and then to other REC members in the next stages. The PV systems are installed on the buildings’ roofs tilted by 30° and oriented in southern, eastern and western directions, depending on the orientation of the building. The stand-alone PV plant is assumed with 60 kWp, facing south. Figure 3f shows the electricity generation of a PV system on a 30°-tilted roof in the unit kWh/kW for the directions south, east and west. The northern direction is not considered due to low generation yields.
Table 2 shows the selection of residential customers with their customer ID, load, PV systems, and orientation. All customers are assumed to be part of the REC. However, as explained in Section 2.1 and illustrated in Figure 1, a ’large’ REC can be subdivided into load and generation units that are connected by the low-voltage grid only (’small REC’). The REC in this study defines two ’small RECs’ with customers 1–25 and 26–45 (Table 2) connected through individual branches of the low-voltage grid, respectively. These two ’small RECs’ are connected through a branch of the medium-voltage grid, making energy transfer possible beyond the borders of the ’small RECs’ and, thus, within the ’large REC’.
2.4. Validation of the Simulation Model and Its Limitations
The validation of the developed model is conducted in several ways. The simulation concerns the mapping of demand and renewable generation within the different stages of the REC-(i) within building borders (in-house PV system), (ii) within ’small RECs’ (within a branch of the low-voltage grid), and (iii) within the ’large REC’ (including the medium-voltage grid for electricity transfer). The residual load that cannot be covered within the REC is covered by conventional grid electricity purchase; the surplus renewable electricity generation that is not used within the REC is sold outside the REC. Since it is possible to extract the exact shares of load coverage and used PV generation within the individual stages of the REC, the process of mapping load and generation during the simulation process can be validated as follows:
- Summing up the shares of the covered load within the individual stages of the REC plus the residual load that needs to be covered by conventional grid electricity purchase must equal the total load of each customer.
- Similarly, the amount of PV generation that is used within the individual stages of the REC, plus the surplus PV generation that needs to be sold beyond the borders of the REC, must equal the total renewable PV generation.
Table 3 shows a detailed breakdown of the load covered and the generation used within different stages of the simulation model for three different representative customers. Most importantly for validation, the sum of the covered loads within the individual stages of the REC equals the total load. The sum of the used generation within the individual stages of the REC equals the total generation. For Customer 1, the load covered within the SFH must equal the generation used within the SFH. In contrast, for Customer 40, the amount of covered load and used generation is not equal, since the MAB customers with in-house PV system are allocated fixed shares of the PV generation (it needs to be noted, that these fixed shares are allocated to the MAB residents theoretically; they only have to pay for the amount of electricity they actually use, since the in-house PV system in MABs is assumed to be externally-owned), from which they use as much as possible-before the residual amounts of load and generation are mapped dynamically between the residents of the respective MAB, and then mapped dynamically within the other stages (’small REC’ and ’large REC’) of the energy community.
Moreover, the correct functioning of the simulation is proven for the case when it is assumed that there is no renewable generation available. In that case, the shares of load covered within the individual stages of the REC are zero, and the customers’ residual demand (which equals the total demand) needs to be covered by conventional grid electricity purchase. The breakdown of this scenario is given in Table 4.
As proven before, the simulation model works correctly. However, every implementation has its advantages and limitations. An advantage of this implementation is its modularity, in a way that customers and generation units can be added easily without any changes to the code. Moreover, the model allows to extract all electricity flows of all stages of the simulation-individual building level, ’small REC’ level (low-voltage grid) and ’large REC’ level (medium-voltage grid), enabling precise monitoring and accurate pricing. A limitation of this method is that the implementation of the REC with its different levels and the therefrom derived stepwise reduction of grid charges is valid specifically for Austria. Therefore, the gained results are applicable to Austrian conditions only. However, the results are still of significant value, since other European countries will present either similar or different approaches to the proximity constraint or financial incentives for REC participation. These approaches and the respective results can then be compared and evaluated on a supranational level.
3. Results
This section aims to provide an overview of cost savings for residential customers when participating in a REC of different set-ups, and therefore answers the first research question. In Section 3.1 a purely residential REC is considered, whereas in Section 3.2, it is assumed that a stand-alone PV plant is also part of the REC. Finally, Section 3.3 presents results for a REC consisting of residential customers, a stand-alone PV system, and a commercial customer. In Section 3.4, a synthesis concerning shares of load coverage within the individual levels of the REC is provided.
The following results show a detailed breakdown of how savings due to REC participation can be achieved. The wording used within the tables can be interpreted as explained in Table 5.
3.1. Residential REC
This section provides results for a REC with residential customers only. The set-up is as introduced in Table 2, with customers 1–25 and 26–45 forming ’small’ RECs (exchanging electricity within individual branches of the low-voltage grid), before being considered a ’large’ REC with electricity trade expanded to medium-voltage levels.
Results given in Table 6 and Table 7 show that the total savings due to participation in a REC cover a broad range; from a minimum of EUR/yr to a maximum of EUR/yr. It becomes immediately apparent that cost savings are, in general, smallest for residents without PV systems on their building’s rooftop. SFH residents with their private PV system benefit the most by selling surplus PV electricity to their REC peers; an action that is remunerated with the energy price (in comparison to feeding the surplus into the grid for significantly smaller remuneration). Thus, larger PV system sizes prove to be advantageous, as shown in the case of Customer 2, having the largest PV capacity installed and, thus, gaining the largest revenues. MAB residents also benefit significantly by purchasing electricity from the building-attached PV system (if one is installed), leading to a total omission of grid charges, as introduced in Section 2.2.1. The savings of the remaining customers are lower, as they rely on the electricity leftovers of their peers (after consumption within building borders).
Looking specifically at the results for SFH residents with private PV systems, it becomes apparent that cost savings due to electricity purchase within the community are insignificant. This is not surprising, as the shares of load coverage by buying REC electricity sometimes remain below 1% (e.g., Customers 2 and 26). In comparison, the share of the load covered by direct consumption from the in-house PV system ranges between 25.15% and 30.84% (self-consumption shares are in line with [53,54]).
3.2. REC with Households and Stand-Alone PV Plant
This section aims to quantify the impact of taking into account a stand-alone PV plant with 60 kWp installed capacity. Results for the residential customers are provided in Table 8 and Table 9. An additional generation unit within the REC implies that there is significantly more electricity available for consumption under REC tariffs. This leads to improved economic viability for all customers, compared to the situation without an additional stand-alone PV plant, as introduced in Section 3.1. The relation of total generation to total load increases from 33.62% to 65.53%. However, the improvement of economic viability is unequal for individual customers and ranges between EUR/yr (Customer 6) and EUR/yr (Customer 5).
These two extreme values can be explained as follows. Customer 6 is one out of two customers with an annual load below 2000 kWh who is located in MAB 1, which has an in-house PV system available. The combination of a small energy demand and (in relation to that) a large amount of available in-house PV electricity (the exact relation of generation and demand for Customer 6 just by static PV electricity allocation is almost 112%) leads to the situation that Customer 6 does not require large amounts of electricity from the community, including the stand-alone PV plant. The share of load coverage only increases from 30.87% (Table 6) to 33.69% (Table 8). Customer 5, on the contrary, is a conventional SFH resident without a private PV system, who profits significantly from the stand-alone PV plant due to a high energy demand of almost 7000 kWh. The load coverage by renewable energy from the community increases from 16.20% to 28.22% for this customer.
3.3. REC with Households, Stand-Alone PV Plant and Commercial Customer
In comparison to Section 3.2, this section now includes a commercial customer along with the residential participants. The stand-alone PV system is still considered to be part of the energy community. The results show that participating in the REC is advantageous for the commercial customer, while the results for the residential customers are only slightly worsened, except for the SFH owners with a private PV system (Table 10 and Table 11). For these participants, the economic viability is improved, as a larger amount of self-generated PV electricity can be sold within the REC, due to the participation of the commercial customer. With the presence of the commercial customer, the relation of total generation to total demand drops by 7.49% to 58.04%.
In general, considering a commercial customer as a REC participant can be considered advantageous, as their presence does not affect the results of residential customers significantly, while an enhanced usage of local electricity is ensured. In the case where the commercial customer is not taken into account, only 23.00% of the stand-alone PV system electricity is locally consumed, whereas the remaining 77.00% would be sold otherwise. On the contrary, in the case where one commercial customer (with an annual load of 25,000 kWh) is taken into account, the locally used electricity of the stand-alone PV plant already increases by 10% (to 33.17%). This means that only 66.83% need to be sold outside the borders of the REC by the PV plant operator.
3.4. Synthesis-Load Coverage within Different Levels of the REC
This section discusses the load coverage within the different levels of the REC for the three different energy community set-ups (residential, residential + stand-alone PV, residential + stand-alone PV + commercial). The first part of Table 12 shows the total load coverage, with and without taking into consideration the direct consumption of SFHs from their private PV systems. Theoretically, when actually looking at the performance of the REC, load coverage by direct consumption in SFHs with PV may not be considered, as direct consumption and the according share of load coverage is not related to the concept of an energy community. However, these numbers are given for the sake of completeness and comparability.
The second part of Table 12 shows (i) how much of the load of customers 1–25 is covered when only trading PV electricity within a branch of the low-voltage grid (’small’ REC), and (ii) how much of the load of customers 1–25 can be covered in total, when also being able to transfer electricity over the medium-voltage grid (thus forming the ’large’ REC with customers 26–45). Analogous results are shown for customers 26–45 in the third part of Table 12. It can be seen that, in case the REC is purely residential with moderate amounts of PV generation, load coverage mainly takes place within the ’small’ RECs. When also allowing electricity exchange between the ’small’ RECs over the medium-voltage grid-thus forming a ’large’ REC, load coverage increases insignificantly. However, in case a stand-alone PV system is assumed to also be connected to the respective branch of the medium-voltage grid, it can be seen that the share of load coverage increases significantly. Thus, the importance of sufficient local generation is demonstrated repeatedly. For the third use case-including a commercial customer-the situation changes insignificantly, with a slight drop in the shares of load coverage due to the increase in the total load of the ’large’ REC.
4. Sensitivity Analyses
Thus far in this study, the results are presented without consideration of a certain kind of participation fee for RECs (i.e., a cost term), which could influence the profitability of such concepts significantly; Section 4.1 discusses this issue. Moreover, as local electricity transfer will be incentivised by step-wise reduced grid charges, the actual monetary impact of such implementation is quantified in Section 4.2. Last, but not least, the influence of lower electricity prices is investigated in Section 4.3. By conducting sensitivity analyses on the impact of described influencing factors, the second research question of this paper is answered.
4.1. Participation Fee-Costs for REC Operation, Billing and Accounting
A major factor of uncertainty concerning the actual economic viability of RECs is the related costs for organisational efforts, billing, and accounting. Given the case that a certain actor (e.g., a contractor, an energy supplier) must manage an energy community, a certain kind of participation fee is required from the participants to remunerate the actor for all efforts and necessary expenses to operate the community. To date, due to missing practical experience, it is not possible to financially quantify efforts and expenses associated with the operation of RECs. In contrast, it is possible to exactly quantify the maximum possible participation fee such that taking part in a REC has, at least, no negative impact on the participant’s finances, compared to the default situation without REC. The maximum annual participation fee that could be charged, and would still allow participants to break-even, is different for the individual customers, since the annual savings by REC participation differ. This situation is illustrated in Figure 4, for all customers and the three different case studies. It becomes evident that a participation fee would, in general, mostly affect residents of MABs without an in-house PV system (i.e., Customers 16–25). Here, the maximum participation fee per year would range around 30 EUR/yr for a purely residential REC, and around 50 EUR/yr for a REC with an additional stand-alone PV generation unit. Most other customers could still achieve break-even with a participation fee around 60 EUR/yr to 80 EUR/yr. Therefore, with participation fees between 30 EUR/yr and 80 EUR/yr, REC operators could charge around EUR and EUR per month for their services. However, some less-fortunate participants might not be able to break even.
For the commercial customer, the cost savings are significantly above those for residential customers; namely, at a level of 450 EUR/yr. Based on this result, one option could be to increase participation charges for commercial customers that profit significantly from buying cheaper community electricity due to their constantly high energy demand. By doing so, the participation fee for residential customers could be kept at moderate levels, in order to incentivise participation.
4.2. Quantifying the Impact of Reduced Grid Charges
Linking the proximity constraint for RECs to the specific grid levels of the public electricity grid is a topic of controversy. Therefore, this section aims to quantify the actual monetary impact of reduced grid charges for the different levels of the REC. Basically, the more local the electricity that is transferred, the higher the reduction of grid charges (50% reduction for electricity transfer within the low-voltage grid and 30% within the medium-voltage grid). However, in this sensitivity analysis, it is assumed that grid charges need to be paid in full (for PV electricity within the borders of individual multi-apartment buildings, grid charges are still omitted in full, as the public grid is not used for electricity transfer to the individual residents), and that the cost-saving potential of REC participation is only connected to the omission of the electricity levy and the green electricity levy.
The results in Table 13 and Table 14 show that, for a purely residential REC, the savings of MAB residents with in-house PV systems barely decrease, as most of the savings are gained by direct consumption within the building border. SFH residents with private PV systems gain most of their annual benefits by selling PV electricity to community peers. As grid charges for electricity transfer are allocated to the recipient, these customers are also only slightly affected. However, for conventional customers without in-house PV, cancelling grid cost reductions causes a noticeable decline in annual savings, up to 32 EUR/yr for SFH residents (Customer 29) and up to 19 EUR/yr for MAB residents (the decrease in annual savings depends significantly on the customer’s load) in this case study.
In the case where a stand-alone PV system is considered to participate in the REC, the omission of reducing grid costs for the two levels of the REC is reflected somewhat more in the annual savings for participants with in-house PV systems as, in this case, a larger amount of local renewable PV electricity can be purchased to cover the load. From these results, it can be concluded that the approach of reducing grid costs as an incentive to participate in a REC is specifically important for customers without an in-house PV system, as long as the economic viability of RECs hangs by a thread. However, in addition to a reduction of grid charges, other incentives (e.g., tax exemptions) could be implemented.
4.3. Lower Retail Electricity Prices
In this section, the originally assumed costs for energy of approximately c/kWh (as given in Table 1) is reduced to c/kWh, leading to lower total electricity prices within the different levels of the REC. Higher electricity prices have a significant influence on the profitability of PV systems, as a larger amount of costs for purchasing grid electricity can be saved, in comparison to a situation with lower retail electricity prices. However, as it is assumed that electricity within the REC is sold at exactly the same energy price as grid electricity in this study (savings due to REC participation are gained by the omission of the electricity levy and the green electricity levy, as well as the step-wise reduction of grid costs), the savings gained by REC participation for customers that do not own a PV system are not influenced by the actual retail electricity price. For SFH residents with a private PV system, in contrast, the energy price indeed influences their financial benefits as, with lower energy prices, the difference between the energy price and the feed-in tariff shrinks; thus, the viability of selling PV electricity to the REC peers (instead of feeding it into the grid) also decreases.
Figure 5 shows the actual cost savings of SFH owners with private PV systems when participating in a REC. For the case of a purely residential REC, the cost savings decrease by 40–50%. In the case where a stand-alone PV system is taken into consideration, the decrease in cost savings is approximately reduced to the range of 30–40%. This demonstrates once more the importance of significant amounts of renewable generation to achieve economically sustainable RECs.
5. Conclusions
A thorough literature review shows a general lack of studies addressing energy communities with respect to the novel legislative framework in Europe. The limited number of existing studies only present this topic in a theoretical way, missing all aspects of practical implementation. This study aims to close this gap by evaluating the economic viability of REC participation for primarily residential customers under the framework of the RED transposed into Austrian law. The cost saving potential induced by REC participation is evaluated for different REC configurations—purely residential, with increased renewable PV generation and taking into account a commercial customer—in order to discern beneficial REC configurations. This topic is presented in the context of transposing novel European guidelines for RECs into Austrian law, which will come to force in 2021. Legislators have announced a selection of financial incentives for REC participation, such as the omission of certain levies, as well as the stepwise reduction of per-unit grid charges, according to grid levels. A simulation model is developed to estimate the economic viability of RECs, which is set up such that all announced specifications for RECs are taken into account. Thus, the gained results can be considered generally valid for future RECs in Austria and to give a realistic outlook to the economic situation. Based on the results of this study, different stakeholders shall be prevented from developing false expectations concerning the economic potential of RECs.
It is shown that the economic viability of RECs for residential customers depends significantly on their individual situation, such as whether an in-house PV system is available and whether the PV system is privately-owned, or otherwise. Moreover, external factors, such as the composition of participants within the REC, the available amount of renewable electricity within the borders of the REC, and the price for conventional grid electricity purchase, play important roles. It is shown that residents with a privately-owned PV system profit the most from REC participation, as they not only can purchase electricity at lower costs (through reduction of levies and grid charges) within the community, but also can sell PV electricity at higher prices (compared to low standard feed-in-tariffs). This insight is specifically valuable for household customers that have not yet invested in a PV system. Previous studies such as [33,36,54,55] have already shown that PV system implementation is profitable for individual buildings. Looking at this study’s results for SFHs with privately-owned PV systems with significant revenues through selling PV electricity to community peers it can be recommended to household customers to invest in a PV system and participate in a REC to achieve a break-even of their investment within a decent period of time. Generally in RECs, electricity purchase is most valuable when the source is closer to the sink due to the stepwise reduced charges for grid usage. In the case where in-house PV electricity is sold within the borders of individual MABs, no grid charges need to be accounted for (i.e., behind the meter). Investing in in-house PV systems and selling the generated electricity could be a valuable business opportunity for contractors: They can charge the energy community participants with the full energy price, while participants still benefit from purchasing the contractors’ electricity due to omitted or reduced grid charges. Sufficient amounts of renewable energy within the REC prove to be profitable for all participants, which again highlights the importance of encouraging private individuals and contractors to invest in renewable energy. In the case where a commercial customer is included in the REC, the results for residential customers without privately-owned PV systems are worsened, but insignificantly. Therefore, it can be concluded that taking commercial participants into account can be considered advantageous, to some extent, as synergy effects increase, and a larger amount of renewable electricity can be consumed locally.
Independent of the different case studies and energy community set-ups, achieving break-even when participating in a REC will not be easy. The results given in this study are positive for all participants, but it should be pointed out that no participation fee is considered. When it comes to the question of energy community operations, the community managers will have to raise a participation fee to be remunerated for their efforts. Due to the lack of practical experience to date, the actual price of such a participation fee remains unclear. However, it is immediately apparent that there is a limited margin for the residential customers to break even. This fact should alert policy makers to find additional (and not necessarily purely financial) support mechanisms to enhance the willingness to participate in a REC. For example, investment subsidies could be linked to the successful implementation of RECs, as is already outstandingly practiced in Scotland [56]. In order to ensure that RECs meet the criteria of a successful implementation, experts in legal, technical and organisational issues could be made available free of charge as additional incentive.
A way to ensure increased profitability of REC participation in the future is to use spatial planning. Doing so, new neighbourhoods can be designed in a way that benefits for REC participants are maximised. Such approach would ensure that individual buildings are located in close geographical range, and, at best, are connected to the same branch of the low-voltage grid to profit from a significant reduction of grid charges for inner-community electricity transfer. Moreover, as it is difficult to accommodate larger generation units retroactively in densely built areas, the planning of novel neighbourhoods should also foresee the implementation of larger renewable generation units, being, at best, connected to the same branch of the low-voltage grid (here, the maximum rated electrical output needs to be taken into consideration in the planning phase) as household customers.
The approach of using grid levels to geographically constrain RECs is a controversial topic; however, when looking at it more closely, such an interpretation of the proximity constraint could be preferable over other options, such as a perimeter definition or using postal codes. An issue that is viewed critically in this context is co-operation with grid operators. Despite being a fully regulated monopoly, grid operators might not be in favour of stepwise reduced grid charges, especially when it is not proven that the implementation of RECs actually reduces the grid burden or increases grid stability. However, the stepwise reduction of grid charges planned by Austrian legislators provides an additional incentive for local electricity consumption, even if the thus-gained financial benefits are moderate.
Based on this work, it would be of interest to see other research articles concerned with simulating RECs under the novel regulatory frameworks of other countries. As the national transposition of the RED will be at least slightly different in other countries, intriguing comparisons would be of value, in order to derive the most beneficial approaches for broad REC application. Additionally, future studies should focus on evaluating the actual organisational efforts of REC managers, in order to obtain a concrete idea about the value of a potential participation fee. Last, but not least, it would be of interest to find out more about the optimal REC implementation, in terms of the number and type of participants, as well as the optimal energy mix, for different objective functions.
Author Contributions
B.F.: Conceptualization, Methodology, Software, Validation, Formal Analysis, Investigation, Resources, Data Curation, Writing—Origional Draft, Writing—Review and Editing, Visualisation. H.A.: Validation, Writing—Review and Editing. All authors have read and agreed to the published version of the manuscript.
Funding
This research received no external funding.
Acknowledgments
I would like to thank Johannes Kathan for discussions during the development of the simulation model. Moreover I would like to thank Tara Esterl for discussions concerning the regulatory background in Austria. Finally, special thanks go to Carolin Monsberger for her general support and proofreading.
Conflicts of Interest
The authors declare no conflict of interest.
Abbreviations
The following abbreviations are used in this manuscript:
| Abbreviations | ||
| CEC | Citizen Energy Community | |
| CEP | Clean Energy for all Europeans Package | |
| EB | Electricity bill | |
| EMD | Electricity Market Directive | |
| FiT | Feed-in-Tariff | |
| ID | Customer identification | |
| LC | Load coverage | |
| MAB | Multi-apartment building | |
| RED | Renewable Energy Directive | |
| REC | Renewable Energy Community | |
| SFH | Single-family house | |
| Nomenclature | ||
| Difference in annual electricity costs with and without REC established | EUR/yr | |
| Annual electricity costs with a REC established, revenues of PV system owners not considered | EUR/yr | |
| Annual electricity costs with a REC established, adjusted for revenues of PV system owners | EUR/yr | |
| Default annual electricity costs (without a REC established) | EUR/yr | |
| Residual generation not used in the REC | kWh | |
| PV generation used within the ’large’ REC | kWh | |
| PV generation used within the ’small’ RECs | kWh | |
| Residual generation of SFHs after self-consumption (privately-owned PV system) | kWh | |
| Load that is covered within the borders of a MAB by consuming in-house PV electricity | EUR/kWh | |
| Load that is covered within the ’large’ REC | kWh | |
| Residual load that cannot be covered within the REC | kWh | |
| Load that is covered within the ’small’ REC | kWh | |
| Residual load of SFHs after self-consumption of private PV electricity | kWh | |
| Total load of customer n | kWh | |
| n | Control variable customers | |
| N | Total number of customers | |
| SFH customers with private PV system | ||
| Pure energy price | EUR/kWh | |
| Feed-in-tariff of surplus PV generation | EUR/kWh | |
| Price for grid electricity | EUR/kWh | |
| Electricity price for in-house electricity in MABs | EUR/kWh | |
| Electricity price for electricity within ’large REC’ | EUR/kWh | |
| Electricity price for electricity within ’small REC’ | EUR/kWh | |
| Revenues gained by SFH customers with a private PV system by selling electricity within the REC | EUR/yr | |
| t | Control variable timestep |
References
- European Commission. 2030 Climate and Energy Framework. 2018. Available online: https://ec.europa.eu/clima/policies/strategies/2030_en (accessed on 2 October 2020).
- European Commission. Clean Energy for All Europeans Package. 2019. Available online: https://ec.europa.eu/energy/topics/energy-strategy/clean-energy-all-europeans_en (accessed on 2 October 2020).
- European Commission. Europe’s Moment: Repair and Prepare for the Next Generation. 2020. Available online: https://ec.europa.eu/commission/presscorner/detail/en/ip_20_940 (accessed on 20 October 2020).
- European Council. Special Meeting of the European Council (17, 18, 19, 20 and 21 July 2020)- Conclusions. 2020. Available online: https://www.consilium.europa.eu/en/press/press-releases/2020/07/21/european-council-conclusions-17-21-july-2020/ (accessed on 20 October 2020).
- European Commission. The European Green Deal. 2019. Available online: https://eur-lex.europa.eu/legal-content/EN/TXT/?qid=1596443911913&uri=CELEX:52019DC0640#document2 (accessed on 20 October 2020).
- EUR-Lex. Directive (EU) 2019/944 of the European Parliament and of the Council of 5 June 2019 on Common Rules for the Internal Market for Electricity and Amending Directive 2012/27/EU. 2019. Available online: https://eur-lex.europa.eu/legal-content/en/TXT/?uri=CELEX:32019L0944 (accessed on 2 October 2020).
- EUR-Lex. Directive (EU) 2018/2001 of the European Parliament and of the Council of 11 December 2018 on the Promotion of the Use of Energy from Renewable Sources. 2018. Available online: https://eur-lex.europa.eu/legal-content/EN/TXT/?uri=uriserv:OJ.L_.2018.328.01.0082.01.ENG&toc=OJ:L:2018:328:TOC (accessed on 2 October 2020).
- Jäger-Waldau, A. Snapshot of Photovoltaics—February 2020. Energies 2020, 13, 930. [Google Scholar] [CrossRef] [Green Version]
- Sarasa-Maestro, C.J.; Dufo-López, R.; Bernal-Agustín, J.L. Photovoltaic remuneration policies in the European Union. Energy Policy 2013, 55, 317–328. [Google Scholar] [CrossRef]
- Zhang, F.; Deng, H.; Margolis, R.; Su, J. Analysis of distributed-generation photovoltaic deployment, installation time and cost, market barriers, and policies in China. Energy Policy 2015, 81, 43–55. [Google Scholar] [CrossRef] [Green Version]
- Yin Mah, D.N.; Wang, G.; Lo, K.; Leung, M.K.; Hills, P.; Lo, A.Y. Barriers and policy enablers for solar photovoltaics (PV) in cities: Perspectives of potential adopters in Hong Kong. Renew. Sustain. Energy Rev. 2018, 92, 921–936. [Google Scholar] [CrossRef]
- Shukla, A.K.; Sudhakar, K.; Baredar, P.; Mamat, R. Solar PV and BIPV system: Barrier, challenges and policy recommendation in India. Renew. Sustain. Energy Rev. 2018, 82, 3314–3322. [Google Scholar] [CrossRef]
- Strupeit, L.; Palm, A. Overcoming barriers to renewable energy diffusion: Business models for customer-sited solar photovoltaics in Japan, Germany and the United States. J. Clean. Prod. 2016, 123, 124–136. [Google Scholar] [CrossRef]
- Huijben, J.; Verbong, G. Breakthrough without subsidies? PV business model experiments in the Netherlands. Energy Policy 2013, 56, 362–370. [Google Scholar] [CrossRef]
- Polo, A.L.; Haas, R. An international overview of promotion policies for grid-connected photovoltaic systems. Prog. Photovoltaics Res. Appl. 2012, 22, 248–273. [Google Scholar] [CrossRef]
- Moosavian, S.; Rahim, N.; Selvaraj, J.; Solangi, K. Energy policy to promote photovoltaic generation. Renew. Sustain. Energy Rev. 2013, 25, 44–58. [Google Scholar] [CrossRef]
- Michas, S.; Stavrakas, V.; Spyridaki, N.A.; Flamos, A. Identifying Research Priorities for the further development and deployment of Solar Photovoltaics. Int. J. Sustain. Energy 2018, 38, 276–296. [Google Scholar] [CrossRef] [Green Version]
- D’Adamo, I.; Gastaldi, M.; Morone, P. The post COVID-19 green recovery in practice: Assessing the profitability of a policy proposal on residential photovoltaic plants. Energy Policy 2020, 147, 111910. [Google Scholar] [CrossRef] [PubMed]
- Kuzemko, C.; Bradshaw, M.; Bridge, G.; Goldthau, A.; Jewell, J.; Overland, I.; Scholten, D.; de Graaf, T.V.; Westphal, K. Covid-19 and the politics of sustainable energy transitions. Energy Res. Soc. Sci. 2020, 68, 101685. [Google Scholar] [CrossRef]
- Roberts, J. Power to the people? Implications of the Clean Energy Package for the role of community ownership in Europe’s energy transition. Rev. Eur. Comp. Int. Environ. Law 2020. [Google Scholar] [CrossRef]
- Lowitzsch, J.; Hoicka, C.; van Tulder, F. Renewable energy communities under the 2019 European Clean Energy Package – Governance model for the energy clusters of the future? Renew. Sustain. Energy Rev. 2020, 122, 109489. [Google Scholar] [CrossRef]
- Inês, C.; Guilherme, P.L.; Esther, M.G.; Swantje, G.; Stephen, H.; Lars, H. Regulatory challenges and opportunities for collective renewable energy prosumers in the EU. Energy Policy 2020, 138, 111212. [Google Scholar] [CrossRef]
- D’Alpaos, C.; Andreolli, F. Renewable Energy Communities: The Challenge for New Policy and Regulatory Frameworks Design. In New Metropolitan Perspectives; Springer International Publishing: Basel, Switzerland, 2020; pp. 500–509. [Google Scholar] [CrossRef]
- Hanke, F.; Lowitzsch, J. Empowering Vulnerable Consumers to Join Renewable Energy Communities—Towards an Inclusive Design of the Clean Energy Package. Energies 2020, 13, 1615. [Google Scholar] [CrossRef] [Green Version]
- Jager-Waldau, A.; Bodis, K.; Kougias, I.; Szabo, S. The New European Renewable Energy Directive-Opportunities and Challenges for Photovoltaics. In Proceedings of the 2019 IEEE 46th Photovoltaic Specialists Conference (PVSC), Chicago, IL, USA, 16–21 June 2019. [Google Scholar] [CrossRef]
- Ghiani, E.; Giordano, A.; Nieddu, A.; Rosetti, L.; Pilo, F. Planning of a Smart Local Energy Community: The Case of Berchidda Municipality (Italy). Energies 2019, 12, 4629. [Google Scholar] [CrossRef] [Green Version]
- Hicks, J.; Ison, N. An exploration of the boundaries of ‘community’ in community renewable energy projects: Navigating between motivations and context. Energy Policy 2018, 113, 523–534. [Google Scholar] [CrossRef]
- Ntanos, S.; Kyriakopoulos, G.; Chalikias, M.; Arabatzis, G.; Skordoulis, M. Public Perceptions and Willingness to Pay for Renewable Energy: A Case Study from Greece. Sustainability 2018, 10, 687. [Google Scholar] [CrossRef] [Green Version]
- Zografakis, N.; Sifaki, E.; Pagalou, M.; Nikitaki, G.; Psarakis, V.; Tsagarakis, K.P. Assessment of public acceptance and willingness to pay for renewable energy sources in Crete. Renew. Sustain. Energy Rev. 2010, 14, 1088–1095. [Google Scholar] [CrossRef]
- Paravantis, J.A.; Stigka, E.; Mihalakakou, G.; Michalena, E.; Hills, J.M.; Dourmas, V. Social acceptance of renewable energy projects: A contingent valuation investigation in Western Greece. Renew. Energy 2018, 123, 639–651. [Google Scholar] [CrossRef]
- Lee, C.Y.; Heo, H. Estimating willingness to pay for renewable energy in north Korea using the contingent valuation method. Energy Policy 2016, 94, 150–156. [Google Scholar] [CrossRef]
- Ma, C.; Rogers, A.A.; Kragt, M.E.; Zhang, F.; Polyakov, M.; Gibson, F.; Chalak, M.; Pandit, R.; Tapsuwan, S. Consumers’ willingness to pay for renewable energy: A meta-regression analysis. Resour. Energy Econ. 2015, 42, 93–109. [Google Scholar] [CrossRef] [Green Version]
- Fina, B.; Auer, H.; Friedl, W. Profitability of active retrofitting of multi-apartment buildings: Building-attached/integrated photovoltaics with special consideration of different heating systems. Energy Build. 2019, 190, 86–102. [Google Scholar] [CrossRef]
- Fleischhacker, A.; Auer, H.; Lettner, G.; Botterud, A. Sharing Solar PV and Energy Storage in Apartment Buildings: Resource Allocation and Pricing. IEEE Trans. Smart Grid 2019, 10, 3963–3973. [Google Scholar] [CrossRef]
- Roberts, M.B.; Bruce, A.; MacGill, I. Impact of shared battery energy storage systems on photovoltaic self-consumption and electricity bills in apartment buildings. Appl. Energy 2019, 245, 78–95. [Google Scholar] [CrossRef]
- Fina, B.; Auer, H.; Friedl, W. Profitability of PV sharing in energy communities: Use cases for different settlement patterns. Energy 2019, 189, 116148. [Google Scholar] [CrossRef]
- Fina, B.; Auer, H.; Friedl, W. Profitability of contracting business cases for shared photovoltaic generation and renovation measures in a residential multi-apartment building. J. Clean. Prod. 2020, 265, 121549. [Google Scholar] [CrossRef]
- Karunathilake, H.; Hewage, K.; Mérida, W.; Sadiq, R. Renewable energy selection for net-zero energy communities: Life cycle based decision making under uncertainty. Renew. Energy 2019, 130, 558–573. [Google Scholar] [CrossRef]
- Yazdanie, M.; Densing, M.; Wokaun, A. The nationwide characterization and modeling of local energy systems: Quantifying the role of decentralized generation and energy resources in future communities. Energy Policy 2018, 118, 516–533. [Google Scholar] [CrossRef]
- Wu, Q.; Ren, H.; Gao, W.; Weng, P.; Ren, J. Coupling optimization of urban spatial structure and neighborhood-scale distributed energy systems. Energy 2018, 144, 472–481. [Google Scholar] [CrossRef]
- Nationalrat. Elektrizitaetswirtschafts- und Organisationsgesetz 2010. 2020. Available online: https://www.ris.bka.gv.at/GeltendeFassung.wxe?Abfrage=Bundesnormen&Gesetzesnummer=20007045 (accessed on 2 October 2020).
- Hodasz, M. Energiegemeinschaften-Moeglichkeiten und Huerden; Bundesministerium fuer Nachhaltigkeit und Tourismus: Wien, Austria, 2019. [Google Scholar]
- Bundesministerium fuer Klimaschutz, Umwelt, Energie, Mobilitaet, Innovation und Technologie. Energiegemeinschaften im Neuen Regierungsprogramm. 2020. Available online: https://www.e-control.at/documents/1785851/1811582/02_Benedikt-Ennser(1).pdf/4b37259f-3d17-a51ed895-08b0dbe3c4a0?t=1600093973230 (accessed on 2 October 2020).
- Bundesministerium für Klimaschutz, Umwelt, Energie, Mobilitaet, Innovation und Technologie. Erneuerbaren-Ausbau-Gesetz–EAG. 2020. Available online: https://www.bmk.gv.at/recht/begutachtungsverfahren/eag.html (accessed on 2 October 2020).
- Wiener Netze. Bestandteile Netzpreis Strom. 2020. Available online: https://www.wienernetze.at/preise-bedingungen-strom (accessed on 2 October 2020).
- Hackner, J. Auswirkung der Raeumlichen Naehe und Sensitivitaeten; Hackner-Energy Ingenieur- und Beratungsbureau: Wien, Austria, 2020. [Google Scholar]
- Wien Energie. Strom. 2020. Available online: https://www.wienenergie.at/privat/produkte/strom/ (accessed on 2 October 2020).
- Rechtsinformationssystem des Bundes. Bundesrecht konsolidiert: Gesamte Rechtsvorschrift für Systemnutzungsentgelteverordnung 2018, Fassung vom 23.09.2020. 2020. Available online: https://www.ris.bka.gv.at/GeltendeFassung.wxe?Abfrage=Bundesnormen&Gesetzesnummer=20010883 (accessed on 2 October 2020).
- Rechtsinformationssystem des Bundes. Bundesrecht Konsolidiert: Gesamte Rechtsvorschrift für Elektrizitaetsabgabegesetz, Fassung vom 23.09.2020. 2020. Available online: https://www.ris.bka.gv.at/GeltendeFassung.wxe?Abfrage=Bundesnormen&Gesetzesnummer=10005027 (accessed on 2 October 2020).
- Rechtsinformationssystem des Bundes. Bundesrecht Konsolidiert: Gesamte Rechtsvorschrift für Oekostromfoerderbeitragsverordnung, Fassung vom 23.09.2020. 2020. Available online: https://www.ris.bka.gv.at/GeltendeFassung.wxe?Abfrage=Bundesnormen&Gesetzesnummer=20010107 (accessed on 2 October 2020).
- Rechtsinformationssystem des Bundes. Bundesrecht Konsolidiert: Gesamte Rechtsvorschrift für Biomassefoerderung-Grundsatzgesetz, Fassung vom 24.09.2020. 2020. Available online: https://www.ris.bka.gv.at/GeltendeFassung.wxe?Abfrage=Bundesnormen&Gesetzesnummer=20010653 (accessed on 2 October 2020).
- APCS Power Clearing and Settlement. Synthetische Lastprofile. 2020. Available online: https://www.apcs.at/de/clearing/technisches-clearing/lastprofile (accessed on 2 October 2020).
- Luthander, R.; Widén, J.; Nilsson, D.; Palm, J. Photovoltaic self-consumption in buildings: A review. Appl. Energy 2015, 142, 80–94. [Google Scholar] [CrossRef] [Green Version]
- Lang, T.; Ammann, D.; Girod, B. Profitability in absence of subsidies: A techno-economic analysis of rooftop photovoltaic self-consumption in residential and commercial buildings. Renew. Energy 2016, 87, 77–87. [Google Scholar] [CrossRef]
- Roberts, M.B.; Bruce, A.; MacGill, I. A comparison of arrangements for increasing self-consumption and maximising the value of distributed photovoltaics on apartment buildings. Sol. Energy 2019, 193, 372–386. [Google Scholar] [CrossRef]
- Local Energy Scotland. Funding. 2020. Available online: https://www.localenergy.scot/funding/ (accessed on 2 October 2020).
Figure 1.
Different levels of a REC.

Figure 2.
Flow chart of the three-stage simulation model concerning electricity trade within the borders of individual buildings, within ’small RECs’ (participants within a branch of the low-voltage grid) and finally within the ’large REC’ (participants within a branch of the medium-voltage grid).
Figure 2.
Flow chart of the three-stage simulation model concerning electricity trade within the borders of individual buildings, within ’small RECs’ (participants within a branch of the low-voltage grid) and finally within the ’large REC’ (participants within a branch of the medium-voltage grid).

Figure 3.
Overview of load and generation profiles: (a–d) show the demand of 10 considered single-family houses and 3 multi-apartment buildings. (e) shows the demand of the considered commercial customer. The loads are illustrated as the average hourly consumption for the period of one year. (f) shows the monthly PV generation in kWh/kW for different directions.

Figure 4.
Maximum potential participation fee to achieve break-even for individual participants. (a) Maximum participation fee for customers 1–25. (b) Maximum participation fee for customers 26–45.
Figure 4.
Maximum potential participation fee to achieve break-even for individual participants. (a) Maximum participation fee for customers 1–25. (b) Maximum participation fee for customers 26–45.


Figure 5.
The impact of a decrease in per-unit energy prices for SFH owners with a private PV system. (a) Purely residential. (b) Residential and stand-alone PV. (c) Residential, stand-alone PV and commercial.
Figure 5.
The impact of a decrease in per-unit energy prices for SFH owners with a private PV system. (a) Purely residential. (b) Residential and stand-alone PV. (c) Residential, stand-alone PV and commercial.


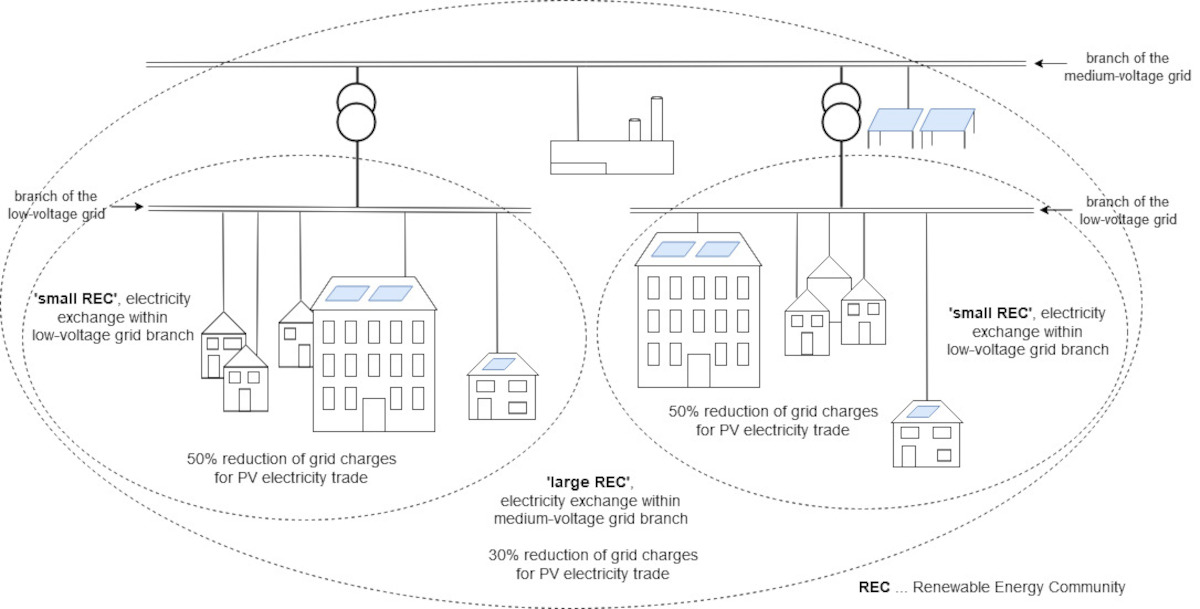
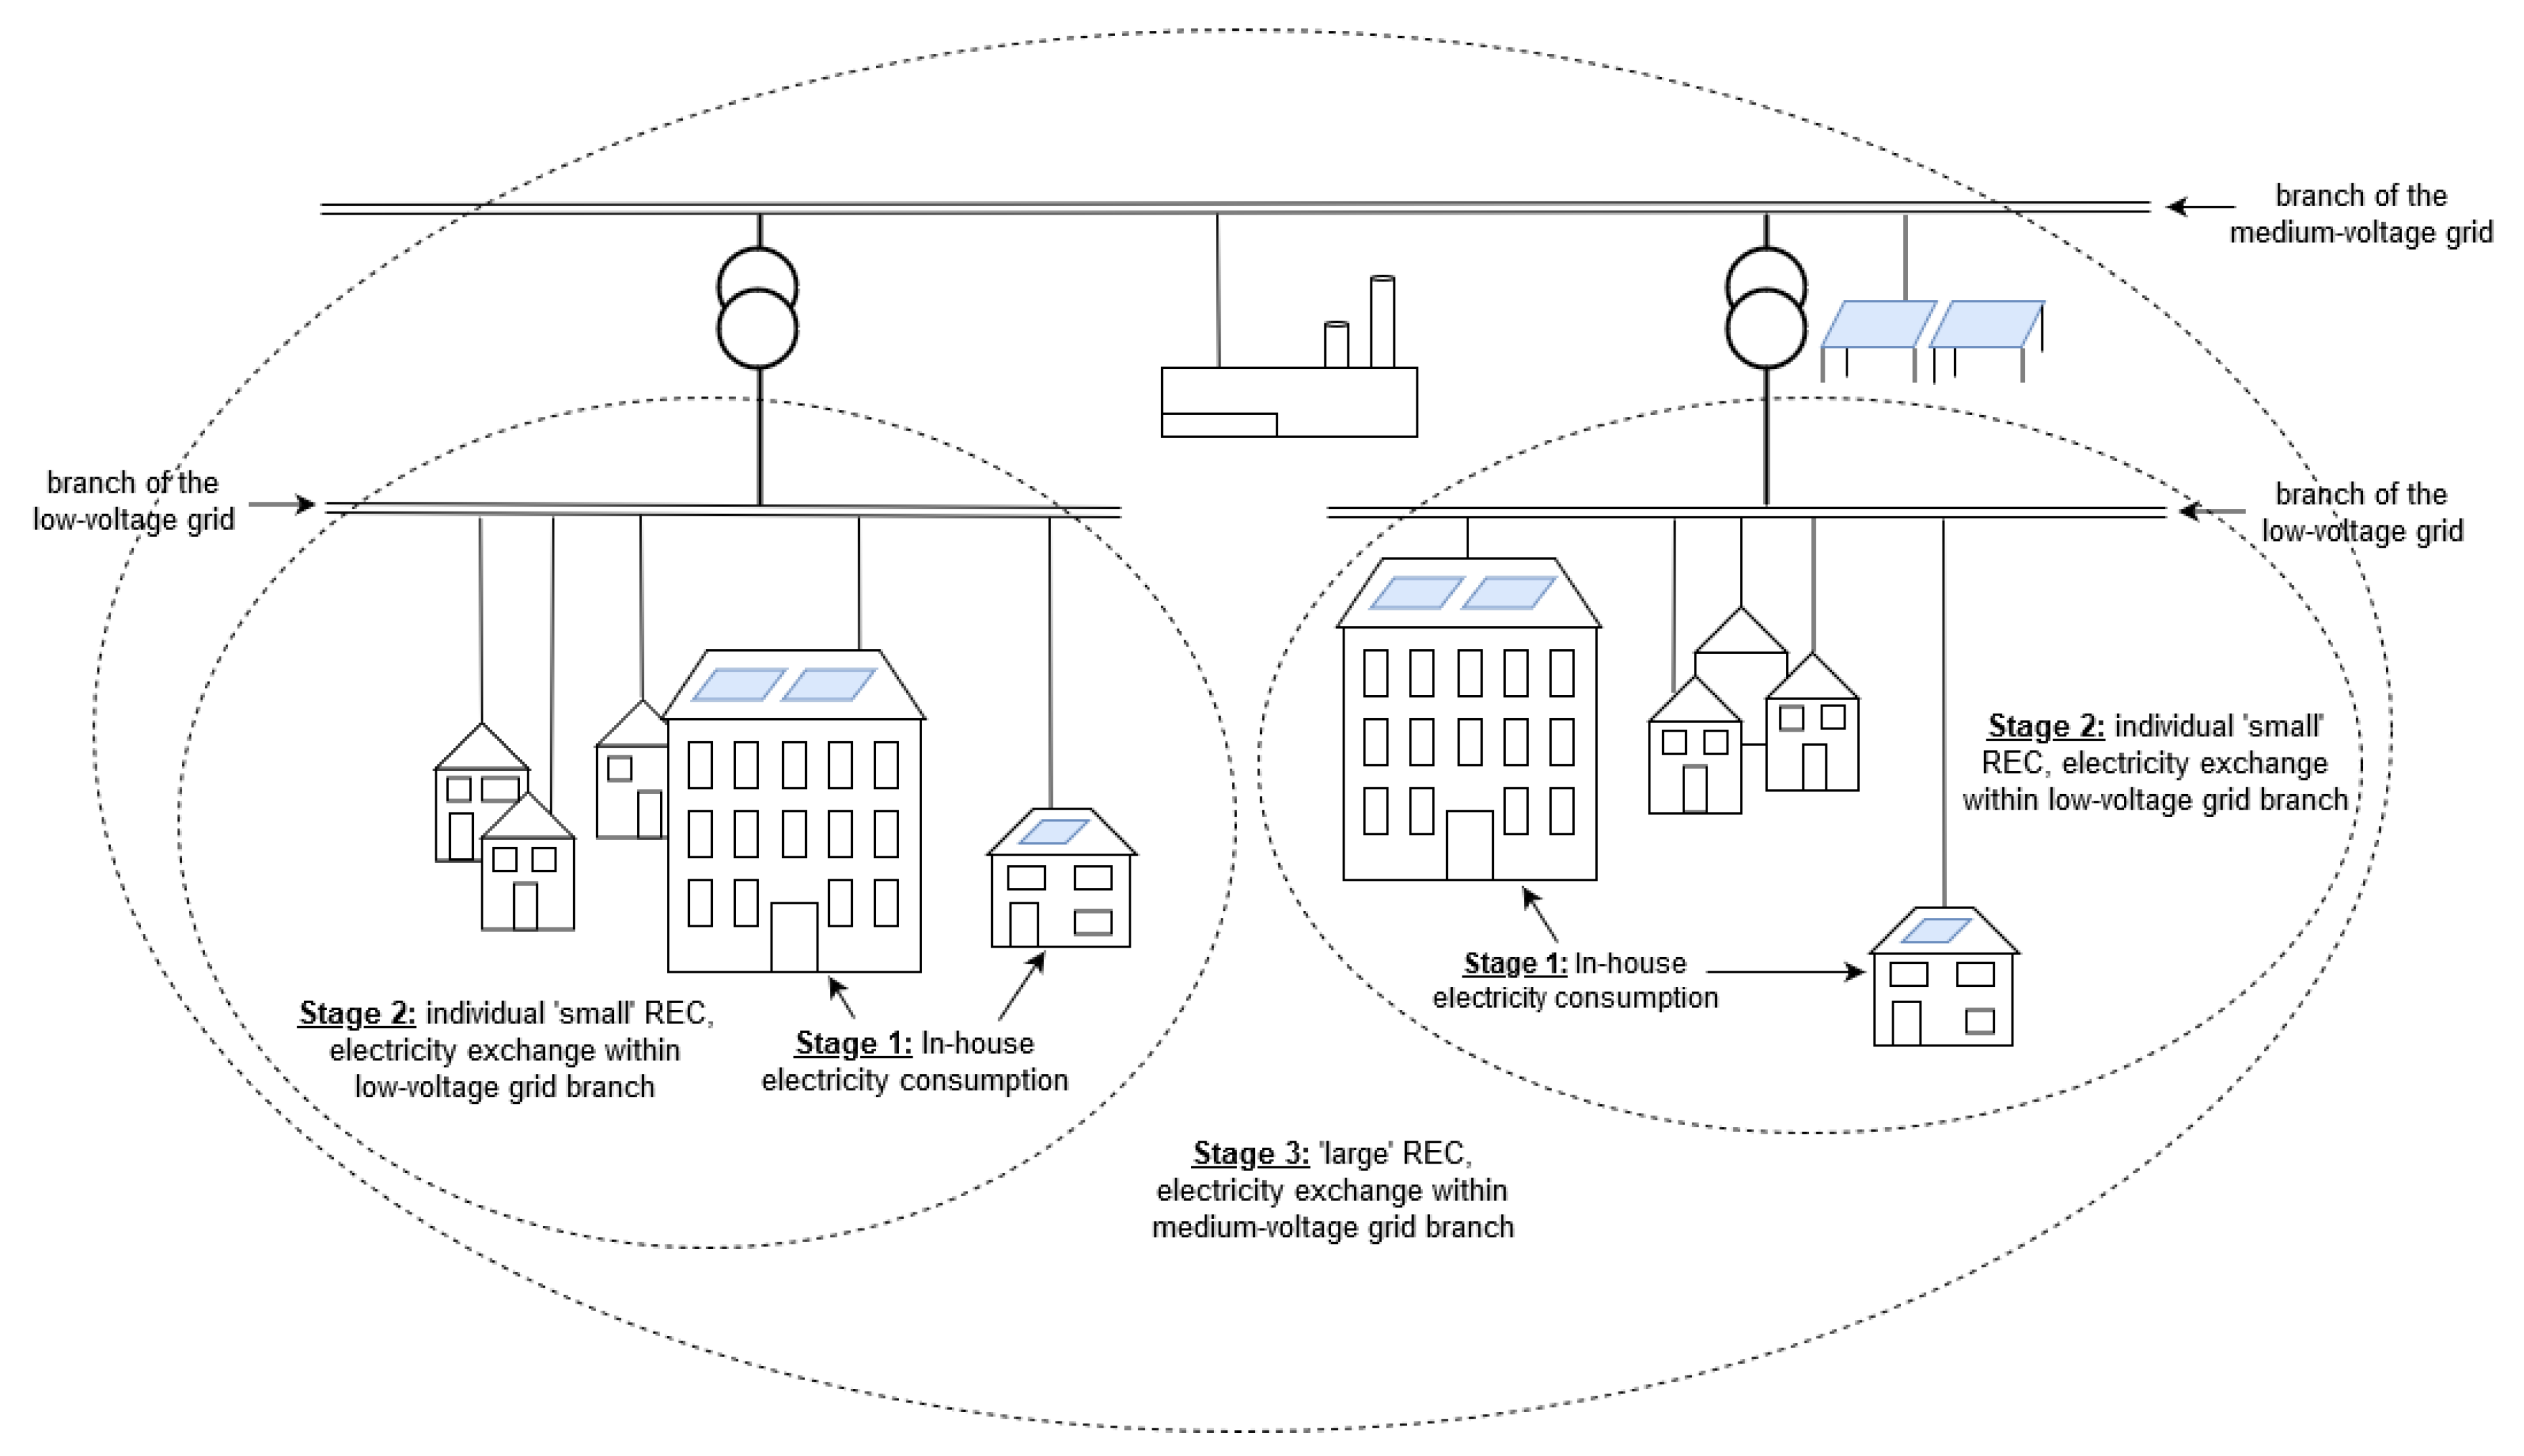
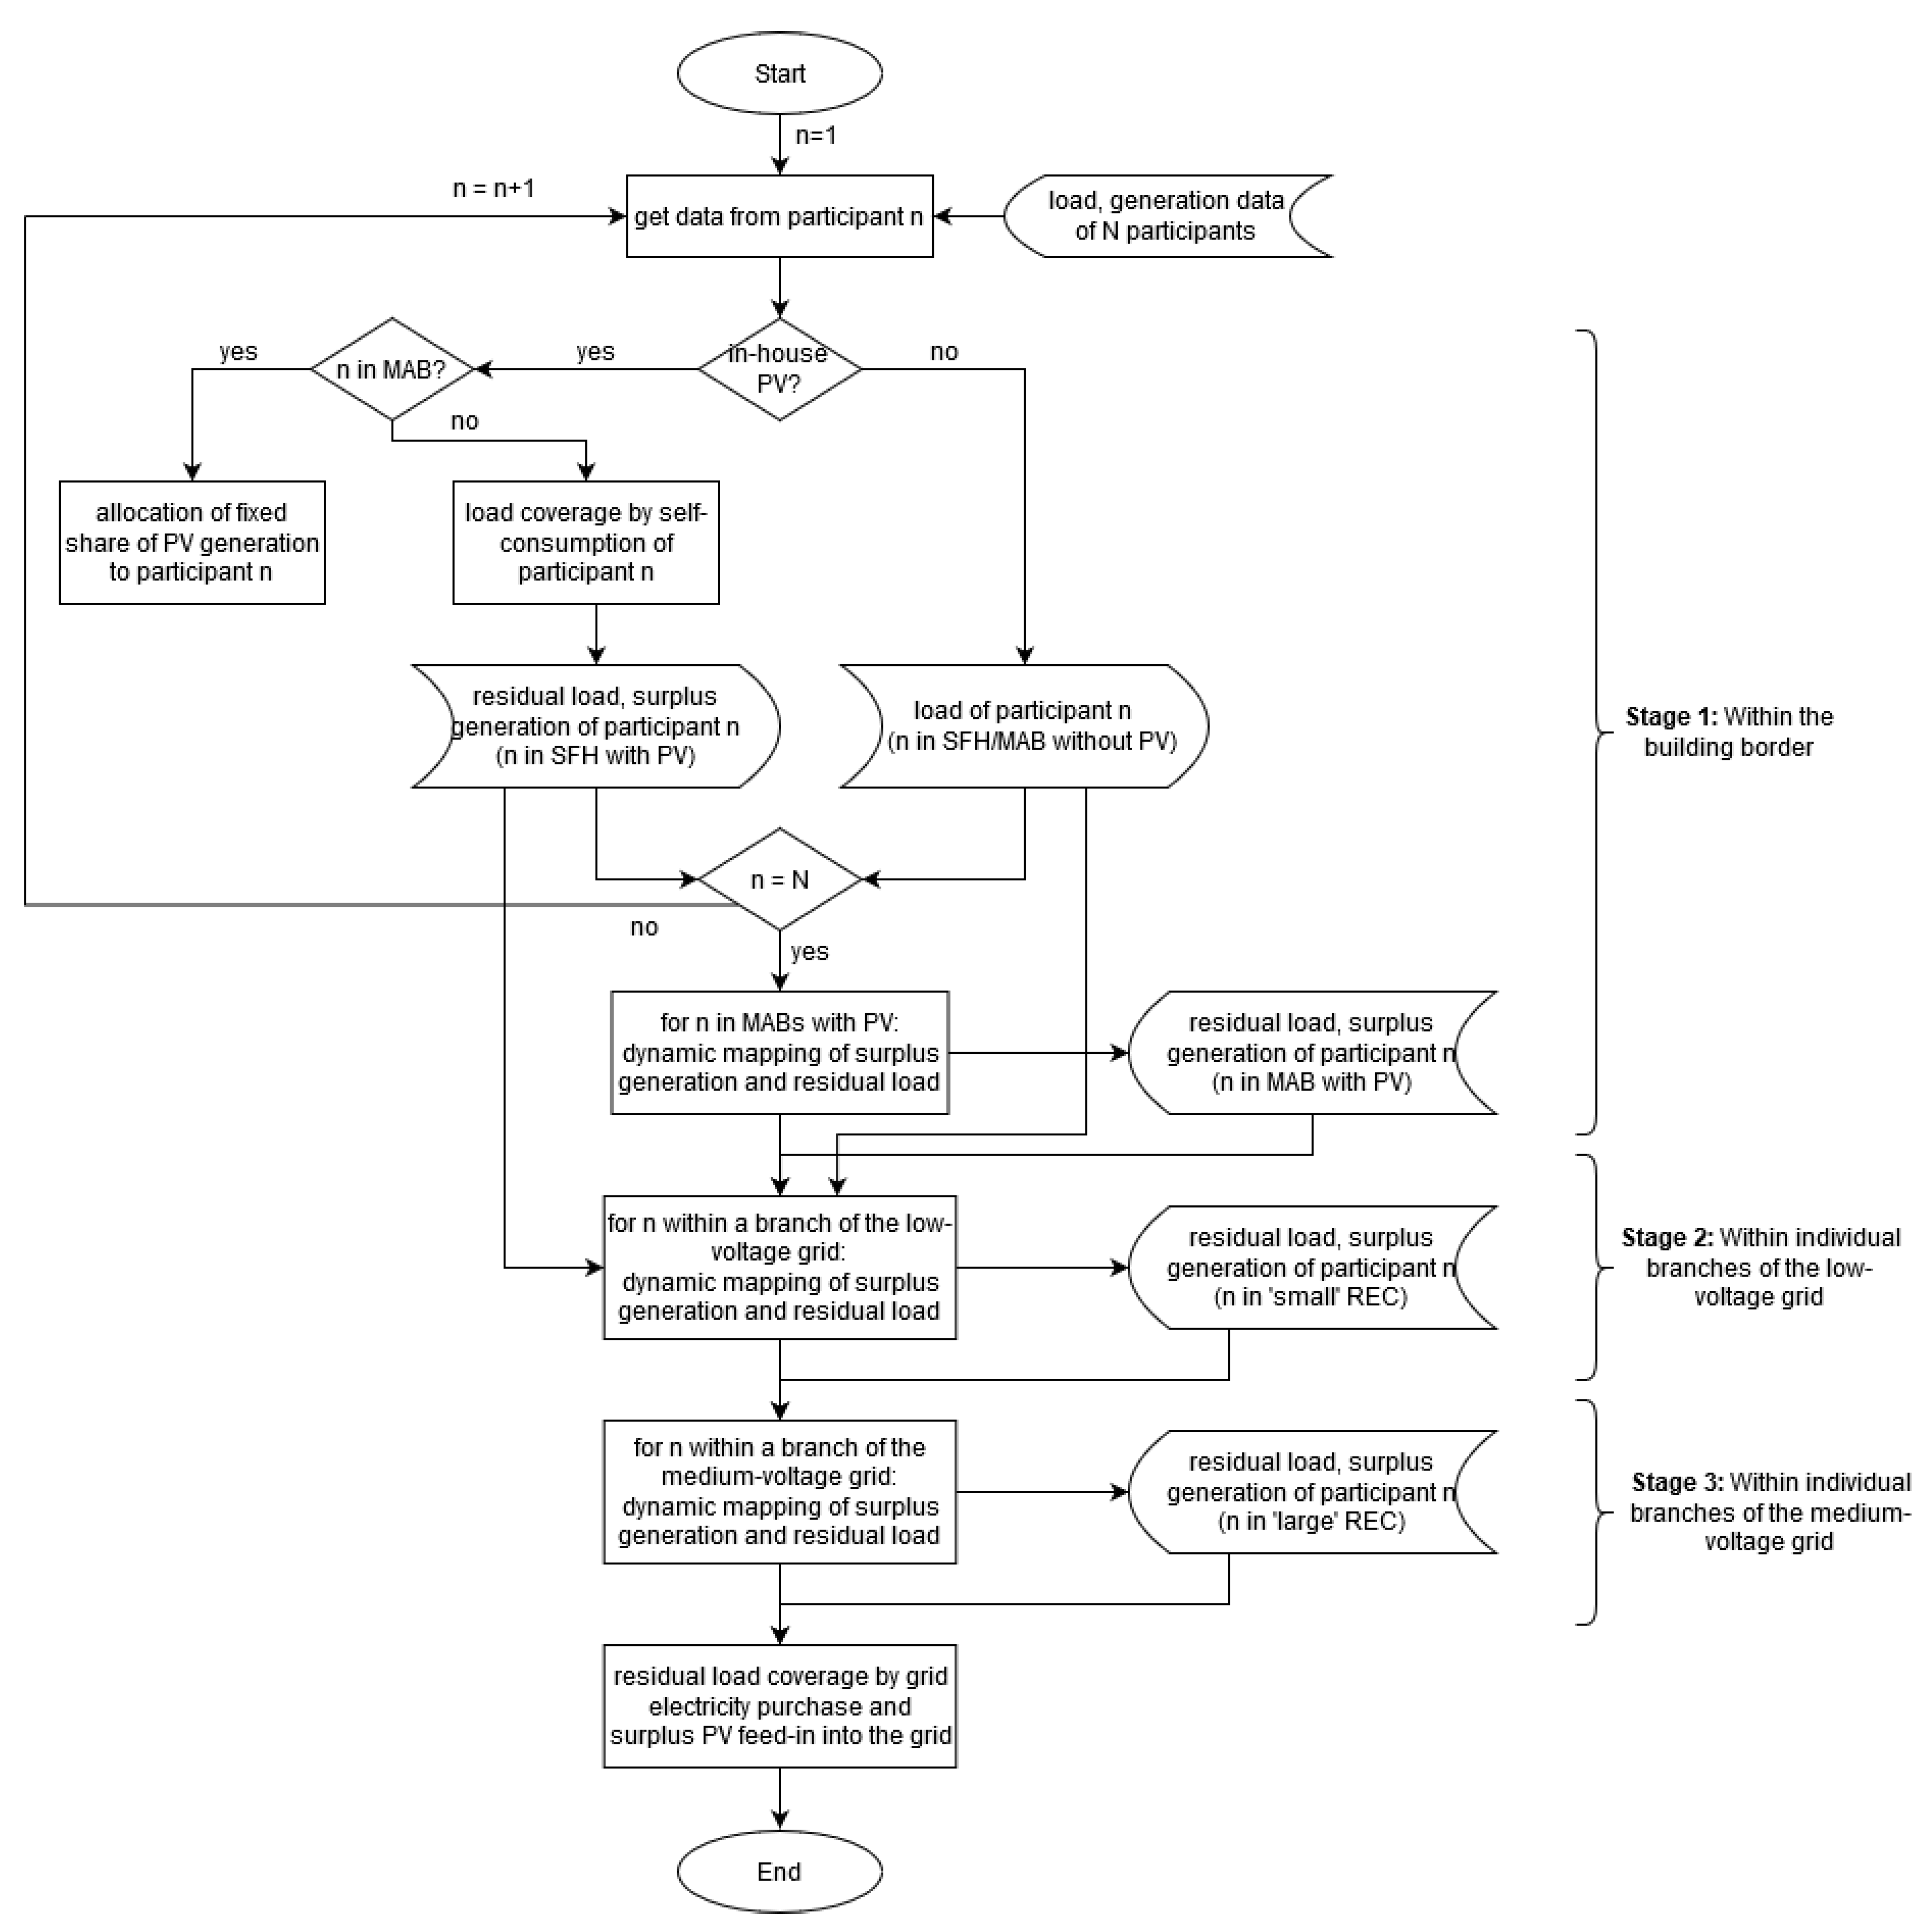
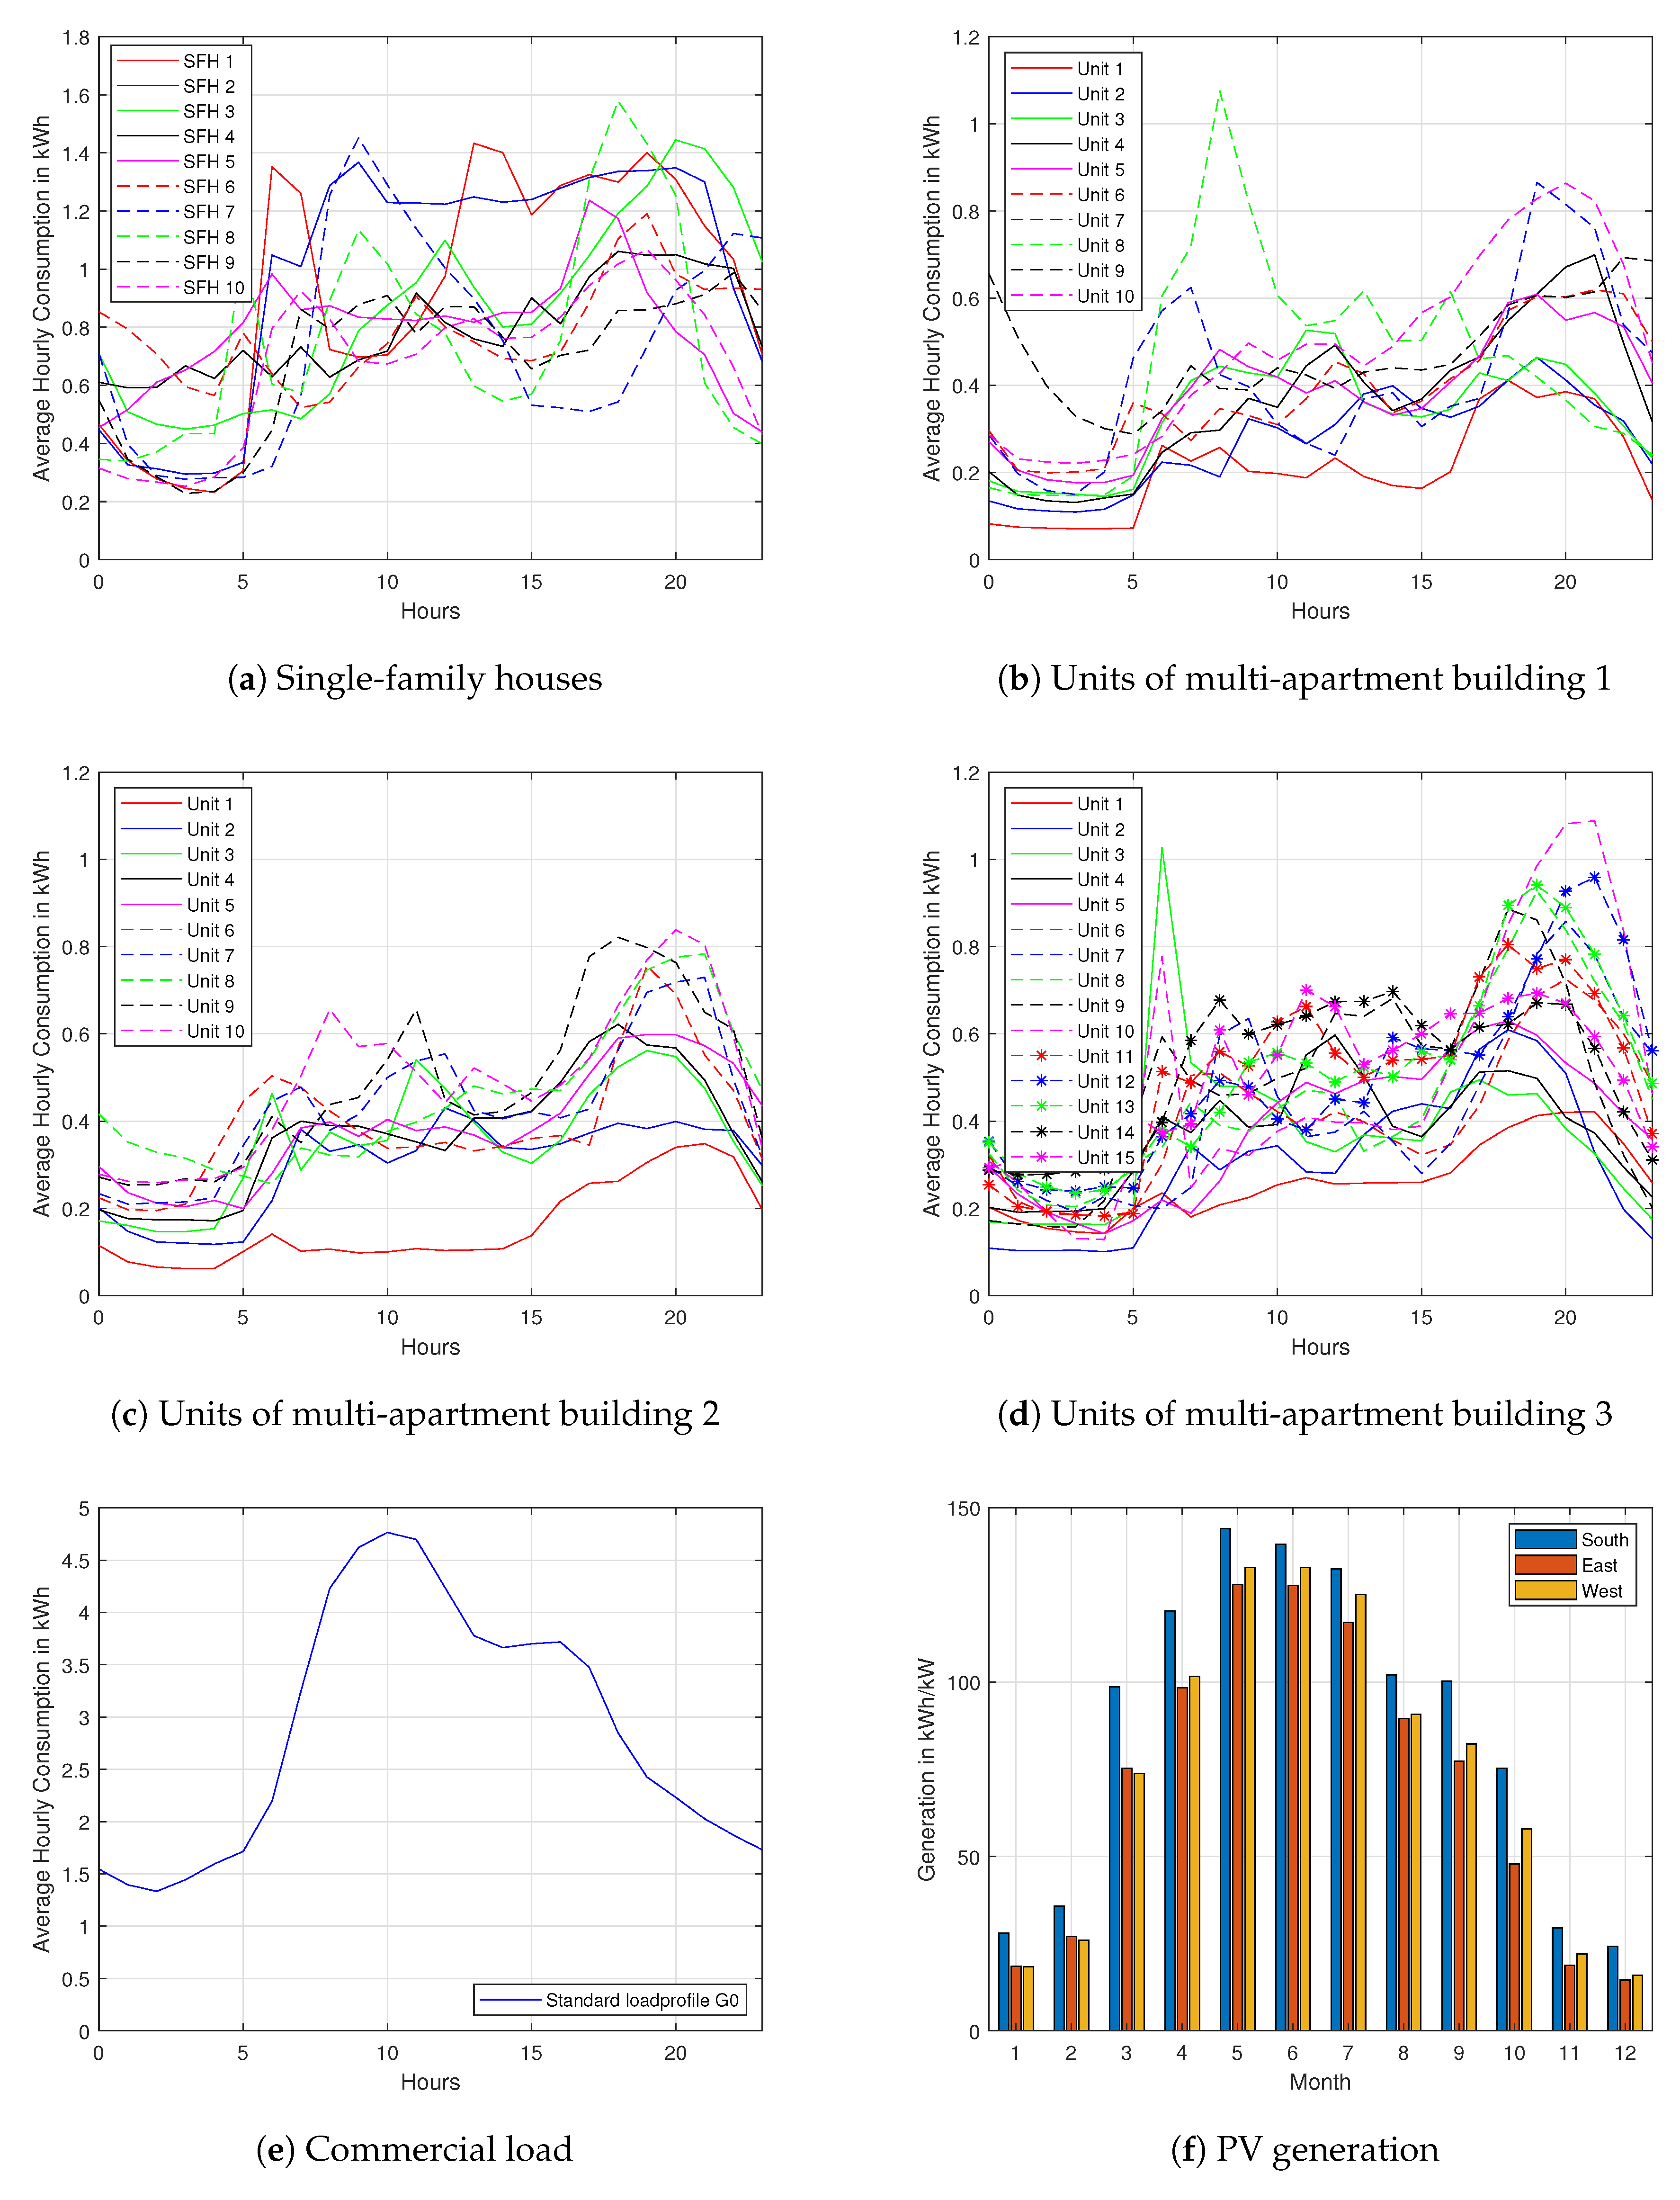
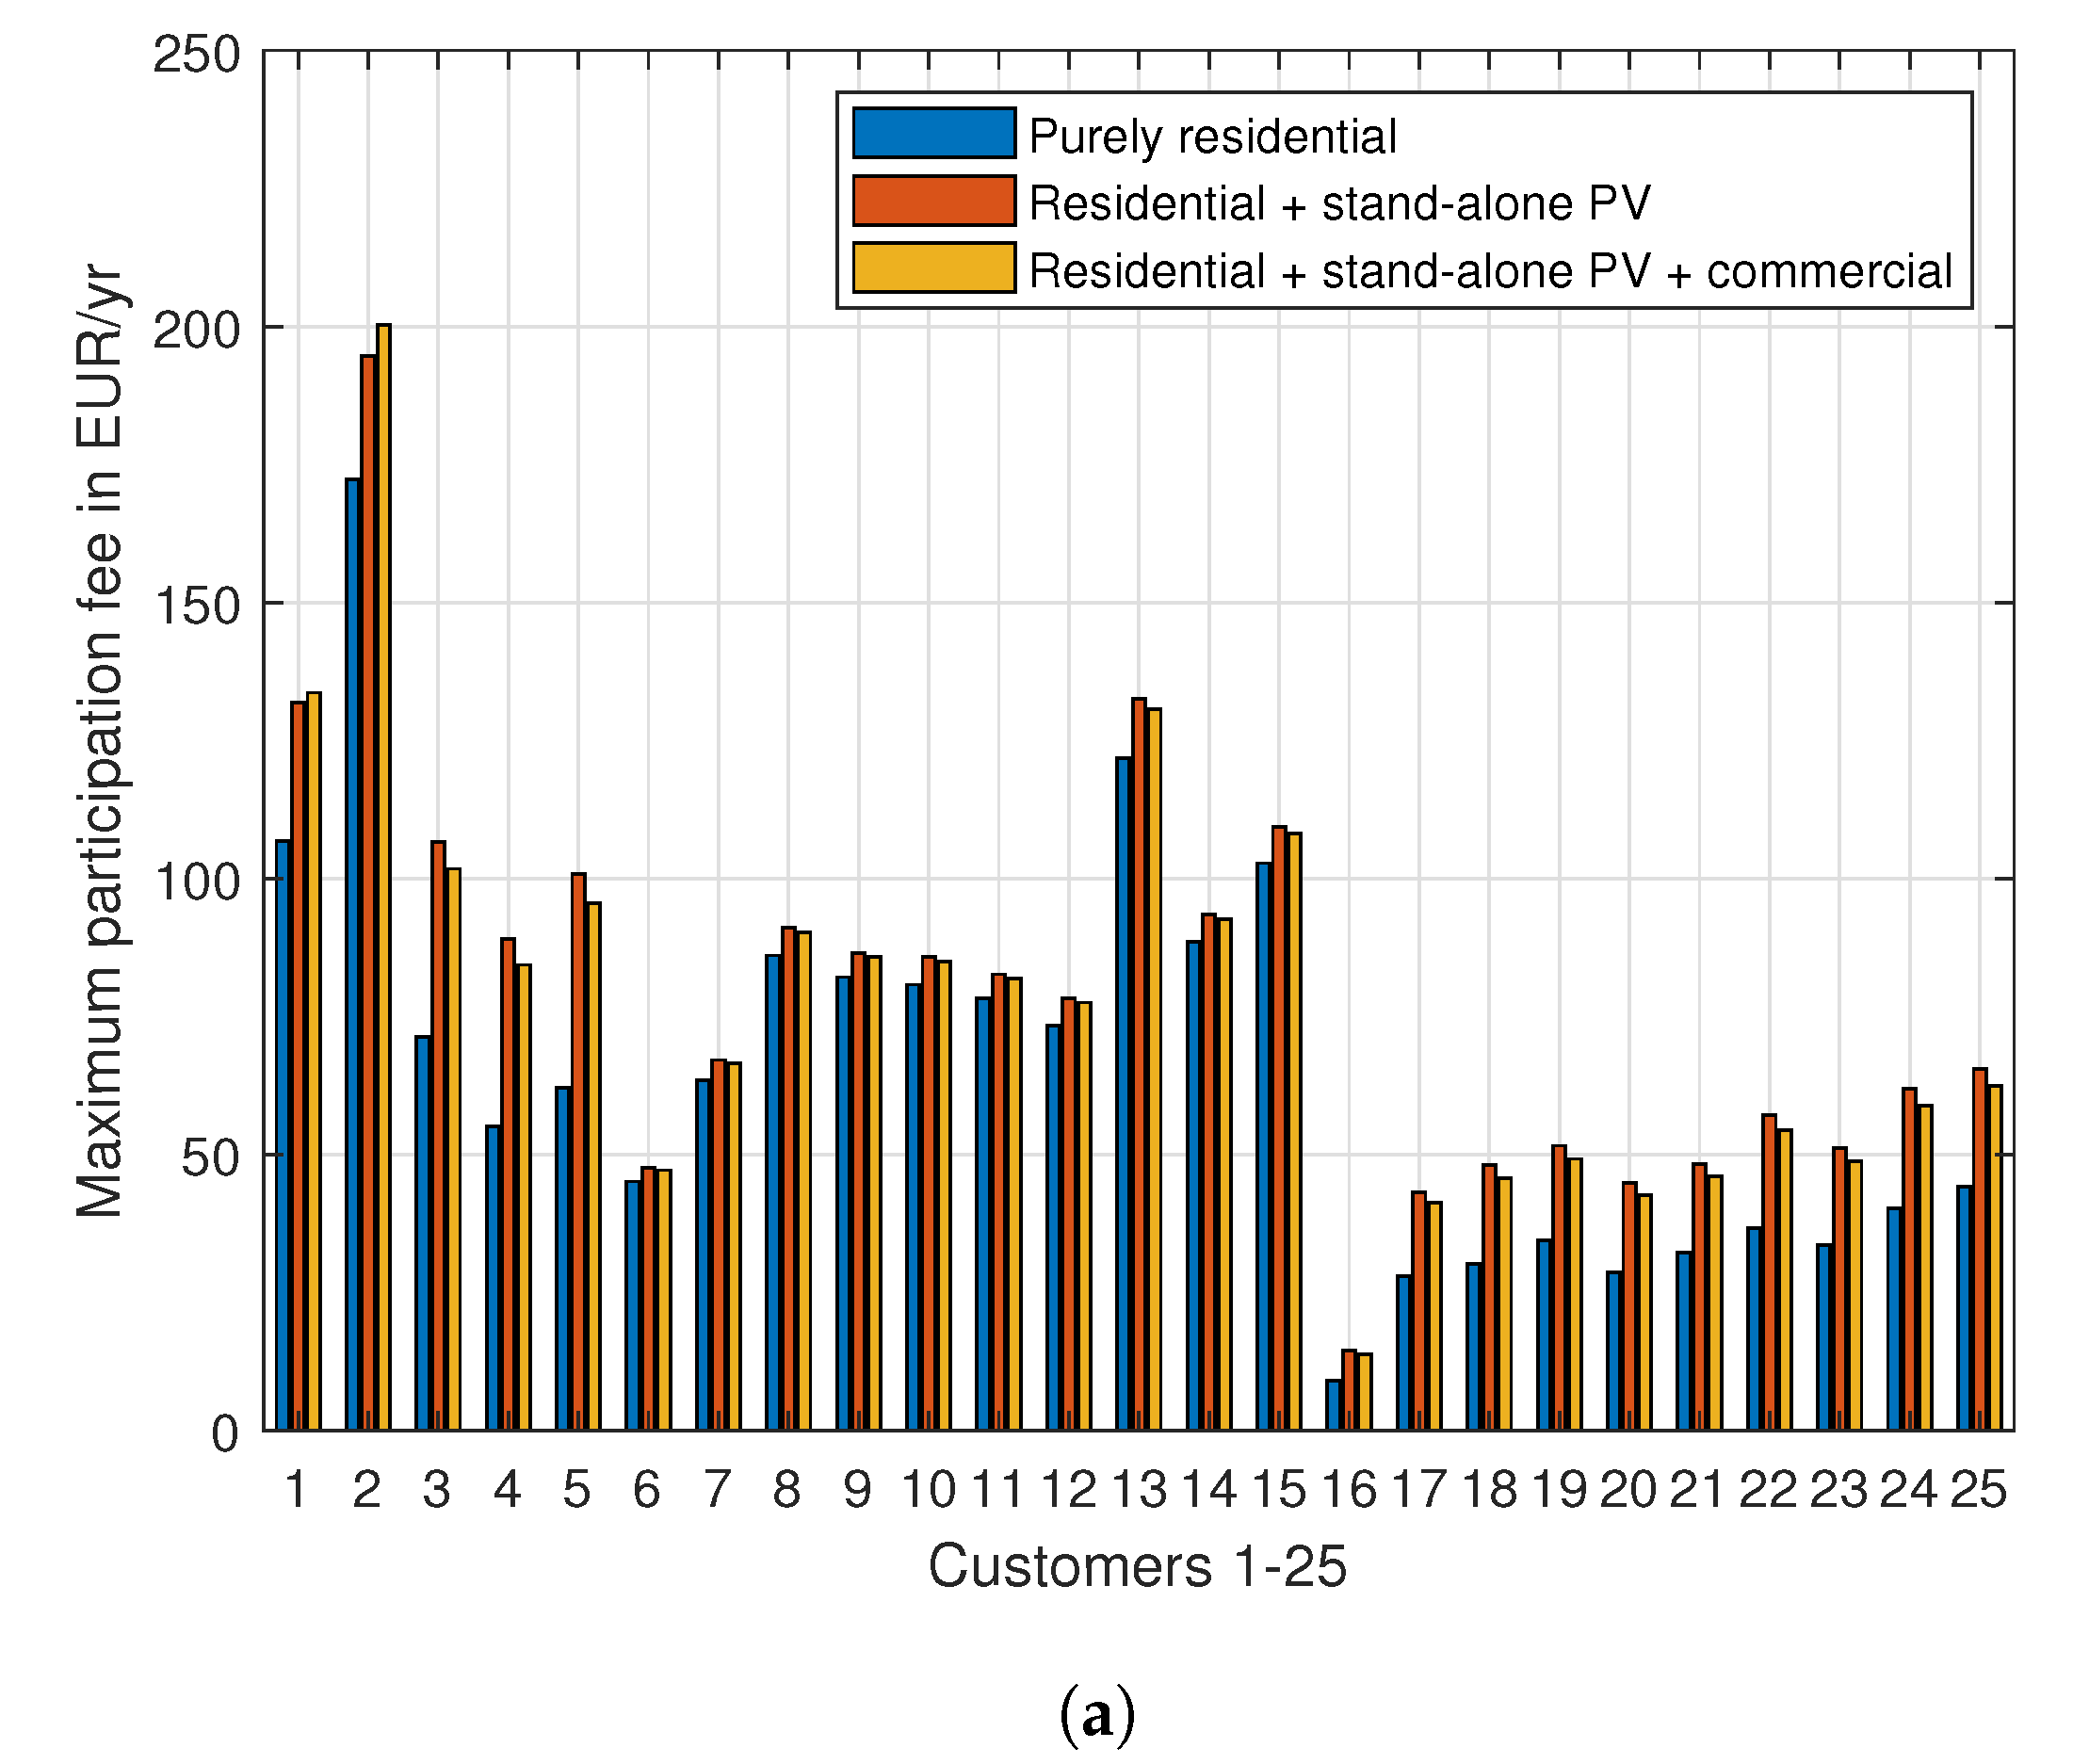
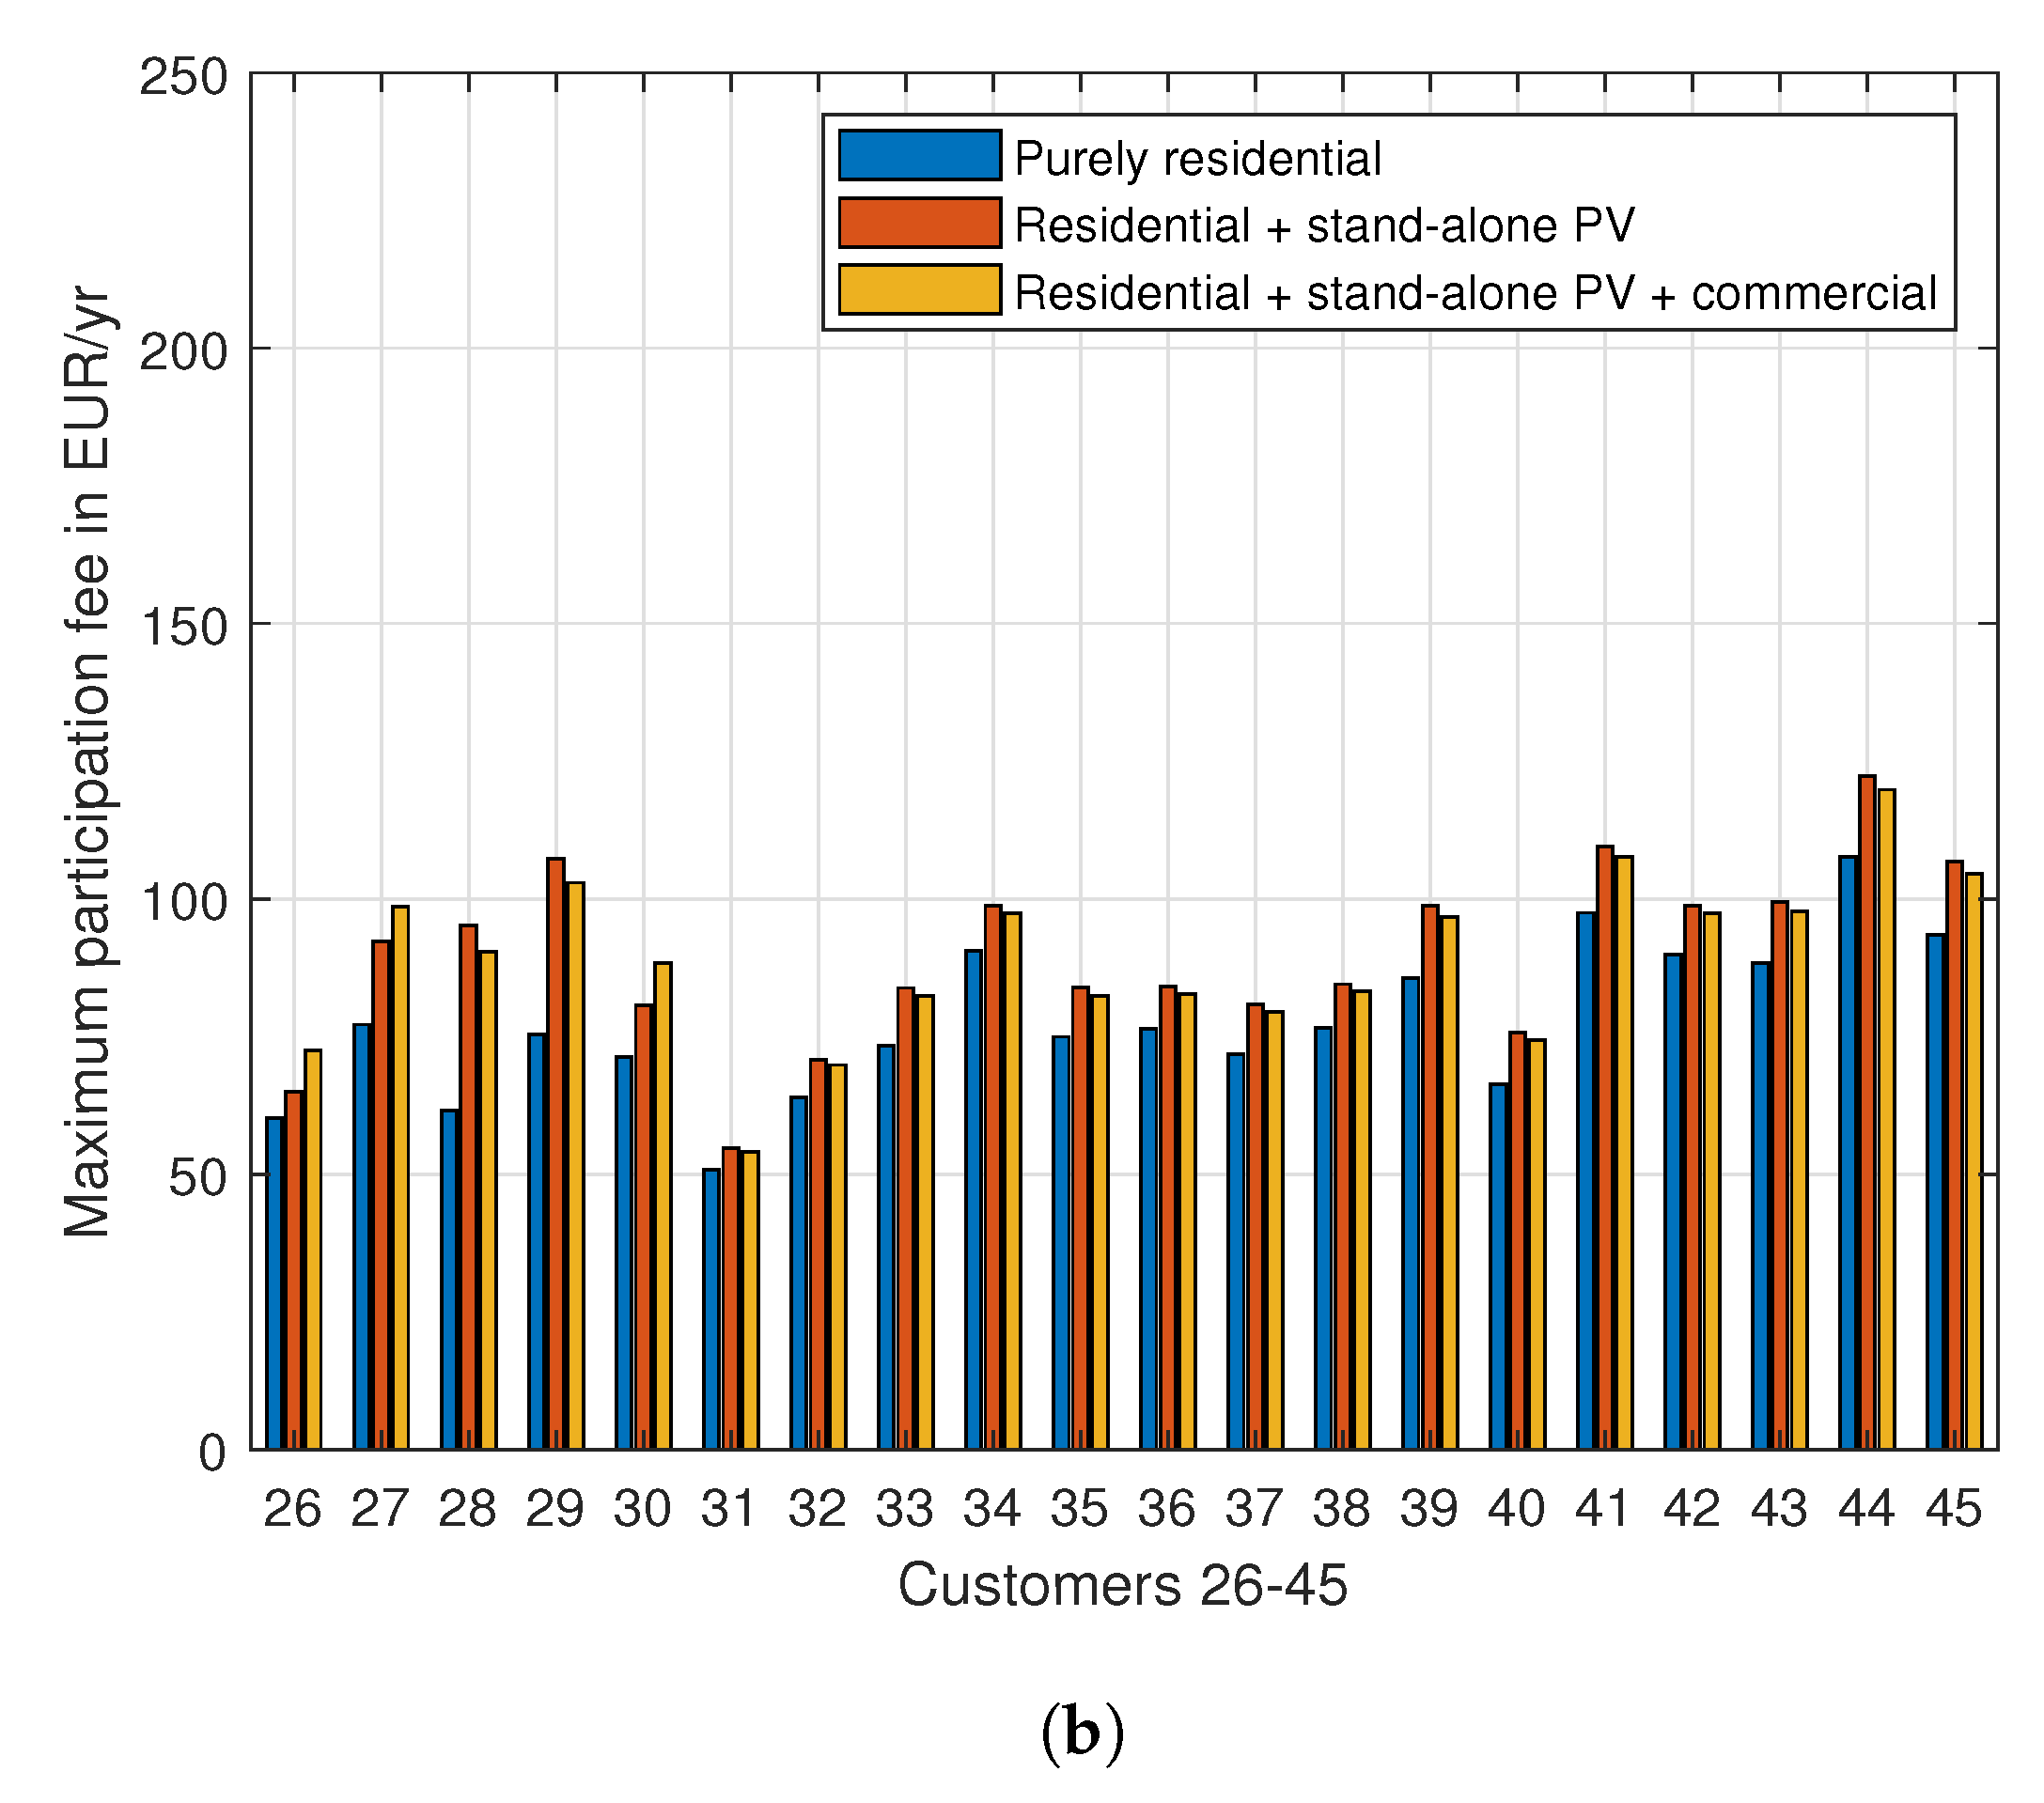
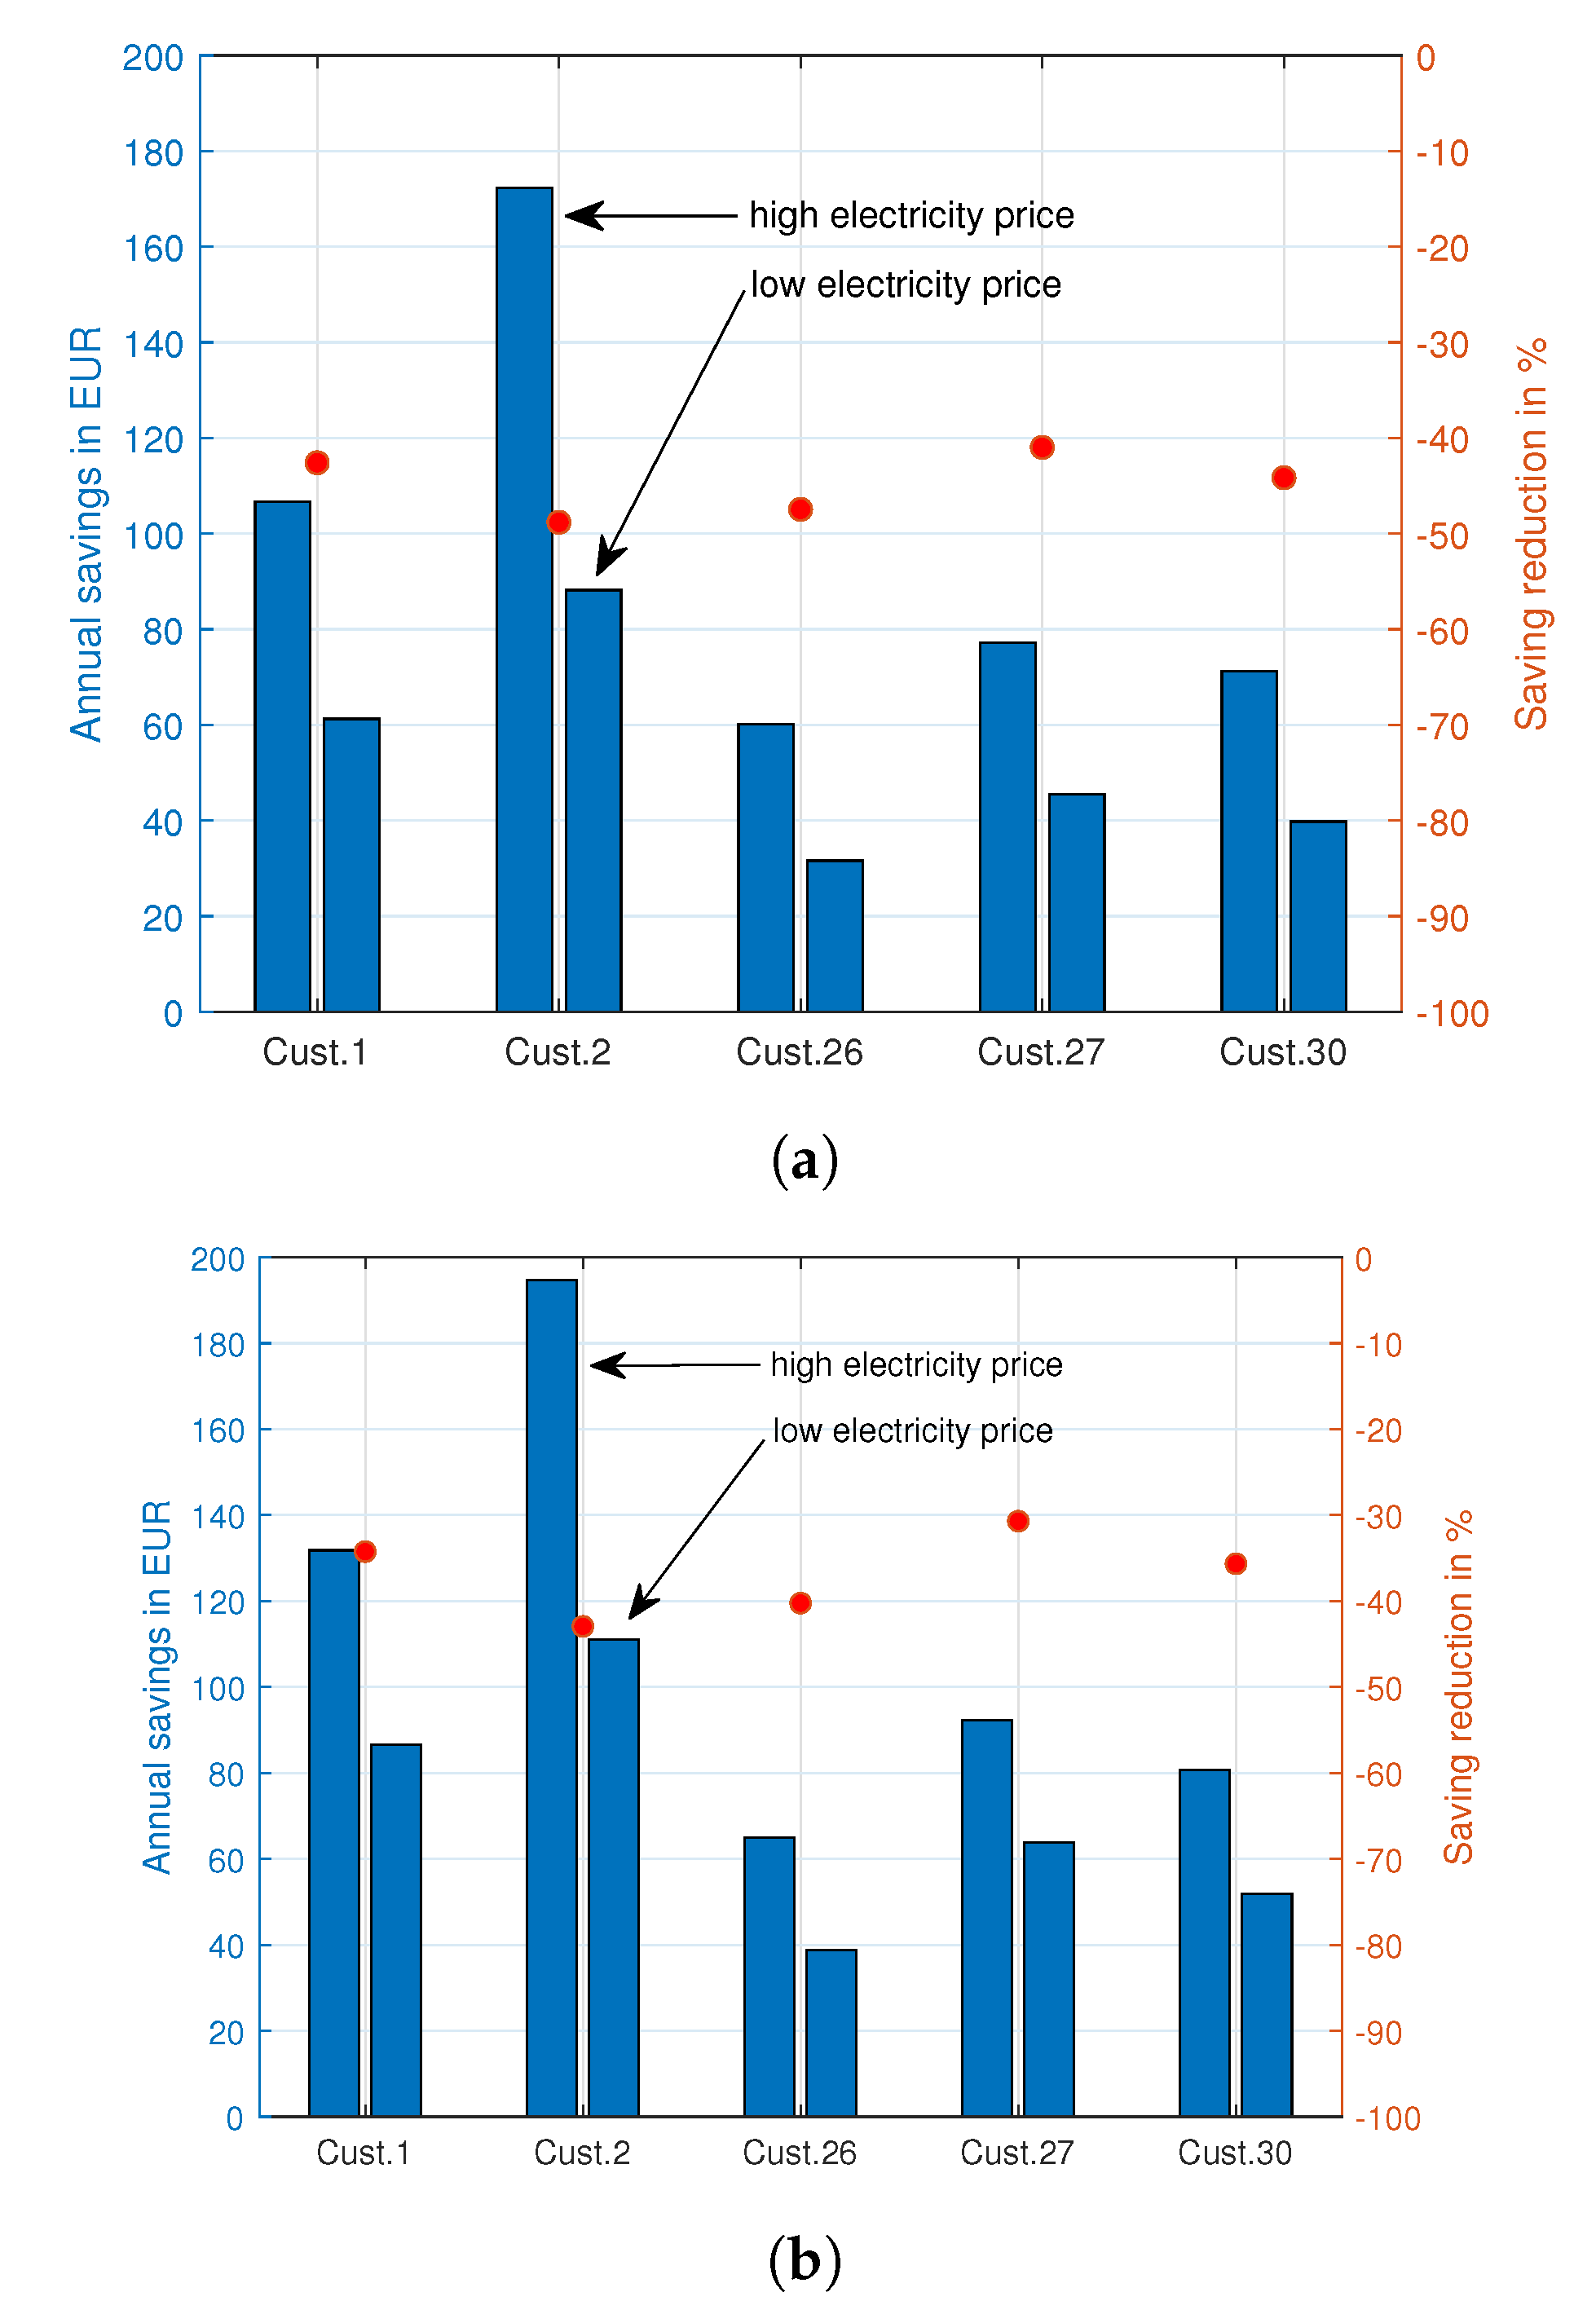
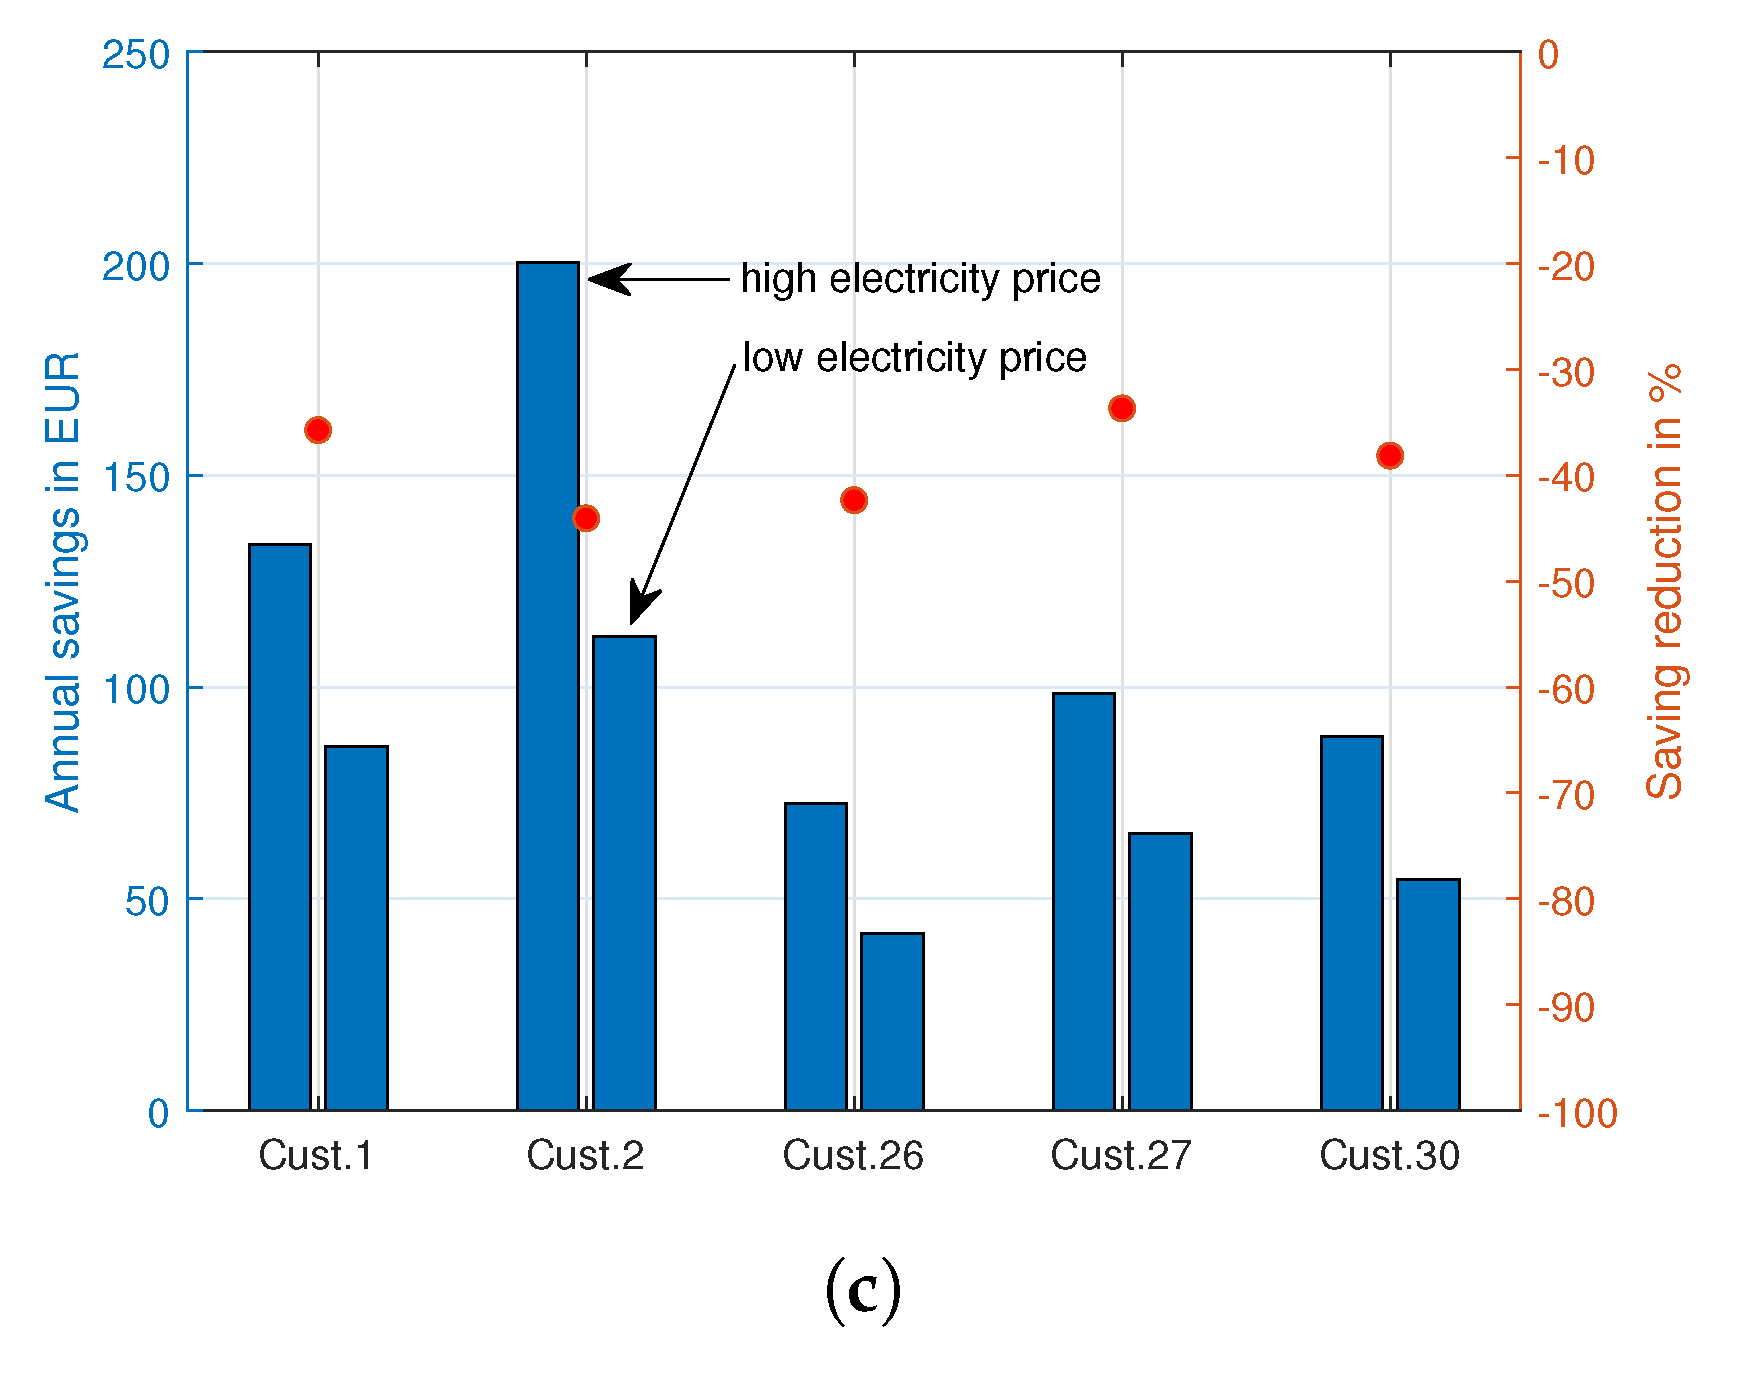
Table 1.
Detailed breakdown of electricity costs per kilowatt hour (fixed charges not considered in this table) for different use cases. Energy prices include 6% user fee and 20% VAT. Grid charges include 6% user fee. Total electricity price includes 20% VAT.
Table 1.
Detailed breakdown of electricity costs per kilowatt hour (fixed charges not considered in this table) for different use cases. Energy prices include 6% user fee and 20% VAT. Grid charges include 6% user fee. Total electricity price includes 20% VAT.
| Component in c/kWh | Default | In-House | ’Small’ REC Low-Voltage Grid | ’Large’ REC Medium-Voltage Grid |
|---|---|---|---|---|
| Energy price [47] | ||||
| Grid charges [48] | 0 | |||
| Electricity levy [49] | 0 | 0 | 0 | |
| Green electricity levy [50] | 0 | 0 | 0 | |
| Biomass surcharge [45,51] | ||||
| Total |
Table 2.
Residential customers, their load and PV systems (orientations: S–south, E/W–east/west). It needs to be noted that the PV systems on the SFHs are privately-owned. In contrast, PV systems on MABs’ rooftops are externally-owned (e.g., by a contractor). However, the MAB residents are allocated fixed shares of the PV system: They can consume as much electricity as possible and pay the external PV system owner, but they do not sell PV electricity themselves, as they do not own the in-house PV system.
| ’Small’ REC 1 | ’Small’ REC 2 | ||||||
|---|---|---|---|---|---|---|---|
| ID | Building | Load kWh | PV, Orient. kW | ID | Building | Load kWh | PV, Orient. kW |
| 1 | SFH 1 | 8001 | 5, E/W | 26 | SFH 6 | 6904 | 4, S |
| 2 | SFH 2 | 8635 | 6, S | 27 | SFH 7 | 6535 | 5, E/W |
| 3 | SFH 3 | 7498 | 28 | SFH 8 | 6690 | ||
| 4 | SFH 4 | 6945 | 29 | SFH 9 | 6041 | ||
| 5 | SFH 5 | 6944 | 30 | SFH 10 | 5954 | 4, S | |
| 6 | MAB 1 | 1847 | 2, S | 31 | MAB 3 | 2296 | , E/W |
| 7 | MAB 1 | 2392 | 2, S | 32 | MAB 3 | 2663 | , E/W |
| 8 | MAB 1 | 2938 | 2, S | 33 | MAB 3 | 3196 | , E/W |
| 9 | MAB 1 | 3197 | 2, S | 34 | MAB 3 | 3260 | , E/W |
| 10 | MAB 1 | 3370 | 2, S | 35 | MAB 3 | 3403 | , E/W |
| 11 | MAB 1 | 3430 | 2, S | 36 | MAB 3 | 3616 | , E/W |
| 12 | MAB 1 | 3683 | 2, S | 37 | MAB 3 | 3787 | , E/W |
| 13 | MAB 1 | 3887 | 2, S | 38 | MAB 3 | 4044 | , E/W |
| 14 | MAB 1 | 4147 | 2, S | 39 | MAB 3 | 4227 | , E/W |
| 15 | MAB 1 | 4266 | 2, S | 40 | MAB 3 | 4324 | , E/W |
| 16 | MAB 2 | 1399 | 41 | MAB 3 | 4360 | , E/W | |
| 17 | MAB 2 | 2630 | 42 | MAB 3 | 4364 | , E/W | |
| 18 | MAB 2 | 3081 | 43 | MAB 3 | 4495 | , E/W | |
| 19 | MAB 2 | 3239 | 44 | MAB 3 | 4500 | , E/W | |
| 20 | MAB 2 | 3391 | 45 | MAB 3 | 4508 | , E/W | |
| 21 | MAB 2 | 3466 | |||||
| 22 | MAB 2 | 3775 | |||||
| 23 | MAB 2 | 3962 | |||||
| 24 | MAB 2 | 4212 | |||||
| 25 | MAB 2 | 4287 | |||||
Table 3.
Validation of the simulation model. Results provided for the case study of a purely residential REC. Customer 1: SFH with privately-owned PV; Customer 18: MAB without PV; Customer 40: MAB with externally-owned PV.
Table 3.
Validation of the simulation model. Results provided for the case study of a purely residential REC. Customer 1: SFH with privately-owned PV; Customer 18: MAB without PV; Customer 40: MAB with externally-owned PV.
| Load covered in kWh | Customer 1 | Customer 18 | Customer 40 |
| within SFH | 2120.5 | 0 | 0 |
| within MAB | 0 | 0 | 810.9 |
| within ’small RECs’ | 251.1 | 514.2 | 36.8 |
| within ’large REC’ | 38.1 | 32.1 | 0.9 |
| outside the REC | 5591.3 | 2535.1 | 3475.0 |
| sum of the above | 8001.0 | 3081.4 | 4323.7 |
| Total load | 8001.0 | 3081.4 | 4323.7 |
| Generation used in kWh | Customer 1 | Customer 18 | Customer 40 |
| within SFH | 2120.5 | 0 | 0 |
| within MAB | 0 | 0 | 896.3 |
| within ’small RECs’ | 1253.6 | 0 | 97.7 |
| within ’large REC’ | 11.4 | 0 | 19.5 |
| outside the REC | 915.2 | 0 | 420.1 |
| sum of the above | 4300.8 | 0 | 1433.6 |
| Total generation | 4300.8 | 0 | 1433.6 |
Table 4.
Validation of the simulation model. Results provided for the theoretical case study of a purely residential REC. No PV systems available; thus, no electricity transfer within the REC.
Table 4.
Validation of the simulation model. Results provided for the theoretical case study of a purely residential REC. No PV systems available; thus, no electricity transfer within the REC.
| Load covered in kWh | Customer 1 | Customer 18 | Customer 40 |
| within SFH | 0 | 0 | 0 |
| within MAB | 0 | 0 | 0 |
| within ’small RECs’ | 0 | 0 | 0 |
| within ’large REC’ | 0 | 0 | 0 |
| outside the REC | 8001.0 | 3081.4 | 4323.7 |
| sum of the above | 8001.0 | 3081.4 | 4323.7 |
| Total load | 8001.0 | 3081.4 | 4323.7 |
| Generation used in kWh | Customer 1 | Customer 18 | Customer 40 |
| within SFH | 0 | 0 | 0 |
| within MAB | 0 | 0 | 0 |
| within ’small RECs’ | 0 | 0 | 0 |
| within ’large REC’ | 0 | 0 | 0 |
| outside the REC | 0 | 0 | 0 |
| sum of the above | 0 | 0 | 0 |
| Total generation | 0 | 0 | 0 |
| ID | Each customer is assigned an ID used for explicit identification. |
| Default EB | Default electricity bill (EB): Annual costs for conventional grid electricity. For SFH owners with a private PV system, the electricity bill is reduced by small revenues generated by feeding surplus PV electricity into the grid. |
| EB with REC | Annual costs for electricity with a REC established, consisting of costs for electricity within the individual levels of the REC and costs for conventional grid electricity to cover the residual load. For SFH owners with private PV systems, the costs are adjusted for revenues due to selling electricity within the community and then feeding the surplus into the grid. |
| LC within REC | Load coverage (LC) within REC: Calculation of the exact share of the loads of customers which are covered by renewable electricity bought within the borders of the REC. |
| Savings-buy | Savings achieved by buying community electricity. Hereby, the price differences of conventional grid electricity and electricity traded within the different levels of the REC are decisive. |
| Revenues-sell | Revenues gained by selling PV electricity within the community, instead of feeding the surplus (after self-supply) into the public grid for a small remuneration. Hereby, the difference between the PV electricity costs within the REC and the feed-in-tariff is decisive. |
| Savings-total | Calculated as the difference between default EB and EB with REC. |
Table 6.
Purely residential REC: Results for customers 1–25. Detailed explanation of the individual columns given in Table 5. Note, that revenues due to selling electricity within the community are zero for MAB residents 6–15 despite the availability of an in-house PV system, because the PV system is externally-owned.
| ID | Default EB | EB with REC | LC in REC | Savings-Buy | Revenues-Sell | Savings-Total |
|---|---|---|---|---|---|---|
| EUR/yr | EUR/yr | % | EUR/yr | EUR/yr | EUR/yr | |
| 1 | 1005.43 | 898.72 | 3.61 | 15.75 | 90.96 | 106.71 |
| 2 | 1056.62 | 884.32 | 0.81 | 3.86 | 168.44 | 172.30 |
| 3 | 1365.31 | 1293.99 | 17.21 | 71.31 | 0.00 | 71.31 |
| 4 | 1264.64 | 1209.54 | 14.35 | 55.11 | 0.00 | 55.11 |
| 5 | 1264.54 | 1202.45 | 16.20 | 62.09 | 0.00 | 62.09 |
| 6 | 336.34 | 291.27 | 30.87 | 45.07 | 0.00 | 45.07 |
| 7 | 435.55 | 372.16 | 33.54 | 63.39 | 0.00 | 63.39 |
| 8 | 535.00 | 448.97 | 37.05 | 86.02 | 0.00 | 86.02 |
| 9 | 582.12 | 500.02 | 32.49 | 82.10 | 0.00 | 82.10 |
| 10 | 613.63 | 532.89 | 30.34 | 80.73 | 0.00 | 80.73 |
| 11 | 624.55 | 546.30 | 28.86 | 78.25 | 0.00 | 78.25 |
| 12 | 670.69 | 597.35 | 25.20 | 73.34 | 0.00 | 73.34 |
| 13 | 707.86 | 586.13 | 39.71 | 121.73 | 0.00 | 121.73 |
| 14 | 755.19 | 666.67 | 27.00 | 88.53 | 0.00 | 88.53 |
| 15 | 776.93 | 674.17 | 30.48 | 102.76 | 0.00 | 102.76 |
| 16 | 254.68 | 245.66 | 11.70 | 9.02 | 0.00 | 9.02 |
| 17 | 478.90 | 450.95 | 19.28 | 27.95 | 0.00 | 27.95 |
| 18 | 561.13 | 531.00 | 17.73 | 30.13 | 0.00 | 30.13 |
| 19 | 589.77 | 555.31 | 19.26 | 34.46 | 0.00 | 34.46 |
| 20 | 617.49 | 588.90 | 15.27 | 28.59 | 0.00 | 28.59 |
| 21 | 631.22 | 598.99 | 16.83 | 32.23 | 0.00 | 32.23 |
| 22 | 687.34 | 650.75 | 17.56 | 36.59 | 0.00 | 36.59 |
| 23 | 721.54 | 688.04 | 15.31 | 33.51 | 0.00 | 33.51 |
| 24 | 766.97 | 726.73 | 17.30 | 40.24 | 0.00 | 40.24 |
| 25 | 780.72 | 736.54 | 18.65 | 44.18 | 0.00 | 44.18 |
Table 7.
Purely residential REC: Results for customers 26–45. Detailed explanation of the individual columns given in Table 5. Note, that revenues due to selling electricity within the community are zero for MAB residents 31–45 despite the availability of an in-house PV system, because the PV system is externally-owned.
| ID | Default EB | EB with REC | LC in REC | Savings-Buy | Revenues-Sell | Savings-Total |
|---|---|---|---|---|---|---|
| EUR/yr | EUR/yr | % | EUR/yr | EUR/yr | EUR/yr | |
| 26 | 839.81 | 779.69 | 0.78 | 2.98 | 57.13 | 60.12 |
| 27 | 754.51 | 677.36 | 3.84 | 13.88 | 63.27 | 77.16 |
| 28 | 1218.19 | 1156.63 | 16.59 | 61.56 | 0.00 | 61.56 |
| 29 | 1100.11 | 1024.72 | 22.47 | 75.39 | 0.00 | 75.39 |
| 30 | 694.05 | 622.84 | 2.51 | 8.27 | 62.95 | 71.21 |
| 31 | 418.14 | 367.37 | 28.08 | 50.77 | 0.00 | 50.77 |
| 32 | 485.00 | 421.08 | 30.63 | 63.92 | 0.00 | 63.92 |
| 33 | 582.07 | 508.70 | 29.44 | 73.37 | 0.00 | 73.37 |
| 34 | 593.60 | 503.08 | 35.35 | 90.51 | 0.00 | 90.51 |
| 35 | 619.61 | 544.68 | 28.12 | 74.94 | 0.00 | 74.94 |
| 36 | 658.42 | 582.09 | 26.89 | 76.33 | 0.00 | 76.33 |
| 37 | 689.57 | 617.87 | 24.23 | 71.70 | 0.00 | 71.70 |
| 38 | 736.43 | 659.92 | 24.11 | 76.51 | 0.00 | 76.51 |
| 39 | 769.75 | 684.21 | 25.94 | 85.54 | 0.00 | 85.54 |
| 40 | 787.34 | 721.03 | 19.63 | 66.32 | 0.00 | 66.32 |
| 41 | 794.01 | 696.55 | 28.55 | 97.46 | 0.00 | 97.46 |
| 42 | 794.63 | 704.70 | 26.25 | 89.93 | 0.00 | 89.93 |
| 43 | 818.47 | 730.15 | 25.10 | 88.32 | 0.00 | 88.32 |
| 44 | 819.49 | 711.89 | 30.60 | 107.59 | 0.00 | 107.59 |
| 45 | 820.89 | 727.38 | 26.54 | 93.51 | 0.00 | 93.51 |
Table 8.
REC of residential customers and a stand-alone PV plant: Results for customers 1–25. Detailed explanation of the individual columns given in Table 5. Note, that revenues due to selling electricity within the community are zero for MAB residents 6–15 despite the availability of an in-house PV system, because the PV system is externally-owned.
| ID | Default EB | EB with REC | LC in REC | Savings-Buy | Revenues-Sell | Savings-Total |
|---|---|---|---|---|---|---|
| EUR/yr | EUR/yr | % | EUR/yr | EUR/yr | EUR/yr | |
| 1 | 1005.43 | 873.61 | 10.58 | 41.57 | 90.25 | 131.82 |
| 2 | 1056.62 | 861.96 | 6.69 | 27.37 | 167.29 | 194.65 |
| 3 | 1365.31 | 1258.76 | 27.35 | 106.54 | 0.00 | 106.54 |
| 4 | 1264.64 | 1175.56 | 24.92 | 89.09 | 0.00 | 89.09 |
| 5 | 1264.54 | 1163.82 | 28.22 | 100.72 | 0.00 | 100.72 |
| 6 | 336.34 | 288.85 | 33.69 | 47.49 | 0.00 | 47.49 |
| 7 | 435.55 | 368.45 | 36.88 | 67.10 | 0.00 | 67.10 |
| 8 | 535.00 | 444.00 | 40.70 | 90.99 | 0.00 | 90.99 |
| 9 | 582.12 | 495.65 | 35.44 | 86.47 | 0.00 | 86.47 |
| 10 | 613.63 | 527.84 | 33.57 | 85.79 | 0.00 | 85.79 |
| 11 | 624.55 | 541.94 | 31.61 | 82.62 | 0.00 | 82.62 |
| 12 | 670.69 | 592.36 | 28.13 | 78.33 | 0.00 | 78.33 |
| 13 | 707.86 | 575.30 | 45.73 | 132.56 | 0.00 | 132.56 |
| 14 | 755.19 | 661.76 | 29.56 | 93.44 | 0.00 | 93.44 |
| 15 | 776.93 | 667.68 | 33.77 | 109.25 | 0.00 | 109.25 |
| 16 | 254.68 | 240.19 | 20.14 | 14.48 | 0.00 | 14.48 |
| 17 | 478.90 | 435.74 | 31.77 | 43.16 | 0.00 | 43.16 |
| 18 | 561.13 | 513.06 | 30.30 | 48.07 | 0.00 | 48.07 |
| 19 | 589.77 | 538.20 | 30.67 | 51.57 | 0.00 | 51.57 |
| 20 | 617.49 | 572.65 | 25.62 | 44.84 | 0.00 | 44.84 |
| 21 | 631.22 | 582.94 | 26.83 | 48.27 | 0.00 | 48.27 |
| 22 | 687.34 | 630.24 | 29.30 | 57.10 | 0.00 | 57.10 |
| 23 | 721.54 | 670.42 | 24.92 | 51.12 | 0.00 | 51.12 |
| 24 | 766.97 | 705.14 | 28.37 | 61.83 | 0.00 | 61.83 |
| 25 | 780.72 | 715.27 | 29.37 | 65.45 | 0.00 | 65.45 |
Table 9.
REC of residential customers and a stand-alone PV plant: Results for customers 26–45. Detailed explanation of the individual columns given in Table 5. Note, that revenues due to selling electricity within the community are zero for MAB residents 31–45 despite the availability of an in-house PV system, because the PV system is externally-owned.
| ID | Default EB | EB with REC | LC in REC | Savings-Buy | Revenues-Sell | Savings-Total |
|---|---|---|---|---|---|---|
| EUR/yr | EUR/yr | % | EUR/yr | EUR/yr | EUR/yr | |
| 26 | 839.81 | 774.89 | 3.80 | 12.66 | 52.26 | 64.92 |
| 27 | 754.51 | 662.29 | 11.04 | 35.66 | 56.56 | 92.22 |
| 28 | 1218.19 | 1123.08 | 27.42 | 95.11 | 0.00 | 95.11 |
| 29 | 1100.11 | 992.85 | 33.86 | 107.26 | 0.00 | 107.26 |
| 30 | 694.05 | 613.34 | 7.92 | 23.16 | 57.55 | 80.71 |
| 31 | 418.14 | 363.43 | 31.79 | 54.71 | 0.00 | 54.71 |
| 32 | 485.00 | 414.18 | 36.23 | 70.82 | 0.00 | 70.82 |
| 33 | 582.07 | 498.26 | 36.49 | 83.80 | 0.00 | 83.80 |
| 34 | 593.60 | 494.81 | 40.83 | 98.79 | 0.00 | 98.79 |
| 35 | 619.61 | 535.70 | 33.81 | 83.91 | 0.00 | 83.91 |
| 36 | 658.42 | 574.39 | 31.49 | 84.03 | 0.00 | 84.03 |
| 37 | 689.57 | 608.78 | 29.41 | 80.79 | 0.00 | 80.79 |
| 38 | 736.43 | 651.94 | 28.37 | 84.49 | 0.00 | 84.49 |
| 39 | 769.75 | 671.01 | 32.69 | 98.74 | 0.00 | 98.74 |
| 40 | 787.34 | 711.59 | 24.34 | 75.75 | 0.00 | 75.75 |
| 41 | 794.01 | 684.56 | 34.50 | 109.46 | 0.00 | 109.46 |
| 42 | 794.63 | 695.85 | 30.63 | 98.78 | 0.00 | 98.78 |
| 43 | 818.47 | 719.08 | 30.42 | 99.38 | 0.00 | 99.38 |
| 44 | 819.49 | 697.22 | 37.64 | 122.27 | 0.00 | 122.27 |
| 45 | 820.89 | 714.19 | 32.86 | 106.70 | 0.00 | 106.70 |
| 46 | stand-alone PV plant | |||||
Table 10.
REC of residential customers, a stand-alone PV plant and a commercial customer: Results for customers 1–25. Detailed explanation of the individual columns given in Table 5. Note, that revenues due to selling electricity within the community are zero for MAB residents 6–15 despite the availability of an in-house PV system, because the PV system is externally-owned.
| ID | Default EB | EB with REC | LC in REC | Savings-Buy | Revenues-Sell | Savings-Total |
|---|---|---|---|---|---|---|
| EUR/yr | EUR/yr | % | EUR/yr | EUR/yr | EUR/yr | |
| 1 | 1005.43 | 871.79 | 9.67 | 38.17 | 95.47 | 133.64 |
| 2 | 1056.62 | 856.31 | 5.76 | 23.64 | 176.66 | 200.30 |
| 3 | 1365.31 | 1263.59 | 25.96 | 101.72 | 0.00 | 101.72 |
| 4 | 1264.64 | 1180.31 | 23.44 | 84.33 | 0.00 | 84.33 |
| 5 | 1264.54 | 1169.07 | 26.59 | 95.47 | 0.00 | 95.47 |
| 6 | 336.34 | 289.22 | 33.27 | 47.13 | 0.00 | 47.13 |
| 7 | 435.55 | 369.06 | 36.33 | 66.48 | 0.00 | 66.48 |
| 8 | 535.00 | 444.85 | 40.08 | 90.15 | 0.00 | 90.15 |
| 9 | 582.12 | 496.36 | 34.96 | 85.76 | 0.00 | 85.76 |
| 10 | 613.63 | 528.72 | 33.01 | 84.91 | 0.00 | 84.91 |
| 11 | 624.55 | 542.66 | 31.15 | 81.89 | 0.00 | 81.89 |
| 12 | 670.69 | 593.20 | 27.64 | 77.50 | 0.00 | 77.50 |
| 13 | 707.86 | 577.14 | 44.71 | 130.72 | 0.00 | 130.72 |
| 14 | 755.19 | 662.59 | 29.13 | 92.61 | 0.00 | 92.61 |
| 15 | 776.93 | 668.79 | 33.20 | 108.13 | 0.00 | 108.13 |
| 16 | 254.68 | 240.93 | 19.00 | 13.74 | 0.00 | 13.74 |
| 17 | 478.90 | 437.72 | 30.15 | 41.18 | 0.00 | 41.18 |
| 18 | 561.13 | 515.43 | 28.64 | 45.70 | 0.00 | 45.70 |
| 19 | 589.77 | 540.59 | 29.07 | 49.18 | 0.00 | 49.18 |
| 20 | 617.49 | 574.90 | 24.19 | 42.59 | 0.00 | 42.59 |
| 21 | 631.22 | 585.18 | 25.44 | 46.04 | 0.00 | 46.04 |
| 22 | 687.34 | 633.03 | 27.70 | 54.31 | 0.00 | 54.31 |
| 23 | 721.54 | 672.86 | 23.59 | 48.68 | 0.00 | 48.68 |
| 24 | 766.97 | 708.10 | 26.85 | 58.87 | 0.00 | 58.87 |
| 25 | 780.72 | 718.32 | 27.83 | 62.41 | 0.00 | 62.41 |
Table 11.
REC of residential customers, a stand-alone PV plant and a commercial customer: Results for customers 26–45; the commercial customer is assigned ID 47. Detailed explanation of the individual columns given in Table 5. Note, that revenues due to selling electricity within the community are zero for MAB residents 31–45 despite the availability of an in-house PV system, because the PV system is externally-owned.
| ID | Default EB | EB with REC | LC in REC | Savings-Buy | Revenues-Sell | Savings-Total |
|---|---|---|---|---|---|---|
| EUR/yr | EUR/yr | % | EUR/yr | EUR/yr | EUR/yr | |
| 26 | 839.81 | 767.29 | 3.30 | 11.06 | 61.46 | 72.52 |
| 27 | 754.51 | 655.96 | 9.90 | 32.21 | 66.34 | 98.55 |
| 28 | 1218.19 | 1127.76 | 25.91 | 90.44 | 0.00 | 90.44 |
| 29 | 1100.11 | 997.20 | 32.30 | 102.91 | 0.00 | 102.91 |
| 30 | 694.05 | 605.71 | 7.11 | 20.94 | 67.40 | 88.34 |
| 31 | 418.14 | 364.06 | 31.20 | 54.08 | 0.00 | 54.08 |
| 32 | 485.00 | 415.20 | 35.40 | 69.80 | 0.00 | 69.80 |
| 33 | 582.07 | 499.73 | 35.51 | 82.34 | 0.00 | 82.34 |
| 34 | 593.60 | 496.22 | 39.90 | 97.38 | 0.00 | 97.38 |
| 35 | 619.61 | 537.20 | 32.86 | 82.41 | 0.00 | 82.41 |
| 36 | 658.42 | 575.66 | 30.73 | 82.76 | 0.00 | 82.76 |
| 37 | 689.57 | 610.17 | 28.62 | 79.40 | 0.00 | 79.40 |
| 38 | 736.43 | 653.20 | 27.69 | 83.23 | 0.00 | 83.23 |
| 39 | 769.75 | 673.00 | 31.67 | 96.75 | 0.00 | 96.75 |
| 40 | 787.34 | 713.01 | 23.63 | 74.33 | 0.00 | 74.33 |
| 41 | 794.01 | 686.46 | 33.55 | 107.55 | 0.00 | 107.55 |
| 42 | 794.63 | 697.33 | 29.89 | 97.30 | 0.00 | 97.30 |
| 43 | 818.47 | 720.80 | 29.59 | 97.67 | 0.00 | 97.67 |
| 44 | 819.49 | 699.69 | 36.45 | 119.79 | 0.00 | 119.79 |
| 45 | 820.89 | 716.36 | 31.82 | 104.53 | 0.00 | 104.53 |
| 46 | stand-alone PV plant | |||||
| 47 | 4552.42 | 4102.25 | 38.89 | 450.18 | 0.00 | 450.18 |
Table 12.
Shares of load coverage by different levels of the REC. Shares are given for residential customers only (for the use case residential + stand-alone PV + commercial, the load coverage of the commercial business is not considered) to ensure comparability of results.
Table 12.
Shares of load coverage by different levels of the REC. Shares are given for residential customers only (for the use case residential + stand-alone PV + commercial, the load coverage of the commercial business is not considered) to ensure comparability of results.
Load Coverage in % | Residential | Residential & Stand-Alone PV | Residential & Stand-Alone PV & Commercial |
|---|---|---|---|
| Total including SFHs direct consumption | 24.89 | 31.98 | 31.85 |
| Total excluding SFHs direct consumption | 19.74 | 26.82 | 27.28 |
| Customers 1–25 (’small’ REC, within low-voltage grid) | 8.67 | 8.67 | 8.67 |
| Customers 1–25 (within ’large’ REC) | 9.17 | 16.98 | 15.86 |
| Customers 26–45 (’small’ REC, within low-voltage grid) | 3.83 | 3.83 | 3.83 |
| Customers 26–45 (within ’large’ REC) | 3.93 | 10.17 | 9.22 |
Table 13.
Comparison of savings for customers 1–25, with and without reduction of grid charges.
| Savings Total in EUR/yr | ||||||
|---|---|---|---|---|---|---|
| Residential | Residential & Stand-Alone PV | Residential & Stand-Alone PV & Commercial | ||||
| ID | GC Red. | No GC Red. | GC Red. | No GC Red. | GC Red. | No GC Red. |
| 1 | 106.71 | 100.24 | 131.82 | 117.44 | 133.64 | 120.30 |
| 2 | 172.30 | 170.68 | 194.65 | 185.83 | 200.30 | 192.62 |
| 3 | 71.31 | 41.41 | 106.54 | 65.84 | 101.72 | 62.49 |
| 4 | 55.11 | 32.00 | 89.09 | 55.55 | 84.33 | 52.26 |
| 5 | 62.09 | 36.12 | 100.72 | 62.90 | 95.47 | 59.26 |
| 6 | 45.07 | 45.00 | 47.49 | 46.68 | 47.13 | 46.43 |
| 7 | 63.39 | 63.27 | 67.10 | 65.84 | 66.48 | 65.42 |
| 8 | 86.02 | 85.86 | 90.99 | 89.30 | 90.15 | 88.72 |
| 9 | 82.10 | 81.95 | 86.47 | 84.98 | 85.76 | 84.49 |
| 10 | 80.73 | 80.54 | 85.79 | 84.04 | 84.91 | 83.44 |
| 11 | 78.25 | 78.12 | 82.62 | 81.15 | 81.89 | 80.65 |
| 12 | 73.34 | 73.19 | 78.33 | 76.65 | 77.50 | 76.07 |
| 13 | 121.73 | 121.28 | 132.56 | 128.79 | 130.72 | 127.52 |
| 14 | 88.53 | 88.38 | 93.44 | 91.79 | 92.61 | 91.21 |
| 15 | 102.76 | 102.54 | 109.25 | 107.04 | 108.13 | 106.27 |
| 16 | 9.02 | 5.25 | 14.48 | 9.04 | 13.74 | 8.53 |
| 17 | 27.95 | 16.28 | 43.16 | 26.82 | 41.18 | 25.45 |
| 18 | 30.13 | 17.54 | 48.07 | 29.97 | 45.70 | 28.33 |
| 19 | 34.46 | 20.02 | 51.57 | 31.88 | 49.18 | 30.23 |
| 20 | 28.59 | 16.62 | 44.84 | 27.88 | 42.59 | 26.33 |
| 21 | 32.23 | 18.72 | 48.27 | 29.85 | 46.04 | 28.30 |
| 22 | 36.59 | 21.28 | 57.10 | 35.50 | 54.31 | 33.56 |
| 23 | 33.51 | 19.48 | 51.12 | 31.69 | 48.68 | 30.00 |
| 24 | 40.24 | 23.39 | 61.83 | 38.36 | 58.87 | 36.31 |
| 25 | 44.18 | 25.67 | 65.45 | 40.42 | 62.41 | 38.31 |
Table 14.
Comparison of savings for customers 26–45, with and without reduction of grid charges.
| Savings Total in EUR/yr | ||||||
|---|---|---|---|---|---|---|
| Residential | Residential & Stand-Alone PV | Residential & Stand-Alone PV & Commercial | ||||
| ID | GC Red. | No GC Red. | GC Red. | No GC Red. | GC Red. | No GC Red. |
| 26 | 60.12 | 58.86 | 64.92 | 60.69 | 72.52 | 68.78 |
| 27 | 77.16 | 71.34 | 92.22 | 79.72 | 98.55 | 87.11 |
| 28 | 61.56 | 35.62 | 95.11 | 58.88 | 90.44 | 55.64 |
| 29 | 75.39 | 43.57 | 107.26 | 65.66 | 102.91 | 62.64 |
| 30 | 71.21 | 67.75 | 80.71 | 72.68 | 88.34 | 80.99 |
| 31 | 50.77 | 50.48 | 54.71 | 53.21 | 54.08 | 52.77 |
| 32 | 63.92 | 63.24 | 70.82 | 68.02 | 69.80 | 67.31 |
| 33 | 73.37 | 72.24 | 83.80 | 79.47 | 82.34 | 78.46 |
| 34 | 90.51 | 89.79 | 98.79 | 95.52 | 97.38 | 94.55 |
| 35 | 74.94 | 74.13 | 83.91 | 80.35 | 82.41 | 79.31 |
| 36 | 76.33 | 75.69 | 84.03 | 81.02 | 82.76 | 80.14 |
| 37 | 71.70 | 70.77 | 80.79 | 77.07 | 79.40 | 76.10 |
| 38 | 76.51 | 75.83 | 84.49 | 81.36 | 83.23 | 80.49 |
| 39 | 85.54 | 84.23 | 98.74 | 93.39 | 96.75 | 92.00 |
| 40 | 66.32 | 65.44 | 75.75 | 71.98 | 74.33 | 70.99 |
| 41 | 97.46 | 96.33 | 109.46 | 104.64 | 107.55 | 103.32 |
| 42 | 89.93 | 89.17 | 98.78 | 95.31 | 97.30 | 94.28 |
| 43 | 88.32 | 87.31 | 99.38 | 94.98 | 97.67 | 93.79 |
| 44 | 107.59 | 106.19 | 122.27 | 116.36 | 119.79 | 114.64 |
| 45 | 93.51 | 92.29 | 106.70 | 101.43 | 104.53 | 99.93 |
Publisher’s Note: MDPI stays neutral with regard to jurisdictional claims in published maps and institutional affiliations. |
© 2020 by the authors. Licensee MDPI, Basel, Switzerland. This article is an open access article distributed under the terms and conditions of the Creative Commons Attribution (CC BY) license (http://creativecommons.org/licenses/by/4.0/).
Share and Cite
MDPI and ACS Style
Fina, B.; Auer, H. Economic Viability of Renewable Energy Communities under the Framework of the Renewable Energy Directive Transposed to Austrian Law. Energies 2020, 13, 5743. https://0-doi-org.brum.beds.ac.uk/10.3390/en13215743
AMA Style
Fina B, Auer H. Economic Viability of Renewable Energy Communities under the Framework of the Renewable Energy Directive Transposed to Austrian Law. Energies. 2020; 13(21):5743. https://0-doi-org.brum.beds.ac.uk/10.3390/en13215743
Chicago/Turabian StyleFina, Bernadette, and Hans Auer. 2020. "Economic Viability of Renewable Energy Communities under the Framework of the Renewable Energy Directive Transposed to Austrian Law" Energies 13, no. 21: 5743. https://0-doi-org.brum.beds.ac.uk/10.3390/en13215743
Note that from the first issue of 2016, this journal uses article numbers instead of page numbers. See further details here.