Closed Form Solutions for Predicting Lateral Response of Tripod Suction Pile for Offshore Wind Turbine Foundation


1
Renewable Energy Group, Korea Electric Power Corporation Research Institute (KEPRI), Daejeon 34056, Korea
2
Department of Civil and Environmental Engineering, Korea Advanced Institute Science and Technology (KAIST), Daejeon 34141, Korea
*
Author to whom correspondence should be addressed.
Energies 2020, 13(23), 6176; https://0-doi-org.brum.beds.ac.uk/10.3390/en13236176
Submission received: 10 October 2020
/
Revised: 20 November 2020
/
Accepted: 23 November 2020
/
Published: 24 November 2020
(This article belongs to the Section A3: Wind, Wave and Tidal Energy)
Abstract
:This study presents a simplified analysis technique capable of predicting the dynamic behavior of a tripod suction pile subjected to a horizontal load. The first natural frequency of the system, horizontal displacement, and allowable rotation angle at the pile head were set as target physical quantities in accordance with substructure design requirements. In consideration of the physical characteristics of the tripod suction pile, the analysis was extended to the single pile-multi-pile-tripod-tower part to derive the influence factors. A possible displacement response function that could be applied to the intermediate pile range was also proposed. Thereafter, a detailed design was determined using an integrated load analysis, which included a turbine based on the basic design of simplified analysis method. Furthermore, the dynamic behavior of the offshore wind turbine at each installation stage was predicted using a numerical analysis and measured via field tests. The displacement at the pile head and the predicted value of the first natural frequency of the system were compared using the field-measured and numerical analysis values. The first natural frequency value produced by the simple analysis method showed an error range within 1%, and the displacement at the pile head also satisfied the structural design requirements. Therefore, this method provides a quick and accurate solution to the lateral response of tripod suction piles as foundations for offshore wind turbines.
1. Introduction
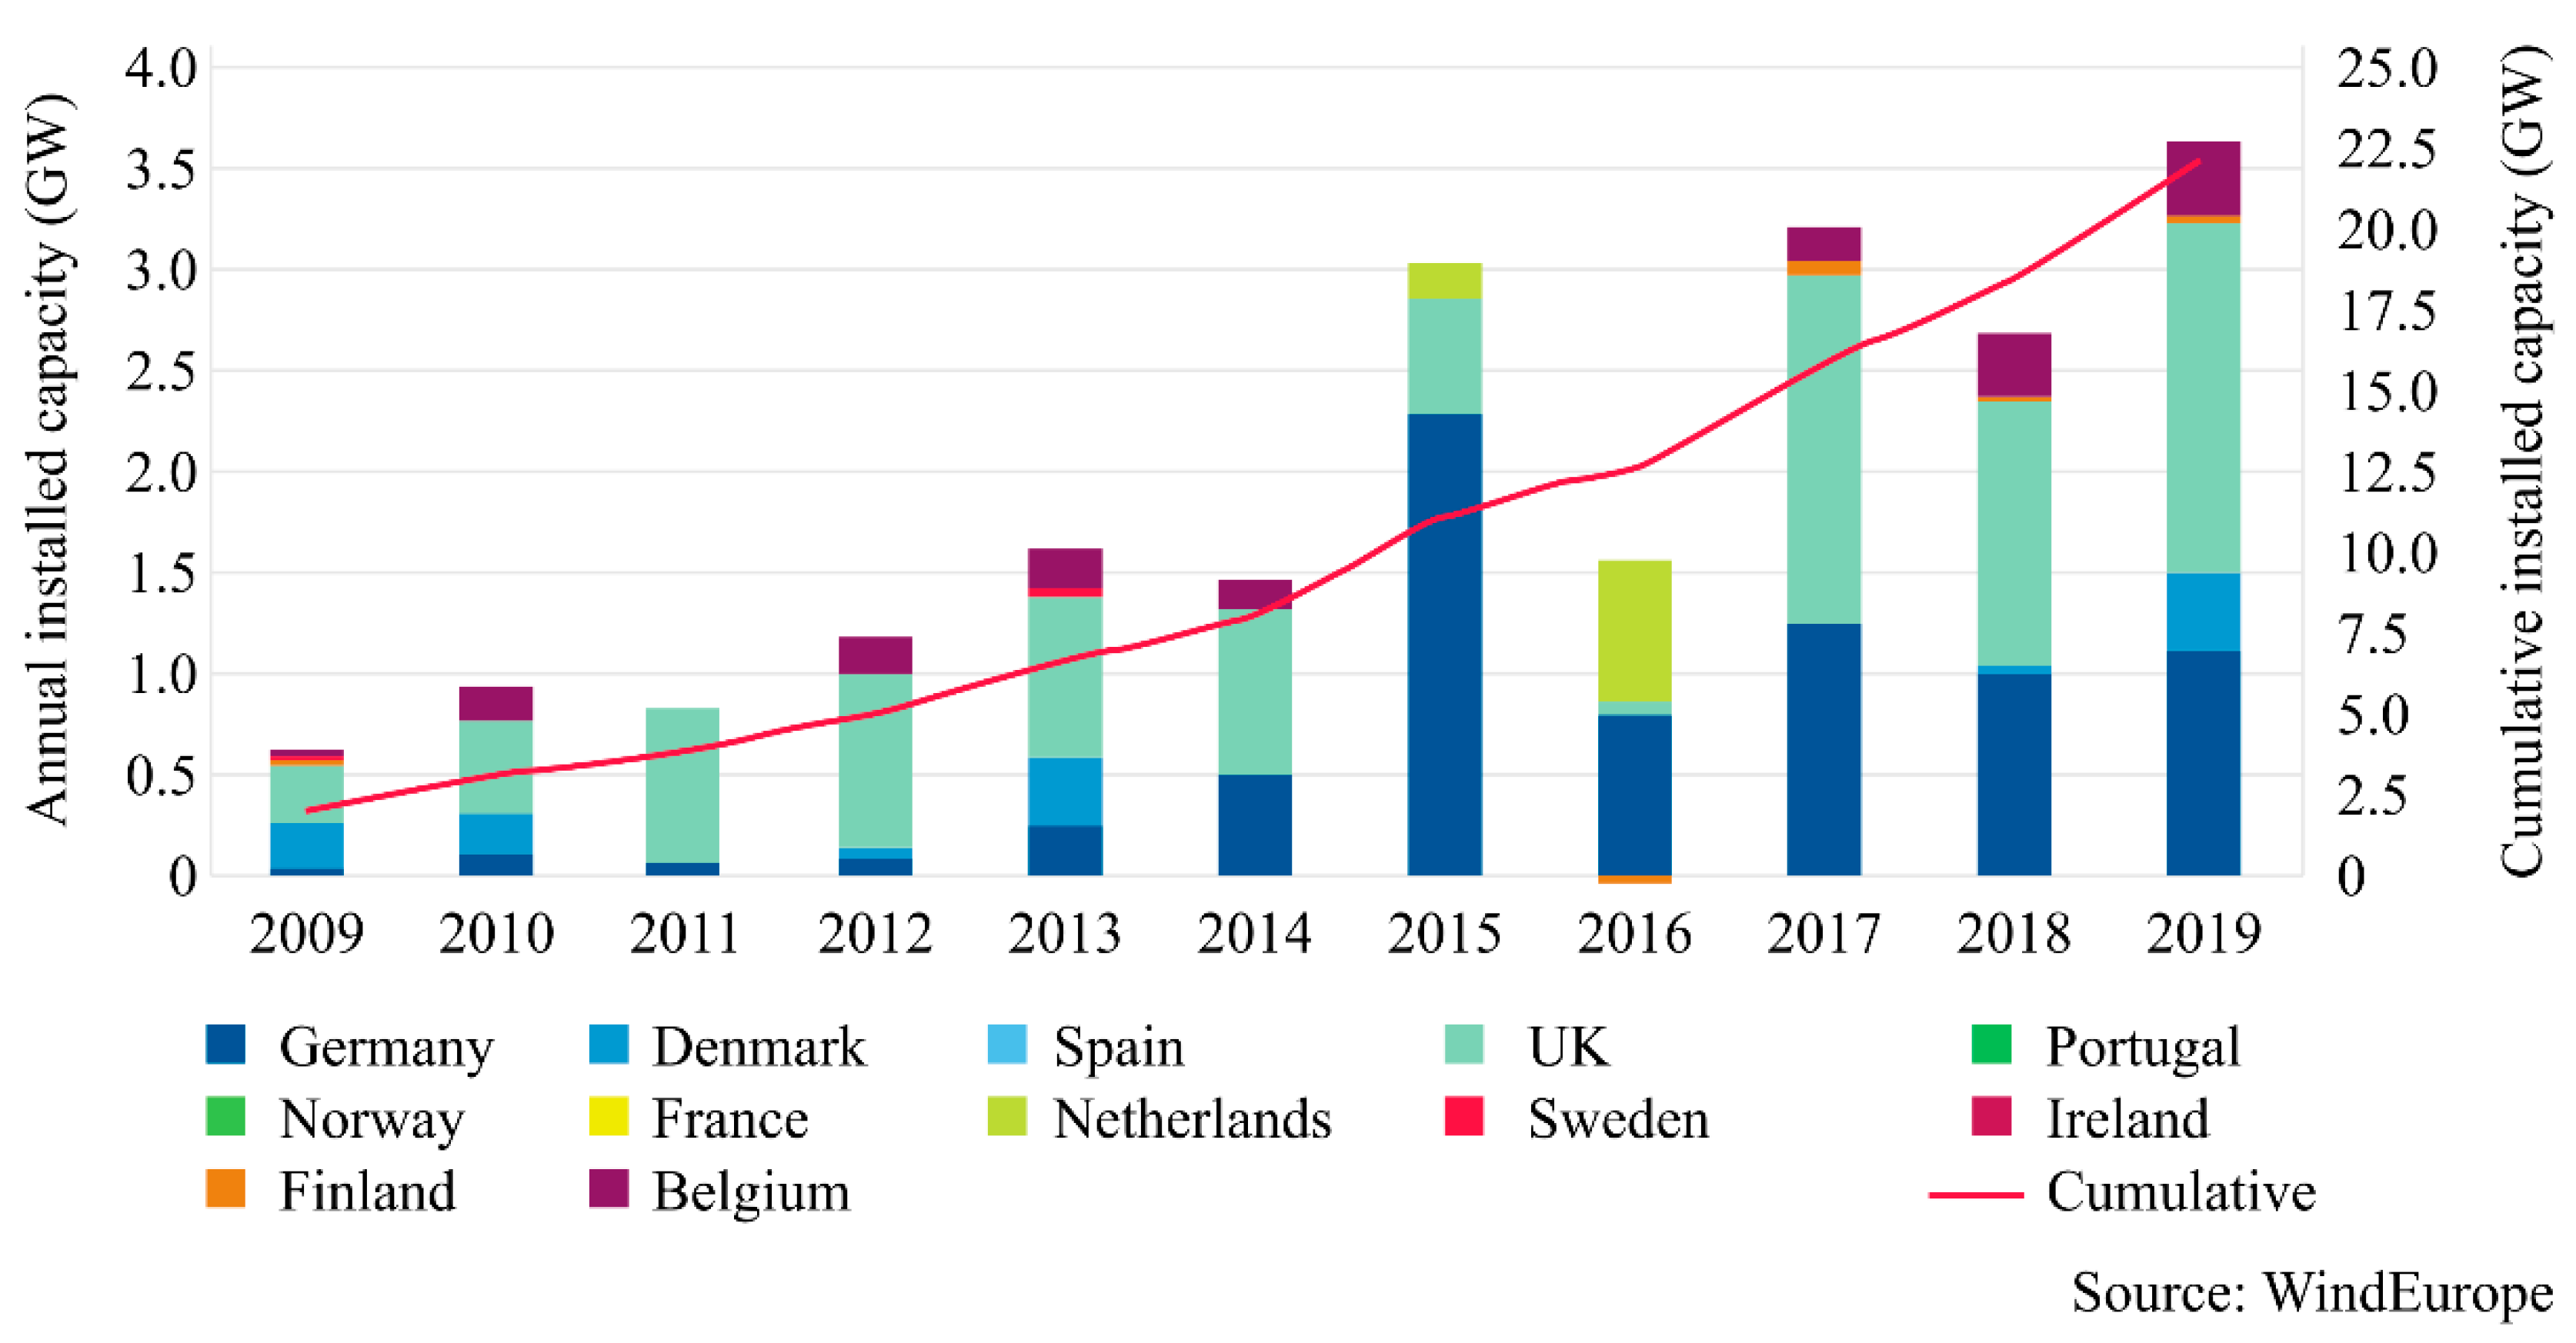
Offshore wind power is a large-scale renewable energy resource that generates electricity by utilizing the wind energy produced by turbines in seawater. The development rate of wind farms is expanding worldwide but is mainly concentrated in Europe (Figure 1), owing to its high level of technology and optimum utilization of facilities [1].
In addition, offshore wind power can secure a relatively large site compared to onshore wind power, which suffers from many restrictions on installation locations owing to the noise and landscape issues; thus, offshore wind power is advantageous with regard to avoiding civil complaints and conflicts in the social environment, while being the most popular renewable energy source because of its significant inducing effects on related industries. Specifically, in Korea, which is a peninsula and a strong manufacturing base for various industries such as shipbuilding and automobiles, the development of offshore wind power is being actively promoted by the government as a new growth engine for future industries. The Korean government’s Renewable Energy Roadmap (Figure 2) aims to secure 20% of the total energy from renewable sources by 2030 [2].
As the installation area moves to regions with increased depths via the expansion of offshore wind farms, the importance of the foundation structures of wind turbines is increasing day by day. Accordingly, the suction pile has recently attracted attention due to its relatively short installation period and low cost [3]. A suction pile is a new construction concept, in which a large steel pipe is mounted on the sea floor and the foundation is installed using the water pressure difference generated by discharging the water inside; this is achieved by using a suction pump installed at the top of the pile. Unlike the existing jacket foundation, the pile diameter is large (3–8 m) and the aspect ratio is small, thereby exhibiting a highly stiff behavior. Numerous reports have used suction bases as anchors for fixing large structures in the ocean or as lower foundations for floating breakwaters; however, the use of suction piles for foundations of offshore wind turbines has not been thoroughly explored thus far [4,5,6,7]. Unlike Europe, Korea adopted a new suction base in the form of a tripod through prior research and decided to perform a full-scale field study to apply it as a lower base for offshore wind power. In this study, a basic design has been created based on a simple analysis of tripod suction piles, which was integrated with the following assessments: safety evaluation through numerical analysis, field stress distribution and cyclic load evaluation through geocentrifuge experiments, and design optimization verification and performance evaluation through full-scale field tests [8,9,10].
The simple analysis method presented in this study applies the influence factor based on the elastic soil theory. Considering the structural characteristics of the suction pile, the analysis range is expanded to a single pile-multi-pile-tripod-tower, and the influence factor is calculated for each step. This approach was applied to determine the design variables. A displacement response function that can be applied to the intermediate pile range between the rigid pile and the flexible pile is also presented; this function has not been considered in previous studies. Finally, through the proposed analysis technique, the basic design of the tripod suction pile was developed, which takes into account the actual turbine specifications; subsequently, design variables (first natural frequency, horizontal displacement, and allowable rotation angle) were calculated, and the accuracy and effectiveness of the design were evaluated. To the best of our knowledge, this study is the first to investigate the mechanics of a tripod suction bucket foundation for offshore wind turbines in Korea. The findings of this study will provide design guidelines and a basis for field test indicators in other research projects.
2. Design of Offshore Wind Turbine Foundation
2.1. Basic Design Requirements
Unlike oil and gas structures where the vertical load is dominant, offshore wind turbines tend to generate large rotational moments in the lower foundation; this is because an extremely large horizontal load, which corresponds to 100% to 150% of the vertical load, is generated from a region that is relatively higher than the top of the pile. In addition, because the turbine has a design life of more than 20 years, long-term fatigue analysis is important as continuous cyclic loads caused by winds and waves are observed even after installation. Therefore, as a design requirement for offshore wind turbines, manufacturers generally provide design-allowable displacements based on the operating requirements of wind turbines. The allowable displacement includes the maximum allowable rotation angle at the tip of the pile after installation and the maximum cumulative rotation angle that results from the cyclic loads sustained during the entire design life [11,12]. In the case of an onshore wind turbine, the maximum allowable inclination at the tip of the pile is generally 0.003–0.008 rad (0.2–0.45°) after installation, and the offshore wind power is slightly larger than 0.009 rad (0.5°). In addition, to ensure the safety of the structure during the installation process of the lower foundation, the allowable value for the horizontal displacement at the pile head is specified, which varies depending on the applied design standard; however, it generally ranges from 0.5% to 1% of the pile diameter. In this study, the horizontal displacement was limited to 0.5% of the suction pile diameter by applying the design basis of the south-western offshore wind farm project in Korea [13]. Specifically, in the design of offshore wind turbines wherein continuous cyclic loads such as wind and waves are encountered, the dynamic characteristics of the system, including the substructure, are a major design consideration. The turbine rotates the blades and causes resonance at the blade-passing frequency and at frequencies that are represented by integer multiples. If the primary blade-passing frequency is 1P, in the case of a turbine having three blades, most of the vibration energy is released in 3P. In the case of a variable speed turbine, the blade-passing frequency ranges from 0.18 Hz to 0.26 Hz; thus, 3P ranges from 0.54 to 0.78 Hz. On the other hand, because the periodic force caused by the waves is generated in the range of 0.04 Hz to 0.34 Hz, the wind turbine system design has a natural frequency that does not overlap with the 1P and 3P frequencies and the wave frequency range as shown in Figure 3 (which includes an example for frequency window of a 3 MW wind turbine made by D-company in Seoul, Korea [14]); this is aimed at avoiding the destruction of the system by resonance.
2.2. Determination of Design Parameters for Wind Turbine
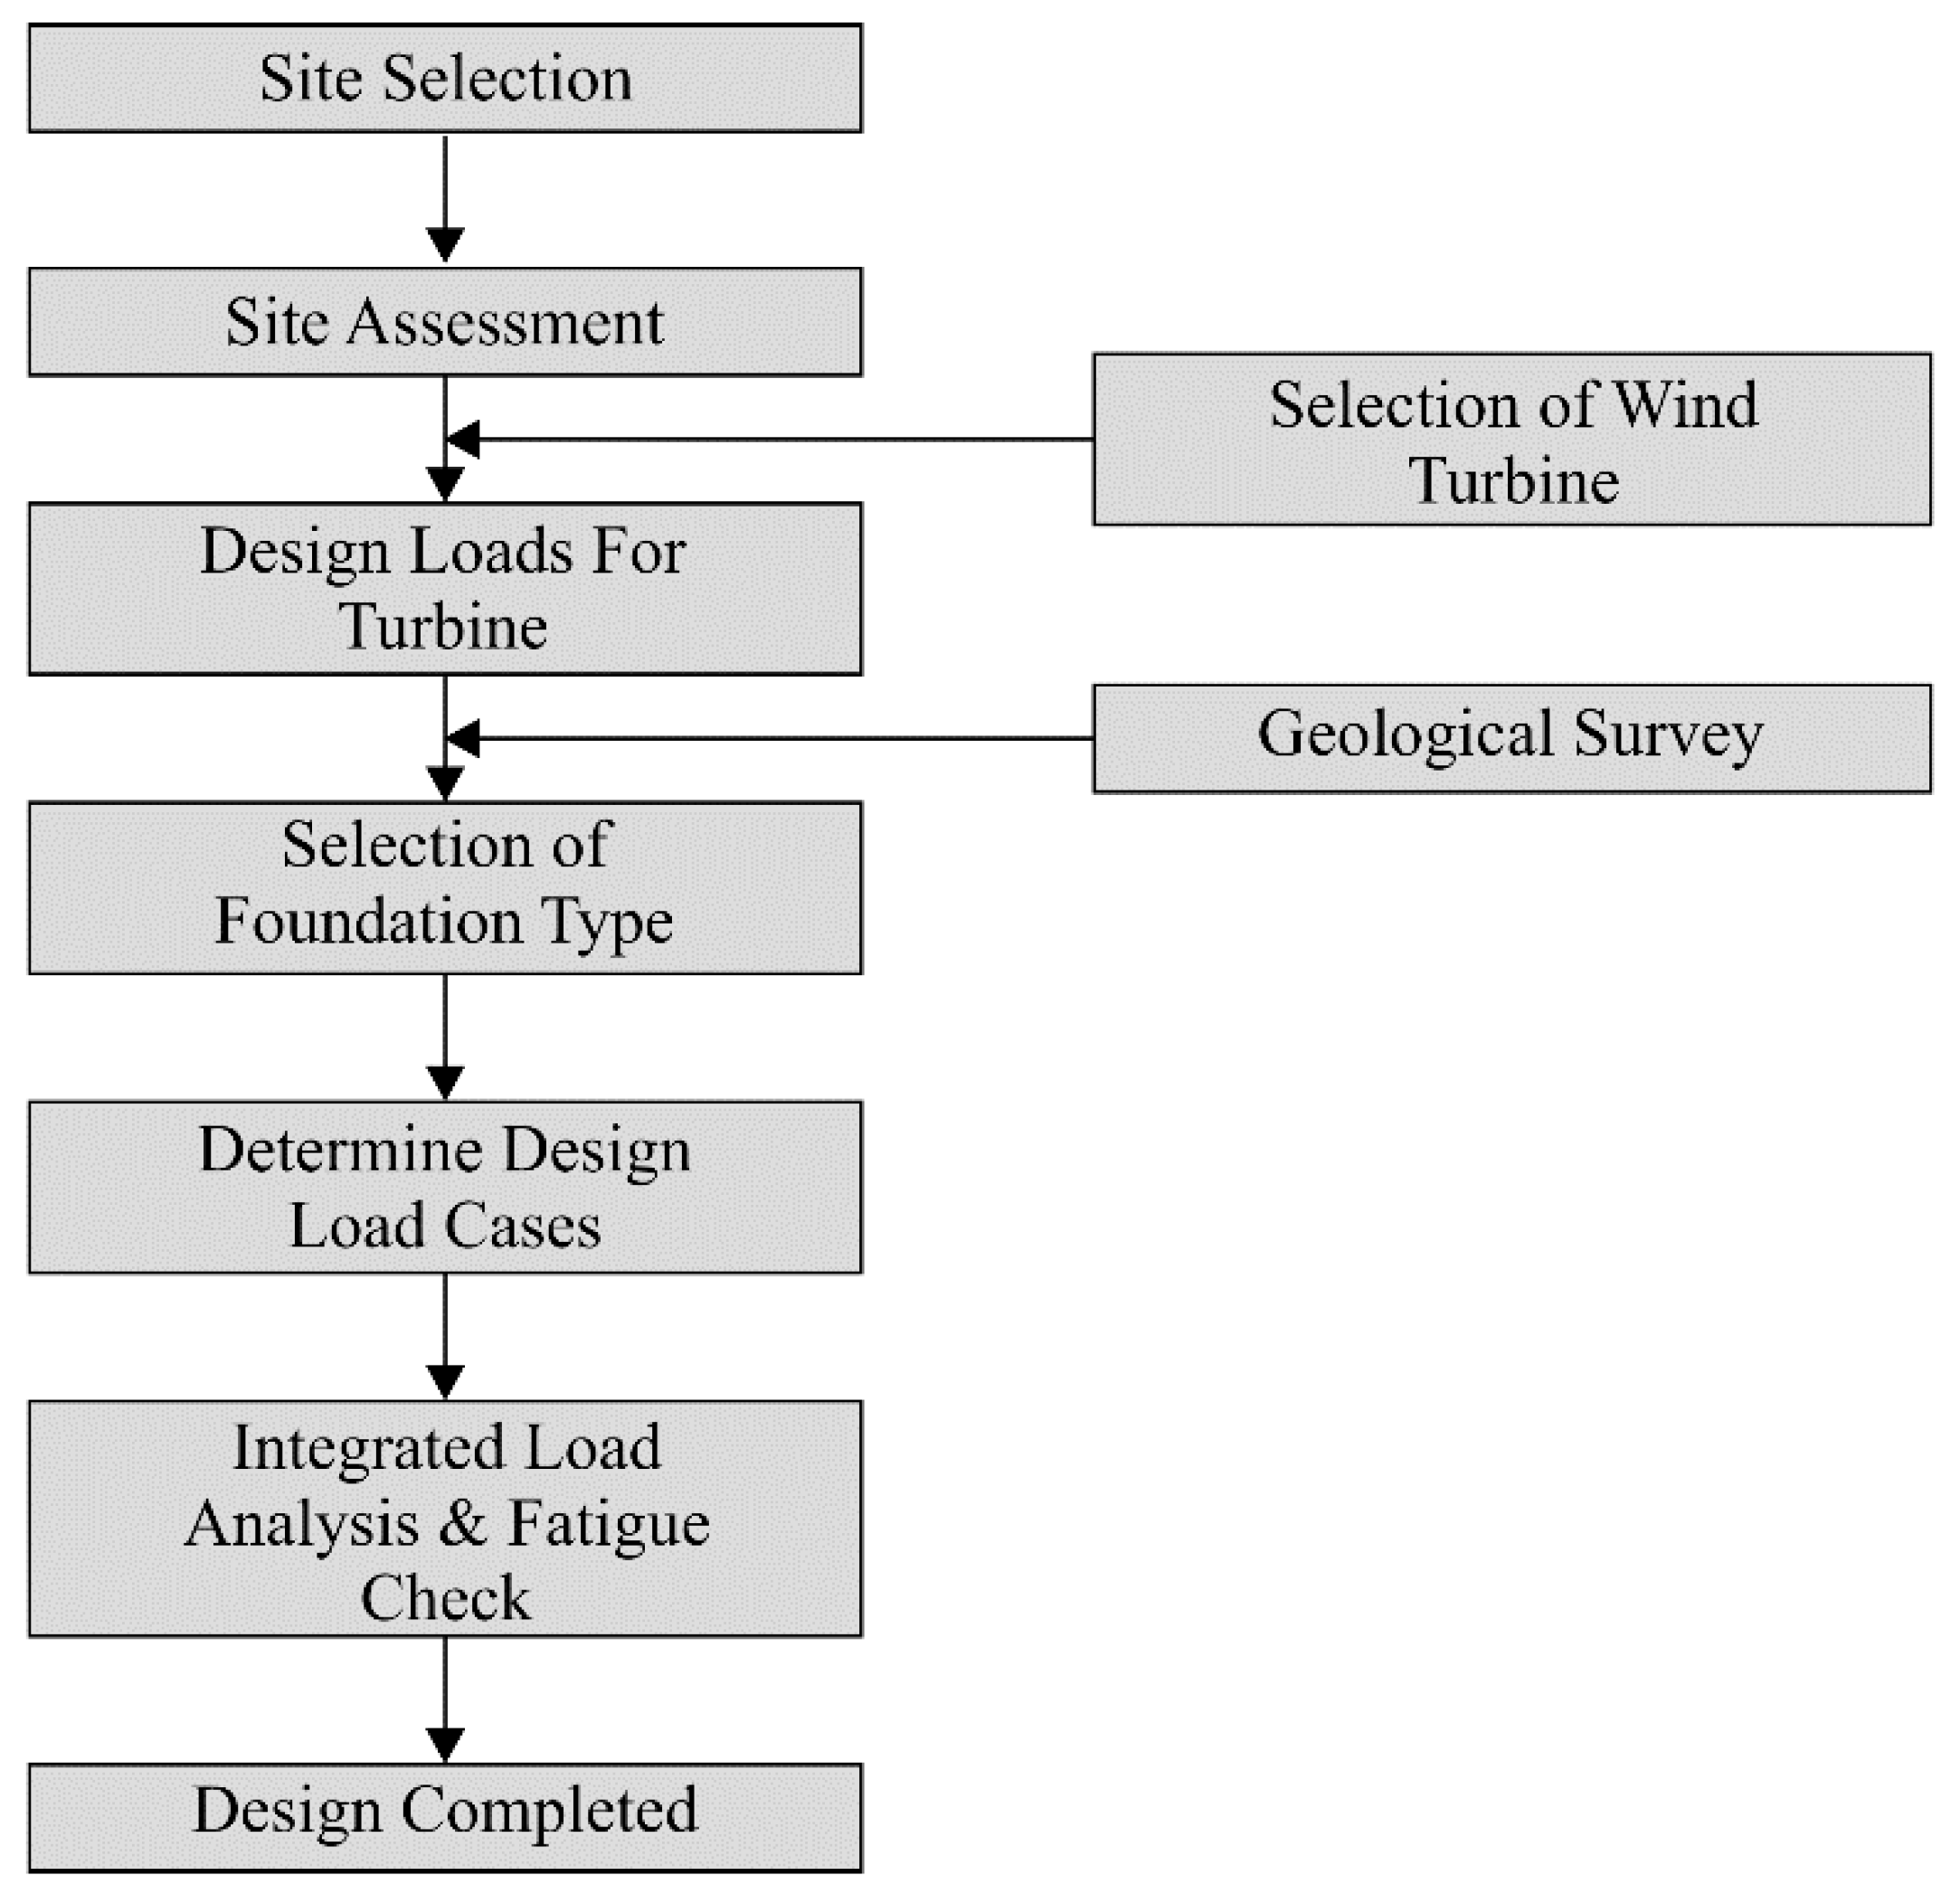
Figure 4 shows the design procedure for a general offshore wind power foundation. The figure demonstrates that the type of supporting structure and the design variables are evaluated prior to performing the full-scale integrated load analysis and structural design. This process is a key step in determining the design interface of the turbine and the supporting structure, and a better understanding between the manufacturer and the foundation designer ensures that a more optimal design becomes possible.
In this study, we propose a technique for performing the basic design of a turbine system through a simplified analysis of the horizontal load. In addition, the calculation process was organized step by step to ensure that the structural and behavior characteristics of the supporting structure could be easily understood, and a simple design document in the form of a spreadsheet was prepared to use it according to various turbine specifications. The basic design is to calculate the key parameters of the supporting structure required to mount the offshore wind turbine, such as the primary natural frequency of the turbine system and the displacements of main points of the supporting structure (the top and bottom of the tower and the top of the pile).
Figure 5 shows a simplified schematic diagram of the analysis of the offshore wind turbine system (3 MW) under external force conditions [14], as described in Section 2.1. The analysis starts with the suction pile at the bottom, and in this case, the diameter, length, and thickness of the pile become important design variables. In addition, detailed ground conditions that affect the stiffness of the suction pile are required. In this study, the shear modulus and Poisson’s ratio were used as design input variables for the ground soil. The next analysis component is the tripod structure at the bottom of the tower, where the batter angle, the distance between each member, and the diameter and thickness of the tripod members are the main variables. Thereafter, when analyzing the tower part, the height, diameter, and thickness of the tower must be entered as design variables, and the top turbine requires complex design variables for each component, such as the blade, hub, and nacelle. However, in the case of the upper turbine, the total mass has the greatest influence on the dynamic behavior, even more than the effect of the specifications of each component; therefore, the former is calculated as the main design variable. Finally, the value obtained through the analysis must satisfy the related design criteria or design requirements, and if these criteria are not met, an optimal design is developed through an iterative process that modifies design variables until a satisfactory result is obtained.
3. Simplified Analysis Method for Laterally Loaded Suction Pile
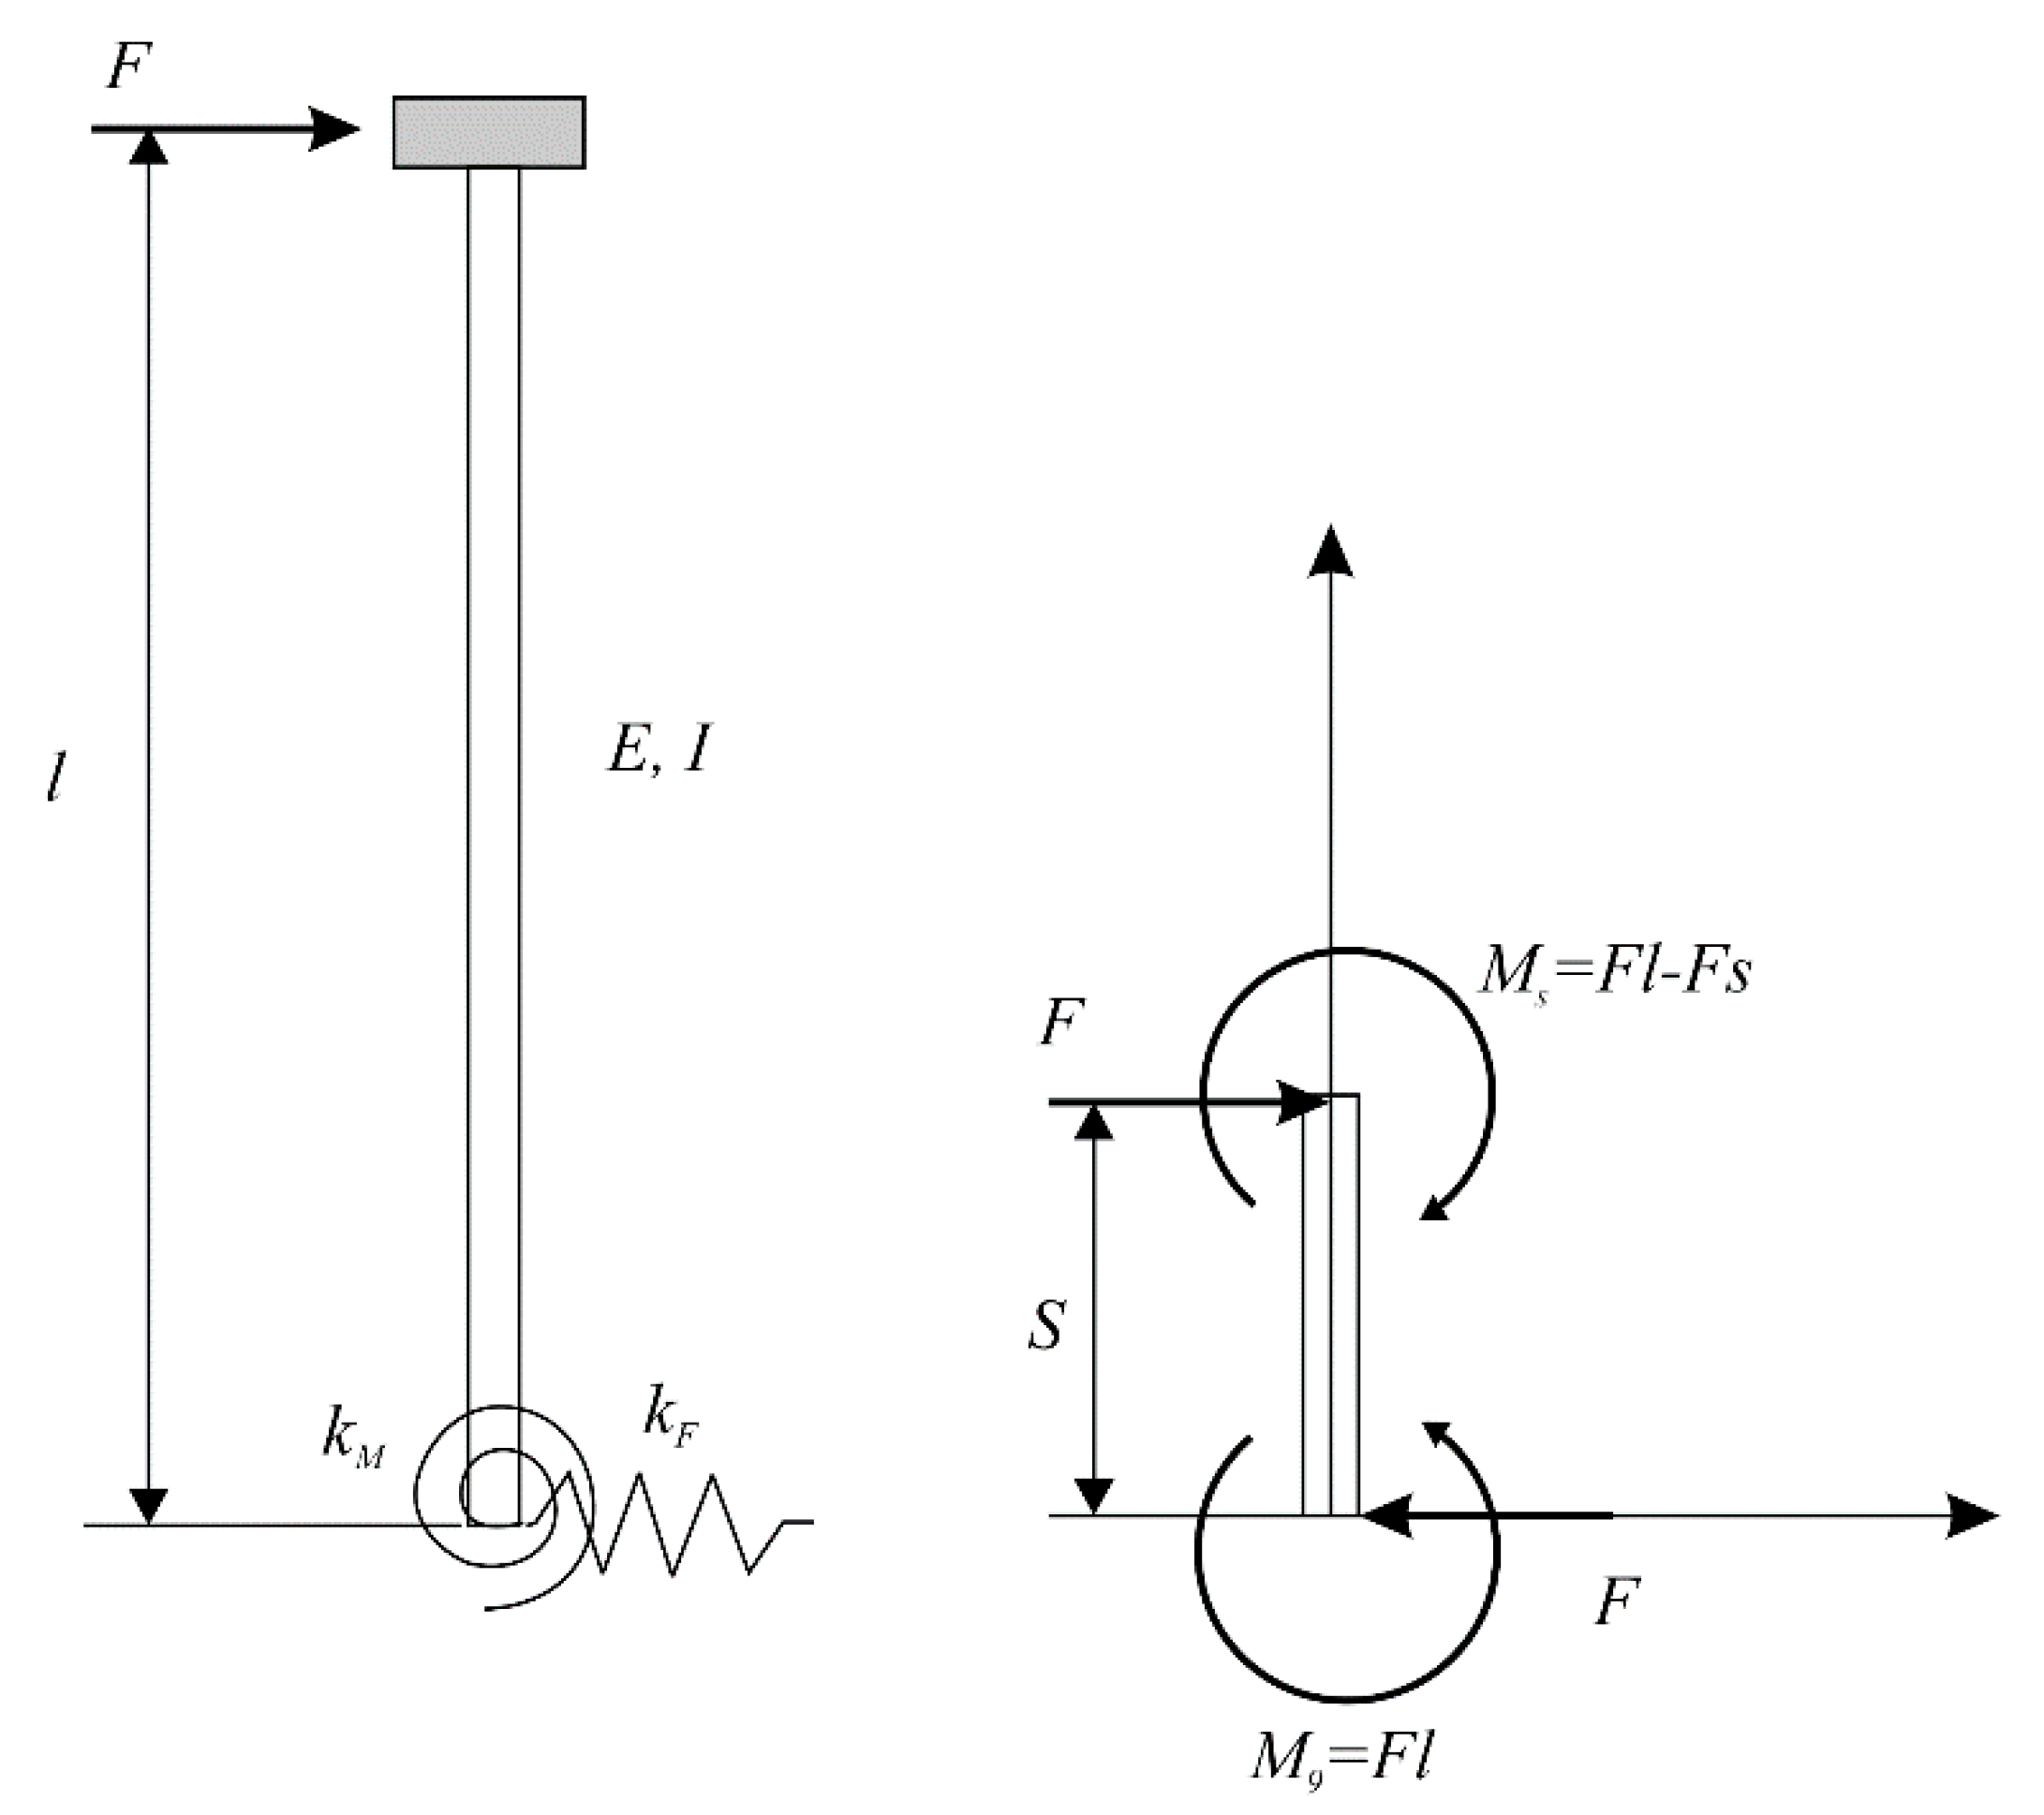
In this section, we will discuss a simple analysis technique that can predict the dynamic behavior and evaluate the safety of the offshore wind turbine system loaded with the horizontal load discussed above. Poulos [14] presented a method for calculating the displacement and rotation angle of a pile installed in the ground using a dimensionless influence factor. He assumed the ground to be a homogeneous elastic continuum model; the length-to-diameter ratio (L/D) and the pile flexibility factor, which is defined as a dimensionless measure of the flexibility of the pile relative to soil, are the most influential factors on the behavior of the pile. In addition, Randolph [15] expanded this model and suggested an algebraic expression that can calculate the displacement and rotation angle of a pile under a horizontal load (F) and moment (M) using fundamental soil properties, as shown in Figure 6.
3.1. Closed Form Solution for Laterally Loaded Piles
Randolph proposed that the behavior of the pile can be characterized into three cases according to the modulus ratio and the slenderness ratio , which are two dimensionless parameters (hereafter, referred to as influence factors).
- : Flexible Pile Region
- : Rigid Pile Region
- : Intermediate Region
is the effective Young’s modulus of the pile and is defined by Equation (1) when the pile in the ground is actual bending rigidity .
In addition, is an equivalent shear modulus that shows the effect of variations in Poisson’s ratio () on the deformation of the laterally loaded pile and is described by Equation (2).
In the flexible range, the displacement response of the pile is determined by the modulus ratio among the aforementioned dimensionless parameters when the applied load is the same, and the horizontal displacement and rotation angle are approximated by Equations (3) and (4). In this case, the applicable range of the equation is ≤ ≤ and L/D ≥10.
In contrast, in the rigid range, the displacement response of the pile is determined by the slenderness ratio,, and John P. Carter proposed the following simple formula through further research [16].
Its accuracy has been verified only for the following ranges of parameters: 1 ≤ ≤ 10 and ≥ 1. In addition, the displacements in the intermediate range case should be taken as 1.25 times the maximum of either (a) the predicted displacement of a rigid pile with the same slenderness ratio, or (b) the predicted displacement of a flexible pile with the same modulus ratio.
In summary, if the displacement response to the load of the pile is obtained in the form of a closed solution and used in the design of the foundation structure, a quick design decision can be made without time-consuming numerical analysis. In this study, the displacement response of the turbine system is obtained in the form of a closed solution using the basic properties of the suction pile and the ground soil. The effectiveness is verified through a comparison with the Finite Element Method (FEM) analysis result and is then used for a safety review using the quick basic design.
3.2. Influence Factors for Single Suction Pile
First, if the load displacement relations presented in Equations (3) to (6) are applied to a single suction pile, as shown in Figure 7, the horizontal displacement and rotation angle at the pile head can be obtained as follows using the influence factor.
In the above equations, , , , and represent dimensionless coefficients of influence, and they are a function of the aspect ratio and stiffness ratio. In each coefficient, the first subscript indicates whether it is related to a horizontal displacement (u) or an angular displacement (θ), and the second subscript is related to a horizontal load (F) or a moment load (M). represents the vertical force generated when a horizontal load is applied to the multisuction pile, which can also be expressed in the form of an influence factor, as shown in Equation (9).
Next, to obtain the displacement response for a single suction pile in the form of a closed solution, the influence factors for the three pile regions presented in Section 3.1 will be calculated. First, if the displacement response function in the rigid pile range is defined as and the function in the flexible range as , the influence factors of a single suction pile in each area can be obtained as shown in Table 1 through the results of previous studies.
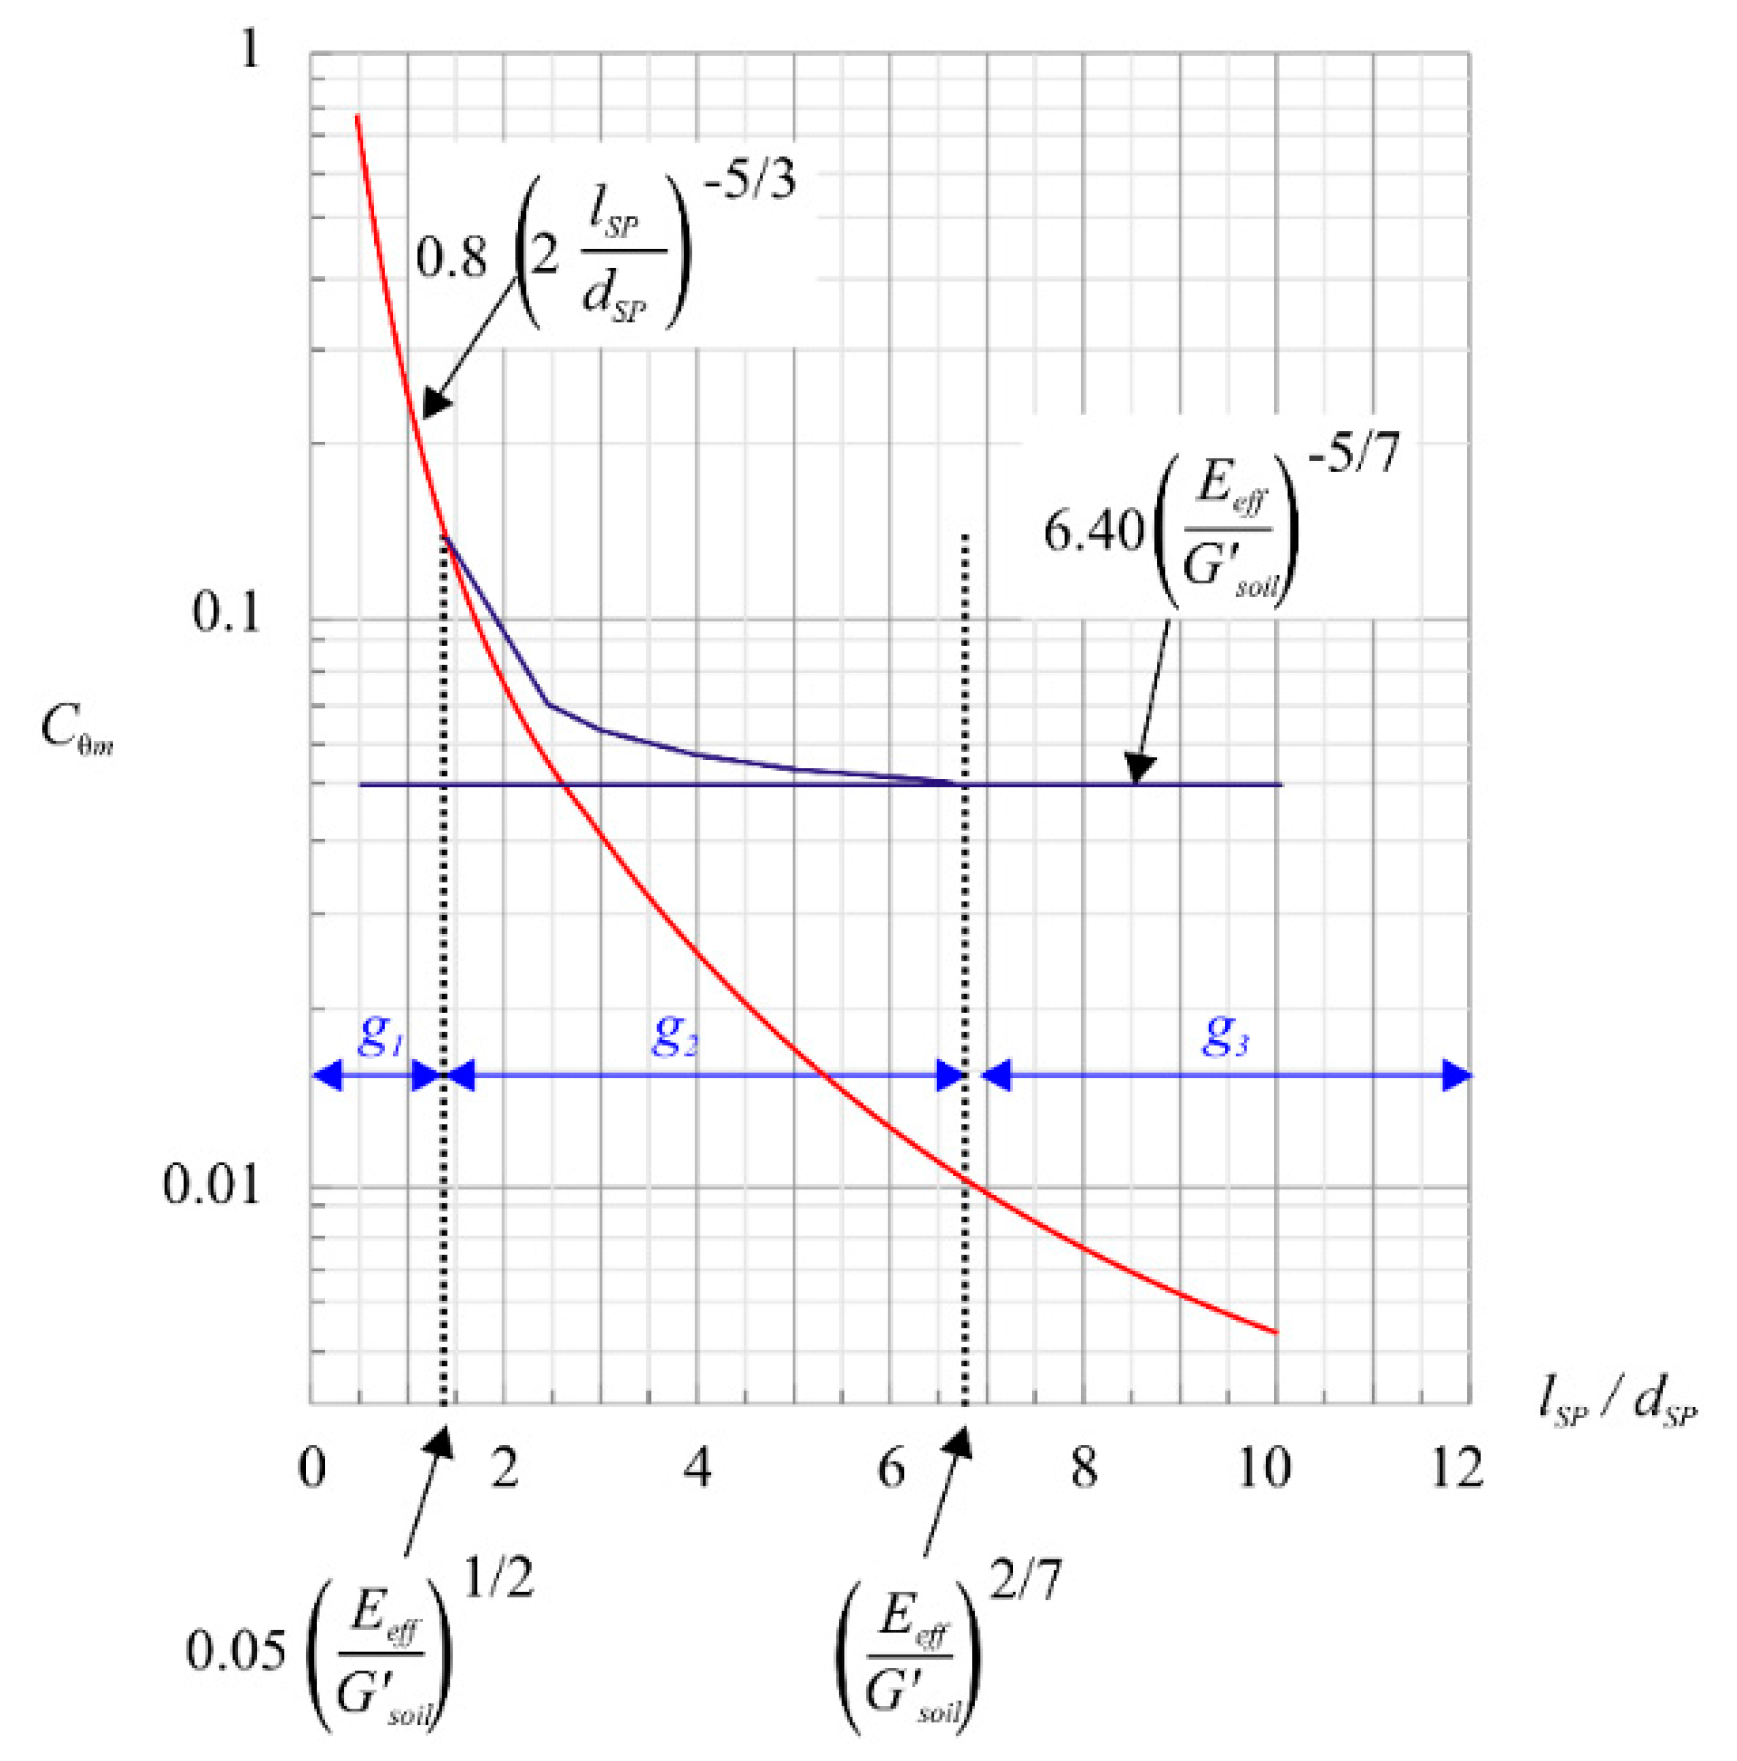
In this study, an influence factor function that can be applied in the intermediate region is proposed, which is represented by and = at the left boundary (rigid range ) when the approximate function of the displacement response in the intermediate range is, =. This is an exponential function that satisfies the condition. Additionally, at the right boundary, the slope of the function is zero because it has a constant value regardless of the aspect ratio when the modulus ratio is constant, but the slope between and cannot be zero unless exponential function has an extreme value. However, because the function is sufficiently attenuated with the for this range, it can be expressed as a continuous function if appropriate attenuation conditions are applied. Therefore, the analysis was performed by defining the exponential function , with an attenuation condition of less than 0.01 at the right boundary (flexible range ), as shown in Equation (10).
By synthesizing the above results, the exponential function of the intermediate range is proposed as Equation (11).
α then requires the following conditions to satisfy Equation (10).
Based on the results obtained above, the coefficient of influence of the rotation angle caused by the moment load over the entire pile range is shown in Figure 8.
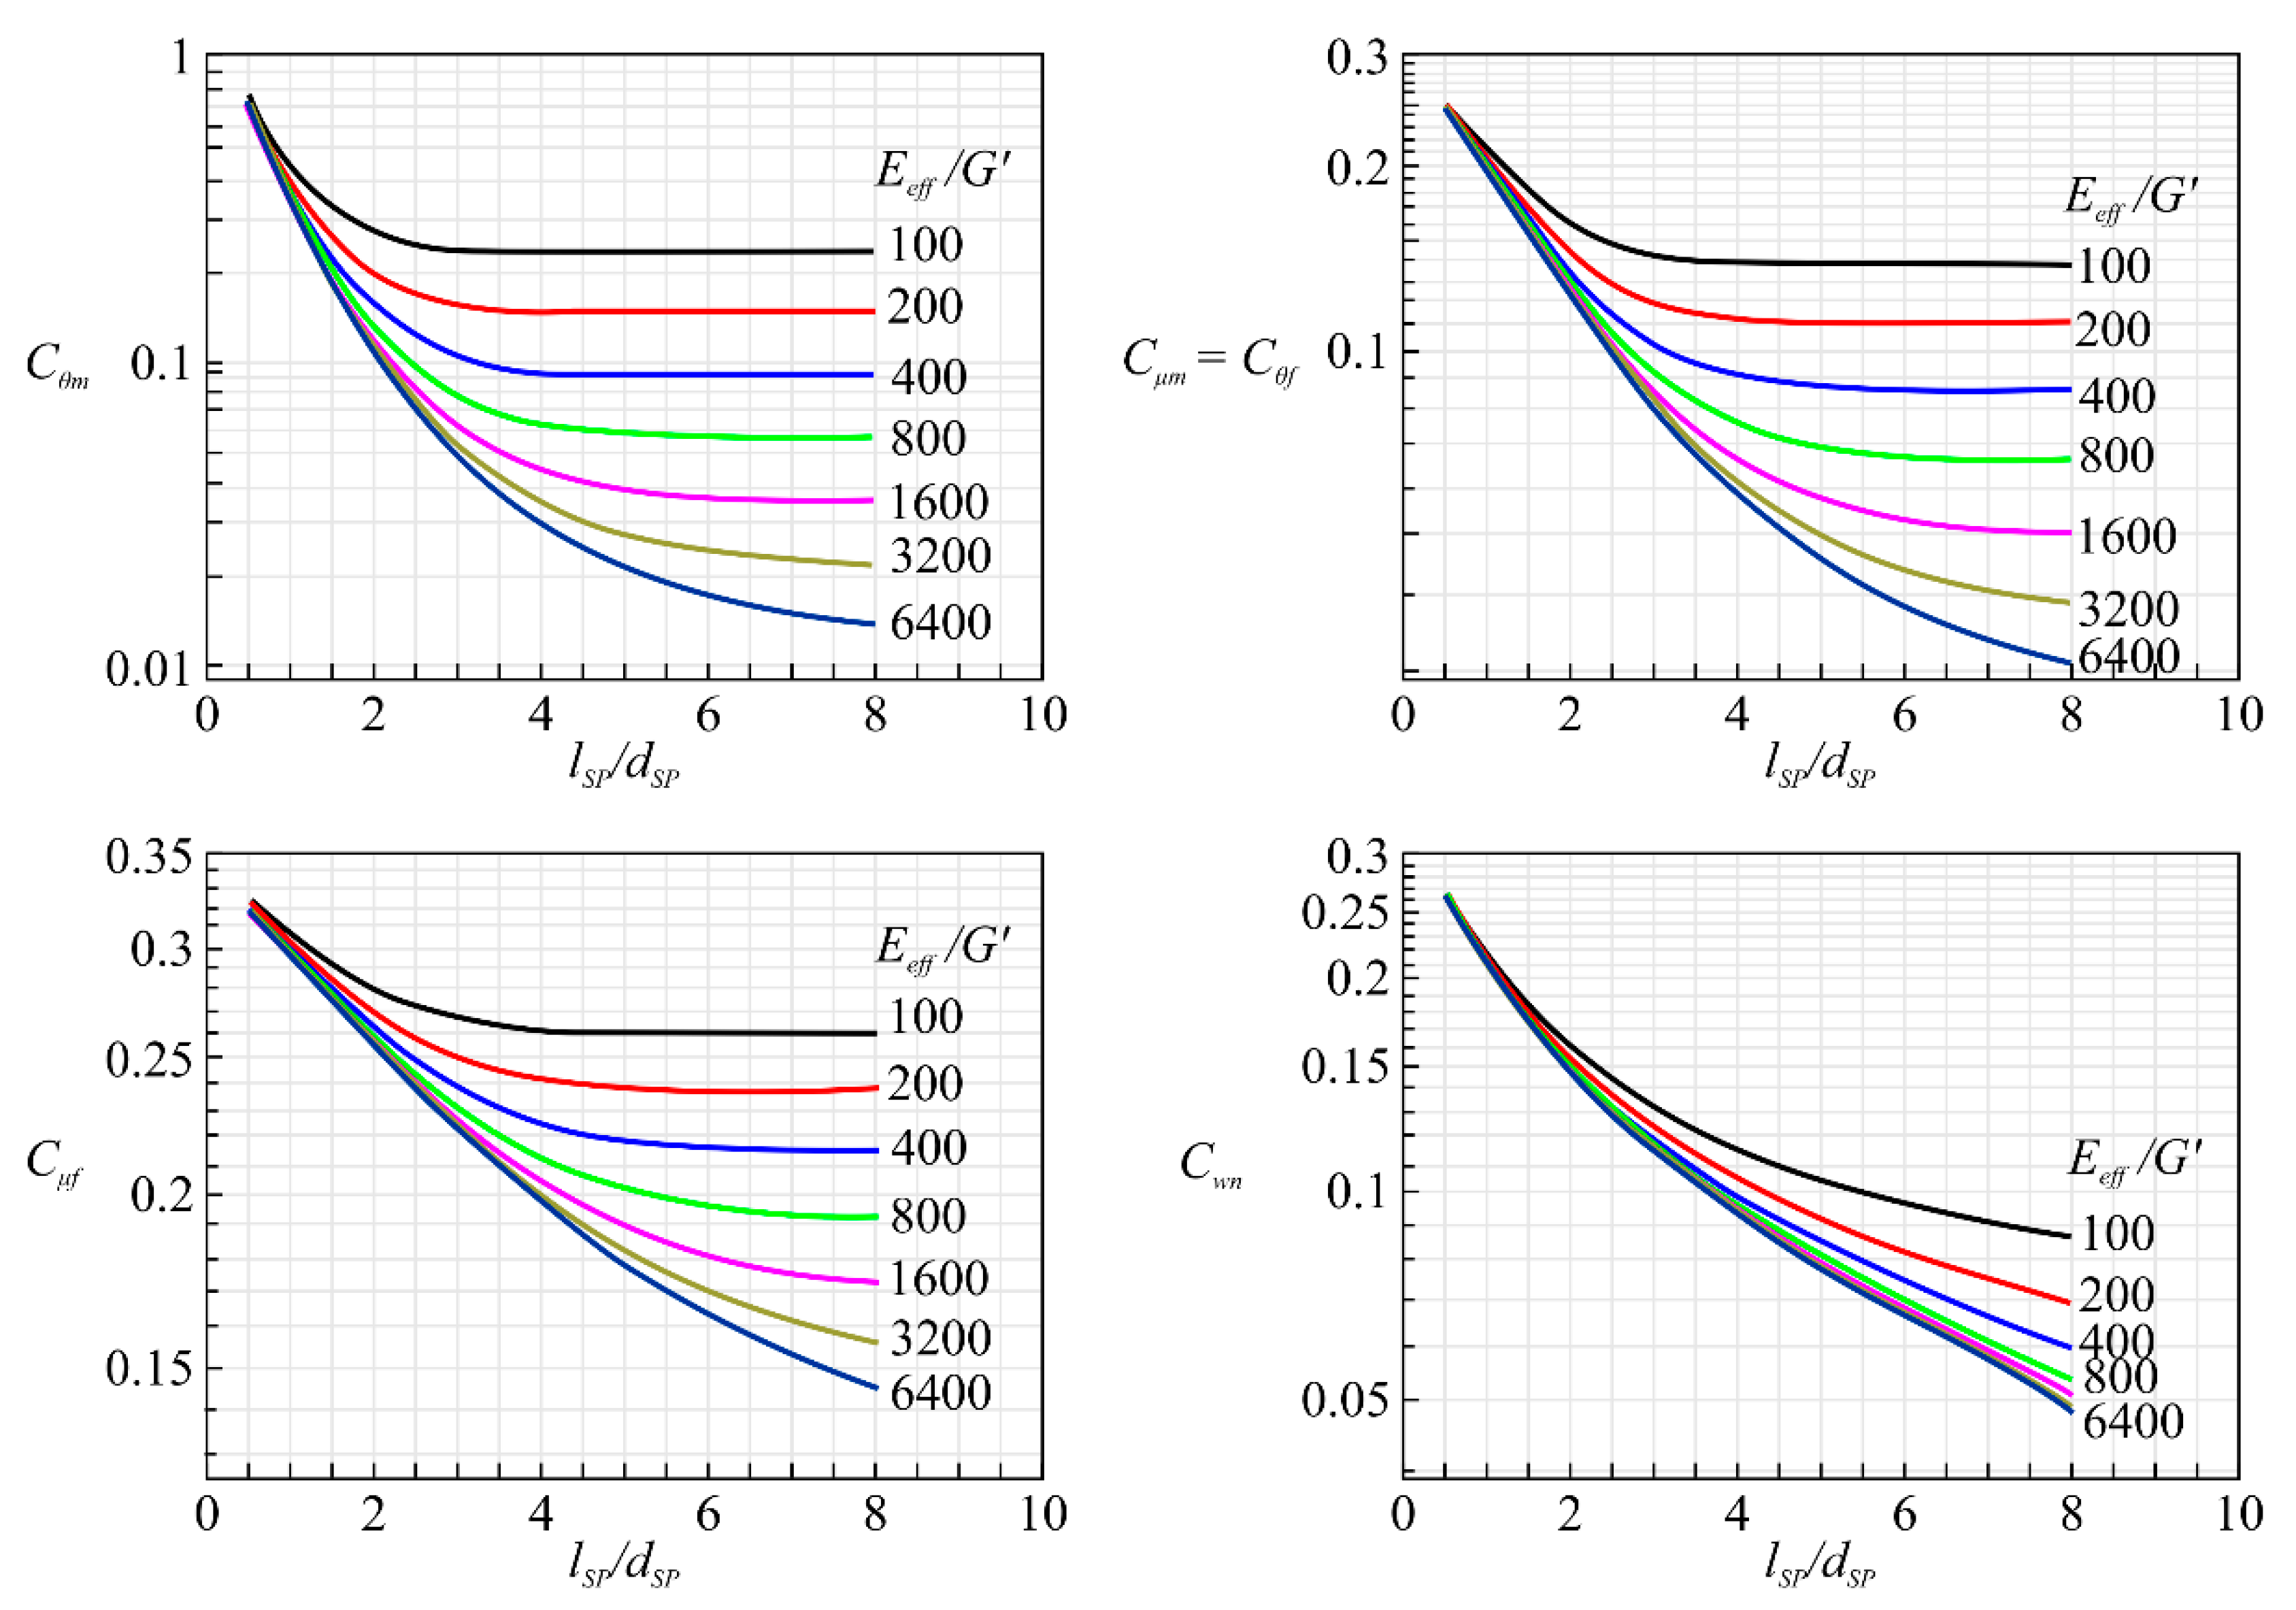
In addition, a simple finite element analysis was performed to understand the characteristics of the influence factor. For the physical properties of the ground soil, a modulus of elasticity of 22.1 MPa and a Poisson’s ratio of 0.25 were applied, in consideration of the soft marine soil. The influence factor was derived using the functions –based on the stiffness ratios of 100, 200, 400, 800, 1600, 3200, and 6400 and an aspect ratio (L/D) of 0.5–8, as shown in Figure 9.
When observing the characteristics of , , , , the rotation factor () of the moment load has the largest effect on the system (2.3 and 3 times that of and , respectively); this is because the offshore wind turbine has a large horizontal load, which is relatively situated at a higher position than that of the top of the pile, as described above. In addition, for the same pile, the larger the stiffness ratio and the larger the aspect ratio, the smaller the influence factor. This implies that the larger the stiffness of the ground soil, the longer the length of the pile, and the smaller the displacement at the pile head. Specifically, when the stiffness ratio is constant, the influence factor no longer decreases when the slenderness exceeds a certain value, which shows that no matter how deep the pile is driven above a certain depth, the displacement reduction is not affected. Based on the validity of the confirmed influence factor, the analysis was performed by extending the influence factor to the lower support structure.
3.3. Influence Factors for Multisuction Piles
In this section, based on Equations (7) and (8) for the single pile, we derive the load and displacement relations for the multisuction pile. Variables related to the multisuction pile are indicated by subscript MP, and the analysis section and elements have been presented as shown in Figure 10. In addition, we assume that each member connecting a single pile is robust and the relative displacement between the piles at the top of the pile is negligibly small. In this assumption, the angular displacement () and horizontal displacement () of the multipile have the same value at all points of the multipile. The distance from the center point of the multisuction pile to the center of a single suction pile is defined as.
The lateral force () acting on a multipile is simply multiplied by the force acting on a single pile and the number of single piles , as shown in Equation (13).
On the other hand, the moment acting on a multipile () can be expressed as a combination of a moment acting on a single file () and a normal force (), which is shown in Equation (14).
The vertical force acting on the i-th suction pile is defined as and the length of the moment arm due to the vertical force is expressed as . If , i.e., when , the normal force is .
When substituting Equation (15) into Equation (14) to obtain Equation (16), the moment acting on the multipile by the relational expression is as shown in Equation (17). It is expressed simply as below.
The relationship between the vertical force applied to a single pile and the angular displacement and horizontal displacement of a multipile is obtained using Equation (18) in Equation (9) in Section 3.2.
According to the previous assumption, the displacements of the suction pile () are the same as the displacements of the multipile ( and because the multipile at the top of the pile moves like a rigid body. Therefore, to obtain the angular displacement and the horizontal displacement of the multipile, the following equation is derived by substituting the multipile relational Equations (17) and (18) into the influence factor Equations (7) and (8) of a single file.
Substituting Equation (18) to remove the term from the above equation, the angular displacement and horizontal displacement equation for the multipile can be obtained as follows:
The influence factor of the multipile is derived from Equations (23) and (24) as follows:
3.4. Tripod and Tower Influence Factors
As shown in the simplified schematic diagram in Figure 5, we next derive the relationship between force and displacement for the tripod on the top of the suction pile and the tower member. To easily derive the validity and physical concept of the simple analysis, the solution is determined using the static dynamic relationship of force–displacement in the Euler beam to obtain the effective elasticity and effective mass. For the analysis, as shown in Figure 11, the lower, inner, and upper parts of the tripod member are marked with subscripts 0, s, and a, respectively. The relationship between the force applied to the member in the Euler beam , moment , angular displacement , and displacement can be expressed as Equation (25).
The angular and horizontal displacements and at arbitrary positions can be subsequently expressed as follows:
, expressed as an f-factor, which is an influencing coefficient that represents angular displacement θ at an arbitrary point s when the moment acts at the upper end, and other coefficients follow the definition of the aforementioned influence factor.
In the above Equations (26) and (27), the displacement of the tripod is determined by the physical properties of the member as well as by the boundary condition at the lower end (point 0), i.e., the displacement at the upper end of the (single or multi) suction pile. Therefore, by substituting Equations (21) and (22) regarding the influence factor of the suction pile into the displacement at point 0 of Equations (26) and (27), the load–displacement relationship for the entire system can be obtained as follows:
The c-influence factor of the entire tripod system can be obtained as shown in Equations (30)–(33) below.
The effect of the influence factor of the tripod and tower member can be directly observed in Equations (28) and (29). In this instance, the influence factor f is a value corresponding to the displacement or angular displacement when the lower end is completely fixed, and if the shape of the beam is expressed as a simple function, a closed form solution may exist. Table 2 summarizes the influence factors (f-factors) for a simple beam in which does not change and the beam changes as a quadratic function. As shown in Figure 5, the vertical member connecting the tripod and the tower applies a condition with a constant cross-section, and the tripod and the tower perform analysis by assuming the change in cross-section as a quadratic function. The process of deriving a detailed equation for this is detailed in Appendix A.
To demonstrate the characteristics of the f-factor expressed in Equations (30)–(33), Figure 12 shows the factor at ŝ = 0, i.e., at the top of the member.
is a monopile structure in which the area moment of inertia at the top and bottom of the member is constant. In this case, the values on the left and right sides of Table 2 are the same. At this time, the ratio of is 6:3:2, and to compare the three values in the same graph, the values of are shown. As depicted in Figure 12, as n increases, the stiffness of the system increases, and the f-factor value decreases. For example, in the case of n = 100, the value of decreases to 15% of the value at n = 1, and 2 also sharply decrease to 5% and 2.7%, respectively. In addition,decreases at the fastest rate as n increases, and in the case of n ≫ 100, the values of become small enough to be negligible compared to , so the behavior of structure is under the effect of .
In addition, from the f-factor graph in Figure 13, the influence factor increases as the location of the point where the displacement is obtained moves from the bottom to the top. This is because the turbine system has a large horizontal load acting on the top of the tower and dominates the overall behavior as described above. Notably, do not match; unlike in Figure 12 for the influence factor at ŝ = 0, these variables are within the member as shown in Figure 13, which demonstrates that the symmetry is not secured inside the member. Figure 13 also shows that the graph of is convex as the length changes, whereaschanges to a concave shape. Thus, a simple analysis method that can obtain the horizontal displacement and rotation angle among the main design variables in the form of a closed solution has been proposed, and the characteristics of each influence factor at different cases have been examined. In the next section, we will discuss how to determine the first natural frequency of the system, with one of the remaining major design variables.
4. Natural Frequency Derivation of Wind Turbine System
4.1. Equivalent Spring Coefficient of System
To obtain the first natural frequency of a wind turbine system, the stiffness coefficient and mass of the system are required, as shown in Equation (34).
represents the stiffness coefficient of the system, which denotes the load acting on the system when a unit displacement occurs; therefore, it can be regarded as the inverse of the previously obtained influence factor. Likewise, in the multidimensional case, the stiffness coefficient matrix becomes the inverse matrix of the influence factor. Therefore, the system’s stiffness coefficient () can be obtained by dividing the horizontal load acting on the top of the turbine by the horizontal displacement obtained through Equation (28). In this instance, as shown in Figure 14, a wind turbine is simulated as a simple beam, and the dynamic characteristics of the ground soil are equivalent to a horizontal spring and a rotating spring to explain the process of obtaining the stiffness coefficient. The relationship between the force applied to the member in the Euler beam , moment , angular displacement, and displacement is as shown in Equation (35) below.
When obtaining the relational expression of the moment and displacement acting on the supporting structure member:
, , and are values defined at the bottom of the supporting structure and have a mathematical relationship with the spring coefficient as follows:
Substituting Equations (39) and (40) into Equation (38) to obtain Equation (41) below.
Using Equation (41), when the force F is applied, the relational expression with the maximum displacement at the nucelle position is determined to obtain the effective spring coefficient of system.
where: .
In this equation, the longer the length of the supporting structure, the smaller the effect of on the spring coefficient of system, and it has the relationship. Therefore, it is determined by the value of for the effect of ground soil on the whole system.
4.2. Effective System Mass
When the support structure of a wind turbine behaves in the first Eigenmode, which is a natural vibration of a system such that various parts all move at the same frequency, the velocity in a small volume has the same shape as the displacement; therefore, Equation (43) is established, and by using Equation (41) it becomes Equation (44).
Using the kinetic energy formula of the supporting structure to find the effective mass for the displacement at the top of the structure, is derived as Equation (46).
where: .
is the mass of the entire turbine system and is expressed as the sum () of the weight of the turbine itself () and the effective mass of the lower support structure (). Because the turbine mass is a fixed value, we can obtain the first natural frequency of the system we want by obtaining the effective mass of the support structure through analysis. However, if the cross section of the supporting structure changes linearly as shown in Figure 11, the ratio of and the average area () can be calculated using Equation (47), and the effective mass is obtained using Equation (48).
Using the equation obtained above to determine the first natural frequency of the system, it is equal to Equation (49).
In general, because (, the elimination of the related term yields Equation (50).
To discern the characteristics of the first natural frequency, Equation (52) is calculated using the stiffness ratio x between the ground soil and the structure and the mass ratio y between the nacelle and the structure as follows:
is the same as Equation (53), and if the value is calculated according to the stiffness ratio and the mass ratio defined above, it is shown in Table 3.
Table 3 shows that as the nacelle weight increases, the natural frequency decreases and gradually approaches zero. Conversely, as the stiffness of the ground soil increases, the natural frequency gradually increases, and when the stiffness of the ground soil is extremely high, i.e., more than 100 times the stiffness of the structure, the natural frequency converges to a constant value. Thus, the dynamic behavior of the wind turbine system is governed by the design variables of the turbine part not the ground soil conditions.
5. Analysis Results
5.1. Design Parameters
Table 4 shows the main design parameters of offshore wind turbines that applied the derived simple analysis method for the basic design. Based on the load conditions provided by the turbine company, a horizontal load of 1 MN was applied to the top of the 3 MW turbine, and the specifications and properties of the tower and turbine were also prepared based on the actual turbine information [17]. The material properties of the ground soil were applied by reflecting the results of the site survey and laboratory test results [18].
5.2. Numerical Analysis
This section describes the numerical analysis procedure for deciding the stiffness matrix of suction pile in the ground soil. In order to design offshore wind turbine using GH Bladed, multiple design parameters of the foundation are required as input. The nonlinear p–y curve is usually used for this purpose but it is not valid for piles with larger diameters such as suction pile and mono pile. DNV-OS-J-101(DNV GL, Oslo, Norway) recommend finite element (FE) analysis to solve this problem; thus, equivalent stiffness matrix of suction pile has been evaluated using a commercial FE program, MIDAS GTS NX. Figure 15 shows the analysis model of suction pile, which is 6 m (D) 12 m (L) as depicted in Table 4. Mohr-Coulomb is adopted as the soil model and elastic model is applied to suction pile. Material properties related to soil and structure are shown in Table 4. Boundary conditions of all the surfaces were clamped to represent nondeformed locations.
A basic assumption in this approach is that force in the x(y) direction and moment in the x(y) direction mainly contribute to deformation in the x(y) direction. A coupling effect between translational and rotational degrees of freedom (DOFs) is an actual phenomenon in the response of the suction bucket; thus, equivalent stiffness matrix (6 is elaborately evaluated considering many aspects including stress concentration of the pile head. Figure 16 shows the load–displacement curve and analysis results for FEM model. This relationship between load and displacement of the suction pile is provided as a foundation design parameter to the Garrad Hassan (GH) Bladed input file.
After deciding the foundation design parameter, integrated load analysis is performed using GH Bladed based on the external forces from the design basis of the site [13]. Figure 17 shows the input model and mode shape of suction pile offshore wind turbine. Design parameters of wind turbine from the manufacturer are summarized in Table 5.
Integrated load analysis is performed according to design load cases of IEC 61400-3 (IEC, Geneva, Switzerland) but the details are not explained here because of the nondisclosure agreement with the turbine manufacturer.
5.3. Field Test
This section briefly describes the installation procedure and field test of suction bucket offshore wind turbine. This system has been designed and installed as a part of research project, as shown in Figure 18. Field test was performed at each installation stage in order to check the accuracy of installation and safety of structure. Accelerometers and tilt and strain gauges were installed for measuring the natural frequency, verticality, and stresses on crucial parts of the system.
Table 6 shows the field test cases and excitation method to measure the natural frequency of first bending mode of system. In case 1, it was hard to get an excitation force induced by wind; therefore, we used the impact method, which involved a boat hitting the landing platform very slowly to initiate the response of foundation. In other cases, we could obtain the natural frequency easily because excitation force induced by wind and wave was enough to vibrate the structure.
The measurement points were at the transition piece, which connects the foundation and tower, because this location provides a clearer response for first natural frequency than other parts of system. Accelerometers are installed in two directions which are perpendicular to each other because structure usually has the different natural frequency at each direction. Figure 19 shows the details.
Figure 20 shows the time series of acceleration (left-hand side) of system for Case 4 (Table 6). From these data, we could obtain a natural frequency of the structure for each case through fast Fourier transformation, as depicted in the right-hand side of the figure. The other three cases are not explained in this section, but the process is the same. As shown in Figure 20, there are two response spectrums in different directions and the x direction gives the natural frequency (0.32 Hz) of the wind turbine system mounted on the suction bucket foundation. This result gives the reference value for the simplified analysis method later.
5.4. Comparison of Results between Numerical Analysis and Field Test
Figure 21 is a step-by-step summary of the simplified analysis process presented in Section 3 and Section 4 using a spreadsheet program (MS-Excel). It is possible to determine whether the structure conforms to the design standards through phased analysis and result comparison for each structural element, and based on this approach, the prior safety evaluation is possible.
As a result of the analysis, the first natural frequency of the system was 0.322 Hz; this value did not overlap with the blade pass frequency of 0.18 to 0.26 Hz and its triple value of 0.54 to 0.78 Hz, as mentioned in Section 2.1, which indicated that the design requirements were satisfied. In addition, when a horizontal load of 1 MN is applied to the turbine, the maximum angular displacement at the suction pile head is 2.3 × 10⁻⁴ rad, which satisfies the design standard of the wind turbine substructure at 0.009 rad or less. The horizontal displacement is also 2.57 mm, which satisfies the allowable displacement (less than 0.5% of the pile diameter, 30 mm). Therefore, the design parameters selected in Section 3.1 are structurally safe and the design criteria of the offshore wind power system are met. In summary, this analysis can obtain the displacement response of the turbine system in the form of a closed solution using only the basic properties of the suction pile, wind turbine, and the ground soil, which ensures that the designer can quickly review the safety of system through the basic design.
Table 7 is a comparison table of the basic design results using this analysis technique, detailed numerical analysis results, and field measurement results. In the table, the first natural frequency is the value for the wind turbine system, and the horizontal displacement and rotation angle are the values at the suction pile head penetrating the ground soil. The calculated natural frequency value shows a 99% accuracy compared to the actual measured value, the rotation angle has an error of less than 4% from the numerical analysis value, and the horizontal displacement satisfies the design requirements, which confirm that this analysis method was highly accurate and useful.
6. Discussion
In this study, a simple analysis method was proposed for obtaining the displacement response of an offshore wind turbine with a tripod suction pile in the form of a closed solution by using only the basic properties of the system, pile, and ground soil. By calculating the variable and comparing it with the field test results, the accuracy and effectiveness of this analysis method was confirmed, and the following findings were drawn.
- The influence factor function that could be applied to the intermediate pile range was suggested by extending the formula proposed by Randolph and Carter. FEM analysis confirmed that the proposed function accurately simulated the displacement response of the suction pile. This function provided the solution for only a limited number of large-diameter piles whose aspect ratios (L/D) were mainly between 1 and 3, such as suction piles.
- An offshore wind turbine is a structure, in which a large horizontal load is applied to the top, and the influence of the turbine is overwhelming for the system components. The result of the influence factor analysis also showed that the effect of was the largest (2.3–3 times of , ), and most of the horizontal and angular displacements were related to the turbine part.
- By extending the influence factor that was applied to the single pile, a multipile influence factor equation that could be applied to the support structure was derived. In addition, based on this approach, the influence factor for structures with varying analysis sections such as tripods and towers were derived arithmetically. Looking at the characteristics of the influence factor of the structure that was defined by the f-factor, the value decreased as the ratio of the area moment of the inertia of the upper and lower parts of the structure increased (i.e., the occurrence of displacement decreased owing to the increase in structure stiffness). In the case of n = 100, the value of decreased to 15% of the value at n = 1, and 2 also sharply decreased to 5% and 2.7%, respectively. In addition, decreased at the fastest rate as n increased. In the case of n≫100, the values of became small enough to be negligible as compared to that of , which ensured that the behavior of the structure was influenced by .
- The equation for calculating the primary natural frequency of the offshore wind turbine was derived using the effective mass of the structure, which was determined using the kinetic energy formula and the influence factor obtained for the entire supporting structure. In addition, the pattern of the change in the first natural frequency according to the stiffness ratio of the ground/support structure and the mass ratio of the turbine/support structure was analyzed. The frequency was almost unaffected by the ground soil when the soil had a high stiffness value ( compared to that of the support structure.
- This analysis method is a highly useful design tool that accurately simulates the dynamic behavior of an offshore wind turbine system in the form of a closed solution by comparing the results of the simple analysis to those of the numerical analysis and the field measurement values.
7. Conclusions
The fast and simple safety check analysis method proposed in this study enables the project manager to make a quick decision when selecting the type of foundation and wind turbine at the FEED stage. Additionally, it can also provide the basic design of the offshore wind turbine and enables scenario analyses during the feasibility study. Nevertheless, there are some limitations to using an approximated influence curve for the intermediate pile range and assuming that the support structure is a simple beam when calculating the natural frequency of the system. However, these assumptions do not affect the accuracy of our simplified analysis method because the turbine component is the dominant driver of system behavior. Moreover, to our knowledge, this study is the first to investigate the mechanics of a tripod suction bucket foundation for offshore wind turbines in Korea. The findings of this study will provide design guidelines and a basis for field test indicators in other research projects. In the future, a more accurate influence curve for the intermediate pile range suitable for suction buckets should be studied.
Author Contributions
Conceptualization and methodology, M.-S.R. and J.-S.L.; formal analysis, M.-S.R. and M.-U.J.; investigation, M.-S.R.; resources, M.-S.R. and M.-U.J.; data curation, M.-S.R. and M.-U.J.; validation, M.-S.R., M.-U.J., and J.-S.L.; writing—original draft preparation, M.-S.R.; writing—review and editing, J.-S.L. and M.-U.J.; supervision, D.-S.K.; project administration, D.-S.K.; funding acquisition, D.-S.K. All authors have read and agreed to the published version of the manuscript.
Funding
This research was funded by the Korea Institute of Energy Technology Evaluation and Planning (KETEP) (Grant No. 20143010024330).
Acknowledgments
This research was supported by the Korea Institute of Energy Technology Evaluation and Planning (KETEP), Korea Construction Engineering and Transport Development Collaboratory Management Institute (KOCED), and Korea Advanced Institute of Science and Technology (KAIST).
Conflicts of Interest
The authors declare no conflict of interest.
Appendix A. Derivation of f-Factor of Members Changing as Quadratic Functions
The area inertia of the tripod changes along the axis s as follows:
Next, the coefficient of change in section a is:
The ratio of the area inertia of the bottom and top surfaces is defined as .
First, the coefficient of influence on the moment is determined. When the moment of acts on the upper part of the member, the angular displacement on the s-axis is:
is a nondimensionalized variable s. Next, by integrating Equation (A3), Equation (A4) can be obtained.
Referring to Table A1 for the integration of the function, the influence factor is:
When the upper point of the tripod is the same as the upper point of the tower (, the influence factor of the angular displacement caused by the moment at the upper point of the tripod is:
By integrating the angular displacement of Equation (A4), the displacement on the s−axis can be obtained as Equation (A7).
Based on this equation, influence factor can be obtained as follows:
As a result, when the upper point of the tripod is the same as the upper point of the tower (, the influence factor of the horizontal displacement due to the moment at the upper point of the tripod is equal to Equation (A9):
The influence factor caused by the force can also be obtained. When a force is applied, the angular displacement can be obtained as Equation (A10) because the moment along the s−axis changes as :
The influence factor is:
As a result, where the top point of the tripod and the tower coincide (, the influence factor for the angular displacement of the tripod by the acting horizontal force can be obtained as follows:
In addition, if the angular displacement equations (A10 and A11) are integrated and calculated, the displacement caused by the horizontal force acting on the top of the tower and the corresponding f-factors can be obtained.
Therefore, the influence factors at the point where the upper point of the tripod coincides with the upper point of the tower ( is equal to Equation (A14).

Table A1.
Integral function definition.
| 1 | |
| 2 | |
| 3 | |
| 4 | |
| 5 | |
| 6 | |
| 7 | |
| 8 | |
| 9 | |
| 10 |
References
- Wind Europe. Offshore Wind in Europe: Key Trends and Statistics 2019; Wind Europe: Brussels, Belgium, February 2020; p. 7. [Google Scholar]
- Ministry of Trade, Industry and Energy. Korea’s Renewable Energy 3020 Plan; Ministry of Trade, Industry and Energy: Seoul, Korea, December 2017; pp. 4–7.
- Offshore Wind Accelerator (OWA)/Foundations, Carbon Trust. Available online: www.carbontrust.com (accessed on 8 September 2020).
- Oh, K.; Nam, W.; Ryu, M.; Kim, J.; Epureanu, B. A review of foundations of offshore wind energy converters: Current status and future perspectives. Renew. Sustain. Energy Rev. 2018, 88, 16–36. [Google Scholar] [CrossRef]
- Houlsby, G.; Byrne, B. Design procedures for installation of suction caissons in clay and other materials. Proc. Inst. Civ. Eng. Geotech. Eng. 2005, 158, 75–82. [Google Scholar] [CrossRef]
- Houlsby, G.; Byrne, B. Design procedures for installation of suction caissons in sand. Proc. Inst. Civ. Eng. Geotech. Eng. 2005, 3, 135–144. [Google Scholar] [CrossRef]
- Houlsby, G.; Kelly, R.; Huxtable, J.; Byrne, B. Field trials of suction caissons in sand for offshore wind turbine foundations. Geotechnique 2006, 56, 3–10. [Google Scholar] [CrossRef]
- Ryu, M.; Lee, J.; Kwag, D.; Seo, Y. Verification of tripod suction pile applicability through dynamic characteristic analysis of offshore wind turbine at each installation stage. J. Korea Wind Energy Assoc. 2019, 10, 12–21. [Google Scholar]
- Seo, Y. Dynamic model of a offshore wind turbine with a supporting structure with suction buckets for prediction of natural frequencies. J. Korea Wind Energy Assoc. 2016, 7, 29–34. [Google Scholar]
- Seo, Y.-H.; Ryu, M.S.; Oh, K.-Y. Dynamic characteristics of an offshore wind turbine with tripod suction buckets via full-scale testing. Complexity 2020, 2020, 1–16. [Google Scholar] [CrossRef]
- IEC. Wind Turbines-Part 3: Design Requirements for Offshore Wind Turbines, 3rd ed.; 61400-3; IEC: Geneva, Switzerland, 2009. [Google Scholar]
- Det Norske Veritas. Design of Offshore Wind Turbine Structures; Offshore Standard DNV-OS-J101; DNV: Oslo, Norway, 2011. [Google Scholar]
- Test Bed for 2.5 GW Offshore Wind Farm at Yellow Sea Design Basis; Final Report; Korea Electric Power Corporation Research Institute (KEPRI): Daejeon, Korea, 2016; pp. 153–168.
- Poulos, H.G. Behavior of Laterally Loaded Piles: Ⅰ-Single Piles. ASCE 1971, 97, 711–720. [Google Scholar]
- Randolph, M.F. The response of flexible piles to lateral loading. Geotechnique 1981, 31, 247–252. [Google Scholar] [CrossRef]
- Carter, J.P. Analysis of laterally loaded shafts in rock. J. Geotech. Eng. 1992, 118, 839–844. [Google Scholar] [CrossRef]
- Technical Description of WinDS3000 in Supply. Doosan Heavy Industry; Contract Documents: Madison, WI, USA, 2012.
- Technical Report of Young’s Modulus of Ground Soil for Project: SuCCESS; KAIST Soil Dynamic Lab: Daejeon, Korea, 2015.
Figure 1.
Cumulative installed capacity of offshore wind power in Europe.

Figure 2.
Roadmap for renewable energy generation by 2030 in Korea.

Figure 3.
Design requirements of natural frequency (3 MW Turbine-D Company in Korea).

Figure 4.
Flowchart of foundation design.

Figure 5.
Simplified analysis model of offshore wind turbine system.

Figure 6.
Laterally loaded pile in soil.

Figure 7.
Simplified analysis model of a single suction pile.

Figure 8.
Influence factor curve of rotation within the entire range.

Figure 9.
Characteristics of influencing factors.

Figure 10.
Schematic diagram of multisuction piles.

Figure 11.
Simplified Euler beam model for tripod structure.

Figure 12.
f-factors with variation of n ().

Figure 13.
Characteristics of f-factors with variation of n.

Figure 14.
Schematic diagram of simplified wind turbine system.

Figure 15.
Numerical model of suction pile.

Figure 16.
Evaluation of stiffness matrix of suction pile (-, -).

Figure 17.
Analysis model and mode shape of the wind turbine system in GH Bladed.

Figure 18.
Installation process of suction bucket offshore wind turbine.

Figure 19.
Measuring points of transition piece of wind turbine.

Figure 20.
Time series of acceleration and response spectrum of the wind turbine system.

Figure 21.
Simplified dynamic analysis method (MS-Excel version).

Table 1.
Influence factors for a single suction pile.
| Function | |||
|---|---|---|---|
Table 2.
f-factors for each support structure case.
| f-Factors | ||
|---|---|---|
where, : Ratio of area moment of inertia; : Defined equation for effective expression.
Table 3.
Characteristic values of .
| 0.00 | 0.01 | 0.10 | 1.00 | 10.0 | 100 | |
|---|---|---|---|---|---|---|
| 0.00 | 0 | 0 | 0 | 0 | 0 | 0 |
| 0.01 | 0.4160 | 0.4129 | 0.3895 | 0.2941 | 0.1762 | 0.0998 |
| 0.10 | 0.7361 | 0.7306 | 0.6889 | 0.5194 | 0.3111 | 0.1762 |
| 1.00 | 1.2519 | 1.2418 | 1.1663 | 0.8706 | 0.5194 | 0.2941 |
| 10.0 | 1.7347 | 1.7181 | 1.5969 | 1.1645 | 0.6888 | 0.3895 |
| 100 | 1.8703 | 1.8512 | 1.7133 | 1.2385 | 0.7303 | 0.4129 |
| ∞ | 1.8888 | 1.8693 | 1.7290 | 1.2482 | 0.7358 | 0.4159 |
Table 4.
Design parameters of the wind turbine system.
| Component | Parameter | Unit | |
|---|---|---|---|
| Wind Turbine | Lateral Load (F) | 1,000,000 N | |
| Weight (Nacelle) | 193 t | ||
| Tower | Diameter | 3–4.5 m | |
| Length | 70 m | ||
| Thickness | 22 mm | ||
| Young’s Modulus | 210 GPa | ||
| Tripod Structure | Main Member | Diameter | 4.5 m |
| Thickness | 35 mm | ||
| Bracing Member | Diameter | 1.5 m | |
| Thickness | 40 mm | ||
| Young’s Modulus | 210 GPa | ||
| Length (from the seabed) | 26.6 m | ||
| Suction Pile | Diameter | 6 m | |
| Length | 12 m | ||
| Thickness | 19 mm | ||
| Young’s Modulus | 210 GPa | ||
| Pile Distance | 17.2 m | ||
| Soil Condition | Young’s Modulus | 44.7 MPa | |
| Poisson’s Ratio | 0.35 | ||
Table 5.
Design load case parameters.
| Category | Variable | Value | Unit |
|---|---|---|---|
| Wind class | Class 2-A | - | - |
| Air density | 1.225 | kg/ | |
| Mean turbulence intensity at 15 m/s | 0.105 | % | |
| Rated power | 3000 | kW | |
| Cut-in wind speed | 3 | m/s | |
| Rated wind speed | 12 | m/s | |
| Cut-out wind speed | 25 | m/s | |
| 50-year extreme mean wind speed over 10 min | 42.5 | m/s | |
| 50-year extreme wind speed over 3 s | 49.64 | m/s | |
| 1-year extreme mean wind speed over 10 min | 34 | m/s | |
| 1-year extreme wind speed over 3 s | 39.712 | m/s | |
| Wind gradient | 0.105 | - | |
| Annual average wind speed at hub height | 6.72 | m/s |
Table 6.
Natural frequency test at each installation stage.
| Case | Description | Excitation |
|---|---|---|
| 1 | Suction bucket foundation only | Boat |
| 2 | Suction + Tower 1 + Tower 2 | Wind |
| 3 | Suction + Tower 1 + Tower 2 + Tower 3 + Nacelle | Wind |
| 4 | Suction + Tower 1 + Tower 2 + Tower 3 + Nacelle + Hub + Blade | Wind |
Table 7.
Comparison with the results of numerical analysis and field tests.
| Category | Simplified Method | Numerical Analysis | Field Test | Design Requirements |
|---|---|---|---|---|
| 1st natural freq. (Hz) | 0.322 | 0.325 | 0.320 | 0.285–0.335 |
| Displacement (mm) | 2.57 | 25.03 | N.A. | 30 |
| Rotation (rad) | 0.00023 | 0.000238 | N.A. | 0.009 |
| Safety check | O.K. | O.K. | O.K. |
Publisher’s Note: MDPI stays neutral with regard to jurisdictional claims in published maps and institutional affiliations. |
© 2020 by the authors. Licensee MDPI, Basel, Switzerland. This article is an open access article distributed under the terms and conditions of the Creative Commons Attribution (CC BY) license (http://creativecommons.org/licenses/by/4.0/).
Share and Cite
MDPI and ACS Style
Ryu, M.-S.; Jung, M.-U.; Lee, J.-S.; Kim, D.-S. Closed Form Solutions for Predicting Lateral Response of Tripod Suction Pile for Offshore Wind Turbine Foundation. Energies 2020, 13, 6176. https://0-doi-org.brum.beds.ac.uk/10.3390/en13236176
AMA Style
Ryu M-S, Jung M-U, Lee J-S, Kim D-S. Closed Form Solutions for Predicting Lateral Response of Tripod Suction Pile for Offshore Wind Turbine Foundation. Energies. 2020; 13(23):6176. https://0-doi-org.brum.beds.ac.uk/10.3390/en13236176
Chicago/Turabian StyleRyu, Moo-Sung, Min-Uk Jung, Jun-Shin Lee, and Dong-Soo Kim. 2020. "Closed Form Solutions for Predicting Lateral Response of Tripod Suction Pile for Offshore Wind Turbine Foundation" Energies 13, no. 23: 6176. https://0-doi-org.brum.beds.ac.uk/10.3390/en13236176
Note that from the first issue of 2016, this journal uses article numbers instead of page numbers. See further details here.