Evaluation of Two-Column Air Separation Processes Based on Exergy Analysis


1
Department of Chemical Engineering, University of Engineering and Technology, Lahore 54890, Pakistan
2
Department of Chemical Engineering, COMSATS University Islamabad, Lahore Campus, Defence Road, Lahore 54000, Pakistan
*
Author to whom correspondence should be addressed.
Energies 2020, 13(23), 6361; https://0-doi-org.brum.beds.ac.uk/10.3390/en13236361
Submission received: 29 October 2020
/
Revised: 21 November 2020
/
Accepted: 27 November 2020
/
Published: 2 December 2020
(This article belongs to the Special Issue Exergy Analysis and Optimization of Energy Systems and Processes)
Abstract
:Cryogenic air separation processes are widely used for the large-scale production of nitrogen and oxygen. The most widely used design for this process involves two distillation columns operating at different pressures. This work focuses on the selection of suitable cryogenic air separation process by evaluating seven alternative designs of the two-column air separation process based on detailed exergy analysis. The feed conditions (500 tons/h, and 50% relative humidity of air), product purities (99 mole% for both nitrogen and oxygen), and operational conditions (pressures of both distillation columns) are kept same in all designs. The two cryogenic distillation columns in each configuration are heat-integrated to eliminate the need for external utilities. Steady-state simulation results are used to calculate the exergy efficiency (%) of each equipment as well as its contribution toward the overall exergy destruction rate (kW) of the process. The results show that the compression section is a major source of exergy destruction, followed by the low-pressure column, and the multi-stream heat exchanger. A Petlyuk-like configuration, labeled as C1, provides the lowest exergy destruction rate.

1. Introduction
Oxygen is widely used in chemical industry including steel and semi-conductor production, food processing, and healthcare [1,2]. Nitrogen is used mainly as a reactant for ammonia production and as an inert gas in various industrial processes [3,4]. On commercial scale, these gases are produced from the separation of air. The operation of air separation units (ASU) can be broadly classified into two categories, namely, non-cryogenic and cryogenic air separation processes. Non-cryogenic techniques for air separation include pressure swing adsorption (PSA) and membrane-based systems. These processes are relatively simple in operation; however, their major drawbacks are scalability and relatively lower quality of product gases [5,6,7]. Cryogenic processes, though complex in nature, are more efficient and cost-effective. They are widely applied on industrial scale for production of high-purity oxygen and nitrogen gases from air [5,6,8,9,10].
Many alternative designs of the cryogenic air separation process have been reported in literature. These include process designs based on 1, 2, and 3 distillation columns. The one-column process is the simplest design to produce high-purity oxygen and nitrogen from air. However, it offers somewhat limited opportunities for heat integration in the process and is rarely used in industrial practice [11]. The three-column air separation process is a relatively complex design and usually employed only when in addition to high-purity oxygen and nitrogen, separation of argon is also required [12]. The most widely used process for industrial-scale air separation is based on a two-column design. These columns are operated at different pressures, and are thermally coupled through additional compressors, expanders, and/or heat exchangers in order to reduce the overall utility requirements for the process [13].
The major drawback of cryogenic air separation processes is their significantly higher energy requirement. To overcome this issue, the cryogenic process is generally highly heat-integrated to reduce and possibly eliminate the use of external utilities. This is generally achieved by (1) adjusting the pressures of the distillation columns such that there is a positive temperature difference driving force for heat transfer from the condenser of the high-pressure column to the reboiler of the low-pressure column, (2) adjusting the feed rates to the distillation columns such that the duty of the condenser of the high-pressure column is balanced with the duty of the reboiler of the low-pressure column, and (3) using cold products from the process to precool and liquify the incoming feed air in multi-stream heat exchangers before feeding the distillation columns. The heat-integrated air separation process requires up to 40% less energy than the non-heat-integrated process [6,14]. The cryogenic air separation process can also be heat-integrated with other processes. Examples of such externally coupled processes include integrated gasification combined cycle (IGCC) [1], oxy-fuel combustion [15], and liquified natural gas (LNG) regasification [16].
Castle [6] reviewed recent advancements in air separation and liquefaction processes and identified capital cost, technology selection and upgradation, and process integration as important factors for future design. Smith and Klosek [8] reviewed various air-separation processes based on startup time, economic range, % purity limit (that is, the maximum purity which can be economically produced using the specific technology), and the ability to simultaneously produce byproducts and concluded that the cryogenic process is generally the most suitable choice for large-scale applications. They have also reported various schemes for heat integration within ASU for improving overall efficiency and reducing the operational costs of the system.
Cryogenic distillation of air is frequently carried out in a two-column process configuration [17]. The columns operate at different pressures—low-pressure (LP) and high-pressure (HP) columns—and are tightly heat-integrated to minimize the operational cost and to maintain the very low process temperatures. Multi-stage compressors are used to increase the pressure of the feed air, followed by liquefaction using multi-stream heat exchangers (MHEX). The liquefied air is fed to the distillation columns for the separation of nitrogen and oxygen. High-purity oxygen is obtained from the bottom of the LP column, whereas high-purity nitrogen may be obtained either from the top of the LP column or from the top of both the LP and HP columns [18,19,20]. These products are used to liquefy the feed air in the MHEX and then compressed to the next facility for applications.
Because of the complex heat integration, many configurations of the two-column air separation process have been reported in literature. For example, the liquefied air may be directly fed to the HP column [21], or the liquefied air may be split and both fractions fed to the HP column [3], or the liquefied air may be split and split-fed to both columns [22]. These configurations not only have different flowsheet topologies, but they also differ in terms of the factors already described above [8,23]. For example, Mehrpooya and Zonouz [24] demonstrated that installing phase separators before introducing feed into the LP column results in up to 16% decrease is power consumption without compromising the purity of the products. Khalel et al. [25] compared two alternative designs for the two-column ASU. In one configuration, a turbine was used to reduce the pressure of air, whereas in the alternative configuration, the turbine was replaced by a flash vessel. The reported power consumption and the specific power consumption of the latter configuration were 8% and 20% lower, respectively. Furthermore, the flash-vessel-based design produced 5.5% less waste nitrogen, 5.4% more high-purity nitrogen, and 14.3% more high-purity oxygen.
Exergy is defined as the maximum available work, which can be obtained by bringing a system to equilibrium with its environment [26]. Exergy analysis based on the second law of thermodynamics is a useful technique for identifying the causes and effects of irreversibility in a process and ultimately leads to improved process design through better utilization of energy resources. In recent years, exergy analysis has been increasingly used to evaluate the performance of various chemical processes and to compare alternative process designs [27,28,29,30].
Agrawal and Woodward [31] performed exergy analysis of a two-column ASU and reported that LP column and MHEX contribute significantly toward total exergy destruction. The reported exergy destruction rate was 2.2 kJ/mol(N2). The exergy destruction rate in the LP column was reduced by 9% by installation of an intermediate heat exchanger in the LP column. As a result, the overall exergy efficiency of the process increased from 36% to 38%. Cornelissen and Hirs [32,33] reported an overall exergy efficiency of 28% and an exergy destruction rate of 15.57 kJ/mol(air) for the two-column ASU. They reported that the liquefaction (that is, the MHEX) and the compression sections are largely responsible for exergy destruction in the process. Yong et al. [34] reported an overall exergy destruction rate of 2.03 kJ/mol(air) for an improved two-column ASU and identified the MHEX and the distillation columns as major sources of exergy destruction in the process. Van der Ham and Kjelstrup [1] reported an overall exergy destruction rate of 4.76 kJ/mol(air) and an overall exergy efficiency of 35% for the two-column ASU. Almost one-third of the total exergy destruction (1.6–2.0 kJ/mol(air)) occurred in the cold section (that is, the MHEX). The compression and distillation sections were identified as other major sources of exergy destruction in the process. Fu and Gundersen [21] compared two, two-column ASU configurations based on energy and exergy analysis, and reported that up to 10% less energy was required for the configuration with dual reboilers for the LP column, which permitted operation at lower compression ratio. The compression and distillation sections were identified as the most important sources of exergy destruction. Rizk et al. [35] showed that up to 23% less exergy destruction occurred in a diabatic two-column ASU compared to an adiabatic two-column ASU. This improvement was attributed to a lower pressure of the HP column and hence lower power requirement in the compression section. Khalel et al. [36] reported that the two-column ASU configuration with a flash separator had up to 4% higher exergy efficiency and 8% lower energy consumption than the alternative configuration with a turbine. Using exergy analysis, Ebrahimi et al. [3] reported that the two-column ASU becomes economically feasible for oxygen production capacities greater than 9 kg/s.
Because of the high refrigeration costs involved in the cryogenic process, it is important to identify the most suitable configuration for a given separation target. While many alternative two-column ASU configurations have been reported in literature, a fair comparison between the reported studies is not possible because of the use of different basis (that is, feed and product flowrates), different operating conditions (that is, pressures of the LP and HP columns), and different separation targets (that is, purities of the oxygen and nitrogen products).
Through a closer look at the two-column ASU configurations reported in literature, we were able to identify seven unique designs. The main objective of this work is to identify the most suitable two-column ASU configuration by evaluating these seven alternatives based on exergy analysis. To allow a fair comparison, the feed conditions, product purities, and operational conditions are kept same in all designs. The process flowsheets are developed and simulated using Aspen Plus® V10. The steady-state simulation results are used to calculate the exergy efficiency (%) of individual components as well as its contribution toward total exergy destruction rate.
2. Model Development
In this study, the following parameters/assumptions are fixed for all seven ASU configurations:
- Steady state
- Flowrate of air = 500 tons/h (1 ton = 1000 kg = 1 Mg)
- Humidity of air = 50%
- Composition of air: 76.87% N2, 20.62% O2, 0.92% Ar, 1.56% H2O, 0.03% CO2
- Isentropic efficiency of compressor = 72%
- Isentropic efficiency of pump = 80%
- Pressure drop across heat exchanger = 10 kPa
- Approach temperature in heat exchanger = 10 °C
- Number of stages in HP column = 60
- Number of stages in LP column = 60
- Pressure of HP column = 5.6 bar
- Pressure of LP column = 1.5 bar
- Total pressure drop in HP column = 0.2 bar
- Total pressure drop in LP column = 0.3 bar
The steady-state simulation models have been developed using Aspen Plus® V10 using Peng–Robinson property package. Each compression stage is modeled using a combination of COMPR (for compressor), HEATX (for intercooler and aftercooler), and FLASH2 (for knockout drum) blocks. Adsorbers for the removal of carbon dioxide and residual moisture are modeled using SEP blocks. Distillation columns are modeled using RADFRAC blocks with equilibrium trays. Pressure reduction between different unit operations is simulated using VALVE blocks.
2.1. ASU Configuration C1
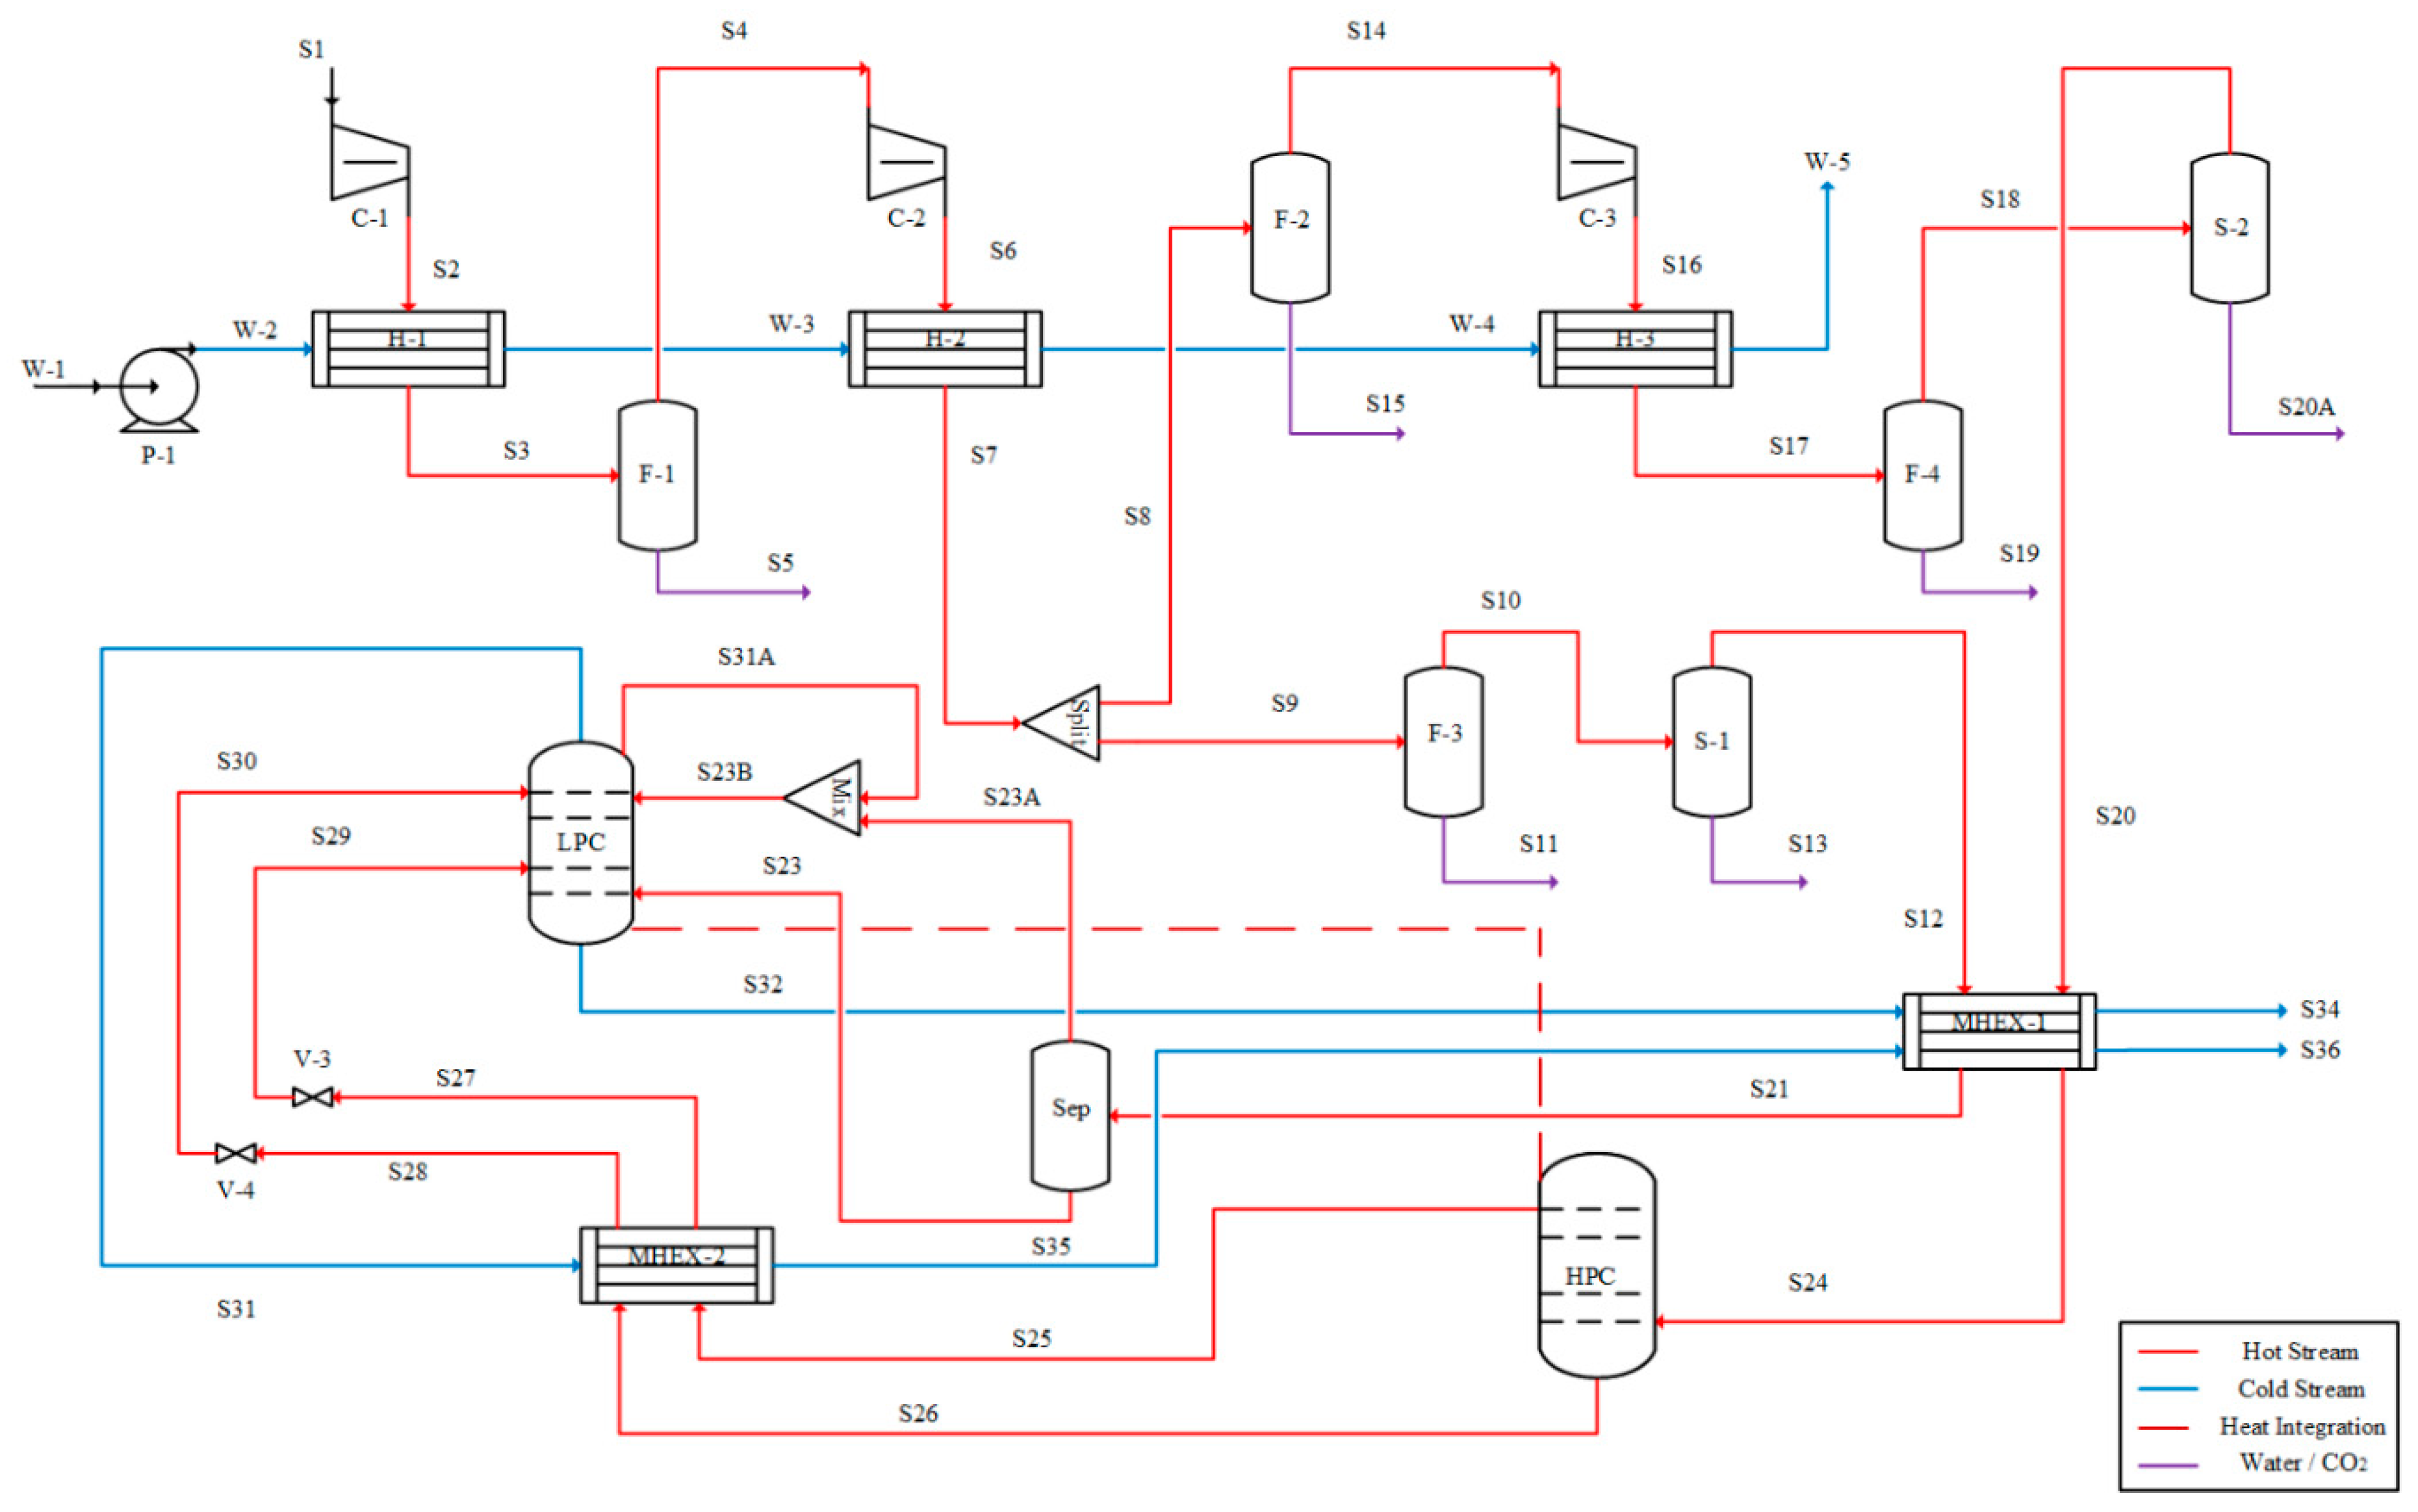
The schematic diagram of the ASU configuration C1 is presented in Figure 1 [3]. The pressure of the feed air is increased using a multi-stage compressor. Each compression stage includes a compressor, a water-cooled inter-stage cooler, and a flash separator. The compression of the feed air results in an increase in its temperature. The compressed air is first cooled in the inter-stage cooler and then sent to the flash separator for the removal of condensate. In the configuration C1, the air is split into two fractions after the 2nd stage of compression. One fraction (S8) is further compressed using the 3rd stage of compression, followed by the removal of carbon dioxide and residual moisture from the air using the adsorber (S-2). The second fraction (S9) is directly sent to the adsorber (S-1) for the removal of carbon dioxide and residual moisture. The two streams leaving the compression section (S12 and S20) are thus at different pressures. They enter the 1st multi-stream heat exchanger (MHEX-1) where they are cooled and liquified using the products coming from the distillation section.
The liquified air streams (S21 and S22) are fed to the HP column for first phase of separation. The products of the HP column (S25 and S26) are then fed to the 2nd multi-stream heat exchanger (MHEX-2), where they are further cooled through heat exchange with the high-purity nitrogen coming from the top of the LP column (S31). The cooled streams leaving the MHEX-2 (S27 and S28) are then fed to the LP column for final phase of separation. The top product from the LP column is 99% pure gaseous nitrogen, which is used to cool the incoming feed streams in MHEX-2 and MHEX-1, respectively. The bottom product from the LP column is 99% pure liquid oxygen, which is used to cool the incoming feed streams in MHEX-1. The HP and LP columns are heat-integrated in a way that the reboiler duty for the LP column is same as the condenser duty for the HP column. Because of heat exchange in MHEX-1 and MHEX-2, both nitrogen and oxygen products (S34 and S36) are obtained in gaseous form. Steady-state simulation results for the configuration C1 are summarized in Table 1.
2.2. ASU Configuration C2
The schematic diagram of the ASU configuration C2 is presented in Figure 2 [37]. The key difference between configurations C1 and C2 is that in configuration C2 high-purity oxygen product is taken from the bottoms of the LP column in gaseous form. Steady-state simulation results for the configuration C2 are summarized in Table 2.
2.3. ASU Configuration C3
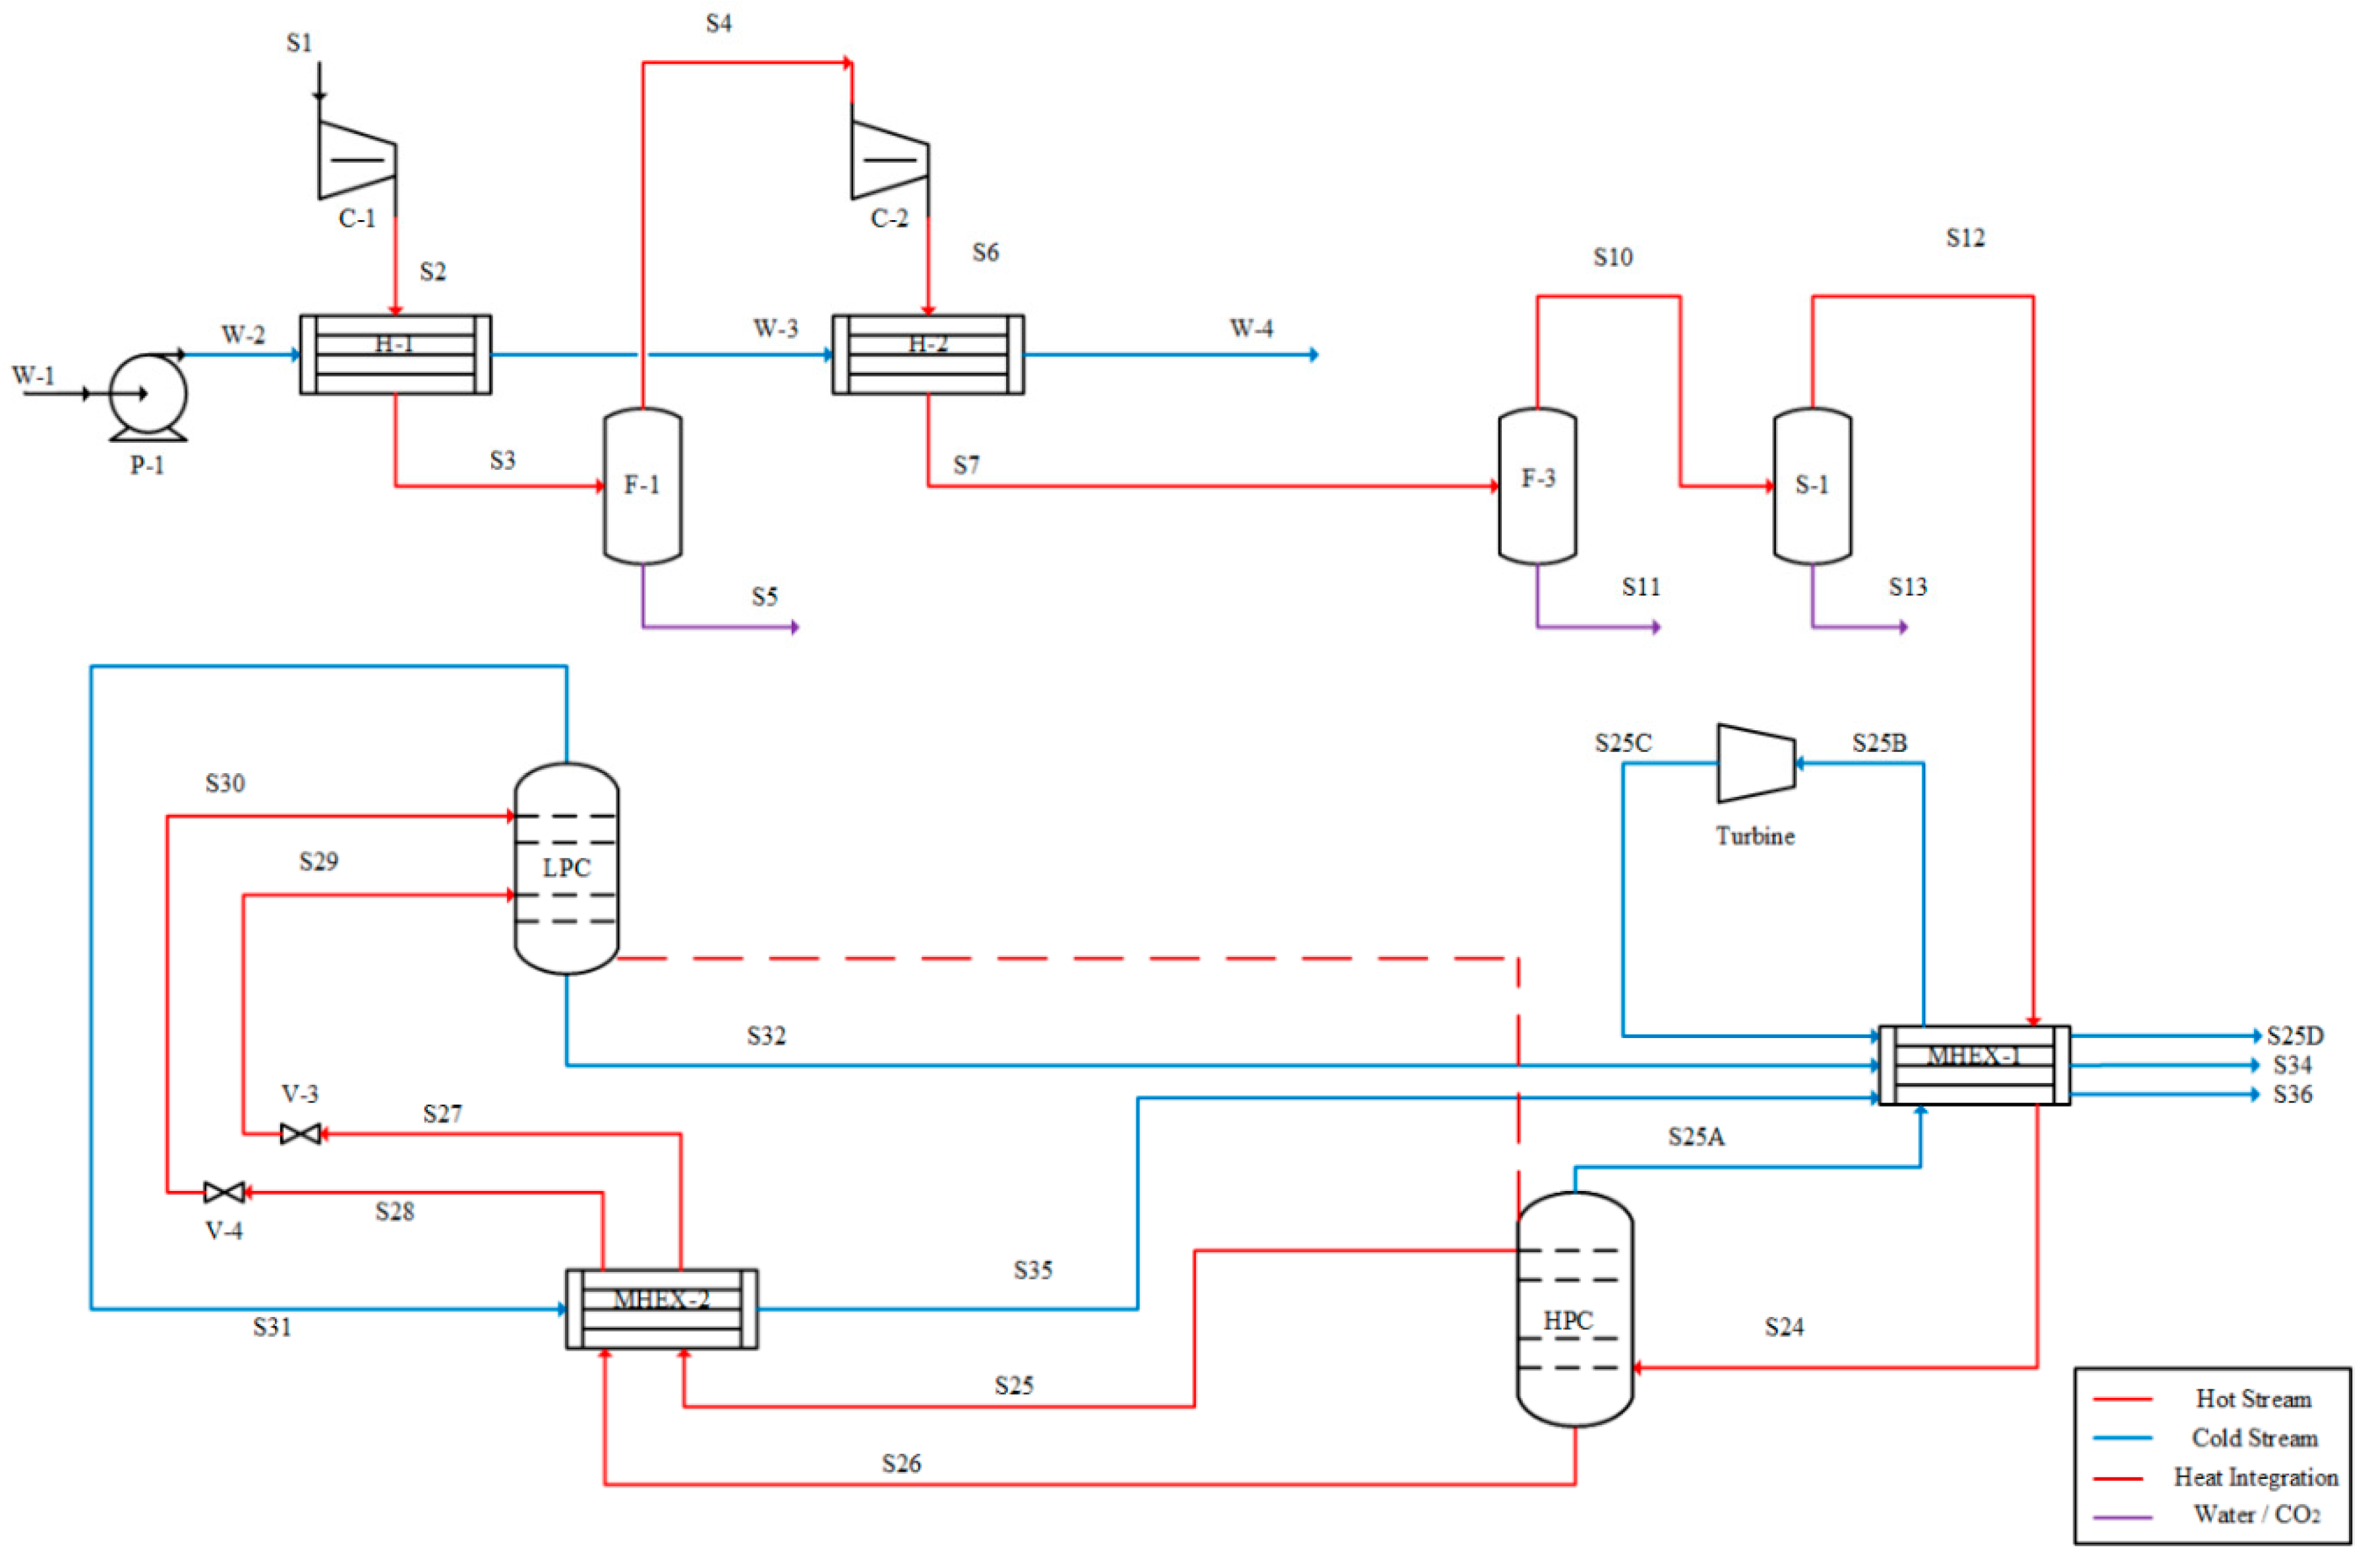
The schematic diagram of the ASU configuration C3 is presented in Figure 3 [25]. In this configuration, one liquified air stream (S21) from MHEX-1 is expanded in a turbine and then fed to the LP column. The other liquified air stream (S24) is fed to the HP column as in configurations C1 and C2. Steady-state simulation results for the configuration C3 are summarized in Table 3.
2.4. ASU Configuration C4
The schematic diagram of the ASU configuration C4 is presented in Figure 4 [25]. In this configuration, the turbine of configuration C3 is replaced with a flash separator. The liquid from the bottom of this separator is directly fed to the LP column. The vapor from the top of this separator is mixed with the vapor from the top of the LP column and fed to the LP column at an intermediate stage. Steady-state simulation results for the configuration C4 are summarized in Table 4.
2.5. ASU Configuration C5
The schematic diagram of the ASU configuration C5 is presented in Figure 5 [21]. Unlike configurations C1–C4, the air feed is not split in this configuration. Instead, the complete air stream (S12) is sent to the MHEX-1 and HP column after the second stage of compression. Second, a fraction of the vapor from the top of the HP column (S25A) is expanded in a turbine to recover its cold and pressure exergy. Steady-state simulation results for the configuration C5 are summarized in Table 5.
2.6. ASU Configuration C6
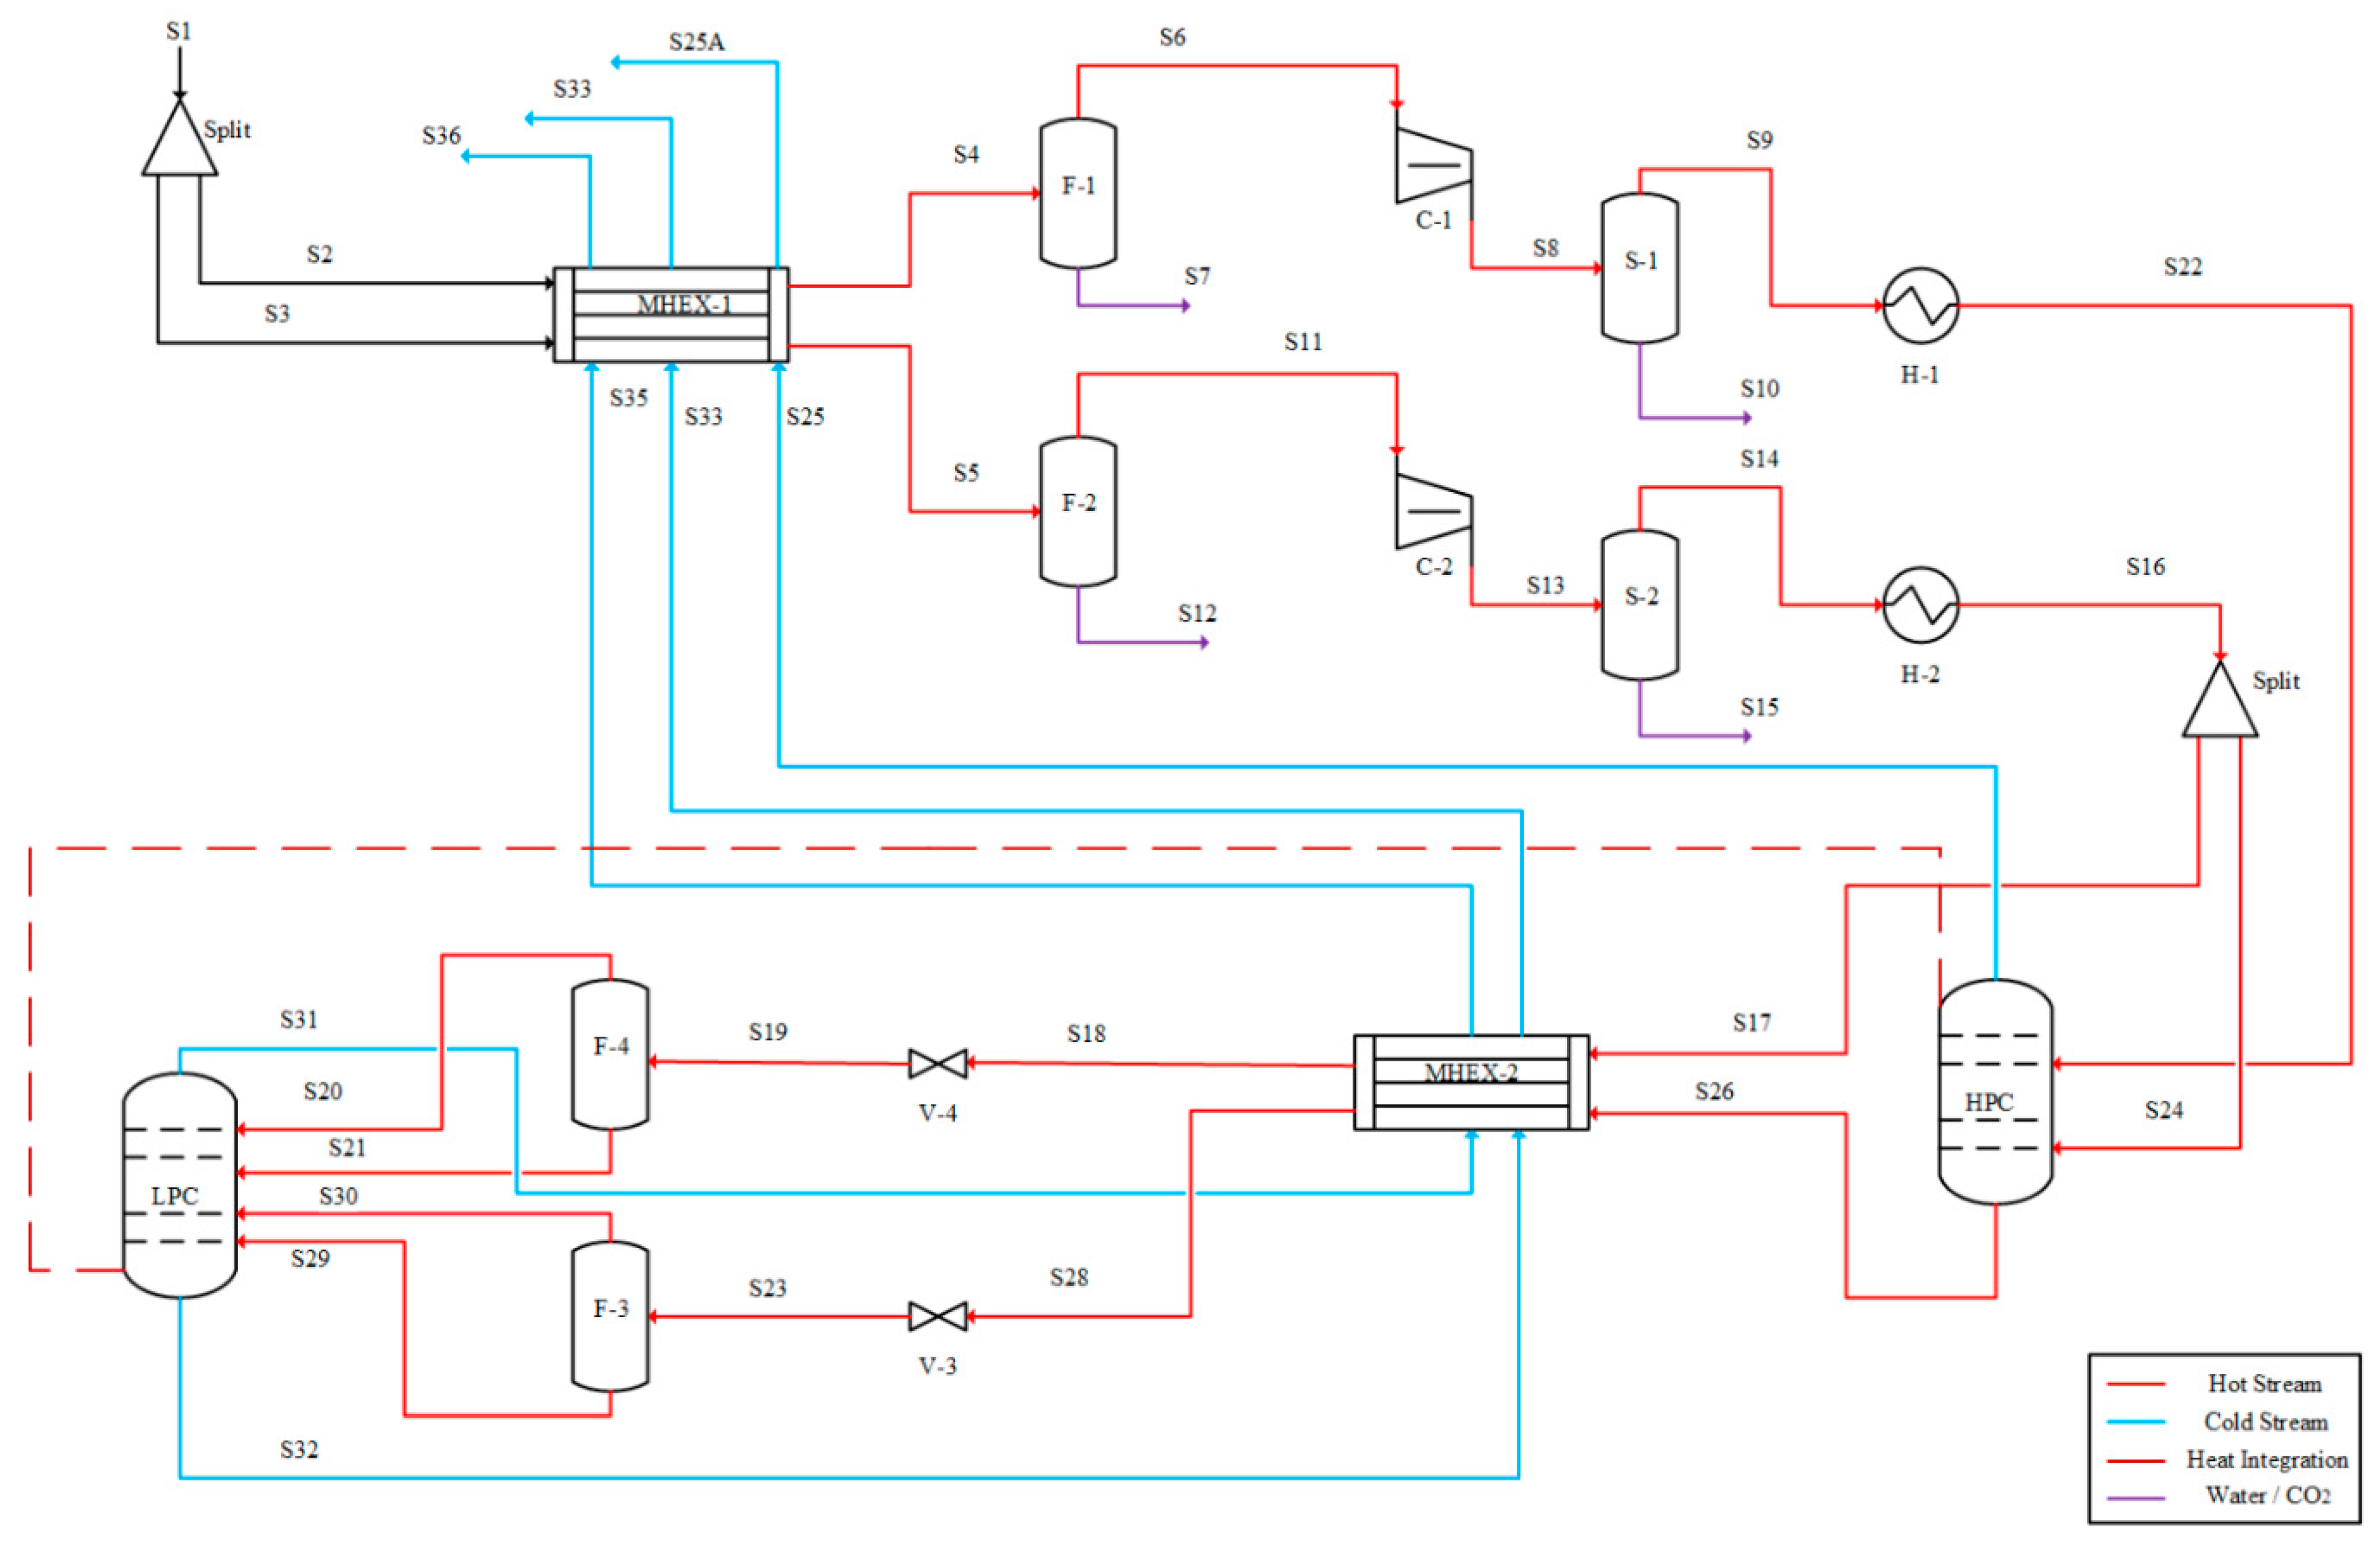
The schematic diagram of the ASU configuration C6 is presented in Figure 6 [38]. In this configuration, the feed air is essentially split into three fractions; two (S22B and S24) are fed to the HP column whereas the third fraction (S17) is fed to the LP column after expansion in a turbine. Moreover, the nitrogen product is taken from the top of the HP column (S25). The top vapor from the LP column (S31) in this configuration is ca. 80% nitrogen and is essentially a waste stream. The oxygen product is taken from the bottom of the LP column (S32) as in configurations C1–C5. Steady-state simulation results for the configuration C6 are summarized in Table 6.
2.7. ASU Configuration C7
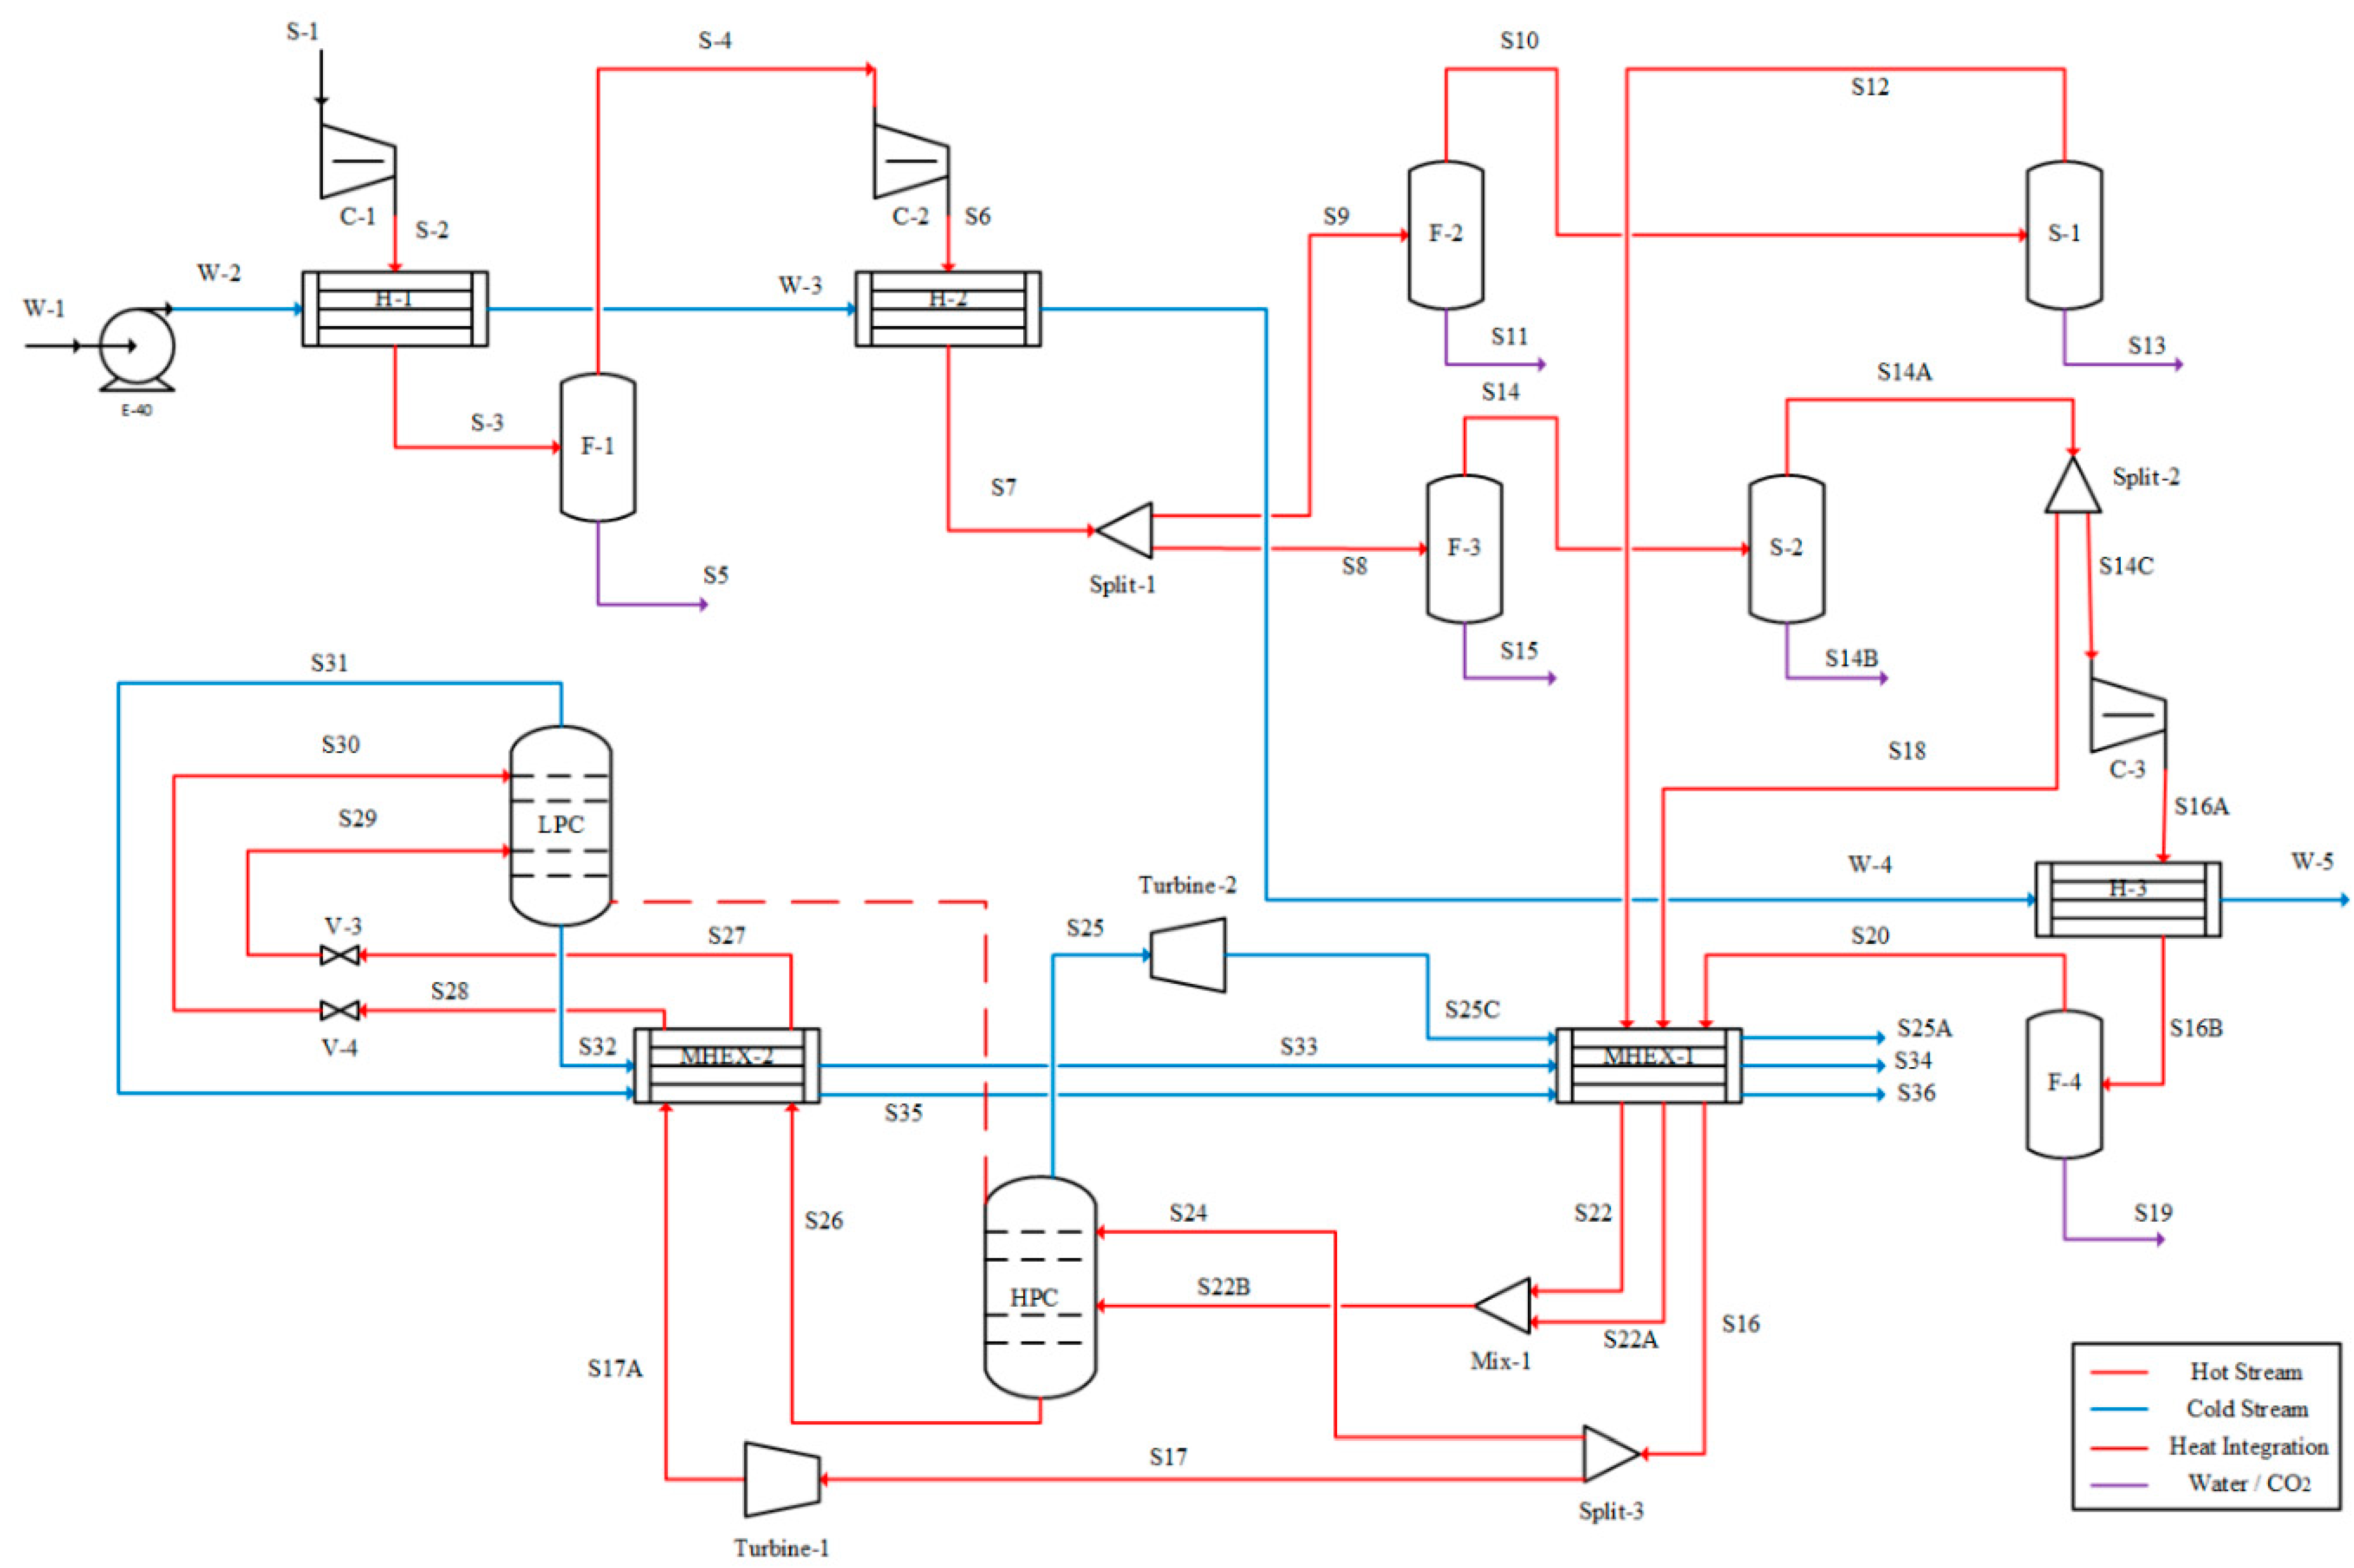
The schematic diagram of the ASU configuration C7 is presented in Figure 7 [22]. In this configuration, the feed air is initially split and cooled to cryogenic temperature in MHEX-1 before compression. One fraction (S22) is directly fed to the HP column, whereas the other fraction is further split and fed to both HP (S24) and LP (S17) columns. Additional flash separators are installed before feeding the LP column and vapor and liquid outputs from these separators are introduced at different stages. High-purity nitrogen product (S25) is obtained from the top of the HP column. The top vapor from the LP column (S31) in this configuration is ca. 90% nitrogen and is essentially a waste stream. The oxygen product is taken from the bottom of the LP column (S32) as in configurations C1–C6. Steady-state simulation results for the configuration C7 are summarized in Table 7.
Table 8 summarizes the location of feed stages (numbered from top) for HP and LP columns in all configurations studied here.
2.8. Exergy Analysis
The total molar exergy of a stream includes physical, chemical, kinetic, and potential molar exergies. Potential and kinetic exergies are generally insignificant (less than 0.5% of the total exergy flow) and not considered here [1,19]. The total molar exergy is therefore calculated using Equation (1):
The physical molar exergy of a mixture can be computed using its molar entropy (s) and molar enthalpy (h) under actual conditions and its molar entropy (so) and molar enthalpy (ho) at reference conditions (Po = 1 atm and To = 298.15 K):
The chemical molar exergy of a mixture can be calculated from the standard chemical exergies of its components () and respective mole fractions (xi): [1]
3. Results and Discussion
For analysis of exergy efficiency and exergy destruction, the process is divided into the following sections:
- Compression: compressors, inter-stage coolers, water pump, flash separators, and adsorber for water and carbon dioxide removal
- MHEX: multi-stream heat exchanger
- LP column: low-pressure column
- HP column: high-pressure column
- Others: turbines, flash separators (excluding those in compression section), valves, and oxygen pump (when applicable)
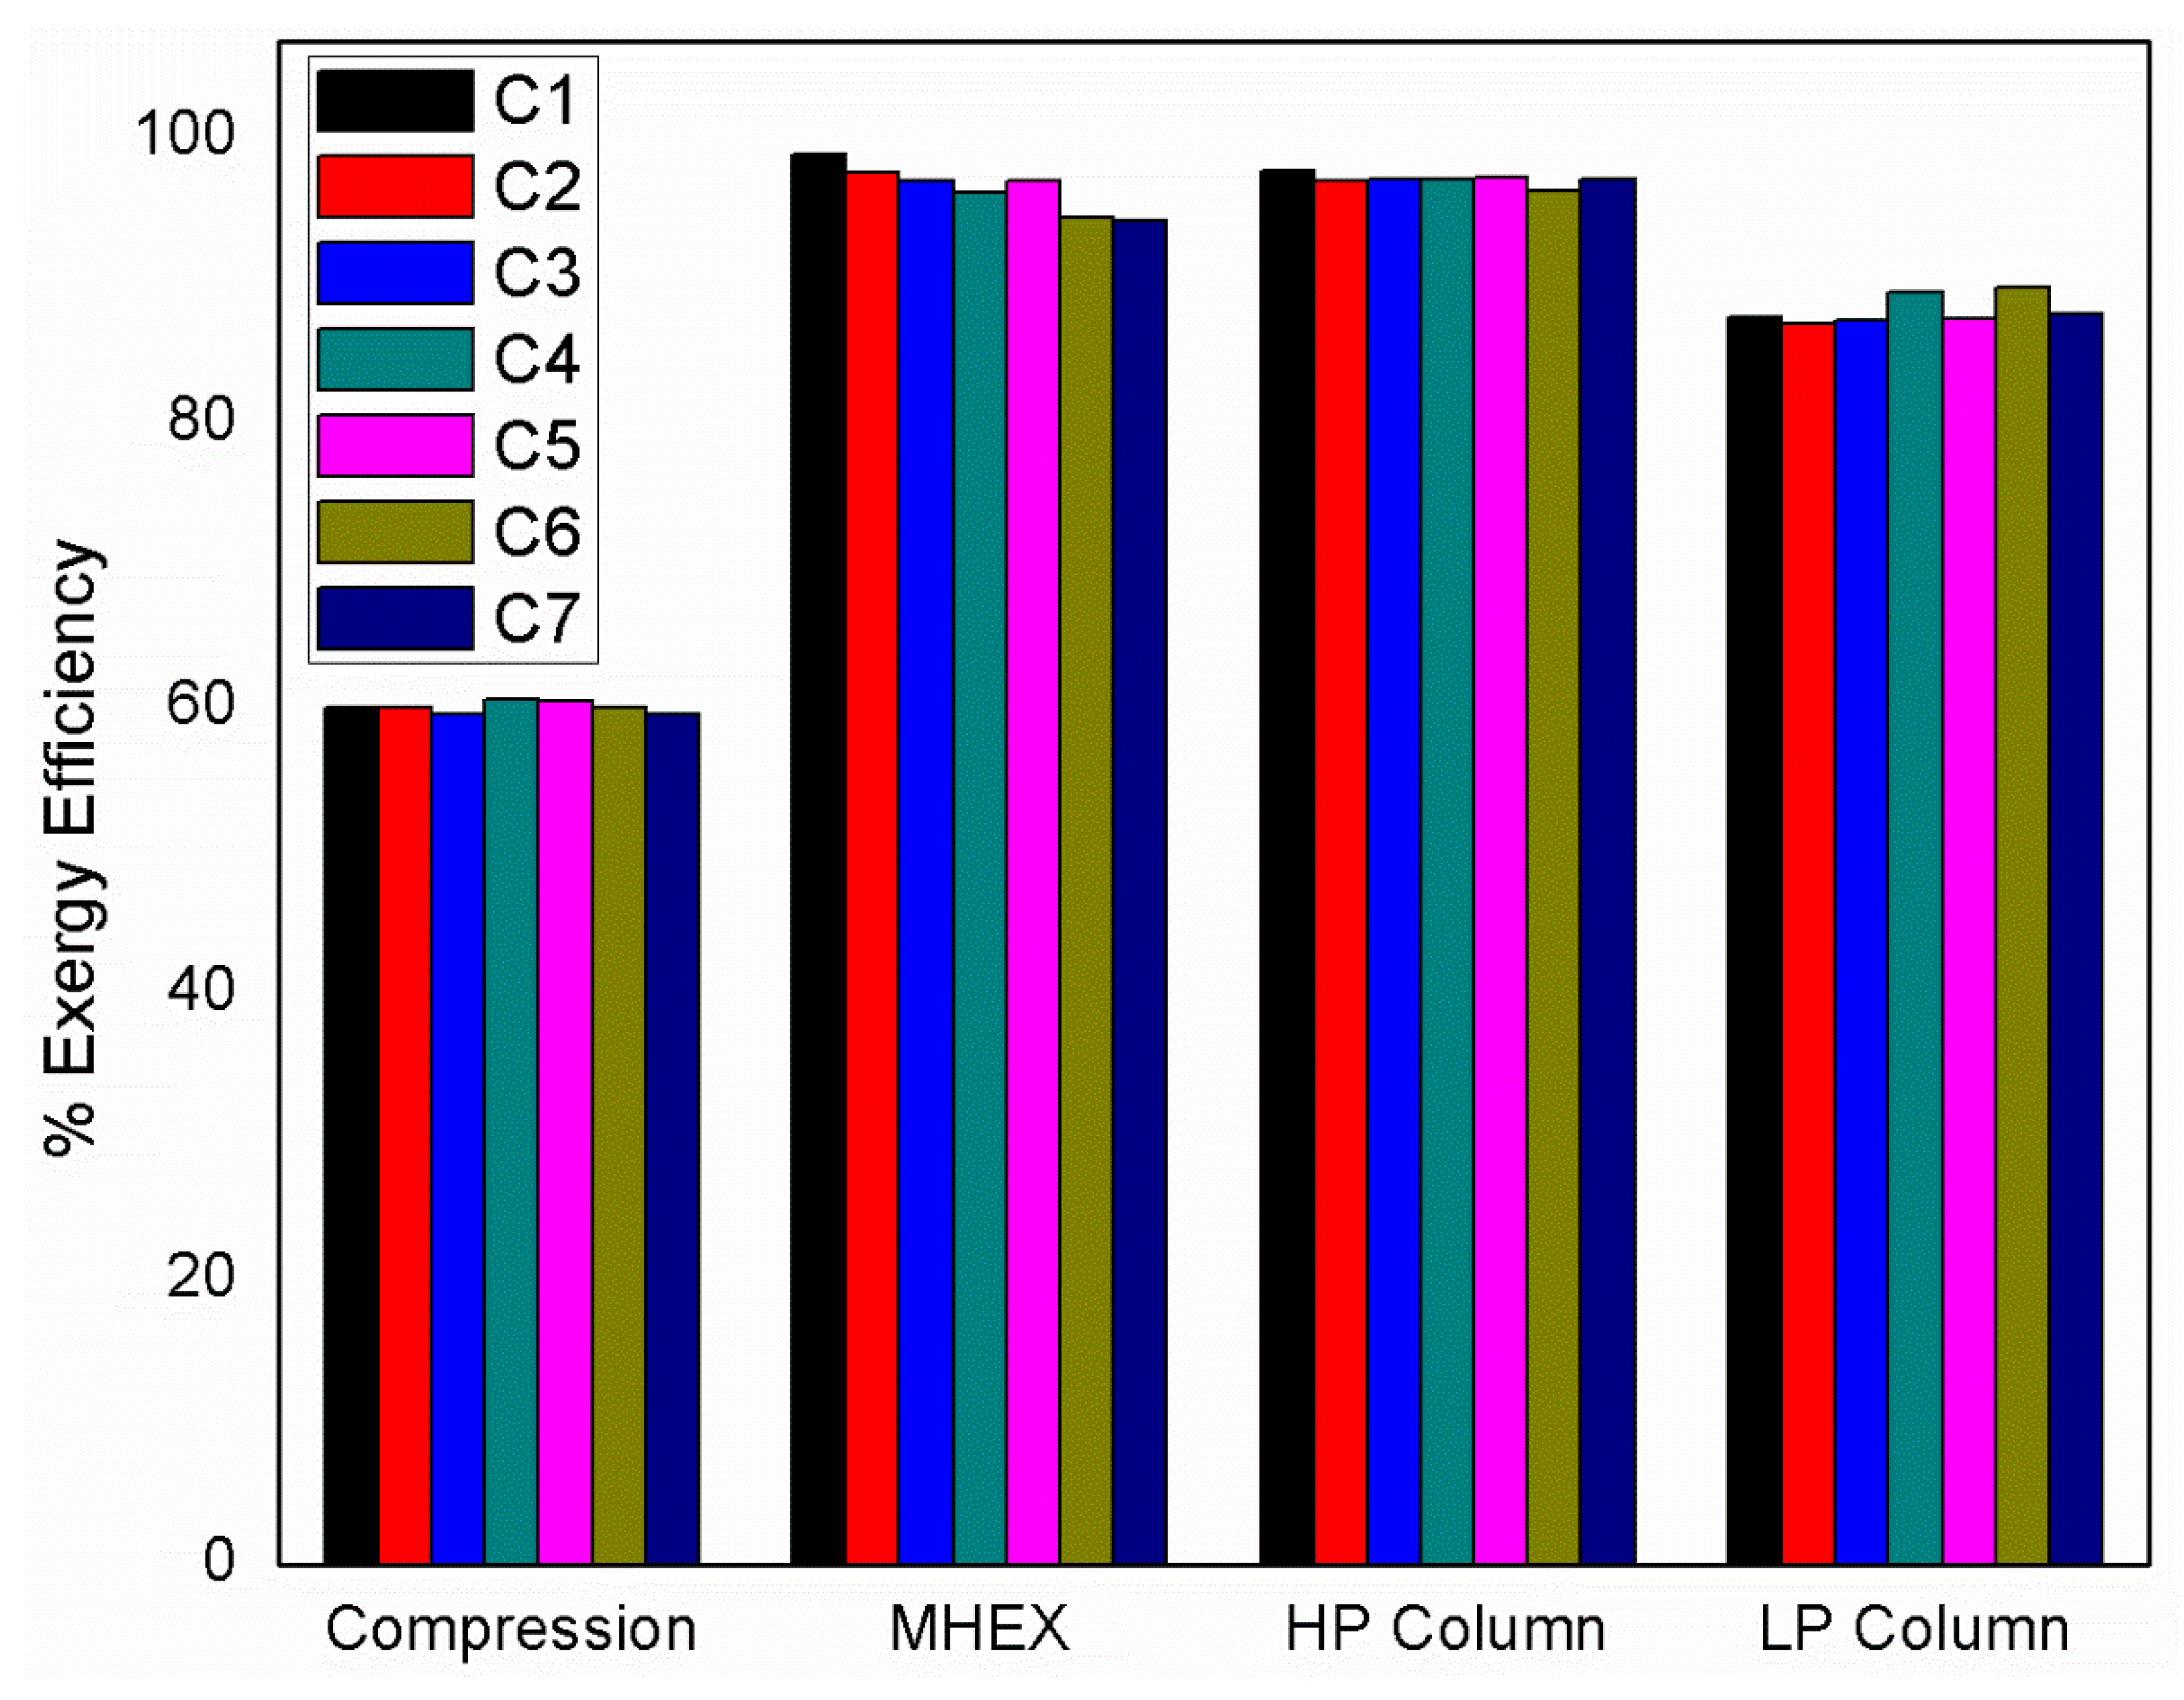
Steady-state simulation results have been used to calculate the exergy flows and exergy destruction rates for each configuration. Exergy efficiencies of individual equipment in configurations C1–C7 are presented in Table 10. A summary of section-wise exergy efficiency of the system is presented in Figure 8. The analysis shows that MHEXs have relatively higher exergy efficiencies, because they operate with minimal temperature difference driving force between cold and hot streams. Similarly, the HP column in all configurations has higher exergy efficiency than the respective LP column. This is because the HP column provides only crude separation whereas the LP column is responsible for final separation causing extensive exergy destruction. In all configurations, the compression section is the least exergy efficient. This is because compression followed by inter-stage cooling with finite temperature difference driving force causes significant irreversibility and hence higher exergy destruction rate.
Some anomalies are also observed in Table 10, especially for configuration C7. Here, the exergy efficiencies of compressors (C-1 and C-2) are relatively low because the feed air being compressed is at cryogenic temperature. Similarly, the exergy efficiency of heat exchanger H-2 is relatively low because of the large temperature change required for the air being cooled. Moreover, the exergy efficiency of MHEX-1 is relatively low because it operates with considerably larger temperature difference driving forces than all other configurations. Finally, the relatively high exergy efficiency of the turbine/expander in configuration C5 can be attributed to the absolute temperatures of the inlet and outlet streams being higher than encountered in other configurations.
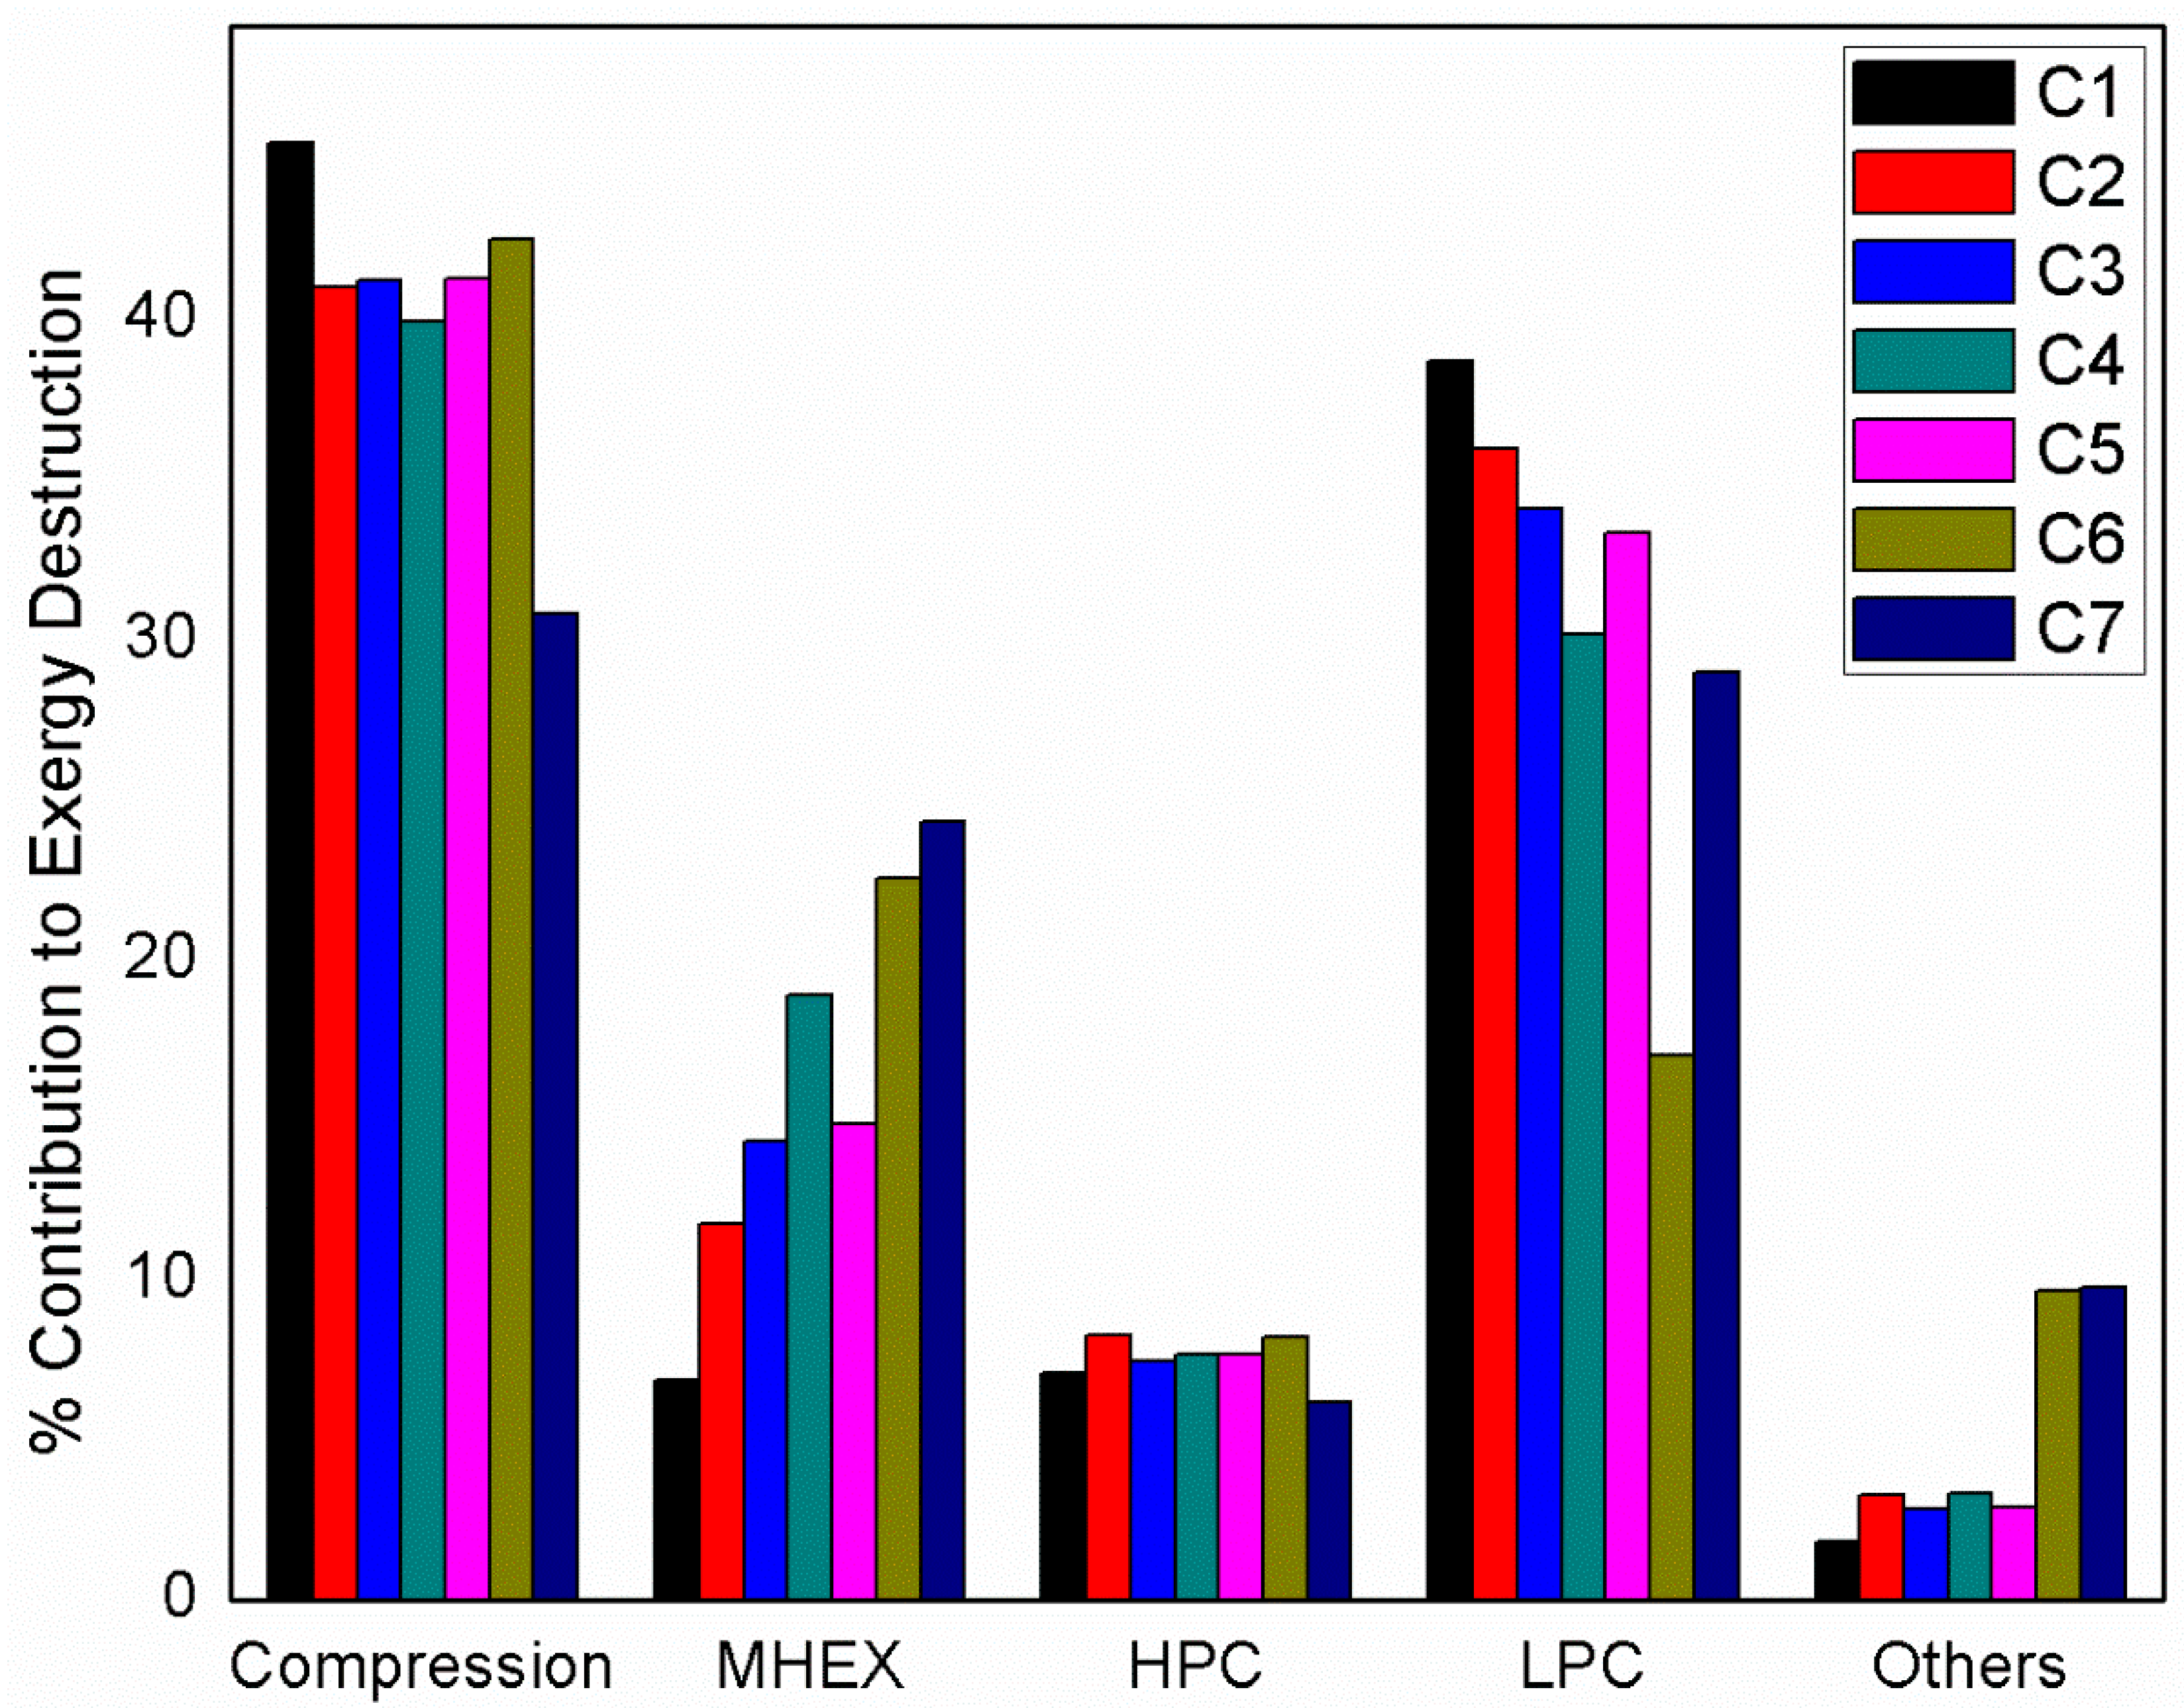
Figure 9 shows a summary of the percent contribution of each section to the overall exergy destruction in each configuration. In all configurations, the compression section is responsible for most exergy destruction, ranging from 30.8% in configuration C7 to 45.5% in configuration C1. In configurations C1–C5 and C7, the LP column is the second largest source of exergy destruction and is responsible for 29.0% (C7) to 38.7% (C1) of the total exergy destruction in the process. Only in configuration C6, MHEX has a higher exergy destruction rate (22.6%) than the LP column (17.0%). In configurations C2–C5 and C7, the MHEX is the third largest source of exergy destruction and is responsible for 11.7% (C2) to 24.3% (C7) of the total exergy destruction in the process. Only in configuration C1, the HP column has a higher exergy destruction rate (7.1%) than the MHEX (6.8%). In configurations C2–C5, the HP column ranks 4th in terms of exergy destruction rate and is responsible for 7.5% (C3) to 8.3% (C2) of the total exergy destruction in the process. In configurations C1–C5, the contribution of the “Others” section to the total exergy destruction is 3% or less. Only in configurations C6 and C7, these equipment cause more exergy destruction (ca. 9.6–9.8%) than the HP column and rank 4th.
A deeper look into the exergy destruction rates of individual equipment reveals important information for future process improvement. For example, in configuration C1, the total exergy destruction in the compression section is 14.82 MW (45.49% of the total exergy destruction in the process). The three compressors and the corresponding inter- and aftercoolers are collectively responsible for exergy destruction of 7.48 MW and 7.05 MW, respectively. Since none of these equipment causes any change in chemical composition, this exergy destruction is primarily because of the physical exergy component, and its origin can be traced back to the practical limitations of equipment efficiency and driving forces. For example, if the compressor efficiency were 90%, instead of the presently assumed 72%, the combined exergy destruction rate in compressors would be reduced to 2.52 MW (66.3% reduction). Similarly, if the inter- and aftercoolers could be designed and operated with a minimum approach temperature of 5 °C, instead of the presently assumed 10 °C, the combined exergy destruction rate in these coolers would be reduced to 3.34 MW (52.6% reduction). The same principle can also be extended to the MHEX. For example, in configuration C7, the MHEX is moved before the compression section. As a result, heat exchange in this exchanger takes place under large temperature difference driving force, leading to larger exergy destruction than other configurations.
Based on the total exergy destruction rate (MW), the configuration C1 has been identified as the most efficient process design. The overall ranking of all configurations is as follows:
C1 (32.58) < C6 (33.85) < C4 (34.02) < C5 (34.04) < C3 (35.13) < C7 (36.04) < C2 (36.39)
We reiterate that the equipment and the process configurations that operate with smaller driving forces are more exergy efficient. However, this attribute is generally in conflict with the economic considerations, e.g., the need to reduce the number and the size of the equipment. A prudent approach to process design and optimization should aim at striking a balance between these two conflicting objectives.
4. Conclusions
Seven alternative configurations of the two-column air separation process were examined based on the detailed exergy analysis. The results show that the compression section is the largest source of exergy destruction in the air separation process and is responsible for up to 46% of the total exergy destruction. The LP column is responsible for up to 39% of the total exergy destruction in the process. The combined contribution of the multi-stream heat exchangers, the HP column, and all other equipment in the process is generally between 20% and 30%. Overall, a Petlyuk-like configuration (labelled C1 here), where the air feed is split into two fractions, both fed to the HP column, and where both products are obtained from the LP column, appears to be the most exergy-efficient design for the air separation process.
At an equipment level, most exergy destruction in the cryogenic air separation process is of physical nature and can be reduced by developing high-efficiency equipment. An increase in isentropic efficiency of compressors from 0.72 to 0.90 can reduce their exergy destruction by 66%. Similarly, if the inter- and aftercoolers of compressors were replaced with more compact and efficient heat exchangers that could operate with an approach temperature of 5 °C instead of the more typical 10 °C, the corresponding exergy destruction would be reduced by 52%.
Author Contributions
Conceptualization, M.F. and N.R.; methodology, M.F. and M.H.H.; software, M.H.H. and M.F; validation, M.H.H., M.H., and M.F.; formal analysis, M.H.H.; investigation, M.H.H.; resources, M.F. and N.R.; data curation, M.H.; writing—original draft preparation, M.H.H.; writing—review and editing, M.F. and M.H.; visualization, M.H.; supervision, M.F. and N.R.; project administration, M.F.; funding acquisition, M.F. and N.R. All authors have read and agreed to the published version of the manuscript.
Funding
This research received no specific external funding.
Acknowledgments
The authors gratefully acknowledge the financial support provided by the SNGPL Chair of Gas Engineering at the Department of Chemical Engineering, University of Engineering & Technology, Lahore.
Conflicts of Interest
The authors declare no conflict of interest.
Nomenclature
| ASU | Air separation unit |
| Ei | Exergy of inlet stream (kW) |
| Eo | Exergy of outlet stream (kW) |
| Eq | Exergy extracted from heat flow (kW) = Q (To/T − 1) [39] |
| Ed | Exergy destruction (kW) |
| HP Column | High-pressure column |
| LP Column | Low-pressure column |
| MHEX | Multi-stream heat exchanger |
| P | Pressure (bar) |
| Po | Reference pressure (bar) |
| R | Gas constant |
| T | Temperature (°C) |
| To | Reference temperature (°C) |
| xi | Mole fraction of component, i |
| W | Work produced (turbine) or work consumed (compressor and pump) |
| Greek Letters | |
| ε | Exergy efficiency (%) |
| Physical exergy (kW) | |
| Chemical exergy (kW) | |
| Total exergy (kW) | |
References
- van der Ham, L.V.; Kjelstrup, S. Exergy analysis of two cryogenic air separation processes. Energy 2010, 35, 4731–4739. [Google Scholar] [CrossRef]
- Dominic, S.; Maier, U. Dynamic Modeling and Simulation of Compressor Trains for an Air Separation Unit. IFAC Proc. Vol. 2014, 47, 432–437. [Google Scholar] [CrossRef]
- Ebrahimi, A.; Meratizaman, M.; Akbarpour Reyhani, H.; Pourali, O.; Amidpour, M. Energetic, exergetic and economic assessment of oxygen production from two columns cryogenic air separation unit. Energy 2015, 90, 1298–1316. [Google Scholar] [CrossRef]
- Chang, L.; Liu, X.; Dai, L.; Sun, Y. Modeling, Characteristic Analysis, and Optimization of Ideal Internal Thermally Coupled Air Separation Columns. Ind. Eng. Chem. Res. 2012, 51, 14517–14524. [Google Scholar] [CrossRef]
- Thorogood, R.M. Developments in air separation. Gas Sep. Purif. 1991, 5, 83–94. [Google Scholar] [CrossRef]
- Castle, W.F. Air separation and liquefaction: Recent developments and prospects for the beginning of the new millennium. Int. J. Refrig. 2002, 25, 158–172. [Google Scholar] [CrossRef]
- Fu, Q.; Zhu, L.; Chen, X. Complete Equation-Oriented Approach for Process Analysis and Optimization of a Cryogenic Air Separation Unit. Ind. Eng. Chem. Res. 2015, 54, 12096–12107. [Google Scholar] [CrossRef] [Green Version]
- Smith, A.R.; Klosek, J. A review of air separation technologies and their integration with energy conversion processes. Fuel Process. Technol. 2001, 70, 115–134. [Google Scholar] [CrossRef]
- Zheng, J.; Ye, H.; Li, Y.; Yang, Y.; Si, B. A Parametric Sensitivity Study and Comparison Analysis on Multiple Air Separation Processes. Ind. Eng. Chem. Res. 2019, 58, 9087–9098. [Google Scholar] [CrossRef]
- Haider, P.; Freko, P.; Lochner, S.; Reiter, T.; Rehfeldt, S.; Klein, H. Design of a test rig for the simulation of startup procedures in main heat exchangers of air separation plants. Chem. Eng. Res. Des. 2019, 147, 90–97. [Google Scholar] [CrossRef]
- Timmerhaus, K.D. Cryogenic Process Engineering. In Encyclopedia of Physical Science and Technology, 3rd ed.; Meyers, R.A., Ed.; Academic Press: New York, NY, USA, 2003; pp. 13–36. ISBN 978-0-12-227410-7. [Google Scholar]
- Zhu, Y.; Liu, X.; Zhou, Z. Optimization of cryogenic air separation distillation columns. In Proceedings of the World Congress on Intelligent Control and Automation (WCICA), Dalian, China, 21–23 June 2006; Volume 2, pp. 7702–7705. [Google Scholar]
- Air Separation Plants: History and Technological Progress in the Course of Time; Linde Aktiengesellschaft, Engineering Division: Pullach, Germany, 2019.
- Chen, S.; Dong, X.; Xu, J.; Zhang, H.; Gao, Q.; Tan, C. Thermodynamic evaluation of the novel distillation column of the air separation unit with integration of liquefied natural gas (LNG) regasification. Energy 2019, 171, 341–359. [Google Scholar] [CrossRef]
- Shi, B.; Xu, W.; Wu, E.; Wu, W.; Kuo, P.-C. Novel design of integrated gasification combined cycle (IGCC) power plants with CO2 capture. J. Clean. Prod. 2018, 195, 176–186. [Google Scholar] [CrossRef]
- Mehrpooya, M.; Ansarinasab, H. Exergoeconomic evaluation of single mixed refrigerant natural gas liquefaction processes. Energy Convers. Manag. 2015, 99, 400–413. [Google Scholar] [CrossRef]
- Cormos, C.C. Energy and cost efficient manganese chemical looping air separation cycle for decarbonized power generation based on oxy-fuel combustion and gasification. Energy 2020, 191, 116579. [Google Scholar] [CrossRef]
- Miller, J.; Luyben, W.L.; Belanger, P.; Blouin, S.; Megan, L. Improving agility of cryogenic air separation plants. Ind. Eng. Chem. Res. 2008, 47, 394–404. [Google Scholar] [CrossRef]
- Zhou, H.; Cai, Y.; Xiao, Y.; Mkhalel, Z.A.; You, B.; Shi, J.; Li, J.; Chen, B.H. Process configurations and simulations for a novel single-column cryogenic air separation process. Ind. Eng. Chem. Res. 2012, 51, 15431–15439. [Google Scholar] [CrossRef]
- Van der Ham, L.V.; Kjelstrup, S. Improving the Heat Integration of Distillation Columns in a Cryogenic Air Separation Unit. Ind. Eng. Chem. Res. 2011, 50, 9324–9338. [Google Scholar] [CrossRef]
- Fu, C.; Gundersen, T. Using exergy analysis to reduce power consumption in air separation units for oxy-combustion processes. Energy 2012, 44, 60–68. [Google Scholar] [CrossRef]
- Esfilar, R.; Mehrpooya, M.; Moosavian, S.M.A. Thermodynamic assessment of an integrated biomass and coal co-gasification, cryogenic air separation unit with power generation cycles based on LNG vaporization. Energy Convers. Manag. 2018, 157, 438–451. [Google Scholar] [CrossRef]
- Smith, A.R.; Klosek, J.; Woodward, D.W. Next-generation integration concepts for air separation units and gas turbines. J. Eng. Gas Turbines Power 1997, 119, 298–304. [Google Scholar] [CrossRef]
- Mehrpooya, M.; Zonouz, M.J. Analysis of an integrated cryogenic air separation unit, oxy-combustion carbon dioxide power cycle and liquefied natural gas regasification process by exergoeconomic method. Energy Convers. Manag. 2017, 139, 245–259. [Google Scholar] [CrossRef]
- Khalel, Z.A.M.; Rabah, A.A.; Barakat, T.A.M. A New Cryogenic Air Separation Process with Flash Separator. ISRN Thermodyn. 2013, 2013, 1–4. [Google Scholar] [CrossRef] [Green Version]
- Kim, D.; Giametta, R.E.H.; Gundersen, T. Optimal Use of LNG Cold Energy in Air Separation Units. Ind. Eng. Chem. Res. 2018, 57, 5914–5923. [Google Scholar] [CrossRef]
- de los Ángeles Olán-Acosta, M.; Barajas-Fernández, J.; García-Alamilla, P.; Castrejón-González, E.O.; Rico-Ramírez, V. Exergy analysis of a reactive extraction process. Chem. Eng. Res. Des. 2020, 162, 1–11. [Google Scholar] [CrossRef]
- Kaushik, S.C.; Reddy, V.S.; Tyagi, S.K. Energy and exergy analyses of thermal power plants: A review. Renew. Sustain. Energy Rev. 2011, 15, 1857–1872. [Google Scholar] [CrossRef]
- Mohammadi, A.; Mehrpooya, M. Energy and exergy analyses of a combined desalination and CCHP system driven by geothermal energy. Appl. Therm. Eng. 2017, 116, 685–694. [Google Scholar] [CrossRef]
- Mehrpooya, M.; Dehghani, H.; Ali Moosavian, S.M. Optimal design of solid oxide fuel cell, ammonia-water single effect absorption cycle and Rankine steam cycle hybrid system. J. Power Sources 2016, 306, 107–123. [Google Scholar] [CrossRef]
- Agrawal, R.; Woodward, D.W. Efficient cryogenic nitrogen generators: An exergy analysis. Gas Sep. Purif. 1991, 5, 139–150. [Google Scholar] [CrossRef]
- Cornelissen, R.L.; Hirs, G.G. Exergy Analysis in the Process Industry. In Thermodynamic Optimization of Complex Energy Systems; Springer: Dordrecht, The Netherlands, 1999; pp. 195–208. ISBN 978-94-011-4685-2. [Google Scholar]
- Cornelissen, R.L.; Hirs, G.G. Exergy analysis of cryogenic air separation. Energy Convers. Manag. 1998, 39, 1821–1826. [Google Scholar] [CrossRef]
- Yong, P.S.; Moon, H.M.; Yi, S.C. Exergy analysis of cryogenic air separation process for generating nitrogen. J. Ind. Eng. Chem. 2002, 8, 499–505. [Google Scholar] [CrossRef] [Green Version]
- Rizk, J.; Nemer, M.; Clodic, D. A real column design exergy optimization of a cryogenic air separation unit. Energy 2012, 37, 417–429. [Google Scholar] [CrossRef]
- Khalel, Z.; Rabah, A.; Barakat, T.A.M. Exergy Analysis of Cryogenic Air Separation Unit with Flash Separator. ICASTOR J. Eng. 2014, 7, 135–147. [Google Scholar]
- Roh, K.; Lee, J.H. Selection of control structure of elevated pressure air separation unit in an IGCC power plant for an economical operation. IFAC Proc. Vol. 2013, 46, 141–146. [Google Scholar] [CrossRef]
- Mehrpooya, M.; Esfilar, R.; Moosavian, S. Design of Cryogenic Air Separation Process with LNG Cold Energy Recovery and Supercritical CO2 Power Generation. In Proceedings of the 9th International Chemical Engineering Congress & Exhibition, University of Shiraz, Shiraz, Iran, 22 December 2015. [Google Scholar]
- Tesch, S.; Morosuk, T.; Tsatsaronis, G. Exergetic and economic evaluation of safety-related concepts for the regasification of LNG integrated into air separation processes. Energy 2017, 141, 2458–2469. [Google Scholar] [CrossRef]
Figure 1.
Process flow diagram of the air separation unit (ASU) configuration C1.

Figure 2.
Process flow diagram of the ASU configuration C2.

Figure 3.
Process flow diagram of the ASU configuration C3.

Figure 4.
Process flow diagram of the ASU configuration C4.

Figure 5.
Process flow diagram of the ASU configuration C5.

Figure 6.
Process flow diagram of the ASU configuration C6.

Figure 7.
Process flow diagram of the ASU configuration C7.

Figure 8.
Section-wise exergy efficiency (%) for configurations C1–C7.

Figure 9.
Contribution of different sections toward total exergy destruction in configurations C1–C7.
Figure 9.
Contribution of different sections toward total exergy destruction in configurations C1–C7.


Table 1.
Steady-state simulation results for the ASU configuration C1.
| Stream | Temp. | Pressure | Flowrate | Composition | ||||
|---|---|---|---|---|---|---|---|---|
| °C | Bar | tons/h | N2 | O2 | Ar | H2O | CO2 | |
| S1 | 25.0 | 1.0 | 500.0 | 0.77 | 0.21 | 0.01 | 0.02 | 0.00 |
| S2 | 146.0 | 2.5 | 500.0 | 0.77 | 0.21 | 0.01 | 0.02 | 0.00 |
| S3 | 40.0 | 2.4 | 500.0 | 0.77 | 0.21 | 0.01 | 0.02 | 0.00 |
| S4 | 40.0 | 2.4 | 500.0 | 0.77 | 0.21 | 0.01 | 0.02 | 0.00 |
| S5 | -- | 2.4 | -- | -- | -- | -- | -- | -- |
| S6 | 168.9 | 6.0 | 500.0 | 0.77 | 0.21 | 0.01 | 0.02 | 0.00 |
| S7 | 40.0 | 5.9 | 500.0 | 0.77 | 0.21 | 0.01 | 0.02 | 0.00 |
| S8 | 40.0 | 5.9 | 160.0 | 0.77 | 0.21 | 0.01 | 0.02 | 0.00 |
| S9 | 40.0 | 5.9 | 340.0 | 0.77 | 0.21 | 0.01 | 0.02 | 0.00 |
| S10 | 40.0 | 5.9 | 339.0 | 0.77 | 0.21 | 0.01 | 0.01 | 0.00 |
| S11 | 40.0 | 5.9 | 1.0 | 0.00 | 0.00 | 0.00 | 1.00 | 0.00 |
| S12 | 40.0 | 5.9 | 336.5 | 0.78 | 0.21 | 0.01 | 0.00 | 0.00 |
| S13 | 40.0 | 5.9 | 2.5 | 0.00 | 0.00 | 0.00 | 0.97 | 0.03 |
| S14 | 40.0 | 5.9 | 159.5 | 0.77 | 0.21 | 0.01 | 0.01 | 0.00 |
| S15 | 40.0 | 5.9 | 0.5 | 0.00 | 0.00 | 0.00 | 1.00 | 0.00 |
| S16 | 70.8 | 7.5 | 159.5 | 0.77 | 0.21 | 0.01 | 0.01 | 0.00 |
| S17 | 40.0 | 7.4 | 159.5 | 0.77 | 0.21 | 0.01 | 0.01 | 0.00 |
| S18 | 40.0 | 7.4 | 159.3 | 0.77 | 0.21 | 0.01 | 0.01 | 0.00 |
| S19 | 40.0 | 7.4 | 0.2 | 0.00 | 0.00 | 0.00 | 1.00 | 0.00 |
| S20 | 40.0 | 7.4 | 158.4 | 0.78 | 0.21 | 0.01 | 0.00 | 0.00 |
| S20A | 40.0 | 7.4 | 1.0 | 0.00 | 0.00 | 0.00 | 0.97 | 0.03 |
| W-1 | 25.0 | 1.0 | 4700.0 | 0.00 | 0.00 | 0.00 | 1.00 | 0.00 |
| W-2 | 25.0 | 3.3 | 4700.0 | 0.00 | 0.00 | 0.00 | 1.00 | 0.00 |
| W-3 | 27.6 | 3.2 | 4700.0 | 0.00 | 0.00 | 0.00 | 1.00 | 0.00 |
| W-4 | 30.9 | 3.1 | 4700.0 | 0.00 | 0.00 | 0.00 | 1.00 | 0.00 |
| W-5 | 31.1 | 3.0 | 4700.0 | 0.00 | 0.00 | 0.00 | 1.00 | 0.00 |
| S21 | −171.7 | 7.3 | 158.4 | 0.78 | 0.21 | 0.01 | 0.00 | 0.00 |
| S22 | −160.0 | 5.8 | 336.5 | 0.78 | 0.21 | 0.01 | 0.00 | 0.00 |
| S23 | −174.9 | 5.8 | 158.4 | 0.78 | 0.21 | 0.01 | 0.00 | 0.00 |
| S24 | −160.0 | 5.8 | 336.5 | 0.78 | 0.21 | 0.01 | 0.00 | 0.00 |
| S25 | −177.5 | 5.6 | 199.1 | 0.99 | 0.00 | 0.00 | 0.00 | 0.00 |
| S26 | −173.3 | 5.8 | 295.8 | 0.63 | 0.36 | 0.01 | 0.00 | 0.00 |
| S27 | −185.7 | 5.5 | 199.1 | 0.99 | 0.00 | 0.00 | 0.00 | 0.00 |
| S28 | −180.6 | 5.7 | 295.8 | 0.63 | 0.36 | 0.01 | 0.00 | 0.00 |
| S29 | −192.1 | 1.5 | 199.1 | 0.99 | 0.00 | 0.00 | 0.00 | 0.00 |
| S30 | −189.0 | 1.5 | 295.8 | 0.63 | 0.36 | 0.01 | 0.00 | 0.00 |
| S31 | −194.1 | 1.2 | 378.6 | 0.99 | 0.00 | 0.01 | 0.00 | 0.00 |
| S32 | −179.3 | 1.5 | 116.3 | 0.00 | 0.99 | 0.01 | 0.00 | 0.00 |
| S33 | −179.2 | 4.8 | 116.3 | 0.00 | 0.99 | 0.01 | 0.00 | 0.00 |
| S34 | 39.0 | 4.7 | 116.3 | 0.00 | 0.99 | 0.01 | 0.00 | 0.00 |
| S35 | −175.0 | 1.1 | 378.6 | 0.99 | 0.00 | 0.01 | 0.00 | 0.00 |
| S36 | 39.0 | 1.0 | 378.6 | 0.99 | 0.00 | 0.01 | 0.00 | 0.00 |
| PURGE | −193.9 | 1.2 | 0.00 | 0.98 | 0.00 | 0.02 | 0.00 | 0.00 |
Table 2.
Steady-state simulation results for the ASU configuration C2.
| Stream | Temp | Pressure | Flow | Composition | ||||
|---|---|---|---|---|---|---|---|---|
| °C | Bar | tons/h | N2 | O2 | Ar | H2O | CO2 | |
| S1 | 25.0 | 1.0 | 500.0 | 0.77 | 0.21 | 0.01 | 0.02 | 0.00 |
| S2 | 146.0 | 2.5 | 500.0 | 0.77 | 0.21 | 0.01 | 0.02 | 0.00 |
| S3 | 40.0 | 2.4 | 500.0 | 0.77 | 0.21 | 0.01 | 0.02 | 0.00 |
| S4 | 40.0 | 2.4 | 500.0 | 0.77 | 0.21 | 0.01 | 0.02 | 0.00 |
| S5 | -- | 2.4 | -- | -- | -- | -- | -- | -- |
| S6 | 168.9 | 6.0 | 500.0 | 0.77 | 0.21 | 0.01 | 0.02 | 0.00 |
| S7 | 40.0 | 5.9 | 500.0 | 0.77 | 0.21 | 0.01 | 0.02 | 0.00 |
| S8 | 40.0 | 5.9 | 160.0 | 0.77 | 0.21 | 0.01 | 0.02 | 0.00 |
| S9 | 40.0 | 5.9 | 340.0 | 0.77 | 0.21 | 0.01 | 0.02 | 0.00 |
| S10 | 40.0 | 5.9 | 339.0 | 0.77 | 0.21 | 0.01 | 0.01 | 0.00 |
| S11 | 40.0 | 5.9 | 1.0 | 0.00 | 0.00 | 0.00 | 1.00 | 0.00 |
| S12 | 40.0 | 5.9 | 336.5 | 0.78 | 0.21 | 0.01 | 0.00 | 0.00 |
| S13 | 40.0 | 5.9 | 2.5 | 0.00 | 0.00 | 0.00 | 0.97 | 0.03 |
| S14 | 40.0 | 5.9 | 159.5 | 0.77 | 0.21 | 0.01 | 0.01 | 0.00 |
| S15 | 40.0 | 5.9 | 0.5 | 0.00 | 0.00 | 0.00 | 1.00 | 0.00 |
| S16 | 70.8 | 7.5 | 159.5 | 0.77 | 0.21 | 0.01 | 0.01 | 0.00 |
| S17 | 40.0 | 7.4 | 159.5 | 0.77 | 0.21 | 0.01 | 0.01 | 0.00 |
| S18 | 40.0 | 7.4 | 159.3 | 0.77 | 0.21 | 0.01 | 0.01 | 0.00 |
| S19 | 40.0 | 7.4 | 0.2 | 0.00 | 0.00 | 0.00 | 1.00 | 0.00 |
| S20 | 40.0 | 7.4 | 158.4 | 0.78 | 0.21 | 0.01 | 0.00 | 0.00 |
| S20A | 40.0 | 7.4 | 1.0 | 0.00 | 0.00 | 0.00 | 0.97 | 0.03 |
| W-1 | 25.0 | 1.0 | 4700.0 | 0.00 | 0.00 | 0.00 | 1.00 | 0.00 |
| W-2 | 25.0 | 3.3 | 4700.0 | 0.00 | 0.00 | 0.00 | 1.00 | 0.00 |
| W-3 | 27.6 | 3.2 | 4700.0 | 0.00 | 0.00 | 0.00 | 1.00 | 0.00 |
| W-4 | 30.9 | 3.1 | 4700.0 | 0.00 | 0.00 | 0.00 | 1.00 | 0.00 |
| W-5 | 31.1 | 3.0 | 4700.0 | 0.00 | 0.00 | 0.00 | 1.00 | 0.00 |
| S21 | −170.0 | 7.3 | 158.4 | 0.78 | 0.21 | 0.01 | 0.00 | 0.00 |
| S22 | −160.0 | 5.8 | 336.5 | 0.78 | 0.21 | 0.01 | 0.00 | 0.00 |
| S23 | −173.1 | 5.8 | 158.4 | 0.78 | 0.21 | 0.01 | 0.00 | 0.00 |
| S24 | −160.0 | 5.8 | 336.5 | 0.78 | 0.21 | 0.01 | 0.00 | 0.00 |
| S25 | −177.5 | 5.6 | 240.2 | 0.99 | 0.01 | 0.00 | 0.00 | 0.00 |
| S26 | −172.7 | 5.8 | 254.7 | 0.57 | 0.41 | 0.01 | 0.00 | 0.00 |
| S27 | −185.7 | 5.5 | 240.2 | 0.99 | 0.01 | 0.00 | 0.00 | 0.00 |
| S28 | −180.6 | 5.7 | 254.7 | 0.57 | 0.41 | 0.01 | 0.00 | 0.00 |
| S29 | −192.1 | 1.5 | 240.2 | 0.99 | 0.01 | 0.00 | 0.00 | 0.00 |
| S30 | −188.5 | 1.5 | 254.7 | 0.57 | 0.41 | 0.01 | 0.00 | 0.00 |
| S31 | −194.0 | 1.2 | 379.1 | 0.99 | 0.00 | 0.01 | 0.00 | 0.00 |
| S32 | −179.3 | 1.5 | 115.8 | 0.00 | 0.98 | 0.02 | 0.00 | 0.00 |
| S34 | 39.0 | 1.0 | 115.8 | 0.00 | 0.98 | 0.02 | 0.00 | 0.00 |
| S35 | −173.9 | 1.1 | 379.1 | 0.99 | 0.00 | 0.01 | 0.00 | 0.00 |
| S36 | 38.6 | 1.0 | 379.1 | 0.99 | 0.00 | 0.01 | 0.00 | 0.00 |
| PURGE | −193.9 | 1.2 | 0.00 | 0.98 | 0.00 | 0.02 | 0.00 | 0.00 |
Table 3.
Steady-state simulation results for the ASU configuration C3.
| Stream | Temp | Pressure | Flow | Composition | ||||
|---|---|---|---|---|---|---|---|---|
| °C | Bar | tons/h | N2 | O2 | Ar | H2O | CO2 | |
| S1 | 25.0 | 1.0 | 500.0 | 0.77 | 0.21 | 0.01 | 0.02 | 0.00 |
| S2 | 146.0 | 2.5 | 500.0 | 0.77 | 0.21 | 0.01 | 0.02 | 0.00 |
| S3 | 40.0 | 2.4 | 500.0 | 0.77 | 0.21 | 0.01 | 0.02 | 0.00 |
| S4 | 40.0 | 2.4 | 500.0 | 0.77 | 0.21 | 0.01 | 0.02 | 0.00 |
| S5 | -- | 2.4 | 0.0 | -- | -- | -- | -- | -- |
| S6 | 168.9 | 6.0 | 500.0 | 0.77 | 0.21 | 0.01 | 0.02 | 0.00 |
| S7 | 40.0 | 5.9 | 500.0 | 0.77 | 0.21 | 0.01 | 0.02 | 0.00 |
| S8 | 40.0 | 5.9 | 50.0 | 0.77 | 0.21 | 0.01 | 0.02 | 0.00 |
| S9 | 40.0 | 5.9 | 450.0 | 0.77 | 0.21 | 0.01 | 0.02 | 0.00 |
| S10 | 40.0 | 5.9 | 448.7 | 0.77 | 0.21 | 0.01 | 0.01 | 0.00 |
| S11 | 40.0 | 5.9 | 1.3 | 0.00 | 0.00 | 0.00 | 1.00 | 0.00 |
| S12 | 40.0 | 5.9 | 445.4 | 0.78 | 0.21 | 0.01 | 0.00 | 0.00 |
| S13 | 40.0 | 5.9 | 3.3 | 0.00 | 0.00 | 0.00 | 0.97 | 0.03 |
| S14 | 40.0 | 5.9 | 49.9 | 0.77 | 0.21 | 0.01 | 0.01 | 0.00 |
| S15 | 40.0 | 5.9 | 0.2 | 0.00 | 0.00 | 0.00 | 1.00 | 0.00 |
| S16 | 70.8 | 7.5 | 49.9 | 0.77 | 0.21 | 0.01 | 0.01 | 0.00 |
| S17 | 40.0 | 7.4 | 49.9 | 0.77 | 0.21 | 0.01 | 0.01 | 0.00 |
| S18 | 40.0 | 7.4 | 49.8 | 0.77 | 0.21 | 0.01 | 0.01 | 0.00 |
| S19 | 40.0 | 7.4 | 0.1 | 0.00 | 0.00 | 0.00 | 1.00 | 0.00 |
| S20 | 40.0 | 7.4 | 49.5 | 0.78 | 0.21 | 0.01 | 0.00 | 0.00 |
| S20A | 40.0 | 7.4 | 0.3 | 0.00 | 0.00 | 0.00 | 0.97 | 0.03 |
| W-1 | 25.0 | 1.0 | 4700.0 | 0.00 | 0.00 | 0.00 | 1.00 | 0.00 |
| W-2 | 25.0 | 3.3 | 4700.0 | 0.00 | 0.00 | 0.00 | 1.00 | 0.00 |
| W-3 | 27.6 | 3.2 | 4700.0 | 0.00 | 0.00 | 0.00 | 1.00 | 0.00 |
| W-4 | 30.9 | 3.1 | 4700.0 | 0.00 | 0.00 | 0.00 | 1.00 | 0.00 |
| W-5 | 30.9 | 3.0 | 4700.0 | 0.00 | 0.00 | 0.00 | 1.00 | 0.00 |
| S21 | −165.0 | 7.3 | 49.5 | 0.78 | 0.21 | 0.01 | 0.00 | 0.00 |
| S23 | −197.5 | 1.5 | 49.5 | 0.78 | 0.21 | 0.01 | 0.00 | 0.00 |
| S24 | −167.0 | 5.8 | 445.4 | 0.78 | 0.21 | 0.01 | 0.00 | 0.00 |
| S25 | −177.5 | 5.6 | 211.3 | 0.99 | 0.01 | 0.00 | 0.00 | 0.00 |
| S26 | −172.8 | 5.8 | 234.1 | 0.58 | 0.40 | 0.01 | 0.00 | 0.00 |
| S27 | −185.7 | 5.5 | 211.3 | 0.99 | 0.01 | 0.00 | 0.00 | 0.00 |
| S28 | −180.6 | 5.7 | 234.1 | 0.58 | 0.40 | 0.01 | 0.00 | 0.00 |
| S29 | −192.1 | 1.5 | 211.3 | 0.99 | 0.01 | 0.00 | 0.00 | 0.00 |
| S30 | −188.6 | 1.5 | 234.1 | 0.58 | 0.40 | 0.01 | 0.00 | 0.00 |
| S31 | −194.1 | 1.2 | 379.1 | 0.99 | 0.00 | 0.01 | 0.00 | 0.00 |
| S32 | −179.3 | 1.5 | 115.8 | 0.00 | 0.985 | 0.015 | 0.00 | 0.00 |
| S34 | 37.0 | 1.0 | 115.8 | 0.00 | 0.985 | 0.015 | 0.00 | 0.00 |
| S35 | −176.1 | 1.1 | 379.1 | 0.99 | 0.00 | 0.01 | 0.00 | 0.00 |
| S36 | 36.1 | 1.0 | 379.1 | 0.99 | 0.00 | 0.01 | 0.00 | 0.00 |
| PURGE | −193.9 | 1.2 | 0.0 | 0.98 | 0.00 | 0.02 | 0.00 | 0.00 |
Table 4.
Steady-state simulation results for the ASU configuration C4.
| Stream | Temp | Pressure | Flow | Composition | ||||
|---|---|---|---|---|---|---|---|---|
| °C | Bar | tons/h | N2 | O2 | Ar | H2O | CO2 | |
| S1 | 25.0 | 1.0 | 500.0 | 0.77 | 0.21 | 0.01 | 0.02 | 0.00 |
| S2 | 113.3 | 2.0 | 500.0 | 0.77 | 0.21 | 0.01 | 0.02 | 0.00 |
| S3 | 40.0 | 1.9 | 500.0 | 0.77 | 0.21 | 0.01 | 0.02 | 0.00 |
| S4 | 40.0 | 1.9 | 500.0 | 0.77 | 0.21 | 0.01 | 0.02 | 0.00 |
| S5 | -- | 1.9 | 0.0 | -- | -- | -- | -- | -- |
| S6 | 142.3 | 4.0 | 500.0 | 0.77 | 0.21 | 0.01 | 0.02 | 0.00 |
| S7 | 40.0 | 3.9 | 500.0 | 0.77 | 0.21 | 0.01 | 0.02 | 0.00 |
| S8 | 40.0 | 3.9 | 450.0 | 0.77 | 0.21 | 0.01 | 0.02 | 0.00 |
| S9 | 40.0 | 3.9 | 50.0 | 0.77 | 0.21 | 0.01 | 0.02 | 0.00 |
| S10 | 40.0 | 3.9 | 50.0 | 0.77 | 0.21 | 0.01 | 0.02 | 0.00 |
| S11 | -- | 3.9 | 0.0 | -- | -- | -- | -- | -- |
| S12 | 40.0 | 3.9 | 49.5 | 0.78 | 0.21 | 0.01 | 0.00 | 0.00 |
| S13 | 40.0 | 3.9 | 0.5 | 0.00 | 0.00 | 0.00 | 0.98 | 0.02 |
| S14 | 40.0 | 3.9 | 450.0 | 0.77 | 0.21 | 0.01 | 0.02 | 0.00 |
| S15 | -- | 3.9 | 0.0 | -- | -- | -- | -- | -- |
| S16 | 96.7 | 6.0 | 450.0 | 0.77 | 0.21 | 0.01 | 0.02 | 0.00 |
| S17 | 40.0 | 5.9 | 450.0 | 0.77 | 0.21 | 0.01 | 0.02 | 0.00 |
| S18 | 40.0 | 5.9 | 448.7 | 0.77 | 0.21 | 0.01 | 0.01 | 0.00 |
| S19 | 40.0 | 5.9 | 1.3 | 0.00 | 0.00 | 0.00 | 1.00 | 0.00 |
| S20 | 40.0 | 5.9 | 445.4 | 0.78 | 0.21 | 0.01 | 0.00 | 0.00 |
| S20A | 40.0 | 5.9 | 3.3 | 0.00 | 0.00 | 0.00 | 0.97 | 0.03 |
| W-1 | 25.0 | 1.0 | 4700.0 | 0.00 | 0.00 | 0.00 | 1.00 | 0.00 |
| W-2 | 25.0 | 3.3 | 4700.0 | 0.00 | 0.00 | 0.00 | 1.00 | 0.00 |
| W-3 | 26.8 | 3.2 | 4700.0 | 0.00 | 0.00 | 0.00 | 1.00 | 0.00 |
| W-4 | 29.2 | 3.1 | 4700.0 | 0.00 | 0.00 | 0.00 | 1.00 | 0.00 |
| W-5 | 30.6 | 3.0 | 4700.0 | 0.00 | 0.00 | 0.00 | 1.00 | 0.00 |
| S21 | −178.4 | 3.8 | 49.5 | 0.78 | 0.21 | 0.01 | 0.00 | 0.00 |
| S23 | −188.4 | 1.5 | 5.1 | 0.55 | 0.44 | 0.01 | 0.00 | 0.00 |
| S23A | −188.4 | 1.5 | 44.4 | 0.81 | 0.18 | 0.01 | 0.00 | 0.00 |
| S23B | −188.9 | 1.5 | 54.4 | 0.83 | 0.15 | 0.01 | 0.00 | 0.00 |
| S24 | −164.7 | 5.8 | 445.4 | 0.78 | 0.21 | 0.01 | 0.00 | 0.00 |
| S25 | −177.4 | 5.6 | 219.6 | 0.98 | 0.02 | 0.00 | 0.00 | 0.00 |
| S26 | −172.7 | 5.8 | 225.8 | 0.58 | 0.41 | 0.01 | 0.00 | 0.00 |
| S27 | −185.7 | 5.5 | 219.6 | 0.98 | 0.02 | 0.00 | 0.00 | 0.00 |
| S28 | −180.6 | 5.7 | 225.8 | 0.58 | 0.41 | 0.01 | 0.00 | 0.00 |
| S29 | −192.0 | 1.5 | 219.6 | 0.98 | 0.02 | 0.00 | 0.00 | 0.00 |
| S30 | −188.5 | 1.5 | 225.8 | 0.58 | 0.41 | 0.01 | 0.00 | 0.00 |
| S31 | −191.9 | 1.5 | 380.5 | 0.99 | 0.01 | 0.01 | 0.00 | 0.00 |
| S31A | −191.5 | 1.5 | 10.0 | 0.96 | 0.01 | 0.04 | 0.00 | 0.00 |
| S32 | −179.3 | 1.5 | 114.4 | 0.00 | 0.985 | 0.015 | 0.00 | 0.00 |
| S34 | 35.0 | 1.0 | 114.4 | 0.00 | 0.985 | 0.015 | 0.00 | 0.00 |
| S35 | −174.5 | 1.1 | 380.5 | 0.99 | 0.01 | 0.01 | 0.00 | 0.00 |
| S36 | 38.0 | 1.0 | 380.5 | 0.99 | 0.01 | 0.01 | 0.00 | 0.00 |
| PURGE | −191.7 | 1.5 | 0.0 | 0.97 | 0.01 | 0.03 | 0.00 | 0.00 |
Table 5.
Steady-state simulation results for the ASU configuration C5.
| Stream | Temp | Pressure | Flow | Composition | ||||
|---|---|---|---|---|---|---|---|---|
| °C | Bar | tons/h | N2 | O2 | Ar | H2O | CO2 | |
| S1 | 25.0 | 1.0 | 500.0 | 0.77 | 0.21 | 0.01 | 0.02 | 0.00 |
| S2 | 146.0 | 2.5 | 500.0 | 0.77 | 0.21 | 0.01 | 0.02 | 0.00 |
| S3 | 40.0 | 2.4 | 500.0 | 0.77 | 0.21 | 0.01 | 0.02 | 0.00 |
| S4 | 40.0 | 2.4 | 500.0 | 0.77 | 0.21 | 0.01 | 0.02 | 0.00 |
| S5 | -- | 2.4 | 0.0 | -- | -- | -- | -- | -- |
| S6 | 168.9 | 6.0 | 500.0 | 0.77 | 0.21 | 0.01 | 0.02 | 0.00 |
| S7 | 40.0 | 5.9 | 500.0 | 0.77 | 0.21 | 0.01 | 0.02 | 0.00 |
| S10 | 40.0 | 5.9 | 498.6 | 0.77 | 0.21 | 0.01 | 0.01 | 0.00 |
| S11 | 40.0 | 5.9 | 1.4 | 0.00 | 0.00 | 0.00 | 1.00 | 0.00 |
| S12 | 40.0 | 5.9 | 494.9 | 0.78 | 0.21 | 0.01 | 0.00 | 0.00 |
| S13 | 40.0 | 5.9 | 3.7 | 0.00 | 0.00 | 0.00 | 0.97 | 0.03 |
| W-1 | 25.0 | 1.0 | 2700.0 | 0.00 | 0.00 | 0.00 | 1.00 | 0.00 |
| W-2 | 25.0 | 3.3 | 2700.0 | 0.00 | 0.00 | 0.00 | 1.00 | 0.00 |
| W-3 | 29.5 | 3.2 | 2700.0 | 0.00 | 0.00 | 0.00 | 1.00 | 0.00 |
| W-4 | 35.2 | 3.1 | 2700.0 | 0.00 | 0.00 | 0.00 | 1.00 | 0.00 |
| S24 | −171.4 | 5.8 | 494.9 | 0.78 | 0.21 | 0.01 | 0.00 | 0.00 |
| S25 | −177.4 | 5.6 | 188.4 | 0.98 | 0.02 | 0.01 | 0.00 | 0.00 |
| S25A | −177.4 | 5.6 | 47.1 | 0.99 | 0.01 | 0.00 | 0.00 | 0.00 |
| S25B | 34.0 | 5.5 | 47.1 | 0.99 | 0.01 | 0.00 | 0.00 | 0.00 |
| S25C | −22.0 | 2.0 | 47.1 | 0.99 | 0.01 | 0.00 | 0.00 | 0.00 |
| S25D | 35.0 | 1.0 | 47.1 | 0.99 | 0.01 | 0.00 | 0.00 | 0.00 |
| S26 | −172.8 | 5.8 | 259.4 | 0.59 | 0.40 | 0.01 | 0.00 | 0.00 |
| S27 | −181.5 | 5.5 | 188.4 | 0.98 | 0.02 | 0.01 | 0.00 | 0.00 |
| S28 | −180.6 | 5.7 | 259.4 | 0.59 | 0.40 | 0.01 | 0.00 | 0.00 |
| S29 | −192.0 | 1.5 | 188.4 | 0.98 | 0.02 | 0.01 | 0.00 | 0.00 |
| S30 | −188.7 | 1.5 | 259.4 | 0.59 | 0.40 | 0.01 | 0.00 | 0.00 |
| S31 | −194.0 | 1.2 | 333.3 | 0.99 | 0.01 | 0.01 | 0.00 | 0.00 |
| S32 | −179.3 | 1.5 | 114.5 | 0.00 | 0.985 | 0.015 | 0.00 | 0.00 |
| S34 | 33.8 | 1.0 | 114.5 | 0.00 | 0.985 | 0.015 | 0.00 | 0.00 |
| S35 | −178.3 | 1.1 | 333.3 | 0.99 | 0.01 | 0.01 | 0.00 | 0.00 |
| S36 | 33.0 | 1.0 | 333.3 | 0.99 | 0.01 | 0.01 | 0.00 | 0.00 |
| PURGE | −193.6 | 1.2 | 0.00 | 0.97 | 0.01 | 0.03 | 0.00 | 0.00 |
Table 6.
Steady-state simulation results for the ASU configuration C6.
| Stream | Temp | Pressure | Flow | Composition | ||||
|---|---|---|---|---|---|---|---|---|
| °C | Bar | tons/h | N2 | O2 | Ar | H2O | CO2 | |
| S1 | 25.0 | 1.01 | 500.0 | 0.77 | 0.21 | 0.01 | 0.02 | 0.00 |
| S2 | 146.0 | 2.50 | 500.0 | 0.77 | 0.21 | 0.01 | 0.02 | 0.00 |
| S3 | 40.0 | 2.40 | 500.0 | 0.77 | 0.21 | 0.01 | 0.02 | 0.00 |
| S4 | 40.0 | 2.40 | 500.0 | 0.77 | 0.21 | 0.01 | 0.02 | 0.00 |
| S5 | -- | 2.40 | 0.0 | -- | -- | -- | -- | -- |
| S6 | 168.9 | 6.00 | 500.0 | 0.77 | 0.21 | 0.01 | 0.02 | 0.00 |
| S7 | 40.0 | 5.90 | 500.0 | 0.77 | 0.21 | 0.01 | 0.02 | 0.00 |
| S8 | 40.0 | 5.90 | 250.0 | 0.77 | 0.21 | 0.01 | 0.02 | 0.00 |
| S9 | 40.0 | 5.90 | 250.0 | 0.77 | 0.21 | 0.01 | 0.02 | 0.00 |
| S10 | 40.0 | 5.90 | 249.3 | 0.77 | 0.21 | 0.01 | 0.01 | 0.00 |
| S11 | 40.0 | 5.90 | 0.7 | 0.00 | 0.00 | 0.00 | 1.00 | 0.00 |
| S12 | 40.0 | 5.90 | 247.5 | 0.78 | 0.21 | 0.01 | 0.00 | 0.00 |
| S13 | 40.0 | 5.90 | 1.8 | 0.00 | 0.00 | 0.00 | 0.97 | 0.03 |
| S14 | 40.0 | 5.90 | 249.3 | 0.77 | 0.21 | 0.01 | 0.01 | 0.00 |
| S14A | 40.0 | 5.90 | 247.5 | 0.78 | 0.21 | 0.01 | 0.00 | 0.00 |
| S14B | 40.0 | 5.90 | 1.8 | 0.00 | 0.00 | 0.00 | 0.97 | 0.03 |
| S14C | 40.0 | 5.90 | 24.7 | 0.78 | 0.21 | 0.01 | 0.00 | 0.00 |
| S15 | 40.0 | 5.90 | 0.7 | 0.00 | 0.00 | 0.00 | 1.00 | 0.00 |
| S16A | 70.8 | 7.50 | 24.7 | 0.78 | 0.21 | 0.01 | 0.00 | 0.00 |
| S16B | 40.0 | 7.40 | 24.7 | 0.78 | 0.21 | 0.01 | 0.00 | 0.00 |
| S18 | 40.0 | 5.90 | 222.7 | 0.78 | 0.21 | 0.01 | 0.00 | 0.00 |
| S19 | -- | 7.40 | 0.0 | -- | -- | -- | -- | -- |
| W-1 | 25.0 | 1.01 | 4700.0 | 0.00 | 0.00 | 0.00 | 1.00 | 0.00 |
| W-2 | 25.0 | 3.30 | 4700.0 | 0.00 | 0.00 | 0.00 | 1.00 | 0.00 |
| W-3 | 27.6 | 3.20 | 4700.0 | 0.00 | 0.00 | 0.00 | 1.00 | 0.00 |
| W-4 | 30.9 | 3.10 | 4700.0 | 0.00 | 0.00 | 0.00 | 1.00 | 0.00 |
| W-5 | 30.9 | 3.00 | 4700.0 | 0.00 | 0.00 | 0.00 | 1.00 | 0.00 |
| S16 | −160.0 | 7.30 | 24.7 | 0.78 | 0.21 | 0.01 | 0.00 | 0.00 |
| S17 | −160.0 | 7.30 | 22.3 | 0.78 | 0.21 | 0.01 | 0.00 | 0.00 |
| S17A | −188.8 | 2.00 | 22.3 | 0.78 | 0.21 | 0.01 | 0.00 | 0.00 |
| S20 | 40.0 | 7.40 | 24.7 | 0.78 | 0.21 | 0.01 | 0.00 | 0.00 |
| S22 | −172.9 | 5.80 | 247.5 | 0.78 | 0.21 | 0.01 | 0.00 | 0.00 |
| S22A | −173.0 | 5.80 | 222.7 | 0.78 | 0.21 | 0.01 | 0.00 | 0.00 |
| S22B | −172.9 | 5.80 | 470.2 | 0.78 | 0.21 | 0.01 | 0.00 | 0.00 |
| S24 | −160.0 | 7.30 | 2.5 | 0.78 | 0.21 | 0.01 | 0.00 | 0.00 |
| S25 | −177.9 | 5.40 | 198.3 | 0.99 | 0.01 | 0.00 | 0.00 | 0.00 |
| S25A | 28.8 | 1.01 | 198.3 | 0.99 | 0.01 | 0.00 | 0.00 | 0.00 |
| S25C | −206.6 | 1.10 | 198.3 | 0.99 | 0.01 | 0.00 | 0.00 | 0.00 |
| S26 | −173.7 | 5.60 | 274.3 | 0.62 | 0.36 | 0.01 | 0.00 | 0.00 |
| S27 | −175.0 | 5.50 | 274.3 | 0.62 | 0.36 | 0.01 | 0.00 | 0.00 |
| S28 | −186.3 | 1.90 | 22.3 | 0.78 | 0.21 | 0.01 | 0.00 | 0.00 |
| S29 | −188.8 | 1.50 | 274.3 | 0.62 | 0.36 | 0.01 | 0.00 | 0.00 |
| S30 | −188.6 | 1.50 | 22.3 | 0.78 | 0.21 | 0.01 | 0.00 | 0.00 |
| S31 | −190.4 | 1.20 | 229.9 | 0.80 | 0.18 | 0.02 | 0.00 | 0.00 |
| S32 | −179.3 | 1.49 | 66.7 | 0.00 | 0.99 | 0.01 | 0.00 | 0.00 |
| S33 | −179.0 | 1.40 | 66.7 | 0.00 | 0.99 | 0.01 | 0.00 | 0.00 |
| S34 | 28.8 | 1.01 | 66.7 | 0.00 | 0.99 | 0.01 | 0.00 | 0.00 |
| S35 | −185.0 | 1.10 | 229.9 | 0.80 | 0.18 | 0.02 | 0.00 | 0.00 |
| S36 | 28.8 | 1.01 | 229.9 | 0.80 | 0.18 | 0.02 | 0.00 | 0.00 |
| PURGE | −191.7 | 1.20 | 0.0 | 0.80 | 0.19 | 0.01 | 0.00 | 0.00 |
Table 7.
Steady-state simulation results for the ASU configuration C7.
| Stream | Temp | Pressure | Flow | Composition | ||||
|---|---|---|---|---|---|---|---|---|
| °C | Bar | tons/h | N2 | O2 | Ar | H2O | CO2 | |
| S1 | 25.0 | 1.0 | 500.0 | 0.77 | 0.21 | 0.01 | 0.02 | 0.00 |
| S2 | 25.0 | 1.0 | 350.0 | 0.77 | 0.21 | 0.01 | 0.02 | 0.00 |
| S3 | 25.0 | 1.0 | 150.0 | 0.77 | 0.21 | 0.01 | 0.02 | 0.00 |
| S4 | −160.0 | 1.0 | 350.0 | 0.77 | 0.21 | 0.01 | 0.02 | 0.00 |
| S5 | −99.6 | 1.0 | 150.0 | 0.77 | 0.21 | 0.01 | 0.02 | 0.00 |
| S6 | −160.0 | 1.0 | 346.6 | 0.78 | 0.21 | 0.01 | 0.00 | 0.00 |
| S7 | −160.0 | 1.0 | 3.4 | 0.00 | 0.00 | 0.00 | 1.00 | 0.00 |
| S8 | −58.2 | 5.8 | 346.6 | 0.78 | 0.21 | 0.01 | 0.00 | 0.00 |
| S9 | −58.2 | 5.8 | 346.4 | 0.78 | 0.21 | 0.01 | 0.00 | 0.00 |
| S10 | −58.2 | 5.8 | 0.2 | 0.00 | 0.00 | 0.00 | 0.00 | 1.00 |
| S11 | −99.6 | 1.0 | 148.5 | 0.78 | 0.21 | 0.01 | 0.00 | 0.00 |
| S12 | −99.6 | 1.0 | 1.5 | 0.00 | 0.00 | 0.00 | 1.00 | 0.00 |
| S13 | 56.6 | 5.8 | 148.5 | 0.78 | 0.21 | 0.01 | 0.00 | 0.00 |
| S14 | 56.6 | 5.8 | 148.5 | 0.78 | 0.21 | 0.01 | 0.00 | 0.00 |
| S15 | 56.6 | 5.8 | 0.1 | 0.00 | 0.00 | 0.00 | 0.00 | 1.00 |
| S16 | −167.3 | 5.8 | 148.5 | 0.78 | 0.21 | 0.01 | 0.00 | 0.00 |
| S17 | −167.3 | 5.8 | 108.4 | 0.78 | 0.21 | 0.01 | 0.00 | 0.00 |
| S18 | −173.4 | 5.8 | 108.4 | 0.78 | 0.21 | 0.01 | 0.00 | 0.00 |
| S19 | −188.4 | 1.5 | 108.4 | 0.78 | 0.21 | 0.01 | 0.00 | 0.00 |
| S20 | −188.4 | 1.5 | 97.2 | 0.81 | 0.18 | 0.01 | 0.00 | 0.00 |
| S21 | −188.4 | 1.5 | 11.2 | 0.55 | 0.44 | 0.01 | 0.00 | 0.00 |
| S22 | −167.3 | 5.8 | 40.1 | 0.78 | 0.21 | 0.01 | 0.00 | 0.00 |
| S23 | −190.4 | 1.5 | 380.4 | 0.78 | 0.21 | 0.01 | 0.00 | 0.00 |
| S24 | −168.0 | 5.8 | 346.4 | 0.78 | 0.21 | 0.01 | 0.00 | 0.00 |
| S25 | −177.6 | 5.6 | 6.1 | 1.00 | 0.00 | 0.00 | 0.00 | 0.00 |
| S25A | 20.0 | 5.5 | 6.1 | 1.00 | 0.00 | 0.00 | 0.00 | 0.00 |
| S26 | −175.0 | 5.8 | 380.4 | 0.78 | 0.21 | 0.01 | 0.00 | 0.00 |
| S28 | −180.0 | 5.7 | 380.4 | 0.78 | 0.21 | 0.01 | 0.00 | 0.00 |
| S29 | −190.4 | 1.5 | 340.4 | 0.76 | 0.23 | 0.01 | 0.00 | 0.00 |
| S30 | −190.4 | 1.5 | 40.0 | 0.92 | 0.08 | 0.00 | 0.00 | 0.00 |
| S31 | −192.2 | 1.2 | 413.1 | 0.90 | 0.09 | 0.01 | 0.00 | 0.00 |
| S32 | −179.6 | 1.5 | 75.8 | 0.00 | 0.99 | 0.01 | 0.00 | 0.00 |
| S33 | −178.0 | 1.4 | 75.8 | 0.00 | 0.99 | 0.01 | 0.00 | 0.00 |
| S34 | 24.0 | 1.0 | 75.8 | 0.00 | 0.99 | 0.01 | 0.00 | 0.00 |
| S35 | −174.5 | 1.1 | 413.1 | 0.90 | 0.09 | 0.01 | 0.00 | 0.00 |
| S36 | 24.0 | 1.0 | 413.1 | 0.90 | 0.09 | 0.01 | 0.00 | 0.00 |
| PURGE | −191.7 | 1.5 | 0.00 | 0.90 | 0.09 | 0.01 | 0.00 | 0.00 |
Table 8.
Feed stage locations in ASU configurations.
| Feed Stage | Configuration | ||||||
|---|---|---|---|---|---|---|---|
| C1 | C2 | C3 | C4 | C5 | C6 | C7 | |
| HP column | S23: 50 | S23: 50 | S22B: 12 | S22: 20 | |||
| S24: 60 | S24: 60 | S24: 60 | S24: 60 | S24: 60 | S24: 60 | S24: 60 | |
| LP column | S29: 1 | S29: 1 | S29: 1 | S29: 1 | S29: 1 | S29: 1 | S21: 1 |
| S30: 42 | S30: 42 | S30: 30 | S30: 40 | S30: 42 | S30: 5 | S29: 1 | |
| S23: 50 | S23: 40 | S20: 10 | |||||
| S23B: 50 | S30: 20 | ||||||
Table 9.
Definitions of % exergy efficiency of various equipment [24].
Table 9.
Definitions of % exergy efficiency of various equipment [24].
| Equipment | Exergy Destruction, Ed (kW) | |
|---|---|---|
| Compressors; Pumps | ||
| Turbines | ||
| Heat Exchangers; Valves | ||
| Distillation Column (LP Column) | ||
| Distillation Column (HP Column) |
Table 10.
Exergy efficiencies (%) of individual equipment in configurations C1–C7.
| Equipment | C1 | C2 | C3 | C4 | C5 | C6 | C7 |
|---|---|---|---|---|---|---|---|
| C-1 | 79.24 | 79.24 | 79.24 | 77.68 | 79.24 | 79.24 | 54.87 |
| C-2 | 80.31 | 80.31 | 80.31 | 79.18 | 80.31 | 80.31 | 72.87 |
| C-3 | 75.42 | 75.42 | 75.42 | 76.93 | -- | 75.42 | -- |
| W–Pump | 93.52 | 93.52 | 93.52 | 93.52 | 93.52 | 93.52 | -- |
| Flash-1 | 100.00 | 100.00 | 100.00 | 100.00 | 100.00 | 100.00 | 98.80 |
| Flash-2 | 99.87 | 99.87 | 99.87 | 100.00 | -- | 99.87 | 97.93 |
| Flash-3 | 99.87 | 99.87 | 99.87 | 100.00 | 99.87 | 99.87 | -- |
| Flash-4 | 99.92 | 99.92 | 99.92 | 99.87 | -- | 100.00 | -- |
| Separator-1 | 99.35 | 99.35 | 99.35 | 99.21 | 99.21 | 99.21 | 99.97 |
| Separator-2 | 99.21 | 99.21 | 99.21 | 98.98 | -- | 99.21 | 100.00 |
| HE-1 | 99.56 | 99.56 | 99.56 | 99.70 | 99.26 | 99.56 | 98.36 |
| HE-2 | 99.48 | 99.48 | 99.48 | 99.62 | 99.18 | 99.48 | 74.76 |
| HE-3 | 99.98 | 99.98 | 99.99 | 99.86 | -- | 99.99 | -- |
| Split | 100.00 | 100.00 | 100.00 | 100.00 | 100.00 | 100.00 | 100.00 |
| MHEX-1 | 99.36 | 95.45 | 94.12 | 94.85 | 94.25 | 88.67 | 79.34 |
| MHEX-2 | 98.51 | 98.53 | 98.37 | 96.73 | 98.45 | 99.09 | 98.68 |
| Turbine-1 | -- | -- | 38.00 | -- | 67.46 | 40.92 | -- |
| Turbine-2 | -- | -- | -- | -- | -- | 35.05 | -- |
| Vessel-1 | -- | -- | -- | 85.92 | -- | -- | 99.90 |
| Vessel-2 | -- | -- | -- | -- | -- | -- | 99.56 |
| Mixer | -- | -- | -- | 99.99 | -- | 99.99 | -- |
| V-1 | 99.83 | 95.87 | -- | -- | -- | -- | -- |
| V-2 | 100.00 | 100.00 | -- | -- | -- | -- | -- |
| V-3 | 99.42 | 99.48 | 99.48 | 99.48 | 99.47 | 98.78 | 99.18 |
| V-4 | 99.53 | 99.53 | 99.53 | 99.54 | 99.10 | 95.28 | 76.64 |
| HP Column | 97.63 | 96.94 | 97.04 | 97.04 | 97.19 | 96.23 | 97.09 |
| LP Column | 87.34 | 86.89 | 87.21 | 89.18 | 87.27 | 89.49 | 87.58 |
| O–Pump | 99.95 | -- | -- | -- | -- | -- | -- |
Publisher’s Note: MDPI stays neutral with regard to jurisdictional claims in published maps and institutional affiliations. |
© 2020 by the authors. Licensee MDPI, Basel, Switzerland. This article is an open access article distributed under the terms and conditions of the Creative Commons Attribution (CC BY) license (http://creativecommons.org/licenses/by/4.0/).
Share and Cite
MDPI and ACS Style
Hamayun, M.H.; Ramzan, N.; Hussain, M.; Faheem, M. Evaluation of Two-Column Air Separation Processes Based on Exergy Analysis. Energies 2020, 13, 6361. https://0-doi-org.brum.beds.ac.uk/10.3390/en13236361
AMA Style
Hamayun MH, Ramzan N, Hussain M, Faheem M. Evaluation of Two-Column Air Separation Processes Based on Exergy Analysis. Energies. 2020; 13(23):6361. https://0-doi-org.brum.beds.ac.uk/10.3390/en13236361
Chicago/Turabian StyleHamayun, Muhammad Haris, Naveed Ramzan, Murid Hussain, and Muhammad Faheem. 2020. "Evaluation of Two-Column Air Separation Processes Based on Exergy Analysis" Energies 13, no. 23: 6361. https://0-doi-org.brum.beds.ac.uk/10.3390/en13236361
Note that from the first issue of 2016, this journal uses article numbers instead of page numbers. See further details here.