The Applicability of Coanda Effect Hysteresis for Designing Unsteady Ventilation Systems


Faculty of Geoengineering, University of Warmia and Mazury in Olsztyn, Heweliusza 4, 10-724 Olsztyn, Poland
Energies 2021, 14(1), 34; https://0-doi-org.brum.beds.ac.uk/10.3390/en14010034
Submission received: 29 November 2020
/
Revised: 20 December 2020
/
Accepted: 21 December 2020
/
Published: 23 December 2020
(This article belongs to the Special Issue Energy Performance and Indoor Climate in Buildings)
Abstract
:Energy-saving ventilation systems are designed to improve the energy efficiency of buildings. Low energy efficiency in buildings poses a considerable problem that needs to be addressed. Mechanical ventilation with heat recovery has gained increased popularity in recent years. Mechanical ventilation has numerous advantages, including easy adjustment and control, high indoor air quality and elimination of indoor pollutants. Mixing ventilation is the most popular type of mechanical ventilation, in particular in residential buildings. Unsteady ventilation is a type of mixing ventilation that involves stronger mixing effects and smaller vertical temperature gradients to improve indoor air quality (IAQ) and minimize energy consumption. This study examines the possibility of controlling and modifying Coanda effect hysteresis (CEH) to generate unsteady flow and simulate the conditions of unsteady mixing ventilation. The experiment was performed on a self-designed test bench at the University of Warmia and Mazury in Olsztyn. It demonstrated that an auxiliary nozzle can be applied at the diffuser outlet to control CEH and the angles at which the air jet becomes attached to and separated from the flat plate positioned directly behind the nozzle. The study proposes an innovative mixing ventilation system that relies on CEH. The potential of the discussed concept has not been recognized or deployed in practice to date. This is the first study to confirm that an auxiliary nozzle by the diffuser outlet can be operated in both injection and suction mode to control CEH. In the future, the results can be used to design a new type of nozzles for unsteady ventilation systems that are based on CEH control.
1. Introduction
The energy-efficiency of indoor ventilation systems has to be improved to reduce power consumption in the residential sector. This is a highly challenging undertaking because in addition to decreasing energy consumption and the relevant costs, novel ventilation systems should also guarantee high indoor air quality (IAQ) and a safe living environment. Various, often complementary solutions can be deployed in residential buildings, including mechanical ventilation with heat recovery, effective control of heating, ventilation and air conditioning (HVAC) systems, or the optimization of air separation, flow and distribution. The optimization problem plays a particularly important role in the most popular mixing ventilation systems. Unsteady ventilation with fluctuating flow contributes to stronger mixing effects and smaller vertical temperature gradients in mixing ventilation systems [1]. This article presents the results of a laboratory experiment investigating the possibility of controlling Coanda effect hysteresis (CEH). The experiment demonstrated that an additional air nozzle can be incorporated at the diffuser outlet to modify the region of angular deflection where CEH occurs and to change the angle at which the jet becomes attached to and separated from the flat plate positioned directly behind the nozzle. The results of the study can be used to design a new nozzle which will be configured with structural partitions in the ventilated area to generate an air jet that is intermittently attached to and separated from a given plane. The resulting system will be characterized by fluctuating flow of fresh air. Stronger mixing effects will improve IAQ and will remove contaminants from the ventilated premises. The system will also be characterized by reduced flow rates, decreased demand for fresh air and lower energy consumption. To the best of the author’s knowledge, this study makes the first ever attempt to design a new nozzle for an unsteady mixed ventilation system based on CEH.
1.1. Energy Efficiency of Ventilation Systems in the Residential Sector
Within the European context, the residential sector accounted for 11.1% of energy-related greenhouse gas emissions and 26.1% of total energy consumption in 2018 [2]. The residential sector in the EU has the greatest energy efficiency potential [3], mainly because around 50% of residential buildings in the EU had been erected before the first thermal regulations came into force in 1970 [4]. In 2018, 63.3% of the energy consumed in the EU housing sector was related to space heating (https://ec.europa.eu/eurostat). In the USA, heating, ventilation and air conditioning (HVAC) systems are responsible for around 50% of energy consumption in the residential sector [5]. Two types of measures are required to reduce energy consumption for heating purposes: heat demand should be decreased, which can be accomplished through insulation, and heating equipment should be modernized [4]. Various strategies have been proposed to improve the energy efficiency of HVAC systems. According to Vakiloroaya et al. [6], such strategies include the introduction of evaporative cooling systems, vapor compression systems and effective system configuration. It should be noted that natural ventilation without heat recovery is largely responsible for heat losses in the energy balance of entire buildings [7,8]. The combined effects of infiltration and ventilation are responsible for 30% to nearly 50% of total heat losses in well-insulated buildings in a moderate European climate [9,10]. An analysis of ventilation systems conducted in 11 European countries in 2012 shed new light on the scale of this problem [11]. Before 1980, residential buildings had mostly natural ventilation. New energy efficiency standards called for the introduction of mechanical ventilation with heat recovery. These standards were implemented in different years across the EU, and Finland was one of the first countries to comply with these regulations. In Finland, the evolution of ventilation systems already began 60 years ago, and as of 2004, new homes have to be equipped with mechanical ventilation. Despite the above, 52% of single-family homes and 28% of apartments in Finland still do not have mechanical ventilation. In Great Britain and Greece, 50% of new buildings were equipped with mechanical ventilation. In Norway, around 90% of new construction buildings have ventilation systems other than natural ventilation. In Portugal, 80% of buildings erected after 2007 were equipped with ventilation systems other than natural ventilation, mostly hybrid ventilation. In Romania, around 20% of buildings developed after 2010 were provided with ventilation systems other than natural ventilation. In Bulgaria and Italy, nearly all existing buildings have natural ventilation that is locally supported by fans or hybrid ventilation. In Poland, around 80% of single-family homes and low-rise apartment buildings (up to four stories) have natural ventilation [12]. For this reason, energy efficiency is a valid concern in the existing ventilation systems. The most popular solutions for reducing the amount of energy consumed by ventilation involve heat recovery units in mechanical ventilation systems and the implementation of demand-controlled ventilation [13]. In Scandinavian countries, mechanical ventilation with heat recovery has gradually attained capstone status on the market of energy-efficient ventilation systems [10].
The energy-efficiency of ventilation systems has been widely researched. Zhou and Haghighat [14] analyzed several variants for optimizing the energy-efficiency of office ventilation. Based on the conducted simulations, they proposed a composite indicator for assessing thermal comfort, IAQ and energy consumption of ventilation systems. The indicator was developed with the use of computational fluid dynamics (CFD) techniques combined with a genetic algorithm (GA) and an artificial neural network (ANN) for response surface approximation (RSA) and speeding up analyses inside the GA loop. The cited study was conducted in three stages. CFD simulations were carried out to predict and assess the performance of different ventilation systems. The optimal combinations of the controlled variables were identified with the use of an ANN and a GA in the last step. The results were validated based on experimentally derived empirical data. Ben-Davi et al. [15] attempted to optimize office ventilation systems by focusing on employee productivity. Li et al. [16] relied on proper orthogonal decomposition (POD) to derive a reduced-order model and a genetic algorithm for optimizing a ventilation system in an office. Guo et al. [17] analyzed the energy efficiency of night-time office ventilation in cold climate zones. In the literature, attempts have been made to optimize ventilation systems for various types of structures, including green buildings [18], livestock buildings [19] and pharmaceutical cleanrooms [20]. Different types of ventilation systems were also studied. Stavrakakis et al. [21] relied on local weather data to conduct CFD simulations in a single-sided, naturally ventilated apartment. The generated data were used to train and validate Radial Basis Function Artificial Neural Network (RBF ANN) input–output “meta-models.” Serageldin et al. [22] explored the options for optimizing a solar chimney passive ventilation system coupled with an earth-to-air heat exchanger. Yuan et al. [23] deployed an energy flow-based method to optimize evaporative cooling and ventilation systems. Baglivo et al. [24] evaluated the performance of horizontal air-ground heat exchangers coupled with a ventilation system in a residential building in southern Italy and validated the applicability of geothermal systems for ventilation.
In the EU, the introduction of energy efficiency standards has led to the development of the nearly zero-energy building (nZEB) concept [25]. Energy efficiency standards differ across countries [26], but all of them aim to implement heat recovery in ventilation system and to meet passive house and nZEB requirements [27]. More than 80% of nZEBs have mechanical ventilation with heat recovery [28].
1.2. Mechanical Ventilation
Mechanical ventilation is increasingly popular not least because it is energy-efficient and supports heat recovery. The energy efficiency of mechanical ventilation systems can also be improved through the use of ground heat exchangers [29,30]. Well-designed and maintained mechanical ventilation systems decrease energy consumption in cooling systems [31]. Ventilation has a major impact on indoor air quality (IAQ) and comfort [32,33]. Mechanical ventilation systems that are properly operated and maintained eliminate pollutants, improve IAQ and minimize the incidence of comfort- and health-related problems, in particular in new and air-tight buildings [34,35]. They are also highly effective in reducing particle pollution in residential buildings [36].
Mechanical ventilation systems have specific operating requirements which can generate problems for users. According to research, some home owners are reluctant to install mechanical ventilation [37,38] and they find the operation of mechanical ventilation equipment too complex. In around 11% of the homes investigated by Zhao and Liu [39], mechanical ventilation was operated around the clock with identical settings. The majority of the users made only sporadic attempts to change system settings. Users are also discouraged from installing mechanical ventilation due to high operating costs [40] as well as the generated noise [41]. Mechanical ventilation systems need to be optimized and regularly inspected to guarantee optimal performance and decrease operating costs [42]. Cheng et al. [43] used the TRNSYS (Transient System Simulation Tool) simulation tool to demonstrate that the energy efficiency of an air-conditioning system with stratum ventilation can be improved by 6.4% by optimizing the fresh outdoor air ratio. Ventilation systems are often optimized together with heating and cooling systems. Zucker et al. [44] combined the currently implemented Building Information Model (BIM) with advanced algorithms and demonstrated that the proposed solution can decrease investment costs and reduce energy consumption. In the described solution, the decrease in dynamic pressure was modeled in a duct ventilation system and its components. The system’s energy efficiency was improved by introducing a controller which simultaneously monitored supply pressure and air flow volume. Simma et al. [45] demonstrated that remote control of a HVAC system via the Wi-Fi network can decrease energy consumption. A simplistic framework based on commodity Wi-Fi was tested in a large lecture hall. Real-time occupancy was estimated without additional infrastructure or upgrades, and occupant privacy was protected. The Wi-Fi-based occupancy schedule decreased energy consumption of the HVAC system by at least 50%. Much broader research has been conducted under the OptEEmAl project funded by the EU Horizon 2020 program to improve the energy efficiency of entire residential districts [46]. As part of the project, new districts will be designed, and the existing districts will be retrofitted by combining passive (upgrading the building envelope through the installation of internal and external insulation) and active measures (installation of new HVACs, replacement of outdated units), using renewables and implementing control strategies to guarantee their energy efficiency. Various smart energy systems have been reviewed and compared by Xu et al. [47]. The planning of HVAC upgrades should also be optimized to maximize the systems’ energy efficiency [48].
Mechanical ventilation systems should be integrated with heating and cooling systems already at the design stage [49]. Various problems associated with the operation of mechanical ventilation systems have been reported, including an insufficient supply of fresh air, inadequate temperature, humidity and velocity settings or failure to regularly clean and maintain the equipment [50]. Mechanical ventilation requires electrical power, and although systems with heat recovery can decrease useful and final energy, the consumption of primary energy may actually increase [51].
Ventilation significantly influences the occupants’ well-being, task performance, productivity and perceived air quality. Inadequate ventilation can contribute to the sick building syndrome (SBS), including the risk of allergies, asthma and communicable respiratory illnesses [52]. The relationship between the SBS and ventilation type has been studied by numerous authors. This problem attracted significant attention already in the 1990s, in particular in office buildings [53,54]. In recent years, factors that contribute to the SBS were also explored in residential buildings [55,56], schools [57] and lecture halls [58]. Symptoms of SBS have been more frequently reported in air-conditioned than in naturally ventilated premises. These observations could indicate that the negative impact of HVAC systems could be minimized through improved hygiene and regular servicing of air handling systems. Effective ventilation can improve task performance and productivity [59]. The performance and safety of ventilation systems has been scrupulously analyzed in educational facilities [60,61]. Regardless of the type of ventilation system, IAQ is influenced mainly by the ventilation rate, which should not be lower than 10 l/person. The indoor air quality and climate are compromised when ventilation systems are not properly designed, installed, maintained and operated. These considerations are particularly important in mechanical ventilation systems, which, if not regularly serviced, can lead to indoor contamination with harmful substances. The growth and accumulation of pathogenic microorganisms in cooling coils and drip pans of mechanical HVAC systems, air humidifiers and cooling towers can cause legionnaires disease and humidifier fever [59]. The prevalence of infectious airborne diseases can be minimized by increasing the ventilation rate [59]. Higher ventilation rates have been found to reduce indoor concentrations of tobacco smoke and radon decay products, thus minimizing the risk of lung cancer, heart attack, heart diseases and stroke [62,63]. Ventilation systems in health care facilities have to meet particularly stringent requirements. Most medical facilities are equipped with mechanical, rather than natural ventilation systems, but alternative solutions such as bed-integrated local exhaust ventilation with local air cleaning have also been proposed [64]. Even in premises with the most demanding air quality requirements, such as operating theaters, 12% of the personnel were unable to correctly identify the type of the installed ventilation system [65]. The presence of potentially pathogenic airborne bacteria is determined by the airflow rate rather the type of ventilation system. The relative concentration of chloroplast DNA in hospital air was considerably reduced by mechanical ventilation because pollen was effectively captured by filters in the ventilation system. However, indoor pathogen loads were not influenced by the type of the applied ventilation [66].
The effectiveness of ventilation systems has attracted particular attention during the SARS-CoV-2 pandemic, and various ventilation strategies have been analyzed [67,68,69]. In the EU, ventilation with outdoor air is recommended to dilute contaminants in closed spaces, increase the time required for exposure to an infectious dose of pathogens, maintain the minimum airflow rate per person (7–10 l/person according to American Society of Heating, Refrigerating and Air-Conditioning Engineers ASHRAE) and increase the air exchange rate [70]. These requirements can be met by various types of ventilation systems that have been properly designed and installed and are correctly operated and maintained. However, effective removal of pathogens requires filters with a Minimum Efficiency Reported Value (MERV) rating in the classification system of the American Society of Heating, Refrigerating and Air-Conditioning Engineers (ASHRAE). The recirculation of air should be decreased in mechanical ventilation systems, which increases operating costs. The risk of becoming infected with SARS-CoV-2 via air distributed by HVAC systems is minimal. However, in closed rooms that are equipped with air-conditioning units, droplets exhaled by infected individuals can travel across long distances.
Ventilation effectiveness is also influenced by the performance of the air distribution system. Without an adequate air distribution system, indoor pollutants cannot be effectively removed only by increasing the ventilation rate [71]. Two methods are generally applied to remove contaminants: dilution and displacement [72]. Mixing ventilation, which is most widely used in modern buildings, relies on the dilution method to optimize thermal comfort, improve energy efficiency and enhance the movement of fresh air [73]. These considerations are particularly important in the cooling mode, where thermal discomfort, the presence of dead pockets in the occupied zone and noise are frequently reported [74]. Mechanical ventilation can also generate drafts. Two types of draft are encountered in buildings. Downdraft at ankle and foot level is generated by air buoyancy near cold surfaces or when the supplied air is cold. Drafts can also be produced by high air velocity, in particular in cooled interiors and in the vicinity of supply diffusers. This type of draft affects the entire body, but causes discomfort mainly at head and neck level [75]. The geometry and location of the supply nozzle are critical for achieving optimal air velocity, direction of flow and the proportions in which fresh air is mixed with stale air [74]. Various supply nozzles for mechanical ventilation systems have been described in the literature [76,77]. The impact of different nozzle configurations on the performance of mixing ventilation was also analyzed [78]. A numerical study conducted by Chen et al. [79] demonstrated that a system featuring wall confluent jets and an impinging jet device created a comfortable indoor environment. A mixing supply device and a displacement supply device were also analyzed.
1.3. Unsteady Ventilation
Intermitted and unsteady ventilation is yet another solution that has been developed to enhance the performance of a mixing ventilation system [1]. These systems rely on unsteady ventilation generated by free convection. Indoor air is distributed in all directions, and it has low momentum. Fresh air is supplied at high velocity, and mixing effects are powerful. The operation of a ventilation system is influenced not only by temperature, relative humidity and carbon dioxide levels, but also by the difference between outdoor and indoor pressure. In diffuse ventilation, indoor pressure is only minimally higher than outdoor pressure, and it changes with variations in outdoor pressure, which forces air to flow into a room. Intermittent ventilation systems have also been proposed, where fresh air is not supplied continuously and the system is operated intermittently [1]. Such solutions are referred to as on/off or step ventilation. Unsteady ventilation can also involve varied (sinusoidal) air supply rates [1]. In this solution, the movement of air exerts much stronger cooling effects [80].
The following systems and approaches rely on unsteady ventilation [1]:
- -
- “BaOpt” (www.climotion.com).
- -
- TwinXChange and CrossXChange (www.howatherm.de).
- -
- FVPpulse (www.ltg.de).
- -
- Systems with time-varying flow rates [81].
- -
- -
- Air supply devices that stimulate natural wind [87].
- -
- Air handling unit for temperature and velocity control [88].
Unsteady and intermittent ventilation delivers numerous benefits. Stronger mixing effects can improve the IAQ and reduce pollutant concentrations in occupancy zones. Stronger mixing effects combined with smaller differences in vertical temperature are particularly beneficial in higher rooms. In unsteady ventilation systems, air is distributed in various directions, which prevents the accumulation of steady large eddies in the room. These systems are also characterized by effective exchange of air, turbulent flow, constant indoor temperature, air velocity and particle distribution. Reduced airflow rates decrease energy consumption, and the risk of draft is minimized. Unsteady ventilation also delivers stronger cooling effects, improves comfort and increases setpoint temperature, which is particularly desirable in warm and hot climates [1].
1.4. Coanda Effect Hysteresis in Ventilation
These benefits prompted Professor Zygmunt Wierciński to design a theoretical solution based on the unsteady ventilation principle. In the proposed solution, when air is supplied at an angle that leads to Coanda effect hysteresis (CEH), the incorporation of an additional harmonic air jet in the designed system supports the intermittent attachment and separation of the air jet that is directed toward an obstacle [89,90]. Various structural partitions can be used for this purpose, such as a vertical wall that is situated at a certain distance from the nozzle, or a ceiling where air is supplied an at appropriate angle.
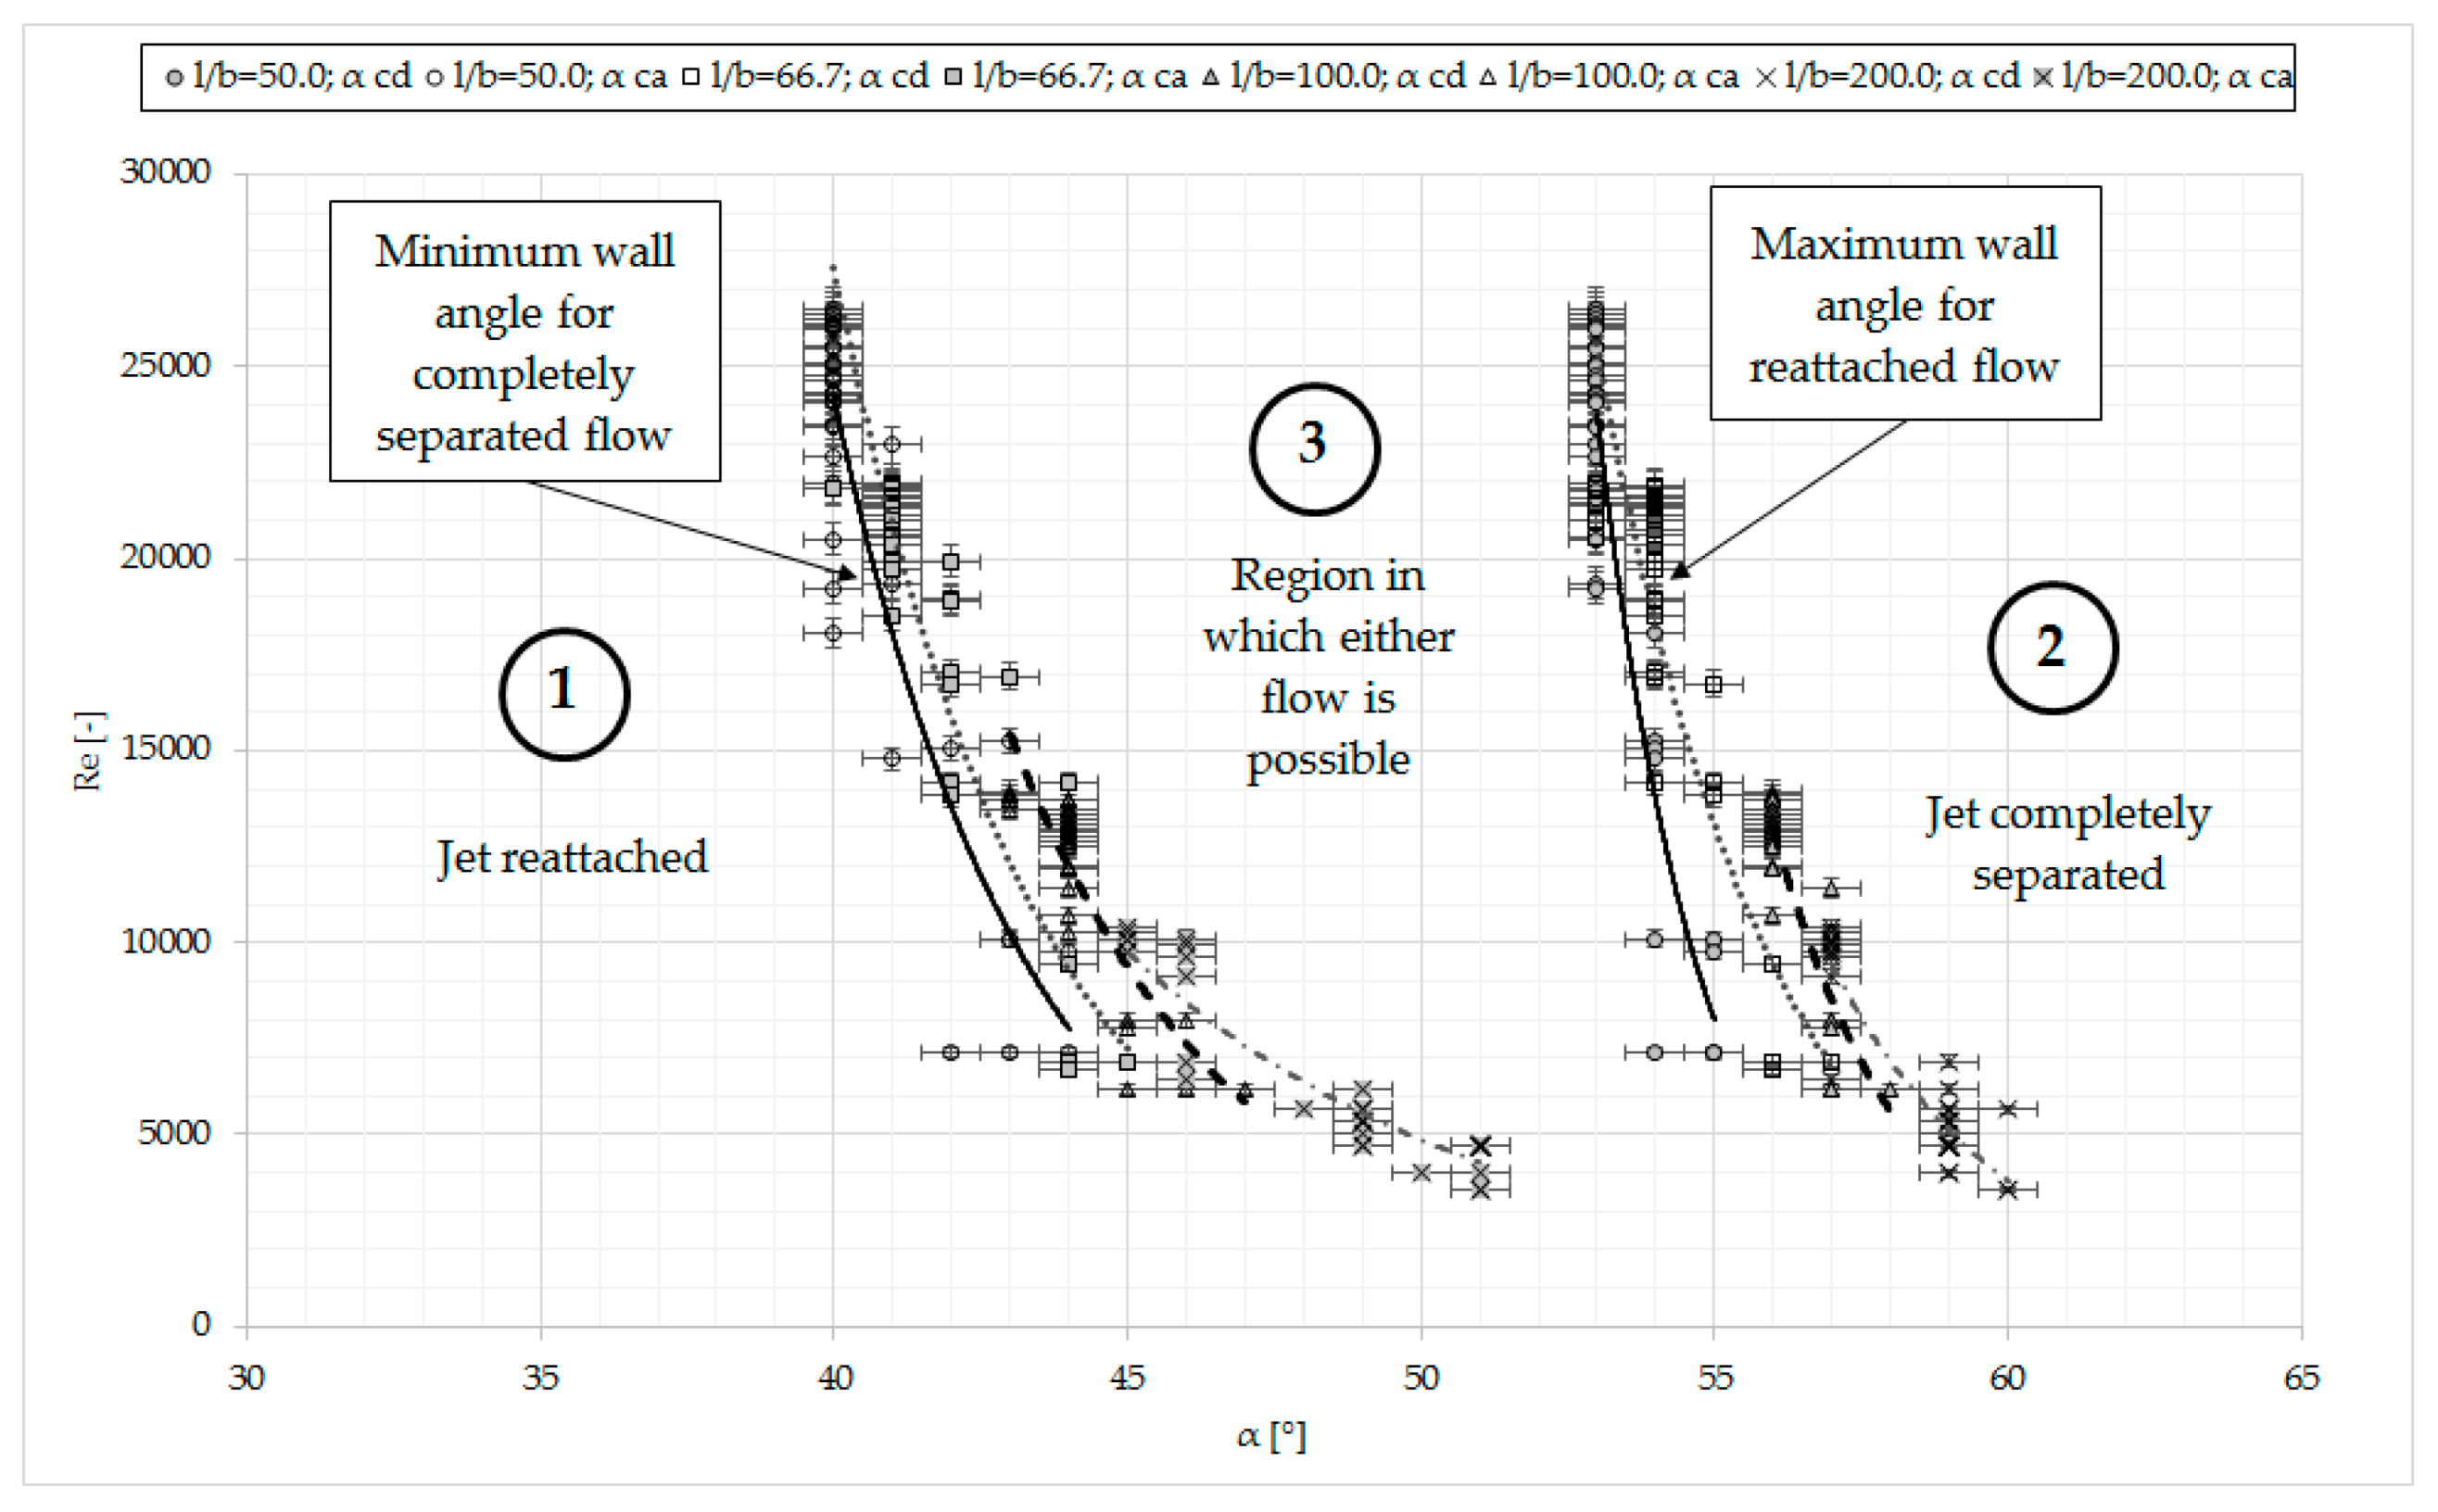
The term “hysteresis” is derived from Ancient Greek (hystérēsis), and it means “deficiency” or “lagging behind.” Hysteresis describes the dependence between the present state of a system and its previous states. The concept of CEH was introduced by Newman [91] to describe the relationship between air jet behavior (a free jet or a jet attached to a flat plate) and the plate deflection angle. Two types of air flow are possible within a given range of deflection angles , which are determined by the ratio of plate length to nozzle width : a free air jet or a jet attached to the plate with a cavitation bubble. Jet behavior is influenced by initial flow conditions. When analyses of jet behavior begin with small values of , an increase in the deflection angle will cause the jet to become attached to the plate in the angle of hysteresis, until a critical angle of jet separation is achieved. If observations begin with high values of when the air jet is free, a decrease in the deflection angle will not cause the jet to become attached to the plate in the entire range of values of the hysteresis region until a critical angle of jet attachment is achieved. The jet will remain attached to the plate after has been attained.
Three CEH regions can be identified (Figure 1):
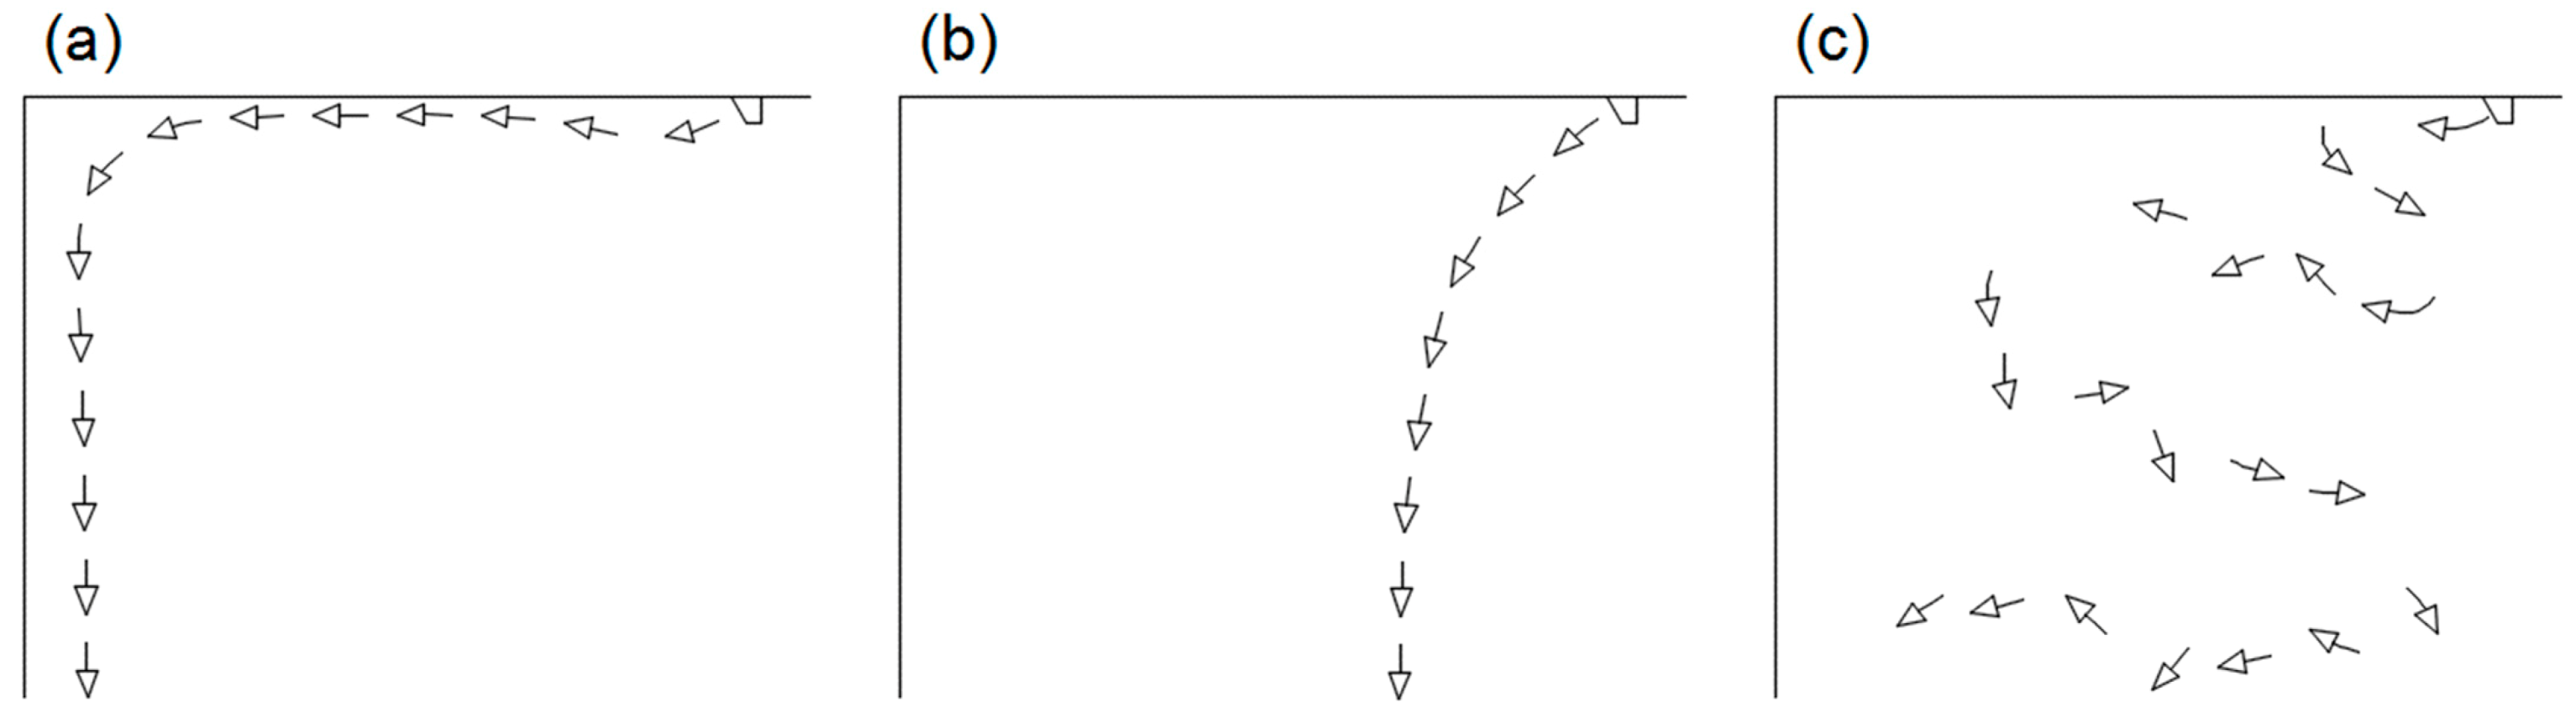
The possible flows of the ventilation air were described for the needs of the analysis (Figure 2). Steady-state flow occurs in the region of the smallest critical angles of jet separation and attachment, and the jet will be always attached to a structural partition positioned in relative proximity (Figure 2a). The region of jet attachment is marked as 1 in Figure 1. In the region of the largest critical angles (Figure 2b), the air jet flows freely regardless of structural partitions. The region of free flow is marked as 2 in Figure 1. Both types of flows (Figure 2a,b) are steady-state flows which are characterized by constant value, direction, sense and velocity. This study focuses on region 3 in Figure 1 where CEH occurs and where the jet can be attached to the wall or can be completely separated from the wall [91,92]. In an unsteady ventilation system based on the CEH phenomenon, an auxiliary nozzle can be incorporated into the system to switch between attached and separated jet flow (Figure 2c). As a result, the ventilated premises will be supplied with intermittent jets of fresh air. Rapid changes in jet flow (reattached/separated) will take place in the direct proximity of the nozzle. As a result, the horizontal reach of the air jet will increase in the occupancy zone away from the nozzle. Unsteady intermittent air flow will occur, where the supplied air will move both vertically and horizontally. This solution improves air mixing and decreases velocity and temperature gradients in the occupancy zone.
Our previous research into CEH [92] confirmed Newman’s observation [91] that in a system with a given geometry (plate length and nozzle width), only and have to be calculated to determine the parameters of jet reattachment. In turn, and have to be defined to determine the parameters of jet separation. The critical angles of jet separation and jet attachment are determined by the Reynolds number, and they decrease with an increase in Re. In this experiment, the maximum value of the critical angle of jet separation was determined at 60° (Re = 3567, l/b = 200.0), and the minimum value of was determined at 53° (Re = 25489, l/b = 50.0). The maximum value of the critical angle of jet attachment was 40° (Re = 25489, l/b = 50.0), and the maximum value of was 51° (Re = 3567, l/b = 200.0). The hysteresis angle , which represents the difference between the critical angle of jet separation and the critical angle of jet attachment, , was 12.6° on average.
Coanda effect hysteresis remains insufficiently investigated in the literature; this phenomenon has been addressed by few authors, among them Allery et al. [93] and Fernholz [94]. To the best of the author’s knowledge, ventilation systems that rely on CEH have not been proposed to date, despite the fact that the Coanda effect is a well-known phenomenon that is widely used in ventilator design. The occurrence of the Coanda effect in ventilation has been discussed by [95,96,97]. Li [6] demonstrated that attachment ventilation based on the Coanda effect decreases the flow rate of fresh air by 20% and chiller capacity by 22%. The tested solution improved the performance of an air-conditioning system by 17% and reduced the wear of air duct material by 14.3%. Various nozzle designs have been developed based on the Coanda effect [98]. The Coanda effect was also used to design a dust exhaust system where the volume of exhaust air was decreased by more than 50%. The proposed solution can be applied to decrease energy consumption in dust exhaust and general ventilation systems by as much as 30–70% [99].
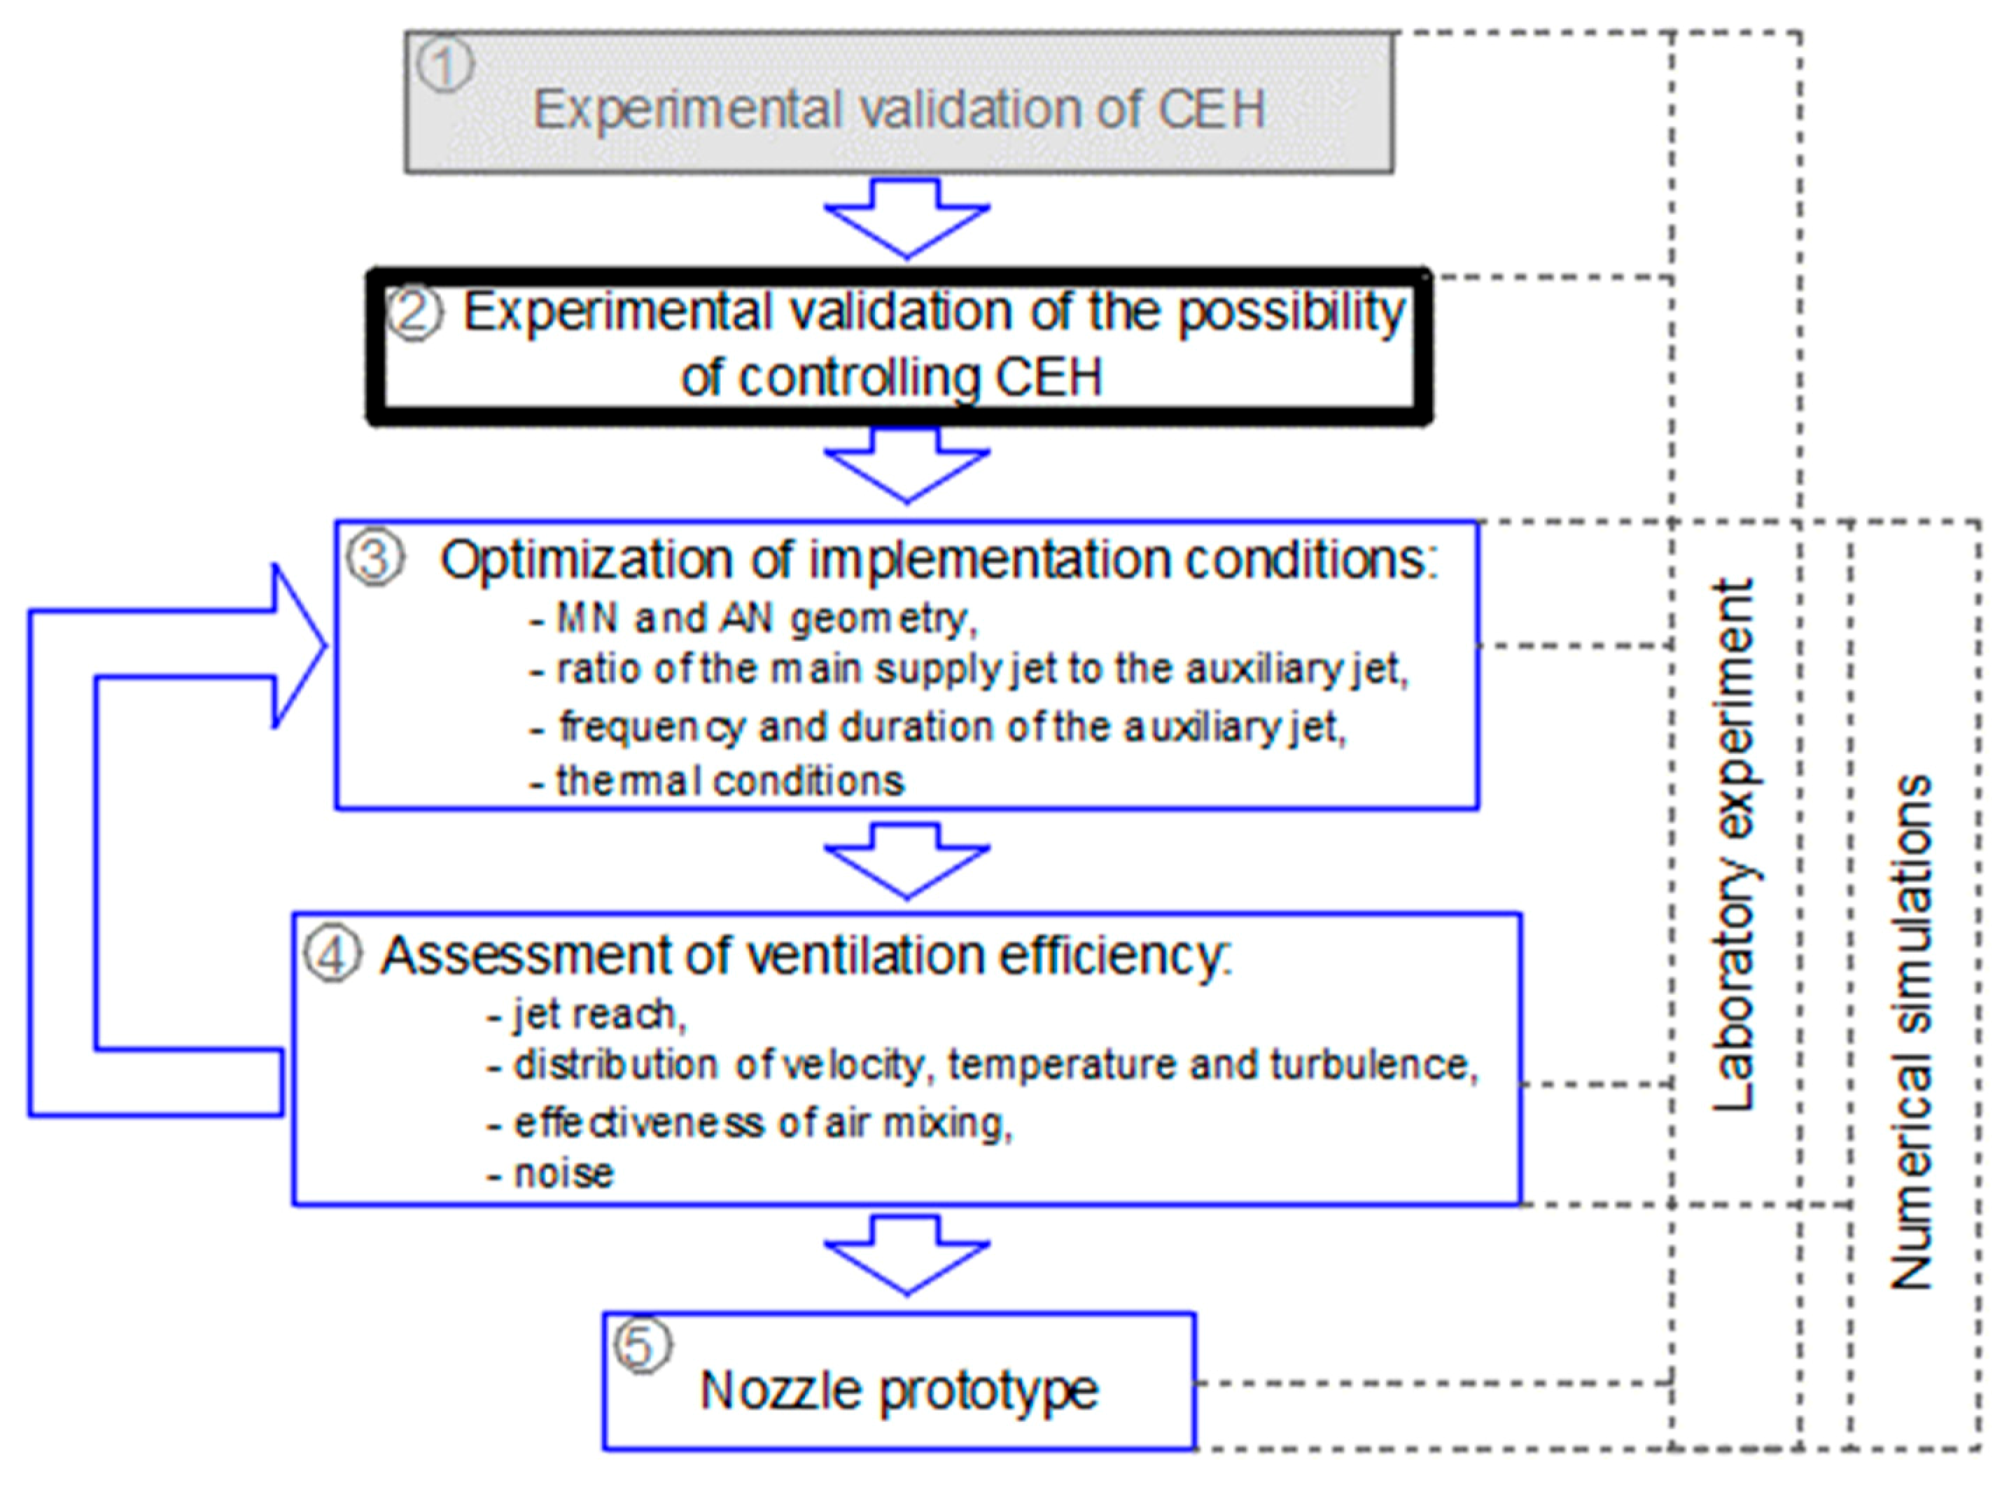
This article presents the results of a subsequent stage of a research project aiming to implement the theoretical concept proposed by Professor Wierciński. In our previous study (Figure 3, step 1), CEH was confirmed experimentally, the range of hysteresis angles was verified and air jet parameters were determined [92]. However, previous experiments involved only a single injector nozzle. In the present study (Figure 3, step 2), the experimental setup was modified by introducing an additional supply diffuser. Based on the results reported by [100,101,102], it was assumed that an auxiliary jet would influence the main supply jet. This study did not aim to measure changes in the parameters of the main supply jet, but to determine whether an additional (auxiliary) jet would affect CEH. If the influence of the auxiliary jet is confirmed, the results of this study could be used to design an unsteady ventilation system based on CEH.
2. Materials and Methods
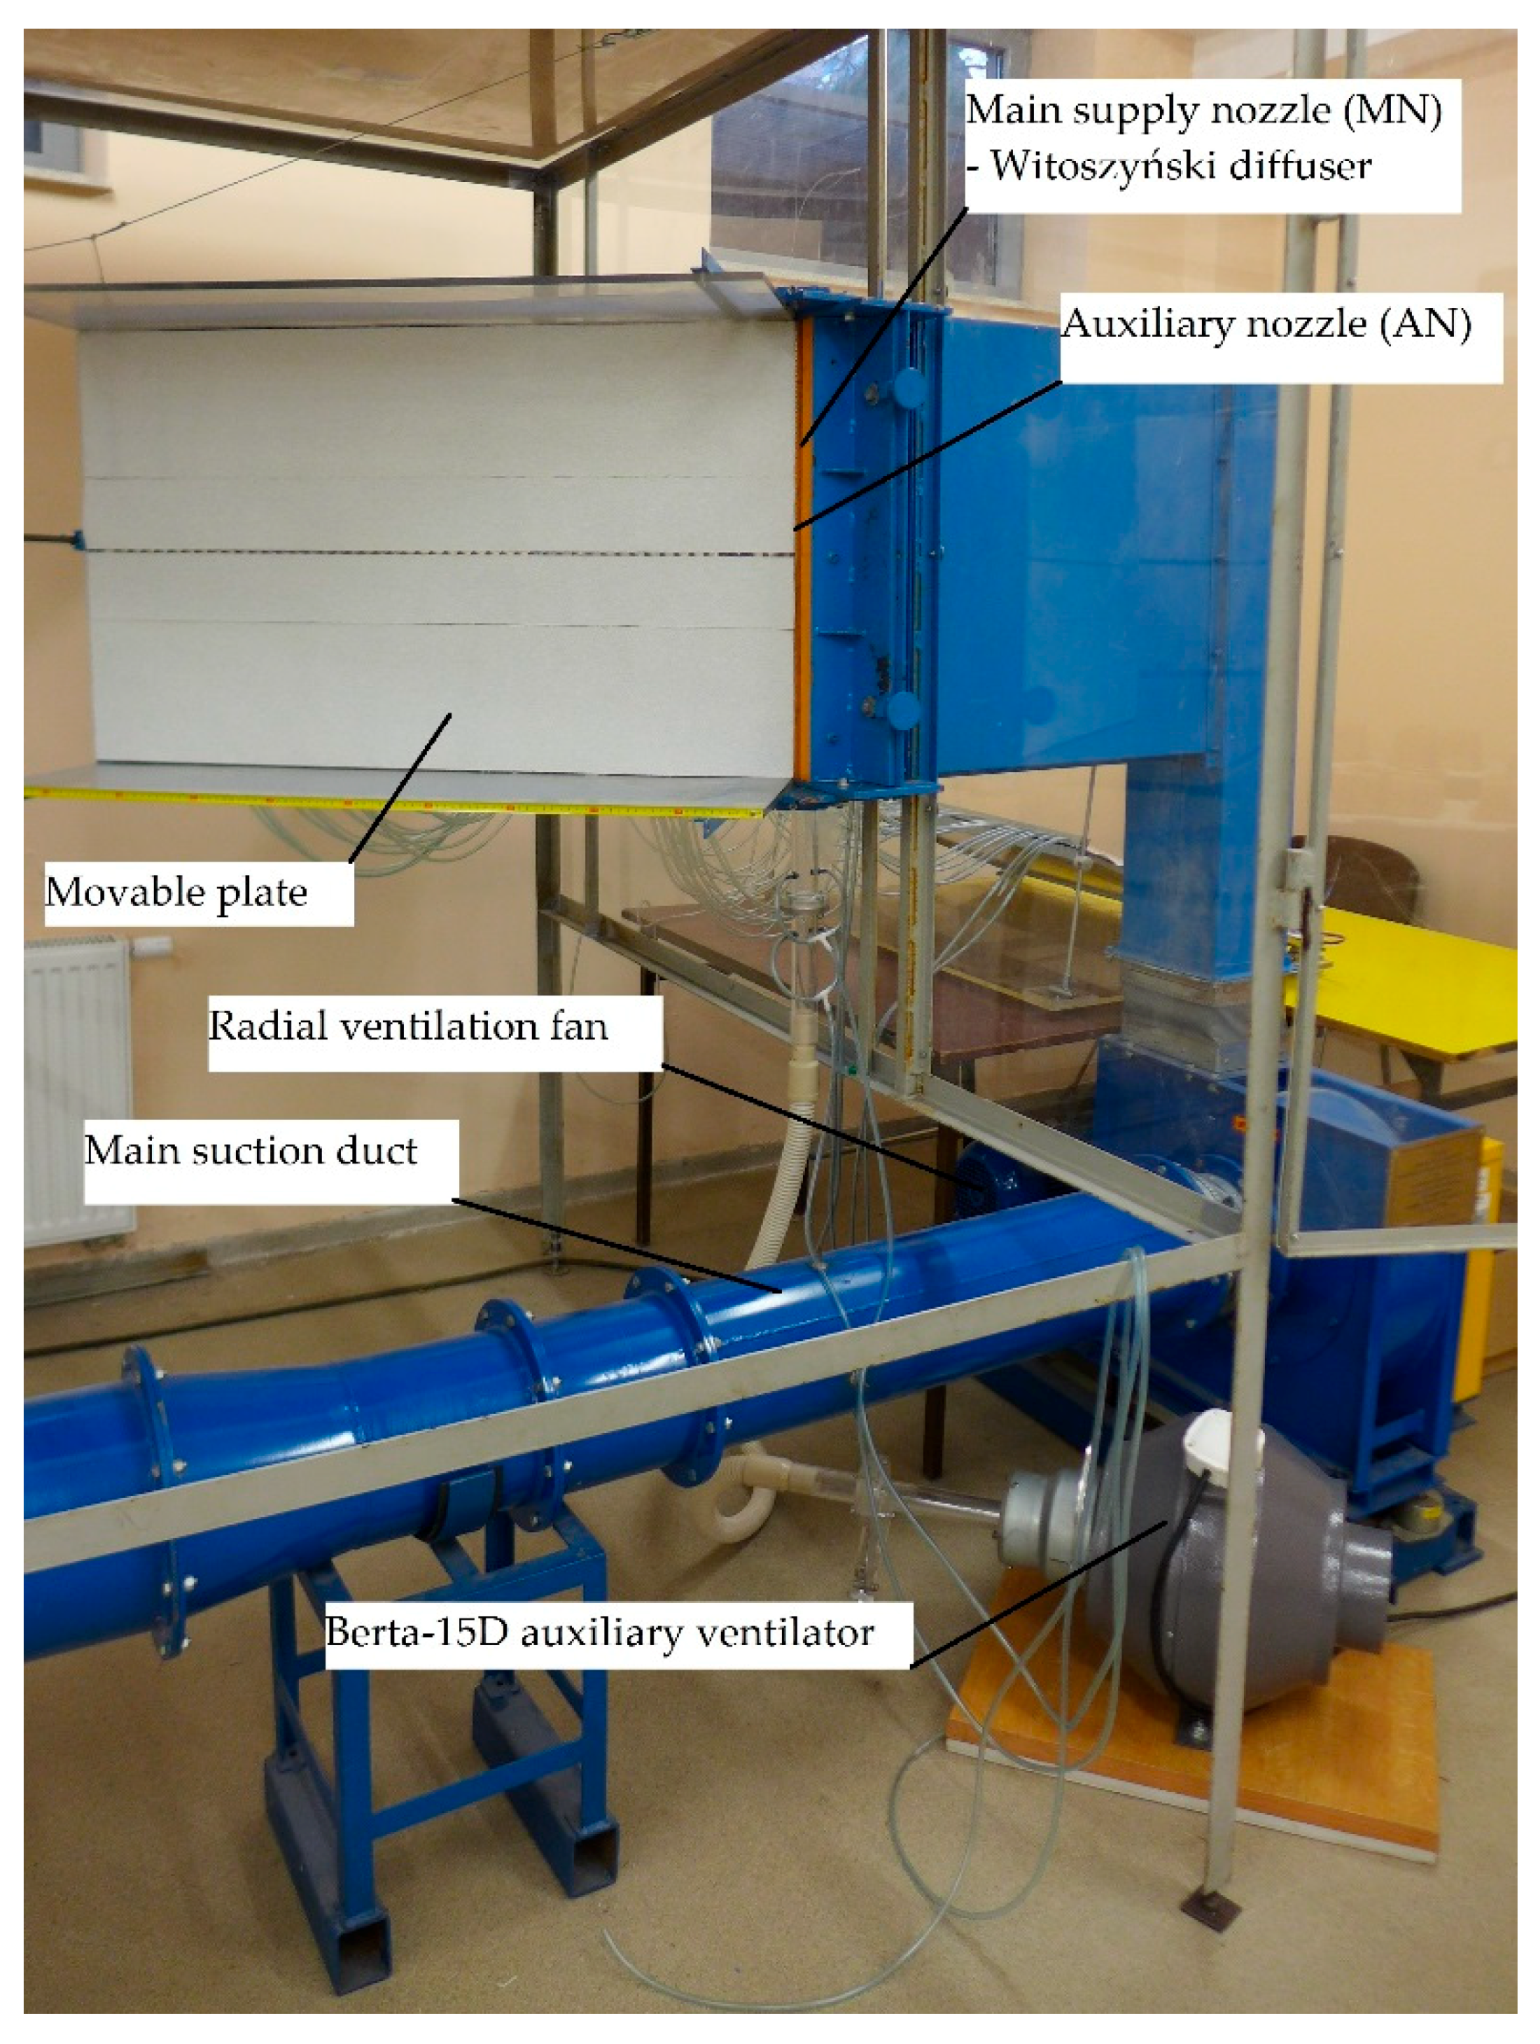
The measurements were performed on a test bench at the Faculty of Geoengineering of the University of Warmia and Mazury in Olsztyn. The main elements of the test bench were two rectangular ventilation nozzles positioned perpendicular to one another, and a mobile plate mounted at the exit of the ventilation nozzles (Figure 4). The main supply nozzle (MN) was a Witoszyński diffuser with two pivoted wooden slats. The nozzle had a fixed height of h = 600 mm. The nozzle’s width could be modified, and a fixed width of b = 20 mm was used in the experiment. A flow rectifier funnel was mounted on the injector nozzle before the Witoszyński diffuser to generate a flat jet with the lowest possible turbulence. The second nozzle could be operated as both an injection nozzle and a suction nozzle. The auxiliary nozzle (AN) had a fixed width of b’ = 5 mm. Both nozzles had an identical height of h = h’ = 600 mm. The longer side of the AN was positioned in the proximity of the main nozzle (MN) in vertical plane Z. When viewed from above, the nozzles were perpendicular to one another in horizontal plane XY. A mobile plate was mounted at the AN outlet, parallel to one of its edges. The plate had a fixed length of l = 1.00 m. The deflection angle between the plate and the MN axis was set manually, and it was read from the scale on a guide rod for positioning the plate.
Air was supplied to the MN via a suction hose with a diameter of 0.25 m and length of 5.30 m, positioned 0.40 m above the floor. The hose was attached to an air inlet with a diameter of 0.40 m and regulated air flow rate. An orifice for measuring static pressure was mounted on the suction hose to determine the air flow rate. The hose was connected with flexible couplings to a general-purpose radial fan with a Sg 100 L-2 three-phase, one-speed induction motor with an EFF2 squirrel-cage rotor. Motor output power was 3 kW, and motor speed was 2905 rpm. The motor was connected to the ventilator via a belt drive. The MN (Witoszyński diffuser) was connected to the fan’s suction side with flexible couplings and a connector.
Air was supplied to the AN by the Berta-15D fan (motor output power was 0.155 kW, and motor speed was 2600 rpm) connected to a junction box with a flexible conduit with a diameter of 32 mm. The fan could be used for both supply and exhaust ventilation. The AN was operated as an injection nozzle when air was pumped by the fan, and it was operated as a suction nozzle when air was sucked by the fan. An orifice for measuring pressure was mounted on the conduit connecting the auxiliary fan to the AN. Air flow in the AN was controlled with the use of orifice plates with different diameter. Three orifice plates were applied in the experiment: orifice A—Ø 26.4 mm, orifice B—Ø 22.1 mm and orifice C—Ø 18.1 mm. To prevent external disturbances, the test bench was enclosed in a metal frame with plexiglass panels. The test bench had the following dimensions: width—3.850 m, depth—2.009 m, height—2.290 m.
Differences in pressure between the AN and the MN were measured in the orifice with the Introl HMG 01 pressure gauge. The results were used to calculate air flow in each nozzle. Temperature, relative humidity and barometric pressure were measured with the HD 2001 T gauge. Velocity and turbulence distribution in a free jet and an attached jet were measured with the ATU2001 hot-wire anemometer, which was connected to a computer and controlled with the use of self-designed software. The system and the software were designed and developed at the Fluid Mechanics Laboratory of the Strata Mechanics Research Institute of the Polish Academy of Sciences. Dimensionless velocity distribution (ratio of the average velocity to the velocity at the diffuser outlet ) and turbulence were calculated based on the distribution of average velocity with the use of formula (1):
In our previous study [92], only the MN was installed on the test bench for analyzing CEH. The present study aimed to determine whether an AN installed at the outlet of the Witoszyński diffuser can influence CEH. Three cases were analyzed:
- -
- Case 1: MN—only the MN was used;
- -
- Case 2: MN+AN INJ—both nozzles were used, where the AN was an injection (INJ) nozzle;
- -
- Case 3: MN+AN SUC—both nozzles were used, where the AN was a suction (SUC) nozzle.
The range of the Coanda effect, the hysteresis angle and the critical angles of jet attachment αca and jet separation αcd were determined. Changes in deflection angle α and the air flow rate in the MN and the AN were monitored for MN with a fixed width of b = 0.020 m and AN with a fixed width of b’ = 0.005 m. In a preliminary analysis, the distribution of velocity and turbulence was determined for nozzle width b = 0.020 m and different values of Re.
3. Results
The experiment was conducted at different air flow rates in the MN and the AN (Figure 5), and, consequently, different values of the Reynolds number, which were determined with the use of formula (2):
The Reynolds number ranged from around 16,500 to around 19,600 in the MN. Three orifice plates (A, B and C) were applied to obtain different injection and suction flow rates in the AN. Despite the fact that the operating parameters of the MN and AN were kept constant during the experiment, the ratio of the Reynolds number of the auxiliary jet to the Reynolds number of the main jet ranged from 1.6% to 5.9% (average of around 2.7%) when the AN was operated as an injection nozzle, and it ranged from 1.8% to 14.4% (average of 5.0%) when the AN was operated as a suction nozzle. These differences resulted from the mutual interactions between the main jet and the auxiliary jet.
The auxiliary jet was reduced to a minimum to maximize the energy efficiency of the proposed solution. The influence of auxiliary injection and suction jets on the parameters of the main jet was analyzed. The distribution of velocity and turbulence was determined with the use of a hot-wire anemometer in the region of angular deflection where CEH does not yet occur ( = 30°). Three types of jet interactions were examined: (1) when only the MN was used (Re = 18,346) (MN—case 1); (2) when the MN (Re = 18,112) was operated together with the AN (Re = 542) as the injection nozzle (MN + AN INJ—case 2); (3) when the MN (Re = 18,799) was operated together with the AN (Re = 475) as the suction nozzle (MN + AN SUC—case 3). Orifice B was used in the tests. The tests were conducted in a local reference system, and measurements were performed at 19 points distributed across the duct cross-section (Figure 6). The point closest to the nozzle was positioned at the beginning of the flat plate in location x/b = 0.00. In the first 0.10 m of the plate, the measuring points were separated by a distance of 0.02 m. In successive parts of the plate, the points were separated by a distance of 0.05 m. The last measuring point was positioned in location x/b = 37.50. The cross-section of the duct was parallel to the flat plate, and measuring points were positioned at varied intervals. At the point that was positioned most remotely from the plate, measurements were performed until the velocity decreased below < 1 m/s or until the maximum reach of the tripod supporting the hot-wire anemometer (y/b = 10.50). The temperature and pressure were measured as closely as possible to the flat plate to observe the plate’s effects without damaging the hot-wire anemometer. Measurements were conducted with an accuracy of Y ± 0.00001 m. The distance between measuring points was determined dynamically: when rapid changes were observed in average velocity, the grid was densified to improve measurement accuracy. In each of the described cases, measurements were performed in a grid of around 650 points.
In case 1, an analysis of the average velocity distribution demonstrated that the maximum velocity was 23.71 m/s and the average velocity in the entire region of measurement was 9.15 m/s. The above values were determined to be = 24.82 m/s and = 9.51 m/s in case 2, and at = 25.95 m/s and = 11.05 m/s in case 3. In case 1, maximum turbulence was 48% and average turbulence was 26%. The above values were determined at 51% and 26%, respectively, in case 2, and at 43% and 28%, respectively, in case 3. A comparison of the maximum values of the analyzed parameters in different measurement planes (Figure 7) revealed similar values of in nearly all planes in all three cases. The greatest differences were observed in plane x/b between 3.0 and 5.0. This transitional zone was located directly behind the core zone [103]. In case 2, the value of in the transitional zone was around 5% higher than in case 1. In case 3, the value of in the transitional zone was around 5% lower than in case 1. Maximum turbulence was similar in all planes. The only exception was noted in case 3 in position x/b = 7.5, where was around 28% lower than in the remaining cases.
The interactions between the MN and the AN influenced jet geometry (Figure 4). Changes were observed mainly in the initial part of the jet, directly behind the nozzles. The radius of the cavitation bubble increased when the AN was operated in injection mode (case 2). The radius and the height of the cavitation bubble decreased when the AN was operated in suction mode (case 3). These changes were most visible at a distance of x/b = 4.0 (Figure 4). Despite similar values of and in plane x/b in the examined cases, the maximum values of these parameters were noted at various distances from the plate. In case 2, where the AN was operated as an injection nozzle, maximum velocity occurred further from the plate (difference of x/b = 0.50) than in case 1, and maximum turbulence was noted further from the plate (difference of x/b = 0.60) than in case 1. In case 3, where the AN was operated in suction mode, maximum velocity occurred closer to the plate (difference of x/b = 0.55) than in case 1, and maximum turbulence was noted closer to the plate (difference of x/b = 0.30) than in case 1. In all three cases, jet parameters became similar at a distance of x/b = 15.0.
When the AN was operated in suction mode (case 3), the jet became reattached to the plate already at around x/b = 6.0. In case 1, when only the MN was in use, the jet was reattached at x/b = 7.5, whereas in case 2, the jet was reattached at around x/b = 9.0 (Figure 8). These results induced differences in location , where the average velocity perpendicular to the jet axis was equal to half the maximum velocity at a given measuring point .
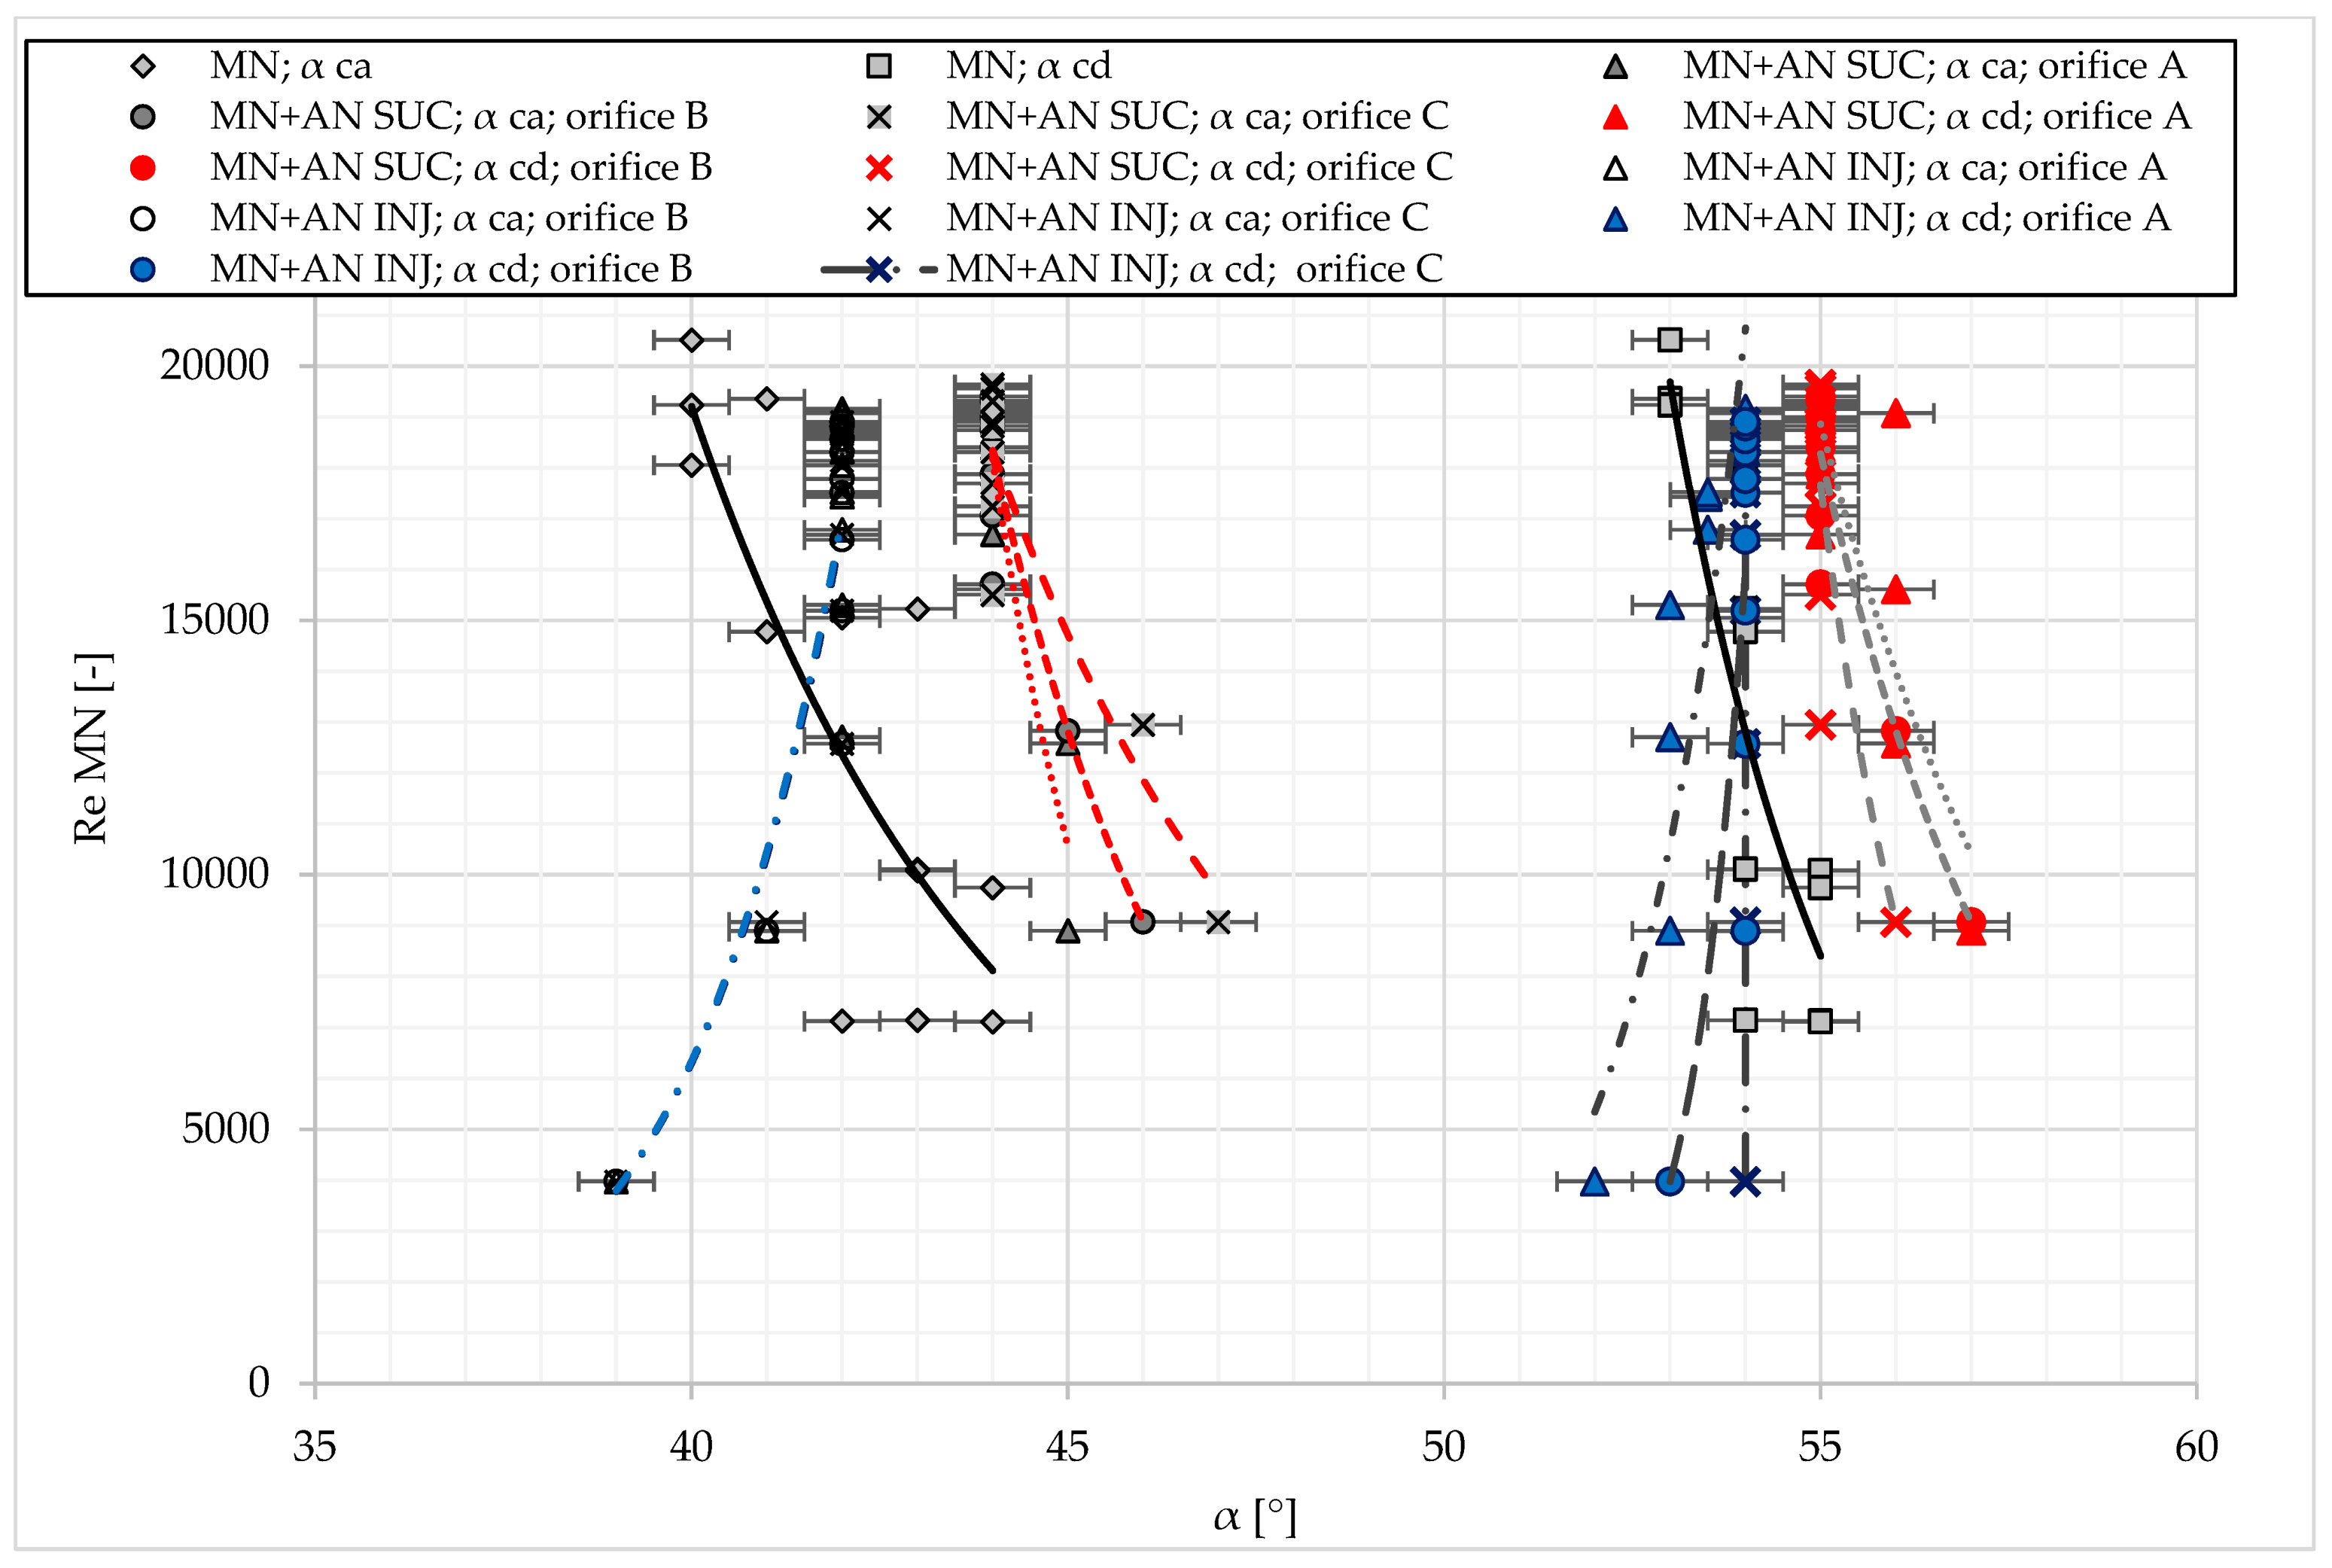
In case 1 (MN only), the range of hysteresis angles (Figure 9) was similar to that determined previously on the same test bench [92] and comparable to that determined by Newman [91]. At l/b = 50.0, the hysteresis angle, i.e., the difference between the critical angle of jet separation and the critical angle of jet attachment , was 12.6°. The values of both critical angles were determined by the Reynolds number, and they decreased with a rise in Re. In case 1, Re ranged from around 7200 to around 20,500 when the critical angle of jet attachment was determined at 44° and 40°, respectively, and when the critical angle of jet separation was determined at 55° and 53°, respectively. The results noted in cases 2 and 3 were compared with case 1. The influence of the Reynolds number of the AN decreased with a rise in the Re of the MN. In case 2, the angle of critical jet separation increased with a decrease in the Re of the AN. The critical angle of jet attachment was not affected by the Re of the AN. In case 3, the angle of critical jet separation increased with a decrease in the Re of the AN, whereas the critical angle of jet attachment decreased with a decrease in the Re of the AN.
In contrast to case 1 (MN only), both critical angles increased with a rise in the values of the Re when the MN was used in combination with the AN operating in injection mode (MN + AN INJ) (case 2). The angle of critical attachment decreased by around 5° for the smallest Reynolds numbers and increased by around 2° for the largest Reynolds numbers. When the Reynolds number approximated 13,500, the angle of critical attachment was identical in case 1 (MN) and case 2 (MN+AN INJ). The critical angle of separation decreased by around 3° for the smallest Reynolds numbers and increased by around 1° for the largest Reynolds numbers. When the Reynolds number approximated 13,000, the angle of critical attachment was identical in case 1 (MN) and case 2 (MN+AN INJ). The angle of hysteresis was determined at 12.1°.
Similar to case 1 (MN only), both critical angles decreased with a rise in Re when the MN was combined with the AN operating in suction mode (MN + AN SUC) (case 3). The angle of critical attachment increased by around 3° for the smallest Reynolds numbers and increased by around 4° for the largest Reynolds numbers. The critical angle of separation increased by around 2° for the smallest Reynolds numbers and increased by around 2° for the largest Reynolds numbers. The angle of hysteresis was determined at 11.0°.
4. Discussion
The occurrence and range of CEH for a single jet of air produced by the main supply nozzle were similar to those determined in the author’s previous study [92] as well as the results reported by Newman [91]. The above observation confirms that for the same Reynolds number, the range of CEH is defined by different critical angles of jet attachment and separation , which, subject to the initial deflection angle, produce a free jet or, under the influence of the Coanda effect, an attached jet. The novelty of the present study rests in the application of an auxiliary nozzle (AN) for controlling CEH. The study demonstrated that the auxiliary jet changes the critical angles of jet attachment and separation . The interactions between two proximal air jets are generally known and are used in various engineering solutions, such as the design of ventilation nozzles in the referenced articles. In the discussed case, the smallest possible auxiliary jet should be applied to minimize the amount of energy used for jet generation and nozzle design. Attempts to minimize the auxiliary air jet were made already in the present experiment. However, the obtained results are not conclusive. In the analyzed case, the auxiliary jet was sufficient to confirm the research assumptions, but the optimal ratio of the auxiliary jet to the main supply jet and the boundary values of both jets for producing the desired effect remain unknown. When the Reynolds number for the main supply jet exceeds 15,000, all three variants of the auxiliary jet produce the same result (Figure 9). The smaller the Reynolds number for the main supply jet, the greater the difference in the critical angles of the tested auxiliary jets. The auxiliary jet modified the CEH when the AN was operated in both injection and suction mode. For the needs of a real-world ventilation system, the application of the AN in suction mode appears to be more predictable and stable. This configuration does not disrupt the relationship between both critical angles and the Reynolds number when only the MN is used. For example, when Re is estimated 13,000 and the deflection angle is 55°, the air jet will be free in a ventilation system with MN only, but it will be attached to the wall when an additional nozzle operating in suction mode is incorporated into the system. In a system with a constant geometry, the AN is the sole factor responsible for the change in jet attachment and separation. The relationship between the Reynolds number and both critical angles is disrupted in the injection mode. When Re reaches 13,500, the incorporation of the auxiliary jet does not affect the value of critical angles of the attachment and separation at a certain point (Figure 9). In the analyzed case, the above implies that the type of air jet will remain unchanged regardless of whether the AN was incorporated into the system.
The novelty of the current research also stems from the application of the CEH concept in unsteady mixing ventilation. The CEH concept was originally developed by Professor Wierciński nearly 60 years ago, but it is not widely known and has rarely been applied in practice. To the best of the author’s knowledge, only one experimental and numerical study examining the applicability of the Coanda effect for reducing self-sustained tones based on proper orthogonal decomposition has been published to date [93]. The derived experimental data confirm that the Coanda effect can be applied in practice, but further research is needed to design the nozzle and evaluate its effect on unsteady or mixing ventilation. In the light of the cited research, the application of CEH in unsteady ventilation appears to be a realistic, logical and justified solution. In unsteady ventilation systems, the intermittent attachment and separation of the air jet from the wall will increase the horizontal reach of supplied air, improve air mixing efficiency and decrease velocity and temperature gradients in the occupancy zone. However, further research is required to address the above issues. This experiment demonstrated that CEH can be deployed in unsteady ventilation systems, but air mixing efficiency, the served area, thermal comfort, IAQ, possible changes in demand for fresh air and energy savings cannot be evaluated based on the obtained results.
5. Conclusions
The study demonstrated that CEH can be modified when an additional air jet is introduced to the system. The critical angle of attachment and the critical angle of separation , which determine the angle of CEH, were modified even when the auxiliary jet did not induce changes in jet parameters (flow rate and turbulence), but induced changes in the diameter of the cavitation bubble.
The application of an auxiliary nozzle modified Coanda effect hysteresis. These changes were observed when the AN was operated in both injection and suction mode. Coanda effect hysteresis was more effectively controlled when the AN was operated in suction mode (MN + AN SUC). In this case, the average angle of CEH was around 11°, and it was similar to that noted in case 1 (MN only). However, due to the presence of correlations between the Reynolds number and the values of both critical angles of deflection, the auxiliary suction nozzle increased the critical angle of attachment by around 3° and the critical angle of separation by around 2°. An inverse relationship between the Reynolds number vs. the angle of critical attachment and the angle of critical separation was observed when the AN was operated in injection mode. In this case (MN + AN INJ), both critical angles of deflection increased by around 2° for the largest Reynolds numbers and decreased by around 4° for the smallest Reynolds numbers relative to the base scenario where only the MN was used. Despite the fact that the average angles of critical attachment and critical separation were identical for MN and MN + AN INJ, the application of an auxiliary jet with Re of around 13,500 did not influence the angle of CEH.
The applied auxiliary jet was minimized to increase the energy efficiency of unsteady flow with CEH. The auxiliary jet influenced the main jet by inducing a minor change in the diameter of the cavitation bubble in the initial segment of flat plate which was positioned directly behind the nozzle. The smaller the Reynolds number of the main jet, the greater the difference in the CEH angle induced by auxiliary jets with different values of Re. An auxiliary jet with higher values of Re can be expected to induce greater changes in critical deflection angles.
Further research is needed to validate the results of the present experiment. In the future, the influence of the auxiliary jet on CEH should be examined at different widths of the MN. The interactions between the main jet and the auxiliary jet should be optimized within a selected range of CEH angles to promote the intermittent attachment of the air jet to the plate as well as the free jet flow without the Coanda effect. The effectiveness of air mixing in the proposed ventilation system should be evaluated for different positions of the nozzle and the flat plate. Noise emissions in the system should also be measured.
This study demonstrated that CEH can be applied in the process of designing unsteady ventilation systems. The present findings can be used to develop a novel solution for improving the energy efficiency and performance of mixing ventilation systems.
Funding
This research received no external funding.
Acknowledgments
The author would like to thank Zygmunt Wierciński, who conducted pioneering research into Coanda effect hysteresis at the University of Warmia and Mazury in Olsztyn. This study would not have been possible without Wierciński’s guidance and support in the process of acquiring research funds and developing the experimental setup.
Conflicts of Interest
The authors declare no conflict of interest.
Symbols
| width of the main nozzle, [m]; | |
| width of the auxiliary nozzle, [m]; | |
| height of the main nozzle, [m]; | |
| height of the auxiliary nozzle, [m]; | |
| length of the flat plate, [m]; | |
| Reynolds number, [-] | |
| Reynolds number for jet attachment, [-] | |
| Reynolds number for jet separation, [-] | |
| turbulence intensity, [%]; | |
| average velocity at measuring points in the air duct, positioned parallel to the jet axis, [m/s]; | |
| maximum average velocity at measuring points in the air duct, [m/s]; | |
| effective turbulence (standard deviation), [m/s]; | |
| average exit velocity in the main nozzle, [m/s]; | |
| plate deflection angle, [°]; | |
| critical angle of jet attachment, [°]; | |
| critical angle of jet separation, [°]; | |
| hysteresis region, [°]; | |
| kinematic viscosity of fluid, [m2/s]. |
References
- Mesenhöller, E.; Vennemann, P.; Hussong, J. Unsteady room ventilation–A review. Build. Environ. 2020, 169, 106595. [Google Scholar] [CrossRef]
- EEC. Energy in Figures. Statistical Pocketbook 2020; Publications Office of the European Union: Luxembourg, 2020. [Google Scholar]
- Directive, E.E. Directive 2012/27/EU of the European Parliament and of the Council of 25 October 2012 on energy efficiency, amending Directives 2009/125/EC and 2010/30/EU and repealing Directives 2004/8/EC and 2006/32. Off. J. 2012, 315, 1–56. [Google Scholar]
- EU Building Stock Observatory. Available online: https://ec.europa.eu/energy/eu-buildings-factsheets_en (accessed on 15 October 2020).
- Pérez-Lombard, L.; Ortiz, J.; Pout, C. A review on buildings energy consumption information. Energy Build. 2008, 40, 394–398. [Google Scholar] [CrossRef]
- Vakiloroaya, V.; Samali, B.; Fakhar, A.; Pishghadam, K. A review of different strategies for HVAC energy saving. Energy Convers. Manag. 2014, 77, 738–754. [Google Scholar] [CrossRef]
- Sherman, M.H.; Matson, N. Residential ventilation and energy characteristics. ASHRAE Trans. 1997, 103, 717–730. [Google Scholar]
- Perez-Lombard, L.; Ortiz, J.; Maestre, I.R. The map of energy flow in HVAC systems. Appl. Energy 2011, 88, 5020–5031. [Google Scholar] [CrossRef]
- SeppȨnen, O. Ventilation strategies for good indoor air quality and energy efficiency. Int. J. Vent. 2008, 6, 297–306. [Google Scholar]
- Laverge, J.; Janssens, A. Heat recovery ventilation operation traded off against natural and simple exhaust ventilation in Europe by primary energy factor, carbon dioxide emission, household consumer price and exergy. Energy Build. 2012, 50, 315–323. [Google Scholar] [CrossRef]
- Litiu, A. Ventilation system types in some EU countries. REHVA J. 2012, 1, 18–23. [Google Scholar]
- Suszanowicz, D. Optimisation of heat loss through ventilation for residential buildings. Atmosphere 2018, 9, 95. [Google Scholar] [CrossRef] [Green Version]
- Laverge, J.; Van Den Bossche, N.; Heijmans, N.; Janssens, A. Energy saving potential and repercussions on indoor air quality of demand controlled residential ventilation strategies. Build. Environ. 2011, 46, 1497–1503. [Google Scholar] [CrossRef] [Green Version]
- Zhou, L.; Haghighat, F. Optimization of ventilation system design and operation in office environment, Part I: Methodology. Build. Environ. 2009, 44, 651–656. [Google Scholar] [CrossRef]
- Ben-David, T.; Rackes, A.; Lo, L.J.; Wen, J.; Waring, M.S. Optimizing ventilation: Theoretical study on increasing rates in offices to maximize occupant productivity with constrained additional energy use. Build. Environ. 2019, 166, 106314. [Google Scholar] [CrossRef]
- Li, K.; Xue, W.; Xu, C.; Su, H. Optimization of ventilation system operation in office environment using POD model reduction and genetic algorithm. Energy Build. 2013, 67, 34–43. [Google Scholar] [CrossRef]
- Guo, R.; Heiselberg, P.; Hu, Y.; Zhang, C.; Vasilevskis, S. Optimization of night ventilation performance in office buildings in a cold climate. Energy Build. 2020, 225, 110319. [Google Scholar] [CrossRef]
- Guo, W.; Liu, X.; Yuan, X. Study on natural ventilation design optimization based on CFD simulation for green buildings. Procedia Eng. 2015, 121, 573–581. [Google Scholar] [CrossRef] [Green Version]
- Ecim-Djuric, O.; Topisirovic, G. Energy efficiency optimization of combined ventilation systems in livestock buildings. Energy Build. 2010, 42, 1165–1171. [Google Scholar] [CrossRef]
- Loomans, M.G.L.C.; Molenaar, P.C.A.; Kort, H.S.M.; Joosten, P.H. Energy demand reduction in pharmaceutical cleanrooms through optimization of ventilation. Energy Build. 2019, 202, 109346. [Google Scholar] [CrossRef]
- Stavrakakis, G.M.; Zervas, P.L.; Sarimveis, H.; Markatos, N.C. Optimization of window-openings design for thermal comfort in naturally ventilated buildings. Appl. Math. Model. 2012, 36, 193–211. [Google Scholar] [CrossRef]
- Serageldin, A.A.; Abdelrahman, A.K.; Ookawara, S. Parametric study and optimization of a solar chimney passive ventilation system coupled with an earth-to-air heat exchanger. Sustain. Energy Technol. Assess. 2018, 30, 263–278. [Google Scholar] [CrossRef]
- Yuan, F.; Dong, W.; Shen, G.; Li, Y.; Liu, W. Energy flow-based method for analysis and optimization of evaporative cooling and ventilation systems. Int. J. Heat Mass Transf. 2020, 146, 118865. [Google Scholar] [CrossRef]
- Baglivo, C.; D’Agostino, D.; Congedo, P.M. Design of a ventilation system coupled with a horizontal air-ground heat exchanger (HAGHE) for a residential building in a warm climate. Energies 2018, 11, 2122. [Google Scholar] [CrossRef] [Green Version]
- COMMISSION RECOMMENDATION (EU) 2016/1318 of 29 July 2016 on Guidelines for the Promotion of Nearly Zero-Energy Buildings and Best Practices to Ensure that, by 2020, all New Buildings are Nearly Zero-Energy Buildings; Publications Office of the European Union: Luxembourg, 2016.
- Kurnitski, J.; Buso, T.; Corgnati, S.P.; Derjanecz, A.; Litiu, A. nZEB definitions in Europe. REHVA Eur. HVAC J. 2014, 51, 6–9. [Google Scholar]
- Guillén-Lambea, S.; Rodríguez-Soria, B.; Marín, J.M. Review of European ventilation strategies to meet the cooling and heating demands of nearly zero energy buildings (nZEB)/Passivhaus. Comparison with the USA. Renew. Sustain. Energy Rev. 2016, 62, 561–574. [Google Scholar] [CrossRef]
- Toleikyte, A.; Kranzl, L.; Bointner, R.; Bean, F.; Cipriano, J.; De Groote, M.; Hermelink, A.; Klinski, M.; Kretschmer, D.; Lapilonne, B.; et al. ZEBRA 2020-Nearly Zero-Energy Building Strategy 2020; Strategies for a nearly Zero-Energy Building market transition in the European Union; ZEBRA: Lincoln County, IL, USA, 2020. [Google Scholar]
- Congedo, P.M.; Lorusso, C.; Baglivo, C.; Milanese, M.; Raimondo, L. Experimental validation of horizontal air-ground heat exchangers (HAGHE) for ventilation systems. Geothermics 2019, 80, 78–85. [Google Scholar] [CrossRef]
- Skotnicka-Siepsiak, A. Operation of a Tube GAHE in Northeastern Poland in Spring and Summer—A Comparison of Real-World Data with Mathematically Modeled Data. Energies 2020, 13, 1778. [Google Scholar] [CrossRef] [Green Version]
- Sha, H.; Qi, D. Investigation of mechanical ventilation for cooling in high-rise buildings. Energy Build. 2020, 228, 110440. [Google Scholar] [CrossRef]
- Sundell, J. On the history of indoor air quality and health. Indoor Air 2004, 14, 51–58. [Google Scholar] [CrossRef]
- Santos, H.R.; Leal, V.M. Energy vs. ventilation rate in buildings: A comprehensive scenario-based assessment in the European context. Energy Build. 2012, 54, 111–121. [Google Scholar] [CrossRef]
- Kephalopoulos, S.; Geiss, O.; Barrero-Moreno, J.; D’Agostino, D.; Paci, D. Promoting Healthy and Highly Energy Performing Buildings in the European Union: National Implementation of Related Requirements of the Energy Performance Buildings Directive (2010/31/EU). Sci. Policy Rep. 2017, 978–992. [Google Scholar] [CrossRef]
- Moreno-Rangel, A.; Sharpe, T.; McGill, G.; Musau, F. Indoor air quality in Passivhaus dwellings: A literature review. Int. J. Environ. Res. Public Health 2020, 17, 4749. [Google Scholar] [CrossRef] [PubMed]
- Park, J.S.; Jee, N.Y.; Jeong, J.W. Effects of types of ventilation system on indoor particle concentrations in residential buildings. Indoor Air 2014, 24, 629–638. [Google Scholar] [CrossRef] [PubMed]
- Hummelgaard, J.; Juhl, P.; Sæbjörnsson, K.O.; Clausen, G.; Toftum, J.; Langkilde, G. Indoor air quality and occupant satisfaction in five mechanically and four naturally ventilated open-plan office buildings. Build. Environ. 2007, 42, 4051–4058. [Google Scholar] [CrossRef]
- Brager, G.; Baker, L. Occupant satisfaction in mixed-mode buildings. Build. Res. Inf. 2009, 37, 369–380. [Google Scholar] [CrossRef] [Green Version]
- Zhao, L.; Liu, J. Operating behavior and corresponding performance of mechanical ventilation systems in Chinese residential buildings. Build. Environ. 2020, 170, 106600. [Google Scholar] [CrossRef]
- Park, J.S.; Kim, H.J. A field study of occupant behavior and energy consumption in apartments with mechanical ventilation. Energy Build. 2012, 50, 19–25. [Google Scholar] [CrossRef]
- Harvie-Clark, J.; Conlan, N.; Wei, W.; Siddall, M. How loud is too loud? noise from domestic mechanical ventilation systems. Int. J. Vent. 2019, 18, 303–312. [Google Scholar] [CrossRef]
- Afroz, Z.; Shafiullah, G.M.; Urmee, T.; Higgins, G. Modeling techniques used in building HVAC control systems: A review. Renew. Sustain. Energy Rev. 2018, 83, 64–84. [Google Scholar] [CrossRef]
- Cheng, Y.; Zhang, S.; Huan, C.; Oladokun, M.O.; Lin, Z. Optimization on fresh outdoor air ratio of air conditioning system with stratum ventilation for both targeted indoor air quality and maximal energy saving. Build. Environ. 2019, 147, 11–22. [Google Scholar] [CrossRef] [Green Version]
- Zucker, G.; Sporr, A.; Garrido-Marijuan, A.; Ferhatbegovic, T.; Hofmann, R. A ventilation system controller based on pressure-drop and CO2 models. Energy Build. 2017, 155, 378–389. [Google Scholar] [CrossRef]
- Simma, K.C.J.; Mammoli, A.; Bogus, S.M. Real-time occupancy estimation using WiFi network to optimize HVAC operation. Procedia Comput. Sci. 2019, 155, 495–502. [Google Scholar] [CrossRef]
- Tommasi, L.D.; Ridouane, H.; Giannakis, G.; Katsigarakis, K.; Lilis, G.N.; Rovas, D. Model-based comparative evaluation of building and district control-oriented energy retrofit scenarios. Buildings 2018, 8, 91. [Google Scholar] [CrossRef] [Green Version]
- Xu, Y.; Yan, C.; Liu, H.; Wang, J.; Yang, Z.; Jiang, Y. Smart energy systems: A critical review on design and operation optimization. Sustain. Cities Soc. 2020, 62, 102369. [Google Scholar] [CrossRef]
- Wu, Y.; Maravelias, C.T.; Wenzel, M.J.; ElBsat, M.N.; Turney, R.T. Predictive maintenance scheduling optimization of building heating, ventilation, and air conditioning systems. Energy Build. 2020, 110487. [Google Scholar] [CrossRef]
- Zhang, C.; Pomianowski, M.; Heiselberg, P.K.; Yu, T. A review of integrated radiant heating/cooling with ventilation systems-thermal comfort and indoor air quality. Energy Build. 2020, 223, 110094. [Google Scholar] [CrossRef]
- Chenari, B.; Carrilho, J.D.; da Silva, M.G. Towards sustainable, energy-efficient and healthy ventilation strategies in buildings: A review. Renew. Sustain. Energy Rev. 2016, 59, 1426–1447. [Google Scholar] [CrossRef]
- Ratajczak, K.; Amanowicz, Ł.; Szczechowiak, E. Assessment of the air streams mixing in wall-type heat recovery units for ventilation of existing and refurbishing buildings toward low energy buildings. Energy Build. 2020, 227, 110427. [Google Scholar] [CrossRef]
- Seppanen, O.A.; Fisk, W.J. Summary of Human Responses to Ventilation. Available online: https://escholarship.org/content/qt64k2p4dc/qt64k2p4dc.pdf (accessed on 16 October 2020).
- Jaakkola, J.J.; Miettinen, P. Type of ventilation system in office buildings and sick building syndrome. Am. J. Epidemiol. 1995, 141, 755–765. [Google Scholar] [CrossRef] [PubMed]
- Burge, S.; Hedge, A.; Wilson, S.; Bass, J.H.; Robertson, A. Sick building syndrome: A study of 4373 office workers. Ann. Occup. Hyg. 1987, 31, 493–504. [Google Scholar]
- Smedje, G.; Wang, J.; Norbäck, D.; Nilsson, H.; Engvall, K. SBS symptoms in relation to dampness and ventilation in inspected single-family houses in Sweden. Int. Arch. Occup. Environ. Health 2017, 90, 703–711. [Google Scholar] [CrossRef] [Green Version]
- Sun, Y.; Hou, J.; Cheng, R.; Sheng, Y.; Zhang, X.; Sundell, J. Indoor air quality, ventilation and their associations with sick building syndrome in Chinese homes. Energy Build. 2019, 197, 112–119. [Google Scholar] [CrossRef]
- Amouei, A.; Aghalari, Z.; Zarei, A.; Afsharnia, M.; Geraili, Z.; Qasemi, M. Evaluating the relationships between air pollution and environmental parameters with sick building syndrome in schools of Northern Iran. Indoor Built Environ. 2019, 28, 1422–1430. [Google Scholar] [CrossRef]
- Jayasooriya, V.M.; Rajapaksha, R.M.D.H.; Ng, A.W.M.; Muthukumaran, S. Associations of Indoor Carbon Dioxide Concentration and Symptoms of Sick Building Syndrome in Air-Conditioned Lecture Halls. Res. Sq. 2020. [Google Scholar] [CrossRef]
- Seppänen, O.; Kurnitski, J. Moisture control and ventilation. In WHO Guidelines for Indoor Air Quality: Dampness and Mould; World Health Organization: Geneva, Switzerland, 2009. [Google Scholar]
- Bakó-Biró, Z.; Clements-Croome, D.J.; Kochhar, N.; Awbi, H.B.; Williams, M.J. Ventilation rates in schools and pupils’ performance. Build. Environ. 2012, 48, 215–223. [Google Scholar] [CrossRef]
- Batterman, S.; Su, F.C.; Wald, A.; Watkins, F.; Godwin, C.; Thun, G. Ventilation rates in recently constructed US school classrooms. Indoor Air 2017, 27, 880–890. [Google Scholar] [CrossRef]
- Eidy, M.; Tishkowski, K. Radon Toxicity. StatPearls [Internet]; StatPearls Publishing LLC: Bethesda, MD, USA, 2020. [Google Scholar]
- Si, H. Indoor air pollution, lung cancer and solutions. Cancer Cell Res. 2018, 19, 464–470. [Google Scholar]
- Bivolarova, M.P.; Melikov, A.K.; Mizutani, C.; Kajiwara, K.; Bolashikov, Z.D. Bed-integrated local exhaust ventilation system combined with local air cleaning for improved IAQ in hospital patient rooms. Build. Environ. 2016, 100, 10–18. [Google Scholar] [CrossRef] [Green Version]
- Langvatn, H.; Bartz-Johannessen, C.; Schrama, J.C.; Hallan, G.; Furnes, O.; Lingaas, E.; Walenkamp, G.; Engesæter, L.B.; Dale, H. Operating room ventilation—Validation of reported data on 108,067 primary total hip arthroplasties in the Norwegian Arthroplasty Register. J. Eval. Clin. Pract. 2020, 26, 1022–1029. [Google Scholar] [CrossRef]
- Kembel, S.W.; Jones, E.; Kline, J.; Northcutt, D.; Stenson, J.; Womack, A.M.; Bohannan, B.J.; Brown, G.Z.; Green, J.L. Architectural design influences the diversity and structure of the built environment microbiome. ISME J. 2012, 6, 1469–1479. [Google Scholar] [CrossRef] [Green Version]
- Lipinski, T.; Ahmad, D.; Serey, N.; Jouhara, H. Review of ventilation strategies to reduce the risk of disease transmission in high occupancy buildings. Int. J. Thermofluids 2020, 7–8, 100045. [Google Scholar] [CrossRef]
- Mouchtouri, V.A.; Koureas, M.; Kyritsi, M.; Vontas, A.; Kourentis, L.; Sapounas, S.; Rigakos, G.; Petinaki, E.; Tsiodras, S.; Hadjichristodoulou, C. Environmental contamination of SARS-CoV-2 on surfaces, air-conditioner and ventilation systems. Int. J. Hyg. Environ. Health 2020, 230, 113599. [Google Scholar] [CrossRef] [PubMed]
- Correia, G.; Rodrigues, L.; Silva, M.G.; Gonçalves, T. Airborne route and bad use of ventilation systems as non-negligible factors in SARS-CoV-2 transmission. Med. Hypotheses 2020, 141, 109781. [Google Scholar] [CrossRef] [PubMed]
- European Centre for Disease Prevention and Control. Heating, Ventilation and Air-Conditioning Systems in the Context of COVID-19: First Update; European Centre for Disease Prevention and Control: Solna, Sweden, 2020. [Google Scholar]
- Deng, H.Y.; Feng, Z.; Cao, S.J. Influence of air change rates on indoor CO2 stratification in terms of Richardson number and vorticity. Build. Environ. 2018, 129, 74–84. [Google Scholar] [CrossRef]
- Cao, Z.; Wang, Y.; Zhai, C.; Wang, M. Performance evaluation of different air distribution systems for removal of concentrated emission contaminants by using vortex flow ventilation system. Build. Environ. 2018, 142, 211–220. [Google Scholar] [CrossRef]
- Kong, X.; Xi, C.; Li, H.; Lin, Z. A comparative experimental study on the performance of mixing ventilation and stratum ventilation for space heating. Build. Environ. 2019, 157, 34–46. [Google Scholar] [CrossRef]
- Meslem, A.; Bragança, P.; Sodjavi, K. Experimental analysis of mixing ventilation efficiency using a vortex diffuser: Comparison to a lobed multicone diffuser. Sci. Technol. Built Environ. 2018, 24, 1041–1053. [Google Scholar] [CrossRef]
- Tawackolian, K.; Lichtner, E.; Kriegel, M. Draught perception in intermittent ventilation at neutral room temperature. Energy Build. 2020, 224, 110268. [Google Scholar] [CrossRef]
- Amai, H.; Novoselac, A. Experimental study on air change effectiveness in mixing ventilation. Build. Environ. 2016, 109, 101–111. [Google Scholar] [CrossRef] [Green Version]
- Bragança, P.; Sodjavi, K.; Meslem, A.; Nastase, I. Passive control strategy for mixing ventilation in heating mode using lobed inserts. Energy Build. 2016, 133, 512–528. [Google Scholar] [CrossRef]
- Sadeghian, P.; Polak, J.; Afshari, A.; Sadrizadeh, S. Numerical investigation on the impact of different supply air terminal devices on the performance of the newly combined ventilation and heating system. In IOP Conference Series: Materials Science and Engineering; IOP Publishing: Bristol, UK, 2019; Volume 609, No. 5; p. 052024. [Google Scholar]
- Chen, H.; Janbakhsh, S.; Larsson, U.; Moshfegh, B. Numerical investigation of ventilation performance of different air supply devices in an office environment. Build. Environ. 2015, 90, 37–50. [Google Scholar] [CrossRef]
- Tanabe, S.; Kimura, K. Effects of Air Temperature, Humidity, and Air Movement on Thermal Comfort Under Hot and Humid Conditions; (No. CONF-9406105-); American Society of Heating 1994, Refrigerating and Air-Conditioning Engineers, Inc.: Atlanta, GA USA, 1994. [Google Scholar]
- Kaam, S.; Raftery, P.; Cheng, H.; Paliaga, G. Time-averaged ventilation for optimized control of variable-air-volume systems. Energy Build. 2017, 139, 465–475. [Google Scholar] [CrossRef] [Green Version]
- Wigö, H. Technique and Human Perception of Intermittent Air Velocity Variation. Ph.D. Thesis, KTH Royal Institute of Technology, Stockholm, Sweden, 2005. [Google Scholar]
- Kabanshi, A.; Wigö, H.; Ljung, R.; Sörqvist, P. Human perception of room temperature and intermittent air jet cooling in a classroom. Indoor Built Environ. 2017, 26, 528–537. [Google Scholar] [CrossRef]
- Kabanshi, A.; Yang, B.; Sörqvist, P.; Sandberg, M. Occupants’ perception of air movements and air quality in a simulated classroom with an intermittent air supply system. Indoor Built Environ. 2019, 28, 63–76. [Google Scholar] [CrossRef]
- Kabanshi, A.; Wigö, H.; Sandberg, M. Experimental evaluation of an intermittent air supply system–Part 1: Thermal comfort and ventilation efficiency measurements. Build. Environ. 2016, 95, 240–250. [Google Scholar] [CrossRef]
- Kabanshi, A.; Wigö, H.; Ljung, R.; Sörqvist, P. Experimental evaluation of an intermittent air supply system–Part 2: Occupant perception of thermal climate. Build. Environ. 2016, 108, 99–109. [Google Scholar] [CrossRef]
- Hua, J.; Ouyang, Q.; Wang, Y.; Li, H.; Zhu, Y. A dynamic air supply device used to produce simulated natural wind in an indoor environment. Build. Environ. 2012, 47, 349–356. [Google Scholar] [CrossRef]
- Wang, G.; Song, L. Air handling unit supply air temperature optimal control during economizer cycles. Energy Build. 2012, 49, 310–316. [Google Scholar] [CrossRef]
- Gromow, E.; Wierciński, Z. Polepszenie rozdziału powietrza w pomieszczeniu wentylowanym za pomocą niestacjonarnego efektu Coanda. Ciepłownictwo Ogrzew. Went. 2002, 33, 27–29. [Google Scholar]
- Gromow, E.; Wierciński, Z. Wykorzystanie histerezy efektu Coanda do polepszenia wentylacji mieszania. Ciepłownictwo Ogrzew. Went. 2003, 34, 20–23. [Google Scholar]
- Newman, B.G. The Deflexion of Plane Jet by Adjacent Boundaries—Coanda Effect; Lachman, G.V., Ed.; Pergamon Press: Oxford, UK, 1961. [Google Scholar]
- Skotnicka-Siepsiak, A. Hysteresis of the Coanda Effect. J. Fluids Eng. 2018, 140, 011202. [Google Scholar] [CrossRef]
- Allery, C.; Guérin, S.; Hamdouni, A.; Sakout, A. Experimental and numerical POD study of the Coanda effect used to reduce self-sustained tones. Mech. Res. Commun. 2004, 31, 105–120. [Google Scholar] [CrossRef]
- Fernholz, H.H. Zur Umlenkung von Freistrahlen an Konvex Gekrümmten Wänden. Ph.D. Thesis, TU Berlin, Berlin, Germany, 1965. [Google Scholar]
- Li, A.; Hou, Y.; Yang, J. Attached ventilation based on a curved surface wall. In Building Simulation; Tsinghua University Press: Beijing, China, 2019; Volume 12, pp. 505–515. [Google Scholar]
- Li, A. Extended Coanda Effect and attachment ventilation. SAGE 2019. [Google Scholar] [CrossRef] [Green Version]
- Yin, H.; Li, L.; Wu, R.; Wang, Y.; Li, A. A numerical study on the effect of column layout on air distribution and performance of column attachment ventilation. In Building Simulation; Tsinghua University Press: Beijing, China, 2020; pp. 1–14. [Google Scholar]
- Trancossi, M. An Overview of Scientific and Technical Literature on Coanda Effect Applied to Nozzles; SAE Technical Paper; SAE: Warrendale, PA, USA, 2011; No. 2011-01-2591. [Google Scholar]
- Kireev, V.M.; Goltsov, A.B.; Seminenko, A.S.; Ovsyannikov, Y.G. Creation of a new energy-efficient design of the dustexhaust system. In IOP Conference Series: Materials Science and Engineering; IOP Publishing: Bristol, UK, 2019; Volume 552, p. 012021. [Google Scholar]
- Trancossi, M.; Dumas, A.; Das, S.S.; Pascoa, J. Design methods of Coanda effect nozzle with two streams. INCAS Bull. 2014, 6, 83. [Google Scholar]
- Alekseenko, S.V.; Markovich, D.M. Reattachment of a plane turbulent jet to a wall upon injection and suction. J. Appl. Mech. Tech. Phys. 1997, 38, 417–422. [Google Scholar] [CrossRef]
- Gad-el-Hak, M.; Pollard, A.; Bonnet, J.P. (Eds.) Flow Control: Fundamentals and Practices; Springer Science & Business Media: Berlin/Heidelberg, Germany, 2003; Volume 53. [Google Scholar]
- Handbook ASHRAE. American Society of Heating, Refrigerating and Air-Conditioning Engineers, Inc., Atlanta, GA; Fundamentals SI edition; Chapter 20 Space air diffusion; Handbook ASHRAE: Atlanta, GA, USA, 2017. [Google Scholar]
Figure 1.
Region of Coanda effect hysteresis (CEH) determined experimentally based on the critical angles of jet separation () and attachment () and the Reynolds number.
Figure 1.
Region of Coanda effect hysteresis (CEH) determined experimentally based on the critical angles of jet separation () and attachment () and the Reynolds number.

Figure 2.
Analyzed variants of air flow: (a) steady flow with Coanda effect, (b) steady flow with a free jet, (c) unsteady flow in the region of CEH.
Figure 2.
Analyzed variants of air flow: (a) steady flow with Coanda effect, (b) steady flow with a free jet, (c) unsteady flow in the region of CEH.

Figure 3.
Flow chart presenting successive research tasks in the process of designing an unsteady ventilation system based on CEH.
Figure 3.
Flow chart presenting successive research tasks in the process of designing an unsteady ventilation system based on CEH.

Figure 4.
Test bench.

Figure 5.
Reynolds number dependence of flow in a system comprising the main supply nozzle (MN) and an auxiliary nozzle (AN) operating as an injection (INJ) or a suction (SUC) nozzle.
Figure 5.
Reynolds number dependence of flow in a system comprising the main supply nozzle (MN) and an auxiliary nozzle (AN) operating as an injection (INJ) or a suction (SUC) nozzle.

Figure 6.
Maximum average velocity and maximum turbulence in each measurement plane.

Figure 7.
Ratio of average velocity to exit velocity , and turbulence at x/b = 4.0 and x/b = 17.5.

Figure 8.
Ratio (average velocity to exit velocity ) in: case (1) main nozzle (MN) only; case (2) MN and the auxiliary nozzle (AN) operating in injection mode (MN + AN INJ); case (3) MN and the AN operating in suction mode (MN + AN SUC).
Figure 8.
Ratio (average velocity to exit velocity ) in: case (1) main nozzle (MN) only; case (2) MN and the auxiliary nozzle (AN) operating in injection mode (MN + AN INJ); case (3) MN and the AN operating in suction mode (MN + AN SUC).

Figure 9.
Correlations between the critical angle of separation and the critical angle of attachment (trend lines) vs. the Reynolds number.
Figure 9.
Correlations between the critical angle of separation and the critical angle of attachment (trend lines) vs. the Reynolds number.

Publisher’s Note: MDPI stays neutral with regard to jurisdictional claims in published maps and institutional affiliations. |
© 2020 by the author. Licensee MDPI, Basel, Switzerland. This article is an open access article distributed under the terms and conditions of the Creative Commons Attribution (CC BY) license (http://creativecommons.org/licenses/by/4.0/).
Share and Cite
MDPI and ACS Style
Skotnicka-Siepsiak, A. The Applicability of Coanda Effect Hysteresis for Designing Unsteady Ventilation Systems. Energies 2021, 14, 34. https://0-doi-org.brum.beds.ac.uk/10.3390/en14010034
AMA Style
Skotnicka-Siepsiak A. The Applicability of Coanda Effect Hysteresis for Designing Unsteady Ventilation Systems. Energies. 2021; 14(1):34. https://0-doi-org.brum.beds.ac.uk/10.3390/en14010034
Chicago/Turabian StyleSkotnicka-Siepsiak, Aldona. 2021. "The Applicability of Coanda Effect Hysteresis for Designing Unsteady Ventilation Systems" Energies 14, no. 1: 34. https://0-doi-org.brum.beds.ac.uk/10.3390/en14010034
Note that from the first issue of 2016, this journal uses article numbers instead of page numbers. See further details here.