The Analysis of the Factors Determining the Choice of Park and Ride Facility Using a Multinomial Logit Model


Department of Transport Systems and Traffic Engineering, Faculty of Transport and Aviation Engineering, Silesian University of Technology, Krasińskiego 8 Street, 40-019 Katowice, Poland
*
Author to whom correspondence should be addressed.
Energies 2021, 14(1), 203; https://0-doi-org.brum.beds.ac.uk/10.3390/en14010203
Submission received: 29 November 2020
/
Revised: 20 December 2020
/
Accepted: 27 December 2020
/
Published: 2 January 2021
(This article belongs to the Special Issue Big Data and Smart Cities)
Abstract
:The basic function of the Park and Ride (P&R) facility is to allow users to leave their vehicle on the outskirts of the city and to continue their journey to the city center using means of public transport, e.g., bus, tram, trolleybus, subway, train, or bike. In the first part of the paper, an analysis of the selected factors related to the functioning of P&R facilities in Warsaw (Poland) was performed. The main purpose of this paper was to identify and quantify the influence factors determining the choice of P&R facility during a journey. This analysis was performed for three hypothetical journey scenarios. A list of potential factors determining the choice of P&R facility during travel was compiled after conducting previous research in this area and studying the worldwide scientific literature on the subject. The structural parameters of the multinomial logit model were estimated based on the data from the survey conducted in Warsaw. The results of the analyses indicate that the decision to choose a hypothetical journey scenario depends on many factors, but primarily on the level of education, the number of years of having a driving license, age, the number of kilometers traveled during the year, and the performed activity.
1. Introduction
On account of the comfort of travel, many residents of Poland as well as other countries in the world use private cars in their daily journeys. However, densely built-up areas, terrain limitations, high values of traffic volumes, and parking space limitations in city centers usually do not meet the needs of all users. In addition, the parking policy about parking charges in city centers contributes to the low use of parking spaces. This problem is more visible in the larger and more densely populated cities. The Park and Ride (P&R) facility is one way to solve the lack of parking spaces in city centers, where the number of parking spaces is the most limited. In addition, these facilities contribute to reducing the number of vehicles entering the city center. The P&R facility is often part of an interchange node, allowing users (most often commuters) to leave their car on the outskirts of the city and continue their journey to the center using means of public transport (e.g., metro lines, bus rapid transit terminals, light rail or tram stations, ferry terminals) [1,2,3]. The main determinants of the success of this type of system are efficiently functioning public transport offering high-quality service, appropriate P&R facility localization, and parking limitations in the city center. Advanced information services for travelers in the field of transfer tips, including reliable remote sensing of road traffic data, are also important. Theoretically, the P&R facility should influence the choice of means of transport by choosing a faster, cheaper, and more convenient means of transport between the car and the means of public transport. So, the utilization of a P&R facility may be affected by other transportation connections. For P&R facilities to be of great interest and to cover as many potential users as possible, they must be located at appropriate points in the transport system. As the P&R facility has evolved, its form, location, and functions have become so diverse that they are currently characterized by many typologies. In practice, the localization of P&R facilities is usually determined based on:
Whereas the concept of the P&R facility is clear, the related factors influencing the choice of P&R facilities are very complex, which results mainly from individual choices and preferences of users of transport systems as well as from various other social factors.
In Poland, despite growing traffic volumes and increasing problems with access to city centers, the P&R facility does not attract the expected number of drivers and is not used sufficiently. So, the main purpose of this paper was to identify and quantify the influence factors determining the choice of P&R facility during a journey. These studies were carried out using the example of P&R facilities located in Warsaw (Poland). According to the authors’ knowledge, the paper presents the first attempt to use the multinomial logit model to quantify the impact of potential factors determining the choice of P&R facility during a journey in Warsaw. This analysis was performed for three hypothetical journey scenarios. The fact that the user can choose one of three hypothetical journey scenarios makes this survey even more representative. The models presented in the paper represent the choices of people traveling to the city center for various purposes, e.g., work, school, university, spending free time, visiting the doctor, etc. So, a portion of them are also commuters. Moreover, respondents could be residents of the city of Warsaw but they also can be residents of Warsaw surroundings.
The paper consists of seven sections. After the introduction, in the Section 2, a literature review is presented. This literature review consists of P&R facility user behavior modeling techniques and the factors influencing the choice of P&R facility during the journey. The Section 3 presents the characteristics of the area of analysis that the city of Warsaw offers, both in terms of public transport and P&R facilities. Section 4 presents the research methodology and the main objectives of the research about P&R facilities in Warsaw. In Section 5, the analysis of the selected factors related to the functioning of P&R facilities in Warsaw are presented. This analysis was carried out with the data on the functioning of four P&R facilities in 2018. This analysis included the distribution of selected factors of analyzed P&R facilities in time. In addition, the pedestrian accessibility of the P&R facilities to metro and train stops is presented. Section 6 shows the analysis of the factors determining the choice of P&R facility during a journey based on data for Warsaw. This analysis was performed for three hypothetical journey scenarios. This section includes the characteristics of respondents, their travel patterns and use of P&R facilities, characteristics of the multinomial logit model, and model results. The paper ends with the Section 7.
2. Review of the Scientific Literature in the Field of P&R Facility User Behavior Modeling Techniques and the Factors Influencing the Choice of P&R Facility during the Journey
In world literature, the subject of the P&R facility has been discussed many times in various aspects. The largest number of studies conducted so far have concerned issues such as the location of the P&R facility (i.a., the works of: W. Fan et al. [12], X. Chen et al. [13], and Z Song et al. [14]), the capacity of the P&R facility (e.g., works by A. Khakbaz et al. [15], and X. Chen et al. [16]), and the preferences of P&R facility users (i.a., papers by A Webb et al. [17] and I. Bos et al. [18]).
In this article, the subject of analysis is the search for factors influencing the choice of P&R facility by users of transport systems during their journey. In all available articles, the analysis of factors influencing the use of the P&R facility was performed based on data obtained from the survey research. Therefore, the following part of the chapter presents an overview of the work in terms of the applied techniques of modeling the behavior of P&R facility users. In addition, the review of works describes factors that were taken into account in the modeling process of choosing a P&R facility while traveling.
The work by B. He et al. [19] is in the group of research works which have used the binary logit model in the modeling process. This article aimed to analyze the factors determining the use of P&R facilities. The study was hypothetical because it concerned the P&R facility that was under construction in the city of Nanjing (China). In this survey, respondents were asked to indicate whether they intended to use the new P&R facility. The results of this work showed that factors such as age, income, trip purpose, road traffic, the availability of parking spaces near the destination, and parking fees had the greatest impact on the potential choice of P&R facility for a journey. The binary logit model was also used in the process of modeling the factors influencing the choice of P&R facility by Y. Du et al. [20]. Ten journey scenarios were identified in this study. Each scenario included information on travel speed, travel time saved, travel cost saved, and the degree of congestion in the city. The results of the conducted research indicate that increasing the cost and time of driving a car and increasing the standard of public transport services may contribute to an increase in the number of users of the P&R facility.
The binomial logit model was used by W. Clayton et al. [21]. The study aimed to build a model that made it possible to determine the factors influencing the choice of P&R facility or parking in the city center. The data from the analysis allowed for the conclusion that the choice of P&R facility in travels is influenced by age, gender, the size of the group of people traveling together, and income. X. Liu et al. [22] also used the binomial logit model to determine the probability of selecting P&R facility during the journey. The results of their research indicated that age, monthly income, having a child, and travel time have an impact on the use of P&R facilities, which turned out to be a more significant factor for respondents than the travel cost.
A multinomial logit model was also used in the process of modeling the factors influencing the choice of P&R facility in travel. For example, X. Zhao et al. [23] used a multinomial logit model to determine the probability of choosing a travel mode: By private car, by means of public transport, or using the P&R facility. Based on the proposed models, it was possible to estimate the demand for P&R facilities assuming travel information, personal distributions of travelers’ attributes, and values of travel-specific variables. The results indicated that gender and monthly income influence the choice of P&R facility. The multinomial logit model was also used by S. Islam et al. [19]. This model was aimed at determining the factors influencing the choice of P&R facility in travel. Nine journey scenarios were used in the survey, which differed in the amount of the parking fee, travel time by means of public transport, and transfer time at the P&R facility. The results indicated that travel time by means of public transport and transfer time at the P&R facility have an impact on the chosen travel mode. Low travel time by means of public transport increases the probability of using only means of public transport for the trip, whereas a shorter transfer time increases the likelihood of using the P&R facility. Meanwhile, lower parking fees near the destination increase the likelihood of car-only travel.
In turn, K. Huang et al. [24] used the cumulative logistic regression model to determine the factors influencing the choice of P&R facility in travel. Nine scenarios were constructed containing information on parking fees in the city center, total travel time by means of public transport, and transfer time. The data from the analysis showed that the parking fee and transfer time are the most important for drivers when choosing a P&R facility during the journey. Y. Kono et al. [25] presented a two-level Nested Logit in which it was assumed that the decision-maker selects the solution with the highest utility. In this study, the respondents were presented with three variants of reaching the destination for each travel mode: By car, by means of public transport, and using the P&R facility. The cost and travel time were estimated for each travel mode. The results of these studies showed that the choice of P&R facility for journeys depends on the amount of travel cost and travel time and the existence of a direct connection by public transport. In turn, H. Qin et al. [26] presented a model of travel behavior based on Decision Field Theory for three travel modes: By car, by means of public transport, and using the P&R facility. The decision-making process consisted of selecting a travel scenario which contained information on, i.a., driving time, transfer time, travel time by means of public transport, and travel cost. Based on the results, it can be concluded that appropriate information to users of transport systems about P&R facility, such as location of the facility, amount of parking fees, number of available spaces, etc., may contribute to increasing the use of these parking facilities. H. Qin et al. also indicated that free public transport tickets for people using the P&R facility can be an incentive to leave the vehicle in these parking facilities. In addition, increasing the level of comfort of traveling by means of public transport and the possibility of leaving the vehicle free of charge in the P&R facility may contribute to the use of such facility by drivers. Table 1 presents a list of factors that have been taken into account by various authors in the analysis of factors influencing the choice of P&R facility in the journey. The factors were distinguished (by grey background) that, in particular studies, showed a significant impact on the choice of P&R facility in the journey. There have been relatively few works on the P&R facilities in Poland.
This may be mainly because, so far, P&R facilities have only operated in a few Polish cities and, as shown by the work to date on the analysis of the functioning of this type of parking, occupancy of parking spaces during the day is incomplete and ranges from 34% to 89% [27,28]. These works include those by A. Szarata concerning, i.a., the impact of the P&R facility on travel time in the road and street network [29], forecasting the size of travel using the P&R facility in the total number of journeys per day [30], and determining the number of drivers who may be potential users of the P&R facility [31]. However, the remaining works have been focused mainly on research areas such as the use of parking (A. Brzeziński et al. [32,33], A. Kurek [34]) or the search for a suitable location for parking (S. Fierek et al. [35], A Lower et al. [36], W. Parkitny [37]).
3. Characteristics of the Research Area
Warsaw is the capital of Poland and the largest city in the country in the Mazowieckie Voivodeship. In Warsaw, the prevalence of public transport is significantly higher than Polish cities. Currently, there are 2 metro lines in Warsaw, 4 Rapid Urban Railway (RUR) lines, 260 daily bus lines, and 25 tram lines [38]. Figure 1 shows a connection scheme for rail transport in the city of Warsaw.
The Warsaw Traffic Research (WTR) carried out in 2015 showed that 56.90% of nonpedestrian travel in the city was made using means of public transport, while trips by car constituted 38.60% [39]. Moreover, more than half of those using the P&R facilities commuted from the area of the neighboring municipalities included in the Warsaw agglomeration, e.g., Piaseczno, Łomianki, and Stare Babice. There were also drivers from Grójec, Serock, Sochaczew, and Warka. Of P&R facility users, 46% were residents of Warsaw. Drivers most often chose the P&R facility closest to their place of residence. However, drivers from Bielany left their car at P&R Imielin, drivers from Mokotów and Otwock at P&R Młociny, and residents of Wołomin came to P&R Wilanowska. P&R facilities in Warsaw every day enabled over 4655 car drivers and over 728 cyclists to change to the Warsaw Public Transport. According to the data presented by the Central Statistical Office in Poland [40], in 2018, the number of inhabitants in Warsaw was over 1708 million and the automotive index in the city was equal to 0.89 car/person. Despite the greater share of journeys made by means of public transport than by car, the automotive index in Warsaw is high.
There are 16 P&R facilities in Warsaw. Figure 2 presents the localization of these facilities against the city background. Most P&R facilities are located next to metro line stations, while the rest are located near RUR stations (e.g., P&R Anin SKM, P&R Wawer SKM, P&R Ursus Niedźwiadek) or at bus or tram stops (e.g., P&R Al. Krakowska, P&R Połczyńska). This type of localization of the P&R facility is compliant with the principles of designing transport systems, as well as the principles of locating this type of facilities resulting from local, financial, organizational, and methodological conditions [41,42,43,44,45,46].
Figure 3 shows the distribution of the number of passengers using the metro line stations with the P&R facility in 2013–2017. The number of passengers was estimated based on data from the crossing counters at ticket gates; the number of passengers using the elevators, jumping through the ticket gates, and using the connector between two metro lines (M1 and M2); and the number of passengers using the emergency exits on the M1 metro line. In the case of five of seven metro line stations, the number of passengers using metro stops since 2013 showed a downward trend but remained at a high level. This decrease may mean that the number of people traveling by private cars in Warsaw has increased, which may be indicated by an increase in the automotive index (from 2013 to 2017, the motorization index increased by 13% [40]) or a change in land use near these stations.
The analyzed P&R facilities are open from 04:30 to 02:30 the next day (except for P&R facility Metro Młociny III, which is open 24 h a day; P&R facility Metro Imielin, which is open from Monday to Thursday from 04:30 to 02:30 the next day, on Friday from 4:30 to 24:00, and is closed on Saturdays, Sundays, and public holidays; and the P&R facility Warszawa Stadion, which is open from Monday 4:30 to Friday until 22:00, 24 h a day, and is closed on Saturdays, Sundays, and public holidays). P&R facility users with active cards with a valid ticket can leave their vehicles free of charge. Valid tickets include daily tickets, three-day tickets, weekend tickets, group weekend tickets, 90-day tickets, 30-day tickets, tickets for children from families with three children, senior tickets, and documents entitling users to free travel by public transport organized by the city of Warsaw. People who do not have the abovementioned tickets or document must pay a one-time fee of PLN 100 (~23 Є) at the entrance to the parking facility.
This fee is charged for renting a parking space between 04:30 and 02:30 and is charged 20 min after entering the parking during the opening hours of the parking [49]. The drivers most often used P&R facility Metro Marymont, P&R facility Metro Wilanowska, P&R facility Metro Wawrzyszew, P&R facility Warszawa Stadion, and P&R facility Metro Młociny I-III (above 90% in all months in 2018, except December) (Figure 4). Data from the P&R facility Metro Młociny IV cover the months from July to December 2018. In the months from August to November, the use of parking spaces in the P&R Metro Młociny IV facility was above 90%. This facility was opened in February 2018. Based on the data from 2018, it can be supposed that, in the following months of 2019, the use of parking space in this facility was 90%. The P&R facility Anin SKM was the least popular. For most of the analyzed facilities, except for the P&R facility Metro Marymont and Metro Wilanowska, the lowest use of facilities could be observed in the summer months (July and August). In these months, there is usually less traffic in the city due to the holiday season. On average, most vehicles were parked in all facilities in November. The results of the analysis show the existence of a relationship between the number of parking spaces offered and the number of used parking spaces.
To illustrate the functioning of the P&R facility, the article presents the characteristics of selected factors related to the functioning of four selected facilities: P&R Metro Stokłosy, P&R Metro Młociny III, P&R Metro Ursynów, and P&R Anin SKM. P&R Metro Młociny III, P&R Metro Ursynów, and P&R Anin SKM are single-level outdoor parking facilities. Meanwhile, P&R facility Metro Stokłosy is a four-level covered facility. Figure 5 presents the views of the analyzed P&R facilities.
An area inventory of the P&R facility was carried out in April 2019. Ticket control devices are located at the entrance and exit to/from the analyzed facilities. In the parking, there are separate public spaces and parking spaces for disabled people and parking spaces for cyclists (equipped with covered bicycle stands). In addition, P&R facility Metro Stokłosy offers users parking spaces equipped with devices for charging electric cars and parking spaces equipped with devices for charging bikes. During the area inventory, attention was also paid to the presence, legibility, and quality of vertical and horizontal marking of parking spaces. All analyzed parking were characterized by good vertical and horizontal parking spaces as a result of the area inventory. The marking was complete, legible, and of good quality. In addition, the presence of information signs in the area about the location of the P&R facility was verified. The analyzed parking facilities were completely marked, thanks to which drivers had full information about the location of such facilities on the transport network. In the case of P&R facility Anin SKM, parking spaces were allocated for vehicles used by more than two people.
Table 2 presents the basic characteristics of the four analyzed parking facilities, i.e., the date of opening, number of parking spaces, etc.
The main function of the P&R facility is to allow the user to leave the vehicle on the outskirts of the city and continue the journey to the center using means of public transport (by bus, tram, trolleybus, subway, train, or bike). People using P&R facilities in Warsaw can continue their journey using five means of transport: Bus, tram, metro, train, and bike-sharing system. In addition, the P&R facility is considered attractive when, i.a., the distance from the car to the stop of the selected means of public transport will be as short as possible. The real distance from the analyzed parking to stops of particular means of public transport does not take into account obstacles on the road, such as a pedestrian crossing, stairs, etc.
Therefore, the equivalent distances were determined from the analyzed parking facilities to stops of particular means of transport. Equivalent distance (EWD) also reflects the nuisance of pedestrians walking to a destination. It takes into account the effort involved in crossing the street or climbing stairs.
It can be estimated according to the formula [50]:
where
EWD = DISTW + 42.8 · NCROS + 2.7 · NSTEP + 26.4 · NCONF [m]
EWD—equivalent distance,
DISTW—real walking distance,
NCROS—the number of crossings in one level,
NSTEP—number of stairs, and
NCONF—number of collisions with vehicular traffic along the approach route.
The equivalent distances from the analyzed parking to the nearest stops of individual means of public transport have been presented in Table 3.
These distances were determined assuming that the driver starts his journey from a central point in the parking, on level 0 (in the case of multilevel parking), and moves to the nearest stop of a particular means of public transport. Three of the analyzed facilities, P&R Metro Stokłosy, P&R Metro Młociny III, and P&R Metro Ursynów, are located near the metro station. These parking facilities are also located far from the railway station. There is no metro station near the P&R Anin SKM facility. However, the attractiveness of this parking facility is increased thanks to its short distance to the train station, from which it is possible to travel by RUR transport and city rail (UR). The P&R facility Metro Młociny III is located in the area of the large interchange node, where it is possible to change the means of transport to a bus, tram, metro, and bike-sharing, and there are four P&R facilities nearby.
4. Research Methodology
The main objectives of research about the P&R facilities in Warsaw were:
- To analyze the selected factors related to the functioning of the P&R facility,
- to research the preferences of the P&R facility users, and
- to analyze the features determining the choice of P&R facility during the journey.
The data were obtained from The Public Transport Authority in Warsaw. These data covered the selected information connected with the functioning of the P&R facilities in 2018 and came from passive remote sensing. To learn about the users’ preferences, surveying among the P&R facilities users in Warsaw was performed. The respondents were users of all P&R facilities in Warsaw. Cronbach’s alpha coefficient (α) was used to check the internal consistency of the designed questionnaire and its reliability [51,52,53,54,55,56,57,58]. A 5-point Likert scale was used (from 1 to 5) in the evaluation of the respondents’ answers [59,60,61]. The average grade for the questionnaire was equal to 4.5, which confirmed the satisfactory relevance of the questionnaire. The survey questionnaire consisted of a few parts, such as:
- Characteristics of the respondent’s profile,
- characteristics of the respondents’ journeys,
- factors affecting the choice of the P&R facility in the journey,
- journey patterns, and
- solutions and P&R facility factors that could encourage respondents to choose the P&R facility during the journey.
In the questionnaire, respondents declared whether or not they used the P&R facility. Additionally, 3 hypothetical journey scenarios were constructed to obtain more information on user behavior. The hypothetical journey scenarios were presented to those respondents who declared that, for various reasons, they did not use the P&R facility. Each hypothetical journey scenario was a description of a hypothetical journey regularly performed by respondents and included information such as the travel mode to the destination, travel time, transfer time, time to reach the destination, and travel cost. Table 4 presents the characteristics of the hypothetical journey scenarios adopted in the survey. Moreover, respondents were asked to answer questions about the determinants of choosing a specific scenario. Figure 6 shows an overview of the most important issues included in the questionnaire content.
The research was carried out from 2017 to 2019 among Warsaw residents and in the Warsaw surrounding area. When collecting data for the study, 2 quantitative research techniques were used: PAPI (Paper and Pencil Interview) and CAWI (Computer-Assisted Web Interview). In total, 1236 questionnaires were obtained (1048 questionnaires were obtained in field surveys and 188 from online surveys). The survey was conducted during every day of the week at different hours. This was aimed at obtaining a large number and diversity answers of the respondents. The subject of the study was drivers who can use the P&R facility. Therefore, respondents with a driver’s license and who traveled by car were examined.
In order to select the respondents, the random sampling technique was used. The online survey was prepared using the Survio tool [62], which allowed us to design a questionnaire.
The received survey questionnaires were studied in terms of data completeness and correctness, e.g., the questionnaires were rejected in which the respondent did not answer all of the questions; respondents answered questions like, e.g., “I don’t remember,” or “I don’t know,” or “I haven’t opinion of my own;” respondents said that they included incomplete information; respondents could not indicate their opinion; and respondents who using the P&R facility for the first time; etc. All of the 1204 questionnaires stayed in the database as a result of the selection. These data were used for further analysis.
5. The Analysis of the Selected Factors Related to the Functioning of P&R Facilities in Warsaw
Analysis of the use of P&R facilities in Warsaw was carried out for the previously characterized four facilities: P&R Metro Stokłosy, P&R Metro Młociny III, P&R Metro Ursynów, and P&R Anin SKM. Due to the different scope of the data obtained in the case of an individual facility, it was impossible to perform a detailed analysis that would characterize the full functioning of the P&R facility in 2018. Hence, for the P&R facility Metro Stokłosy and P&R facility Metro Ursynów, the following were determined:
- The average number of vehicle entries to the parking on particular days of the week and in particular months of the year,
- the distribution of vehicle parking in the P&R facility on working days, and
- the average number of vehicles entering and exiting parking in particular hours of the day.
For P&R facility Anin SKM, the data covered only the month of November 2018, which made it possible to determine the number of vehicle entries to the parking on particular days of the week. On the other hand, in the case of P&R facility Metro Młociny III, the data covered the months of November and December (this parking was opened in February 2018). This data allowed for the analysis of the variability of factors such as the distribution of parking time and the average number of vehicle entries and exits.
Table 5 shows the nonworking days that occurred in 2018 and the days preceding or following them, i.e., days on which the number of parking vehicles was significantly lower than the number of parking vehicles on the same average day of the week. Data from these days were not used in further analysis.
5.1. The Distribution of Selected Factors of Analyzed P&R Facility in Time
Figure 7 shows the average number of vehicle entries to the P&R facility Metro Stokłosy and P&R facility Metro Ursynów on particular days of the week (Figure 7a) and in particular months (Figure 7b) in 2018. The data presented in Figure 7 indicate that, on particular days of the week and in particular months of 2018, P&R facility Metro Stokłosy recorded a higher average number of parked vehicles than P&R facility Metro Urynów. Based on Figure 7a, it can be concluded that, for each of the parking facilities, the average number of parking vehicles on particular working days of the week were similar and ranged from 217–265 vehicles/24 h for P&R facility Metro Stokłosy and from 161 to 176 vehicles/24 h for P&R facility Metro Ursynów. On Saturdays and Sundays, the average number of parked vehicles was much lower than on working days and ranged from 14 to 34 vehicles/h for both P&R facilities. When analyzing the average number of vehicle entries to P&R facility Metro Stokłosy and P&R facility Metro Ursynów in particular months, it can be concluded that the lowest number of entries was recorded in the summer months (July, August). In the case of P&R facility Metro Stokłosy, in both the preceding month (June) and the following month (September), a lower average number of parking entries was observed compared to the remaining months. For P&R facility Metro Stokłosy, the highest average number of entries took place in March and November. In the remaining months, the average number of vehicles ranged from 184 vehicles/24 h to 200 vehicles/24 h. In turn, for P&R facility Metro Ursynów, the largest number of entries to the parking facility was recorded in October.
In turn, Figure 8 shows the parking time at the P&R facility on working days. In the P&R facility Metro Stokłosy and the P&R facility Metro Ursynów, vehicles were parked for more than 9 h. Therefore, it can be inferred that people who commute to work, school, or university are the majority of P&R facility users. Moreover, in the case of P&R facility Metro Ursynów, it was noted that vehicles had short leaves up to 30 min, which was more common than for the period from 1–8 h.
The distribution of the average number of vehicle entries and exits into the P&R facilities Metro Stokłosy and Metro Ursynów in 2018 is presented in Figure 9. The majority of entries to the analyzed parking was registered from 06:00 to 09:00, while the largest number of exits from the parking was from 15:00 to 19:00. The results indicate that people using P&R are probably residents commuting to the city center to and from school, university, or work. In turn, the least vehicles entered and exited in the evening and night, i.e., from 22:00 to 04:00. Figure 9 also indicates that the hours when most drivers entered and exited the parking facility were nearly the same in time for both P&R facilities, which may have been caused by their localization and local conditions.
Figure 4 shows that the P&R facility Anin SKM had the lowest use of parking spaces compared to all other P&R facilities in Warsaw. These values ranged from 22.9% in August to 57.8% in November. Figure 10 shows that the average number of vehicles on every day of the week in November 2018 was low and did not exceed 60 vehicles/24 h. The lowest average number of vehicles was recorded on Saturdays and Sundays and did not exceed 4 vehicles/24 h.
The average use of P&R facility Metro Młociny III in 2018 was very high and amounted to as much as 96.1% (Figure 4). The distribution of parking time and the average number of vehicle entries and exits on working days to and from the P&R facility were analyzed in November and December in 2018. The distribution of parking time on working days, as in the case of other analyzed parking, indicated that users usually leave their vehicles for more than 8 h (Figure 11a). Moreover, Figure 11b shows the average number of vehicle entries and exits on working days for the P&R facility Metro Młociny III in November and December 2018. In both months, the highest average number of vehicles entered the parking facility from 06:00 to 08:00 and exit the parking facility from 15:00 to 19:00.
5.2. Pedestrian Accessibility of the P&R Facilities to Metro and RUR Stops
The quality of P&R facility functioning, as well as the occupancy rate of P&R facility, depends on, i.a., the accessible free parking places, comprehensibility of the rules for using parking, close accessibility to public transport stops parking locations, time of reaching the nearest parking facility, the technical condition of the equipment, prices for using the P&R facility, the safety of parked vehicles, traffic generators in the nearby distance, weather conditions, and many other factors. The pedestrian accessibility analysis was presented for four facilities: P&R Metro Stokłosy, P&R Metro Młociny III, P&R Metro Ursynów, and P&R Anin SKM. Table 6 presents information on the possibilities of changing the means of transport and information on public utility buildings located near the analyzed facilities (the so-called traffic generators).
There is no metro station near the P&R facility Anin SKM. The attractiveness of this parking facility is increased thanks to its proximity to the railway station, from which it is possible to travel by means of RUR and UR transport. The P&R facility Metro Młociny III is located in an interchange node, where it is possible to change the means of transport to a bus, tram, and metro, and there are four additional P&R facilities.
For the analysis, it was assumed that each P&R facility user on a further journey uses only the metro (and RUR in the case of P&R facility Anin SKM) as a means of transport. They do not use other transport subsystems. Pedestrian accessibility from particular metro stations and RUR stops in Warsaw was also analyzed. The premise was that the person was coming to the P&R facility. Then, he continues for some distance from the metro line stop in the case of the facilities P&R Metro Stokłosy, P&R Metro Młociny III, P&R Metro Ursynów, or from RUR stop in the case of P&R facility Anin SKM. Finally, from a particular stop, he may walk some distance to the destination. ArcGIS were used to analyze pedestrian accessibility from the P&R facility. ArcGIS allowed us to realize network analyses, such as pedestrian movement modeling. The spaces were designated as those possible to reach on foot using the P&R facility and metro lines at the assumed distances. Then, this information was compared with the location of residential buildings. The obtained data were transformed into indicators, showing the spatial extent of accessibility areas. To model the accessibility of the P&R facility and metro line stations, we used the necessary information [47].
The maps accessible on Google Maps [63] were used to check and correct the obtained data about the P&R facility and metro line stations. In the next step, the data were converted to GTFS format by exporting to text. In Figure 12 for facilities P&R Metro Stokłosy, P&R Metro Ursynów, and P&R Metro Młociny III and in Figure 13 for Anin SKM, the final results of the analysis of pedestrian accessibility from the P&R facility and metro line stations in Warsaw are presented in the distance category of 0.5 km and 1.0 km.
In Figure 12 and Figure 13, the isochrones of pedestrian access from the metro line stations are marked in blue. In Figure 12, the colors correspond to the accessibility of pedestrian access to P&R facilities: Orange—P&R facility Metro Młociny III, green—P&R facility Metro Ursynów, and pink/red—P&R facility Metro Stokłosy.
In Figure 13, orange is the color of the pedestrian access isochrones from the SKM station, and green is the color of the P&R facility Anin SKM. In the case of the P&R facilities Metro Stokłosy and Metro Ursynów, there is one metro station within 0.5 km walking distance and three metro stations within 1.0 km.
However, in the case of the P&R facility Metro Młociny III, there is one metro station within a walking distance of 0.5 km and two metro stations within 1.0 km. In the case of the P&R facility Anin SKM, isochrones of accessibility of pedestrians to RUR stops and metro line stations are designated, as passengers at transfer stations can change the RUR line to the metro line.
For users of the four analyzed P&R facilities, metro line stations, and RUR, a certain corridor of the passenger service area was created, which, depending on the distance of pedestrian access, covered 3–5% of the Warsaw city area.
6. The Analysis of the Factors Determining the Choice of Park and Ride Facility—A Case Study Based on Warsaw (Poland)
6.1. Characteristics of Respondents, Respondents Travel and Use of P&R Facility
Figure 14 shows the structure of respondents using and not using the P&R facility. Most of the respondents (72.32%) declared that they did not use the P&R facility.
The independent variables included both quantitative and qualitative variables. In order to summarize the obtained data set, descriptive statistics for quantitative variables were calculated (Table 7).
The student’s t-test was carried out in order to verify the hypothesis of whether the use of P&R facility depends on the characteristics of the respondents and their journeys. The student’s t-test was performed at the significance level of α = 0.05. Table 8 shows the formulated null hypotheses (H0) and alternative hypotheses (H1) for quantitative variables, as well as the obtained results of the student’s t-test.
Each of the examined factors were statistically significant at the level of α = 0.05, which means that, in each of the tested cases, the null hypotheses (H0) were rejected in favor of the alternative hypotheses (H1). This means that the average age, income, the number of years having a driver’s license, the number of journeys made by day, the number of cars in the household, the time spent traveling during the day, and the number of kilometers driven during a year of respondents who used the P&R facilities differed statistically significantly from respondents who did not use P&R facilities.
Figure 15 shows the characteristics of the respondents in terms of the choice of one of the three hypothetical journey scenarios characterized in Table 4. Most respondents (52%) chose scenario 1, scenario 2 was chosen by 11% of respondents, and scenario 3 was chosen by 28%. The largest number of responses came from men aged 18–24, with higher education, working, and with a monthly income (Net) in the range of PLN 2.000–2.999 (~455–682 Є). Respondents stated that they had a driver’s license for 10 years or more and that they had two cars in their household. Most of the respondents made two journeys a day, spent an average of 30 min to 59 min per day traveling, and drove 20,000 km or more per year by car. The research showed that the most important factors influencing the choice of particular hypothetical journey scenarios by respondents included gender, performed activity, number of years of having a driver’s license, and the number of kilometers driven during a year.
The respondents were asked to indicate which of the factors, such as travel time, travel cost, time to reach the destination, and transfer time, had the greatest impact on the choice of the hypothetical journey scenario (Figure 16). In the case of respondents who chose scenario 1, the travel time was the most important, while the travel cost was the least important. The respondents who chose scenario 2 indicated the cost of travel as the most significant factor. On the other hand, in the case of scenario 3, travel time was the most important, but not as much as in scenario 1. A significant proportion of respondents also mentioned the cost of travel in this case.
6.2. Multinomial Logit Model Characteristics
The Multinomial Logit Model can be used in the case when the dependent variable is qualitative and assumes more than two states in the modeling process. This model describes the natural logarithm of the odds ratio of the phenomenon to the base category depending on the factors that define it. In the model, the choice of one of the hypothetical journey scenarios was assumed as the dependent variable (Yi). The dependent variable is discrete with a finite number of values, and the values of this variable are disordered. The probability of selecting particular hypothetical journey scenarios can be generally presented as [64]:
where
j—variant number of the dependent variable, j = 0, 1 …, s, and
i—explained variable number, i = 1, 2, …, m.
In the analysis, three competing hypothetical travel scenarios, i.e., the dependent variables, y1, y2, and y3, were defined as follows:
- Y1—the probability that the respondent chooses hypothetical journey scenario no. (1), i.e., traveling to the city center using only car,
- Y2—the probability that the respondent chooses hypothetical journey scenario no. (2), i.e., traveling to the city center using only means of public transport,
- Y3—the probability that the respondent chooses hypothetical journey scenario no. (3), i.e., traveling to the city center using a mixed journey, i.e., driving to the P&R facility by a car and then changing the means of transport to public transport.
In this model, one of the categories, taken as a reference, = 0, was assumed. The answers of people who used the P&R facility were the reference in the case of the model of choosing a particular hypothetical journey scenario by respondents.
6.3. Specification of the Model Selection Hypothetical Journey Scenario-Multinomial Logit Model Results
The questions included in the questionnaire allowed for the selection of many independent variables, which were used in a further stage of the analysis to determine their impact or lack of impact on the use of P&R facility by respondents during their journeys. All the characteristics of the respondents were taken into account in the initial stage of the analyses. The factors (independent variables) potentially influencing the selection of a particular hypothetical journey scenario include:
- PL—gender,
- WI—age,
- WY—education,
- WZ—performed activity,
- DO—income (PLN),
- LPJ—the number of years having a driving license,
- LSGD—the number of cars in the household,
- LP—the average number of journeys made by day,
- LMD—the average time spent traveling during the day,
- LKMR—the number of kilometers driven during a year,
- CP—trip purpose.
In the next step of the analysis, independent variables were selected using stepwise regression. Independent variables were selected in the following steps. In the first stage, independent variables that may, from a physical point of view, have an impact on a given dependent variable, were assigned to each dependent variable. In the second stage, variables showing too small dispersion of values among the analyzed data were excluded (based on the coefficient of variation). The value 0.10 was adopted as the border value of the coefficient of variation based on the data presented by the authors of [65]. In the third stage, variables showing a strong correlation with each other were excluded. A strong mutual correlation of independent variables causes the phenomenon of catalysis. This is an increase of the correlation coefficient not resulting from the fact that independent variables were properly selected and that the regression model was properly constructed, but a result of interrelated independent variables. It was assumed that a strong correlation between explanatory variables occurs when the correlation coefficient R ≥ 0.70, based on the data presented by the authors of [66]. In the last, fourth stage, variables having a too weak correlation with the dependent variable were excluded. It was assumed that a low level of correlation occurs when the correlation coefficient R < 0.20, based on the data presented by the authors of [66].
Table 9 shows the independent variables that were left after the three selection steps and which did not show an effect on the dependent variable in the fourth selection step. Earlier in the analysis, the following independent variables were excluded: Income (exclusion on the third stage. This variable showed a strong correlation with the education variable, R = 0.73), the average time spent traveling during the day (exclusion on the third stage. This variable showed a strong correlation with the average number of journeys made by the day variable, R = 0.81) and trip purpose (exclusion on the third stage. This variable showed a strong correlation with the performed activity variable, R = 0.71).
After the above-presented selection of independent variables, the independent variables presented in Table 10 were adopted to assess the use of the P&R facility by the residents of Warsaw. These variables were characterized by a correlation with dependent variables and, at the same time, a weak correlation with each other.
The next part of the analysis concerned the construction of a multinomial logit model to quantify the influence of the determinants of the probability of using the P&R facility during the journey. This enabled the construction of a multinomial logit model to quantify the influence of the determinants of the probability of using the P&R parking during the journey. Three models describing the factors determining the choice of a hypothetical journey scenario were developed in the first stage of the analyses: Models A, B, and C. Model A includes all the variables that were accepted for the analysis, i.e., the variables presented in Table 10. Model B relates only to the characteristics of the respondents, i.e., independent variables PL, WI, WY, WZ, LPJ, and LSGD. Model C includes variables related to the characteristics of the respondents’ travel, i.e., independent variables LP and LKMR. Table 11 presents the results of the estimation of the structural parameters of models A, B, and C.
The variables with a low p-value were not considered in the model even though the overall coefficient of determination (R2) value was good. So, in the next step of analysis, we excluded those explanatory variables that were statistically insignificant, i.e., for which p-value in Table 11 was <0.4, from the model. So, the next three models, i.e., model D, E, and F, were developed after excluding from model A those explanatory variables that were statistically insignificant, i.e., for which p-value < 0.4 (Table 12).
Table 12 presents the parameters of the multinomial model proving some fit of the model to the data. The set of considered variables differentiated the declared choices of a given hypothetical travel scenario. Estimates of the parameters of a multinomial logit model were not interpreted directly, nevertheless, an appropriate transformation of the estimates allowed their proper interpretation. The exponential form of models (2) and (3) was used for this purpose. As a result of the application of the least likelihood method, estimates of the parameters αij were obtained for three hypothetical travel scenarios (Table 13).
Conclusions can be drawn about the nature of the relationships between the choice of a given scenario and the given predictors based on the changing probability of choosing a hypothetical travel scenario. In case choose hypothetical journey scenario no. (1), i.e., traveling to the city center using only car, based on the D model and the odds ratios calculated for each predictor, we found that:
- A person older than another person (not different in terms of other characteristics) has about 14% less chance of choosing a trip using only car,
- a person with a lower level of education than other people has about 15% less chance of choosing a trip using only car, and a person who makes more trips during the day has about 4% greater chance of choosing a trip using only car. The nonworking (by 13%) are also less likely to choose this hypothetical travel scenario.
In turn, in the case of choosing hypothetical journey scenario no. (2), i.e., traveling to the city center using only means of public transport, we found that:
- A person older than another person is about 19% less likely to choose a trip using only means of public transport,
- a person with a lower level of education than others has about 36% less chance of choosing a trip using only means of public transport, and a person who makes more trips during the day has a 7% greater chance of choosing a trip using only means of public transport.
However, in the case of choosing hypothetical journey scenario no. (3), i.e., traveling to the city center using a mixed journey, i.e., driving to the P&R facility by a car and then changing the means of transport to public transport, we found that:
- A person older than another person has about 19% less chance of choosing a mixed journey,
- a person with a lower level of education than others has about 12% less chance of choosing a mixed journey, and a person who makes more journeys during the day has a 7% greater chance of choosing a mixed journey. People who are not working are also less likely to choose this hypothetical travel scenario (by 4%).
Based on the E model and the odds ratios calculated for each predictor in the case of choosing hypothetical journey scenario no. (1), i.e., traveling to the city center using only car, it can be concluded that:
- A person with a lower level of education than other people has about 33% less chance of traveling using only car, and
- a person who carries out more the number of kilometers driven during a year has about 7% less chance of traveling using only car.
In turn, in the case of hypothetical journey scenario no (2), i.e., traveling to the city center using only means of public transport, we found that:
- A person with a lower level of education than others has about 82% less chance of choosing a trip using only means of public transport,
- a person having a driving license for a year longer has about 41% less chance of choosing a trip using only means of public transport, and
- a person who carries out more the number of kilometers driven during a year has about 46% less chance of choosing a trip using only means of public transport. Also, those not working (by 115%) are more likely to choose this hypothetical travel scenario.
However, in the case of hypothetical journey scenario no. (3), i.e., traveling to the city center using a mixed journey, i.e., driving to the P&R facility by a car and then changing the means of transport to public transport, the following conclusions can be made:
- A person with a lower level of education than other people (not different from them in terms of other characteristics) has about 46% less chance of choosing a mixed journey,
- a person having a driving license for a year longer has about 29% less chance of choosing a mixed journey, and
- a person who performs more the number of kilometers driven during a year has about 46% less chance of choosing a mixed journey.
Based on the F model and the odds ratios calculated for individual predictors in the case of choosing hypothetical journey scenario no. (1), i.e., traveling to the city center using only car, the following conclusions can be made:
- A person older than another person (not different from him in terms of other characteristics) has about 42% less chance to choose a trip using only car,
- a person with a lower level of education than other people has about 40% less chance of choosing a trip using only car,
- a person having a driving license for a year longer has about 28% less chance of choosing a trip using only car, and
- a person who carries out more the number of kilometers driven during a year has about 20% less chance of choosing a trip using only car. The nonworking people are also less likely to choose this hypothetical travel scenario (by 12%).
In turn, in the case of the probability that respondent chooses hypothetical journey scenario no. (2), i.e., the probability that respondent will travel to the city center using only means of public transport, the following conclusions can be made:
- A person older than another person is about 11% less likely to choose a trip using only means of public transport,
- a person with a lower level of education than others has about 83% more chance of choosing a trip using only means of public transport,
- a person having a driver’s license for a year longer has about 37% less chance of choosing a trip using only means of public transport, and
- a person who carries out more the number of kilometers driven during a year has about 43% less chance of choosing a trip using only means of public transport. Also, those not working (by 142%) are more likely to choose this hypothetical travel scenario.
However, in the case of choosing hypothetical journey scenario no. (3), i.e., traveling to the city center using a mixed journey, i.e., driving to the P&R facility by a car and then changing the means of transport to public transport, the following conclusions can be made:
- A person older than another person has approximately 21% less chance of choosing a mixed journey,
- a person with a lower level of education than other people has about 48% less chance of choosing a mixed journey,
- a person having a driving license for a year longer has about 25% less chance of choosing a mixed journey, and
- a person who performs more the number of kilometers driven during a year has about 14% less chance of choosing a mixed journey. The nonworking (by 71%) are also less likely to choose this hypothetical travel scenario.
The C model had the lowest R2 (N) value, while the A model had the highest value. In the case of the Log-likelihood value, the highest value was for model A and the lowest for model F. On the other hand, the lowest value of Chi-square occurred in model C and the highest in model A.
7. Discussion and Conclusions
The analysis of the use of the P&R facilities Metro Stokłosy and Metro Ursynów in Warsaw presented in the article showed that, in the summer months (July and August), there was a significant decrease in the number of parked vehicles. Less use of the analyzed facilities also occurred in the preceding month (June) and the following month (September) compared to all months of the year. The reason may be reduced traffic in the city, usually during the holiday season. In all the analyzed facilities, P&R Metro Stokłosy, P&R Metro Ursynów, P&R Metro Anin SKM, and P&R Metro Młociny III, the largest number of vehicles was recorded on Tuesday, Wednesday, and Thursday. On Mondays and Fridays, a decrease in the number of parked vehicles could be observed, and the lowest number of vehicles at P&R facilities was registered on weekend days (Saturday, Sunday). The largest number of vehicle entries to the facilities P&R Metro Stokłosy, P&R Metro Ursynów, and P&R Metro Młociny III was recorded in the morning hours, while the largest number of exits was recorded in the afternoon. The analysis of the parking time of vehicles in P&R Metro Stokłosy, P&R Metro Ursynów, and P&R Metro Młociny showed that drivers left their vehicles mainly for a period longer than 9 h. These results indicate that the greatest number of people using the analyzed facilities are people commuting to work.
The analysis of the pedestrian accessibility made using isochrones showed that the corridor of the passenger service area created by metro lines supplemented with the bus, tram, RUR stops, and bicycle transport (bicycle rentals) allowed for the integration of various transport subsystems and serviced a large part of the city of Warsaw. P&R parking increased the accessibility to public transport stops.
Then, an attempt was made to identify the causes of the insufficient use of P&R facilities in Warsaw. The results of the research, which aimed at indicating the characteristics determining the selection of a particular hypothetical journey scenario, showed that the majority of respondents (72%) did not use P&R facilities in Warsaw. This fact was confirmed in reality. Most of the respondents chose the first hypothetical journey scenario (52%). The profile of these respondents allows for the conclusion that they were men aged 18–24, with higher education, working with a net monthly income ranging from PLN 2.000 to PLN 2.999 (~455–682 Є). Based on the responses, it can also be concluded that most respondents made two journeys a day, spent an average of 30–59 min traveling in one day, and drove 20,000 km or more during a year by car. The travel time was the most important factor for people who chose this hypothetical journey scenario, while the travel cost was the least significant factor when choosing the hypothetical journey scenario. People who chose only to travel by means of public transport indicated the travel cost as the most important factor. However, in the case of people who chose the travel mode using the P&R facility, the travel time was the most important, but not as much as in the first scenario. In this case, a significant proportion of people indicated the cost of travel as an important factor in choosing the travel mode.
The choice of hypothetical journey scenario no. (3), i.e., traveling to the city center using a mixed journey, i.e., driving to the P&R facility by a car and then changing the means of transport to public transport, was influenced by features such as age, level of education, number of trips made during the day, performed activity based on the D model, and odds ratios calculated for each predictor. However, based on the E model and the odds ratios calculated for each predictor, it can be concluded that choosing hypothetical journey scenario no. (3) is influenced by features such as the level of education, the number of years of having a driver’s license, the number of kilometers driven during a year, and the performed activity influenced the decision. On the other hand, based on the F model and the odds ratios calculated for each predictor, it can be concluded that, in the case of choosing hypothetical journey scenario no. (3), features as such age, education level, number of years of having a driver’s license, the number of kilometers driven during a year, and the performed activity influenced the decision.
A comparison of the results obtained in the research with the results for the P&R built in other cities allows for the conclusion that, according to the results of the analyses presented in the paper, the decision to choose a hypothetical travel scenario depends on many factors, but mainly the level of education, the number of years of having a driving license, age, the number of kilometers traveled during the year, and the performed activity. On the other hand, in the studies of other authors (see Table 1), it can be concluded that different authors took into account different factors in their research. However, the most frequently recurring determinants were gender, age, income, place of employment, destination, travel time, and parking fee. These differences result from behavioral issues as well as from the specificity of the countries where the research was conducted.
Further research directions in the area of the P&R facility should focus on defining the criteria that make a specific P&R successful. There are many factors which determine the success of P&R, mainly including an efficient public transport system, particularly with the presence of metro lines near the P&R and significant traffic volumes on the transport networks in the city center, which means that drivers suffer a lot of delays, have problems with finding a free place for parking, face high parking fees in the city center, and many others factors.
Author Contributions
Conceptualization, E.M., and A.K.; methodology, E.M., and A.K.; software, A.K.; validation, E.M., and A.K.; formal analysis, E.M.; investigation, A.K.; resources, A.K.; data curation, A.K.; writing-original draft preparation, A.K., E.M.; writing-review and editing, E.M.; visualization, A.K.; supervision, E.M.; project administration, E.M.; funding acquisition, E.M. All authors have read and agreed to the published version of the manuscript.
Funding
This research received no external funding.
Institutional Review Board Statement
Not applicable.
Informed Consent Statement
Informed consent was obtained from all subjects involved in the study.
Data Availability Statement
Data is contained within the article.
Acknowledgments
The authors wish to acknowledge The Public Transport Authority in Warsaw (Poland) for providing access to data for research and analysis purposes as well as for their contributions in the understanding of the Part and Ride Facility. The authors also would like to thanks the Students, PhD Students, Graduate from Transport Systems and Traffic Engineering Department, Faculty of Transport and Aviation Engineering, Silesian University of Technology in Katowice as well as other Students from other University who took part in field questionnaires survey collection.
Conflicts of Interest
The authors declare no conflict of interest.
References
- Guerra, E.; Cervero, R.; Tischler, D. Half-mile circle: Does it best represent transit station catchments? Transp. Res. Rec. 2012, 2276, 101–109. [Google Scholar] [CrossRef] [Green Version]
- Kuby, M.; Barranda, A.; Upchurch, C. Factors influencing light-rail station boardings in the United States. Transp. Res. Part A Policy Pract. 2004, 38, 223–247. [Google Scholar] [CrossRef]
- Macioszek, E. Electric Vehicles-Problems and Issues. In Smart and Green Solutions for Transport Systems. Advances in Intelligent Systems and Computing; Sierpiński, G., Ed.; Springer: Cham, Switzerland, 2020; Volume 1091, pp. 169–183. [Google Scholar]
- Norlida, A.H.; Jamilah, M.; Karim, M.R. Parking duration of fringe Park-and-ride users and delineation of stations Catchment Area: Case of the Kuala Lumpur conurbation. J. East. Asia Soc. Transp. Stud. 2007, 7, 1296–1310. [Google Scholar]
- Hendricks, S.; Outwater, M. Demand forecasting model for park-and-ride lots in King County, Washington. Transp. Res. Rec. 1998, 1623, 80–87. [Google Scholar] [CrossRef]
- Kimpton, A.; Pojani, D.; Sipe, N.; Corcoran, J. Parking Behaviour: Park ‘n’ Ride (PnR) to encourage multimodalism in Brisbane. Land Use Policy 2020, 91, 1–16. [Google Scholar] [CrossRef]
- Turnbull, K.F. Effective use of park-and-ride facilities. National Cooperative Research Program Synthesis. Transp. Res. Board 1995, 213, 1–51. [Google Scholar]
- Mather, J. Guidelines and standards for the planning, design, and operation of bus park-and-ride facilities. Transp. Res. Rec. 1983, 908, 1–6. [Google Scholar]
- Maricopa Association of Governments. MAG Park-and-Ride Site Selection Study. Phoenix, Arizona. 2001. Available online: https://www.azmag.gov/Portals/0/Documents/TC_2011-04-14_AGD.pdf?ver=2017-04-06-111814-837 (accessed on 15 January 2019).
- Farhan, B.; Murray, A.T. Siting park-and-ride facilities using a multi-objective spatial optimization model. Comput. Oper. Res. 2008, 35, 445–456. [Google Scholar] [CrossRef]
- Wang, H.; Meng, Q.; Zhang, X.N. Park-and-ride network equilibrium with heterogeneouscommuters and parking space constraint. Transp. Res. Rec. 2014, 2466, 87–97. [Google Scholar] [CrossRef]
- Fan, W.; Khan, M.B.; Ma, J.; Jiang, X. Bilevel programming model for locating park-and-ride facilities. J. Urban Plan. Dev. 2014, 140, 04014007. [Google Scholar] [CrossRef]
- Chen, X.Y.; Yang, X.K.; Xu, Z. Location Configuration Design of New Park-and-Ride Facilities in Beijing, China. In CICTP 2012: Multimodal Transportation Systems-Convenient, Safe, Cost-Effective, Efficient; Twelfth COTA International Conference of Transportation Professionals; ASCE: Beijing, China, 2012; pp. 11–22. [Google Scholar]
- Song, Z.; He, Y.; Zhang, L. Integrated planning of park and ride facilities and transit service. Transp. Res. Part C Emerg. Technol. 2017, 74, 182–195. [Google Scholar] [CrossRef]
- Khakbaz, A.; Nookabadi, A.S.; Shetab-Bushehri, S.N. A model for locating park-and-ride facilities on urban networks based on maximizing flow capture: A case study of Isfahan, Iran. Netw. Spat. Econ. 2013, 13, 43–66. [Google Scholar] [CrossRef]
- Chen, X.; Liu, Z.; Currie, G. Optimizing location and capacity of rail-based Park-and-Ride sites to increase public transport usage. Transp. Plan. Technol. 2016, 39, 507–526. [Google Scholar] [CrossRef]
- Webb, A.; Khani, A. Park-and-Ride Choice Behavior in a Multimodal Network with Overlapping Routes. Transp. Res. Rec. 2020, 2674, 150–160. [Google Scholar] [CrossRef]
- Bos, I.; Molin, E. Is there a “Stick” Bonus? A Stated Choice Model for P&R Patronage incorporating cross Effects. Eur. J. Transp. Infrastruct. Res. 2006, 6, 275–290. [Google Scholar] [CrossRef]
- He, B.; He, W.; He, M. The attitude and preference of traveler to the Park & Ride facilities: A case study in Nanjing, China. Procedia Soc. Behav. Sci. 2012, 43, 294–301. [Google Scholar]
- Du, Y.C.; Wang, J.; Liu, L.; Sun, L. How to Improve the Efficiency of Park-and-Ride: A Case Study in Shanghai, China. In Proceedings of the 15 th COTA International Conference of Transportation Professionals, Beijing, China, 25–27 July 2015; pp. 1238–1249. [Google Scholar]
- Clayton, W.; Ben-Elia, E.; Parkhurst, G.; Ricci, M. Where to park? A behavioural comparison of bus Park and Ride and city centre car park usage in Bath, UK. J. Transp. Geogr. 2014, 36, 124–133. [Google Scholar] [CrossRef]
- Liu, X.; Yun, M.; Chen, Z.; Yang, X. Investigation, analysis, and modeling of choice behavior of park and ride. In CICTP 2012: Multimodal Transportation Systems-Convenient, Safe, Cost-Effective, Efficien; ASCE: Reston, VA, USA, 2012; pp. 1643–1651. [Google Scholar]
- Zhao, X.; Li, Y.; Xia, H. Behavior decision model for park-and-ride facilities utilization. Adv. Mech. Eng. 2017, 9, 1–9. [Google Scholar] [CrossRef] [Green Version]
- Huang, K.; Zhu, T.; An, K.; Liu, Z.; Kim, I. Analysis of the acceptance of park-and-ride by users. J. Transp. Land Use 2019, 12, 637–647. [Google Scholar] [CrossRef] [Green Version]
- Kono, Y.; Uchida, K.; Andrade, K. Economical welfare maximisation analysis: Assessing the use of existing Park-and-Ride services. Transportation 2014, 41, 839–854. [Google Scholar] [CrossRef]
- Qin, H.; Guan, H.; Wu, Y.J. Analysis of park-and-ride decision behavior based on Decision Field Theory. Transp. Res. Part F Traffic Psychol. Behav. 2013, 18, 199–212. [Google Scholar] [CrossRef]
- Macioszek, E.; Kurek, A. The use of a Park and Ride system—A case study based on Cracow city (Poland). Energies 2020, 13, 3473. [Google Scholar] [CrossRef]
- Macioszek, E. First and last mile delivery-problems and issues. In Advanced Solutions of Transport Systems for Growing Mobility. Advances in Intelligent Systems and Computing; Sierpiński, G., Ed.; Springer: Cham, Switzerland, 2018; Volume 631, pp. 147–154. [Google Scholar]
- Szarata, A. Wpływ parkingów Park and Ride na czas przejazdu odcinka w sieci ulicznej-porównanie metody analitycznej i symulacyjnej. Zesz. Nauk. Bud./Politech. Śląska 2004, 102, 511–518. [Google Scholar]
- Szarata, A. Prognozowanie podróży park and ride metodą modelowania. Zesz. Nauk. Tech. Stow. Inżynierów I Tech. Komun. W Krakowie Ser. Mater. Konf. 2007, 80, 157–174. [Google Scholar]
- Szarata, A. Defining shape of membership function for Mamdani’s Fuzzy Inference System within park & ride share modelling. Aip Conf. Proc. 2015, 1648, 600004-1–600004-5. [Google Scholar]
- Brzeziński, A.; Jesionkiewicz-Niedzińska, K.; Rogala, A. Wady i zalety systemu Parkuj i jedź na przykładzie aglomeracji warszawskiej. Transp. Miej. I Reg. 2013, 8, 4–9. [Google Scholar]
- Kowalski, M.; Górecka, A. Problemy wykorzystania parkingów systemu P + R w Warszawie. Logistyka 2014, 4, 3598–3606. [Google Scholar]
- Kurek, A. Analysis of transport availability of Warsaw city. Master’s Thesis, Transport Systems and Traffic Engineering Department, Faculty of Transport and Aviation Engineering, Silesian University of Technology, Katowice, Poland, 2019. [Google Scholar]
- Fierek, S.; Bieńczak, M.; Zmuda-Trzebiatowski, P. Multiple criteria evaluation of P&R lots location. Transp. Res. Procedia 2020, 47, 489–496. [Google Scholar]
- Lower, A.; Lower, M.; Masztalski, R.; Szumilas, A. The Location of Park and Ride Facilities Using the Fuzzy Inference Model. World Acad. Sci. Eng. Technol. Int. J. Civ. Environ. Eng. 2015, 10, 1367–1374. [Google Scholar]
- Parkitny, W. Model matematyczny wyboru lokalizacji miejsc przesiadkowych i parkingów dla systemu P & R. Zesz. Nauk. -Tech. Stow. Inżynierów I Tech. Komun. W Krakowie. Ser. Mater. Konf 2007, 80, 137–146. [Google Scholar]
- Public Transport Authority in Warsaw Website. Available online: https://www.ztm.waw.pl/ (accessed on 8 January 2019).
- Szarata, A. with the Team; Jacyna, M. with the Team. WBR 2005, Warsaw Traffic Study along with the Development of a Traffic Model: Synthesis. BPRW S.A. Available online: http://transport.um.warszawa.pl/wbr-2015 (accessed on 1 March 2020).
- Central Statistical Office in Poland. Available online: www.stat.gov.pl/ (accessed on 12 March 2019).
- Jacyna, M.; Wasiak, M. Multicriteria decision support in designing transport systems. Commun. Comput. Inf. Sci. 2015, 531, 11–23. [Google Scholar]
- Jacyna, M.; Wasiak, M.; Lewczuk, K.; Kłodawski, M. Simuation model of transport system of Poland as a tool for developing sustainable transport. Arch. Transp. 2014, 31, 23–35. [Google Scholar] [CrossRef]
- Jacyna, M.; Kłodawski, M. Model of transportation network development in aspect of transport comodality. In Proceedings of the ICSEng 2011: International Conference on Systems Engineering, LAs Vegas, NV, USA, 16–18 August 2011; pp. 341–345. [Google Scholar]
- Jacyna, M. The urban logistics service in the aspect of the domestic logistic system. Wit Trans. Built Environ. 2011, 116, 117–128. [Google Scholar]
- Jacyna, M.; Lewczuk, K.; Szczepański, E.; Gołębiowski, P.; Jachimowski, R.; Kłodawski, M.; Pyza, D.; Sivets, O.; Wasiak, M.; Żak, J.; et al. Effectiveness of national transport system according to costs of emission of pollutants. Safety and Reliability: Methodology and Applications. In Proceedings of the European Safety and Reliability Conference, Wroclaw, Poland, 14–18 September 2014; pp. 559–567. [Google Scholar]
- Macioszek, E. Changes in Values of Traffic Volume—Case Study Based on General Traffic Measurements in Opolskie Voivodeship (Poland). In Directions of Development of Transport Networks and Traffic Engineering. Lecture Notes in Networks and Systems; Macioszek, E., Sierpiński, G., Eds.; Springer: Cham, Switzerland, 2019; Volume 51, pp. 66–76. [Google Scholar]
- Open Street Map. Available online: https://www.openstreetmap.org/#map=11/52.1792/20.9722 (accessed on 12 May 2019).
- The Website of Warsaw Subway. Available online: www.metro.waw.pl (accessed on 24 March 2019).
- Warsaw Public Transport Website. Available online: https://www.wtp.waw.pl/parkingi/ (accessed on 1 January 2019).
- Olszewski, P. Dostępność piesza jako element jakości komunikacji miejskiej. Transp. Miej. I Reg. 2008, 1, 19–33. [Google Scholar]
- Cronbach, L.J. Coefficient alpha and the internal structure of tests. Psychometrica 1951, 16, 297–334. [Google Scholar] [CrossRef] [Green Version]
- Tavakol, M.; Dennick, R. Making sense of Cronbach’s alpha. Int. J. Med Educ. 2011, 2, 53–55. [Google Scholar] [CrossRef]
- Carmines, E.G.; Zeller, R.A. Reliability and Validity Assessment; Sage Publications: New York, NY, USA, 1982. [Google Scholar]
- Macioszek, E.; Świerk, P.; Kurek, A. The Bike-Sharing System as an Element of Enhancing Sustainable Mobility—A Case Study based on a City in Poland. Sustainability 2020, 12, 3285. [Google Scholar] [CrossRef] [Green Version]
- Yurdugul, H. Minimum sample size for Cronbach’s coefficient alpha: A Monte-Carlo study. Hacet. Univ. J. Educ. 2008, 35, 397–405. [Google Scholar]
- Streiner, D. Starting at the beginning: An introduction to coefficient alpha and internal consistency. J. Personal. Assess. 2003, 80, 99–103. [Google Scholar] [CrossRef]
- Cortina, J.M. What is Coefficient Alpha? An Examination of Theory and Applications. J. Appl. Psychol. 1993, 78, 98–104. [Google Scholar] [CrossRef]
- Macioszek, E. The comparison of models for follow-up headway at roundabouts. In Recent Advances in Traffic Engineering for Transport Networks and Systems. Lecture Notes in Networks and Systems; Macioszek, E., Sierpiński, G., Eds.; Springer: Cham, Switzerland, 2018; Volume 21, pp. 16–26. [Google Scholar]
- Boone, H.N.; Boone, D.A. Analyzing Likert Data. J. Ext. 2012, 50, 1–5. [Google Scholar]
- Allen, E.; Seaman, C.A. Likert Scales and Data Analyses. Qual. Prog. 2007. Available online: http://rube.asq.org/quality-progress/2007/07/statistics/likert-scales-and-data-analyses.html (accessed on 3 April 2019).
- Jamieson, S. Likert scales: How to (ab) use them. Med Educ. 2004, 38, 1212–1218. [Google Scholar] [CrossRef] [PubMed]
- Survey Online. Available online: https://www.survio.com/pl/ (accessed on 3 January 2017).
- Google Maps. Available online: https://www.google.pl/maps (accessed on 10 April 2019).
- Bąk, A. Modele kategorii nieuporządkowanych w badaniach preferencji. Pr. Nauk. Uniw. Ekon. We Wrocławiu 2012, 242, 86–95. [Google Scholar]
- Dziechciarz-Duda, M. Analiza zasobności materialnej gospodarstw domowych w świetle wybranych potrzeb. Pr. Nauk. Uniw. Ekon. We Wrocławiu 2018, 508, 38–47. [Google Scholar] [CrossRef]
- Zeliaś, A. Metody Statystyczne. Zadania i Sprawdziany; PWE: Warsaw, Poland, 2002. [Google Scholar]
Figure 1.
Scheme of rail transport connections in Warsaw. Source: Own based on [38].
Figure 1.
Scheme of rail transport connections in Warsaw. Source: Own based on [38].

Figure 2.
Localization of P&R facilities in the background of the city of Warsaw. Source: Own research based on [47].
Figure 2.
Localization of P&R facilities in the background of the city of Warsaw. Source: Own research based on [47].

Figure 3.
Distribution of the number of passengers using the metro line stations where the P&R facility is located. Source: Own research based on [48].
Figure 3.
Distribution of the number of passengers using the metro line stations where the P&R facility is located. Source: Own research based on [48].

Figure 4.
Distribution of the P&R facility use in Warsaw in 2018. Source: Own research based on [38].
Figure 4.
Distribution of the P&R facility use in Warsaw in 2018. Source: Own research based on [38].

Figure 5.
General views of the analyzed P&R facilities in Warsaw; (a) Metro Stokłosy; (b) Metro Młociny III; (c) Metro Ursynów; (d) Anin SKM.
Figure 5.
General views of the analyzed P&R facilities in Warsaw; (a) Metro Stokłosy; (b) Metro Młociny III; (c) Metro Ursynów; (d) Anin SKM.


Figure 6.
The overview of the most important issues included in the questionnaire content.

Figure 7.
The average number of vehicles in the P&R facility Metro Stokłosy and P&R Metro Ursynów in Warsaw in 2018 divided into: (a) Days of the week; (b) months of the year.
Figure 7.
The average number of vehicles in the P&R facility Metro Stokłosy and P&R Metro Ursynów in Warsaw in 2018 divided into: (a) Days of the week; (b) months of the year.

Figure 8.
The distribution of parking time at P&R facilities Metro Stokłosy and Metro Ursynów on working days in Warsaw in 2018.
Figure 8.
The distribution of parking time at P&R facilities Metro Stokłosy and Metro Ursynów on working days in Warsaw in 2018.

Figure 9.
The average number of vehicle entries and exits on working days at P&R facility Metro Stokłosy and P&R facility Metro Ursynów in 2018.
Figure 9.
The average number of vehicle entries and exits on working days at P&R facility Metro Stokłosy and P&R facility Metro Ursynów in 2018.

Figure 10.
The average number of vehicles divided into days of the week in the P&R facility Anin SKM in November 2018.
Figure 10.
The average number of vehicles divided into days of the week in the P&R facility Anin SKM in November 2018.

Figure 11.
P&R facility Metro Młociny III on working days in November and December 2018: (a) The distribution of parking time; (b) the average number of vehicle entries and exits.
Figure 11.
P&R facility Metro Młociny III on working days in November and December 2018: (a) The distribution of parking time; (b) the average number of vehicle entries and exits.

Figure 12.
Results of the pedestrian accessibility analysis from metro line stops to P&R facilities: Metro Stokłosy, Metro Ursynów, and Metro Młociny III. Source: Own research based on QGIS software.
Figure 12.
Results of the pedestrian accessibility analysis from metro line stops to P&R facilities: Metro Stokłosy, Metro Ursynów, and Metro Młociny III. Source: Own research based on QGIS software.

Figure 13.
Results of pedestrian accessibility analysis for the P&R facility Anin SKM (a) to Rapid Urban Railway (RUR) stops; (b) to RUR stops and metro line stations. Source: Own research based on QGIS software.
Figure 13.
Results of pedestrian accessibility analysis for the P&R facility Anin SKM (a) to Rapid Urban Railway (RUR) stops; (b) to RUR stops and metro line stations. Source: Own research based on QGIS software.

Figure 14.
Structure of respondents’ answers regarding the use of the P&R facility.

Figure 15.
Characteristics of the respondents in terms of the selection of hypothetical journey scenarios depending on the following characteristics of the respondents: (a) Gender; (b) age; (c) education; (d) activity performed; (e) monthly income (Net); (f) the number of years of having a driver’s license; (g) the average number of journeys made by day; (h) the number of cars in the household; (i) the average time spent traveling during the day; (j) the number of kilometers driven during a year.

Figure 16.
Factors determining the selection of hypothetical journey scenarios.


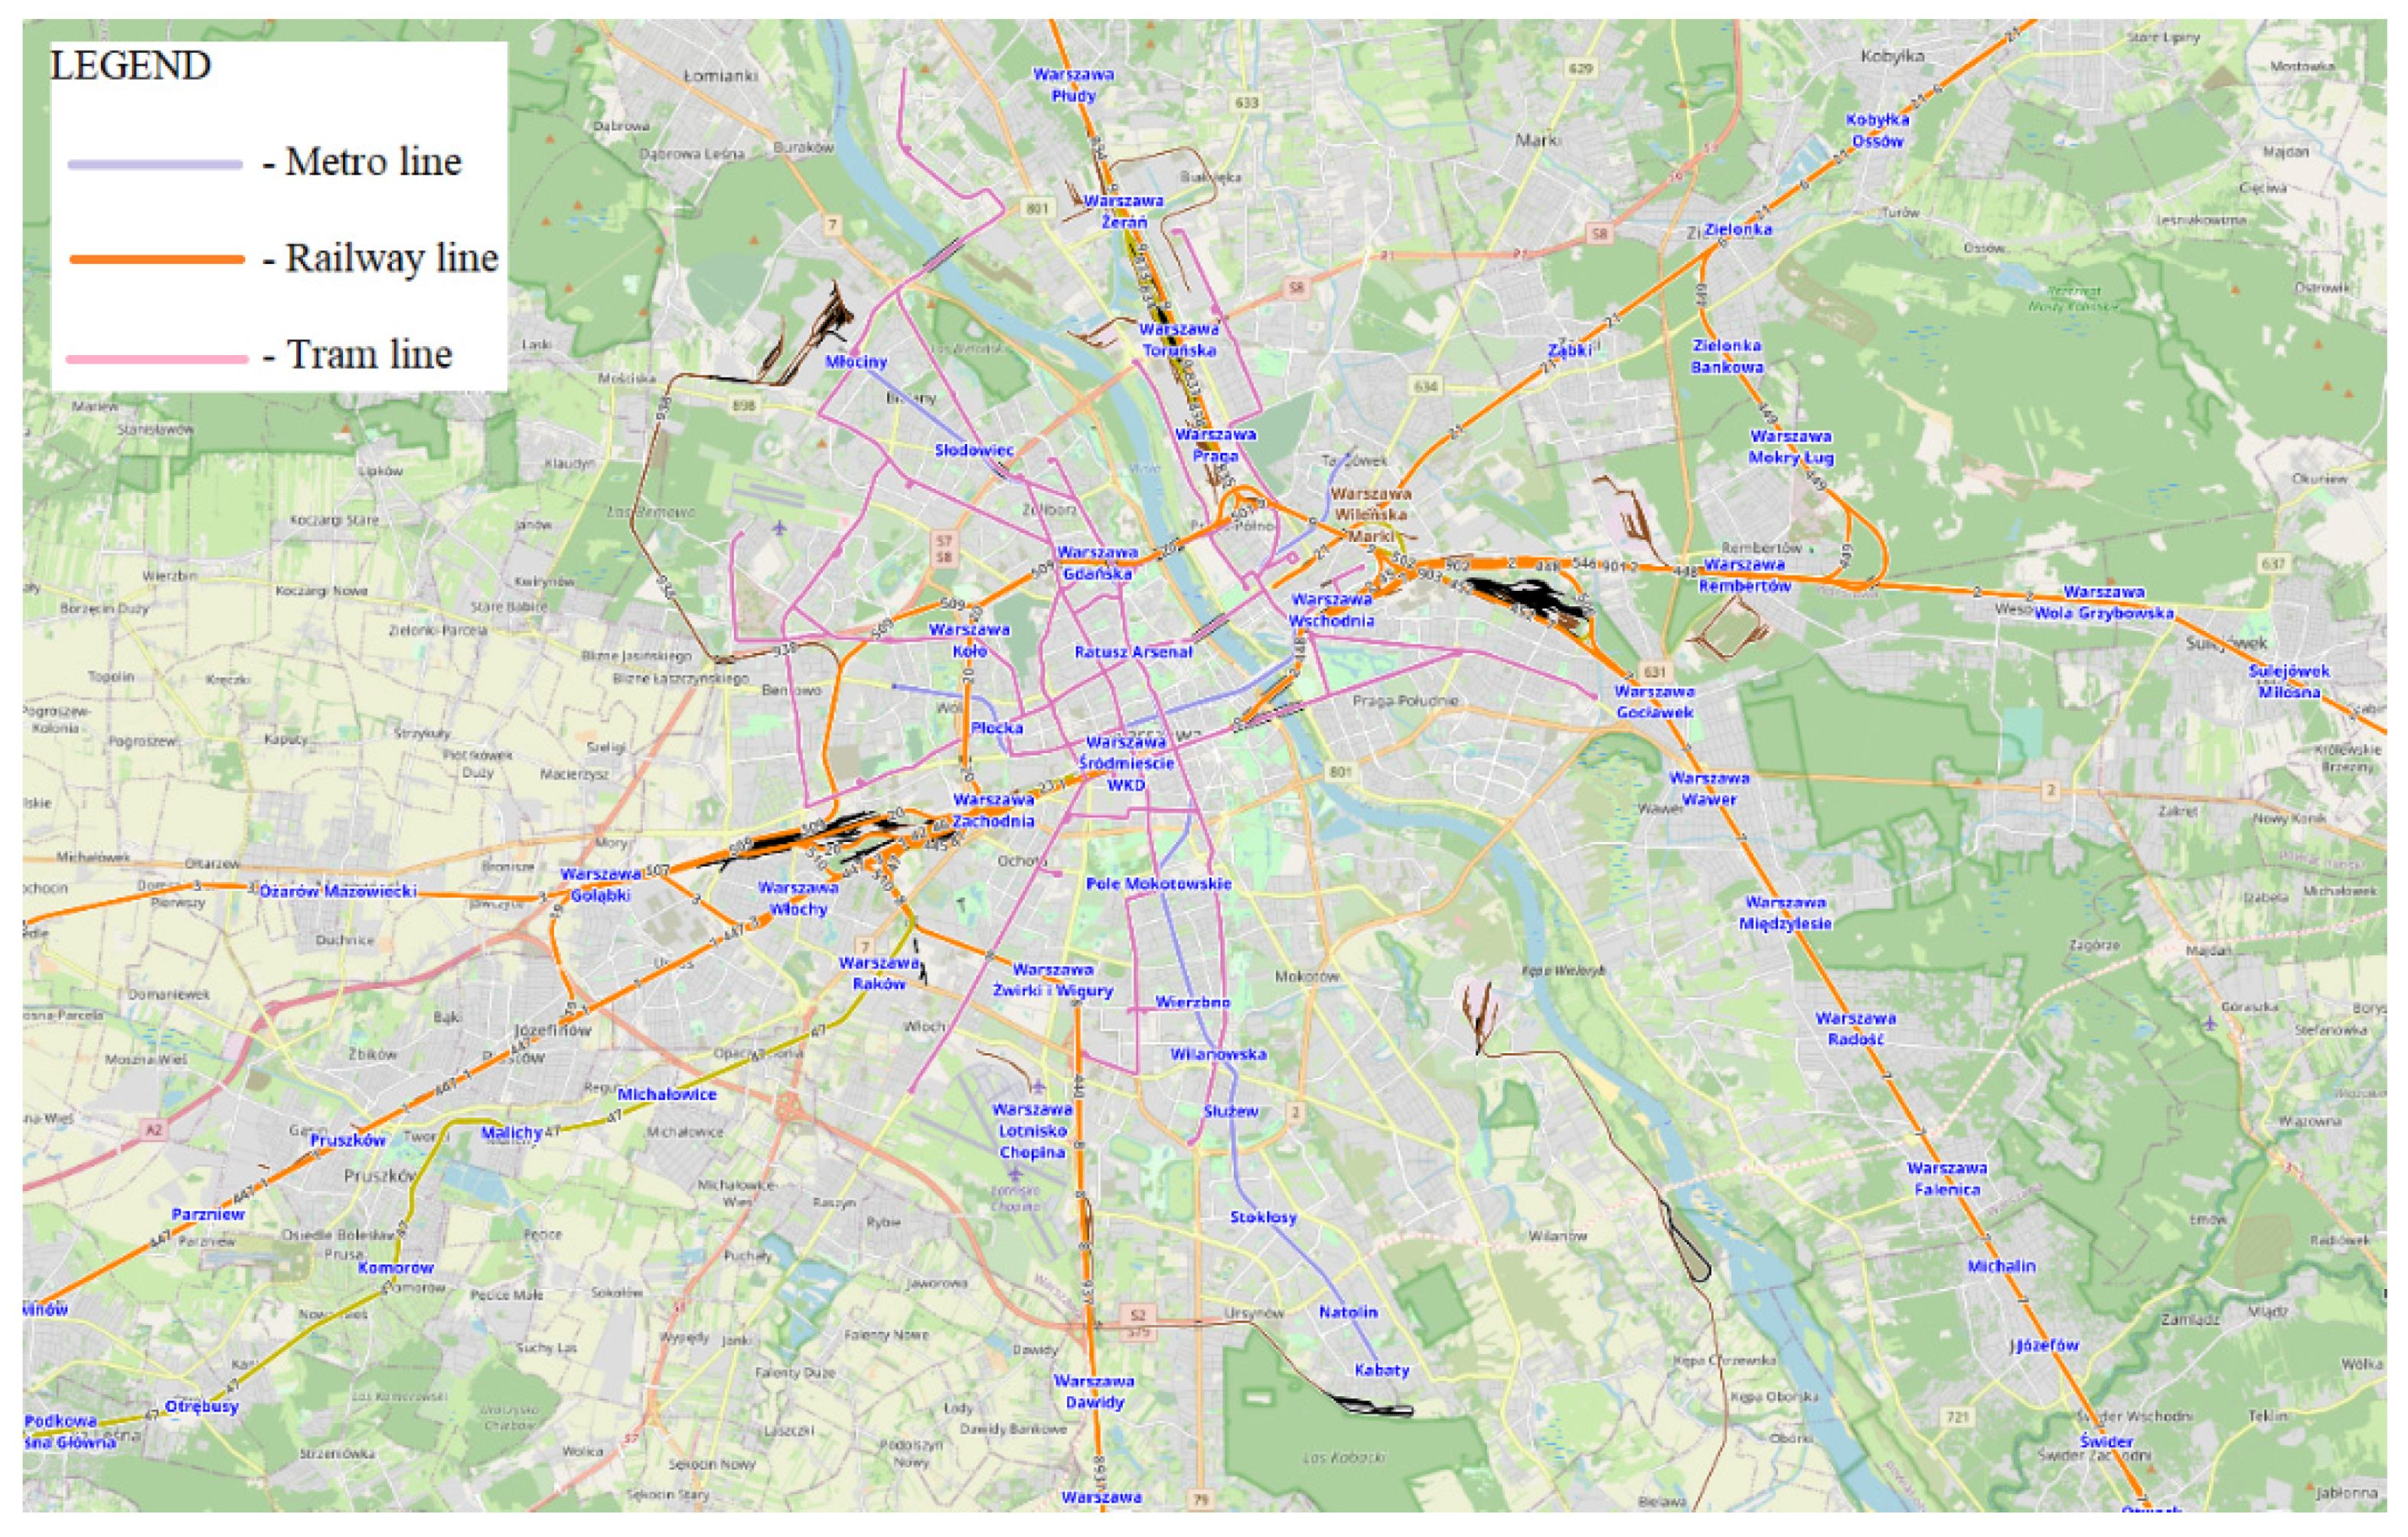
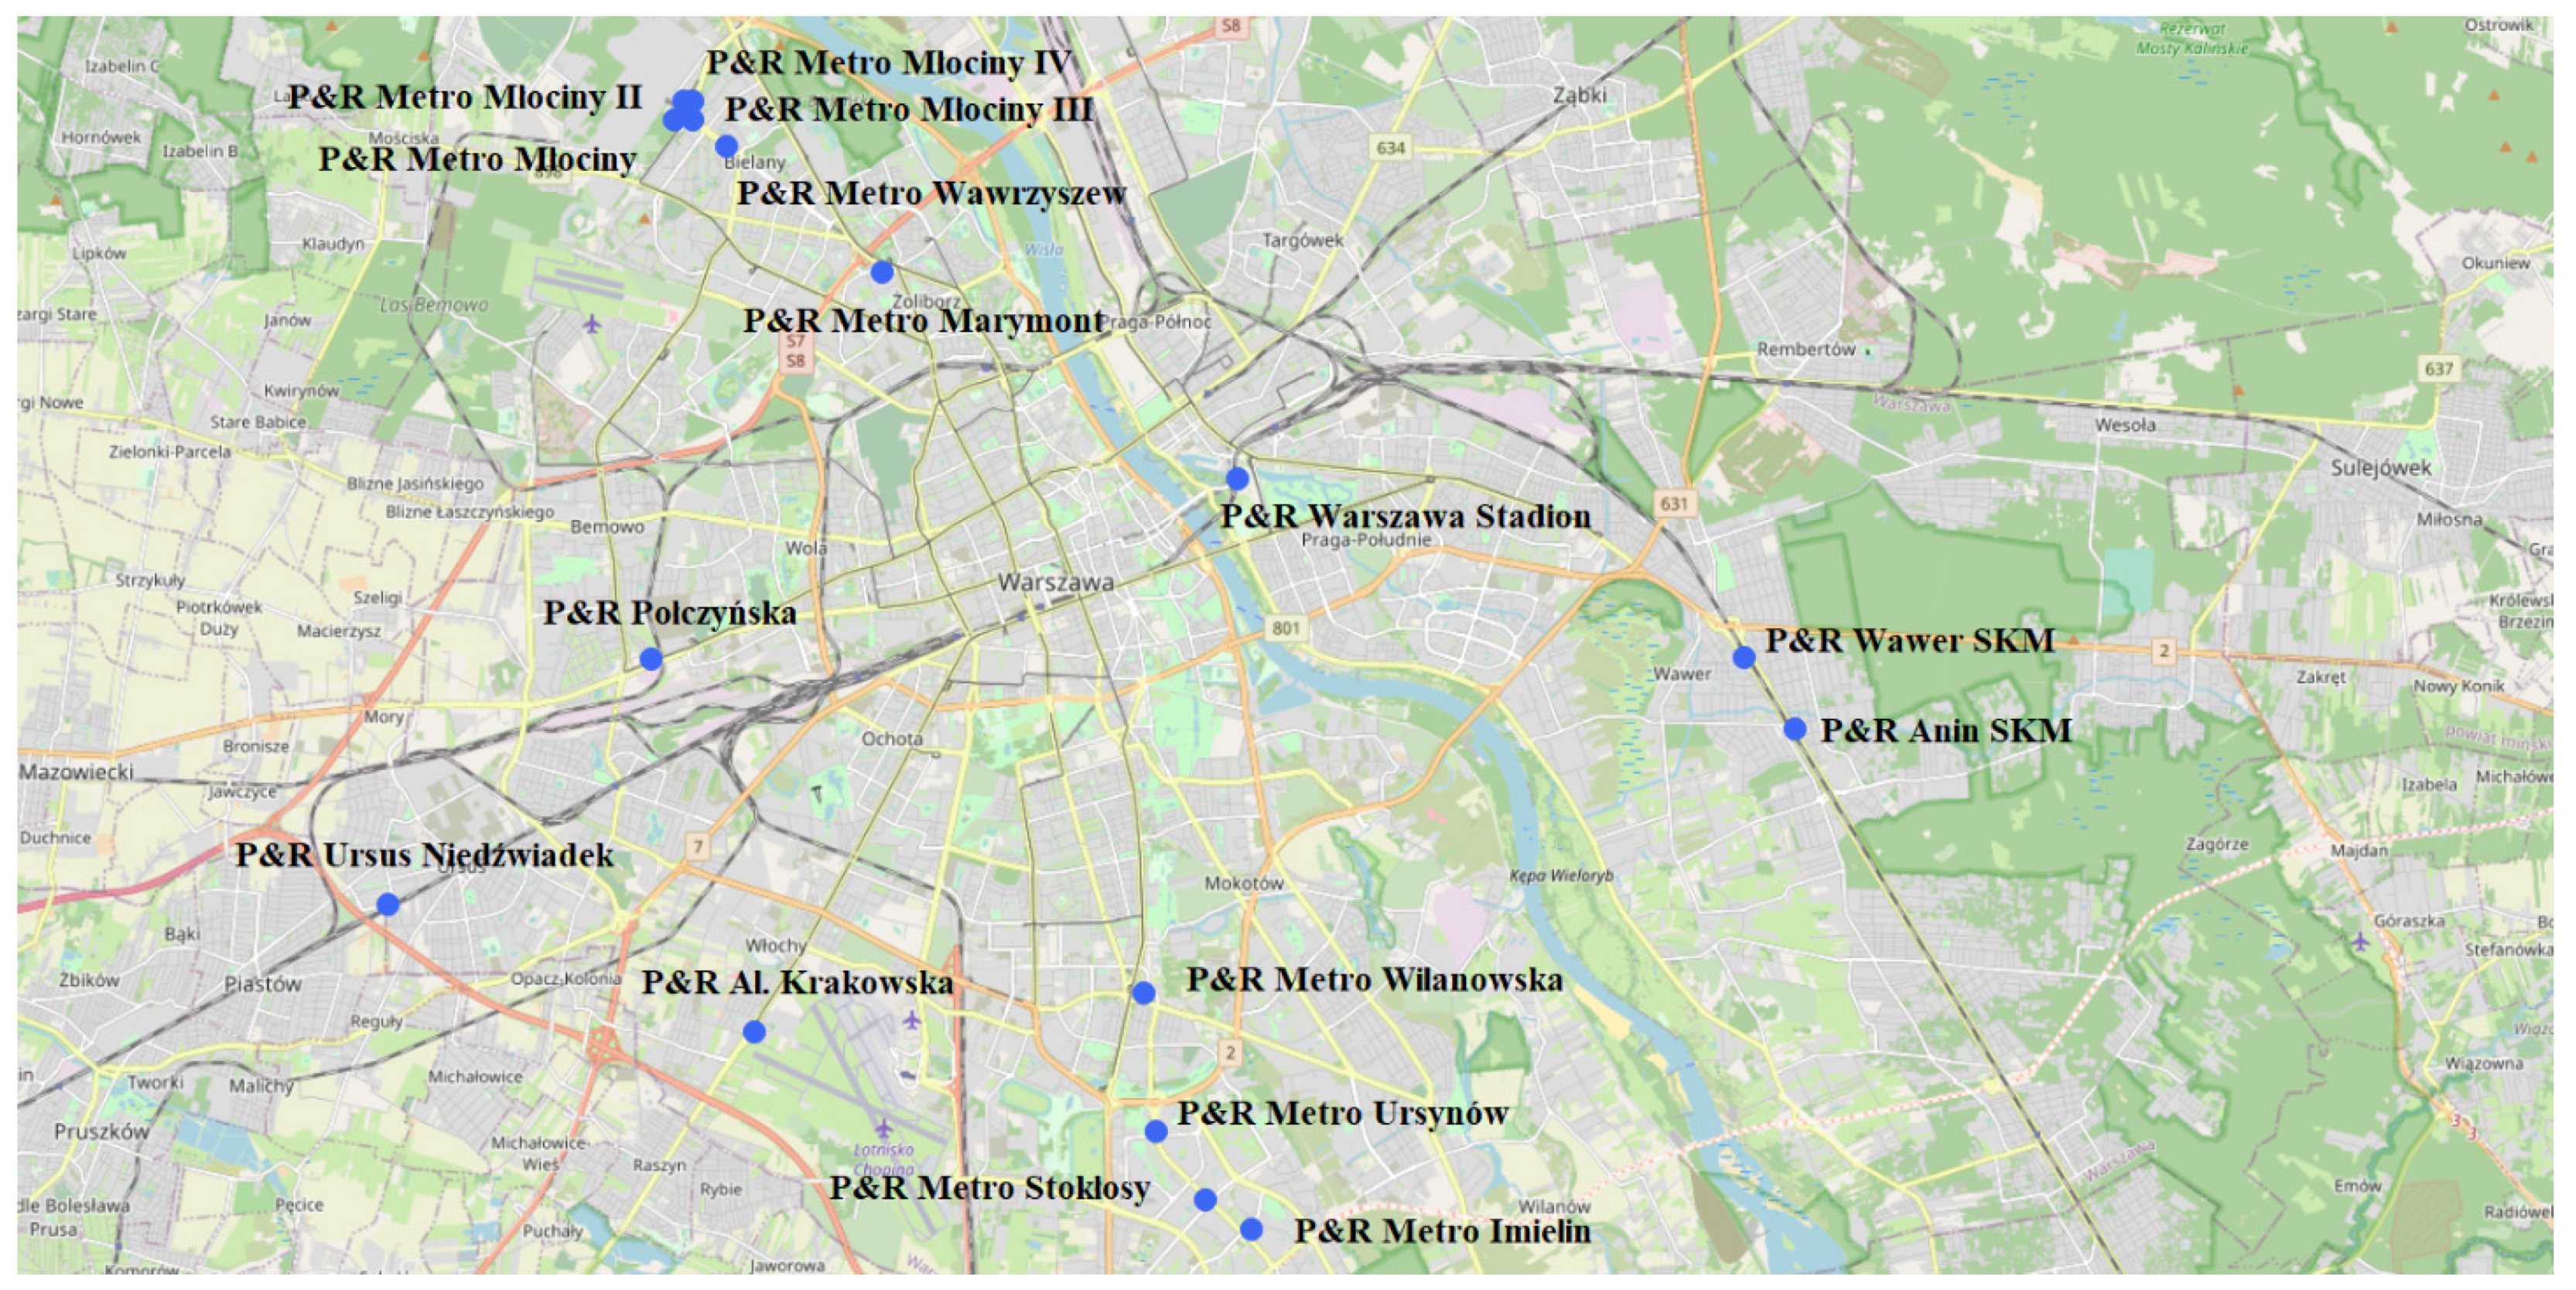
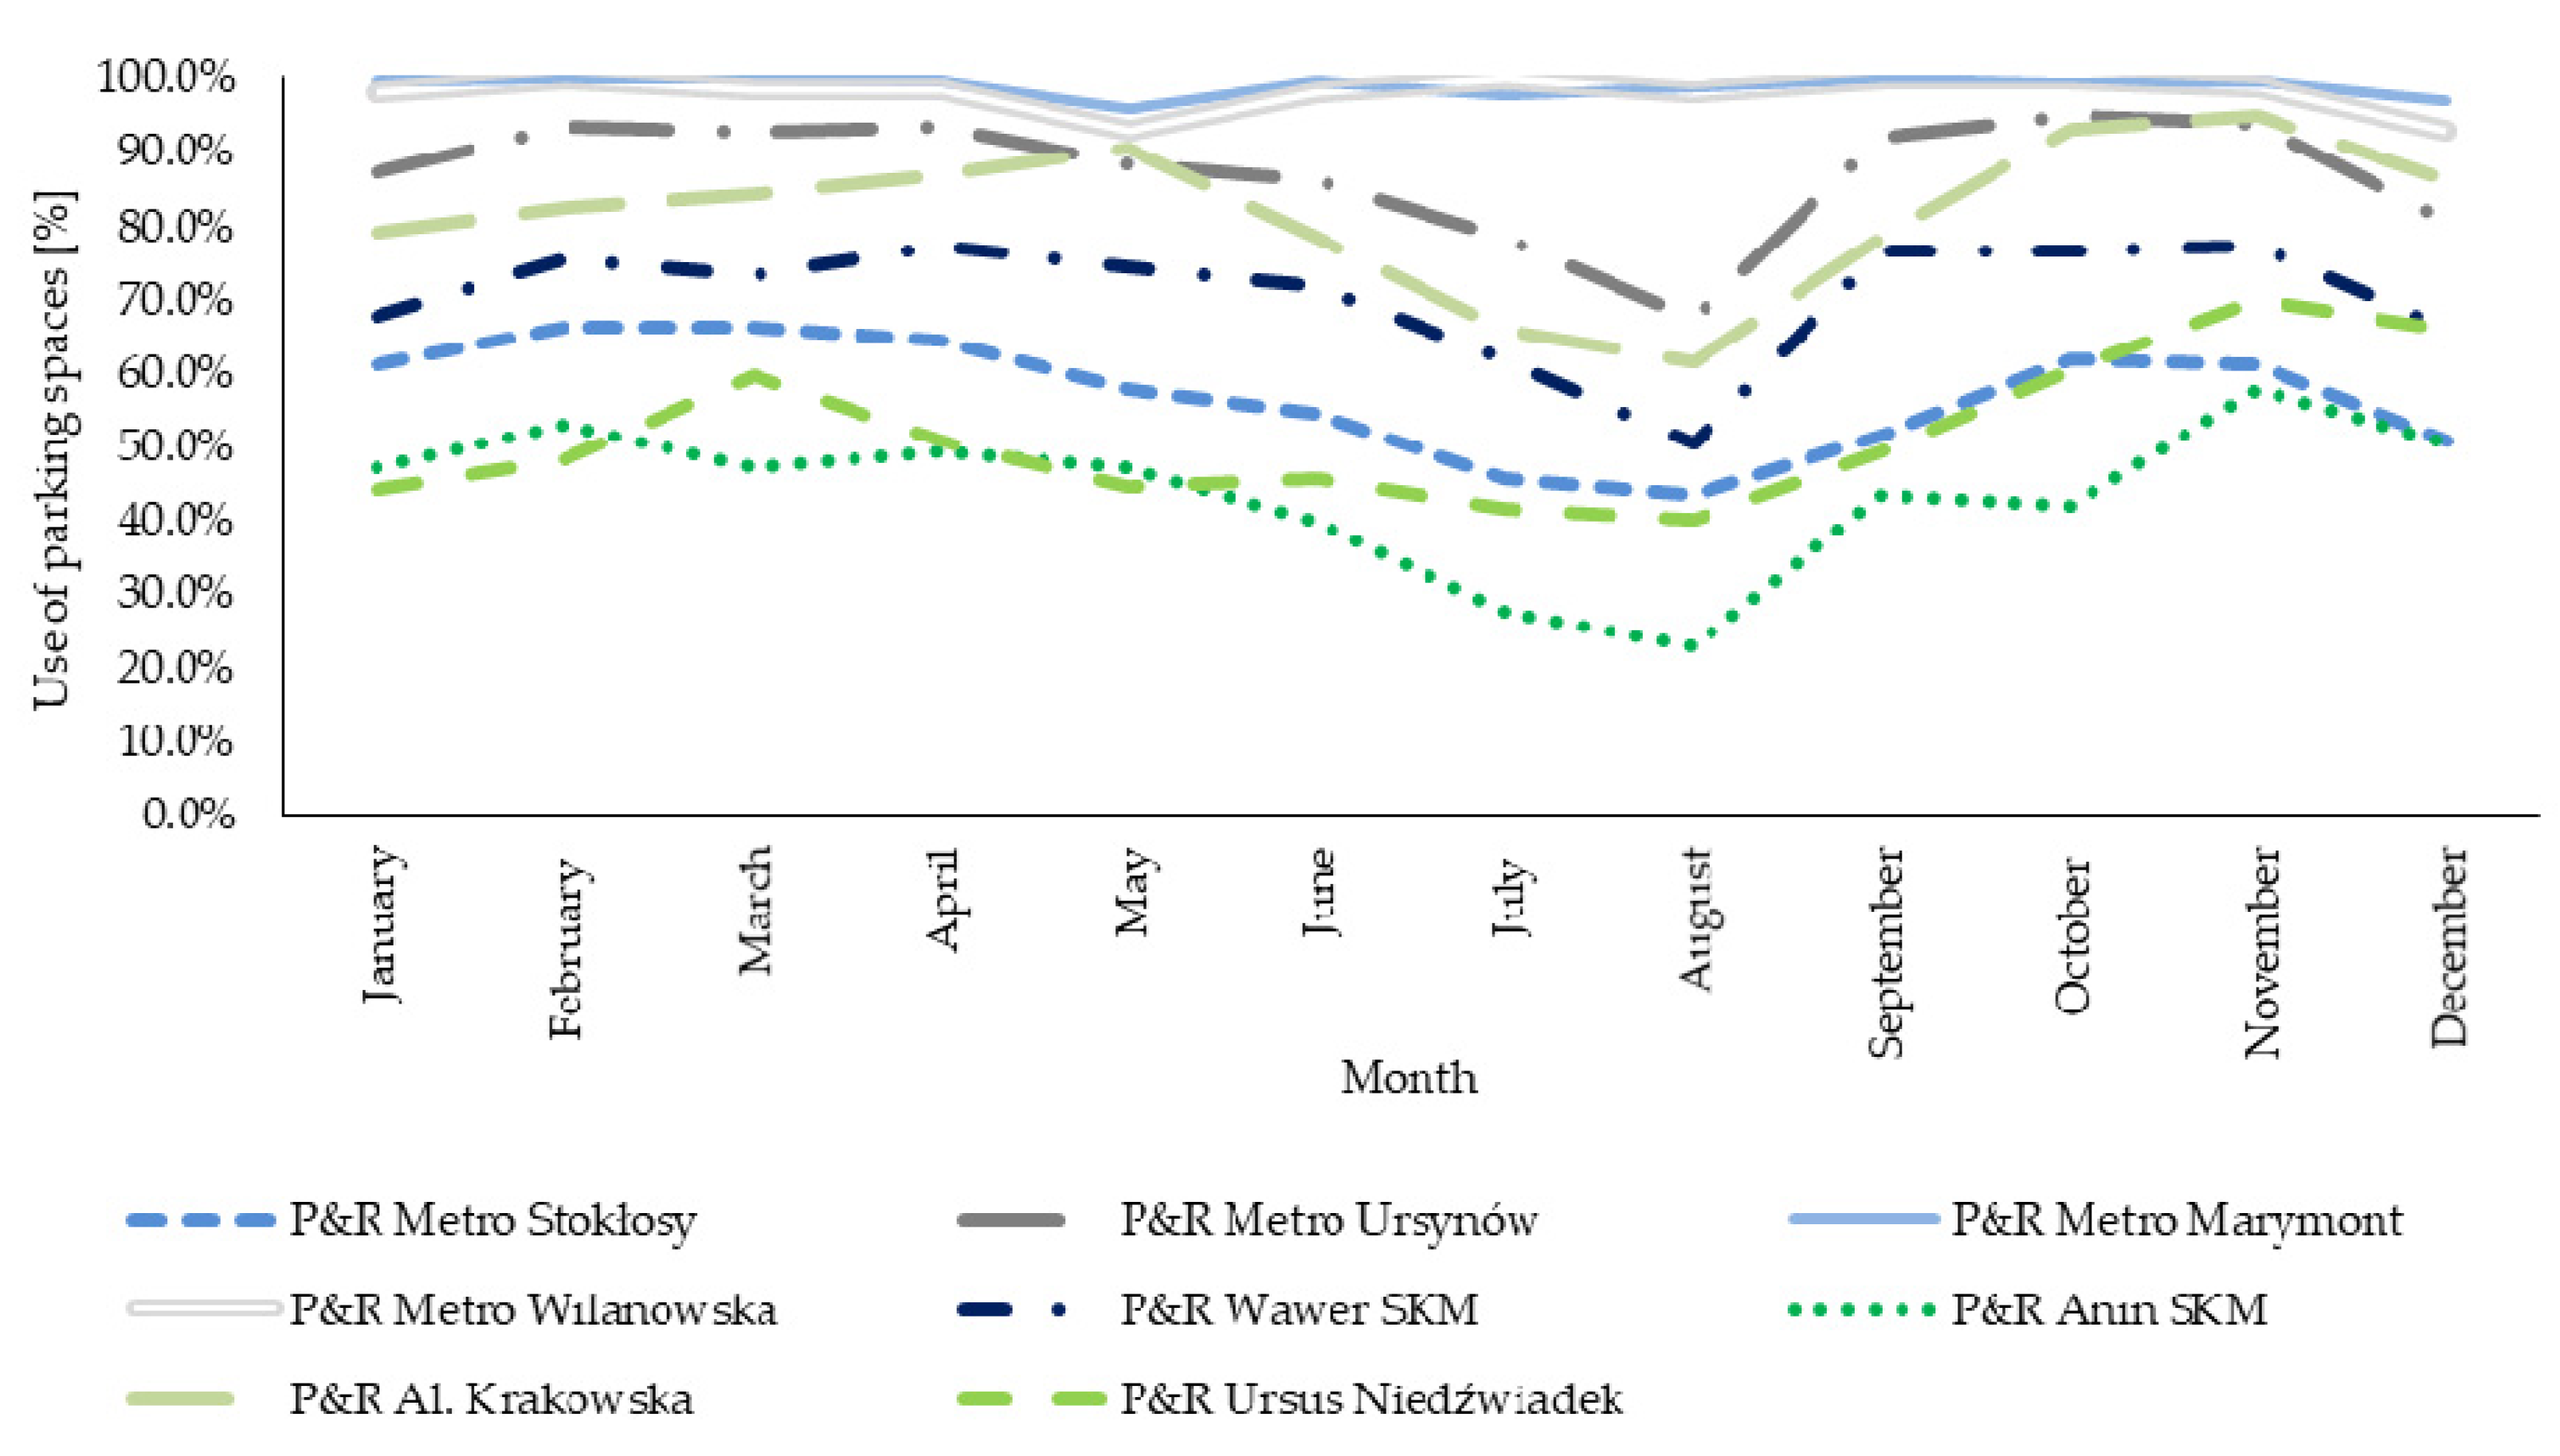
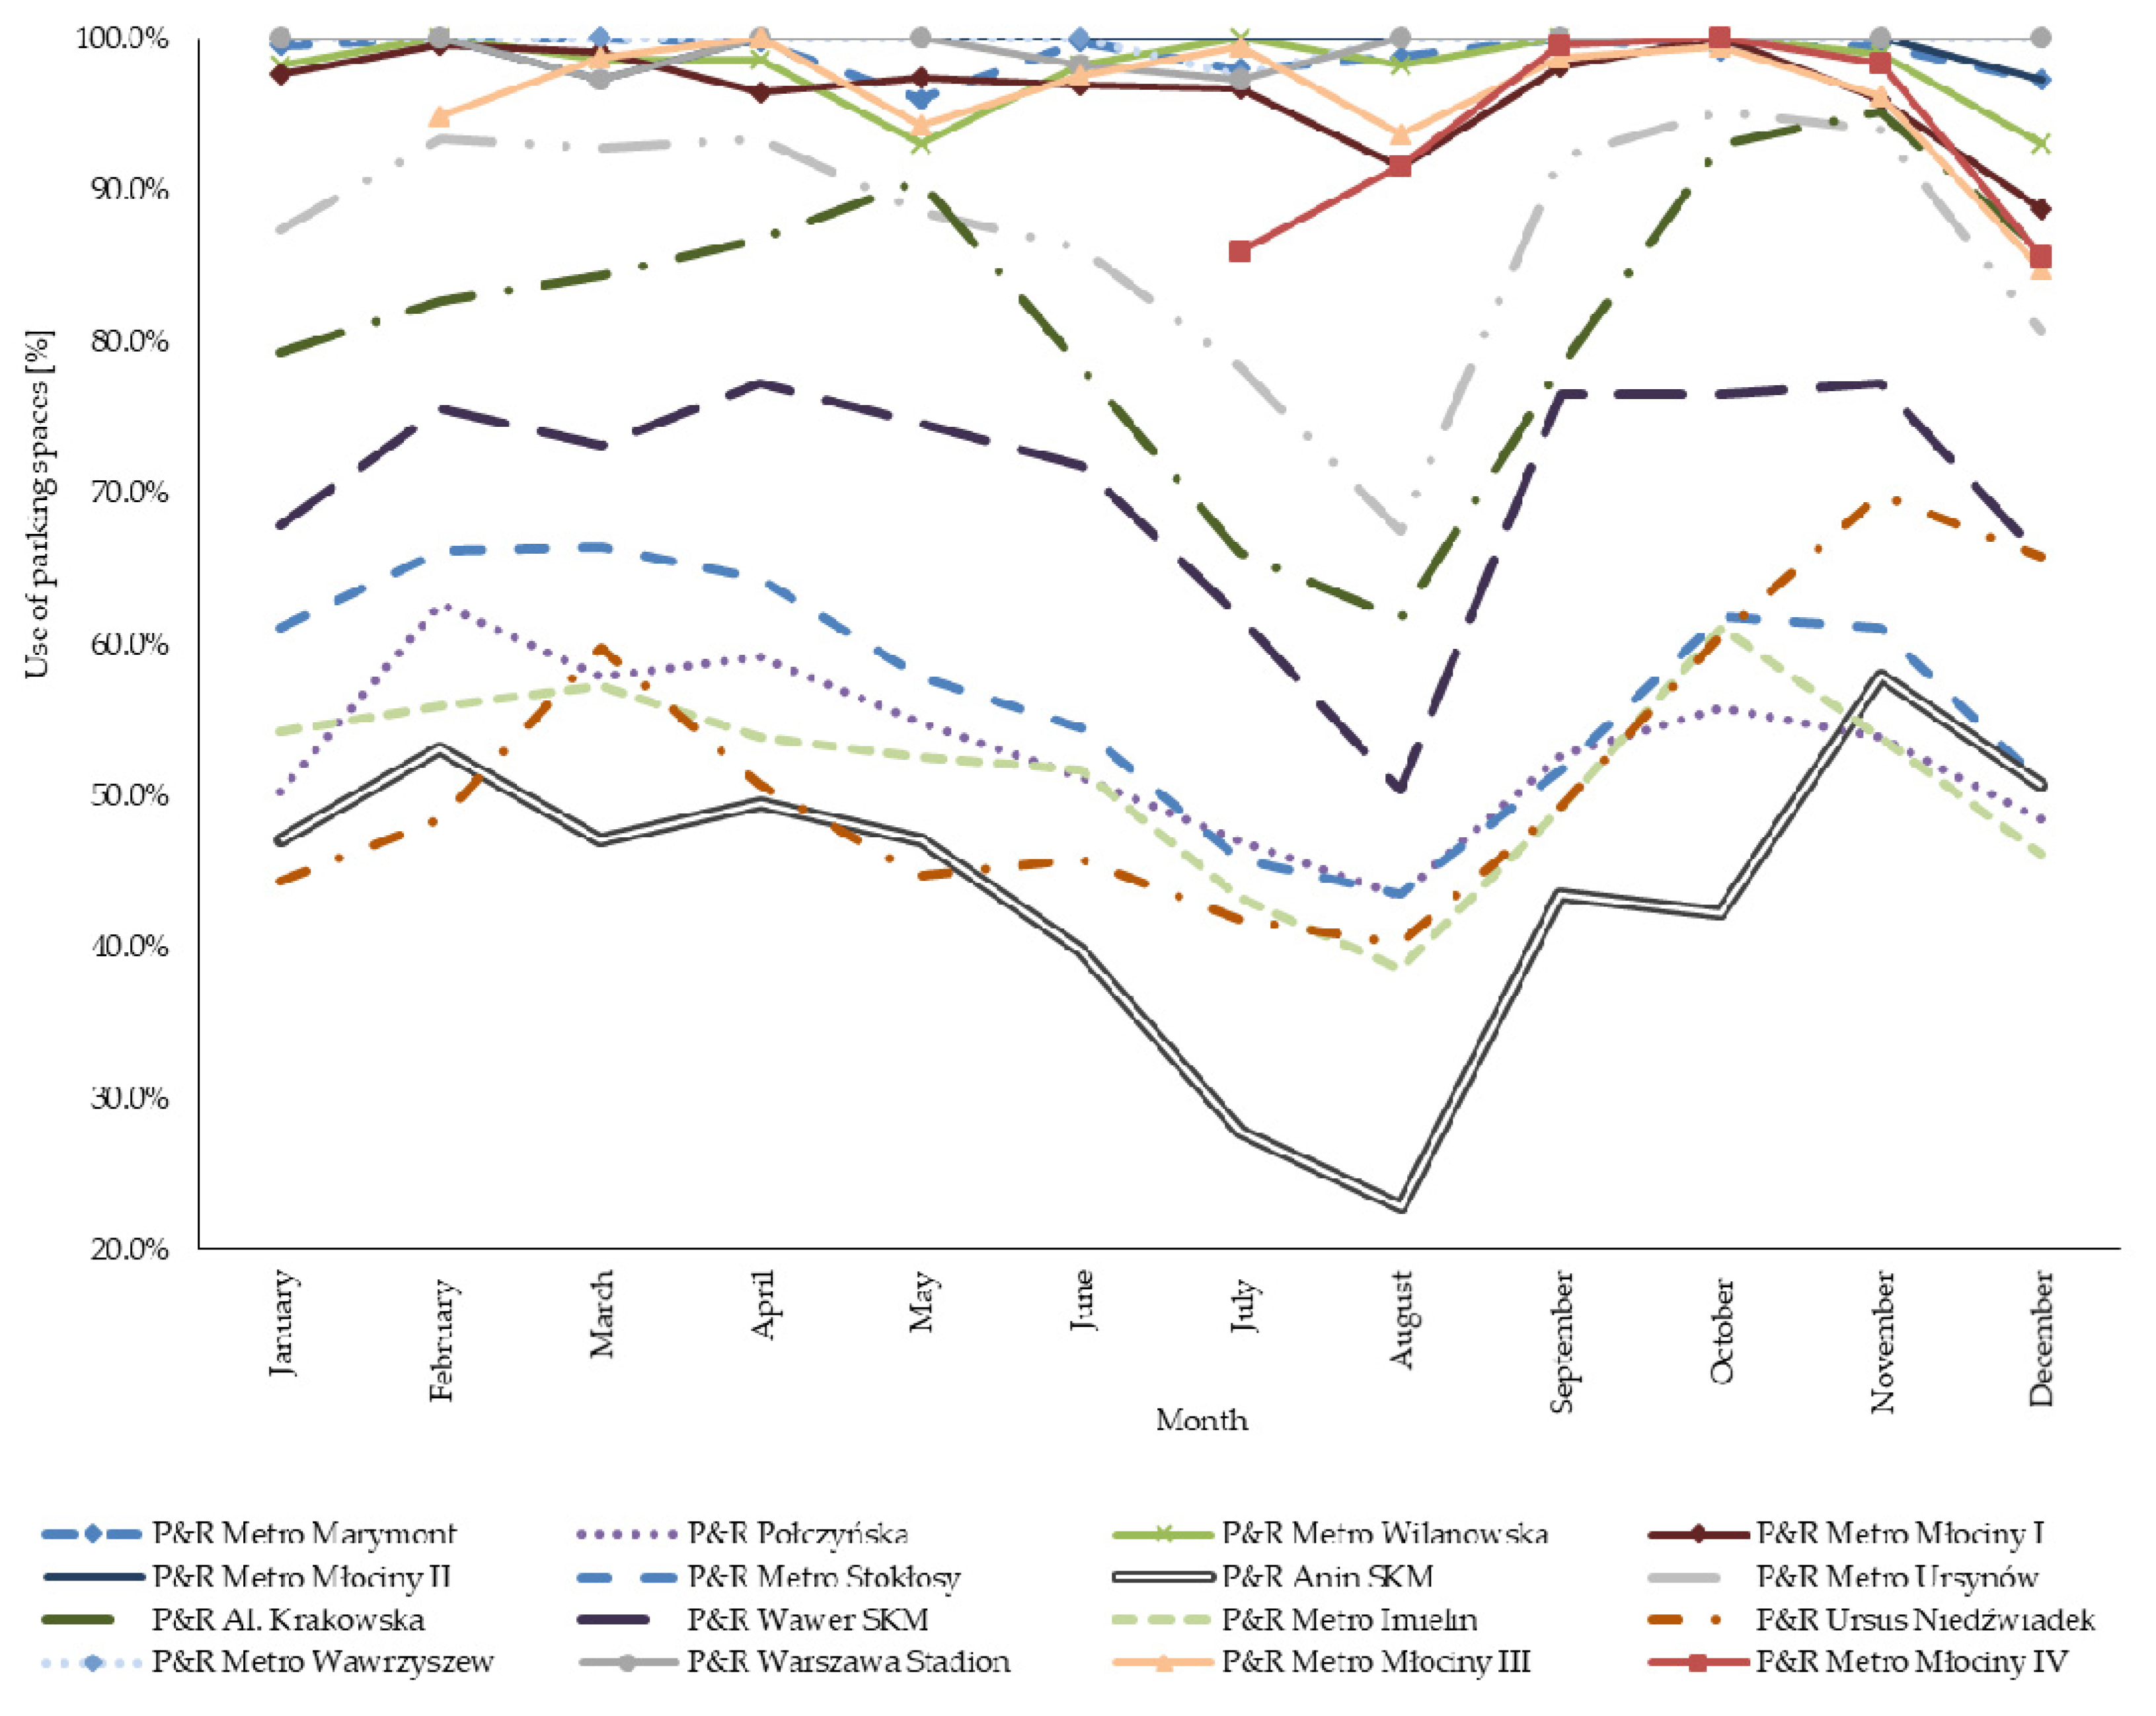
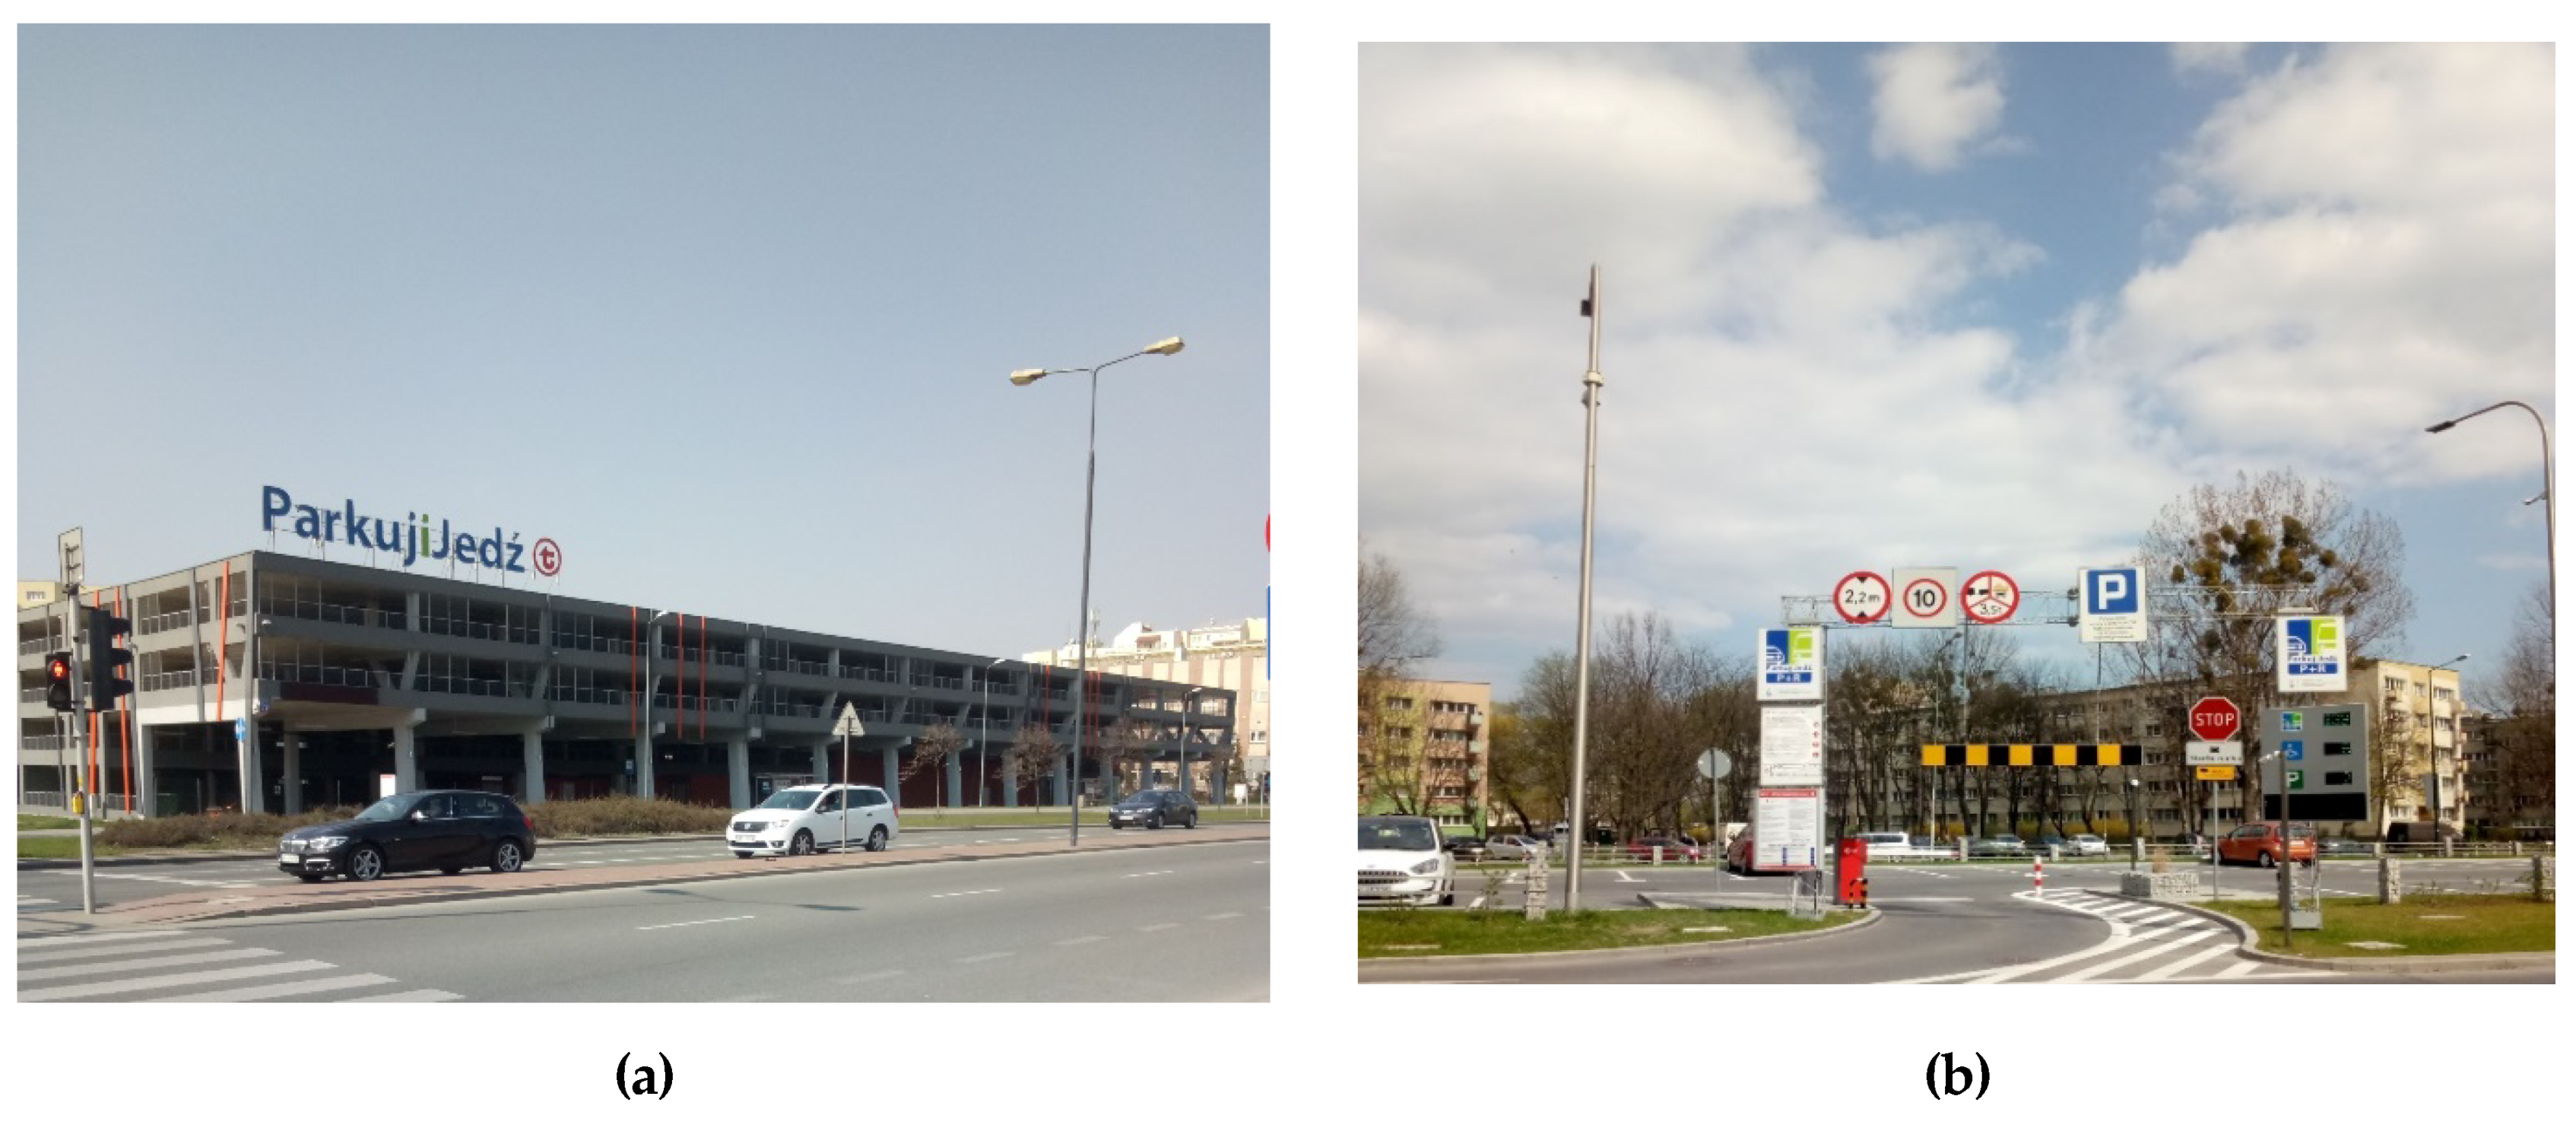
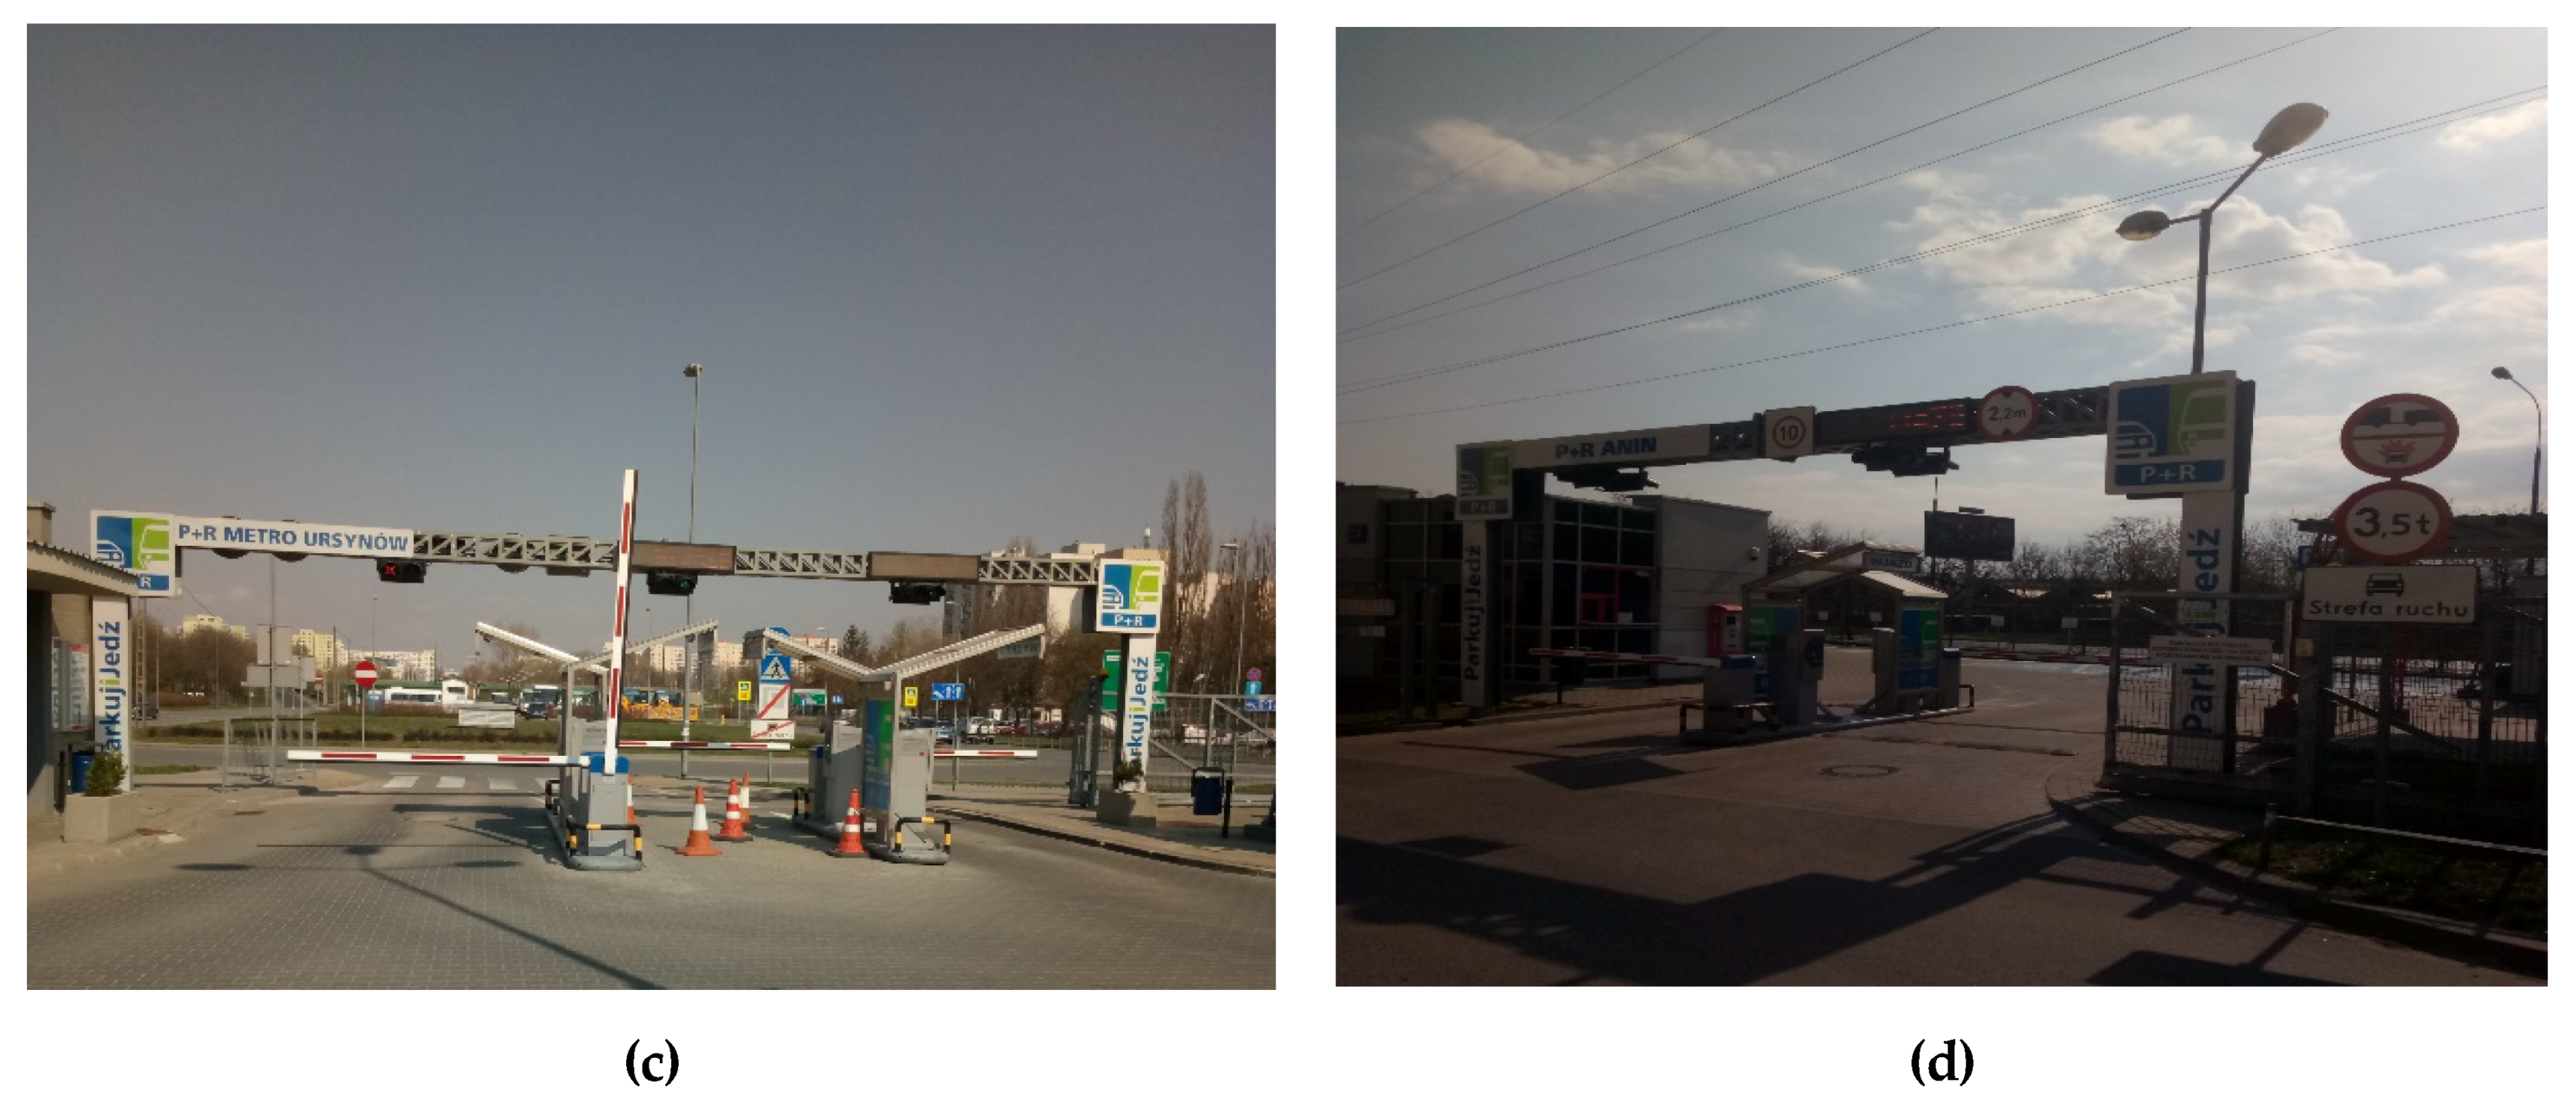
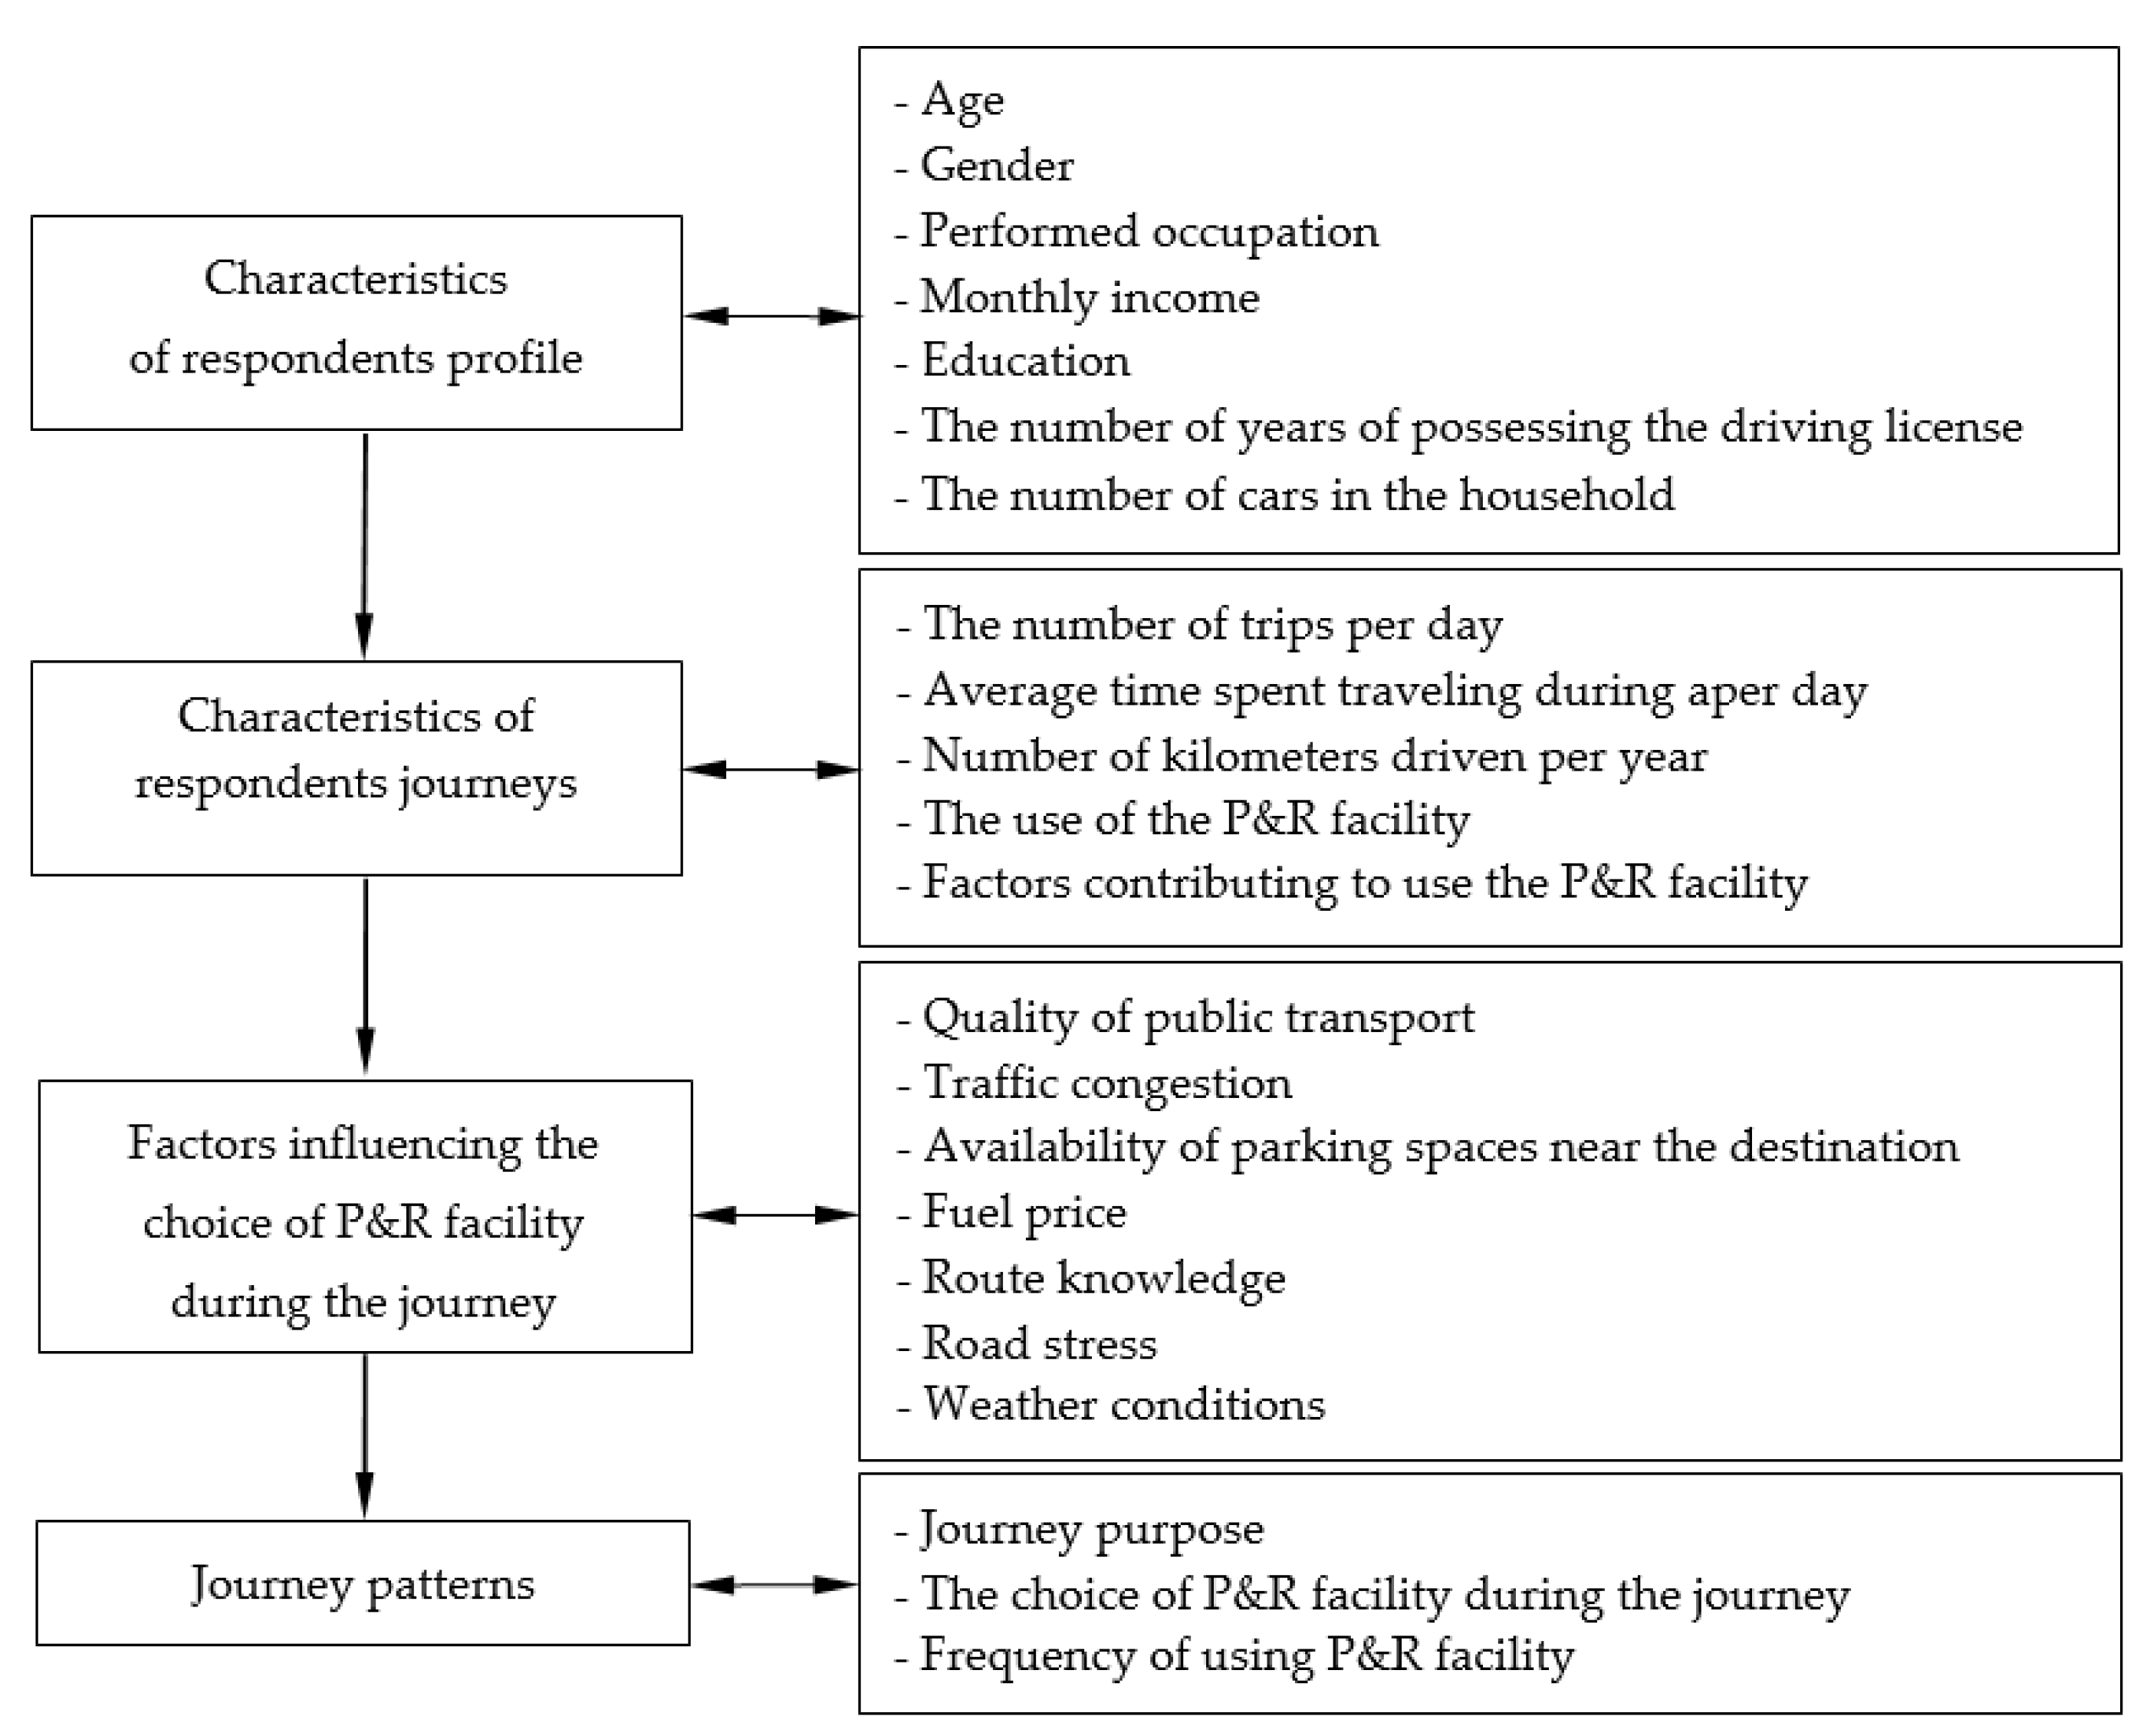
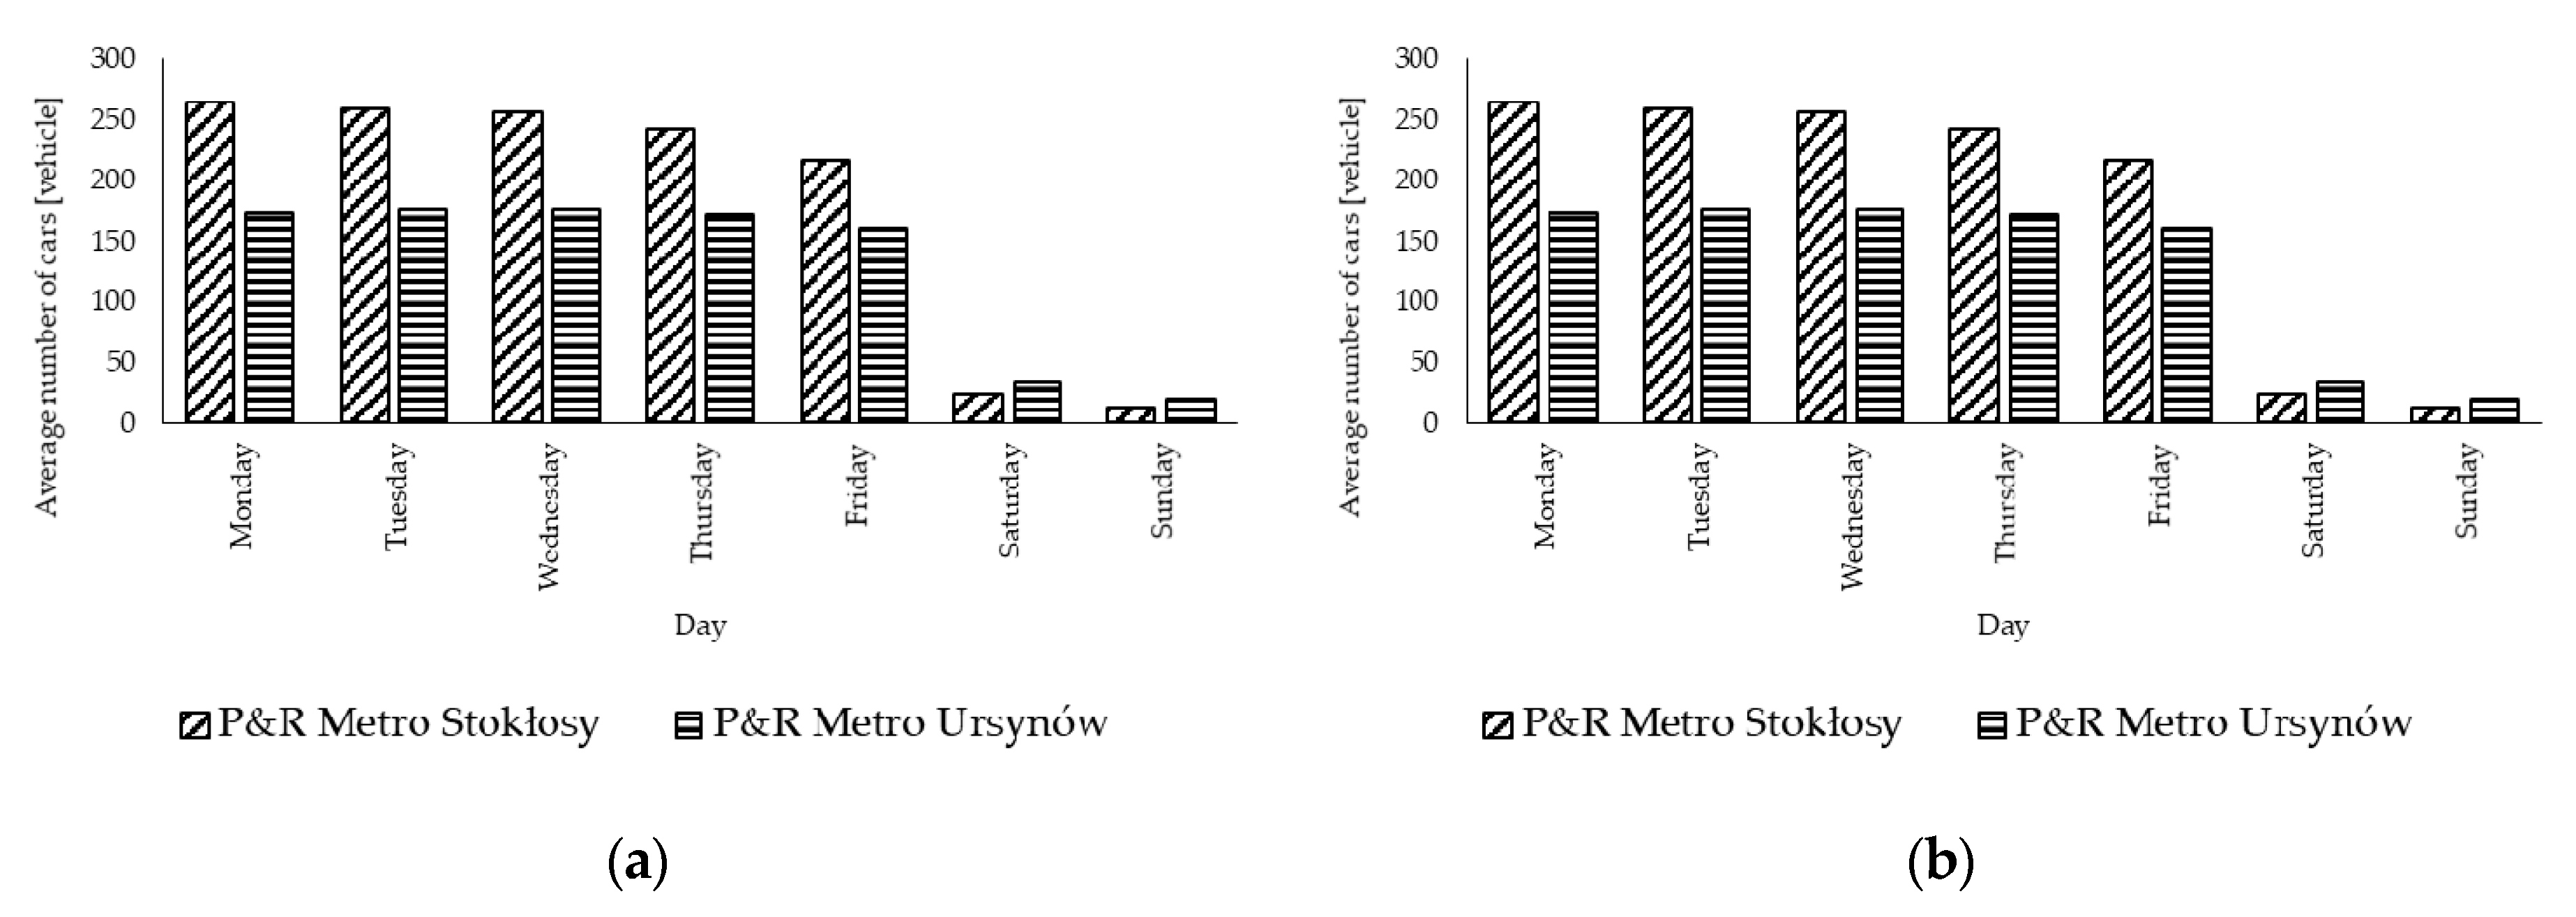
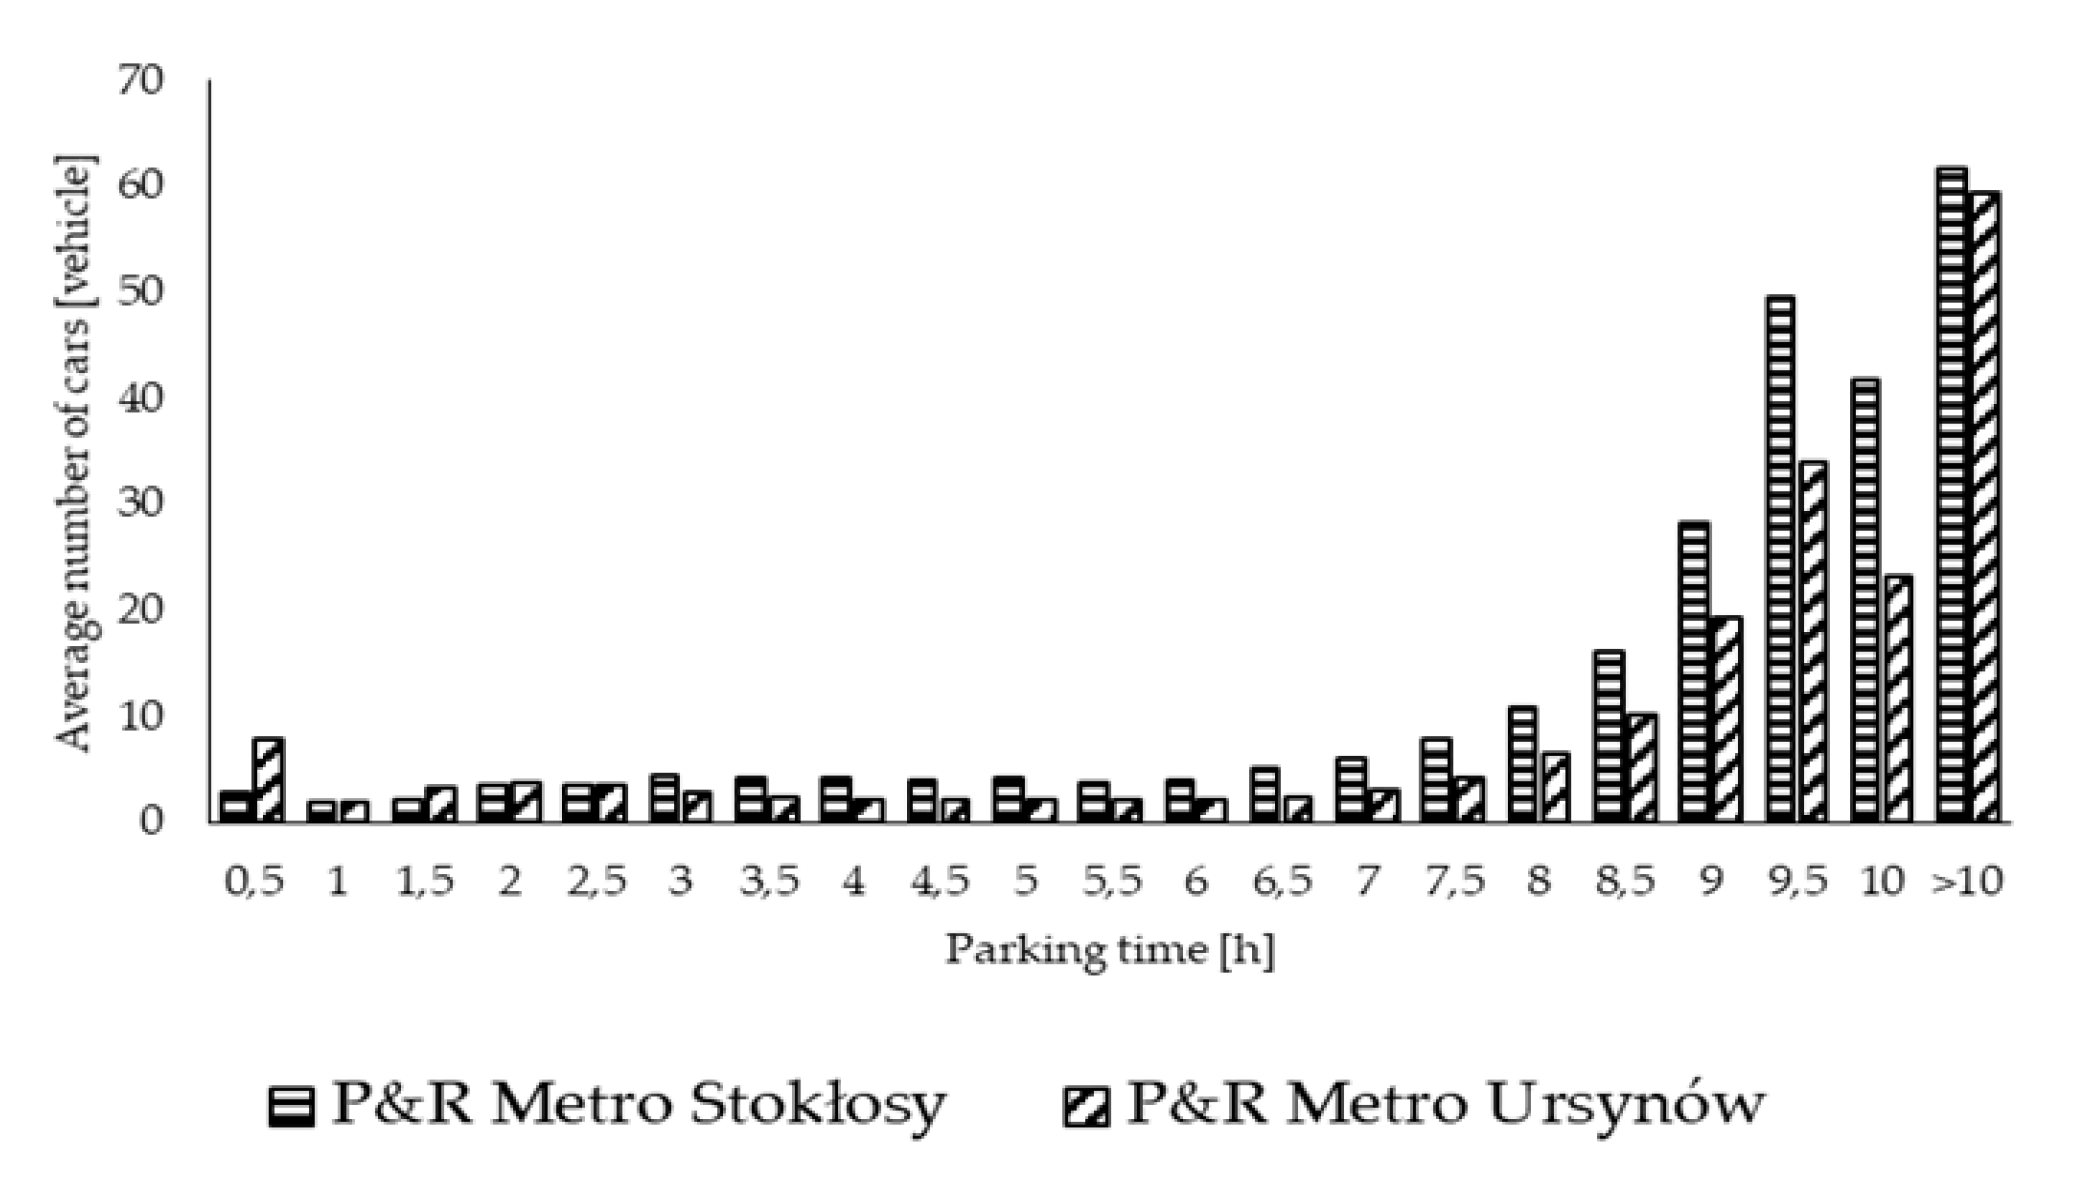
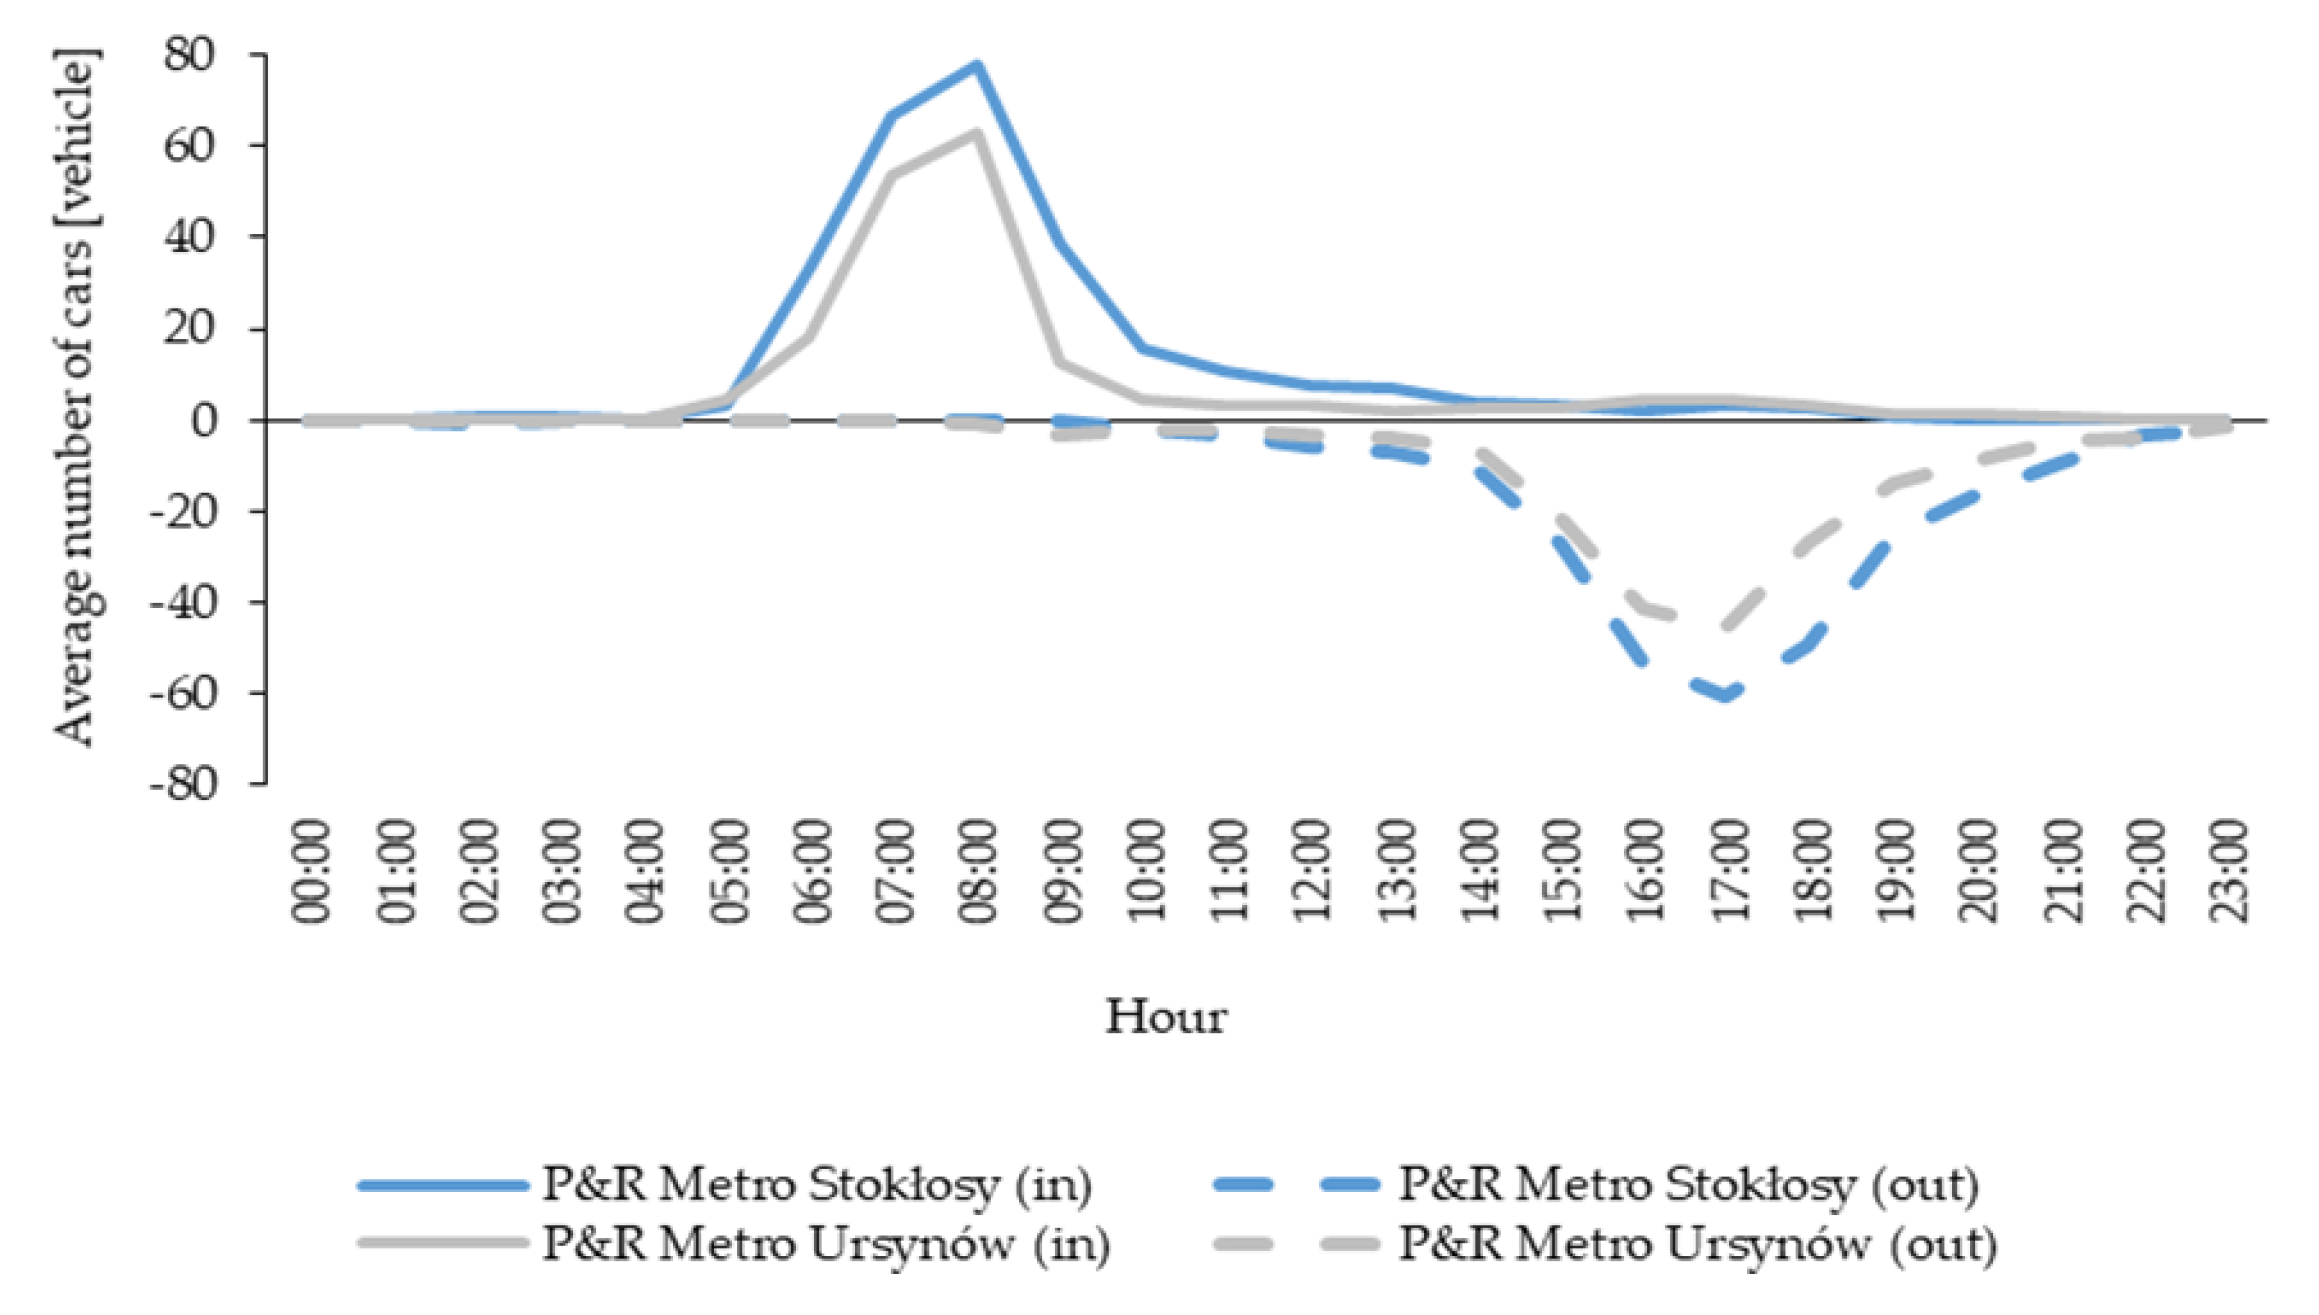
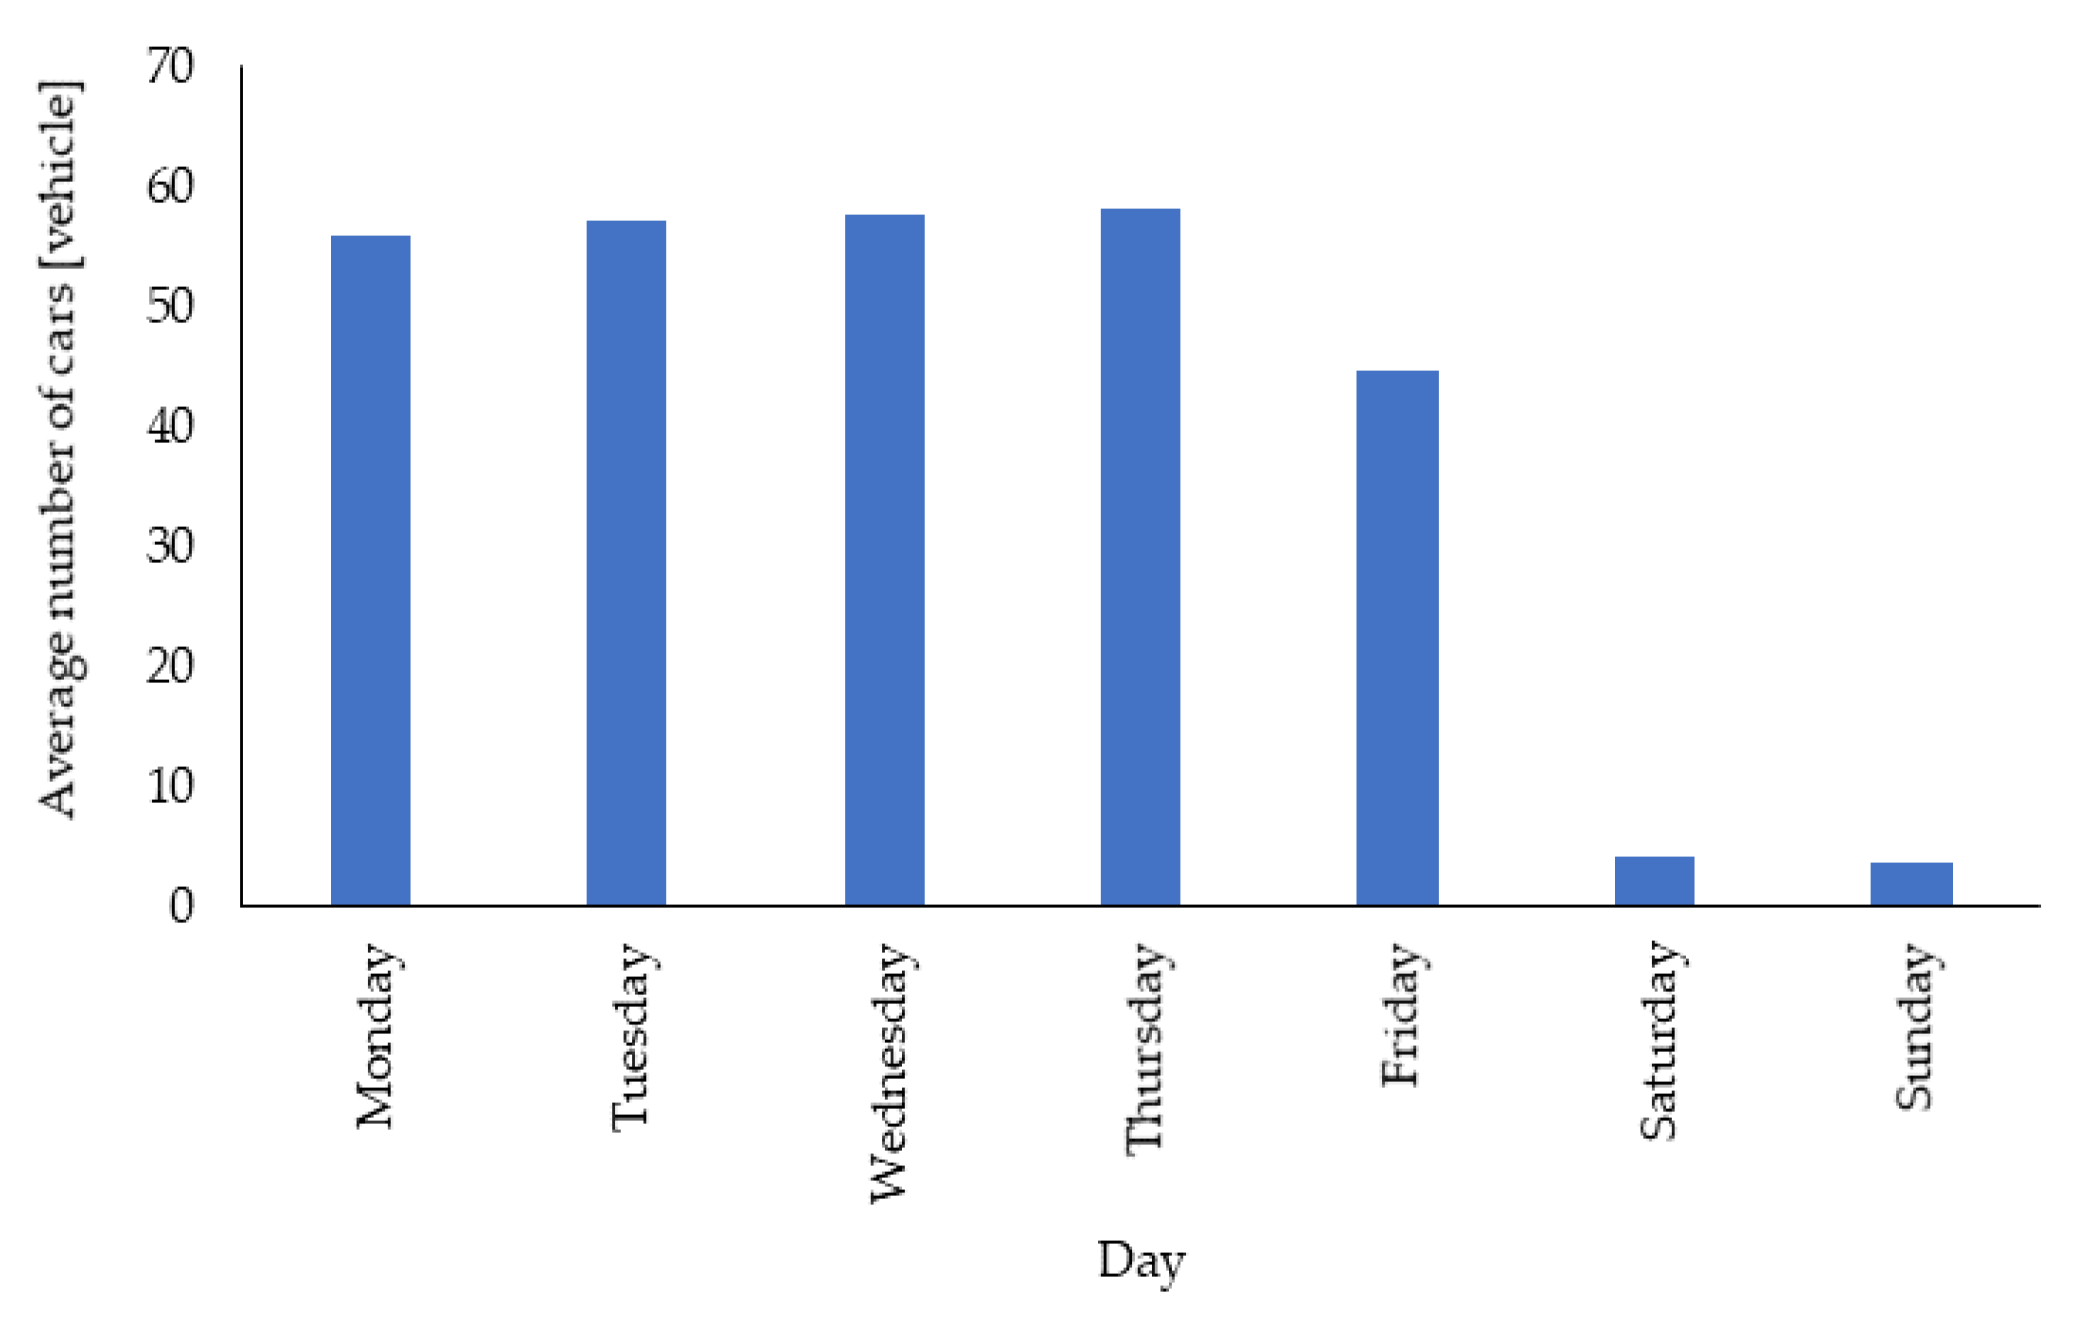
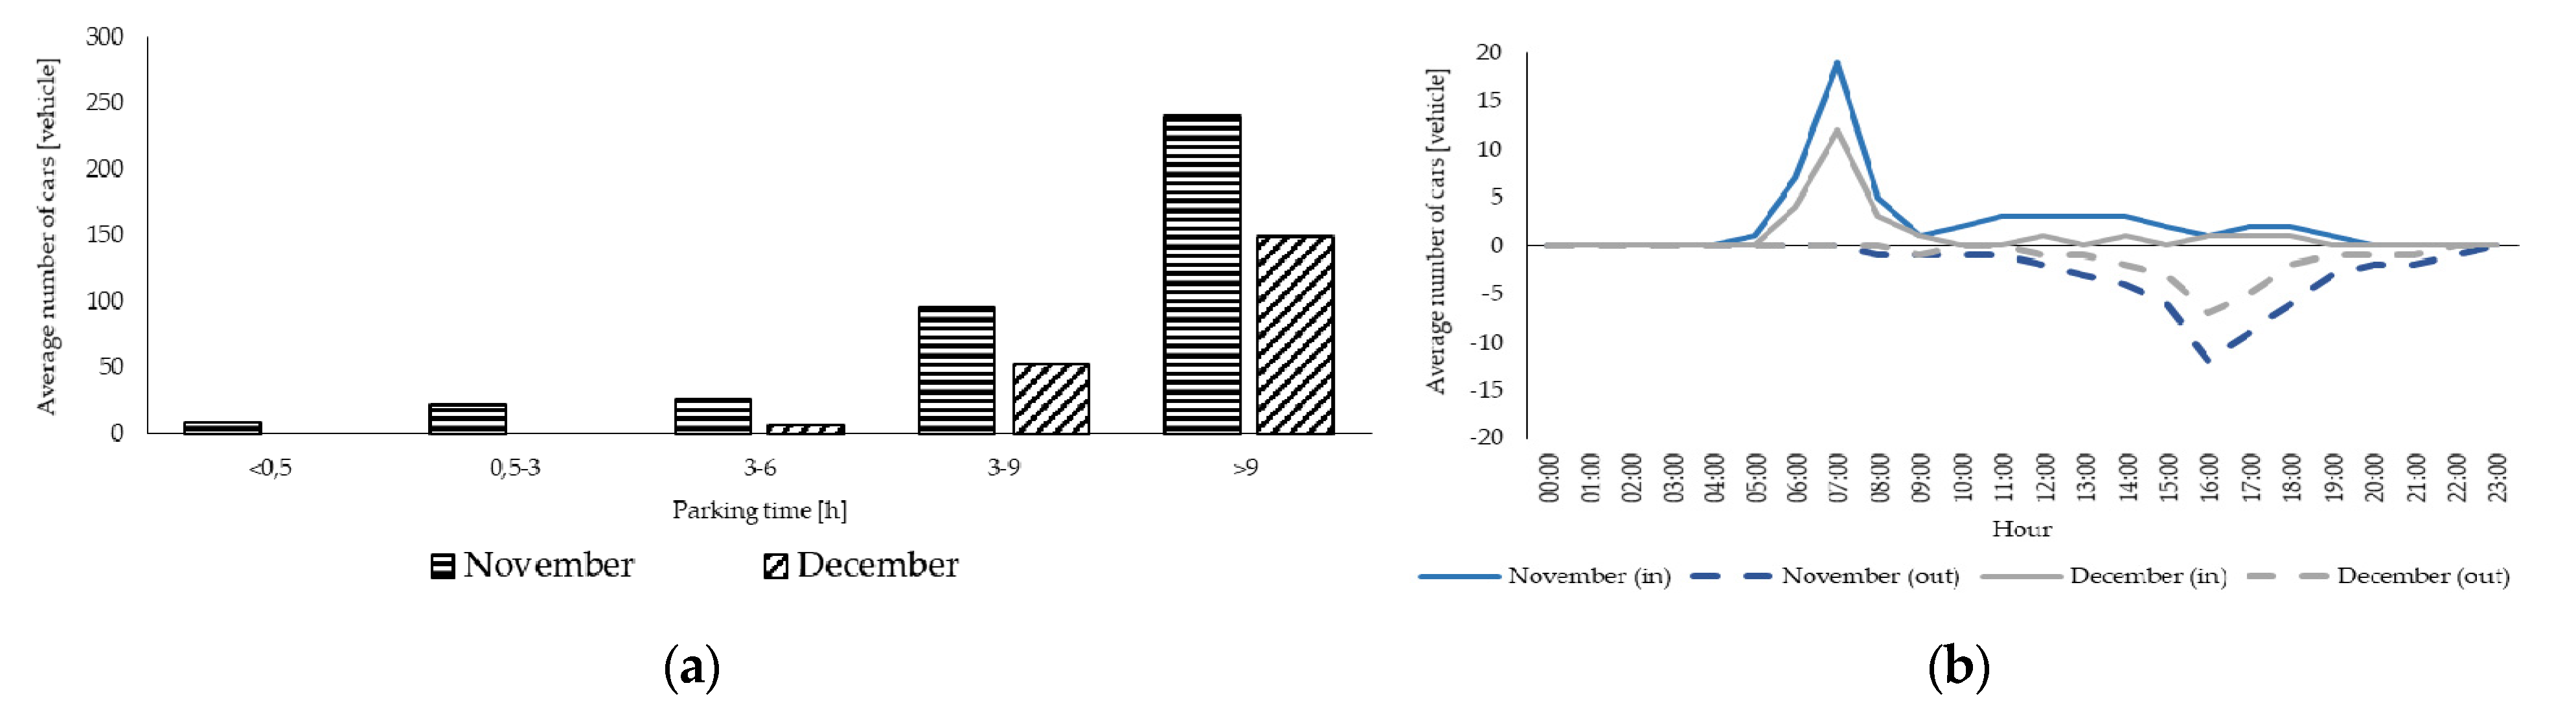
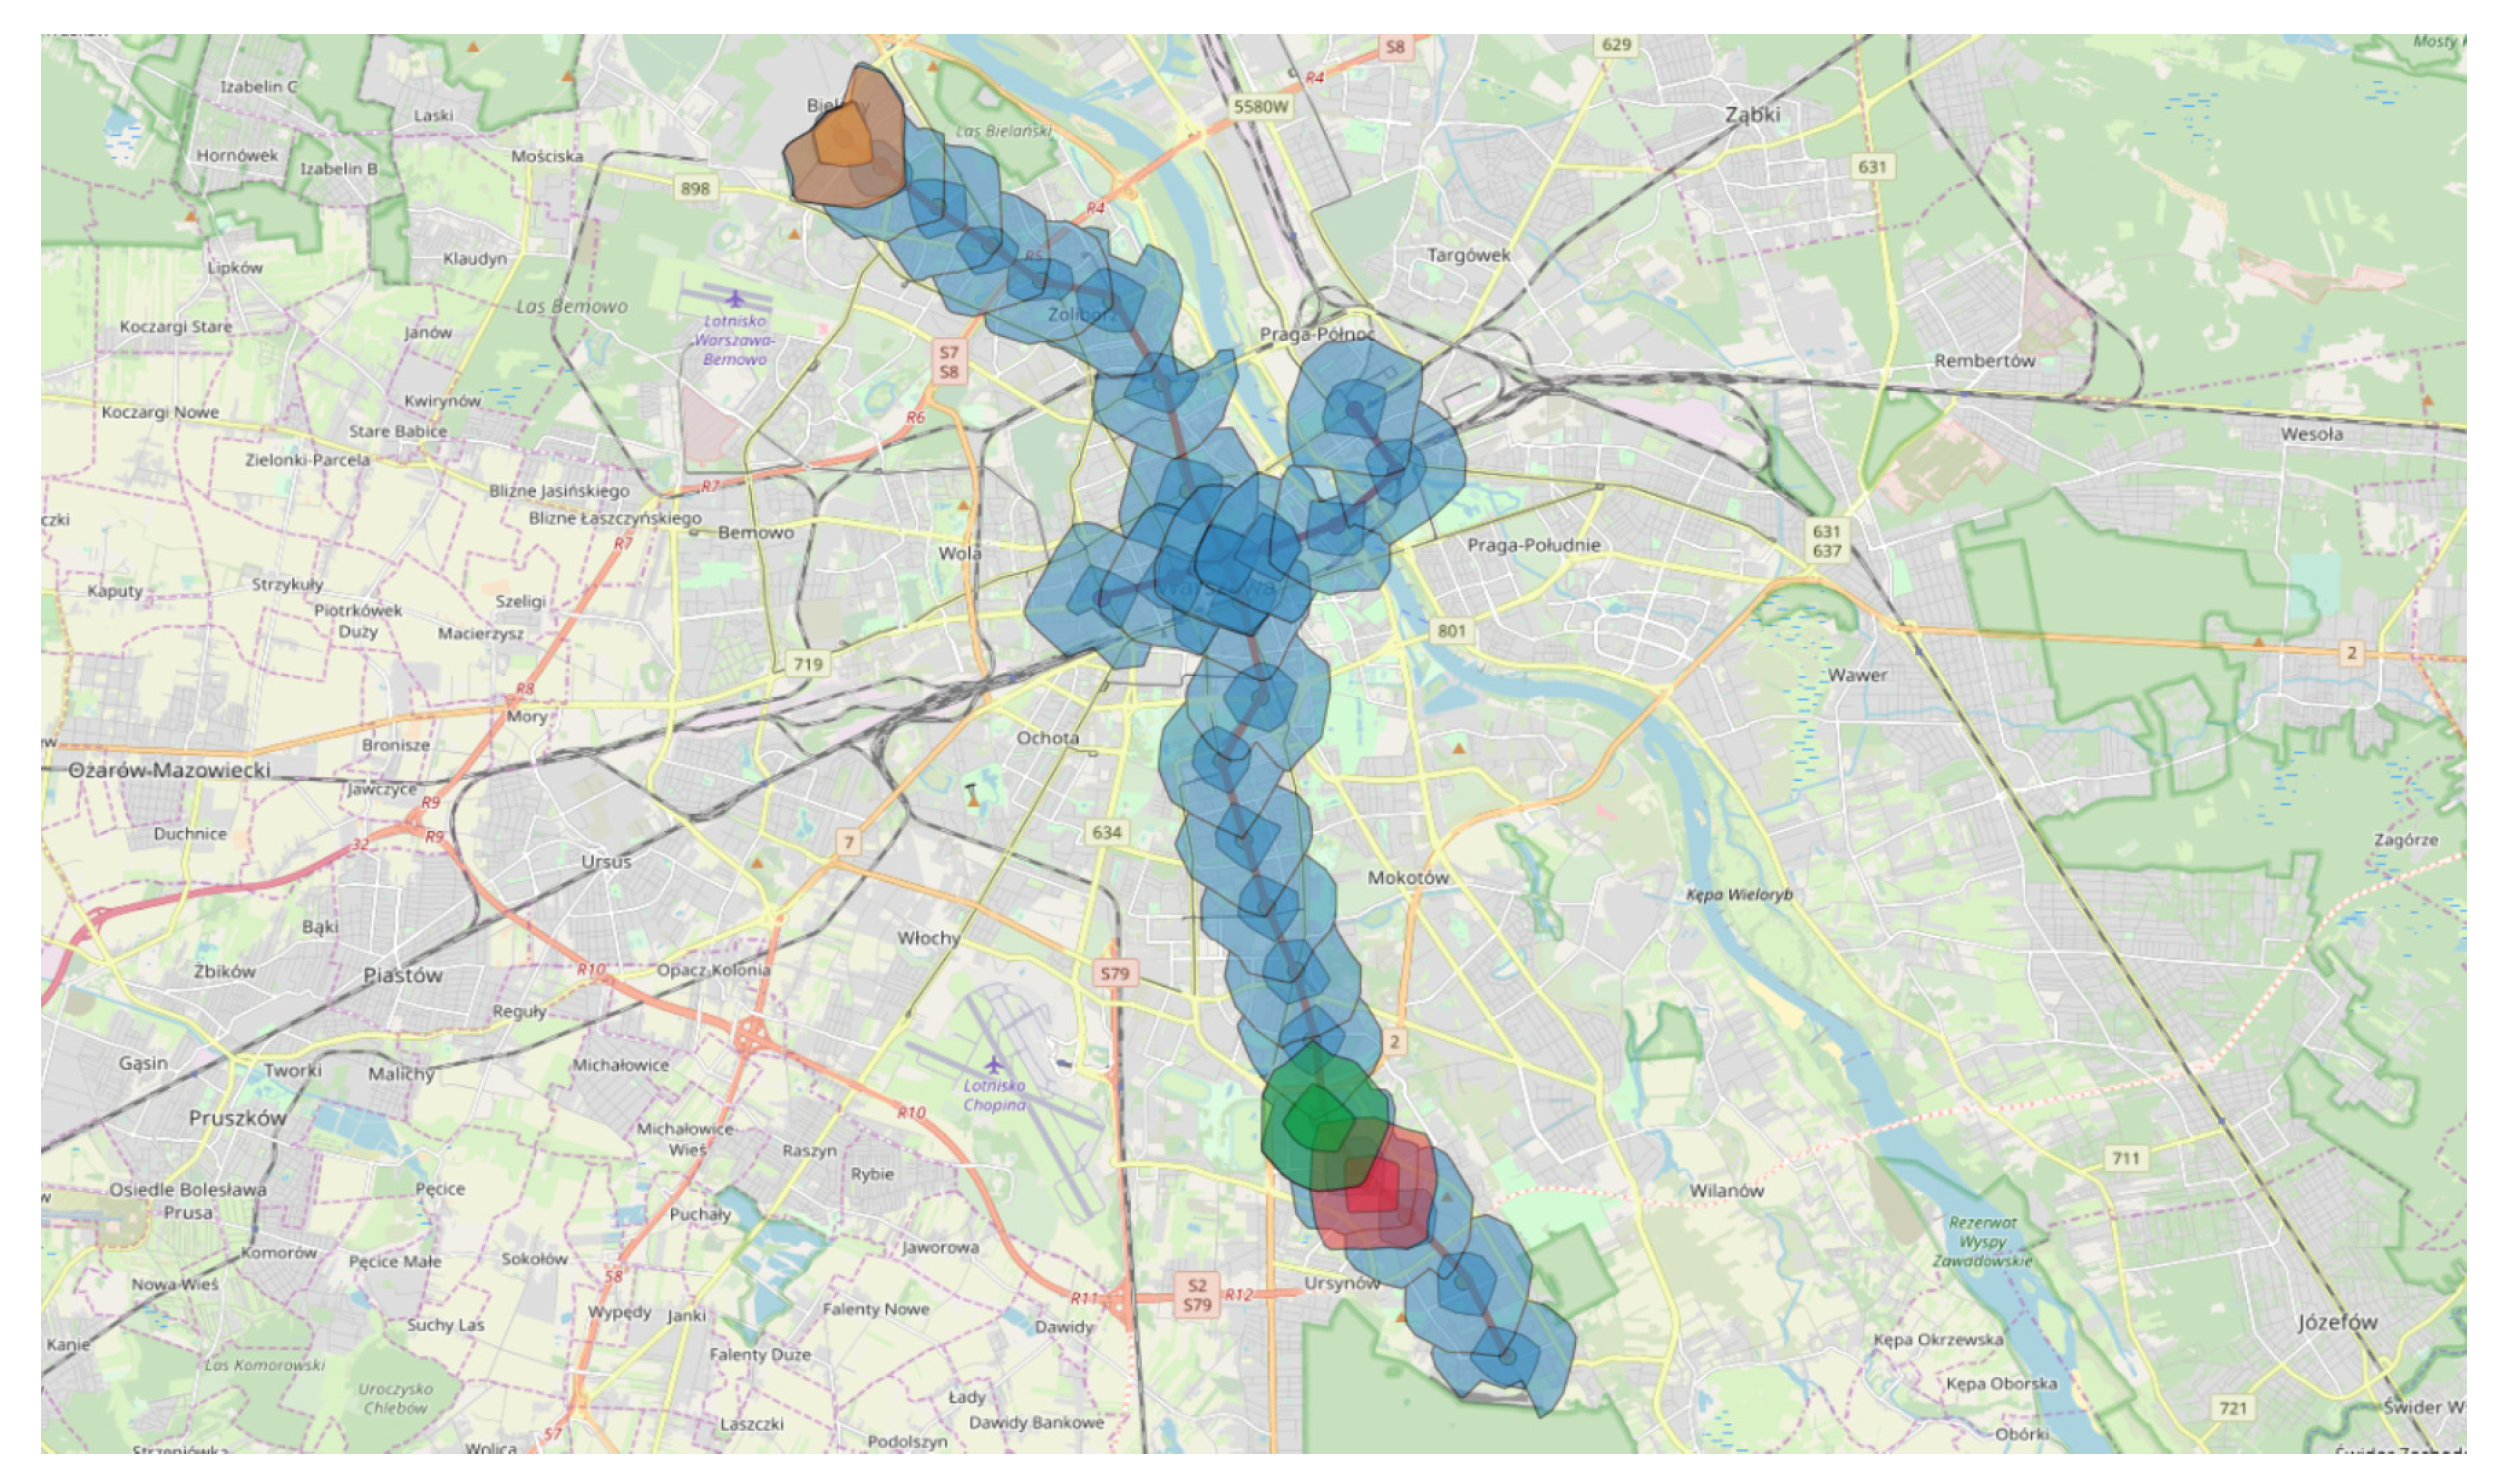
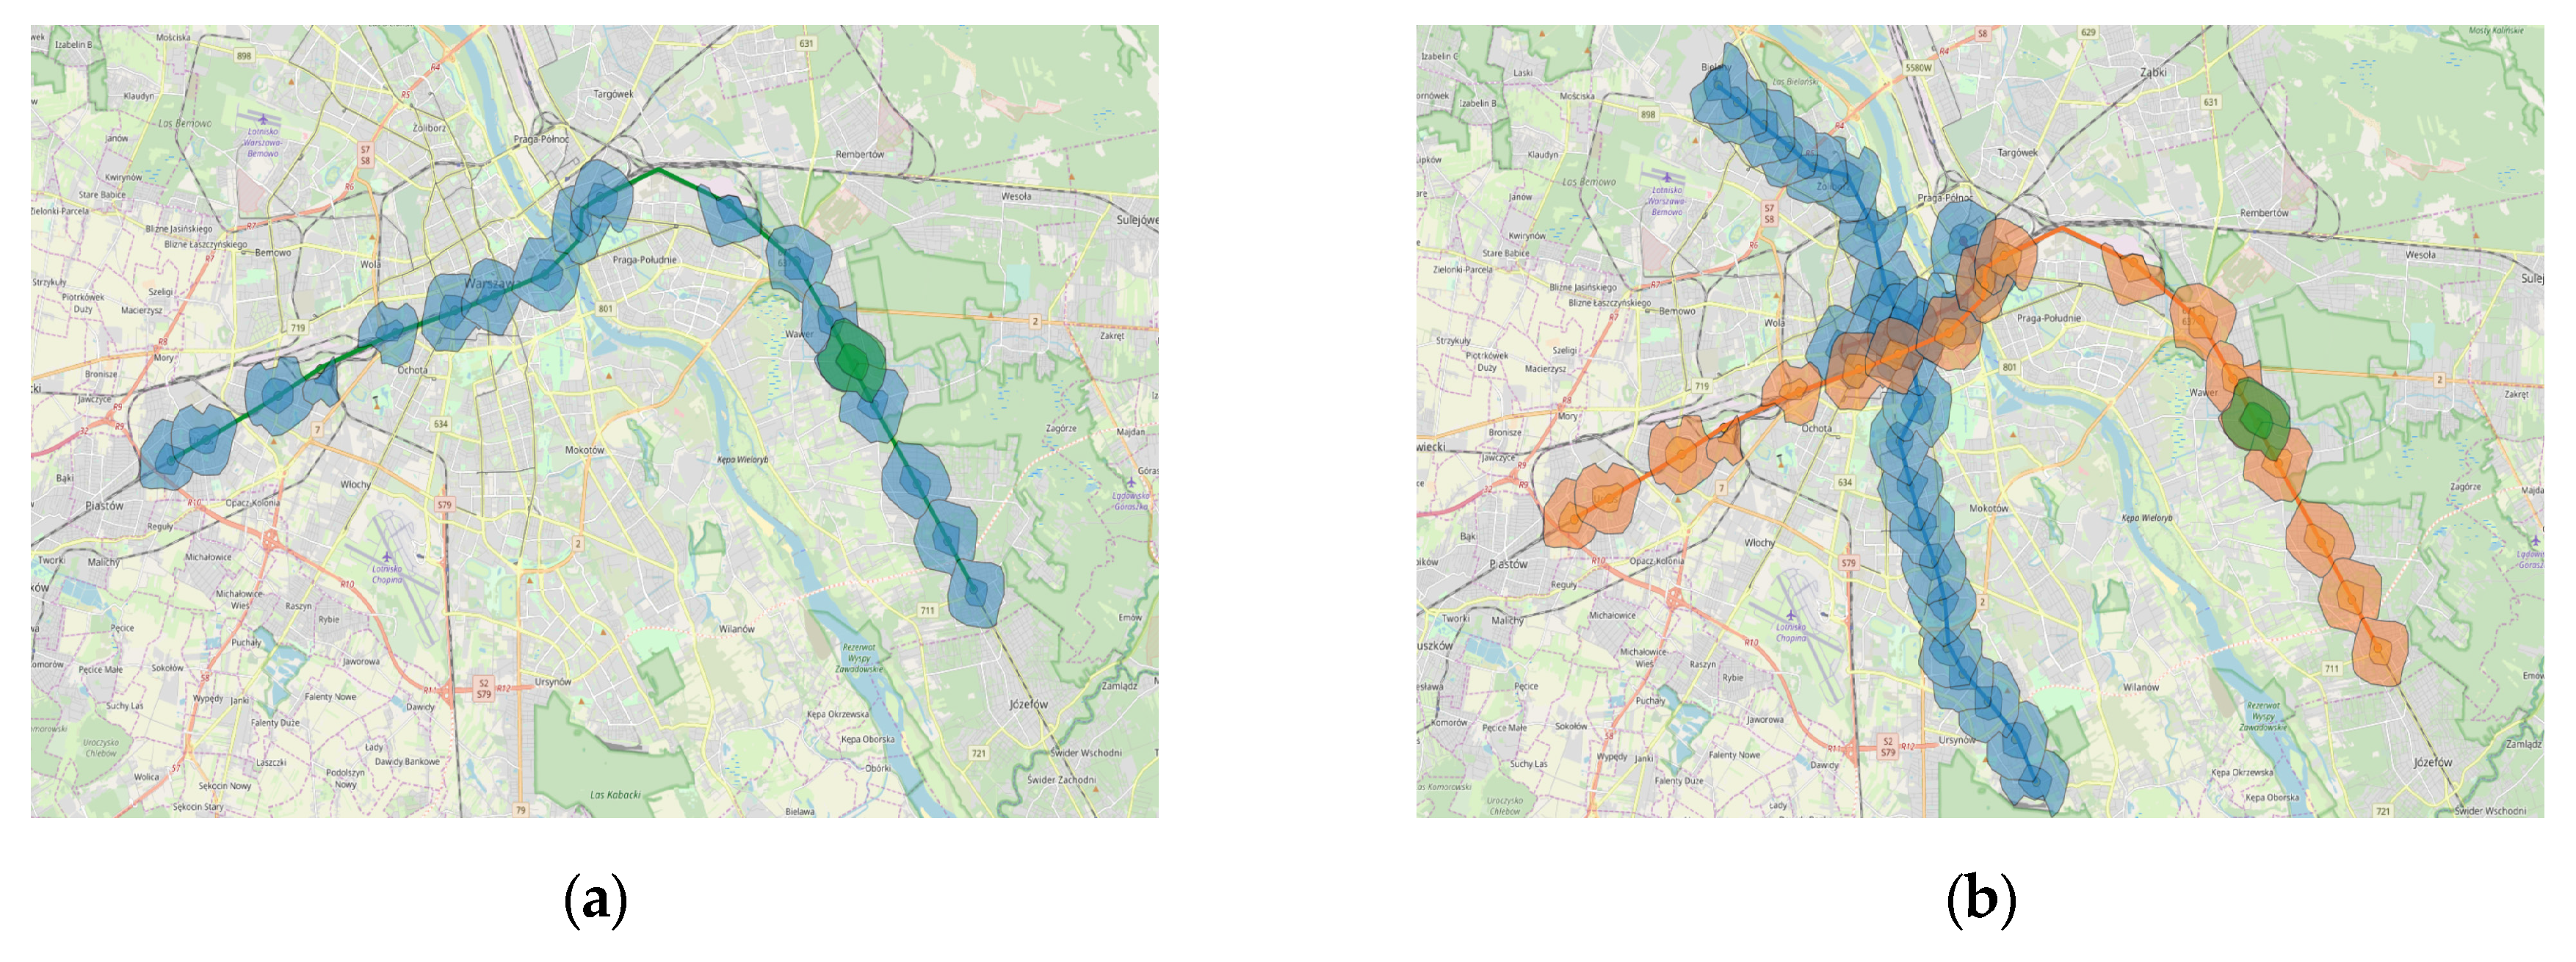
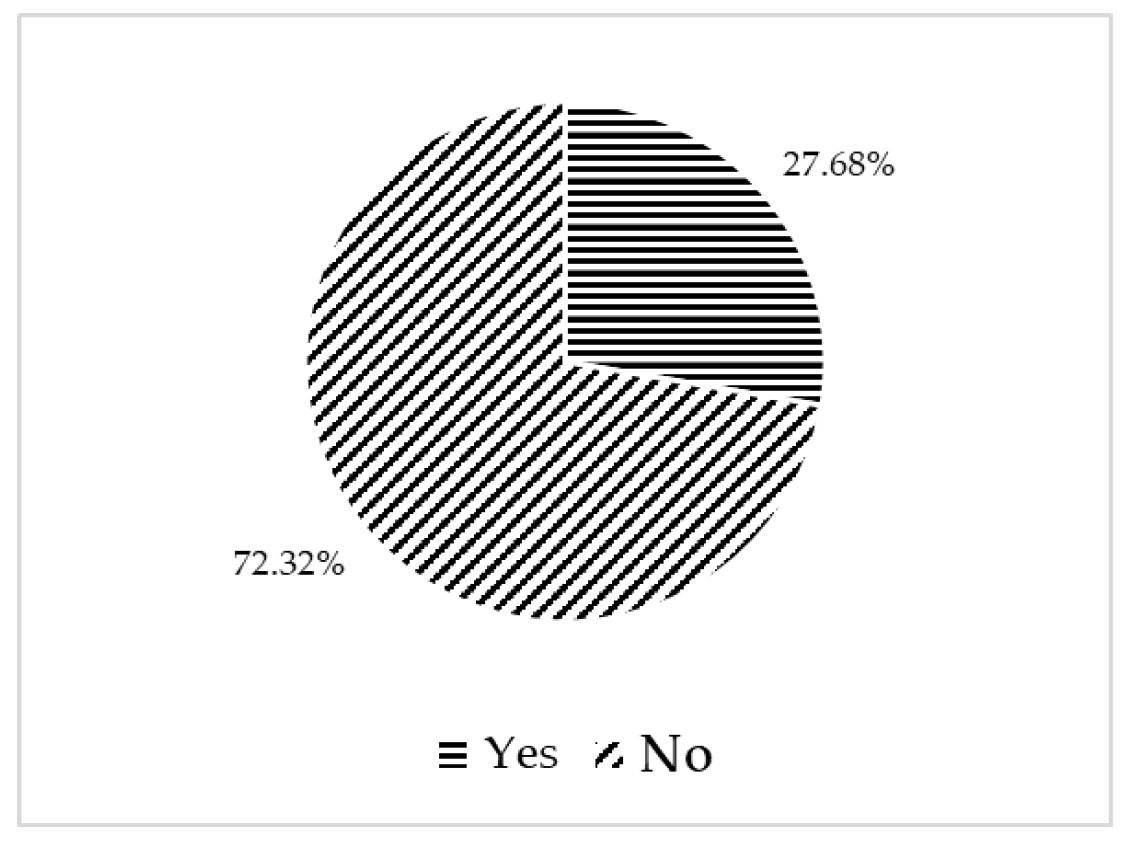
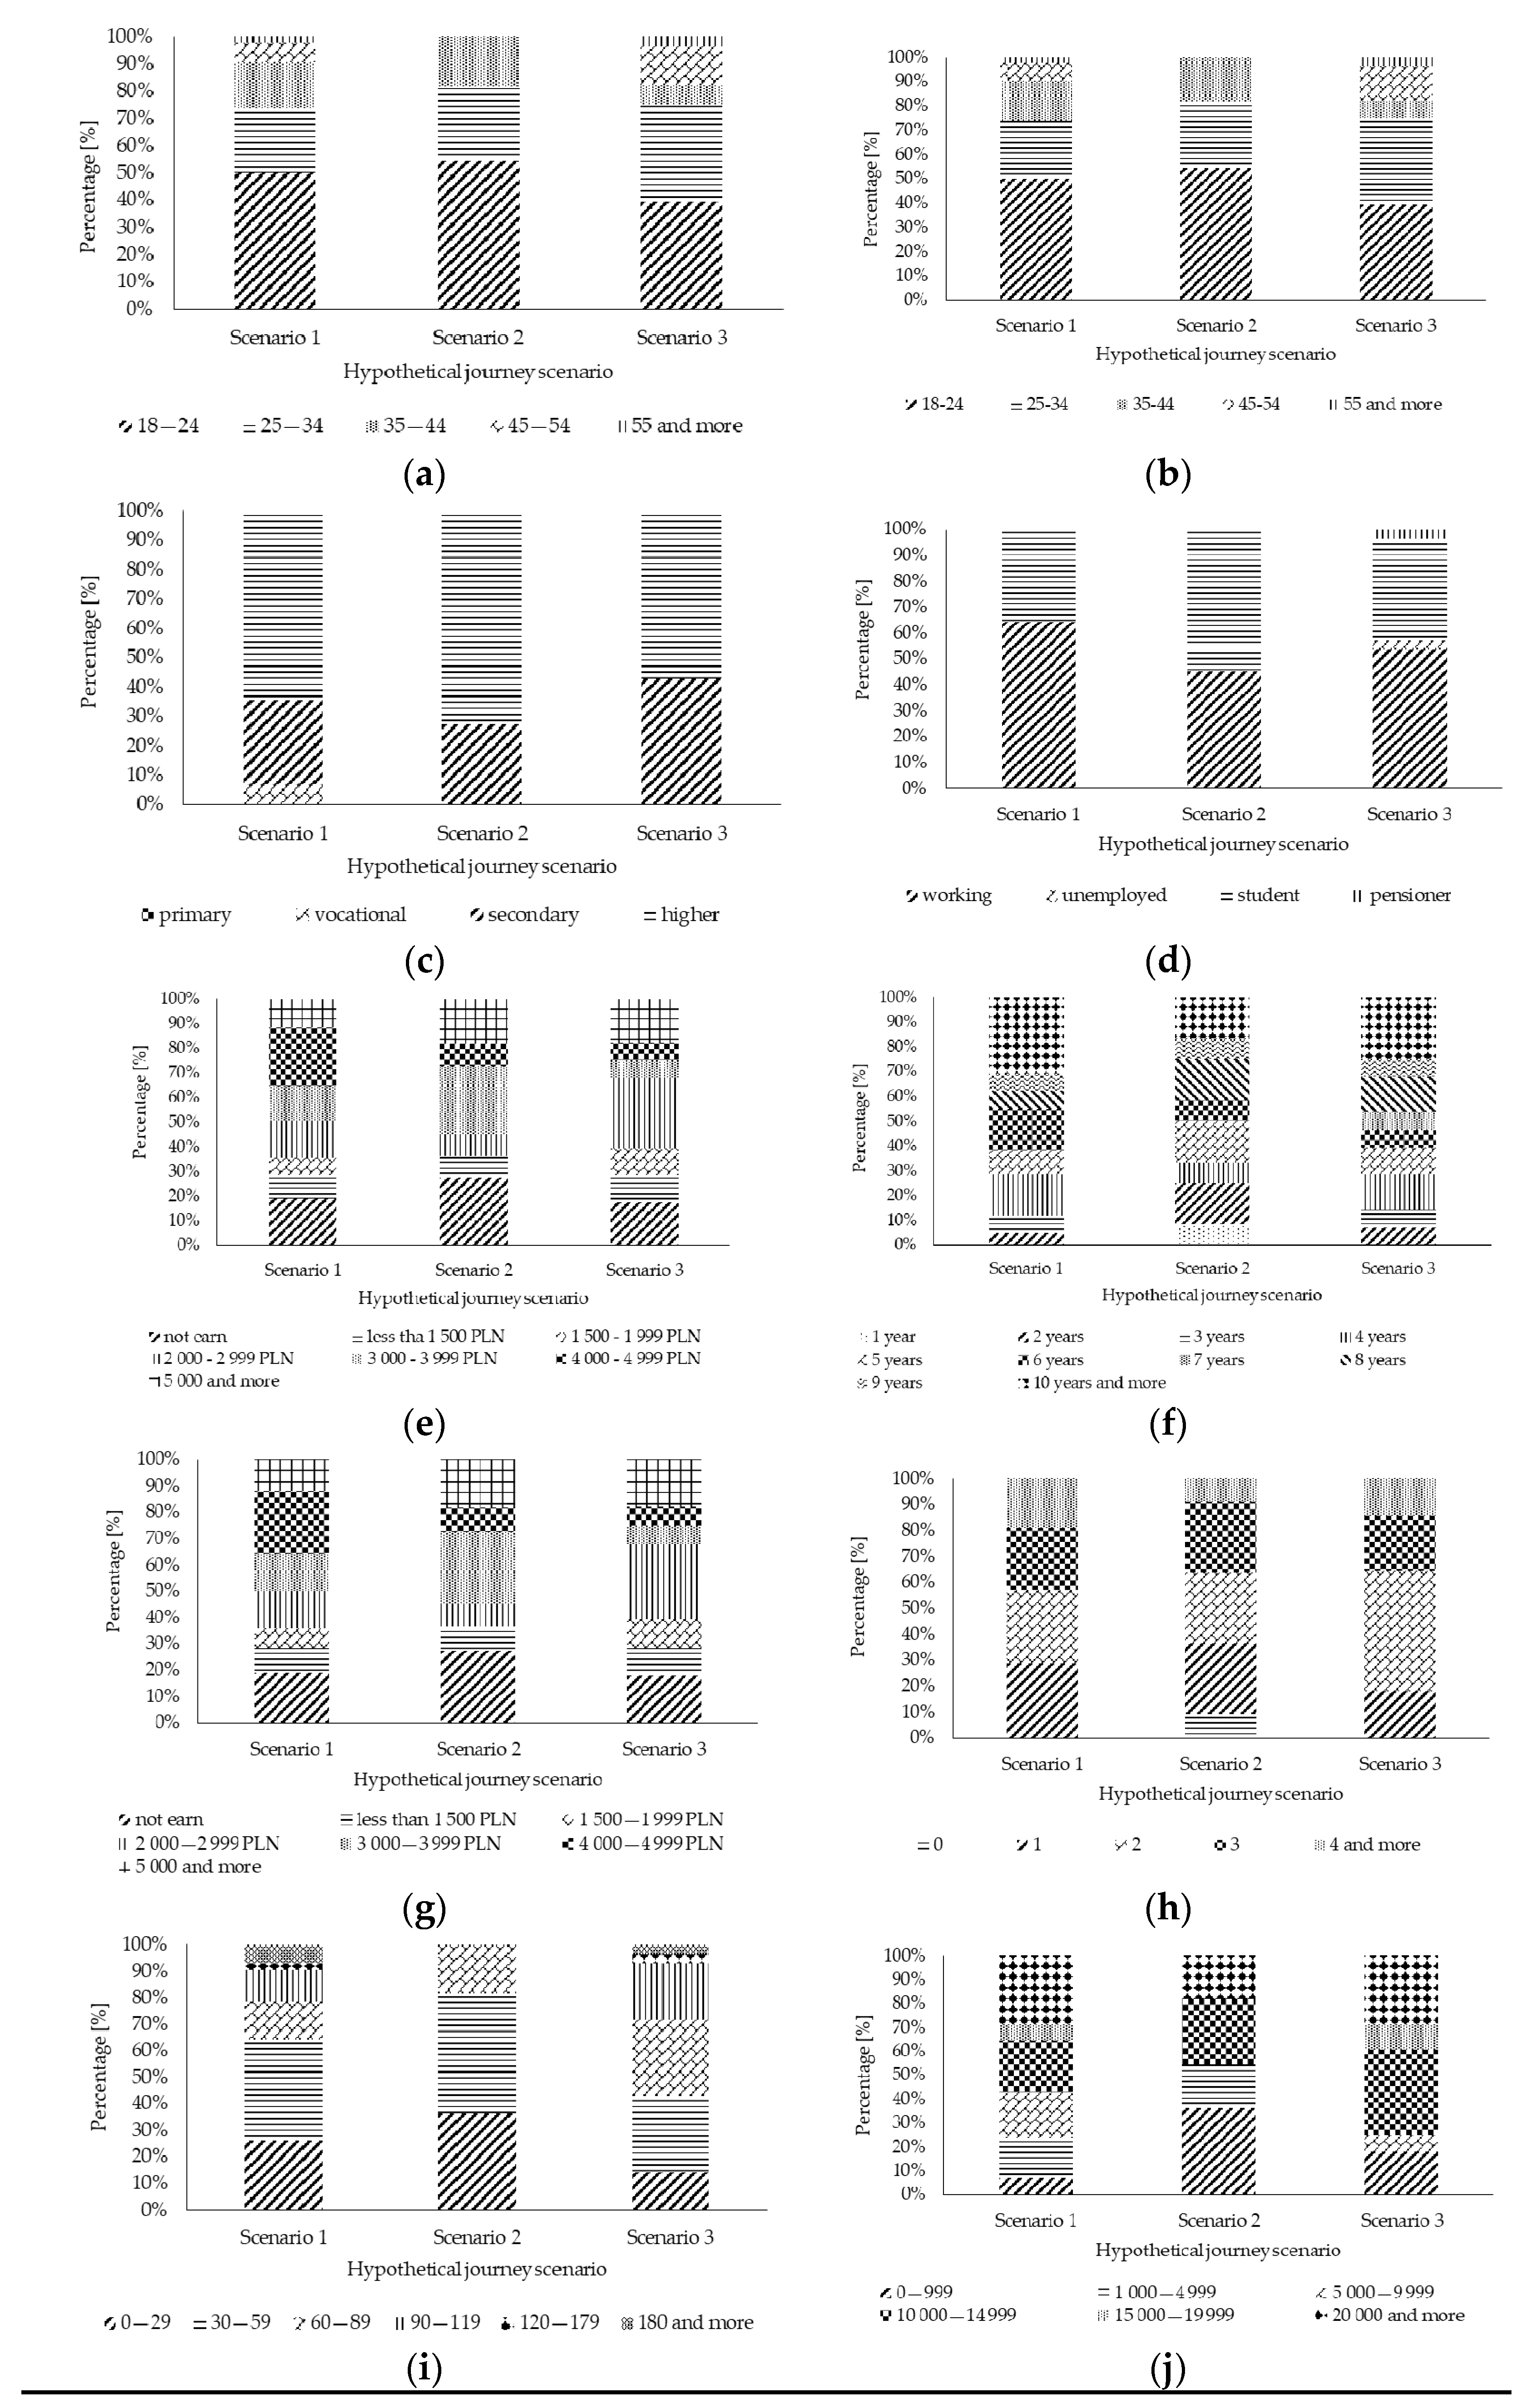
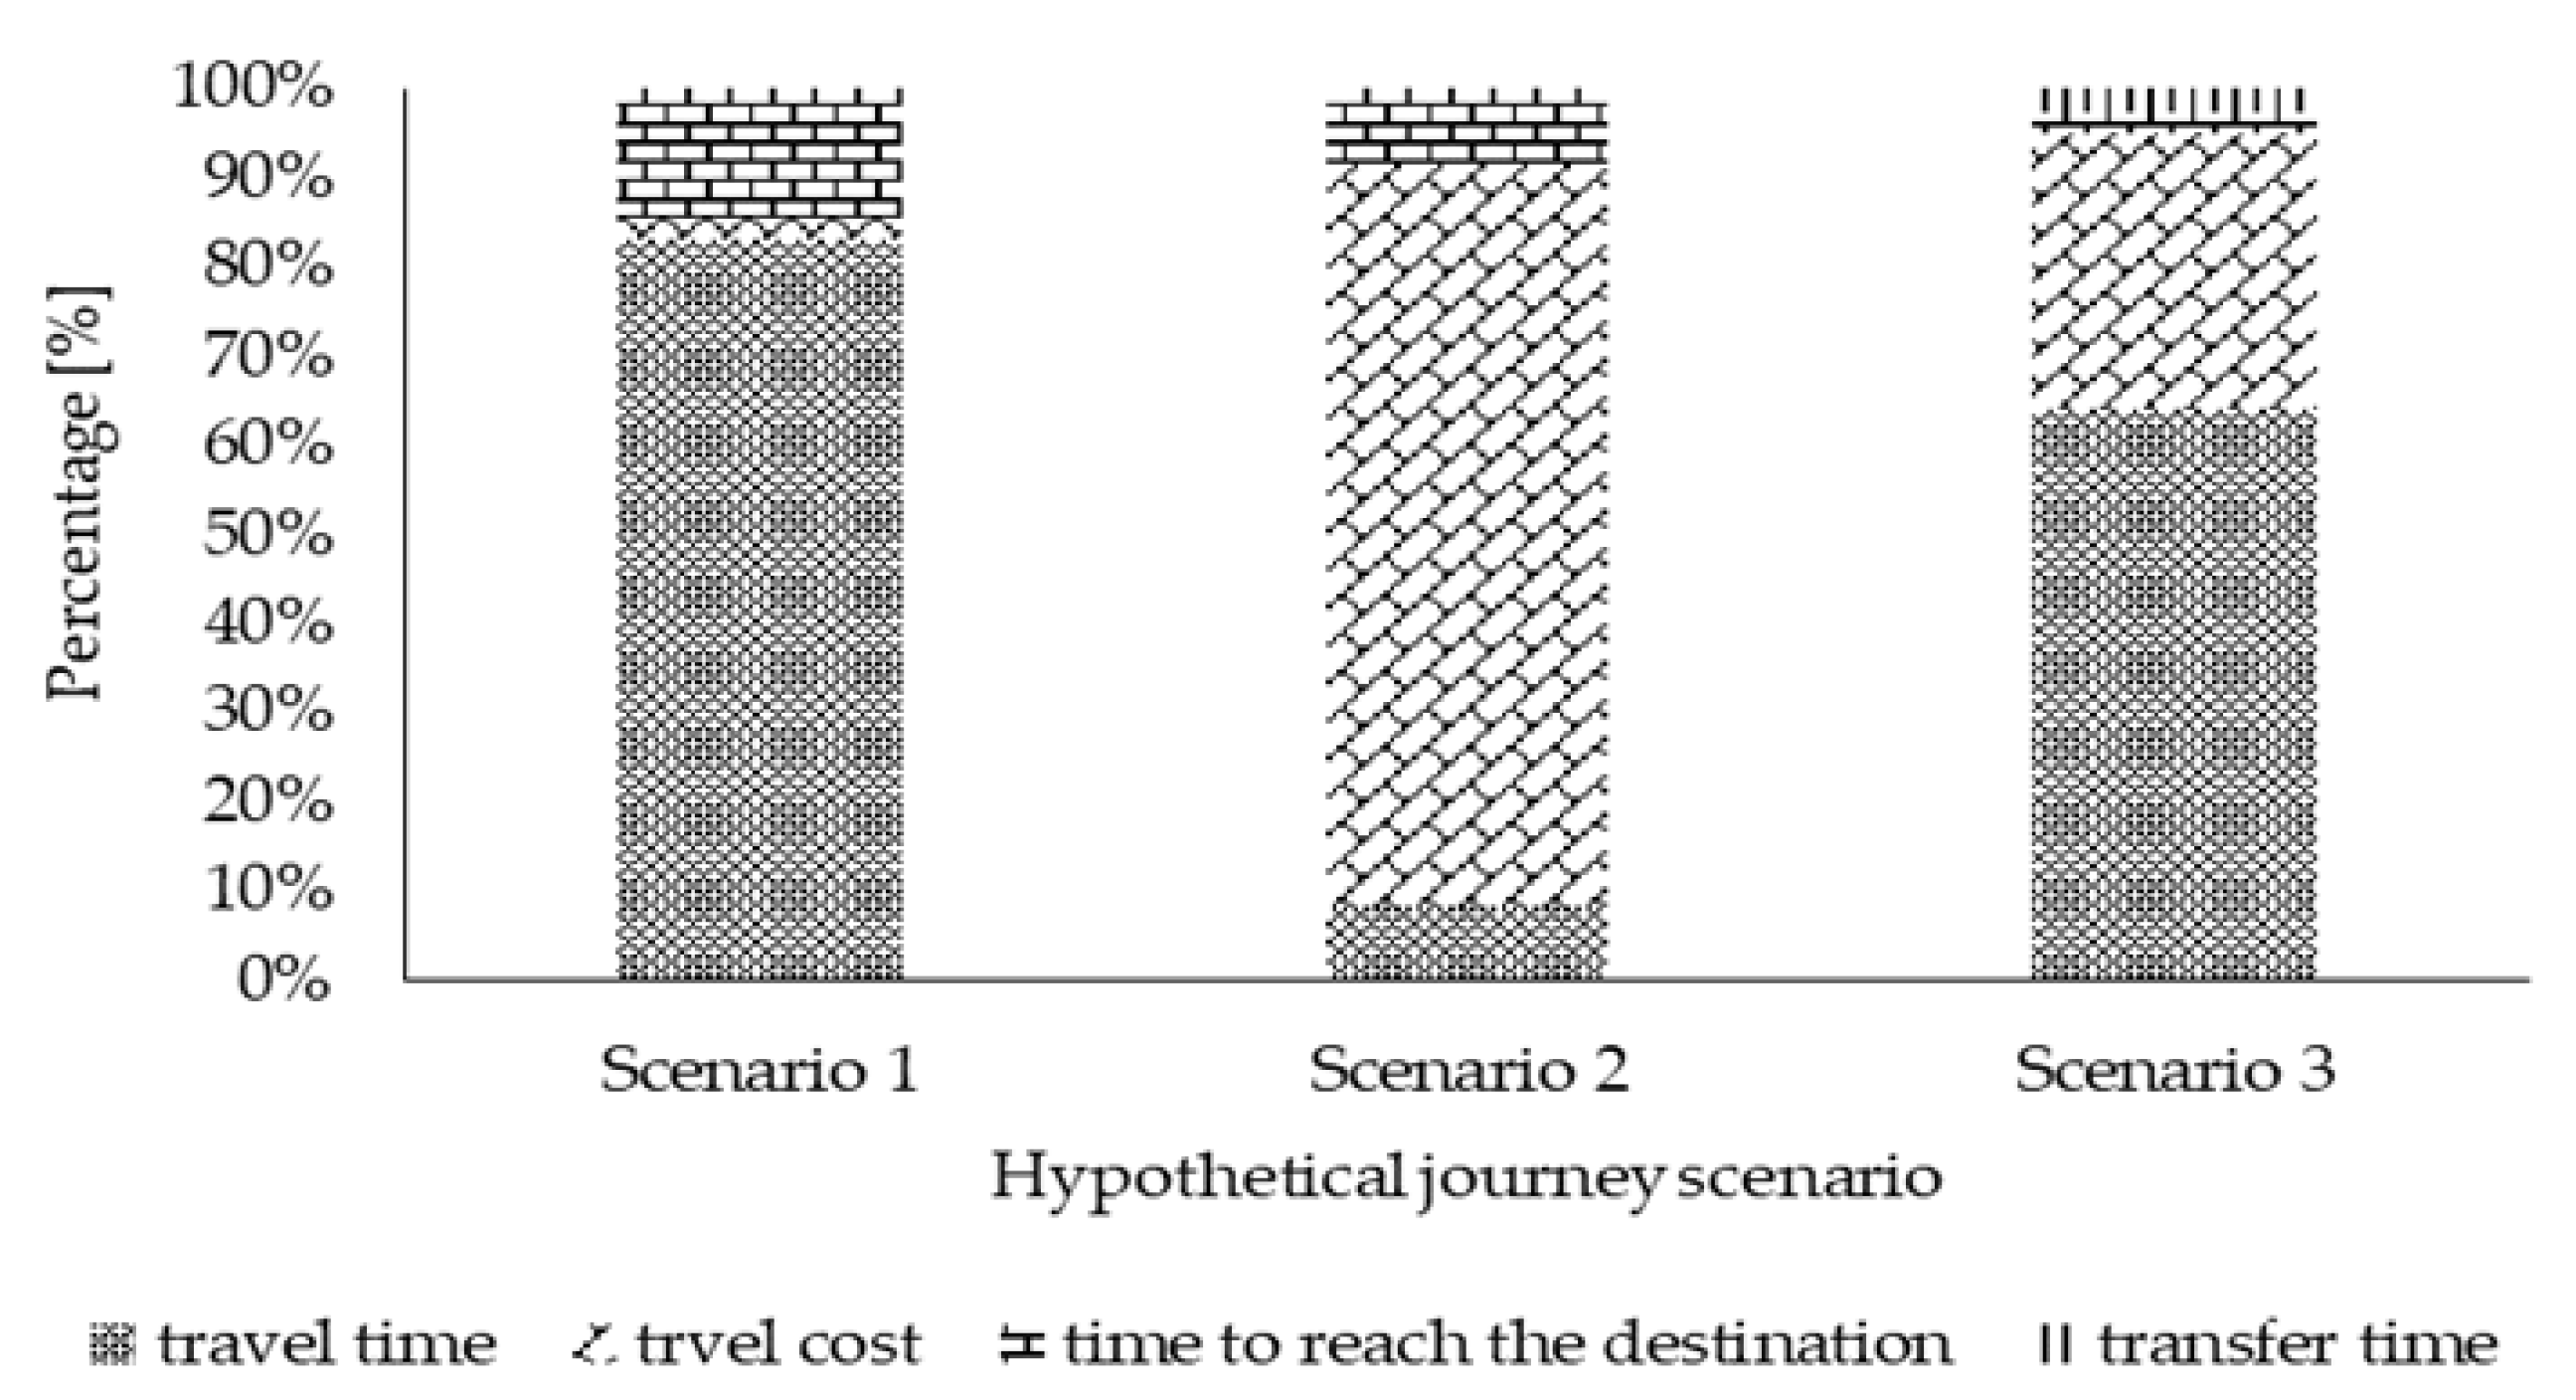
Table 1.
A list of factors taken into account in the analysis of the factors determining the choice of Park and Ride (P&R) facility during the journey, as well as factors that showed a significant impact on the choice of P&R facility during the journey.
Table 1.
A list of factors taken into account in the analysis of the factors determining the choice of Park and Ride (P&R) facility during the journey, as well as factors that showed a significant impact on the choice of P&R facility during the journey.
| Research Work by Author | Characteristics of the Respondents | Travel Characteristics | Factors Related to the Use of P&R Facility | ||||||||||||||||||||||||||||||||||||||
|---|---|---|---|---|---|---|---|---|---|---|---|---|---|---|---|---|---|---|---|---|---|---|---|---|---|---|---|---|---|---|---|---|---|---|---|---|---|---|---|---|---|
| Gender | Age | Income | Education | Place of Employment | Car Ownership | Having Children | The Number of Years Having a Driving License | Place of Residence | Travel Frequency | Frequency of the Using a Car | The Number of kilometers Driven during a Year by a Car | Destination | Travel Mode | Distance to Destination | Distance between the Destination and the Public Transport Stop | Travel Time | Driving Time | Travel Time by Means of Public Transport | Parking Time in the P&R Facility | Transfer Time from the Parking to the Public Transport Stop | Waiting Time for a Transfer | Transfer Mode | Travel Cost | Number of People Traveling Together | Use of the P&R Facility | Information on P&R Facility | Connection to Public Transport Near the Destination | The Quality of Public Transport | Traffic Volume | The Availability of Parking Spaces Near the Destination | Parking Fee | Fuel Cost | Cost of the Ticket for Travel by Means of Public Transport | Transfer Time | Transfer Convenience | Road Stress | Knowing the Road | Safety on the Parking | Environmental Friendliness | Factors Limiting the Use of the P&R Facility | |
| B. He et al. [19] | x | x | x | x | x | x | x | x | x | x | x | x | x | x | x | x | |||||||||||||||||||||||||
| Y. Du et al. [20] | x | x | x | x | x | x | x | x | x | x | x | x | |||||||||||||||||||||||||||||
| W. Clayton et al. [21] | x | x | x | x | x | ||||||||||||||||||||||||||||||||||||
| X. Liu et al. [22] | x | x | x | x | x | x | x | x | x | ||||||||||||||||||||||||||||||||
| X. Zhao et al. [23] | x | x | x | x | x | x | x | x | x | x | x | x | x | x | x | x | x | x | x | x | |||||||||||||||||||||
| S. Islam et al. [19] | x | x | x | x | x | x | x | x | x | x | x | ||||||||||||||||||||||||||||||
| K. Huang et al. [24] | x | x | x | x | x | x | x | x | x | x | x | x | x | x | |||||||||||||||||||||||||||
| Y. Kono et al. [25] | x | x | x | x | x | x | x | x | x | x | x | x | x | x | |||||||||||||||||||||||||||
| H. Qin et al. [26] | x | x | x | x | x | x | x | x | x | x | x | x | x | x | x | x | x | x | |||||||||||||||||||||||
where x—factors included in the study; grey background—factors that showed a significant impact on the choice of P&R facility in travel.
Table 2.
Basic characteristics of the analyzed P&R facilities in Warsaw. Source: Own research based on [49].
Table 2.
Basic characteristics of the analyzed P&R facilities in Warsaw. Source: Own research based on [49].
| P&R Facility Name | Date of Opening | Total Number of Parking Spaces | Number of Parking Spaces for People with Disabilities | Number of Parking Spaces for Bike |
|---|---|---|---|---|
| Metro Stokłosy | 05. 01. 2009 | 393 | 6 | 20 |
| Metro Młociny III | 19. 02. 2018 | 157 | 6 | 24 |
| Metro Ursynów | 11. 12. 2009 | 166 | 7 | 100 |
| Anin SKM | 16. 11. 2009 | 83 | 3 | 100 |
Table 3.
Equivalent distances from the analyzed parking to stops of individual means of public transport.
Table 3.
Equivalent distances from the analyzed parking to stops of individual means of public transport.
| Facility | P&R Metro Stokłosy | P&R Metro Młociny III | P&R Metro Ursynów | P&R Anin SKM | |
|---|---|---|---|---|---|
| Stop/Station | |||||
| Bus [m] | 103.2 | 364.0 | 223.6 | 545.8 | |
| Tram [m] | 3182.4 | 624.6 | 1545.2 | 10,269.2 | |
| Metro [m] | 581.6 | 502.0 | 564.0 | 12,103.2 | |
| Railway [m] | 8258.4 | 9134.8 | 5196.8 | 159.6 | |
| Bike-sharing [m] | 1023.6 | 728.0 | 199.6 | 2464.8 | |
Table 4.
Characteristics of the hypothetical journey scenarios adopted in the survey.
| Hypothetical Journey Scenario | Travel Mode to Destination | Driving Time [min] | Transfer Time [min] | Walking Time to the Destination [min] | Travel Cost [PLN] ([€]) | Components of Travel Costs |
|---|---|---|---|---|---|---|
| 1. | Only car | 35 | 0 | 3 | 17.40 (3.88) and fuel price (depend on traveling distance) | Parking fee, fuel price |
| 2. | Only means of public transport | 61 | 12 | 2 | 4.00 (0.89) | Ticket for travel by means of public transport |
| 3. | A mixed journey, i.e., driving to the P&R facility by car and then changing the means of transport to public transport | 45 | 6 | 2 | 4.00 (0.89) and fuel price (depend on traveling distance) | Ticket for travel by means of public transport, fuel price |
Table 5.
Summary of nonworking days and days before and after these days in 2018.
| Month | Nonworking Days | Days before and after Nonworking Days |
|---|---|---|
| January | 01. 01. 2018—New Year 06. 01. 2018—Feast of the Three Kings | 02. 01. 2018—the impact of New Year |
| February | - | - |
| March | - | 30. 03. 2018 and 31. 03. 2018—the impact of Easter |
| April | 01. 04. 2018—Easter 02. 04. 2018—Easter Monday | 30. 04. 2018—the impact of the May holidays |
| May | 01. 05. 2018—Labor Day 03. 05. 2018—Constitution Day 10. 05. 2018—Whit Sunday 31. 05. 2018—Corpus Christi | 02. 05. 2018 and 04. 05. 2018—the impact of the May holidays |
| June | - | - |
| July | - | - |
| August | 15. 08. 2018—Armed Forces Day | - |
| September | - | - |
| October | - | - |
| November | 01. 11. 2018—All Saints’ Day 11. 11. 2018—Independence Day 12.11.2018—after Independence Day | 02. 11. 2018—the impact of All Saints’ Day |
| December | 25. 12. 2018—Christmas Day 26. 12. 2018—Second Day of Christmas | 24. 12. 2018—Christmas Eve 27. 12. 2018 and 28. 12. 2018—the impact of the Christmas 31. 12. 2018—New Year’s Eve |
Table 6.
Possibilities of changing the means of transport and information about public utility buildings located near the analyzed facility. Source: Own research based on [38].
Table 6.
Possibilities of changing the means of transport and information about public utility buildings located near the analyzed facility. Source: Own research based on [38].
| P&R Facility | Metro Stokłosy | Metro Młociny III | Metro Ursynów | Anin SKM |
|---|---|---|---|---|
| Bus stop name | Ursynów Południowy, Metro Stokłosy | Metro Młociny | Koncertowa, Metro Ursynów | PKP Anin |
| Tram stop name | Wyścigi | Metro Młociny | Wyścigi | - |
| Metro station name | Stokłosy | Młociny | Ursynów | - |
| Railway station name | - | - | - | Warszawa Anin |
| Bike-sharing station name | Metro Stokłosy | Metro Młociny | Metro Ursynów I, Metro Ursynów II | - |
| Nearby public utility buildings (traffic generators) | Shopping center KEN CENTER, House of Culture Stokłosy, Primary schools, High school | ZUS, Huta | Park Romana Kozłowskiego, Furniture store Komfort, Primary school | Primary school, center of sport and recreation, district police headquarters |
Table 7.
The descriptive statistics for quantitative variables.
| Independent Variables (Quantitative) | Min Value | Max Value | Average Value | Standard Deviation |
|---|---|---|---|---|
| Age | 18 | 63 | 31 | 11.98 |
| Income [PLN] | 0 | 7500 | 3035.15 | 2148.46 |
| The number of years having a driving license | 1 | 42 | 10 | 7.76 |
| The average number of journeys made by day | 1 | 4 | 2.72 | 1.82 |
| The number of cars in the household | 1 | 4 | 2.45 | 1.60 |
| The average time spent traveling during the day | 15 | 200 | 71 | 47.98 |
| The number of kilometers driven during a year | 600 | 50,000 | 16,115.76 | 13,480.57 |
Table 8.
Null and alternative hypotheses for quantitative variables.
| Independent Variables (Quantitative) | H0 | H1 | Test Statistics p |
|---|---|---|---|
| Age | The average age of respondents who use the P&R facility is the same as the average age of respondents who do not use the P&R facility | The average age of respondents who use the P&R facility differs from the average age of respondents who do not use the P&R facility | 0.016 |
| Income [PLN] | The average income of respondents who use the P&R facility is the same as the average income of respondents who do not use the P&R facility | The average income of respondents who use the P&R facility differs from the average income of respondents who do not use the P&R facility | 0.024 |
| The number of years having a driving license | The average number of years of driving license for respondents who use the P&R facility is the same as the average number of years of driving license for respondents who do not use the P&R facility | The average number of years of driving license for respondents who use P&R facility differs from the average number of years of driving license for respondents who do not use P&R facility | 0.023 |
| The average number of journeys made by day | The average number of journeys made per day by respondents who use the P&R facility is the same as the average number of journeys made per day by respondents who do not use the P&R facility | The average number of journeys made per day by respondents who use the P&R facility differs from the average number of journeys made per day by respondents who do not use the P&R facility | 0.025 |
| The number of cars in the household | The average number of cars in a household of respondents who use the P&R facility is the same as the average number of cars in a household of respondents who do not use the P&R facility | The average number of cars in a household of respondents who use the P&R facility differs from the average number of cars in a household of respondents who do not use the P&R facility | 0.025 |
| The average time spent traveling during the day | The average time spent traveling during the day by respondents who use the P&R facility is the same as the average time spent traveling during the day by respondents who do not use the P&R facility | The average time spent traveling during the day by respondents who use the P&R facility differs from the average time spent traveling during the day by respondents who do not use the P&R facility | 0.022 |
| The number of kilometers driven during a year | The average number of kilometers traveled by car per year by respondents who use the P&R facility is the same as the average number of kilometers traveled by car per year by respondents who do not use the P&R facility | The average number of kilometers traveled by car per year by respondents who use the P&R facility differs from the average number of kilometers traveled by car per year by respondents who do not use the P&R facility | 0.027 |
Table 9.
Independent variables after selection showing correlation with the dependent variable.
| No. | Independent Variables (Xi) | Correlation Coefficient |
|---|---|---|
| 1. | PL | 0.72 |
| 2. | WI | 0.41 |
| 3. | WY | 0.67 |
| 4. | WZ | 0.35 |
| 5. | LPJ | 0.44 |
| 6. | LSGD | 0.64 |
| 7. | LP | 0.53 |
| 8. | LKMR | 0.48 |
Table 10.
Independent variables adopted for the assessment of the use of the P&R facility in the journey.
Table 10.
Independent variables adopted for the assessment of the use of the P&R facility in the journey.
| No. | Variables | Characteristics | Symbol |
|---|---|---|---|
| 1. | PL | Male | 0 |
| Female | 1 | ||
| 2. | WI [years] | 18–24 | 0 |
| 25–34 | 1 | ||
| 35–44 | 2 | ||
| 45–54 | 3 | ||
| 55 and more | 4 | ||
| 3. | WY | Higher | 0 |
| Secondary | 1 | ||
| Vocational | 2 | ||
| Primary | 3 | ||
| 4. | WZ | Working | 0 |
| Student | 1 | ||
| Pensioner | 2 | ||
| Non employed | 3 | ||
| 5. | LPJ [years] | 1 | 0 |
| 2 | 1 | ||
| 3 | 2 | ||
| 4 | 3 | ||
| 5 | 4 | ||
| 6 | 5 | ||
| 7 | 6 | ||
| 8 | 7 | ||
| 9 | 8 | ||
| 10 and more | 9 | ||
| 6. | LSGD | 1 | 0 |
| 2 | 1 | ||
| 3 | 2 | ||
| 4 and more | 3 | ||
| 7. | LP [trip] | 1 | 0 |
| 2 | 1 | ||
| 3 | 2 | ||
| 4 | 3 | ||
| 5 | 4 | ||
| 6 and more | 5 | ||
| 8. | LKMR [km] | 0–999 | 0 |
| 1000–4999 | 1 | ||
| 5000–9999 | 2 | ||
| 10,000–14,999 | 3 | ||
| 15,000–19,999 | 4 | ||
| 20,000 and more | 5 |
Table 11.
Structural parameters of the A, B, and C models for the three hypothetical journey scenarios.
Table 11.
Structural parameters of the A, B, and C models for the three hypothetical journey scenarios.
| Variable | Model A | Model B | Model C | ||||
|---|---|---|---|---|---|---|---|
| α | p-Value | α | p-Value | α | p-Value | ||
| Y1 (First hypothetical travel scenario) | |||||||
| PL | 0.116 | 0.250 | −0.105 | 0.502 | - | - | |
| WI | −0.154 | 0.012 | −0.148 | 0.016 | - | - | |
| WY | −0.165 | 0.103 | −0.159 | 0.115 | - | - | |
| WZ | −0.116 | 0.351 | −0.109 | 0.377 | - | - | |
| LPJ | 0.009 | 0.745 | 0.011 | 0.704 | - | - | |
| LSGD | 0.048 | 0.491 | 0.217 | 0.595 | - | - | |
| LP | 0.245 | 0.281 | - | - | 0.054 | 0.537 | |
| LKMR | 0.008 | 0.853 | - | - | 0.013 | 0.754 | |
| 0.321 | 0.078 | −0.775 | 0.063 | 0.035 | 0.909 | ||
| Y2 (Second hypothetical travel scenario) | |||||||
| PL | 0.274 | 0.057 | −0.703 | 0.395 | - | - | |
| WI | −0.149 | 0.760 | −0.321 | 0.488 | - | - | |
| WY | −0.442 | 0.029 | −0.159 | 0.115 | - | - | |
| WZ | 0.972 | 0.199 | 0.624 | 0.381 | - | - | |
| LPJ | −0.449 | 0.035 | −0.461 | 0.026 | - | - | |
| LSGD | −0.019 | 0.962 | −0.035 | 0.564 | - | - | |
| LP | 0.049 | 0.431 | - | - | 0.001 | 0.390 | |
| LKMR | −0.643 | 0.029 | - | - | −0.018 | 0.089 | |
| −0.800 | 0.052 | 0.775 | 0.056 | 0.306 | 0.637 | ||
| Y3 (Third hypothetical travel scenario) | |||||||
| PL | −0.608 | 0.346 | 0.555 | 0.377 | - | - | |
| WI | −0.267 | 0.316 | −0.286 | 0.255 | - | - | |
| WY | −0.729 | 0.123 | −0.608 | 0.162 | - | - | |
| WZ | 0.561 | 0.313 | 0.513 | 0.349 | - | - | |
| LPJ | −0.275 | 0.116 | −0.265 | 0.122 | - | - | |
| LSGD | 0.005 | 0.993 | 0.082 | 0.763 | - | - | |
| LP | 0.058 | 0.764 | - | - | 0.027 | 0.986 | |
| LKMR | −0.168 | 0.382 | - | - | 0.026 | 0.575 | |
| −0.094 | 0.762 | −0.226 | 0.451 | −0.317 | 0.049 | ||
| Ch-square | 29.090 | 26.274 | 1.578 | ||||
| Log-likelhood | −1331.48 | −813.623 | −169.105 | ||||
| Log-likelhood 0 | −1346.03 | −826.76 | −169.894 | ||||
| R2 Nagelkerke | 0.026 | 0.023 | 0.001 | ||||
| R2 McFadden | 0.009 | 0.008 | 0 * | ||||
| R2 Cox and Snell | 0.024 | 0.021 | 0.001 | ||||
* R2 < 0.001.
Table 12.
Structural parameters of the D, E, and F models for the three hypothetical journey scenarios.
Table 12.
Structural parameters of the D, E, and F models for the three hypothetical journey scenarios.
| Variable | Model D | Model E | Model F | ||||
|---|---|---|---|---|---|---|---|
| α | p-Value | α | p-Value | α | p-Value | ||
| Y1 (First hypothetical travel scenario) | |||||||
| PL | - | - | - | - | −0.679 | 0.003 | |
| WI | −0.148 | 0.012 | - | - | −0.551 | 0.255 | |
| WY | −0.127 | 0.098 | −0.613 | 0.278 | −0.505 | 0.036 | |
| WZ | −0.120 | 0.322 | 0.072 | 0.896 | −0.129 | 0.196 | |
| LPJ | - | - | −0.426 | 0.007 | −0.324 | 0.837 | |
| LSGD | - | - | - | - | - | - | |
| LP | 0.069 | 0.297 | - | - | - | - | |
| LKMR | - | - | −0.238 | 0.128 | −0.217 | 0.055 | |
| 0.382 | 0.010 | 4.424 | 0.003 | 4.621 | 0.187 | ||
| Y2 (Second hypothetical travel scenario) | |||||||
| PL | - | - | - | - | 0.273 | 0.751 | |
| WI | −0.208 | 0.029 | - | - | −0.107 | 0.827 | |
| WY | −0.167 | 0.009 | −0.405 | 0.040 | 1.775 | 0.039 | |
| WZ | −0.113 | 0.544 | 0.764 | 0.278 | 0.884 | 0.235 | |
| LPJ | - | - | −0.534 | 0.006 | −0.466 | 0.028 | |
| LSGD | - | - | - | - | - | - | |
| LP | 0.024 | 0.254 | - | - | - | - | |
| LKMR | - | - | −0.622 | 0.009 | −0.568 | 0.029 | |
| −0.074 | 0.001 | 4.424 | 0.006 | 4.135 | 0.025 | ||
| Y3 (Third hypothetical travel scenario) | |||||||
| PL | - | - | - | - | −0.611 | 0.341 | |
| WI | −0.208 | 0.002 | - | - | −0.236 | 0.350 | |
| WY | −0.440 | 0.243 | −0.702 | 0.151 | −0.661 | 0.133 | |
| WZ | −0.038 | 0.772 | 0.550 | 0.283 | 0.537 | 0.329 | |
| LPJ | - | - | −0.345 | 0.032 | −0.284 | 0.103 | |
| LSGD | - | - | - | - | - | - | |
| LP | 0.044 | 0.599 | - | - | - | - | |
| LKMR | - | - | −0.159 | 0.348 | −0.156 | 0.383 | |
| −0.723 | 0.651 | 3.155 | 0.034 | 3.241 | 0.037 | ||
| Ch-square | 23.077 | 21.943 | 23.925 | ||||
| Log-likelhood | −370.034 | −308.597 | −151.505 | ||||
| Log-likelhood 0 | −381.573 | −319.569 | −163.468 | ||||
| R2 Nagelkerke | 0.020 | 0.019 | 0.021 | ||||
| R2 McFadden | 0.007 | 0.007 | 0.008 | ||||
| R2 Cox and Snell | 0.019 | 0.018 | 0.019 | ||||
Table 13.
Wald statistic values and odds ratios for D, E, and F models.
| Variable | Model D | Model E | Model F | |||
|---|---|---|---|---|---|---|
| Wald Statistics | Wald Statistics | Wald Statistics | ||||
| Y1 (First hypothetical travel scenario) | ||||||
| PL | - | - | - | - | 1.29 | 0.51 |
| WI | 6.27 | 0.86 | - | - | 4.41 | 0.58 |
| WY | 2.73 | 0.85 | 1.78 | 0.67 | 1.67 | 0.60 |
| WZ | 0.98 | 0.87 | 0.02 | 1.07 | 0.04 | 0.88 |
| LPJ | - | - | 7.21 | 0.65 | 3.69 | 0.72 |
| LSGD | - | - | - | - | - | - |
| LP | 1.09 | 1.04 | - | - | - | - |
| LKMR | - | - | 2.31 | 0.79 | 1.74 | 0.80 |
| Y2 (Second hypothetical travel scenario) | ||||||
| PL | - | - | - | - | 0.10 | 1.31 |
| WI | 4.73 | 0.81 | - | - | 0.05 | 0.89 |
| WY | 6.68 | 0.64 | 4.21 | 0.18 | 4.22 | 0.17 |
| WZ | 0.37 | 0.89 | 1.17 | 2.15 | 1.41 | 2.42 |
| LPJ | - | - | 7.52 | 0.59 | 4.85 | 0.63 |
| LSGD | - | - | - | - | - | - |
| LP | 1.30 | 1.07 | - | - | - | - |
| LKMR | - | - | 6.70 | 0.54 | 1.74 | 0.57 |
| Y3 (Third hypothetical travel scenario) | ||||||
| PL | - | - | - | - | 4.35 | 0.54 |
| WI | 9.79 | 0.81 | - | - | 0.91 | 0.79 |
| WY | 1.36 | 0.88 | 2.06 | 0.54 | 0.87 | 0.52 |
| WZ | 0.08 | 0.96 | 1.15 | 1.73 | 2.26 | 1.71 |
| LPJ | - | - | 4.61 | 0.71 | 0.95 | 0.75 |
| LSGD | - | - | - | - | 2.66 | - |
| LP | 0.28 | 1.02 | - | - | - | - |
| LKMR | - | - | 0.88 | 0.71 | 0.76 | 0.86 |
Publisher’s Note: MDPI stays neutral with regard to jurisdictional claims in published maps and institutional affiliations. |
© 2021 by the authors. Licensee MDPI, Basel, Switzerland. This article is an open access article distributed under the terms and conditions of the Creative Commons Attribution (CC BY) license (http://creativecommons.org/licenses/by/4.0/).
Share and Cite
MDPI and ACS Style
Macioszek, E.; Kurek, A. The Analysis of the Factors Determining the Choice of Park and Ride Facility Using a Multinomial Logit Model. Energies 2021, 14, 203. https://0-doi-org.brum.beds.ac.uk/10.3390/en14010203
AMA Style
Macioszek E, Kurek A. The Analysis of the Factors Determining the Choice of Park and Ride Facility Using a Multinomial Logit Model. Energies. 2021; 14(1):203. https://0-doi-org.brum.beds.ac.uk/10.3390/en14010203
Chicago/Turabian StyleMacioszek, Elżbieta, and Agata Kurek. 2021. "The Analysis of the Factors Determining the Choice of Park and Ride Facility Using a Multinomial Logit Model" Energies 14, no. 1: 203. https://0-doi-org.brum.beds.ac.uk/10.3390/en14010203
Note that from the first issue of 2016, this journal uses article numbers instead of page numbers. See further details here.