Article

Investigating the Effect of Dust Accumulation on the Solar Reflectivity of Coating Materials for Cool Roof Applications

1
Prince Saud bin Thuniyan Research Center, Jubail University College, Royal Commission for Jubail & Yanbu, P.O. Box 10074, Jubail 31961, Saudi Arabia
2
Kuwait Institute for Scientific Research, P.O. Box 24885, Safat 13109, Kuwait
*
Author to whom correspondence should be addressed.
Submission received: 1 December 2020 / Revised: 11 January 2021 / Accepted: 13 January 2021 / Published: 15 January 2021
(This article belongs to the Special Issue Design Considerations for Low Energy Resilient Buildings)

Abstract

:
Cool roofs use reflective materials or coatings to reflect a portion of the incident solar radiation. This results in a lowering the surface temperature of the cool roof compared to black roofs, and thus helps reduce the cooling energy loads during the summer season. The research reported in this paper was conducted to assess experimentally and numerically the performance of cool and black roofs that were subjected to the hot, humid and dusty climate of Jubail Industrial City (JIC). This paper focused on characterizing one of the important properties of reflective coating material (RCM), which is its solar reflectivity. In this study, the effect of dust/dirt accumulation on the solar reflectivity of the RCM was investigated at different exposure times to the natural weathering conditions of JIC. The test results showed that dust and dirt can significantly contribute in reducing the solar reflectivity of the RCM. As such, a number of cleaning processes were conducted on the surface of the RCM so as to increase its solar reflectivity. The effect of each cleaning process on the solar reflectivity of the RCM was investigated. Finally, this paper provides a test protocol and procedure for characterizing the dust concentration/intensity on the surfaces of the RCM and cleaning this material after different exposure times to a natural and polluted climate.

1. Introduction

Global warming occurs when carbon dioxide and other air pollutants and greenhouse gases absorb solar radiation that has bounced off the Earth’s surface. This results in an increase in the air temperature near the Earth surface. Urban heat island effects also contribute to global warming. While early research reported that urban heat island effects have little influence on the trends of the global mean temperature [1], more recent research has found that urban heat island effects contributed to climate warming by about 30% of all other issues that contribute to climate warming [2]. Further, another recent study by Sachindra et al. [3] has revealed increases in the severity of the effect of heat islands with the progress of climate change. Unlike vegetation and other natural ground cover, urban surfaces absorb and store more solar radiation. This results in an increase of the surrounding temperature [4]. For example, the average annual air temperature in a city of one million people or more could be 1 to 3 °C warmer than its surroundings [5]. The higher surrounding temperature causes a greater energy demand for air conditioning (A/C) systems. There are five strategies that can be applied in order to mitigate the effects of urban heat islands [6,7,8,9,10,11,12]: (a) increasing the amount of vegetation and trees in urban areas [7], (b) installing reflective pavements on streets, sidewalks and parking lots [8,9], (c) utilizing smart growth practices that help protect the natural environment [10], (d) installing green roofs by growing vegetative layers on the rooftops [11], and (e) installing cool/white/reflective roofing systems [12]. The latter approach is investigated in this paper.
A joint research project between the Kuwait Institute for Scientific Research (KISR) and Jubail University College (JUC) was initiated to focus on maximizing the energy savings as results of installing reflective membranes and coatings in the roofing systems of Kuwaiti and Saudi buildings. The outdoor surfaces of roofs are exposed to several environmental factors. These factors are specific to the local climatic conditions such as dust/dirt, cloud coverage, sunlight, rain, snow, wind, outdoor temperature and relative humidity [13]. Additionally, the energy performance and moisture performance of the roofs depend mainly on these factors and the roof specifications. For given climatic conditions, a part of the incident solar radiation on a roofing surface is absorbed and another part is reflected back to the environment. The absorbed part of solar energy causes an increase in the surface temperature of the roof, thereby increasing the cooling load in summer and reducing the heating load in winter [14]. Cool roofs use reflective materials or coatings that have high short-wave solar reflectivity (i.e., low short-wave absorption coefficient) to reflect a substantial portion of the incident solar radiation. This results in reducing the amount of energy that A/C system needs (i.e., cooling load) to cool the building in relation to black roofs.
The influences of dirt and/or particles in the form of dust accumulation on surfaces are important for solar photovoltaic (PV) panel and cool roof applications. The dirt/dust accumulations on PV panels obstruct or distract light energy from reaching the solar cells, resulting in reduction in PV performance. Mani and Pillai [15] have indicated that dust is the less acknowledged factor that significantly influences the performance of the PV panels. For example, the experimental study by Sulaimana et al. [16] has shown that the external resistance due to dirt/dust on PV panel could reduce the PV performance by up to 85%. For cool roof applications, dust and dirt accumulations on the reflective materials or coatings installed on the external surfaces of roofs can decrease the short-wave solar reflectivity of these surfaces. This results in increasing the solar heat gains. A number of studies report on the change in the properties of roofing surfaces due to weathering factors and dirt accumulation. Algarni and Nutter [17] investigated the effect of dust accumulation on building roofs on the thermal performance and radiant heat gain. Their results showed that smaller dust particles of lower densities tend to cover more roof area, resulting in higher roof absorptivity.
Levinson et al. [18] investigated the effect of conducting various cleaning processes on the solar reflectivity of light gray polyvinyl chloride membrane samples that were collected from roofs across United States. The results of that study showed that contaminants that included inorganic carbon and black carbon were detected on the surfaces of the samples. These contaminants resulted in reducing the solar reflectivity of the membrane samples. As well, Levinson et al. [18] studied the effect of several cleaning operations on solar reflectance values, where the surfaces of the samples were first wiped to simulate wind action, then rinsed to simulate rain action, and in a third step, the surfaces were washed by a phosphate-free dishwashing detergent to simulate a homemade cleaning process. These three cleaning processes were followed by cleaning the surfaces of the samples with a mixture of sodium hypochlorite and sodium hydroxide to simulate professional cleaning process. The results of that study [18] showed that applying these cleaning processes have resulted in recovering the loss of solar reflectivity to its original values. Akbari et al. [19] applied the cleaning processes that were developed by Levinson et al. [18] on un-weathered and weathered single ply roofing membranes collected from various sites across Canada and United States. That study showed that applying these cleaning processes were successful in recovering about 90% of their un-weathered reflectivity.
To the best of our knowledge, no such experimental study investigating the potential use of reflective roofing technology in dusty weather such as that of Kuwait and Saudi Arabia is available at this time. As such, this research project focused on both conventional (black) and reflective roofs to investigate the potential energy savings due to using reflective coating material on the external surfaces of the roofing systems of Kuwaiti and Saudi buildings. As the short-wave solar reflectivity is one of the important properties for the reflective materials that has a great effect on the amount of energy savings [20,21,22].
In this paper, the dust concentration on the surface of a reflective coating material (RCM) was measured in terms of the turbidity when the RCM was subjected to the natural weathering conductions of Jubail Industrial City (JIC). Due to the quite high pollution level in JIC [23,24], black carbon, inorganic carbon and some isolated dark spots of biomass can be seen on the surface of RCM as a thin layer between the coating and the dust. Beside dust, this thin layer of the contaminants can contribute in reducing the short-wave solar reflectivity of RCM. Throughout this paper, unless otherwise specified, the term “dirt” is used to refer to the thin layer of the contaminants due to pollution (i.e., black carbon and inorganic carbon, etc.). So, the objectives of the research study presented in this paper are to:
(1)
Characterize the short-wave solar reflectivity of RCM when this coating is subjected to natural weathering conditions of Jubail Industrial City.
(2)
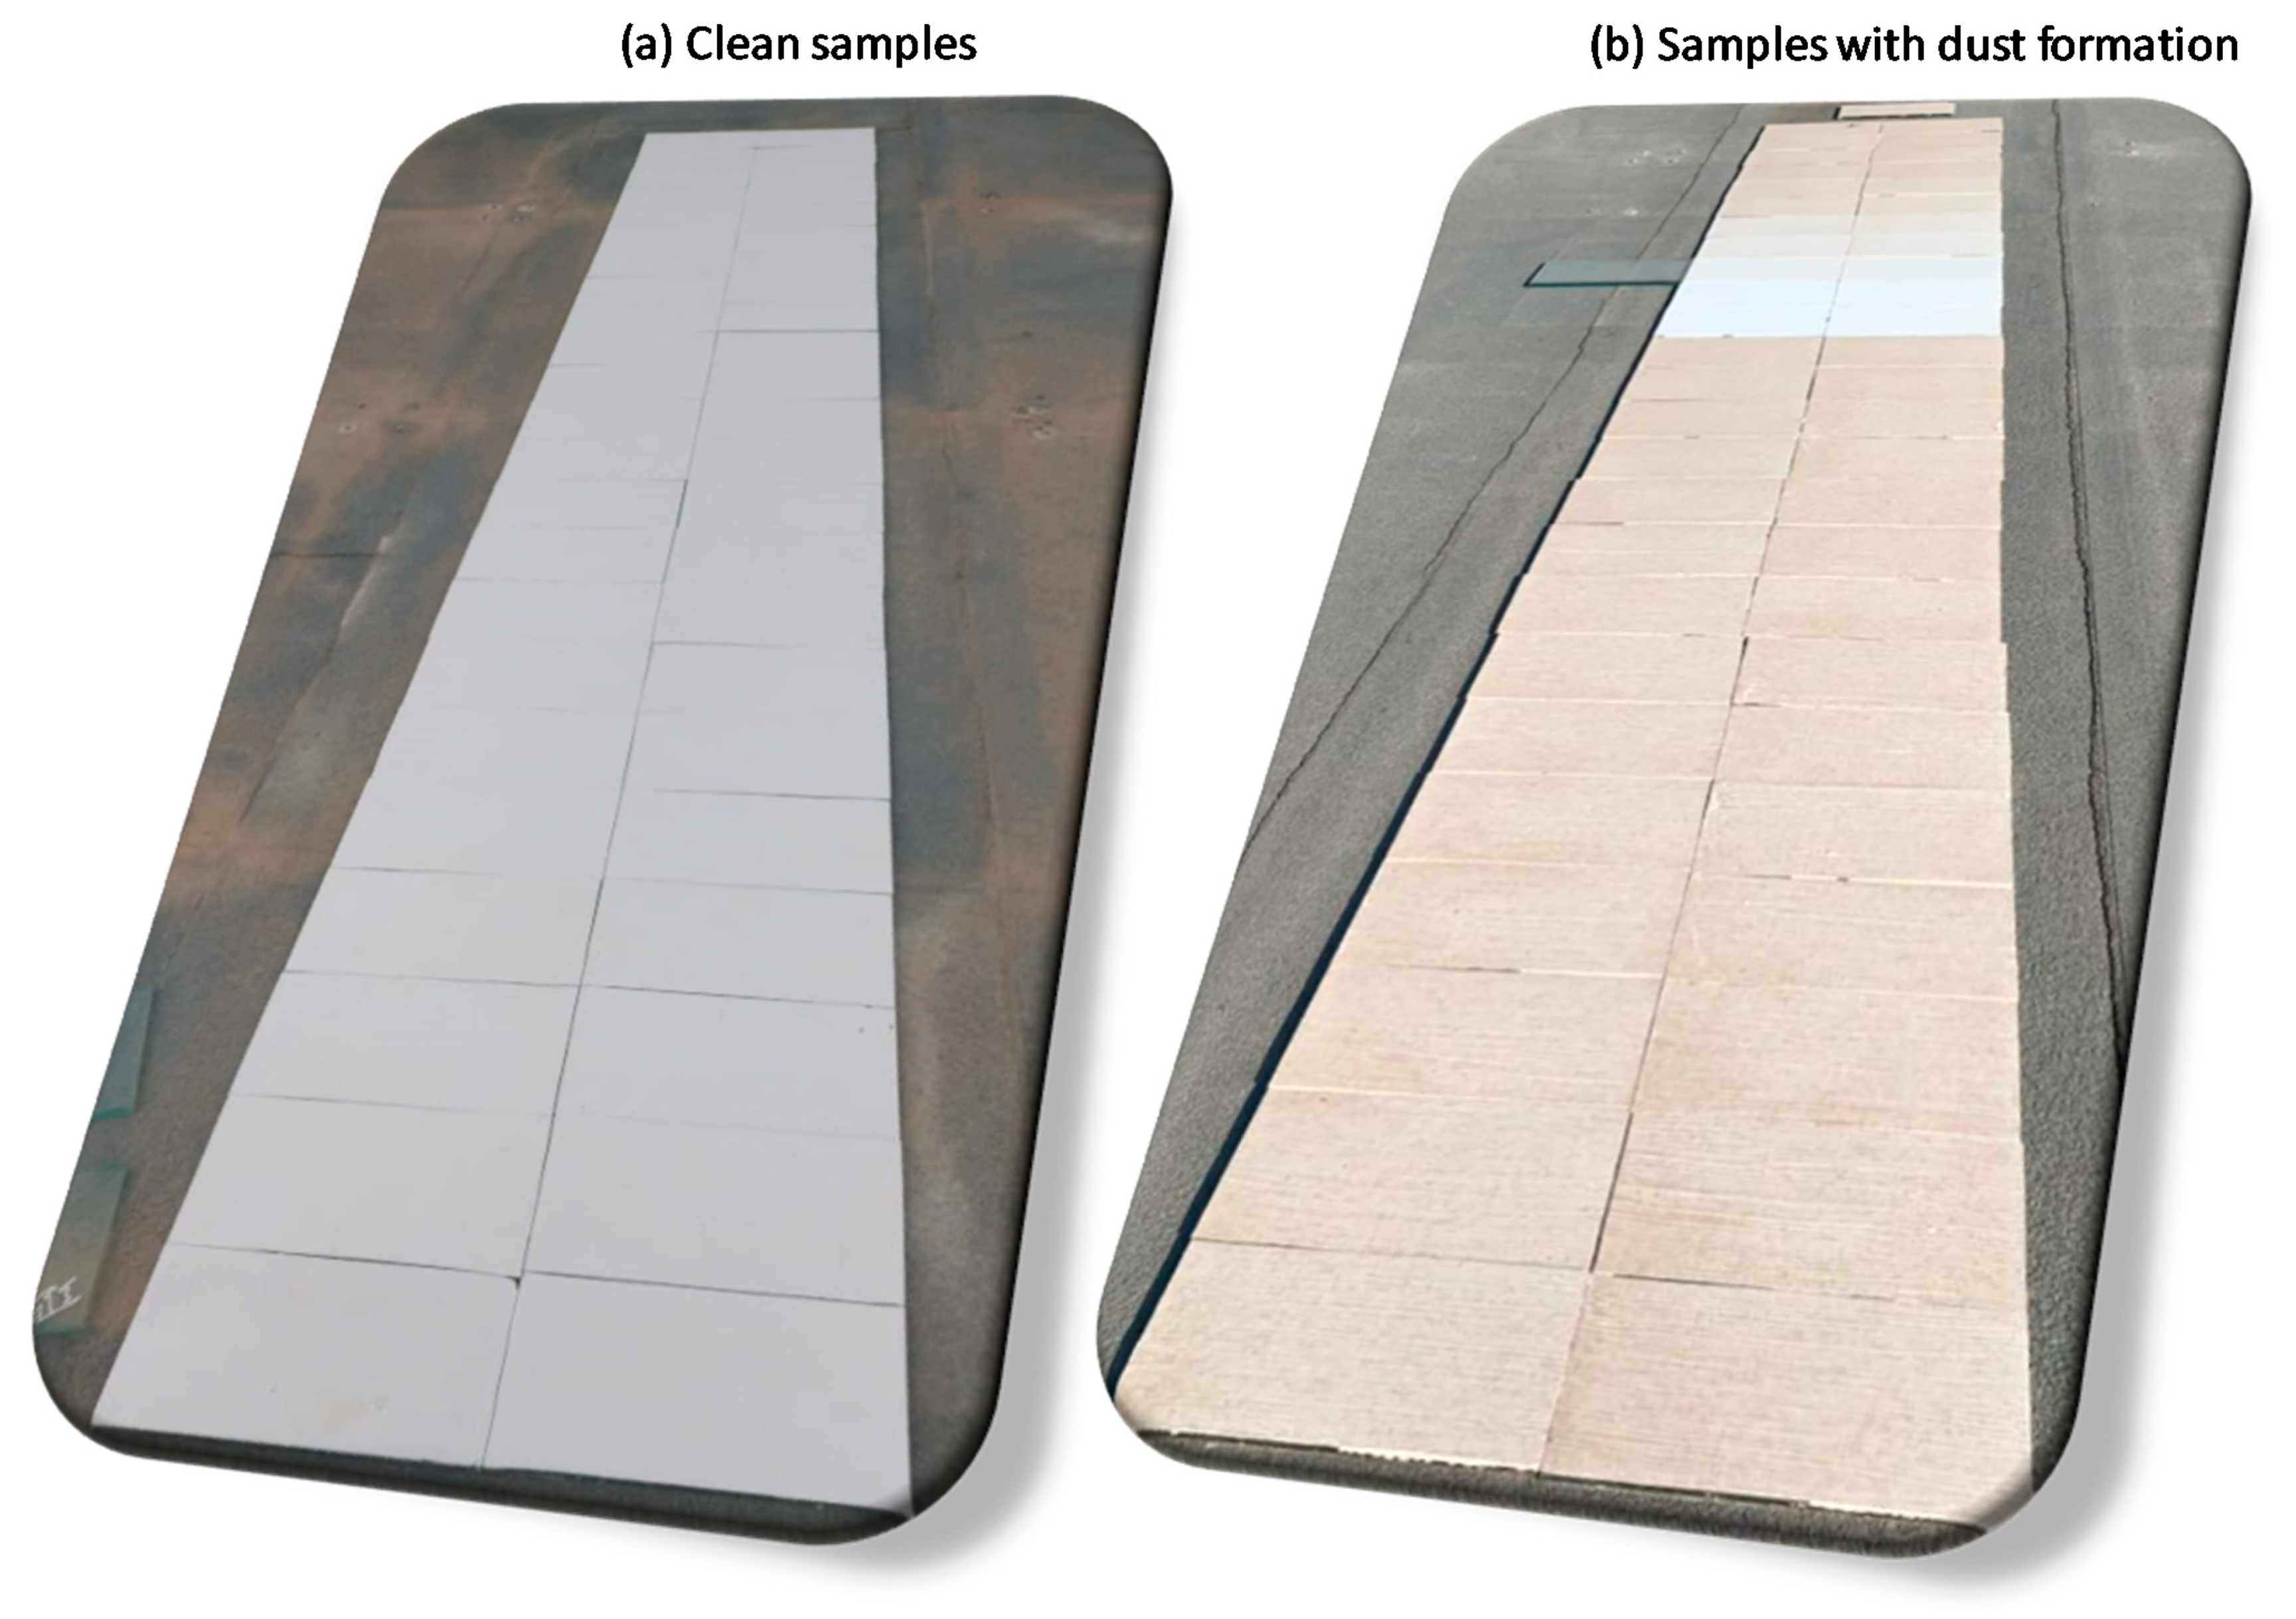
Investigate the effect of dust/dirt accumulation on the surface of RCM on its short-wave solar reflectivity.
(3)
Investigate the effect of conducting different cleaning processes on the RCM so as to increase its solar reflectivity that would result in high energy savings.

2. Materials and Methods

As indicated earlier, dust/dirt accumulations on reflective roofing materials of cool roof can affect the roof performance. Under the natural weathering conditions of Jubail Industrial City (JIC), this paper focused on investigating the effect of dust accumulations at different exposure times on the short-wave solar reflectivity of RCM that is commercially available in the markets of GCC countries. The RCM is formulation of resin polymer, which offers waterproofing due its low water permeability and low vapor permeability. Also, the RCM manufacturer reported the following characteristics:
(a)
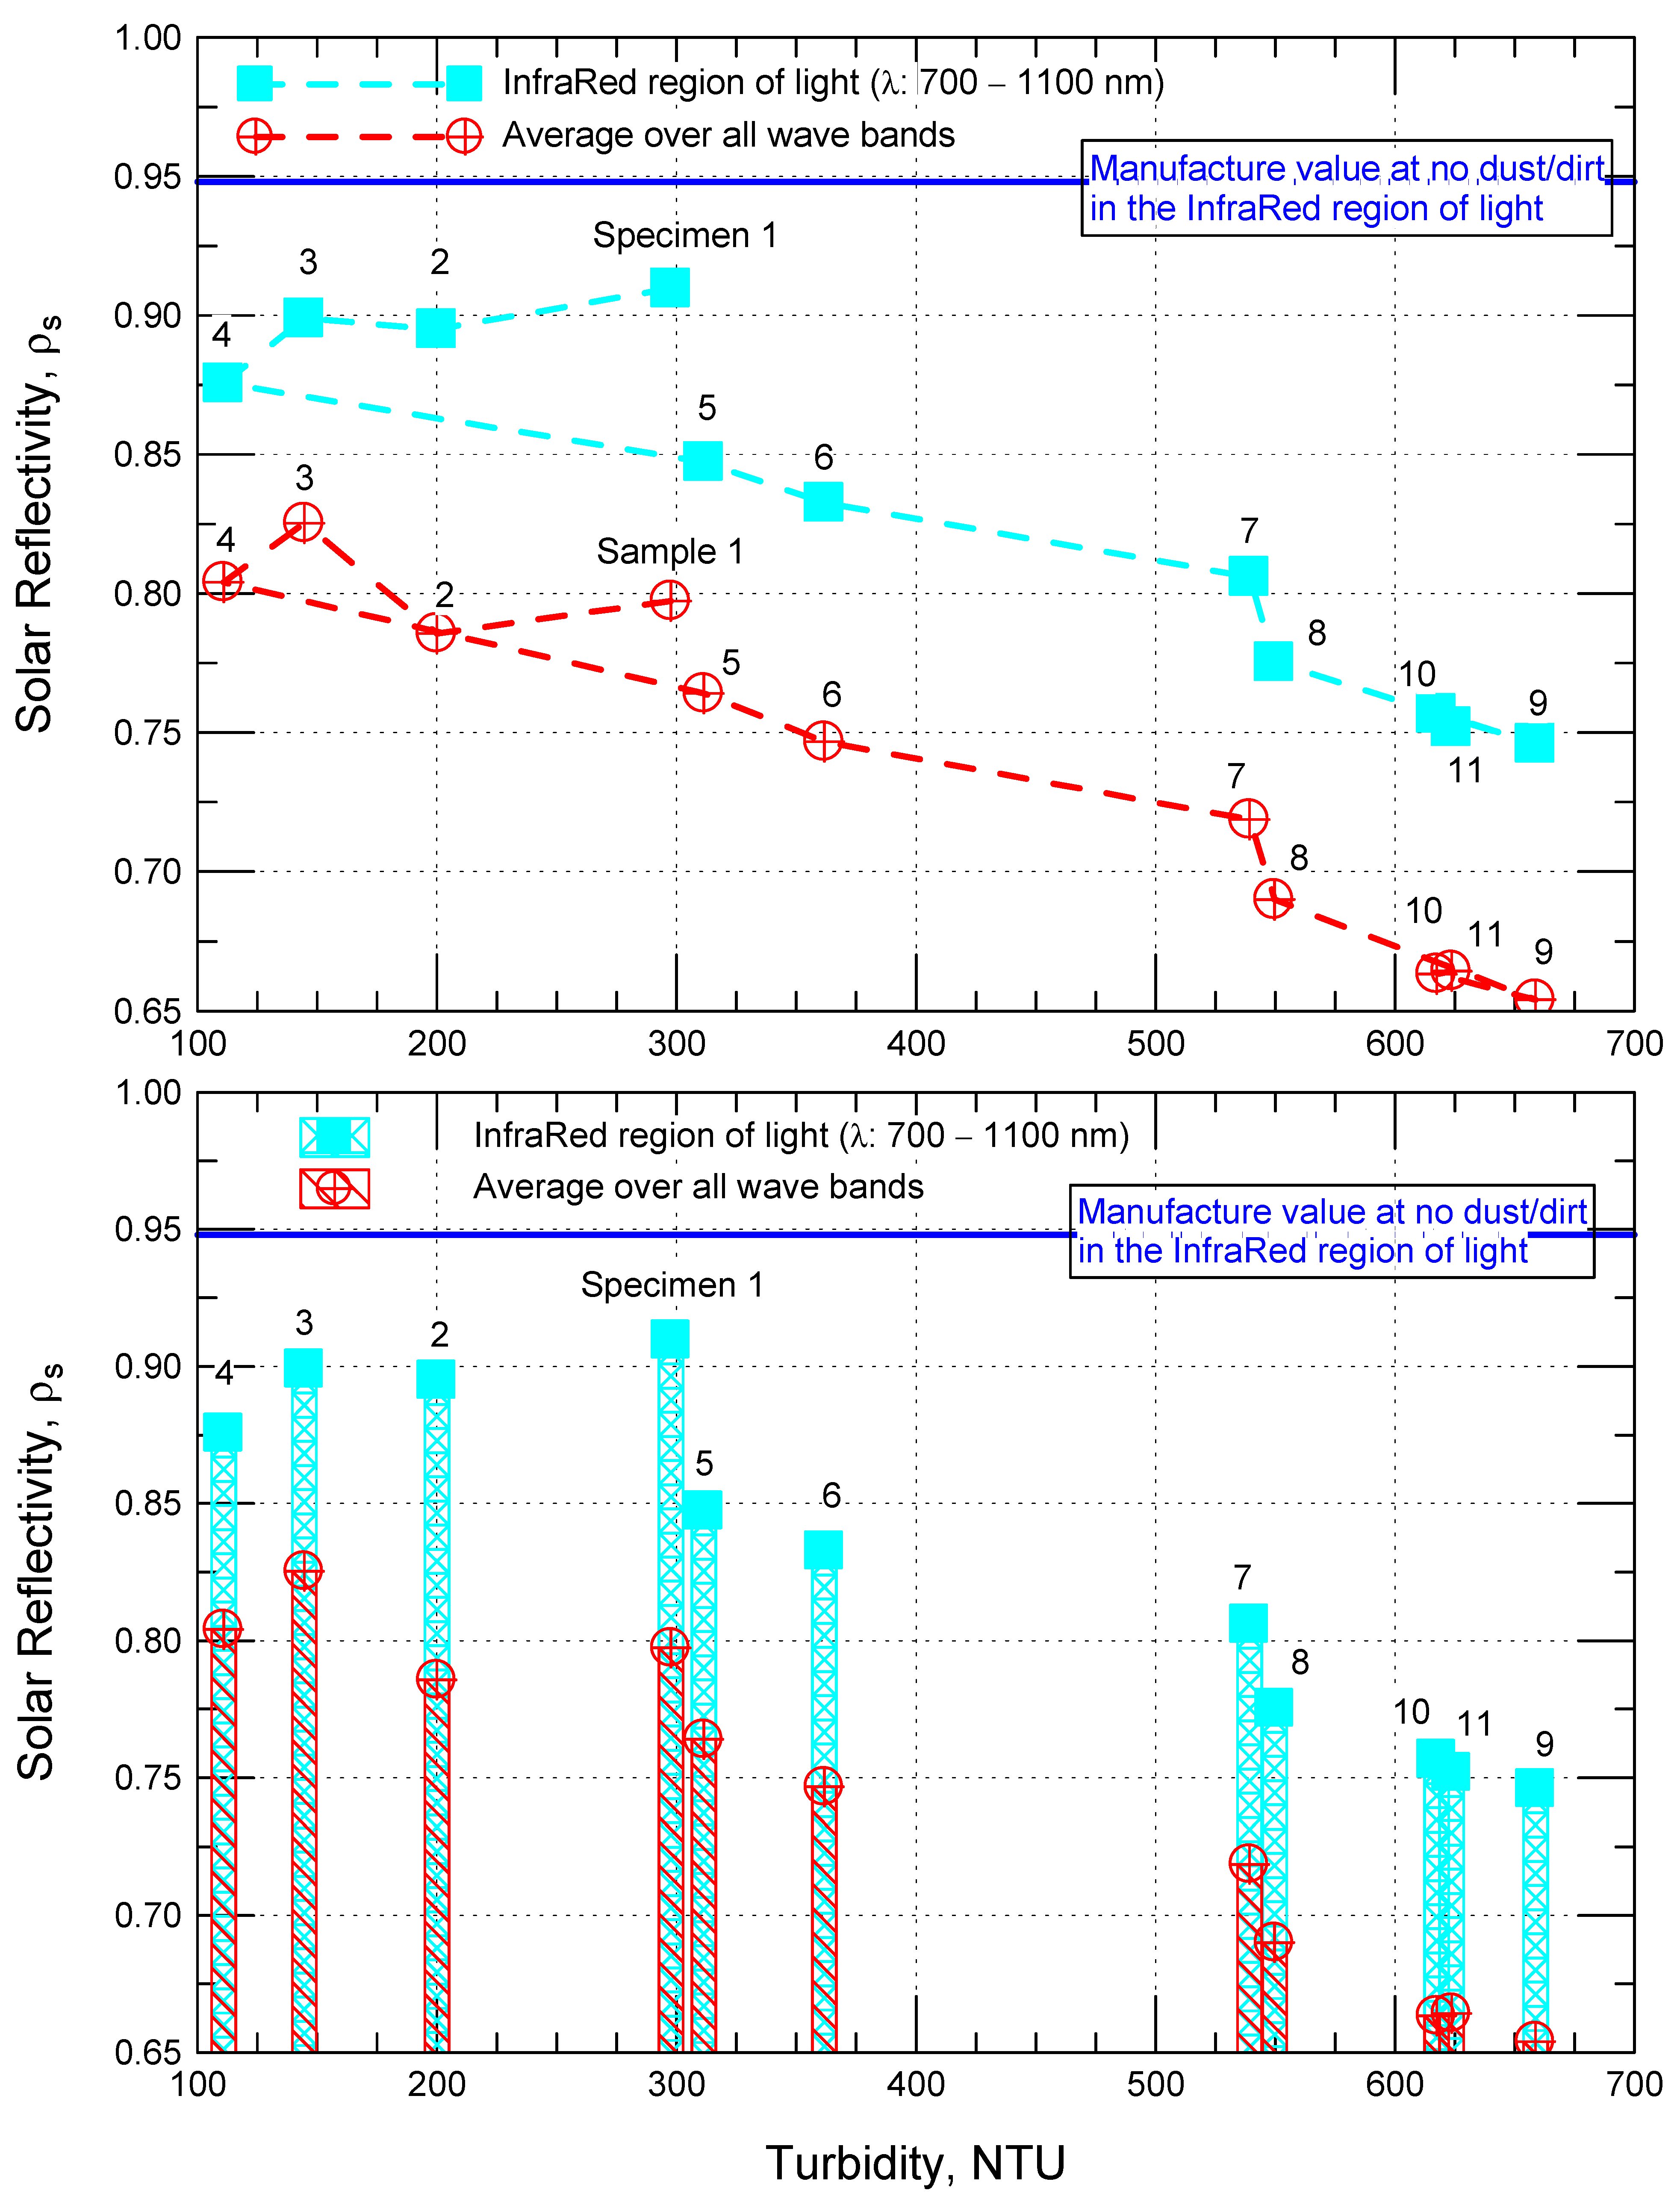
RCM reflects 94.8% of thermal radiation in the infrared light region;
(b)
the thermal conductivity of the RCM is four times less than that of a regular paint;
(c)
the RCM remains white after application, and
(d)
because the RCM can bind cracks up to 1.5 mm, it can be applied directly on the rooftops of different materials.
In this study, the short-wave solar reflectivity was measured using a reflectometer that measures the solar reflectivity in accordance with the test method of ASTM-E903 [25]. The reflectometer measures the reflectance for seven sub-wavelength bands in the range of 300–2500 nm. These sub-wavelength include: (a) 335–380 nm, (b) 400–450 nm, (c) 480–600 nm, (d) 590–720 nm, (e) 700–1100 nm, (f) 1000–1700 nm, and (g) 1700–2500 nm [26]. As well, for each short-wave solar reflectivity measurement, the dust concentration on the roofing materials was measured in terms of nephelometric turbidity units (NTU) using a photometer (turbidity meter, see [27] for details). The outdoor and indoor surface temperatures of the roofing system were measured using k-type thermocouples and infrared camera [28]. To examine the effect of the outdoor conditions on the thermal performance and moisture performance of white and black roofing systems, a weather station installed on the roof of the test facility (see Figure 1).
A test protocol was developed and applied during the course of executing the experimental tests. This test protocol has included all details including the time intervals for measuring different parameters (short-wave solar reflectivity, dust concentration, temperature). The measurements for the short-wave solar reflectivity of the RCM as function of dust/dirt accumulation at different exposure times were used to investigate the effect of conducting different cleaning processes on the solar reflectivity of RCM. The methods for measuring the short-wave solar reflectivity and characterizing the dust accumulation on the exterior surface of the RCM consist of the following steps:
(1)
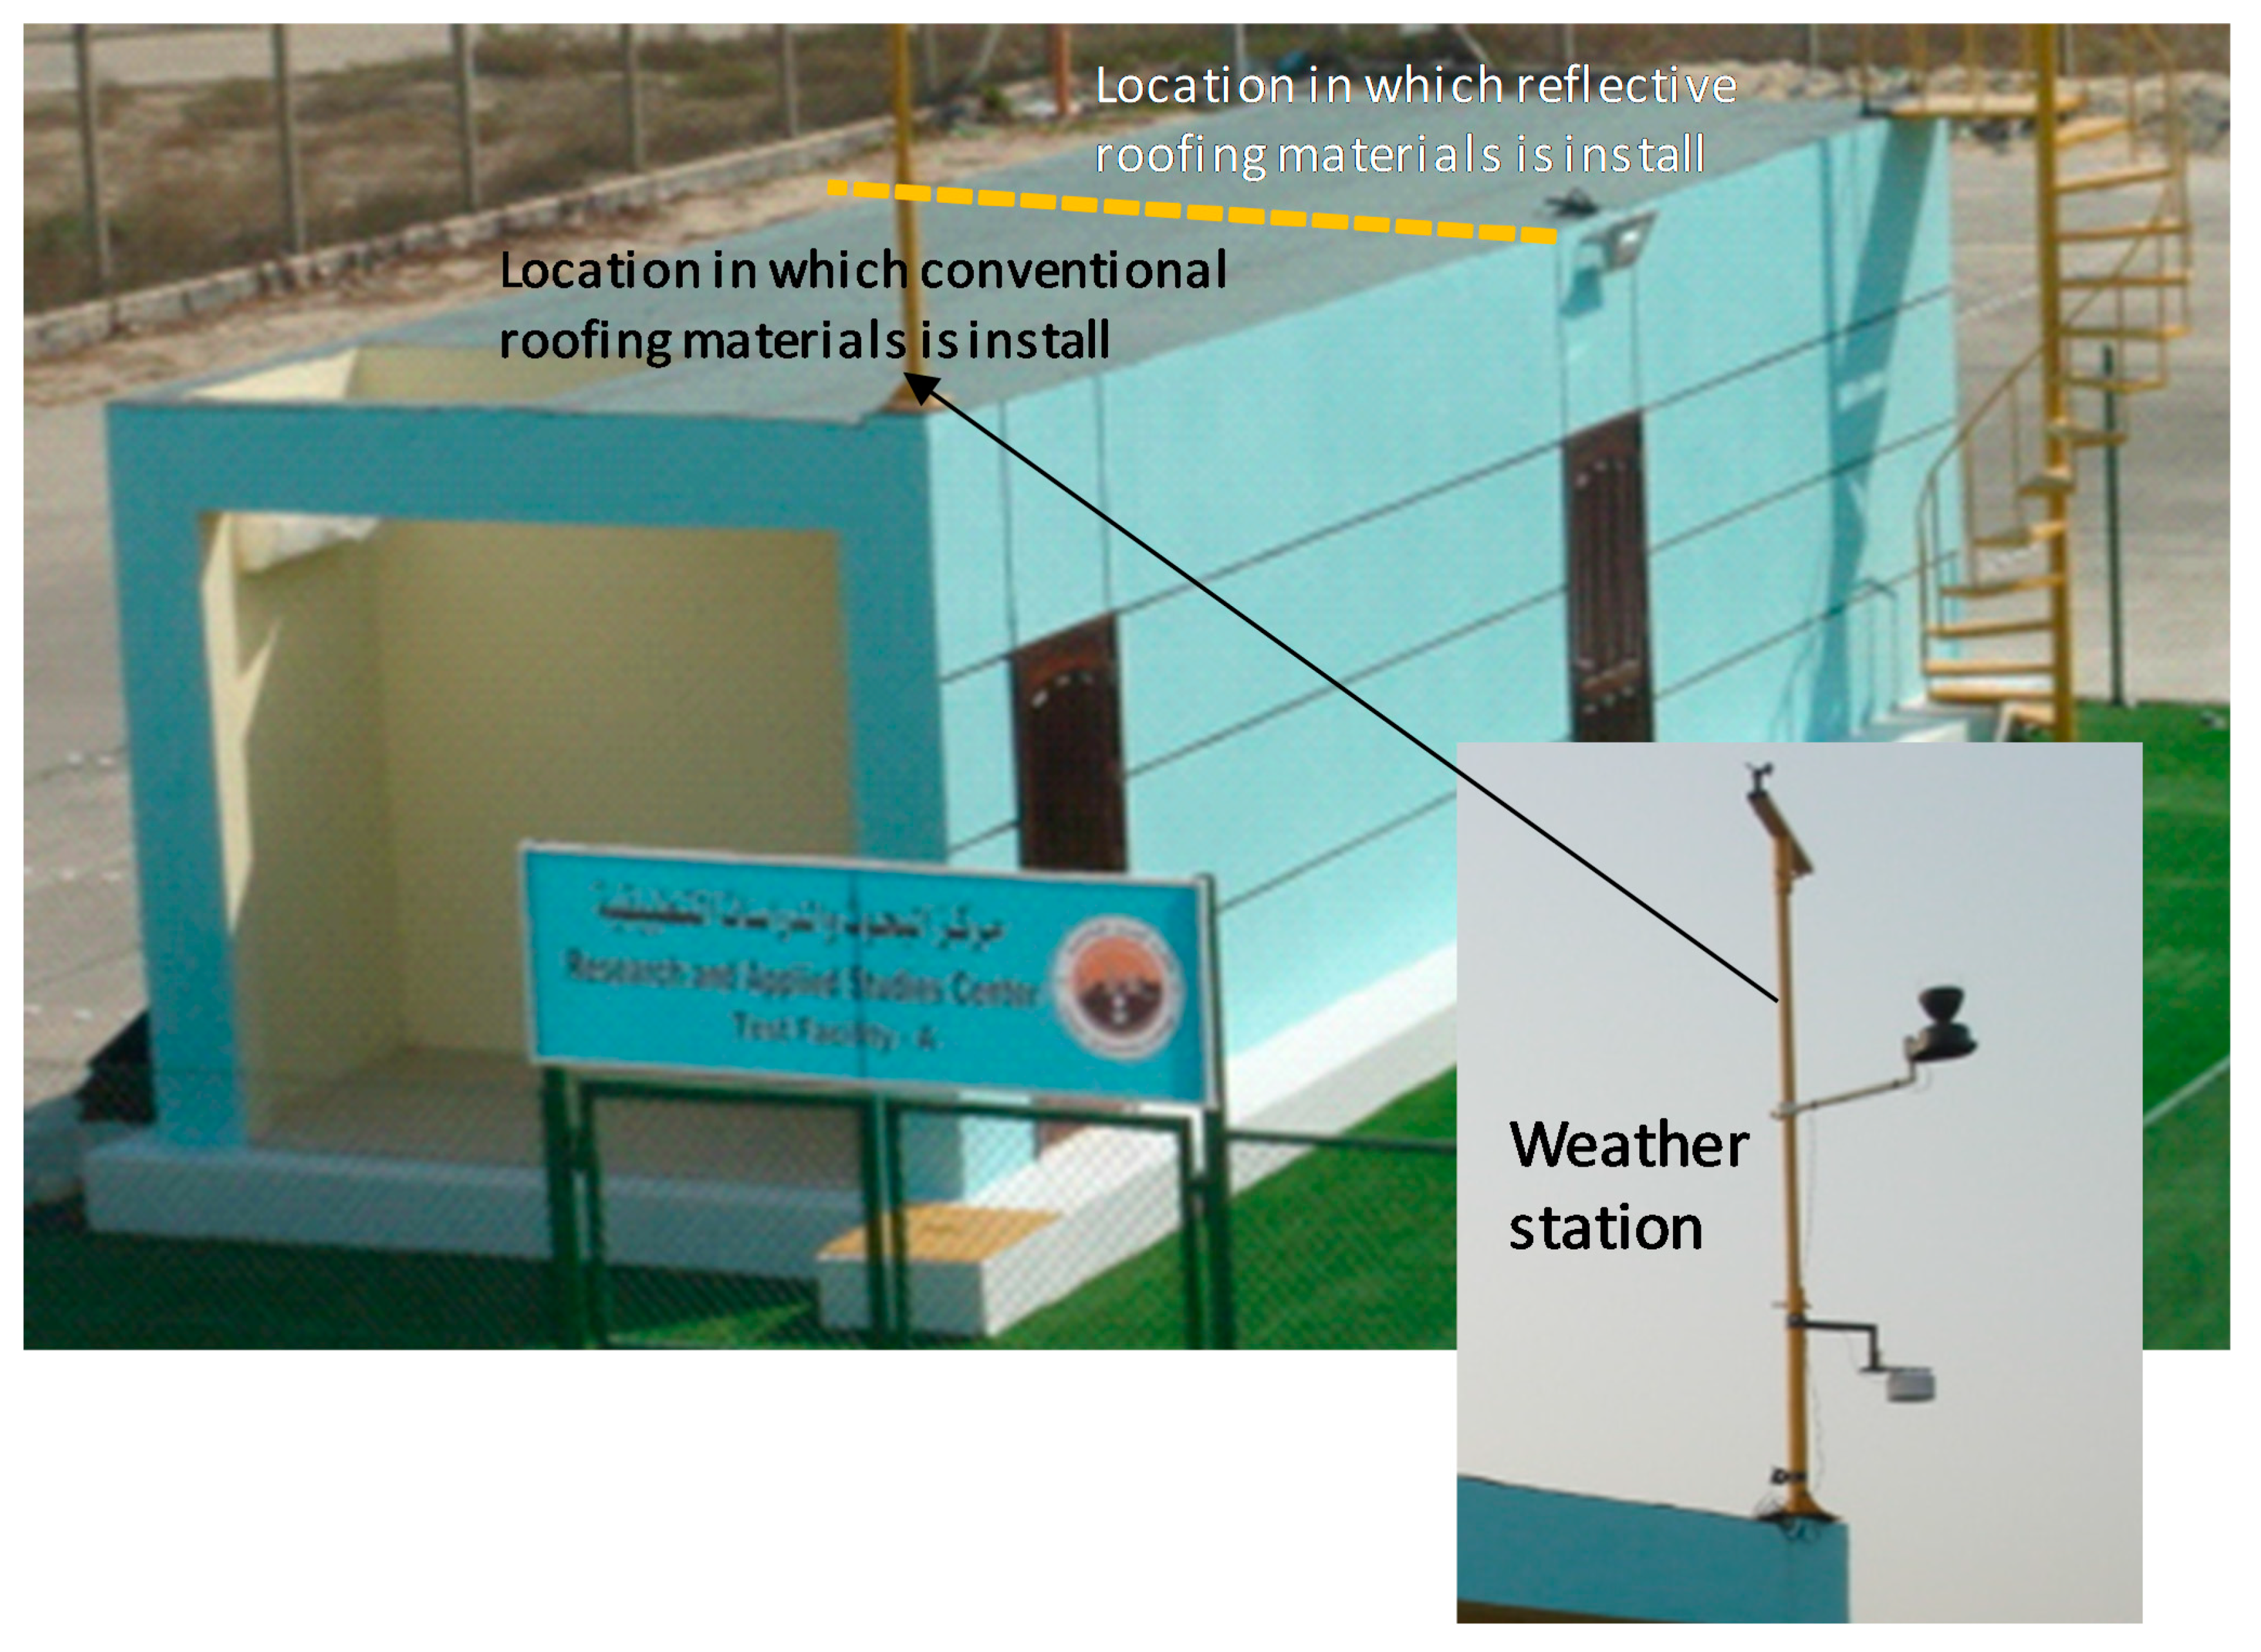
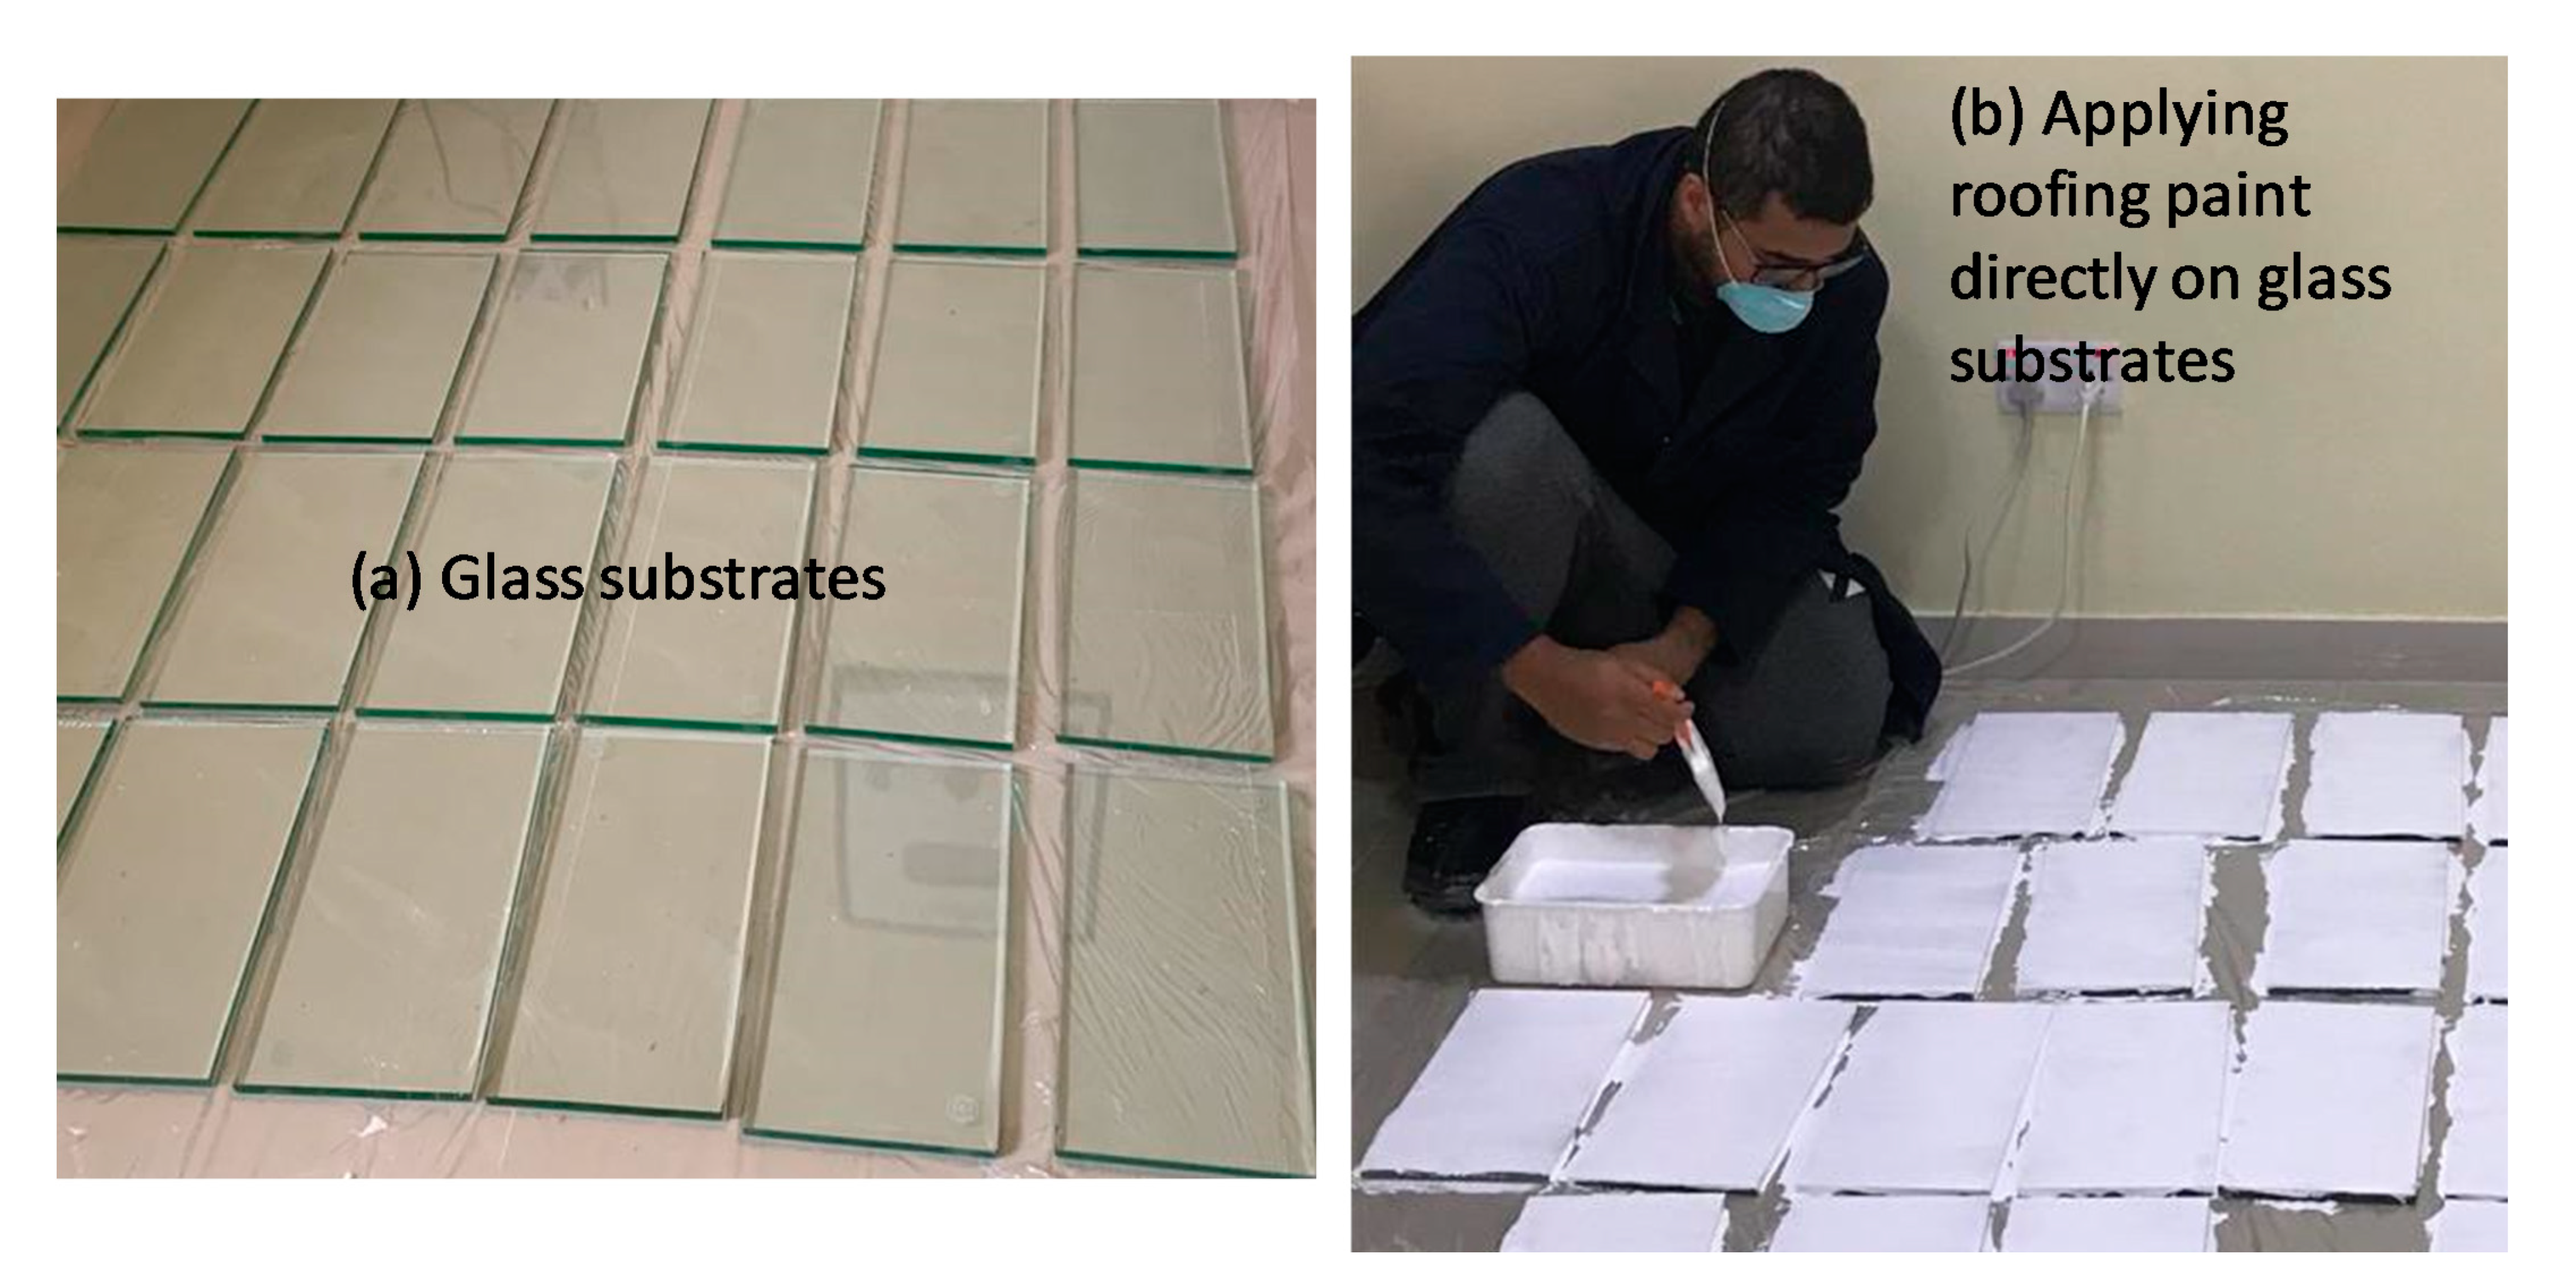
It was not possible to apply RCM on the bituminous membrane and simultaneously characterize the dust concentration on the RCM. Therefore, the RCM was applied on glass samples in order to be able to remove each sample and measure the dust concentration at different exposure times. The RCM was applied on two sets of specimens, called set-A (for conducting dust characterization) and set-B (for conducting cleaning procedure). As shown in Figure 2, the substrate of each specimen was made of glass having a dimension of 330 mm × 165 mm × 8 mm each. Every set (25 specimens in total) was installed on a part of the roof of the JUC test facility (see Figure 1). As shown in Figure 2, the two sets were arrayed in 25 rows and two columns.
(2)
The solar reflectivity was measured at different specified times for all specimens in each set. The time at which a specimen “i” (i =1–25, see Figure 2) was removed for conducting dust characterization (in set-A) and conducting cleaning process (in set-B) called “ti”. For all specimens in set-A and set-B, the inserted table in Figure 2 provides a list of all values for ti in which the measurements for both dust characterization and reflectance were made.
(3)
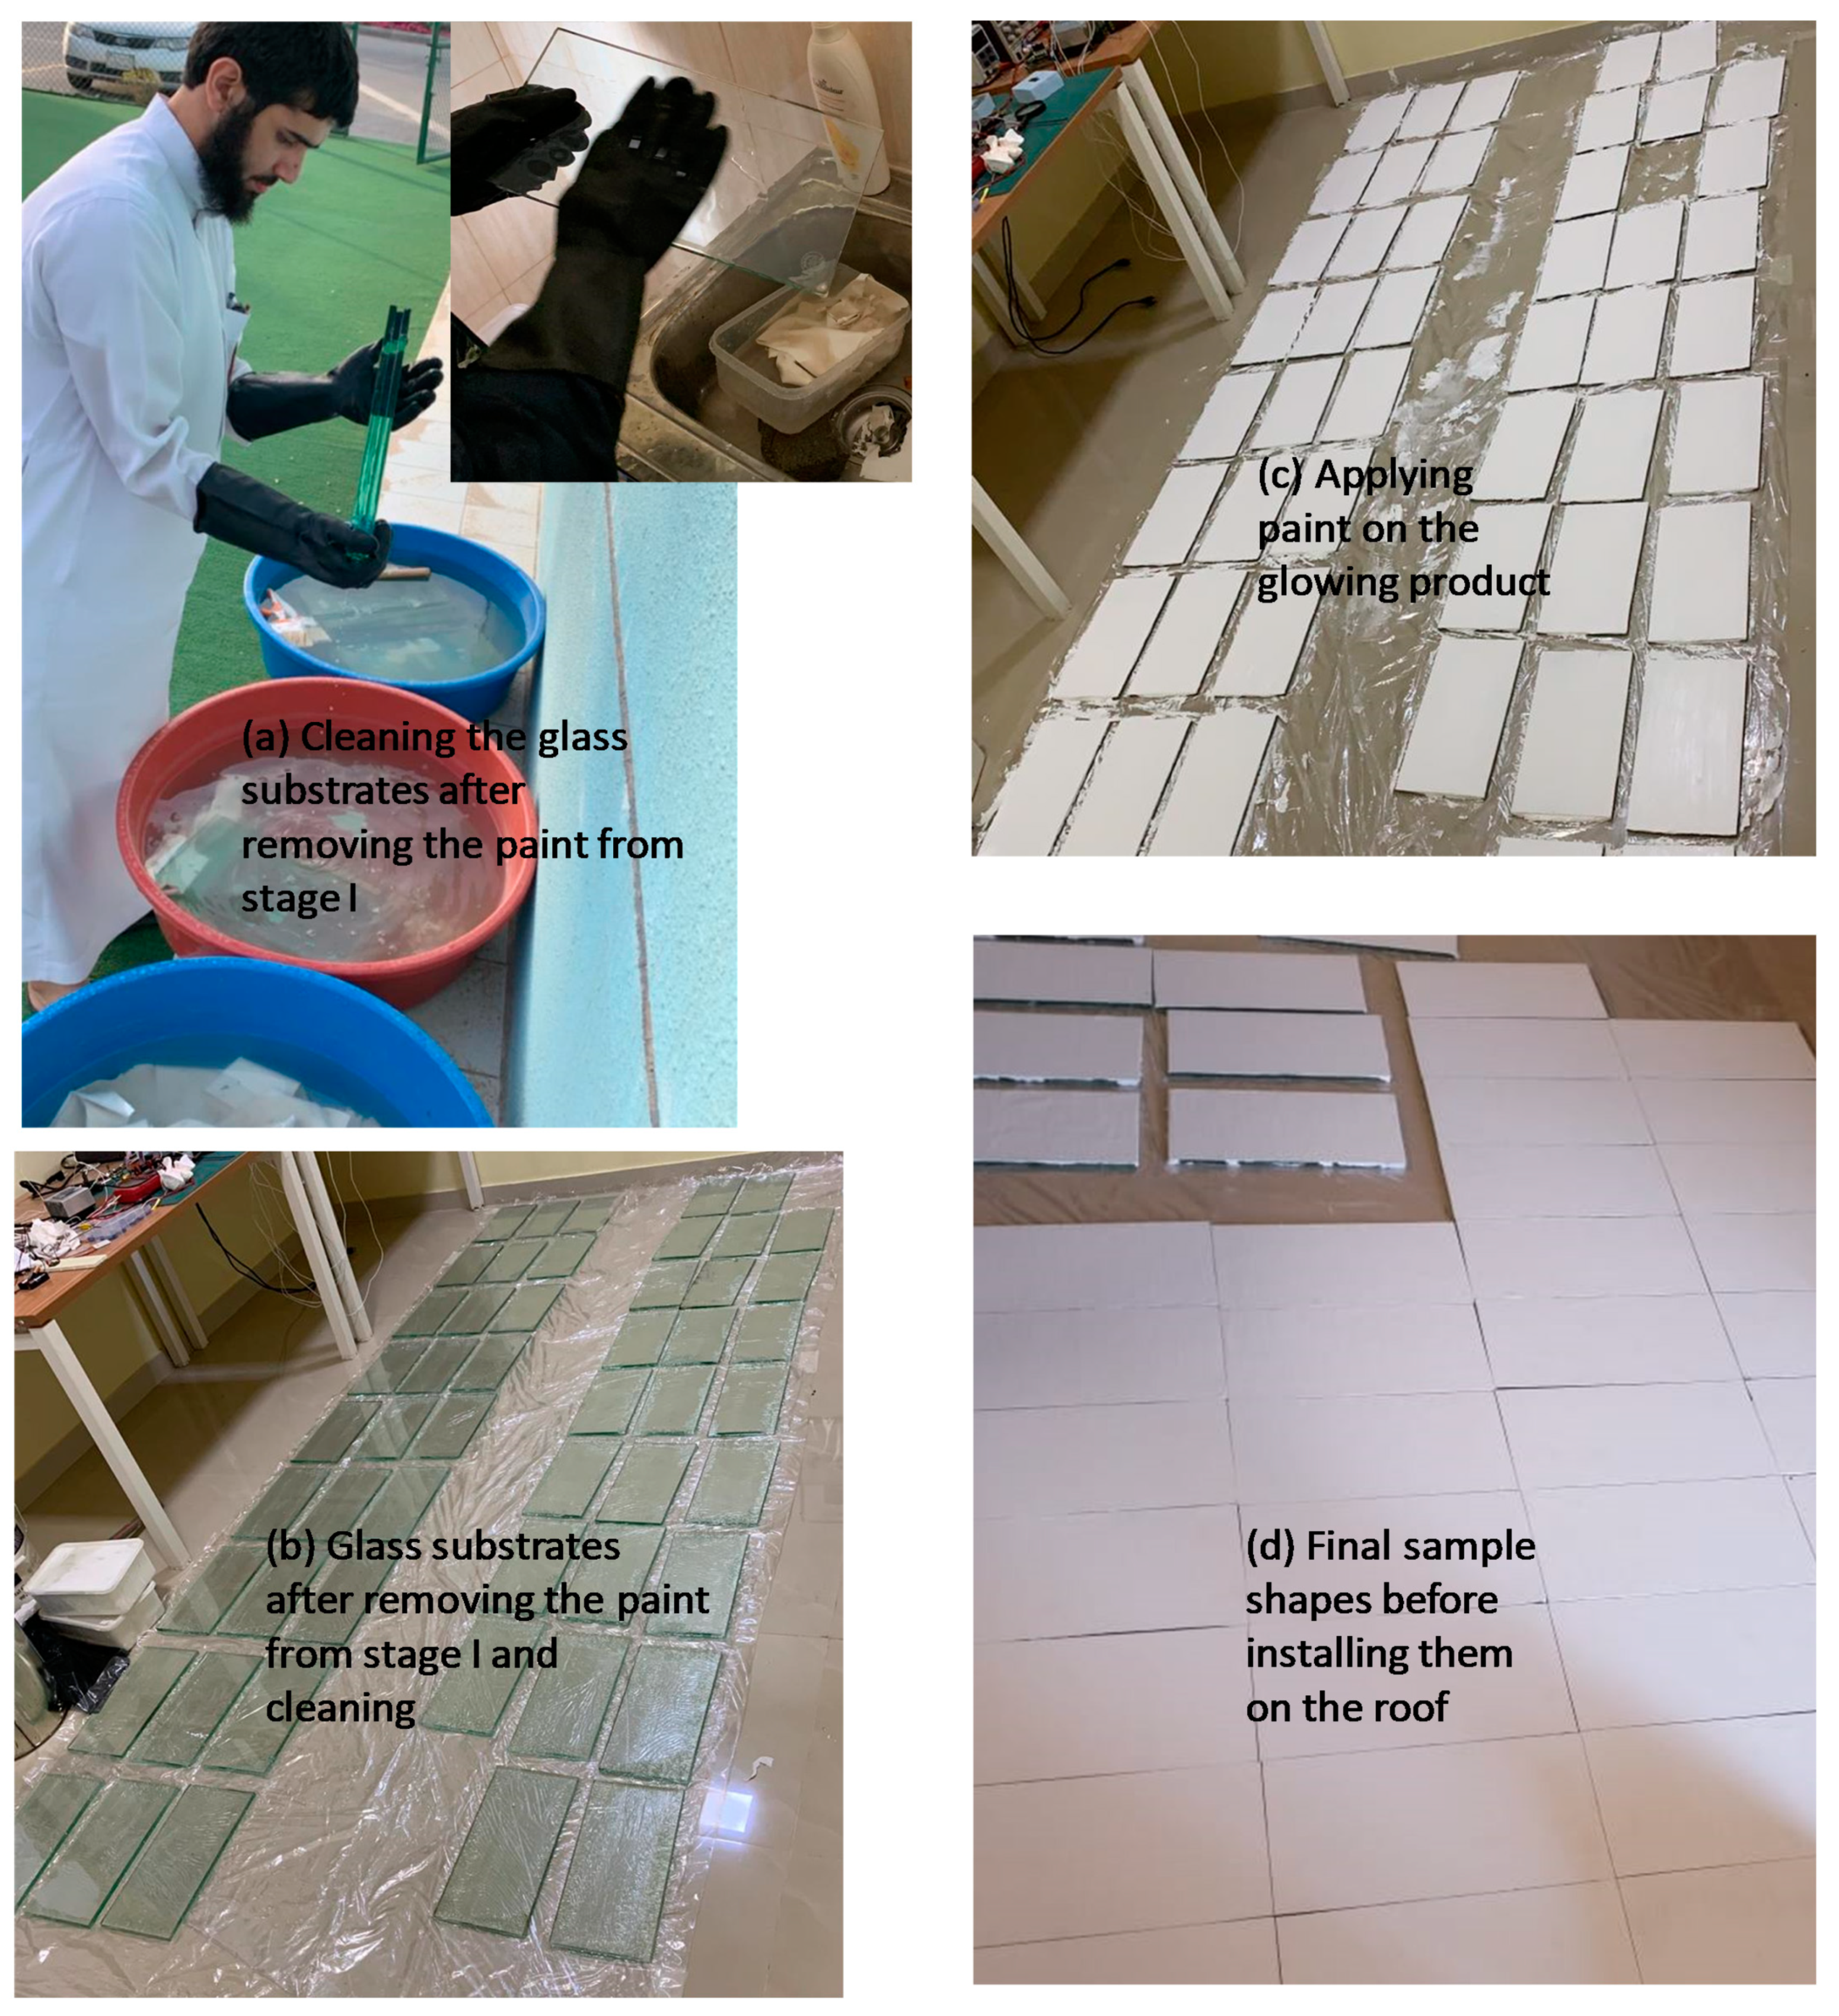
Cleaning processes were conducted for the surface of each specimen in set-B in a number of steps: firstly, wiped to simulate the wind action, then rinsed to simulate the rain action, and in a third step, the surface was washed with dishwashing detergent to simulate the homemade cleaning. Finally, the sample surfaces were treated with a mixture of sodium hypochlorite and sodium hydroxide to simulate professional cleaning. The solar reflectivity of the RCM on each specimen was measured after each cleaning step and then compared this measurement with its original value.
The test protocol described above was used to conduct the experimental tests. These tests were conducted in two stages (Stage-I and Stage-II) as provided next.

2.1. Experimental Setup in Stage-I

In building applications, the RCM should be applied directly on the external surface of building envelope (e.g., cementitious surfaces, vinyl siding, etc.). For the experimental setup in Stage-I that was started in 29 January 2019, the RCM was applied directly on the glass surface (Figure 3). Thereafter, the specimens were installed on the roof of the JUC’s test facility (Figure 1). During the course of conducting the tests, heavily and continuous rain events occurred twice. The rain has lasted for about two days in each rain event. This rain has caused the RCM to be deformed and slipped from the glass surface as shown in Figure 4 (after the first heavily rain event) and Figure 5 (after the second heavily rain event).
One of the goals of this research project was to monitor the dust/dirt accumulation on the RCM with time in order to investigate its effect on the RCM’s short-wave solar reflectivity when the RCM was subjected to the natural hot, humid, dusty and polluted climate of Jubail Industrial City. To arrive at this goal, the experimental setup was modified after finding an alternative solution. As such, the RCM manufacturer was contacted to help find a primer paint that can be applied between the glass surface and the RCM. Thereafter, the RCM manufacturer developed a suitable primer that was used in Stage-II as described next.

2.2. Experimental Setup in Stage-II

For the experimental setup in Stage-II, the RCM in Stage-I was removed from the surfaces of the glass specimens. Thereafter, the glass specimens were first cleaned with water followed by isopropyl alcohol solution (Figure 6a). Afterward, the primer paint was applied on the cleaned glass surfaces (Figure 6b), and then waiting for 18 h, but no more than 24 h. Next, with a smooth brush, the first coating layer of the RCM was applied. After waiting for 2 to 4 h until the first coating layer of the RCM was dried, the second coating layer of the RCM was applied, and then waiting for another 2 to 4 h. Finally, the third coating layer of the RCM was applied. The final shape of the RCM on the glass substrates is shown in Figure 6d. As shown in Figure 7, the number of the prepared specimens is 25 pairs. Each specimen pair consists of two pieces (A and B). The measurements for both solar reflectance and turbidity were conducted at different exposure times. In Stage-II, Figure 8a,b, respectively, show clean specimens (at the time of starting the test in 8 April 2019) and dusty specimens when these specimens were exposed to the natural climate of Jubail Industrial City. Summary of the procedure to obtain the test measurements is provided next.

2.3. Summary of the Procedure for Conducting Solar Reflectivity Measurement for Specimens in Set-B

The tests in Stage-II started in 8 April 2019. For a given exposure time, three measurements were taken on different locations on the specimen surface. These measurements are referred in this paper as B× (where × refers to the row number of the specimen, see Table 1). After measuring the specimen reflectance that was exposed to the natural weather for a specified time, the air plowing process to simulate the wind action was conducted. After conducting this process, three reflectance measurements were taken. These measurements are referred as B × a (Table 1). The next step was to conduct rinsing process to simulate the rain action with bottled water. After conducing this process, three reflectance measurements were taken on the specimen surface, which are referred as B × b (Table 1). Afterward, the process of cleaning the specimen with the detergent solution to simulate homemade cleaning was conducted. After the specimen was dried, three reflectance measurements were taken, which are referred as B × c (Table 1). Finally, after completing the measurements for all specimens in set-A and set-B shown in Figure 7, the cleaning process using sodium hydroxide and sodium hypochlorite mixture to simulate professional cleaning was conducted to investigate whether the solar reflectivity of these specimens can be restored to its original value. The reflectance measurements after conducting this process are referred as A × d for specimens in column A, and B × d for specimens in column B (Table 1).

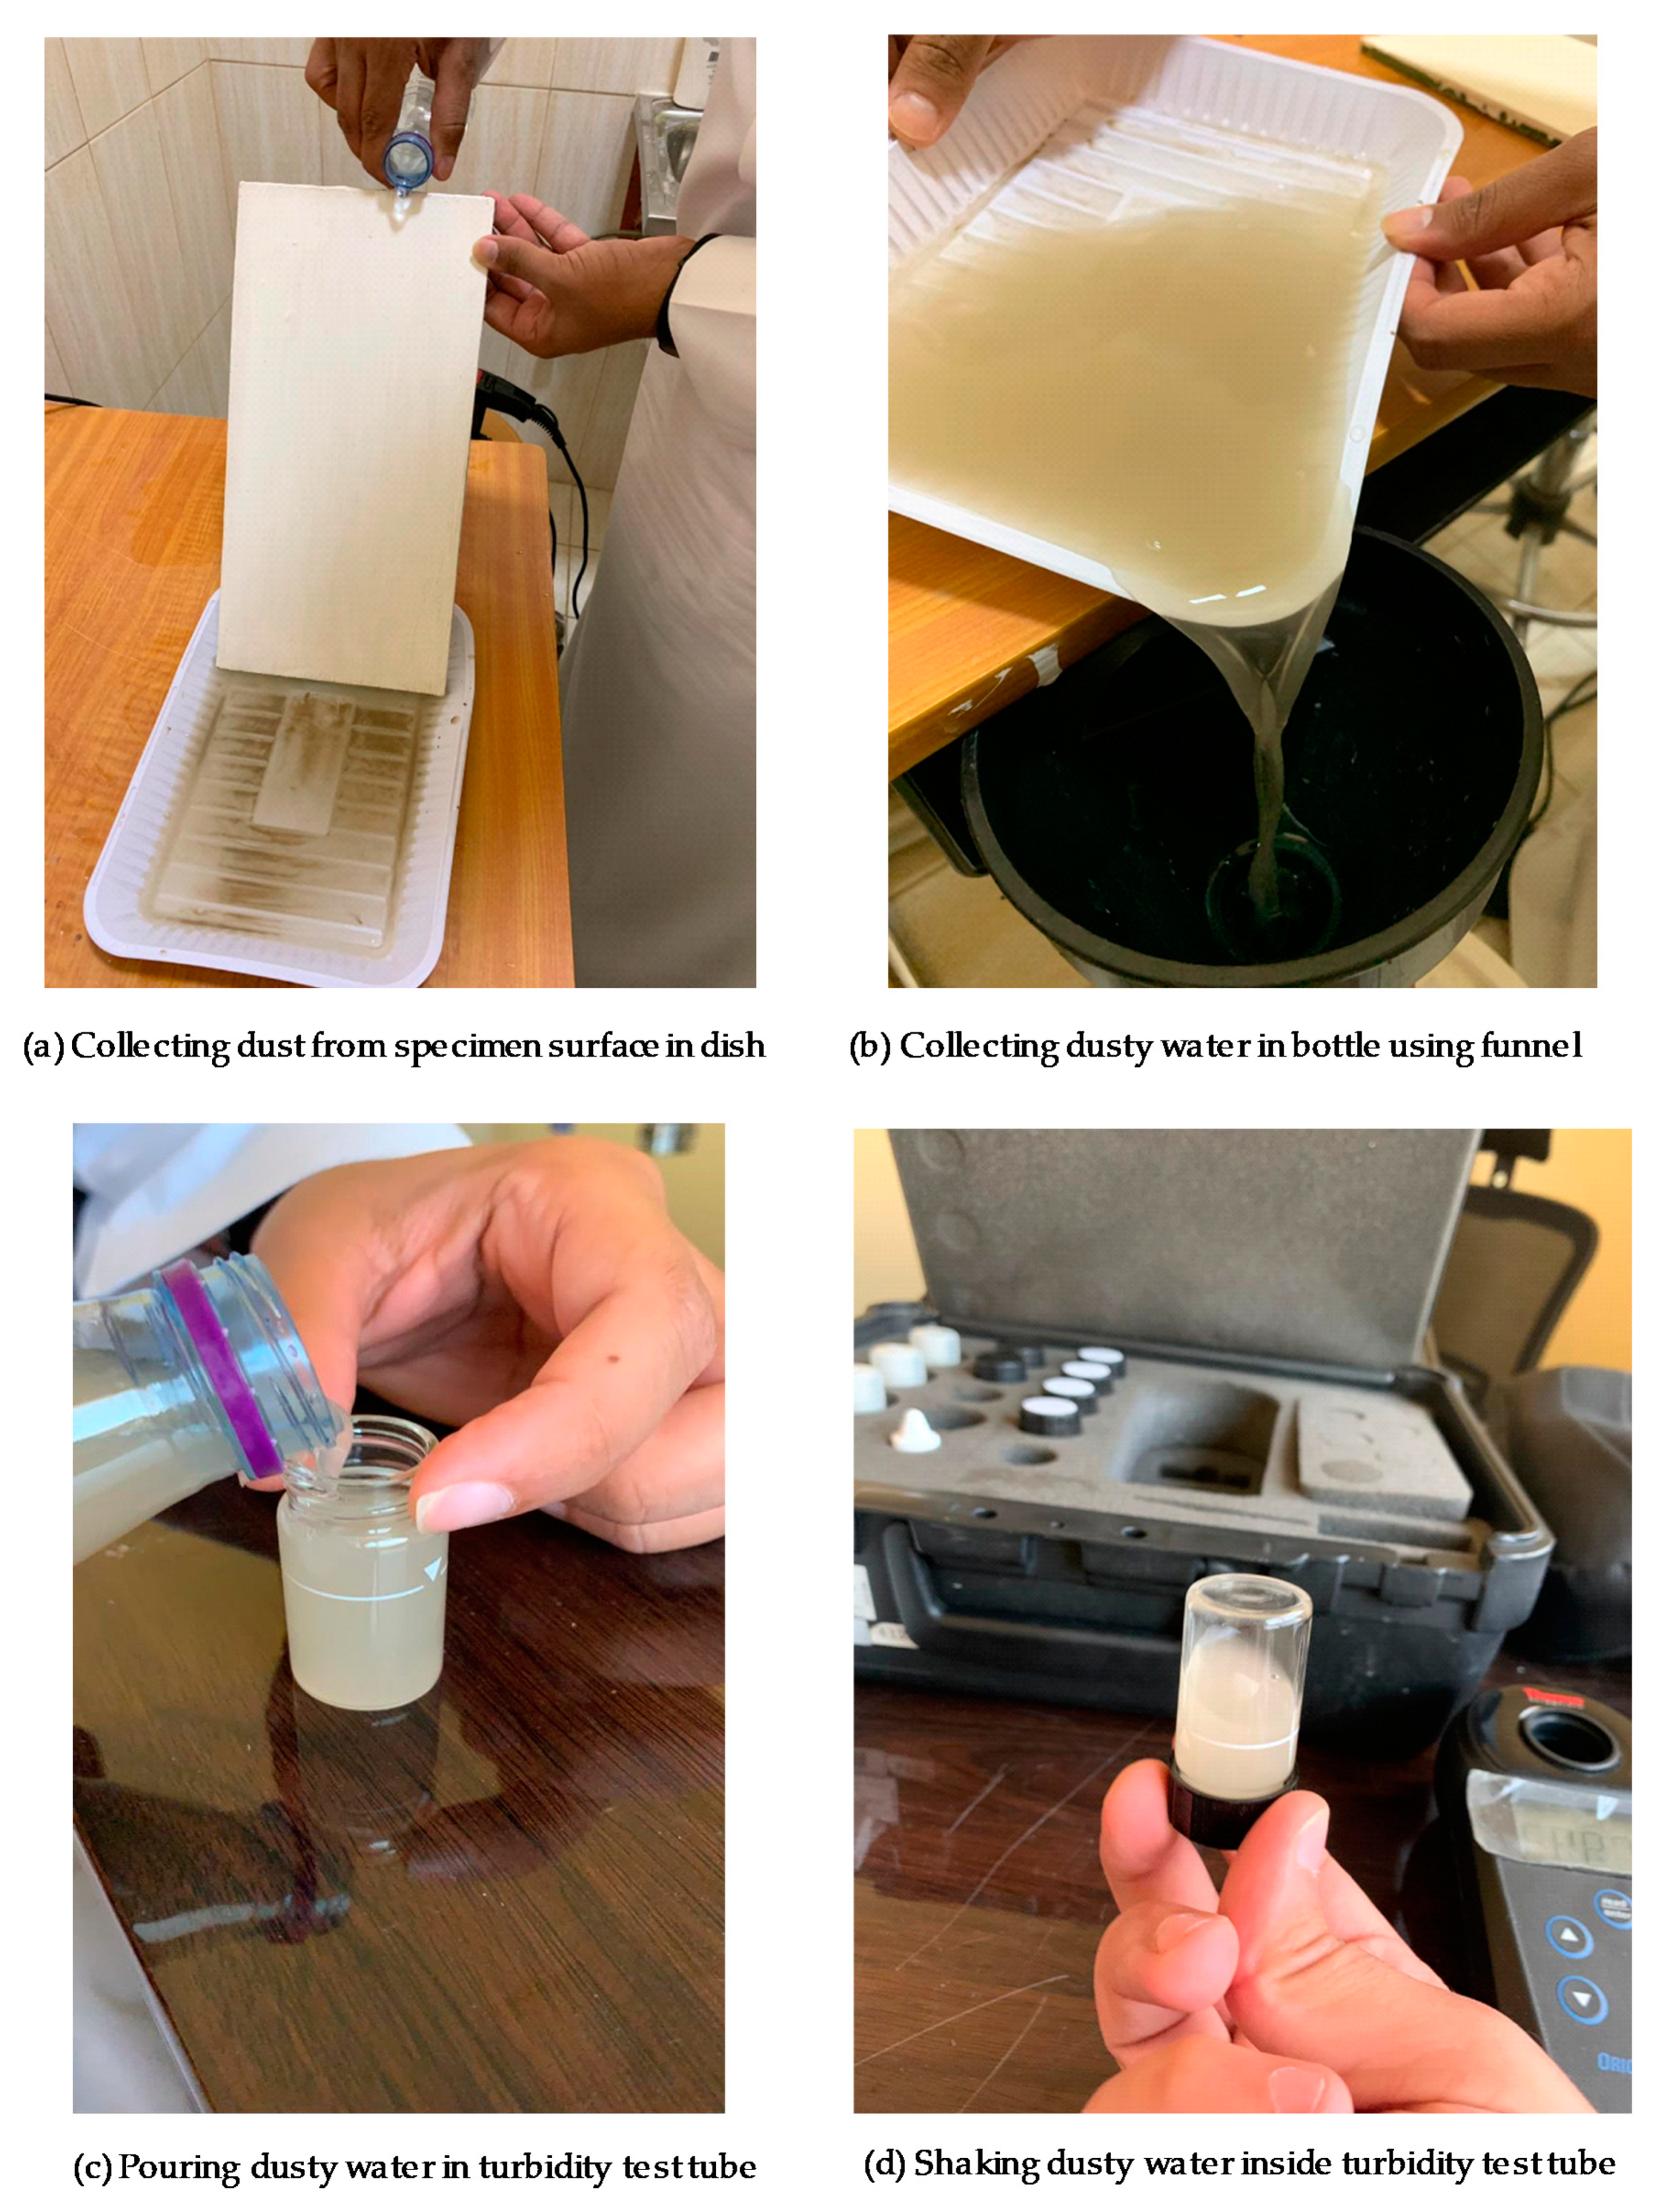
2.4. Summary of the Procedure for Conducting Turbidity Measurement for Specimens in Set-A

The specimens in set-A were used to characterize the dust concentration/intensity on the RCM. For a given exposure time, three reflectance measurements were taken by the Reflectometer on the specimen surface in set-A as described earlier for the specimens set-B. These measurements are referred as Ax (see Table 1). Thereafter, the accumulated dust on the specimen surface was collected using 330 mL water bottle in a dedicated dish (Figure 9a). Then, the dusty water in the dish was taken back to the water bottle using a funnel (Figure 9b). After that, the bottled water mixture was shaken sufficiently until the dust was uniformly distributed in the water before pouring it in the turbidity test tubes (Figure 9c,d). To consistently combine the dust with the water inside the turbidity test tube, it was flipped 180 degree five times, and then, waiting for 30 s before positioning the test tube in the turbidity meter to take the measurement. This procedure was repeated three times for each specimen.

3. Results

The experimental tests in Stage-II of this research project was started in 8 April 2019 and completed in 14 October 2019. The test results are presented in this section where the measurements for 25 specimens in set-A and another 25 specimens in set-B (see the arrangements of these sets in Figure 2 and Figure 7) were completed after 189 days (from 8 April 2019 to 14 October 2019).

3.1. Results of Dust and Dirt Accumulations on RCM for Specimens in Set-A

As indicated earlier, the specimens in set-A were used to study the effect of dust and dirt accumulation on the solar reflectivity of the RCM at different specified times when this coating was subjected to the natural weathering conditions of JIC. The dust concentration or intensity on the surface of the RCM was represented in this research study by the turbidity in terms of nephelometric turbidity units (NTU) [27]. The test results for the first 11 specimens that ware conducted in the period from 8 April to 8 July 2019 are provided in Figure 10, Figure 11, Figure 12 and Figure 13. Additionally, the test results for all specimens (25 specimens in set-A and 25 specimens in set-B) are available in [29].
For the first 11 specimens, Figure 10 shows the effect of dust concentration or intensity on the solar reflectivity of the RCM of the specimens in set-A. Also for the same specimens, Figure 11 shows the effect of the exposure time on the solar reflectivity of the RCM of the specimens in set-A. These figures provide the reflectivity in seven wavelength bands, namely, (1) λ: 335–380 nm, (2) λ: 400–450 nm, (3) λ: 480–600 nm, (4) λ: 590–720 nm, (5) λ: 700–1100 nm, (6) λ: 1000–1700 nm and (7) λ: 1700–2500 nm as well as the average reflectivity over all these seven wavelength bands.
It is important to note that every measurement for the reflectance that is presented in this research study is the average value of three measurements that were taken at different locations on the surface of the RCM. As well, every measurement for the turbidity is the average value of three measurements. At no dust/dirt accumulation on the surface of the RCM, Figure 12 and Figure 13 also show the reflectance of the RCM in the infrared region of light that was reported by the RCM manufacturer, which is 94.8%. Furthermore, at no dust/dirt accumulation on the surface of the RCM, its reflectance was measured in this research study. This measurement was conducted right before installing the specimens in set-A and set-B on the roofing system of the JUC test facility (Figure 1). The obtained average value of the RCM reflectance in the infrared region of light was 95.5%; whereas the lowest value was 95.3%, and the highest value was 95.7%.

3.2. Results of Conducting Cleaning Processes on RCM for Specimens in Set-B

The specimens in set-B were used to study the effect of conducting different cleaning processes on the solar reflectivity of the RCM at different exposure times. Before conducting the cleaning processes, the reflectance of the specimen was measured (B×, × refers to row number of the specimen in set-B). As shown in Table 1, the cleaning procedure included: (i) air plowing process to simulate the wind action (B × a), (ii) water cleaning/rinsing process to simulate rain action (B × b), and (iii) washing with dishwashing detergent process to simulate homemade cleaning (B × c). After completing the tests for all specimens in set-B, a final process to simulate professional cleaning (B × d, see Table 1) was conducted in which a chemical cleaner available in the GCC markets (mixture of sodium hydroxide and sodium hypochlorite) was used to find out whether this cleaning process can lead to bringing the short-wave solar reflectivity of the RCM to its original value (94.8%).
Figure 14 (for specimen 1, exposure time of 3 days), Figure 15 (for specimen 6, exposure time of 29 days) and Figure 16 (for specimen 11, exposure time of 91 days) show the impact of the cleaning processes on the reflectance of the RCM in the InfraRed region of light and the associated average values over all wavelength bands. At no dust/dirt accumulation on the surface of the RCM, these figures also show the reflectance of the RCM in the InfraRed region of light that was reported by the RCM manufacturer, which is 94.8%. The test results provided in this section are discussed next.

4. Discussions

This section discusses the effect of dust/dirt accumulations on the solar reflectivity of the RCM after different exposure times to the natural weathering conditions of JIC. The effect of conducting different cleaning processes on the solar reflectivity of the RCM is also discussed.

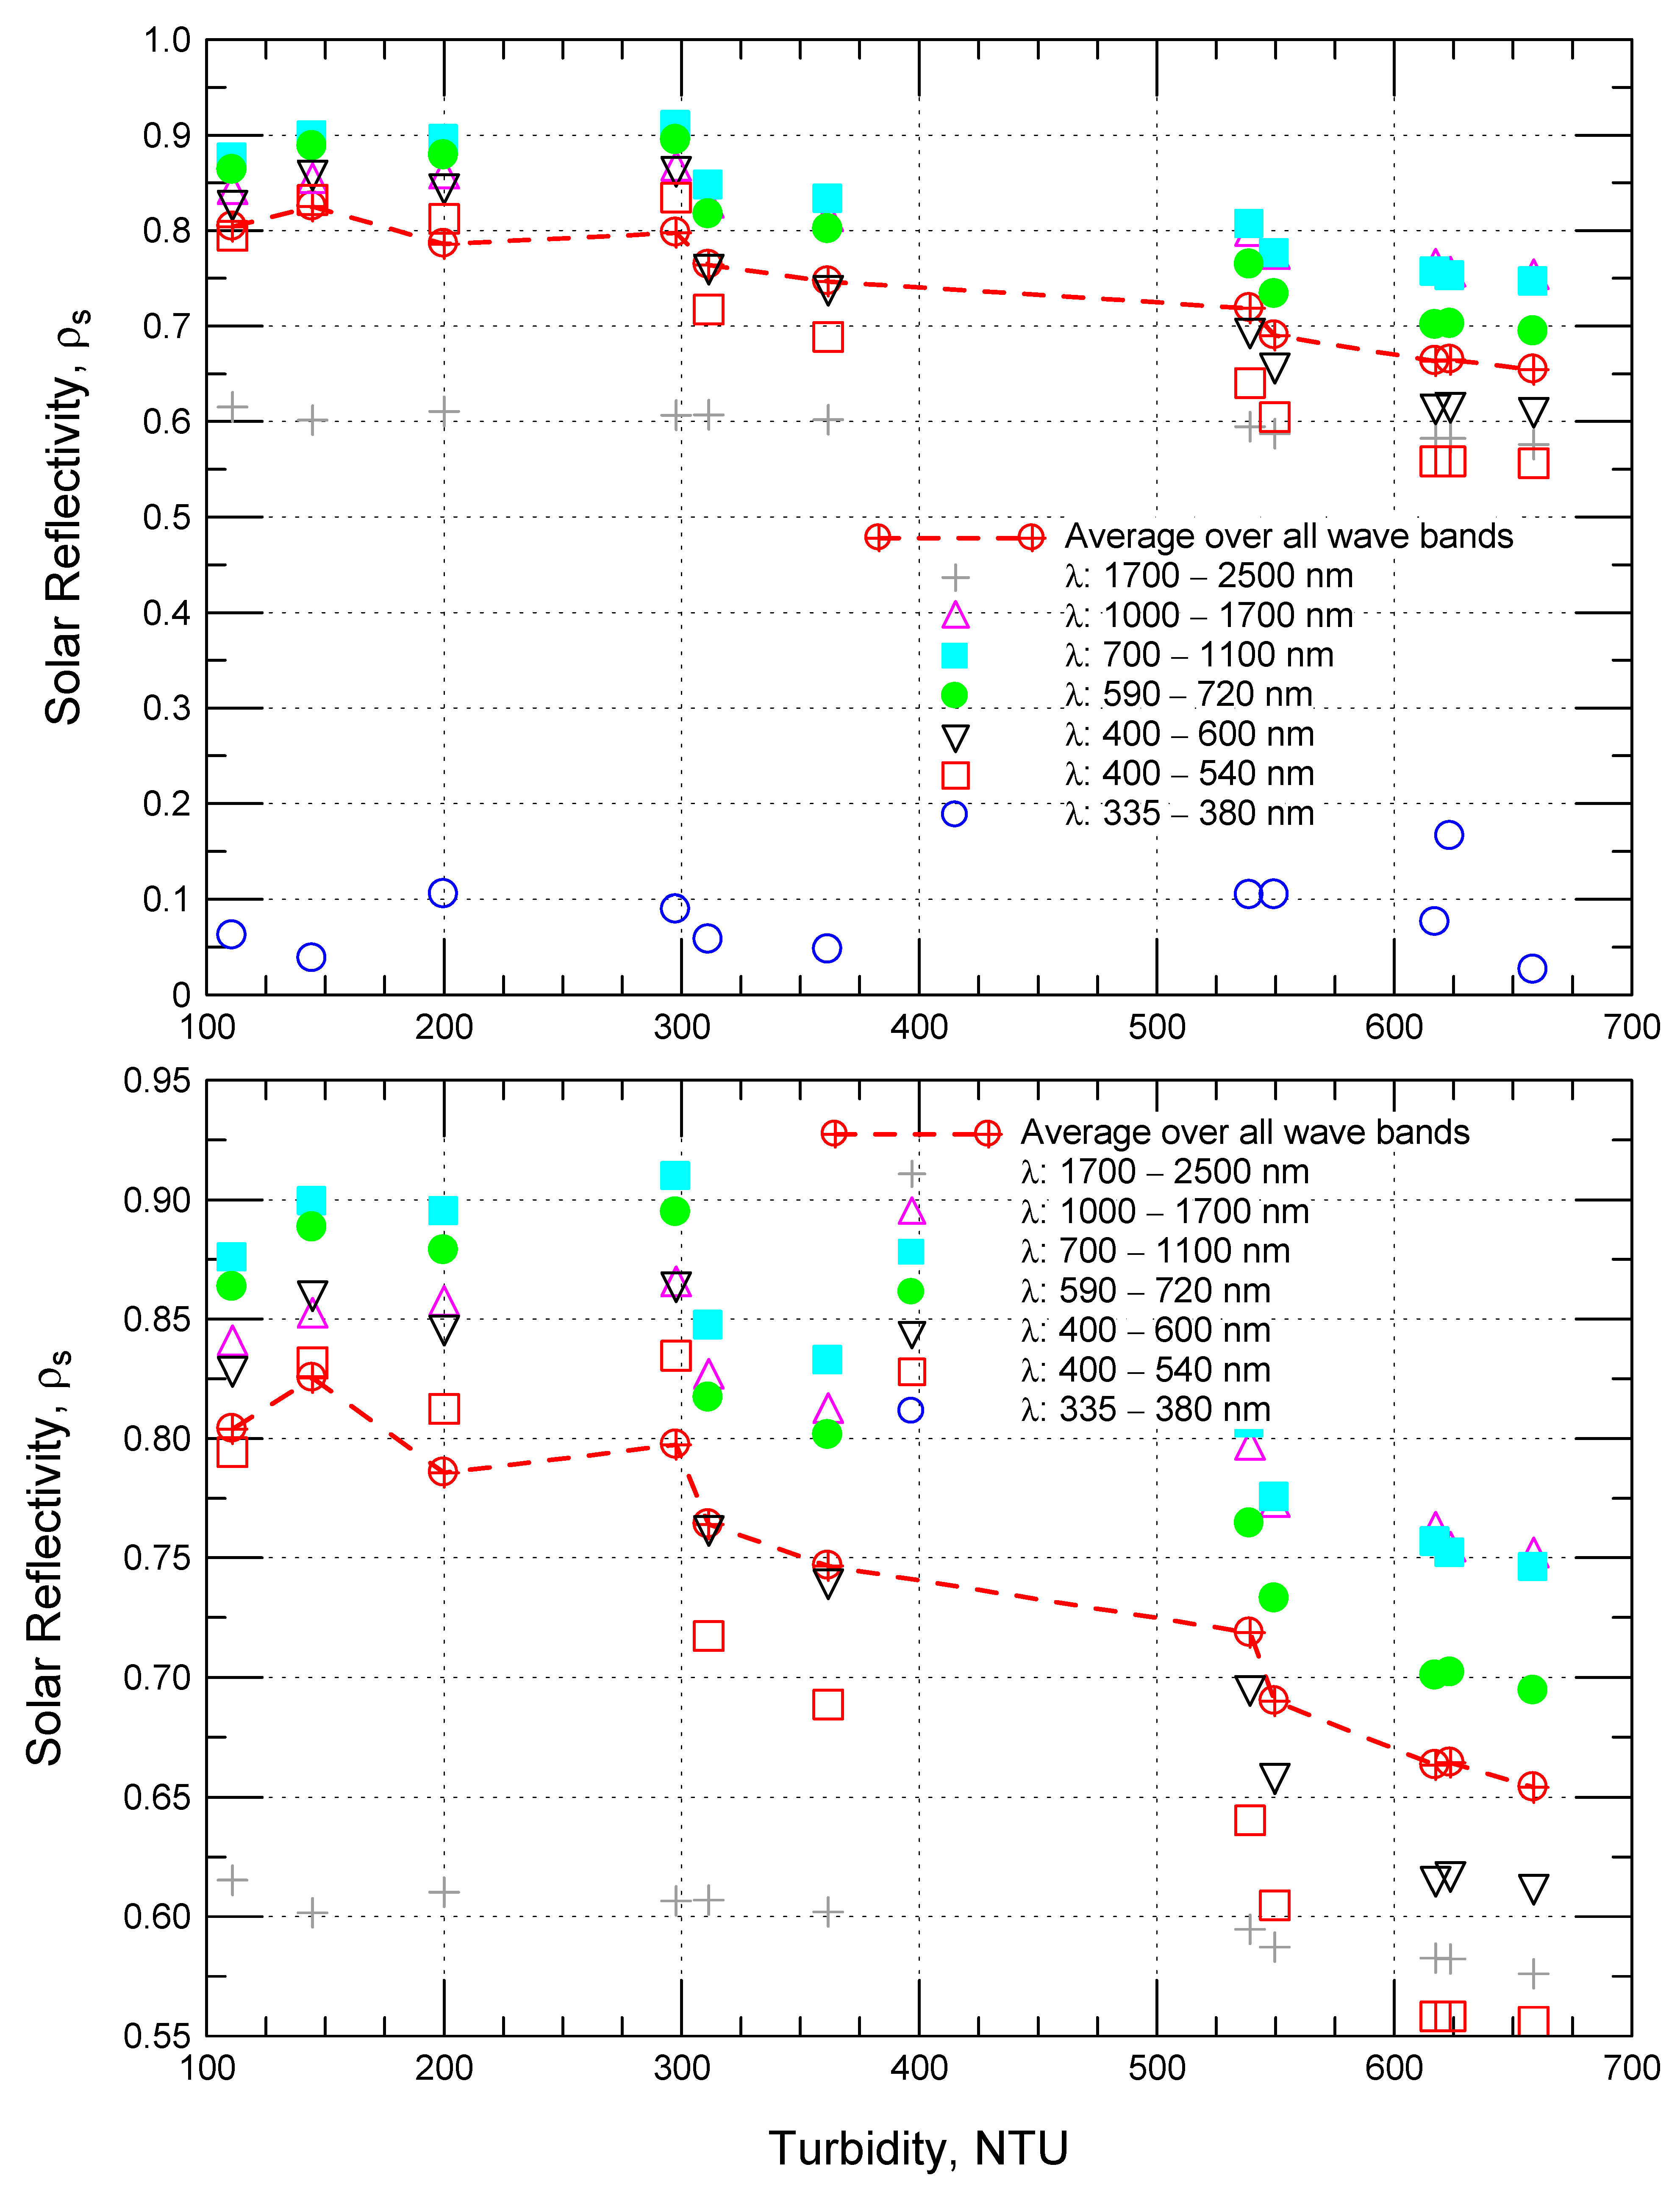
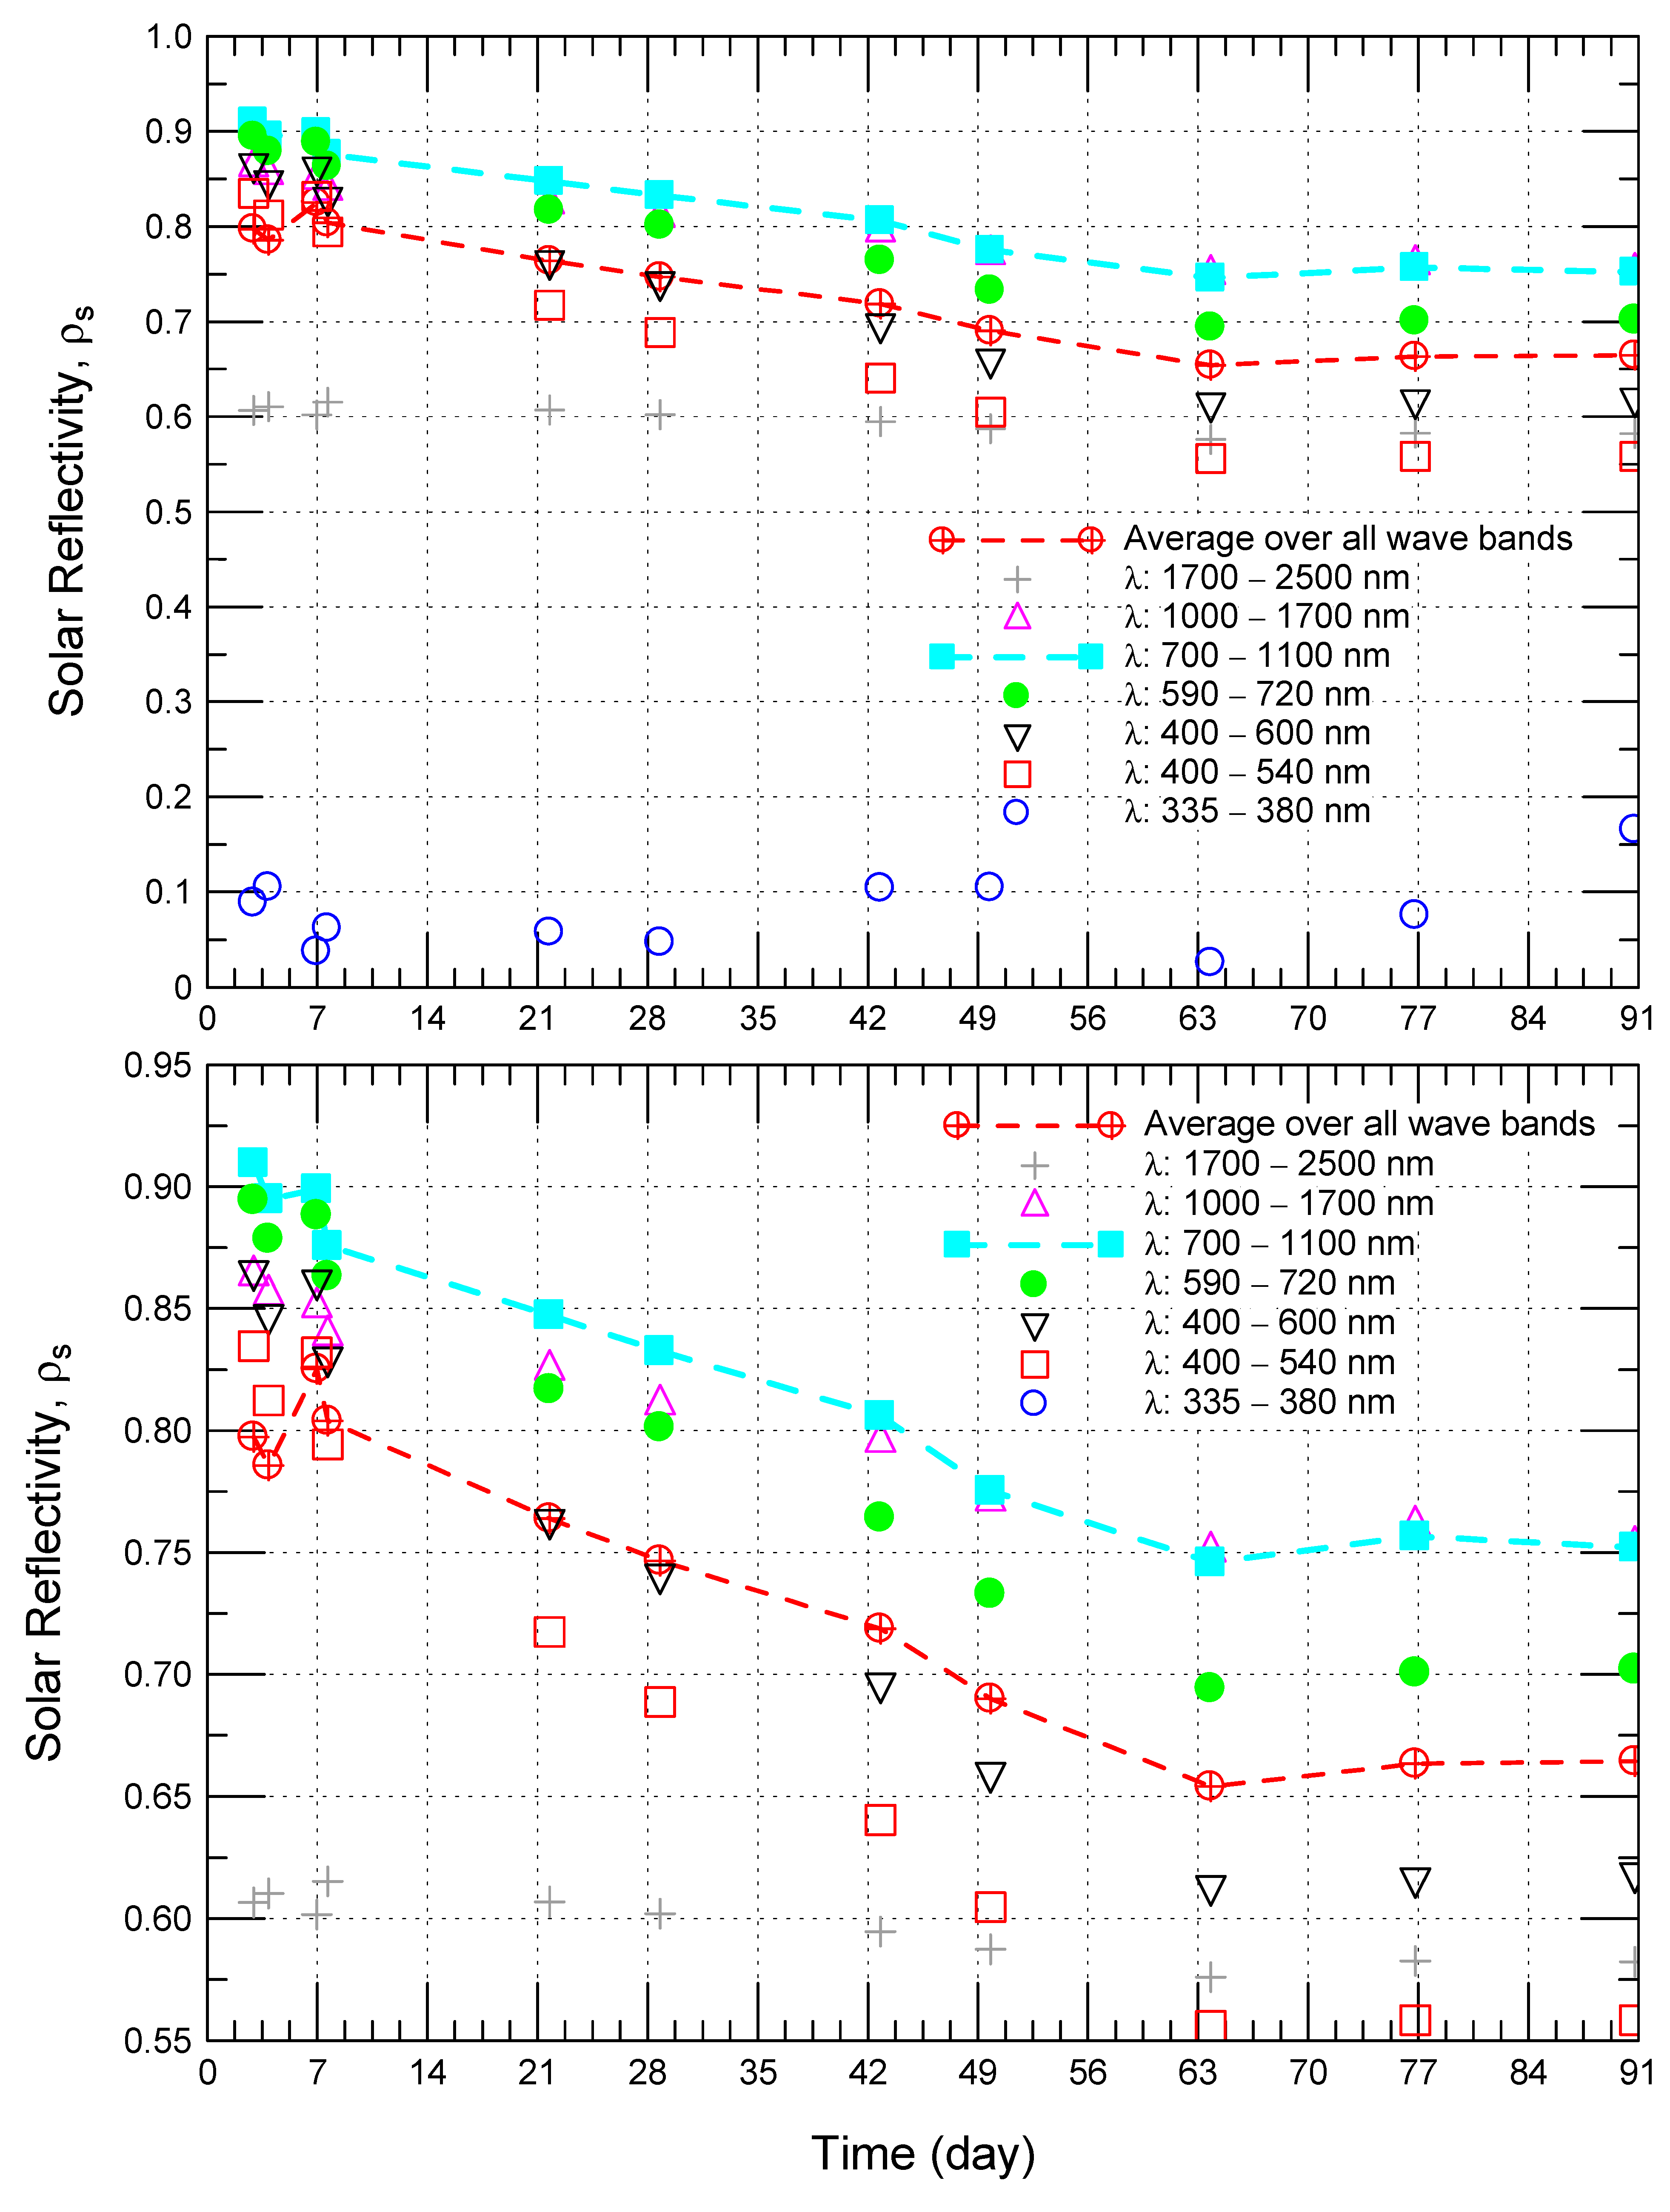
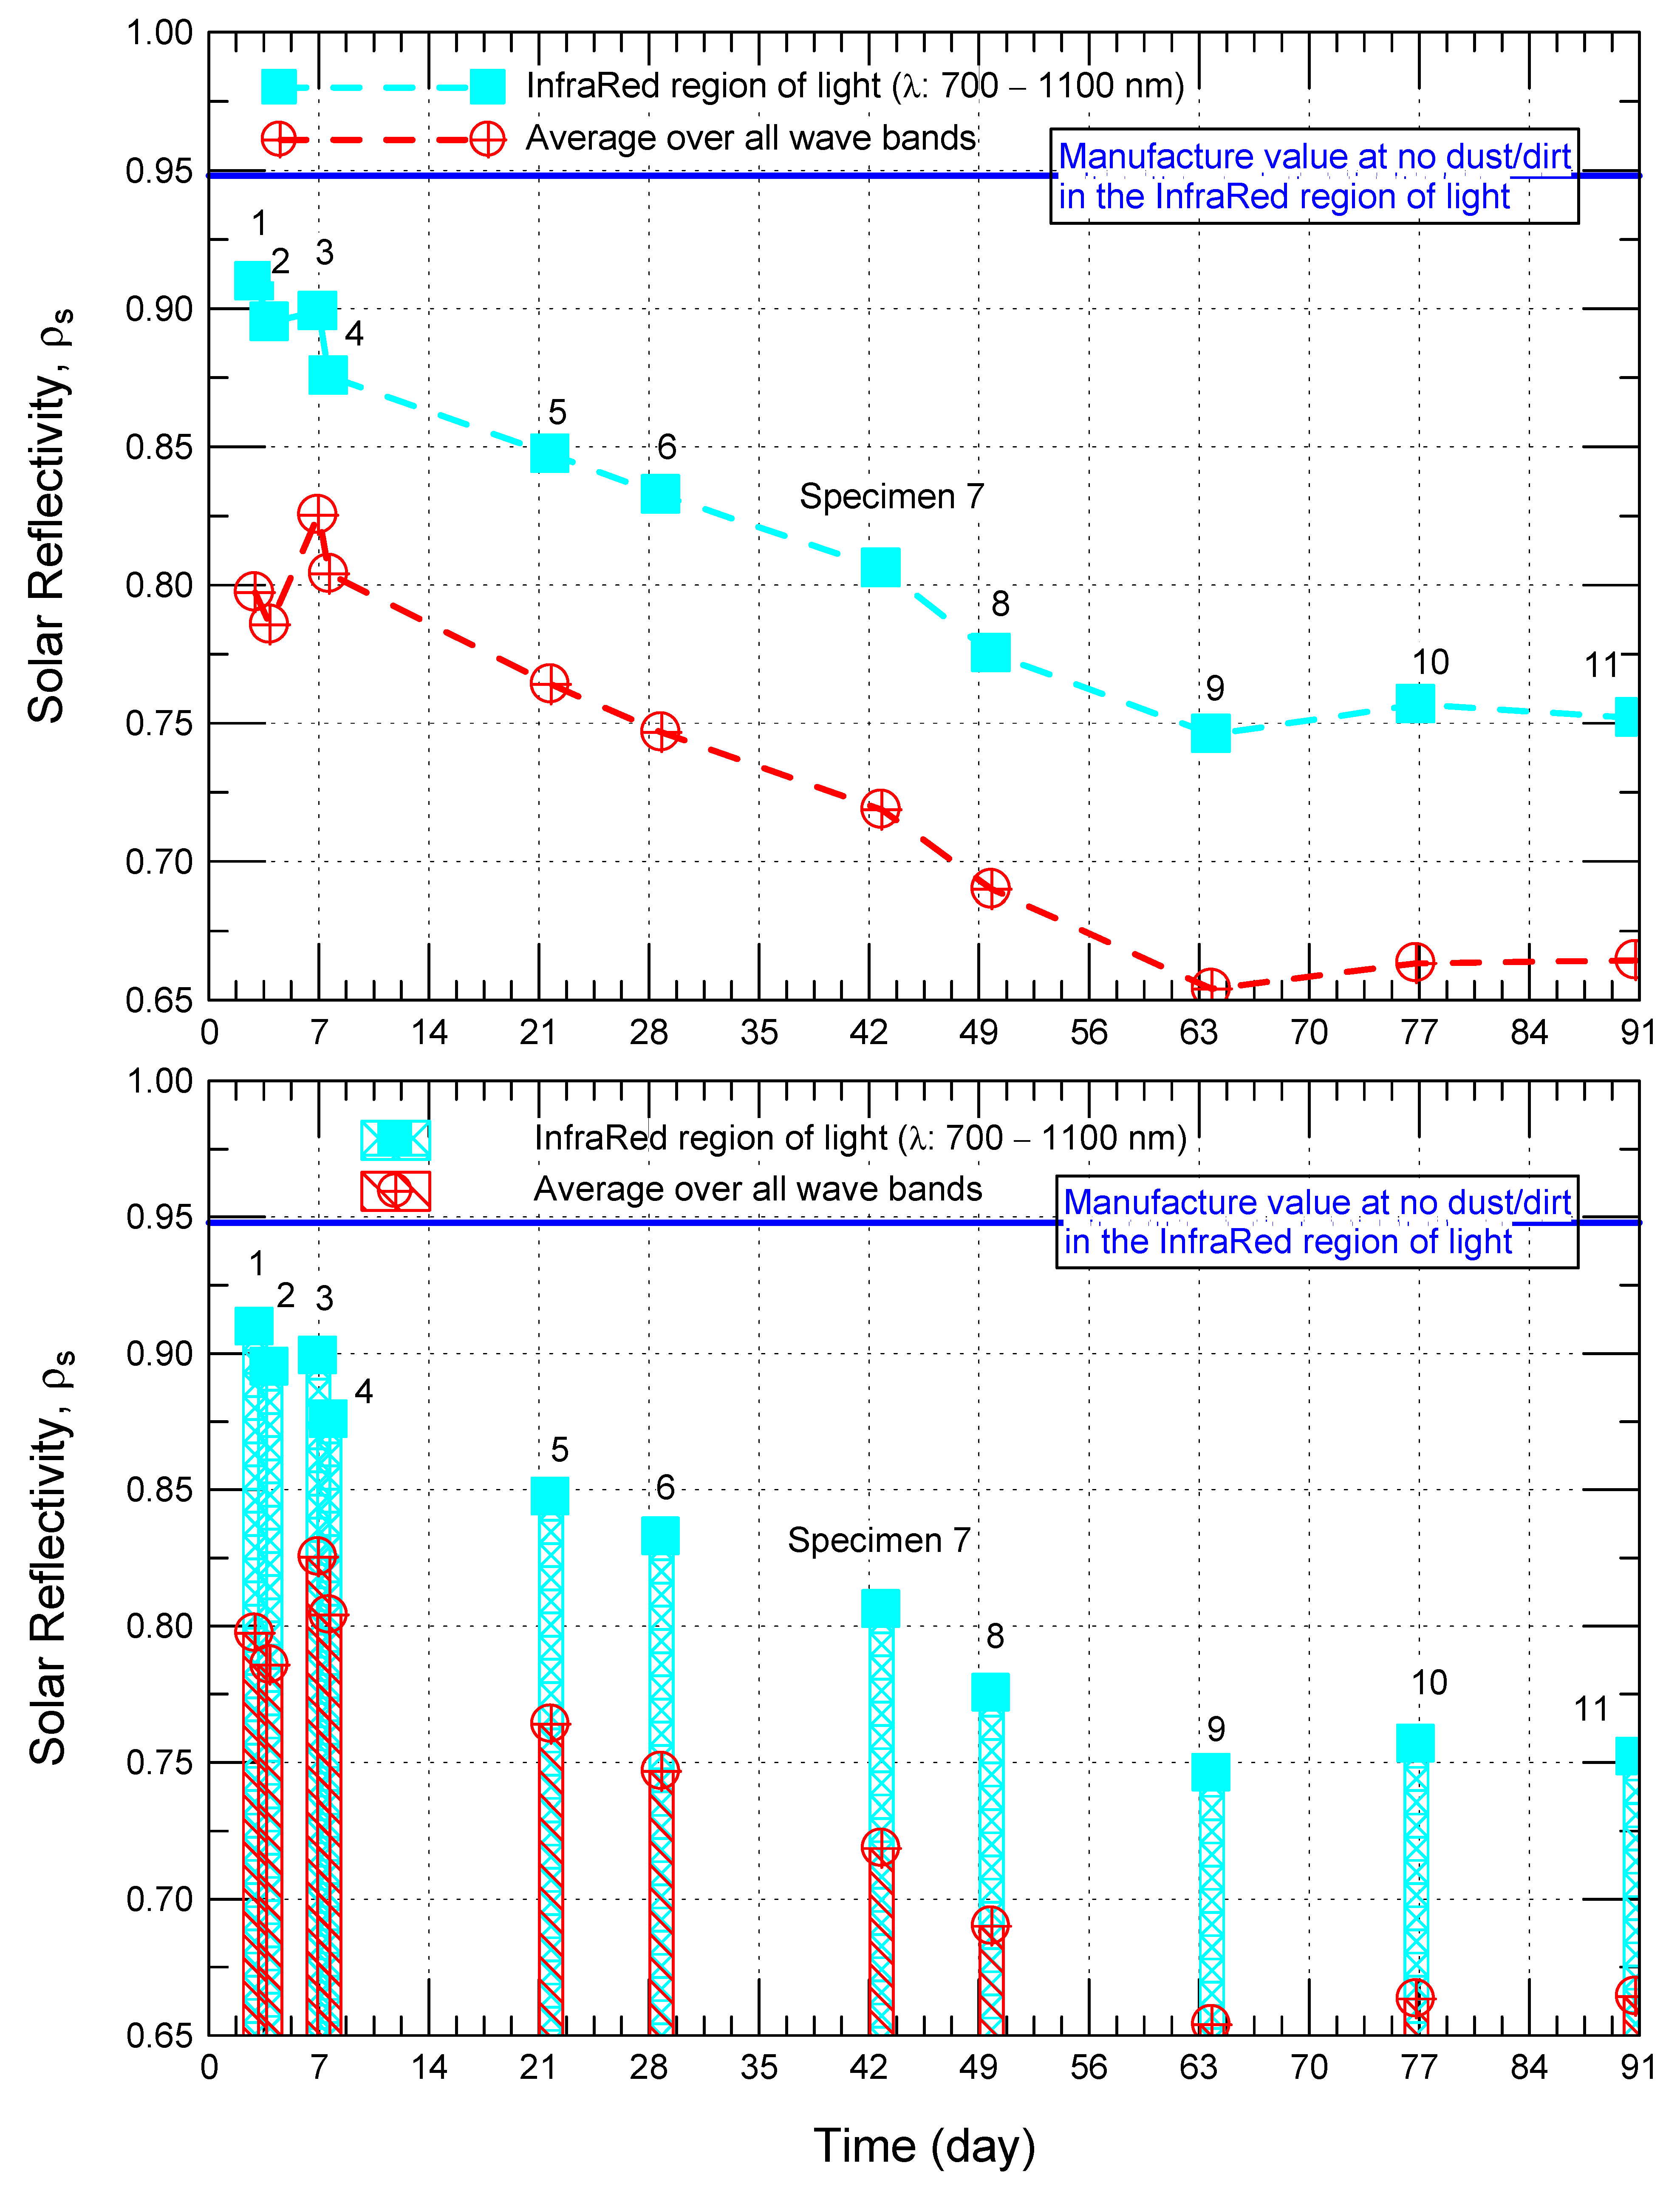
4.1. Effect of Dust and Dirt on the Solar Reflectivity of the RCM for Specimens in Set-A

The energy of the rays of short wavelength band (e.g., 335–380 nm wavelength band) is high in relation to the other long wavelength bands. This high energy can result in that most of the rays of short wavelength band can penetrate and/or be absorbed by the object that is subjected to. As such, the reflectance value of the rays of short wavelength band on the surfaces of the object is small. In this study, the reflectance of the surfaces of RCM specimens was measured using the reflectometer for one wavelength band that is considered among the short wavelength bands, which the 335–380 nm wavelength band. Consequently, Figure 10 and Figure 11 show that the measured reflectance values of the RCM for the 335–380 nm wavelength band are not only the lowest values in relation with other wavelength bands but also these values are independent on the dust concentration/intensity (i.e., turbidity).
For cool/white/reflective roofing system applications, the infrared region of light is the region of interest in which the range of the solar radiation wavelength is 700–1100 nm. Despite that the reflectance of the RCM are measured in the different wavelength bands, the focus in this study is on the measurements of the infrared region of light. As well, the average reflectivity over all wavelength bands are presented in this paper just for the purpose of comparisons of these values with that in the infrared region of light. Throughout this paper, unless otherwise specified, the reflectance that corresponds to:
(a)
The infrared region of light is refereed as the short-wave solar reflectivity (ρs,λ), and
(b)
The average value over all seven wavelength bands provided earlier is refereed as the average reflectivity (ρa,λ).
The reflectance measurements of the RCM followed by the turbidity measurements for the specimen 1 in set-A were conducted in 11 April 2019 (i.e., after three days from the date of staring the tests). These measurements were completed in 90 days and 189 days, respectively, for the first eleven specimens and all specimens in set-A at different exposure times. Figure 12 and Figure 13, respectively, show the effect of dust concentration (i.e., turbidity) and the corresponding exposure time on the reflectance of the RCM in the InfraRed region of light and the associated average values over all wavelength bands. For a given exposure time, these figures show that the reflectance of the RCM in the InfraRed region of light is higher than the corresponding average value over all wavelength bands.
As shown in Figure 12 and Figure 13 for specimen 1 that was exposed to the natural weather for a period of 3 days, the average short-wave solar reflectivity (i.e., in the infrared region of light, λ: 700–1100 nm, ρs,λ) based on three measurements at different locations on the surface (90.6%, 92.1% and 90.2%) was ρs,λ = 91.0%, which is 3.8% lower than the manufacture value at no dust/dirt accumulation on the coating (ρs,λ = 94.8%). Note that the value of ρs,λ for specimen 1 (91.0%) is higher than the corresponding average value over all seven wavelength bands, ρa,λ (79.7%).
Figure 12 shows that the turbidity of specimen 1 that was exposed to the natural weather for 3 days (NTU = 298) is higher than that for specimen 2 (NTU = 200), specimen 3 (NTU = 145) and specimen 4 (NTU = 111) that were exposed to the natural and polluted weather for 4 days, 7 days and 8 days, respectively. In other words, the dust concentration on specimen 1 was higher than that on the specimens 2, 3 and 4. Under natural weathering conditions, this observation is common. This is because dust accumulation on a surface in such day can be reduced in the days after as a result of the wind effect. On the other hand, with no dirt accumulation (i.e., no contaminations) on the surfaces of specimen 1 through specimen 4, one should expect that specimen 4 with the lowest turbidity (111) to have the highest short-wave solar reflectivity compared to the specimens 1, 2 and 3. However, the effect of the dirt accumulation on the specimen 4 (with longest exposure time, 8 days) has resulted in the short-wave solar reflectivity of this specimen (ρs,λ = 87.6%) to be lower than the other specimens with shorter exposure time of 3 days, 4 days and 7 days for specimen 1 (ρs,λ = 91.0%), specimen 2 (ρs,λ = 89.5%) and specimen 3 (ρs,λ = 89.9%), respectively. Starting with specimen 4 and because no cleaning processes were conducted on the specimens in set-A, Figure 12 and Figure 13 show that the short-wave solar reflectivity decreases with increasing the exposure time until it reaches its lowest value (ρs,λ = 74.6% for specimen 9) after 63 days of exposure time. This is due to the increase in dirt and dust concentration on the surfaces of the specimens with increasing the exposure time. However, a further increase in the exposure time beyond 63 days has resulted insignificant effect on the short-wave solar reflectivity. For example, for the exposure time of 63 days, 77 days and 91 days, the short-wave solar reflectivities were approximately the same for the specimen 9 (ρs,λ = 74.6%), specimen 10 (ρs,λ = 75.7%) and specimen 11 (ρs,λ = 75.2%).

4.2. Effect of Cleaning Processes on the Solar Reflectivity of the RCM for Specimens in Set-B

Similar to specimens in set-A, Figure 14 through Figure 16 for specimens in set-B show that the reflectance of the RCM in the InfraRed region of light is higher than the corresponding average value over all wavelength bands. For specimen 1 that was exposed to the natural weather for a period of 3 days, Figure 14 shows that the short-wave solar reflectivity (ρs,λ) before conducting cleaning was 91.0%. Apply the air plowing process (B1a) has resulted in approximately no change in ρs,λ. When the B1a process was followed by the rinsing process (B1b), however, the measured ρs,λ (92.4%) was increased in respect of B1 (i.e., before cleaning) by 1.4%. Following the B1b process by the washing process with dishwashing detergent (B1c), the measured ρs,λ (94.2%) was increased in respect of B1 by the 3.3%. The measured value of ρs,λ (94.2%) after conducting the B1c process was approximately the same as the reported value by the RCM manufacturer at no dust/dirt accumulation (94.8%).
For specimen 6 that was exposed to the natural weather for a period of 29 days, Figure 15 shows that the measured ρs,λ before conducting cleaning was 82.9%. Apply the B6a process has resulted in an increase in ρs,λ (86.7%) by 3.8%. When the B6a process was followed by the B6b process, the measured ρs,λ (89.9%) was increased in respect of B6 (i.e., before cleaning) by 7.0%. Additionally, following the B6b process by the B6c process, the measured ρs,λ (93.5%) was increased in respect of B6 by the 10.6%.
For specimen 11 that was exposed to the natural weather for a period of 91 days, Figure 16 shows that before conducting cleaning, the short-wave solar reflectivity was 72.0%, which is lower than the corresponding ρs,λ for specimen 1 (91.0%, 3 days of exposure time) and specimen 6 (82.9%, 29 days of exposure time). Apply the B11a process has resulted in an increase in ρs,λ (75.7%) by 3.7%. However, when the B11a process was followed by the B11b process, the measured ρs,λ (93.0%) was increased in respect of B11 (i.e., before cleaning) by 21.0%. Finally, following the B11b process by the B11c process, the measured ρs,λ (93.3%) was increased in respect of B11 by the 21.3%. For different wavelength bands, the effect of exposure time and different cleaning processes on the RCM reflectivity for all specimens in set-A and set-B are available in [29].
After conducting the washing process with dishwashing detergent (B × c), it was noticed that the measured value of the short-wave solar reflectivity for specimen 6 (93.5%, 29 days of exposure time) and specimen 11 (93.3%, 91 days of exposure time) were about ~1.0% less than that for specimen 1 (94.2%, 3 days of exposure time). This might be due to the process of washing the RCM with dishwashing detergent was not fully able to remove all contaminant species (e.g., black carbon and inorganic carbon, etc.) from the coating surface of specimen 6 (29 days of exposure time) and specimen 11 (91 days of exposure time). As such, a final process to simulate professional cleaning (B × d, see Table 1) was conducted right after completing the measurements for the rest of specimens in set-B as provided next.

4.3. Effect of Conducting Professional Cleaning on the Solar Reflectivity of the RCM

In this study, two specimens (S1 and S2) that were exposed to the natural weather conditions of Jubail Industrial City for 190 days were used to conduct professional cleaning. These specimens were cleaned using liquid bleach (sodium hydroxide and sodium hypochlorite) that was mixed with water in different ratios. The Bleach (B) to Water (W) ratios (B:W) were 0:1, 1:2 and 2:1. Using bleach for cleaning the RCM simulates the professional cleaning process (B × d) as listed in Table 1. Note that the B:W ratio of 0:1 represents the case of water cleaning/rinsing process, where the measured short-wave solar reflectivity (i.e., λ = 700–1100 nm) for specimen S1 and specimen S2 were 83.37% and 85.33%, respectively. Following the rinsing process for these specimens S1 and S2, the professional cleaning and solar reflectance measurements were conducted. The obtained results are provided in Table 2 below.
Table 2 shows that the short-wave solar reflectivities for both specimen S1 and specimen S2 (90.97% for specimen S1 with B:W = 1:2 and 92.17% for specimen S2 with B:W = 2:1) were still lower than the original value (94.8%). This could be an indication that the professional cleaning with bleach of different mixing ratios could not remove the thin contaminated layer from the surface of the RCM so as to bring its short-wave solar reflectivity to the original value. Furthermore, the average value of the short-wave solar reflectivity for all 25 specimens in set-B of different exposure times to the natural weather and after conducting homemade cleaning was 92.05%. Because the average value of the short-wave solar reflectivity after conducting homemade cleaning is approximately the same as that after conducting professional cleaning, no need for conducting professional cleaning for RCM when it is install in the roofing systems of Saudi buildings. Finally, conducting homemade cleaning for the RCM at different exposure times was successful in recovering about 97% of its un-weathered short-wave solar reflectivity.

4.4. Future Research

Additional research based on the results obtained from this first phase will be modelled as numerical simulations in order to determine the amount of energy savings achievable as results of installing cool roofs instead of black roofs in the Saudi climate.

5. Summary and Conclusions

The first phase of our research presented in this paper has focused on: (a) characterizing the short-wave solar reflectivity of a reflective coating material (RCM) that is available in the markets of the Gulf Cooperation Council (GCC) countries when this material was subjected to the natural weathering conditions of Jubail Industrial City in which the JUC test facility is located, (b) investigating the effect of dust/dirt accumulations on the short-wave solar reflectivity of the RCM, and (c) conducting different cleaning processes on the surfaces of the RCM so as to increase its short-wave solar reflectivity that would result in high energy savings. Four cleaning processes were conducted in this study. These processes included: (1) air plowing to simulate the wind action, (2) water cleaning/rinsing to simulate the rain action, (3) washing with dishwashing detergent to simulate homemade cleaning, and (4) cleaning using sodium hydroxide and sodium hypochlorite mixture to simulate professional cleaning.
At no dust/dirt accumulation, the measured short-wave solar reflectivity for the RCM was close to the reported value by the RCM manufacture (94.8%). For specimen with short exposure time to the natural weather (e.g., 3 days), the results showed that the measured short-wave solar reflectivity of the RCM after conducting homemade cleaning (94.2%) was approximately the same as the reported value by the RCM manufacturer (94.8%). However, for longer exposure time (e.g., 91 days), conducting homemade cleaning has resulted in lower short-wave solar reflectivity of the RCM (93.3%) than that for shorter exposure time. Providing the high pollution level in Jubail Industrial City (black carbon, inorganic carbon and some isolated dark spots of biomass can be seen on the surfaces of RCM), this might be due to the homemade cleaning was not fully able to remove all contaminant species from the coating surfaces. On the other hand, the results showed that conducting professional cleaning has resulted in insignificant enhancement in the short-wave solar reflectivity for RCM in relation with conducting homemade cleaning. Alternatively, conducting homemade cleaning for the RCM at different exposure times has resulted in recovering about 97% of the original value of its short-wave solar reflectivity. Therefore, it is recommended that no need for conducting professional cleaning for the RCM when it is installed on the roofing systems of Saudi buildings.

Author Contributions

Conceptualization, H.H.S., A.E.H.; methodology, H.H.S. and A.E.H.; formal analysis, H.H.S., S.A.A. and H.J.H.; investigation, H.H.S. and A.E.H.; software, H.H.S., A.E.H. and S.A.A.; resources, S.A.A. and H.J.H.; data curation, H.H.S. and S.A.A.; writing—original draft preparation, H.H.S., S.A.A.; writing—review and editing, H.H.S., A.E.H., S.A.A. and H.J.H.; visualization, H.H.S.; supervision, H.H.S.; project administration, H.H.S. and A.E.H. All authors have read and agreed to the published version of the manuscript.

Funding

This research received no external funding.

Institutional Review Board Statement

Not applicable.

Informed Consent Statement

Not applicable.

Data Availability Statement

Not applicable.

Acknowledgments

The authors would like to thank Abdulaziz Algamdi, Mohammad Nfaiai and Salman Rajhi for their technical support during the course of executing this research project.

Conflicts of Interest

The authors declare no conflict of interest.

References

  1. Peterson, T.C.; Gallo, K.P.; Owen, T.W.; McKittrick, D.A.; Lawrimore, J.; Huang, A. Global rural temperature trends. Geophys. Res. Lett. 1999, 26, 329–332. [Google Scholar] [CrossRef] [Green Version]
  2. Huang, Q.; Lu, Y. The Effect of Urban Heat Island on Climate Warming in the Yangtze River Delta Urban Agglomeration in China. Int. J. Environ. Res. Public Health 2015, 12, 8773–8789. [Google Scholar] [CrossRef] [PubMed] [Green Version]
  3. Sachindra, D.A.; Ng, A.; Muthukumaran, S.; Perera, B.J.C. Impact of climate change on urban heat island effect and extreme temperatures: A case-study. Q. J. R. Meteorol. Soc. 2015, 142, 172–186. [Google Scholar] [CrossRef]
  4. Oleson, K.W.; Bonan, G.B.; Feddema, J. Effects of white roofs on urban temperature in a global climate model. Geophys. Res. Lett. 2010, 37. [Google Scholar] [CrossRef] [Green Version]
  5. U.S. Environmental Protection Agency (EPA). Keeping Your Cool: How Communities Can Reduce the Heat Island Effect. Available online: https://www.epa.gov/sites/production/files/2016-09/documents/heat_island_4-page_brochure_508_120413.pdf (accessed on 25 June 2019).
  6. Aflaki, A.; Mirnezhad, M.; Ghaffarianhoseini, A.; Ghaffarianhoseini, A.; Omrany, H.; Wang, Z.-H.; Akbari, H. Urban heat island mitigation strategies: A state-of-the-art review on Kuala Lumpur, Singapore and Hong Kong. Cities 2017, 62, 131–145. [Google Scholar] [CrossRef] [Green Version]
  7. Huang, M.; Cui, P.; He, X. Study of the Cooling Effects of Urban Green Space in Harbin in Terms of Reducing the Heat Island Effect. Sustainability 2018, 10, 1101. [Google Scholar] [CrossRef] [Green Version]
  8. Nuruzzaman, M. Urban Heat Island: Causes, Effects and Mitigation Measures—A Review. Int. J. Environ. Monit. Anal. 2015, 3, 67. [Google Scholar] [CrossRef] [Green Version]
  9. Sebastiani, A.; Marando, F.; Manes, F. Mismatch of Regulating Ecosystem Services for sustainable urban planning: PM10 removal and urban heat island effect mitigation in the Municipality of Rome (Italy). Urban For. Urban Green. 2020, 57, 126938. [Google Scholar] [CrossRef]
  10. Mohajerani, A.; Bakaric, J.; Jeffrey-Bailey, T. The urban heat island effect, its causes, and mitigation, with reference to the thermal properties of asphalt concrete. J. Environ. Manag. 2017, 197, 522–538. [Google Scholar] [CrossRef]
  11. Lee, J.S.; Kim, J.T.; Lee, M.G. Mitigation of urban heat island effect and greenroofs. Indoor Built Environ. 2014, 23, 62–69. [Google Scholar] [CrossRef]
  12. U.S. Environmental Protection Agency. Cool Roofs. In Reducing Urban Heat Islands: Compendium of Strategies. 2008. Available online: https://www.epa.gov/heat-islands/heat-island-compendium (accessed on 11 January 2019).
  13. Berdahl, P.; Akbari, H.; Levinson, R.; Miller, W.A. Weathering of roofing materials—An overview. Constr. Build. Mater. 2008, 22, 423–433. [Google Scholar] [CrossRef] [Green Version]
  14. Suehrcke, H.; Peterson, E.L.; Selby, N. Effect of roof solar reflectance on the building heat gain in a hot climate. Energy Build. 2008, 40, 2224–2235. [Google Scholar] [CrossRef]
  15. Mani, M.; Pillai, R. Impact of dust on solar photovoltaic (PV) performance: Research status, challenges and recommendations. Renew. Sustain. Energy Rev. 2010, 14, 3124–3131. [Google Scholar] [CrossRef]
  16. Sulaimana, S.A.; Singhb, A.K.; Mokhtara, M.M.M.; Bou-Rabeec, M.A. Influence of dirt accumulation on performance of pv panels. Energy Procedia 2014, 50, 50–56. [Google Scholar] [CrossRef] [Green Version]
  17. Algarni, S.; Nutter, D. Influence of dust accumulation on building roof thermal performance and radiant heat gain in hot-dry climates. Energy Build. 2015, 104, 181–190. [Google Scholar] [CrossRef]
  18. Levinson, R.; Berdahl, P.; Berhe, A.A.; Akbari, H. Effects of soiling and cleaning on the reflectance and solar heat gain of a light-colored roofing membrane. Atmos. Environ. 2005, 39, 7807–7824. [Google Scholar] [CrossRef]
  19. Akbari, H.; Berhe, A.; Levinson, R.; Graveline, S.; Foley, K.; Delgado, A.H.; Paroli, R.M. Aging and weathering of cool roofing membranes. In Proceedings of the First International Conference on Passive and Low Energy Cooling for the Built Environment, Athens, Greece, 17 May 2005. [Google Scholar]
  20. Saber, H.H.; Swinton, M.C.; Kalinger, P.; Paroli, R.M. Long-term hygrothermal performance of white and black roofs in North American climates. Build. Environ. 2012, 50, 141–154. [Google Scholar] [CrossRef]
  21. Saber, H.H.; Maref, W.; Hajiah, A.E. Hygrothermal performance of cool roofs aubjected to Saudi climates. J. Front. Energy Res. 2019, 7, 39. [Google Scholar] [CrossRef]
  22. Saber, H.H.; Maref, M. Energy performance of cool roofs followed by development of practical design tool. J. Front. Energy Res. 2019, 7, 122. [Google Scholar] [CrossRef] [Green Version]
  23. Alkhalifa, A.H.; Al-Homaidan, A.A.; Shehata, A.I.; Al-Khamis, H.H.; Al-Ghanayem, A.A.; Ibrahim, A.S.S. Brown macroalgae as bio-indicators for heavy metals pollution of Al-Jubail coastal area of Saudi Arabia. Afr. J. Biotechnol. 2012, 11, 15888–15895. [Google Scholar]
  24. Al-A’ama, M.S.; Nakhla, G.F. Wastewater reuse in Jubail, Saudi Arabia. Water Res. 1995, 29, 1579–1584. [Google Scholar] [CrossRef]
  25. ASTM International. ASTM E903-12—Standard Test Method for Solar Absorptance, Reflectance, and Transmittance of Materials Using Integrating Spheres; ASTM International: West Conshohocken, PA, USA, 2012. [Google Scholar]
  26. 410-Vis-IR Portable Emissometer & Solar Reflectometer. Available online: https://surfaceoptics.com/products/reflectometers-emissometers/410-vis-ir/ (accessed on 25 May 2019).
  27. Tng, K.H.; Antony, A.; Wang, Y.; Leslie, G.L. 11-Membrane ageing during water treatment: Mechanisms, monitoring, and control. In Woodhead Publishing Series in Energy; Basile, A., Cassano, A., Rastogi, N.K., Eds.; Advances in Membrane Technologies for Water Treatment; Woodhead Publishing: Cambridge, UK; pp. 349–378. [CrossRef]
  28. FLIR Thermography Thermal Imagers & Infrared Cameras. Available online: http://www.flirarabia.com/home/ (accessed on 2 May 2019).
  29. Saber, H.H.; Alshehri, S. Energy Savings Due to Using Reflective Roofing Materials in Buildings of Kuwait and Saudi Arabia; Final Report; Kuwait Institute for Scientific Research (KISR): Kuwait City, Kuwait, 2019; 67p. [Google Scholar]
Figure 1. Locations in which cool (white) and conventional (black) roofing materials is installed on the roofing system of JUC test facility—A.
Energies 14 00445 g001
Figure 2. Arrangement of specimens in set-A for dust characterization and set-B for cleaning procedure and their time schedule.
Energies 14 00445 g002
Figure 3. Specimen preparations by applying roofing paint directly on the glass substrates (Stage-I).
Energies 14 00445 g003
Figure 4. Effect of the first heavily rain event on the coating without applying the primer paint (Stage-I).
Energies 14 00445 g004
Figure 5. Effect of the second heavily rain event on the coating without applying the primer paint (Stage-I).
Energies 14 00445 g005
Figure 6. Specimen preparations by applying glowing product X on the glass substrates before applying roofing paint (Stage-II).
Energies 14 00445 g006
Figure 7. Test specimen arrangements for conducting turbidity measurements and cleaning processes.
Energies 14 00445 g007
Figure 8. Clean and dusty specimens subjected to the natural weather of Jubail Industrial City.
Energies 14 00445 g008
Figure 9. Collect accumulated dust on the specimen surface for turbidity measurements.
Energies 14 00445 g009
Figure 10. Effect of dust concentration on the RCM reflectivity in different wavelength bands.
Energies 14 00445 g010
Figure 11. Effect of exposure time on the RCM reflectivity in different wavelength bands.
Energies 14 00445 g011
Figure 12. Effect of dust concentration on the RCM reflectivity in the 700–1100 nm wavelength band and the average reflectivity over all wavelength bands (specimens in set-A).
Energies 14 00445 g012
Figure 13. Effect of exposure time on the RCM reflectivity in the 700–1100 nm wavelength band and the average reflectivity over all wavelength bands (specimens in set-A).
Energies 14 00445 g013
Figure 14. Measurements of the RCM reflectivity in the 700–1100 nm wavelength band and the average reflectivity over all wavelength bands without and with different cleaning processes (Specimen 1).
Energies 14 00445 g014
Figure 15. Measurements of the RCM reflectivity in the 700–1100 nm wavelength band and the average reflectivity over all wavelength bands without and with different cleaning processes (Sample 6).
Energies 14 00445 g015
Figure 16. Measurements of the RCM reflectivity in the 700–1100 nm wavelength band and the average reflectivity over all wavelength bands without and with different cleaning processes (Specimen 11).
Energies 14 00445 g016
Table 1. List of specimen legends and measurement processes.
Legend *Reading of Solar Reflectivity Measurements (ρs)Notes
ρs obtained right before conducting turbidity measurement
ρs obtained right before conducting the cleaning procedure
B × aρs obtained right after conducting air plowing process using air blower (having airflow rate of 64 m3/h at air pressure of 245 mm water (2403 Pa))Simulate the wind action
B × bρs obtained right after conducting water cleaning/rinsing processSimulate rain action
B × cρs obtained right after conducting washing with dishwashing detergent process using mixture from detergent liquid (200 mL) and bottled drinking water (4.8 L)Simulate homemade cleaning
A × d **
B × d **
ρs obtained right after conducting cleaning using sodium hydroxide and sodium hypochlorite mixtureSimulate professional cleaning
* × refers to row number as per Figure 7. ** Conducted after completing the measurements for all specimens shown in Figure 7.
Table 2. Reflectance measurements for RCM after conducting professional cleaning (B × d).
SampleB to W Ratioλ (nm)All Wave Bands
B:W700–1100Average
S10:183.37%75.00%
1:290.97%83.03%
S20:185.33%76.67%
2:192.17%83.43%
Publisher’s Note: MDPI stays neutral with regard to jurisdictional claims in published maps and institutional affiliations.

