Load Shifting and Peak Clipping for Reducing Energy Consumption in an Indian University Campus
by
 and
and
Rajavelu Dharani
1, 
Madasamy Balasubramonian
1,
Thanikanti Sudhakar Babu
2 and
and
Benedetto Nastasi
3,*
1
Department of Electrical and Electronics Engineering, Alagappa Chettiar Government College of Engineering and Technology, Karaikudi, India
2
Department of Electrical Power Engineering, Institute of Power Engineering, Universiti Tenaga National (UNITEN), Kajang, Malaysia
3
Department of Planning, Design, and Technology of Architecture, Sapienza University of Rome, Via Flaminia 72, 00196 Rome, Italy
*
Author to whom correspondence should be addressed.
Energies 2021, 14(3), 558; https://0-doi-org.brum.beds.ac.uk/10.3390/en14030558
Submission received: 8 December 2020
/
Revised: 15 January 2021
/
Accepted: 19 January 2021
/
Published: 22 January 2021
(This article belongs to the Special Issue Energy Consumption in a Smart City)
Abstract
:This paper analyzes the intelligent use of time-varying electrical load via developing efficient energy utilization patterns using demand-side management (DSM) strategies. This approach helps distribution utilities decrease maximum demand and electrical energy billing costs. A case study of DSM implementation of electric energy utility for an educational building Alagappa Chettiar Government College of Engineering and Technology (ACGCET) campus was simulated. The new optimum energy load model was established for peak and off-peak periods from the system’s existing load profile using peak clipping and load shifting DSM techniques. The result reflects a significant reduction in maximum demand from 189 kW to 170 kW and a reduction in annual electricity billing cost from $11,340 to $10,200 (approximately 10%) in the upgraded system. This work highlights the importance of time of day (TOD) tariff structure consumers that aid reduction in their distribution system’s maximum demand and demand charges.
1. Introduction
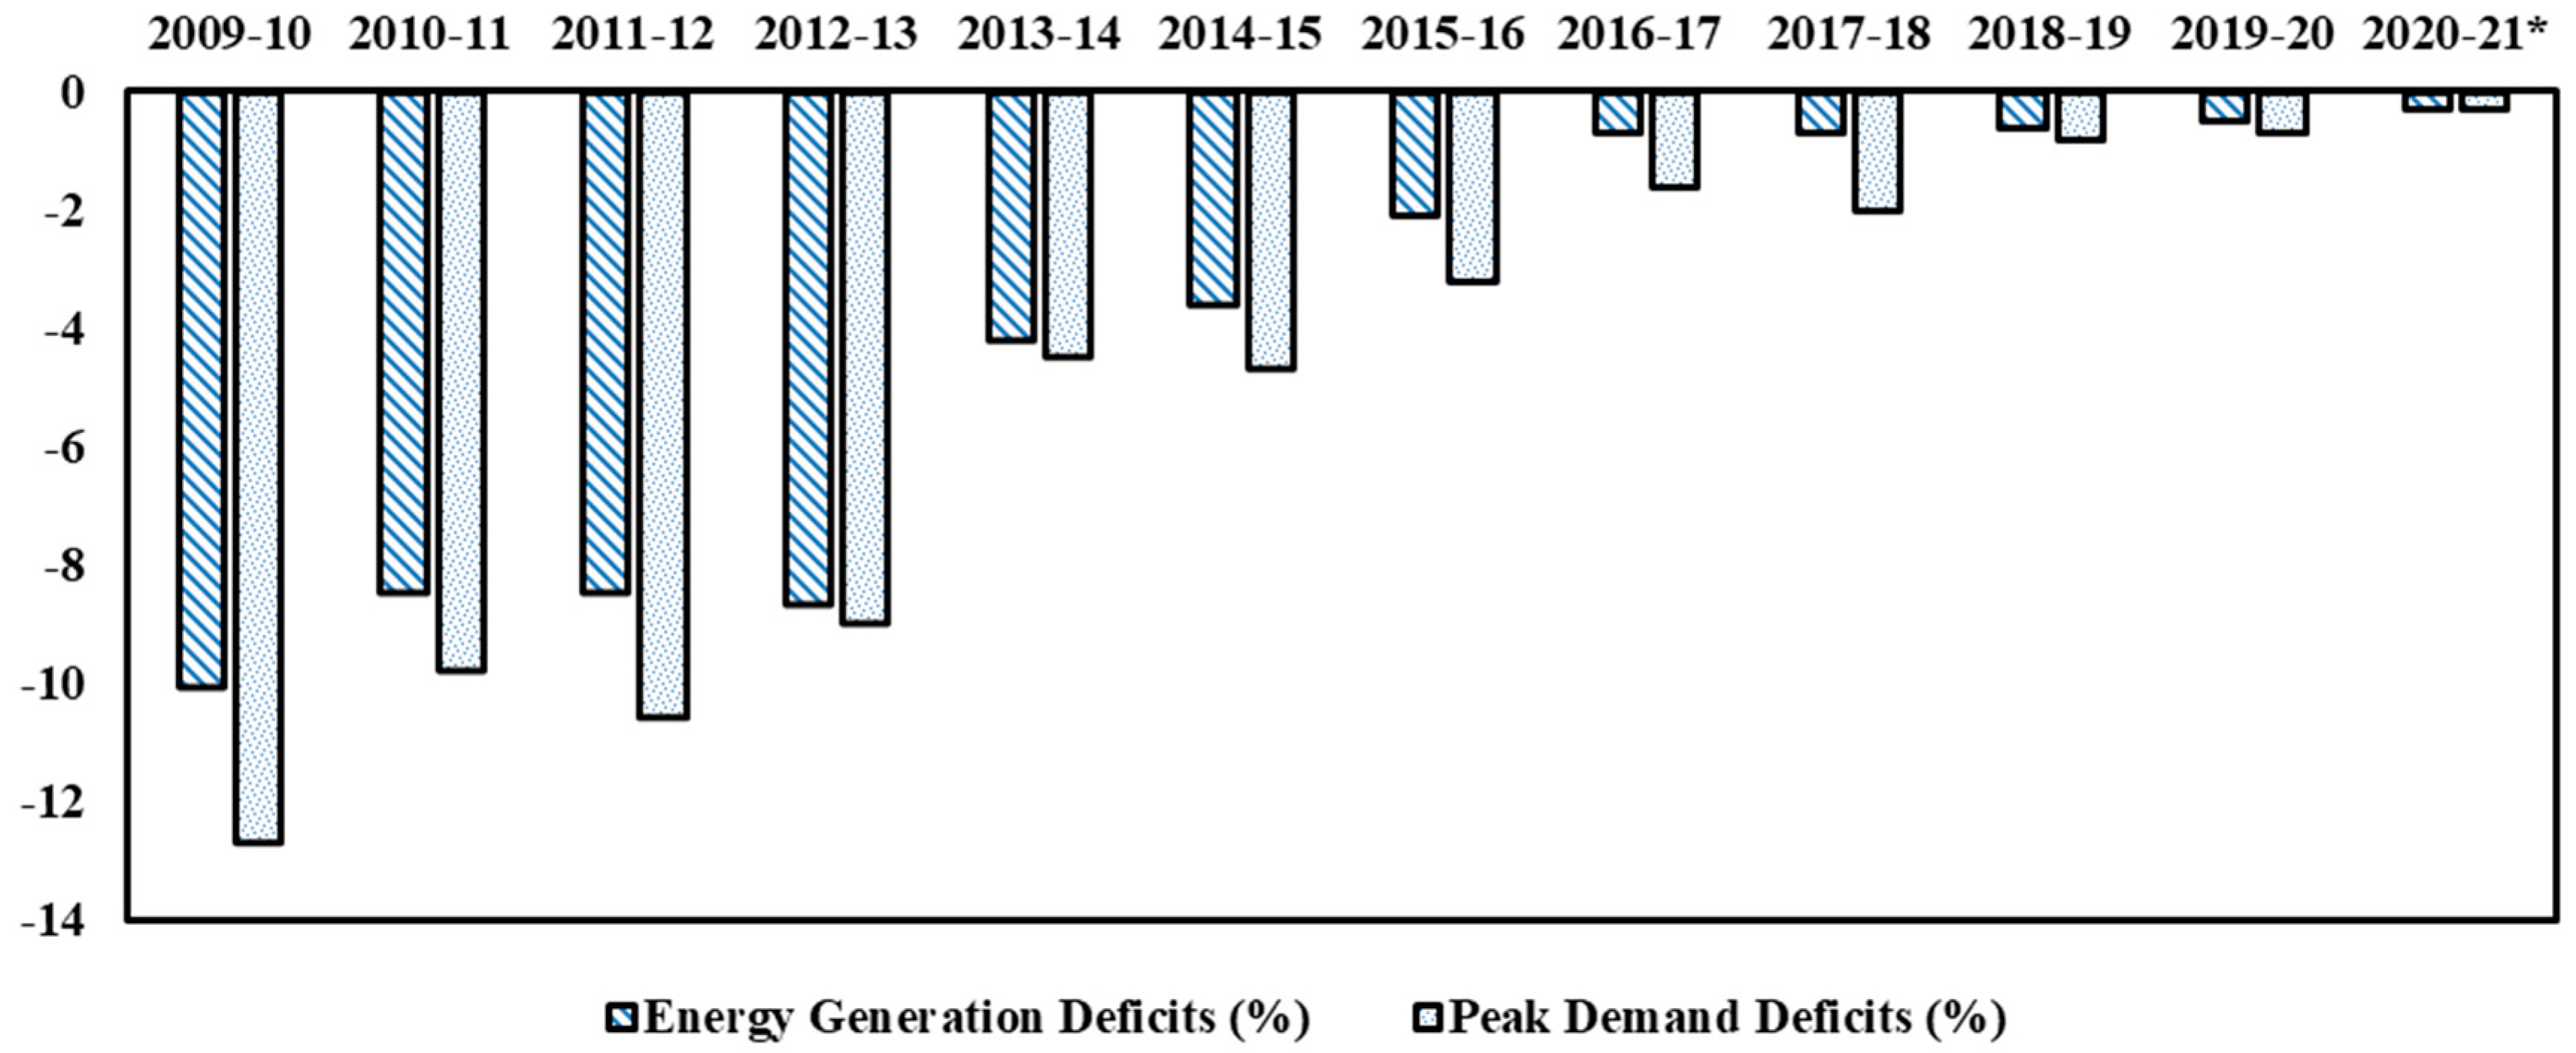
The rising energy demands of further population and industrial growth, shortage of fuel for power plants, and increasing costs of electrical energy require a more advanced, secure power system structure all over the world for economic growth [1] and satisfaction of energy consumers as well as conceiving innovative technologies [2]. This leads to a higher value of energy required to supply the needs of industrial, commercial, and all other categories of end-user [3]. Like in most of the countries, India also encourages the initiate energy efficiency activities (Energy conservation Act 2001) based on Japan’s Energy Conservation (EC) Guidelines through Bureau of Energy Efficiency (BEE), which is an agency of the Indian Minister of Energy. Activities carried out to prepare EC guidelines are (i) performance audits and sectoral study reports, (ii) original equipment manufacturers, (iii) industries, (iv) sectoral experts, (v) stakeholder consultations with industries and industry associations, and (vi) secondary sources such as relevant websites. It provides direction for the preparation of its own “Energy Management planning Handbook” for the efficient operation of various types of energy consumer such as commercial, industrial, and educational institute buildings. The main components of the guidelines are management and control; it plays a vital role in the energy conservation process in India [4]. As result of the follow-up to these guidelines, the actual power deficit was reduced from 0.6% to 0.5% for the financial year 2019–2020, and the peak power deficit was reduced from 0.8% to 0.7%, as reported by the Central Electricity Authority (CEA) [5]. Figure 1 shows the present Indian Energy scenario: power generation and peak demand deficit. In this scenario, to further reduce the deficit like other developing countries, a simple and cheap alternative is essential to provide reliable electricity service and to attain the objective of becoming a nation of surplus electricity for the growth of a country’s economy [6].
The continued growth and development of new power plants in particular of renewable energy plant units can minimize the gap between supply and demand. However, the integration of renewable electricity generation systems in most countries is impossible because of resource restrictions like wind, solar radiation, and storage capacity or local geographical limitation for energy harvesting [7,8]. To control this status, a well-developed form of a power management system is essential to provide for the continued supply and trade of electricity in a country. The power management system is classified into two main categories such as supply-side management and demand-side management (DSM) [9]. The first one focuses on enhancing the operating efficiency of electricity production, transmission and distribution. A mainly efficient generation of energy at a minimum cost, by meeting the energy demand without adding a new plant, decreases the impact on the environment by operating the electricity system efficiently [10]. On the other hand, DSM deal with consumers/utilities load levels and usage models and it is insensitive to external factors. Therefore, for the past few decades, many countries decided to implement energy conservation activities mainly through the DSM approach in addition with other simple approaches such as using energy-efficient equipment/appliances, smart power strips, and setting up a programmable or intelligent thermostat in various types of consumers by giving contributions in electricity bill tariffs and offer energy motivation programs that help make energy efficiency a more affordable and easy model [11]. Among these, a lot of research focused on the DSM approach in terms of load control techniques, economical benefits, effects on various kinds of consumers, role in the electricity market, impact on the power system reliability, etc. [12,13,14,15]. It is implemented with exciting outcomes in different countries. DSM is has been demonstrated as an essential strategy to achieve energy conservation and to reduce emissions in many studies in China [16]. It also plays a leading role in real-time electricity markets to balance power, maintain security, and keep electricity grids safe and reliable as shown in a study in North America [17] and others in Gulf countries [18,19]. The demand side response approach is further classified into two main categories: time- and incentive-based programs [20]. Time-based programs are intended for monitoring power consumption during peak hours. At the same time, incentive programs are managed by utilities and the provision of incentives for consumers.
The DSM time-based strategies are highly involved in the electricity market for energy efficiency [21,22]. These DSM programs are more common: load shifting, peak clipping, valley filing, load building, and energy conservation programs [23]. These algorithms differ for each utility because these are dependent on the number of customers, the nature of load (commercial building, industrial, or residential), the benefits of this program, and the level of customers’ reaction or satisfaction with the program applied. The few numbers of research suggest that energy conservation in the housing/commercial sector as a result of behavioral change strategies is more rapid than any other intervention. This includes direct feedback for smart meters and indirect feedback to improve billing [24,25]. Furthermore, during the peak period, energy saving through behavioral change ranged from 15.7% to 21.7% [26]. The DSM flexibly manages the changing load profile on the consumer side concerning time and use [27]. As a result, the load profile and supply conditions flattening at a location over the day are easily achieved by maintaining a satisfactory end-user level [28,29,30,31]. The DSM load modeling objective includes load-shaping measures such as peak clipping, valley filling, load shifting, strategic conservation, strategic load growth, and flexible load shape that may change the time model and level of the utility’s profile [32]. A load shifting approach is a form of DSM program that increases the power supply’s reliability in an electricity system [33].
Although it is factual that the DSM is a key strategy for minimizing peak demand, developing countries have taken much less consideration of the development of a suitable strategy for the DSM, because the deployment of DSM presents some challenges and barriers. They are a lack of smart metering, communications infrastructure, control techniques, information technologies, understanding the advantages of the DSM, competitiveness issues in relation to traditional approaches, an increase in the complication of the system’s operation, and inadequate market incentives among these capital costs and lead times for implementation [34,35,36]. Hence, it is preferable to choose the best DSM approach which overcomes the issues. Load sharing and peak clipping energy efficiency programs have the advantages of covering the needs of utilities to maintain a reliable, stable, and efficient electrical network and customers’ needs to maintain their comfort, safety, and unique lifestyle [37]; and where the energy resources are not sufficient to satisfy the load requirements, load shifting or peak clipping may be an appropriate and better method for DSM [38,39]. In this study, load shifting and peak clipping DSM approaches are applied; the first one is the best solution from the point of view of utility companies where customers are encouraged for this by the cheaper tariff in off-peak hours. The second is quite significant in developing countries and a problem with the need to invest in new installations and generation capacities.
In most Indian educational institutes, energy resources are inadequate to meet the needs; in this situation, the impact of DSM on the distribution system is important to ensuring a balance between demand and supply in addition to a reduced electricity bill. With this motivation, the authors analyzed the educational institute of Alagappa Chettiar Government College of Engineering and Technology (ACGCET) campus on how to upgrade the existing energy system through the peak clipping and load shifting DSM methodology. It is analyzed using a simple solver MS-Excel and HOMER (Hybrid Optimization of Multiple Energy Resources) (2.8, HOMER Energy, Boulder, CO 80301 USA) optimization tool [40]. Initially, the daily load profile is measured, and thereafter, the monthly or seasonal load curves are obtained by HOMER to identify and analyze of peak load and off-peak load period, average load, peak load demand in an hour/month/year, then executed by the direct load control. The utility can change the load model by turning off the power supply in an intelligent manner to a specific category of loads (shiftable load) at chosen time intervals. This study offers the benefits of reducing implementation complexity, operational costs, etc., compared to other DSM approaches. The result demonstrates the enhancement of the load factor and the load profile curve of the campus.
The detailed expected effects of implementing the DSM are:
- The reduction in energy bills can be achieved compared to the existing billing cost and similar contract and energy price conditions by reducing unnecessary consumption and paying attention to energy consumption behavior on campus;
- The maximum demand charges can be minimized by reducing the sanctioned peak demand of the electricity supplier;
- The possibility to avoid the enlargement of the electricity meter and a subsequent increase in the electricity price per kWh can also be optimized;
- The efficient energy load pattern can derive.
The paper is organized as follows: Section 2 provides the details of the case study and load profile details. Section 3 deals with the methodology used to reduce peak load and load factor for a day/month. Simulation results and discussion are presented in Section 4, and the outcome and conclusions of the work carried out are discussed in Section 5.
2. Case Study Area: ACGCET Campus
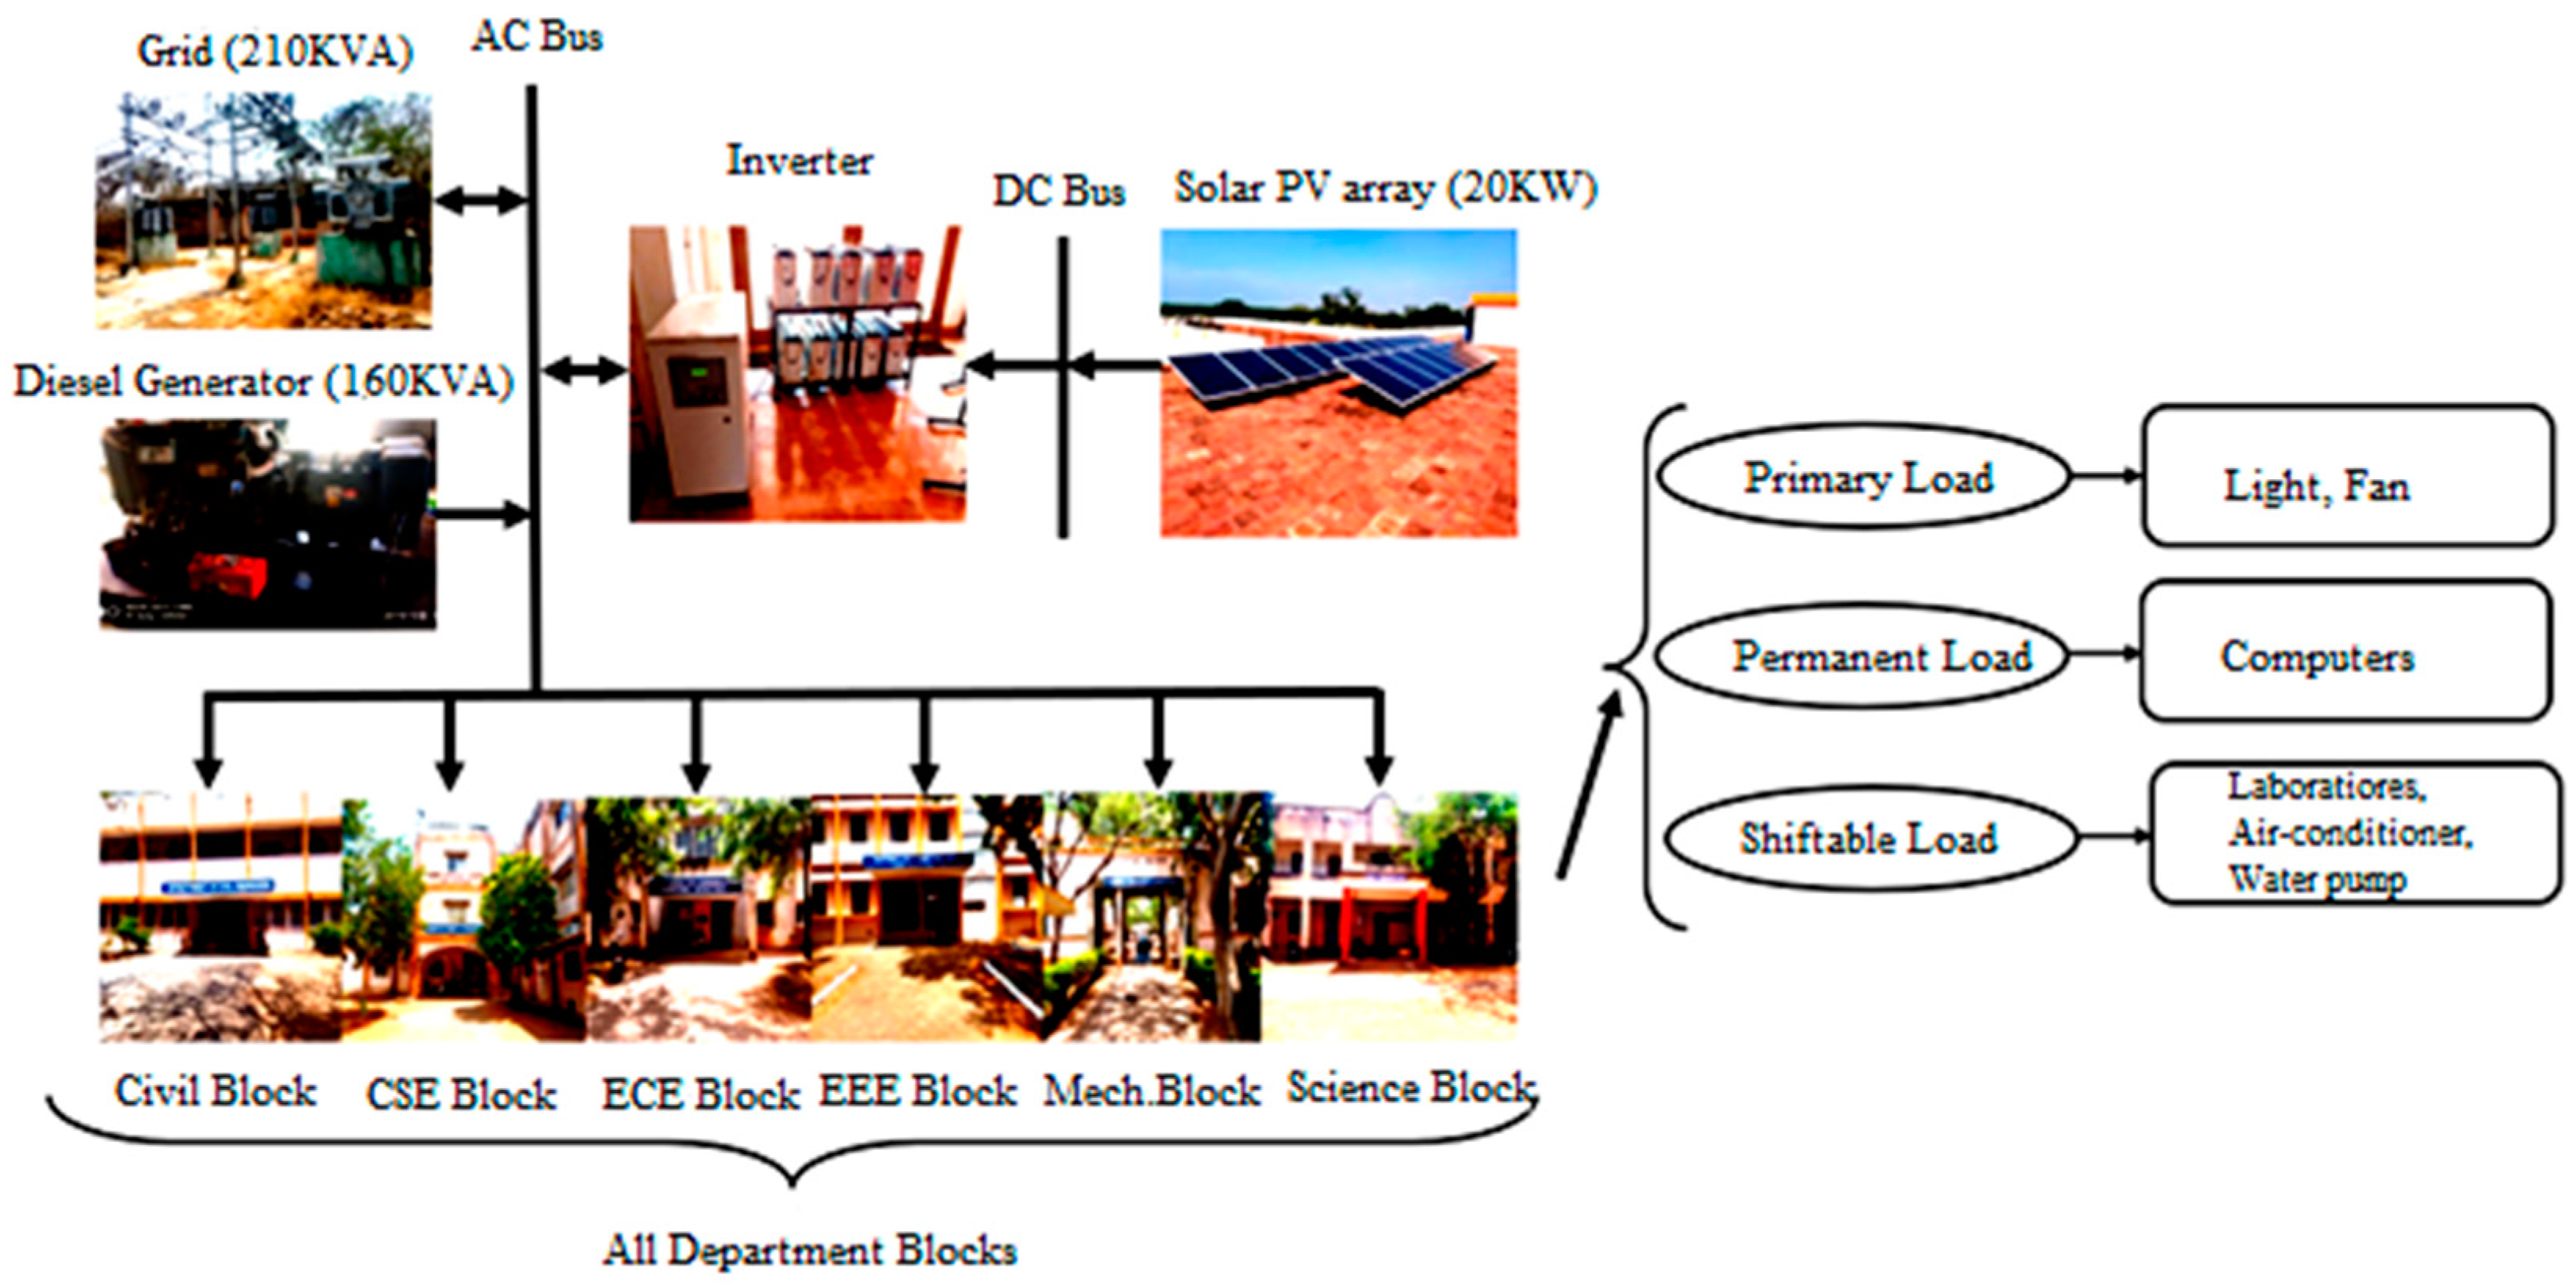
The case study was carried out on ACGCET Campus, Karaikudi, where the latitude and longitude are 10.091° N and 78.797° E, respectively. Its location is in the Indian state of Tamilnadu. The power distribution networks of ACGCET Campus consist of a grid line, solar photovoltaic and diesel generator, distribution panels, automatic power factor correction panels, circuit breakers, cables, and loads. The maximum permitted demand on campus is 210 KVA from the Tamilnadu Electricity Board (TNEB). By observing Tamilnadu Generation and Distribution Corporation Limited′s (TANGEDCO-Electricity provider, No 825, Link Rd, Anna Salai, Triplicane, Chennai, Tamil Nadu 600002, India) bill (November 2019) for the ACGCET campus [41], the cost of energy (COE) is $2857 per month, the penalty fee, which includes the maximum demand charge, is $943 per month, and compensation fee for the low power factor per month of approximately $100. The total amount payable is approximately $48,000 per year [42,43]. From this data, it can be seen that the minimization of the energy cost of existing systems is mandatory in this institution. As a result, this work′s focus is to reduce the demand load by reducing energy consumption during peak hours. Thus, the flattening of the load profile and the state of energy saving behavior of the supply of a site during a day is carried out.
2.1. Load Assessment
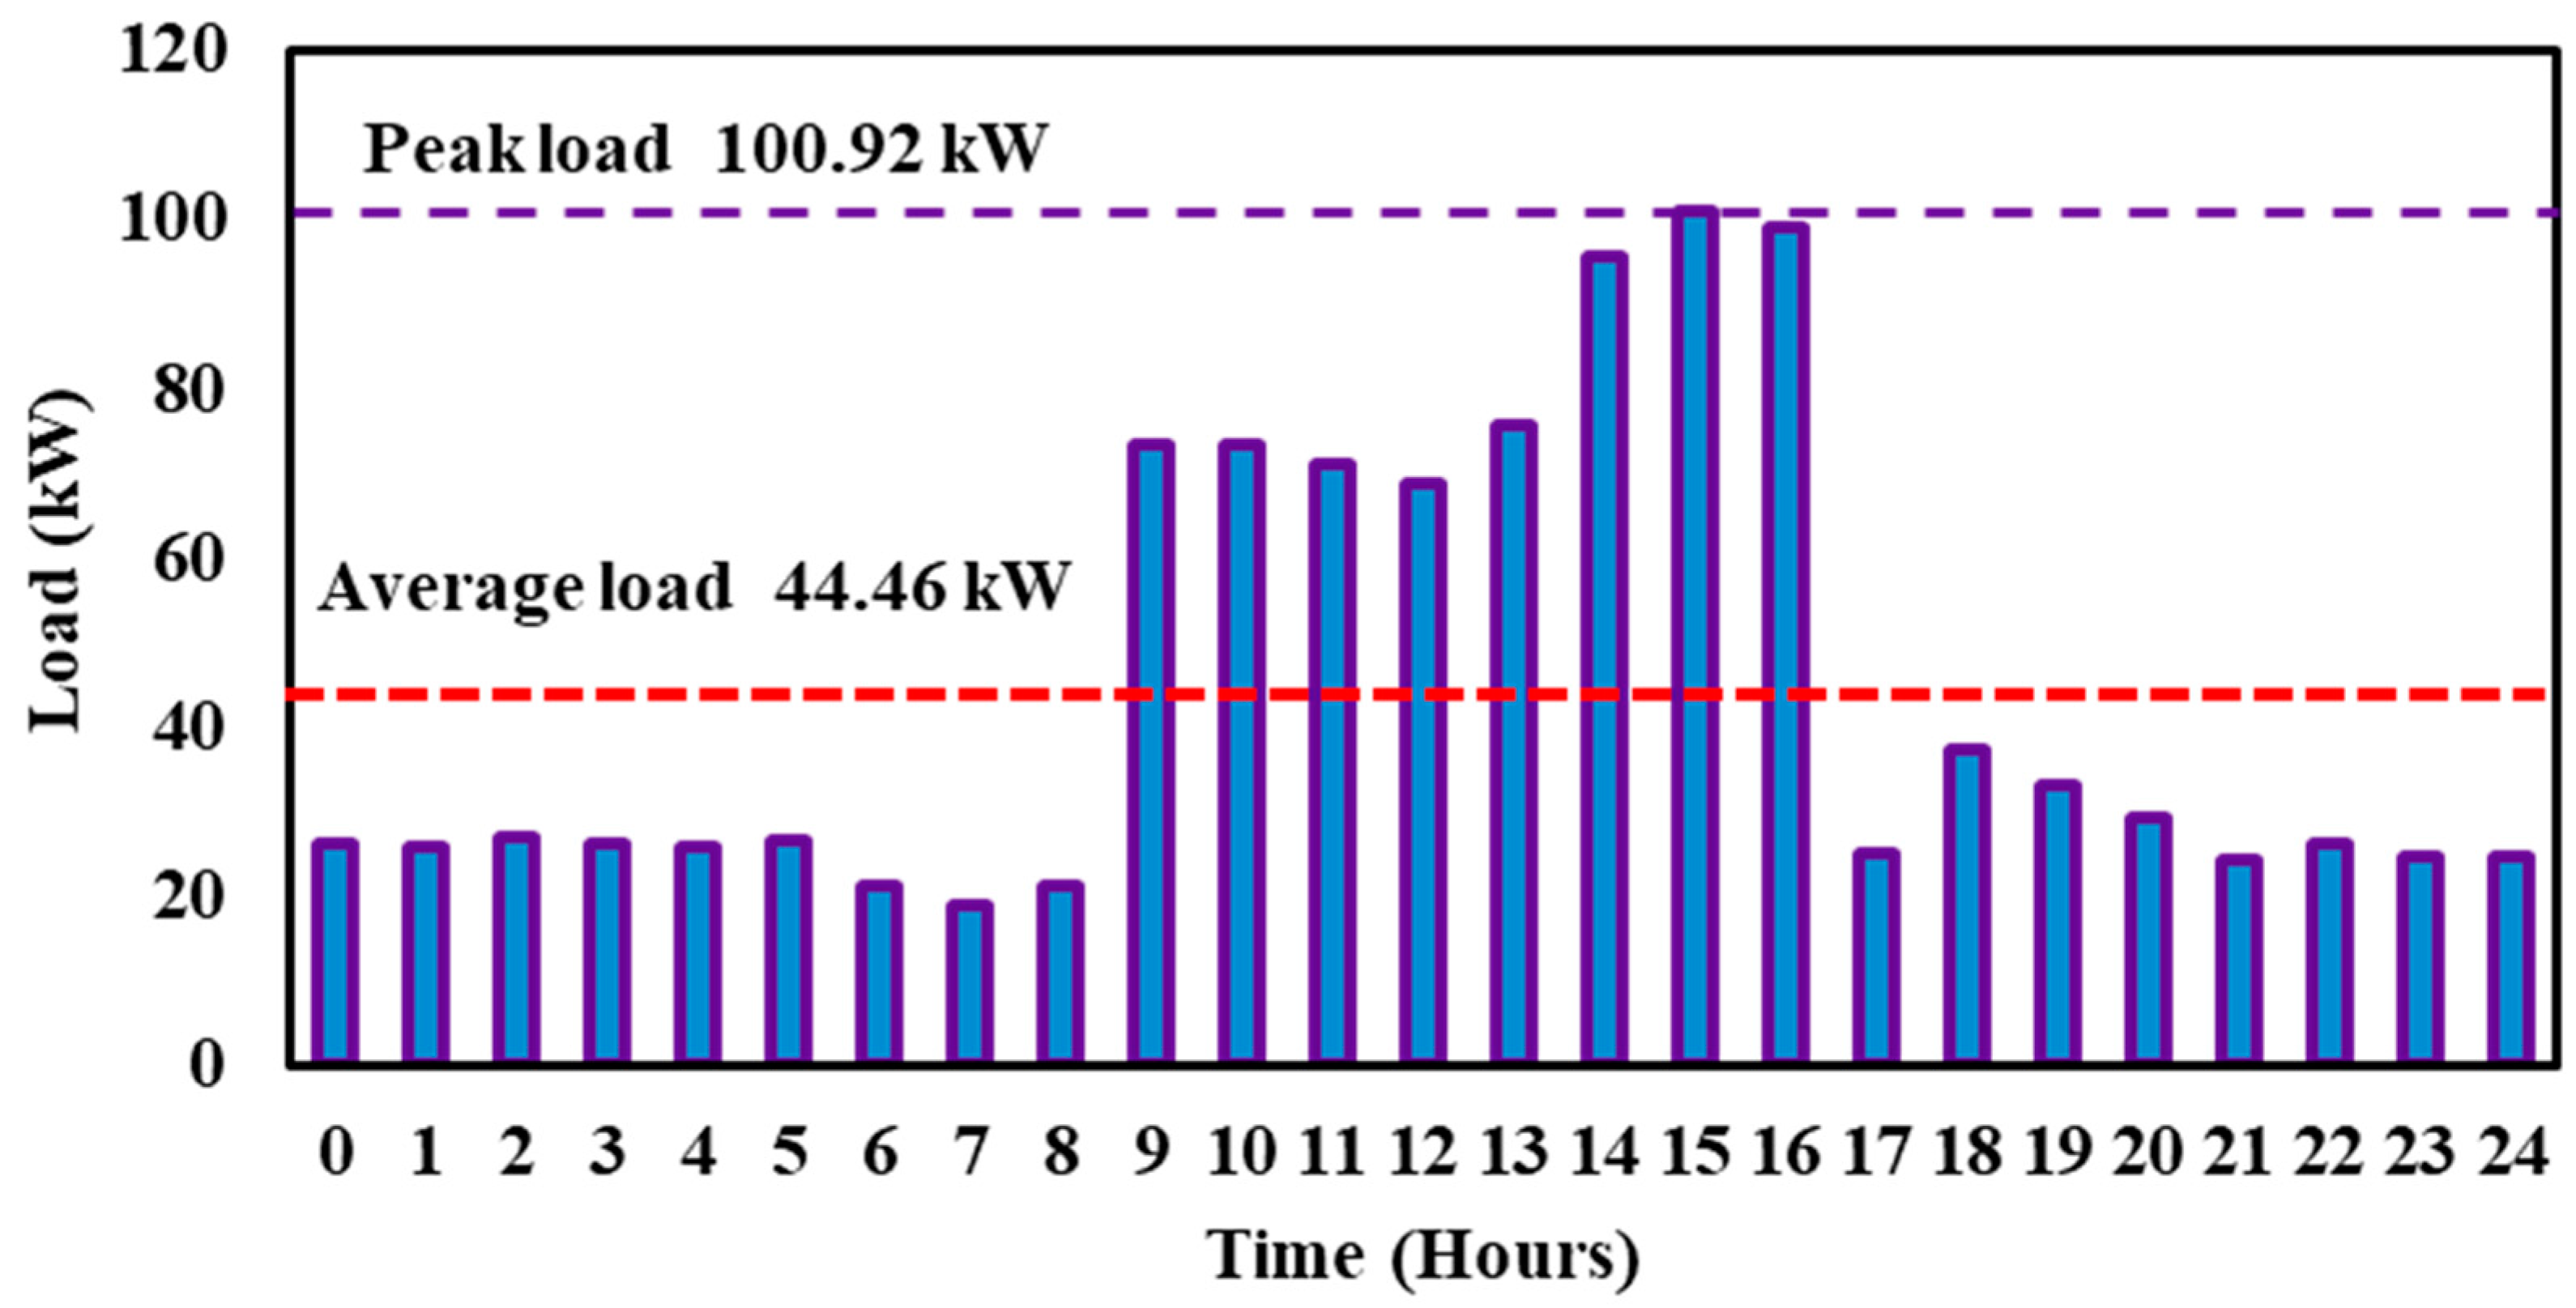
The ACGCET campus brief infrastructure details and number of courses offered can be found in Table 1. It is well known that the institute′s working days are the only possibility to observe peak loads in relation to public holidays and examination days. As a result, the average working day′s energy meter readings are observed in the month of December 2019 and the typical load consumption pattern of the campus is shown in Figure 2. The average load profile of the campus is approximately 44.46 kW.
2.2. Problem Formulation
Usually peak demand requirement is applied by the end-user to the supply provider according to their load in the campus. In this campus, the requested maximum demand is 210 KVA from TNEB (Tamilnadu Electricity Board-provider) to meet our maximum energy demand of the campus. The rules and regulation of TNEB (supply provider) state that a constant supply equal to 90% of recorded demand affects the tariff of a particular end-user—in this case the campus. Even having a lower amount of recorded demand in the month (as per analysis during the month, it is only 100.92 KVA), TNEB considered only 90% of sanction demand as a demand charge. To address this constraint by reducing the peak and related costs, the most viable solution is to implement the DSM approach to the electrical network. DSM entails the supervision of loads on the utility side concerning the occasion and the amount of use to reduce costs. The system′s total peak greatly reduces and supports the load pattern itself much closer to the regular load consumption pattern. The successful execution of DSM employment provides significant assistance in managing customer demand at the lowest cost of electricity. In the valley filling DSM approach, some controllable devices are required to operate in different times of the day, allowing the effective integration of various renewable sources [44,45] and fossil-based ones [46], including improving the management of other sectors, such as heat [47,48]. The load shifting and peak clipping approach are the best solutions for utility companies. End-users are encouraged to do so through the lower-cost tariff during peak and subsequent risk of congestion [49].
3. Methodology
The DSM analysis method is described in the following subsections. Firstly, DSM is performed using the peak clipping and load shifting technique. In the peak clipping approach, the maximum demand reduction is obtained by the clip of the unwanted load during peak hours. Second, the HOMER software tool, built by NREL (National Renewable Energy Laboratory) for cost effective and reliable microgrids, shows the maximum load reduction and load factor for a day/month.
3.1. Demand-Side Management
To manage energy demand for the existing system in the campus DSM approach, two techniques, such as peak clipping and load shifting, are utilized as tools in this case study. Based on hourly and average demand, the peak period was clipped (peal clipping approach), and the end-user determined the load or load that could be shifted (in the load shifting approach).
In this case study, loads are categorized as primary, permanent, and suitable loads and are presented in Figure 3. The power consumptions rating of each load is given in Table 1. The primary load consists of light and fan loads; the permanent load consists of computers. The primary load can be turn-on or turn-off based on the end-user requirement. However, the permanent load requires continuous power with constant power consumption, including computers and server rooms. Shiftable loads are used on time. In the present study, three main devices are considered to be shiftable loads. They are all department laboratories, water well pumps, and air-conditioners. At any period ‘t’, the hourly and average load demand can be computed by the sum of the primary loads (PPL), permanent loads (PPR), and deferrable or shiftable loads PSL. It appears in Equations (1)–(4).
- PPL(t) is the Primary Load;
- PPR (t) is the Permanent Load;
- PSL(t) is the Shiftable Load;
- BVSL(t), BPSL(t) are the Binary Variable;
- Phr_dem(t) is the Hourly Load;
- Pavg_dem(t) is the average energy demand;
- N is the No. of Shiftable Loads.
Using data from the observed hourly/daily load profile, peak hours occurring during the period are recorded. If the hourly energy demand exceeds the average demand, staggered hourly loads are shifted towards off-peak hours based on the end-user′s priorities. At this time, transfer, load to off-peak periods by ON and OFF switching, the channel was denoted by ‘1’ and ‘0’, respectively, in the load shifting DSM approach [50,51]. The system’s shiftable loads depend on the priorities assigned by the end-user based on their requirement characteristics on the campus load as in Table 2. The order of preference is given in Table 3 and Table 4; shifting loads are assigned based on preference by the binary variable shiftable load (BVSL) and binary parameter (BPSL) at a specific time period. In the peak load clipping method, the shiftable load is clipped as per the end-user’s design. The time period of the peak clipping is given in Table 5 for this case study work.
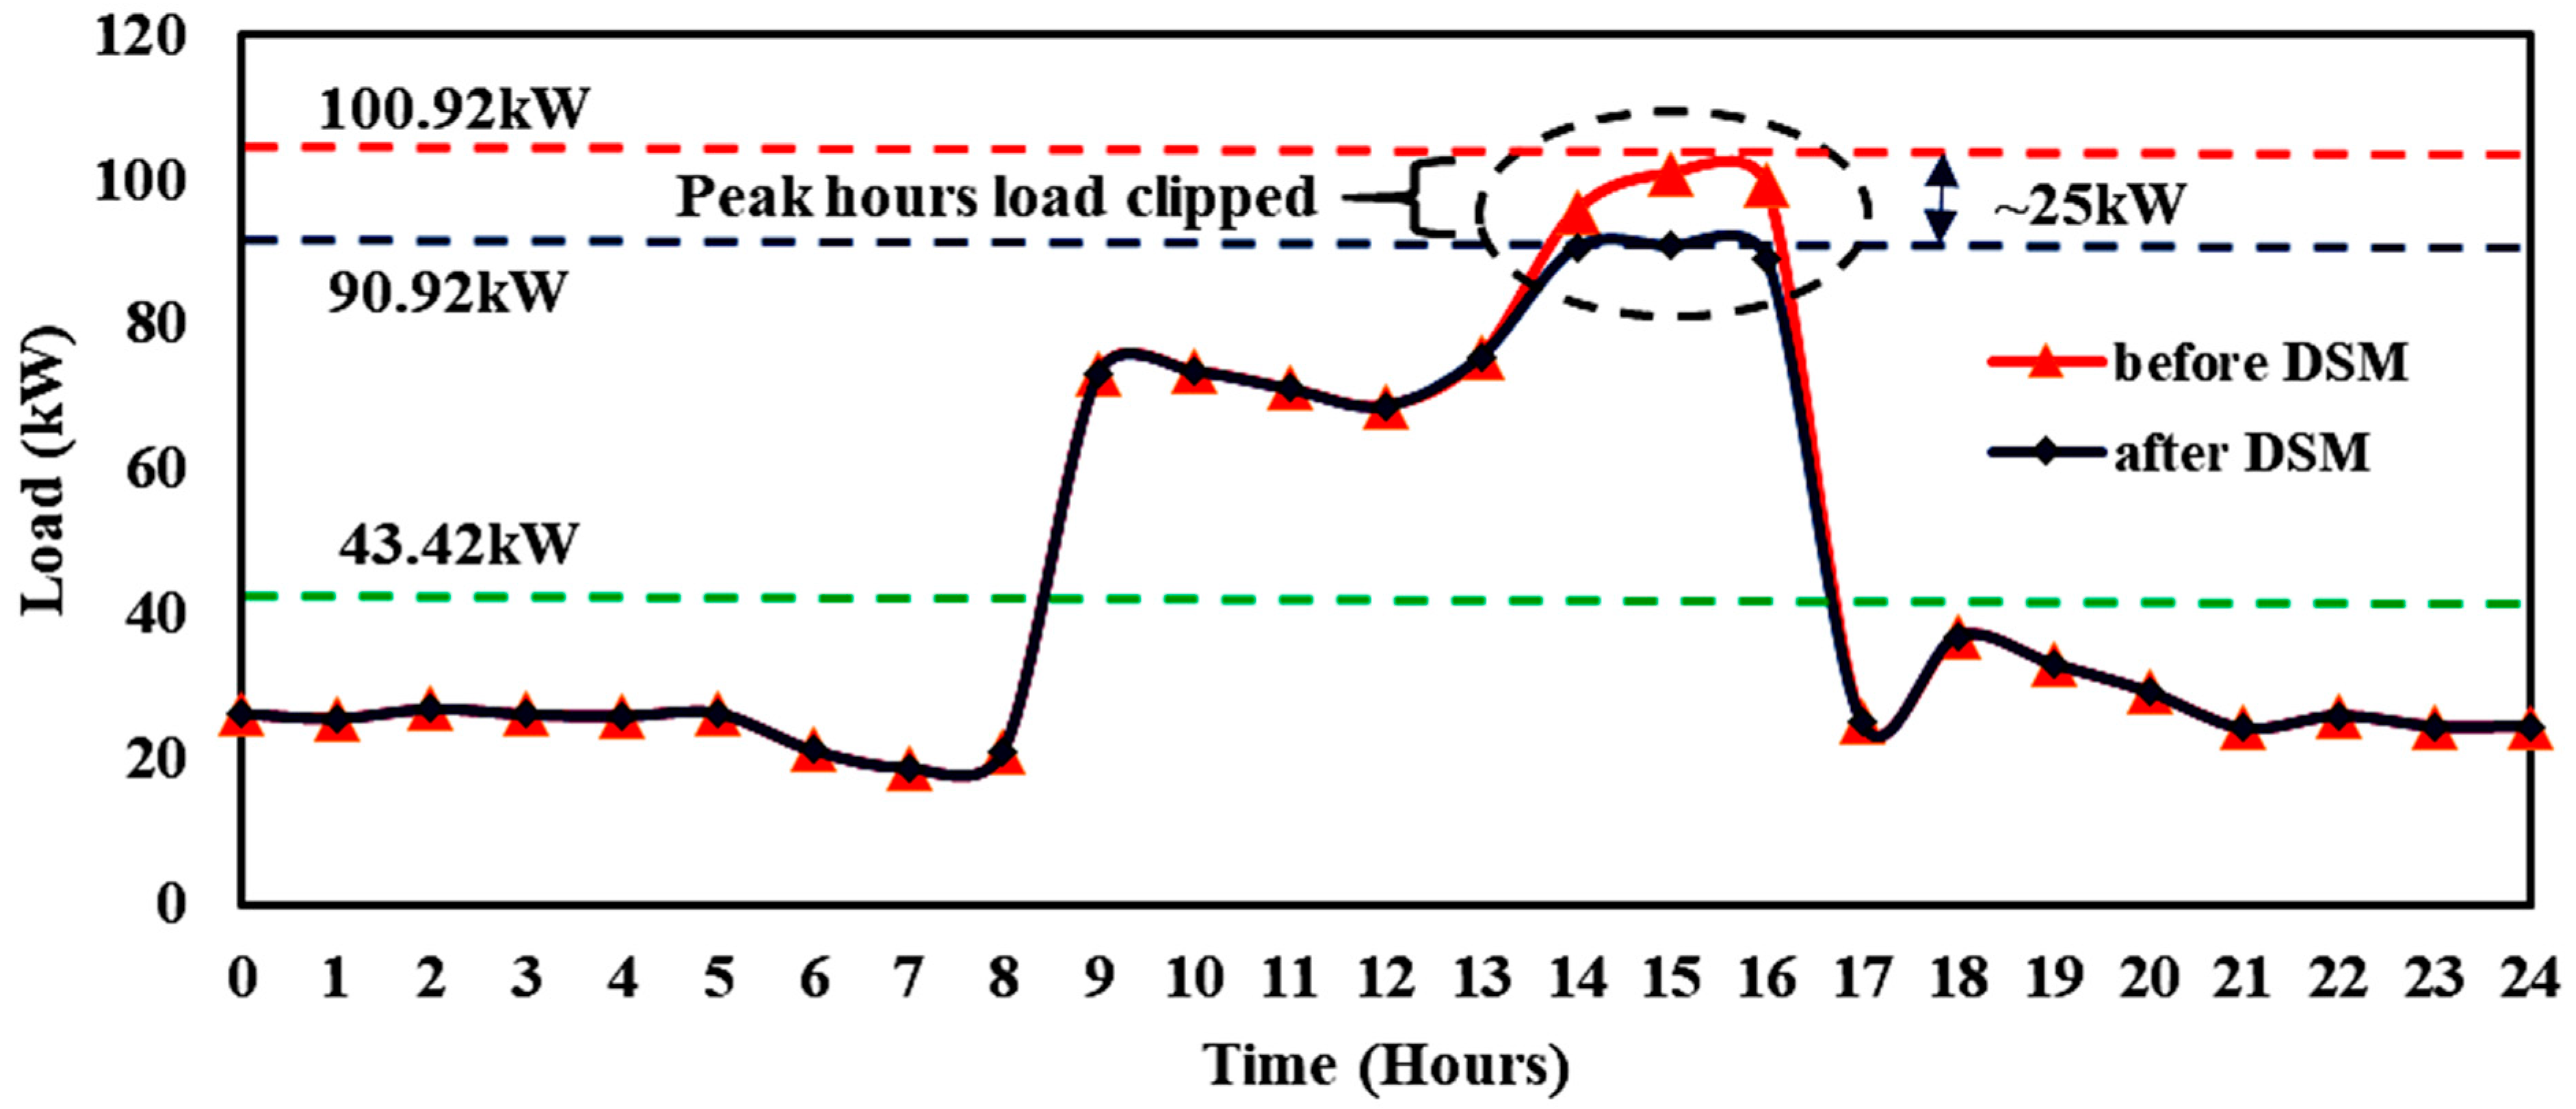
Using this prioritization of loads and subsequent process, the energy demand of the campus with DSM strategy was computed through HOMER tool. The outcomes are evaluated according to the peak load demands. By the peak clipping DSM technique, the maximum value of peak load reduced from 100.92 kW to 90.92 kW, and the average load reduced from 44.46 kW to 43.42 kW. Figure 4 shows the load profile of the system after the peak clipping DSM approach. In the load shifting approach, the deferrable load shifted during the off-peak period such that the maximum peak load was reduced by keeping the same average load. Figure 5 shows the load profile of the existing system after load shifting and is presented in Table 6. It demonstrates that the DSM strategy provides a minimum peak load in comparison to the system without DSM.
3.2. Determination of Monthly Peak Load—HOMER Tool
The HOMER tools can perform a renewable hybrid system analysis based on various sensitive parameters such as technical, economic, and environmental and hybrid system costs. It determines the peak load for a month based on the scaled annual average method. HOMER computes the peak load, saving energy using Equations (5) and (6)—National Renewable Energy Laboratory (NREL) [52]. It calculates the load factor through average load and peak load value.
- ΔkWgross is the Gross demand savings;
- Units indicate units of measure installed in the program;
- RLF refers to the rated load factor;
- kW/unit is the unit demand of measure;
- DF represents the diversity factor;
- CF is the coincidence factor;
- FLH is the full load hours;
- HVACd is for HVAC system interaction factor for demand.
In HOMER, to add randomness to the load data to make it more realistic, the random variability data are day to day and time step. First, it compiles the annual load data based on daily load profiles [53,54]. Then, it goes through that time series, and in each time step, it multiplies the value of that time step by a perturbation factor , given in Equation (7):
where,
- indicates the daily perturbation value;
- represents time stepperturbation value;
4. Results and Discussion
This section discusses the possibilities of inefficient load clipping/shifting in the real-time system and the importance of the load factor. Using pre-analysis of the load profile data per day, the peak hours occurring time period is identified. During this period, shift load to off-peak periods by ON and OFF switching in a smart manner following the prioritization, the sequence was denoted by ‘1’ and ‘0’, respectively, in the load shifting DSM technique. The system’s shiftable loads depend on the end-user’s priorities and are clearly explained in Section 3. Similarly, in the peak load clipping method, the shiftable load is clipped as per the end-user’s design. Mostly, the peak load source in the afternoon session of this institute can be clipped or shifted to the morning session by the below three possibilities (uses shiftable load) to control the maximum demand in peak hours:
- Altering the laboratory schedule between morning and afternoon sessions;
- Timer setting of an air-conditioner;
- Timer setting of water pumps for buildings.
Currently, most of the laboratory classes at this educational institute are conducted in the afternoon session, and there is no timer setting for the air-conditioner and water pumps. Therefore, these three possibilities have a strong influence on reducing the peak load during peak hours. Other options to reduce the peak load are
- Setting fixed maximum demand in the circuit breaker;
- Restructuring the entire electrical distribution network and circuit breaker programming;
- Increasing the renewable energy generation on the campus.
The first two are firmly not recommended from the above three possibilities, and the next one is increasing in renewable energy generation and is partially recommended. However, the main problem of installing a renewable energy plant requires very high capital cost. Therefore, it is concluded that the DSM approach significantly influenced the existing system and reduced peak load, resulting in a reduction in monthly demand charges of about $93. It is represented in Table 6 or before and after the DSM approach, and a reduction in maximum demand is noted [55,56]. The annual cost reduction of the existing energy system after the implementation of the DSM approach is approximately $1140, around 10%, per year in the electricity bill as per the Tamilnadu (a state of Indian Government) Generation, and Distribution Corporation (TANGEDCO) Limited revised tariff rates from the TNERC (Tamilnadu Electricity Regulatory Commission) Tariff Order.
The results also confirmed that the DSM strategy reduces peak load and reduction in the electric bill and prevents the installation of new power plants compared to the system without DSM.
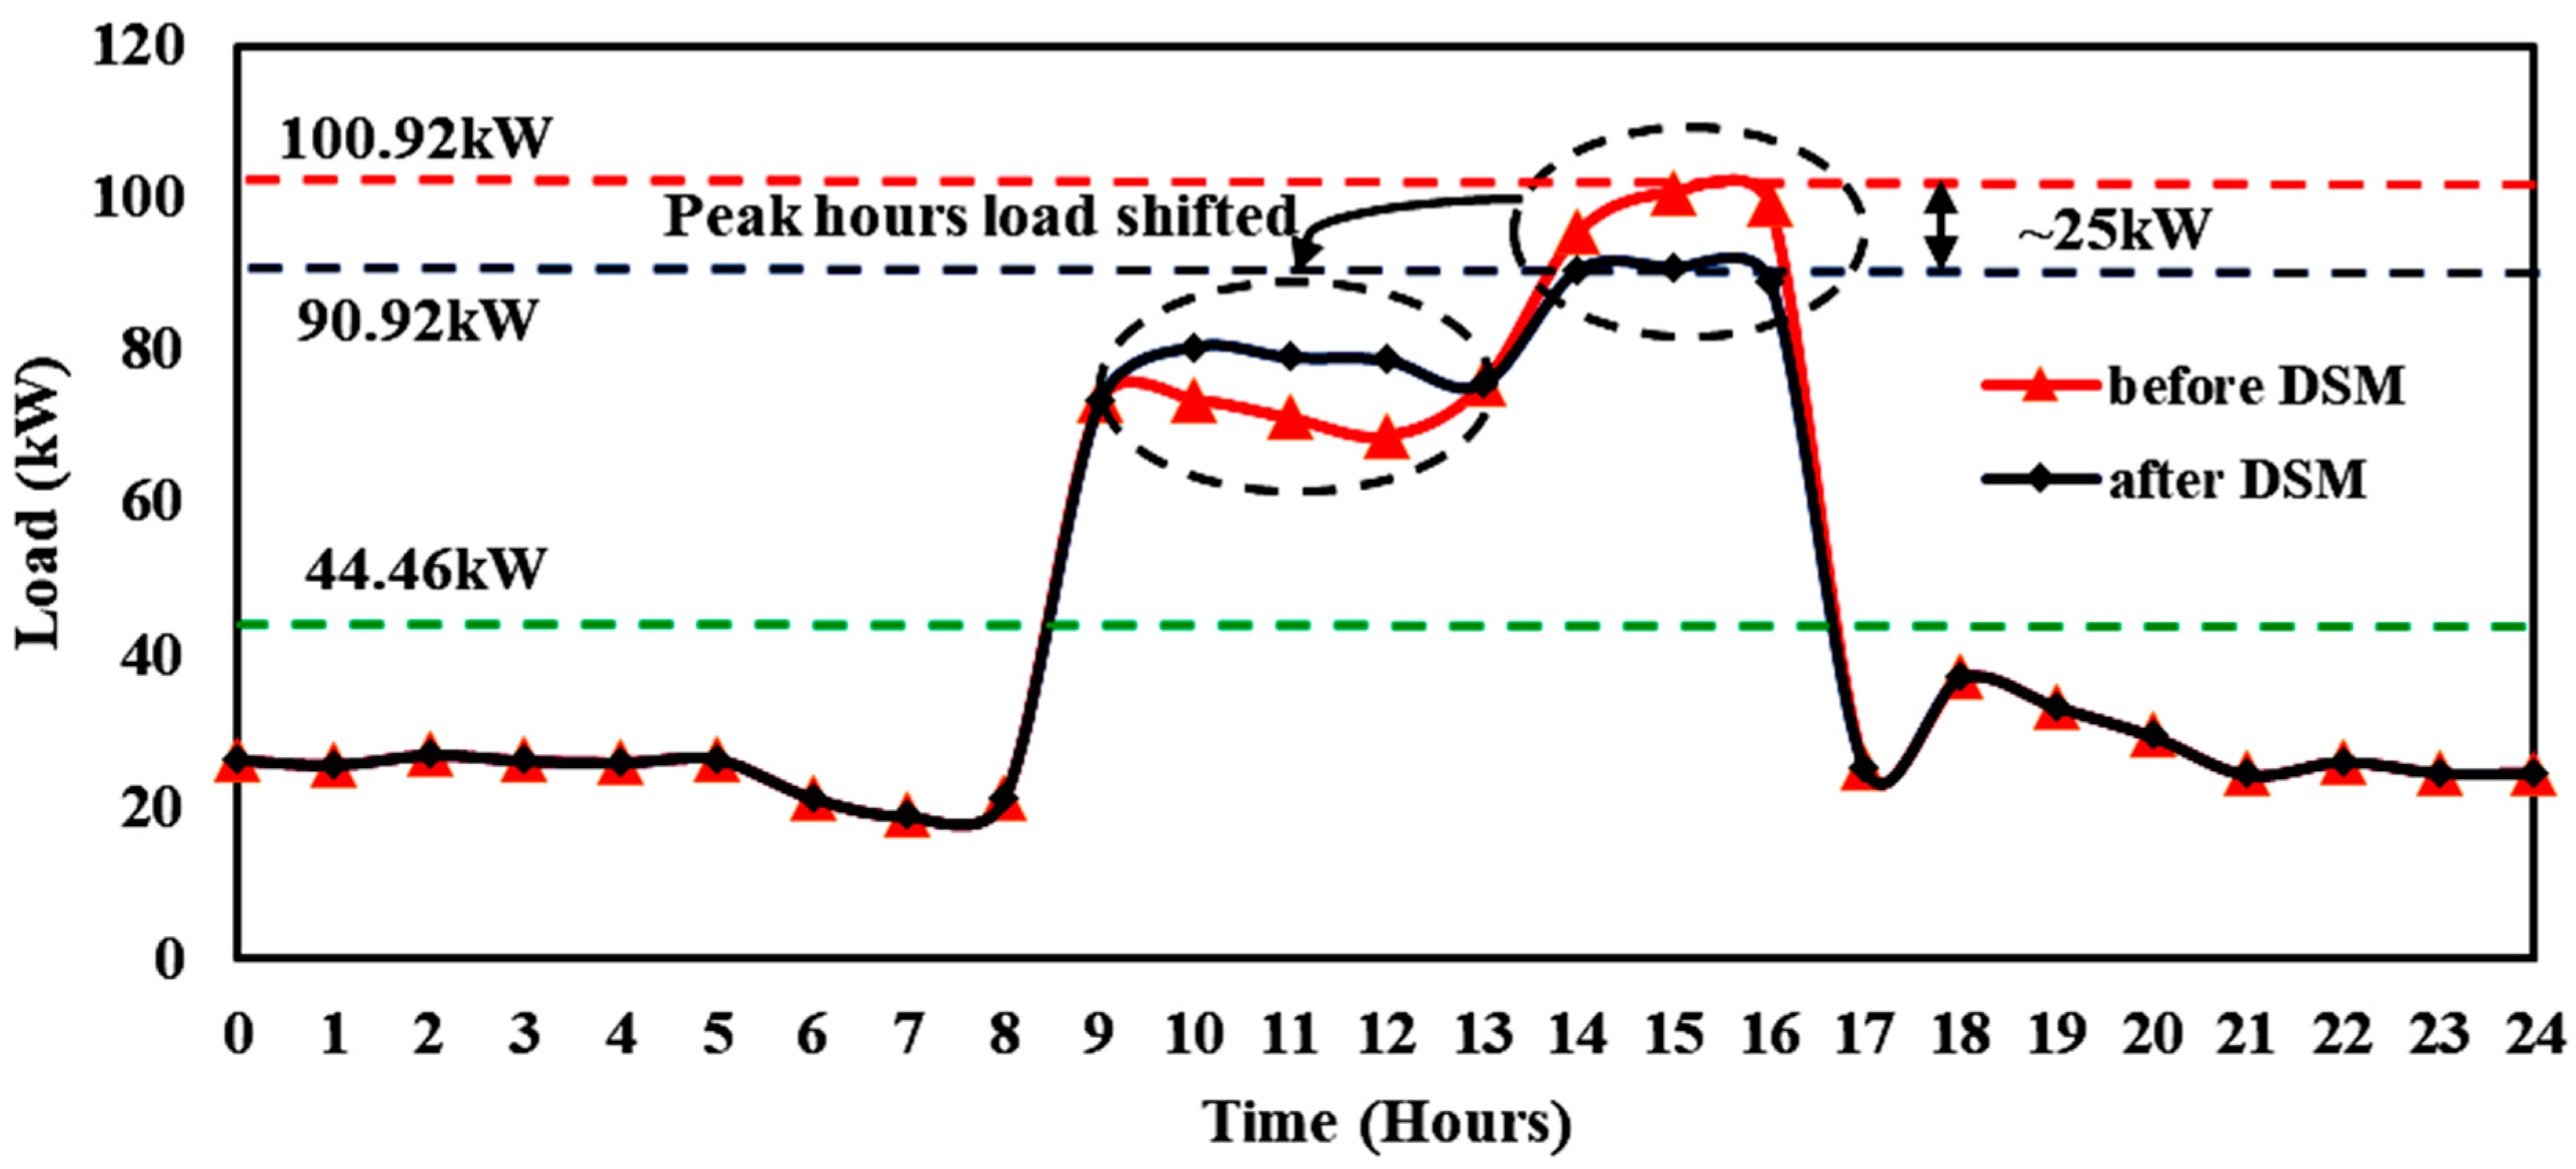
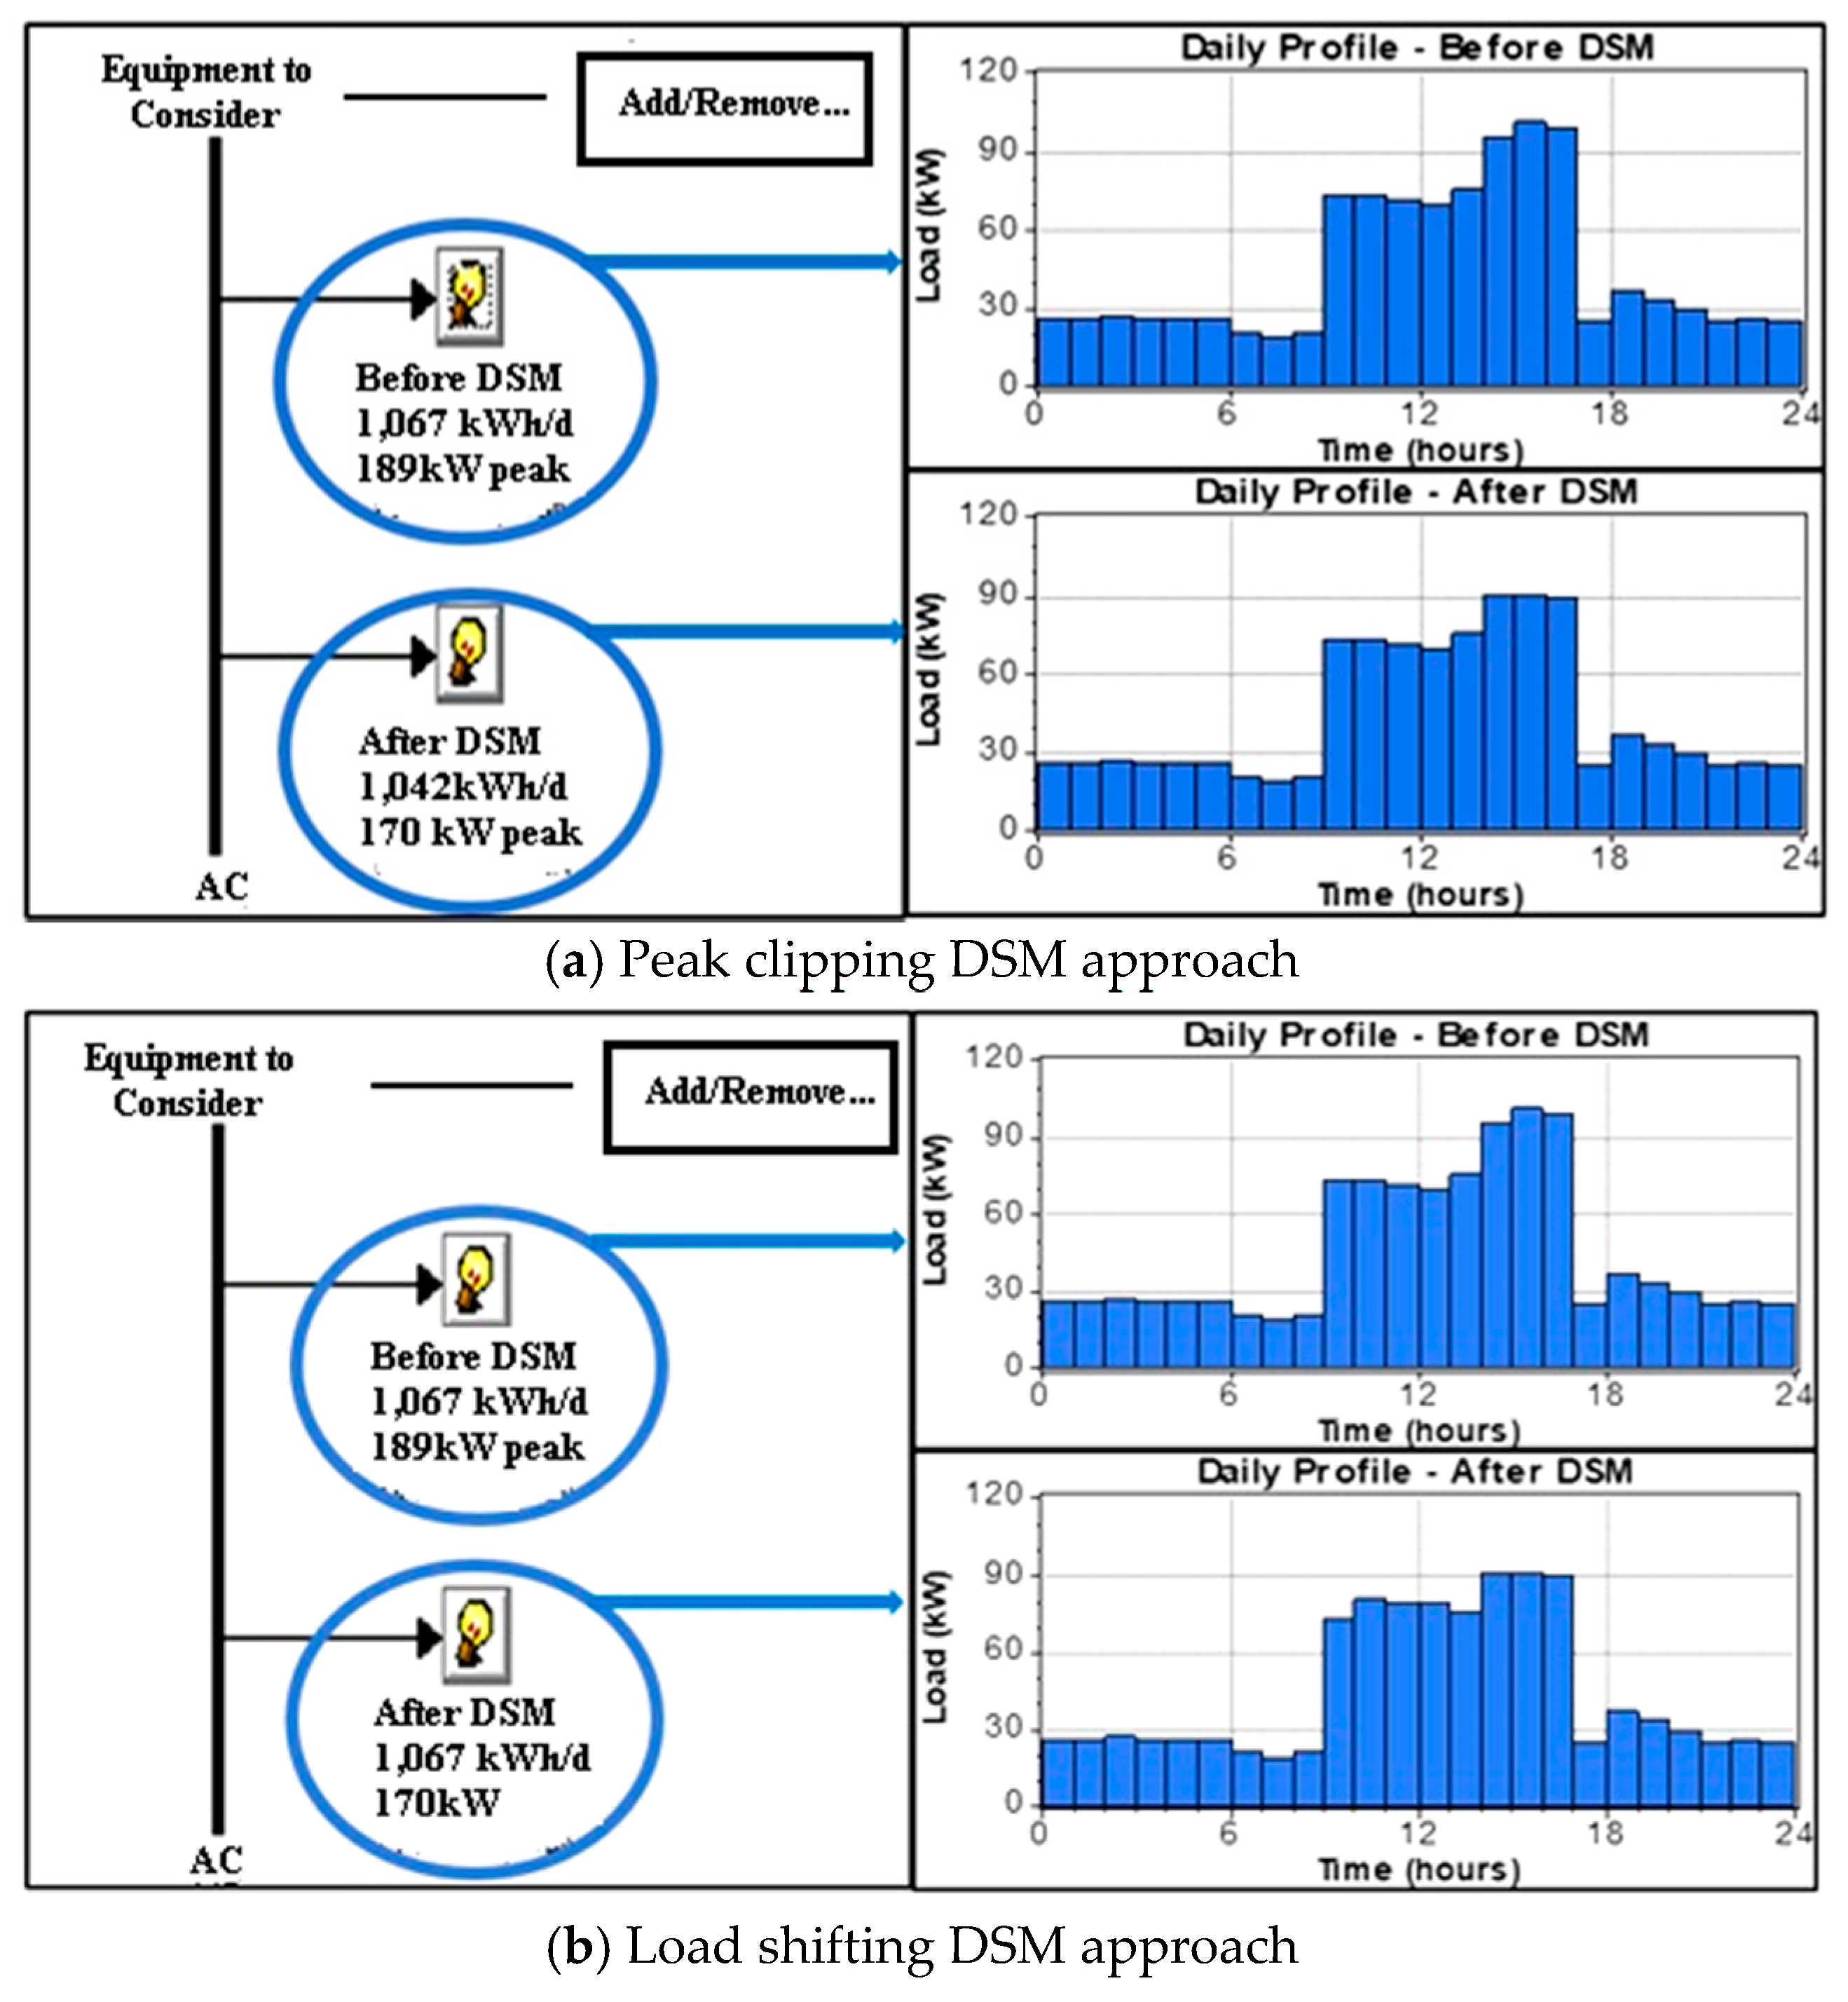
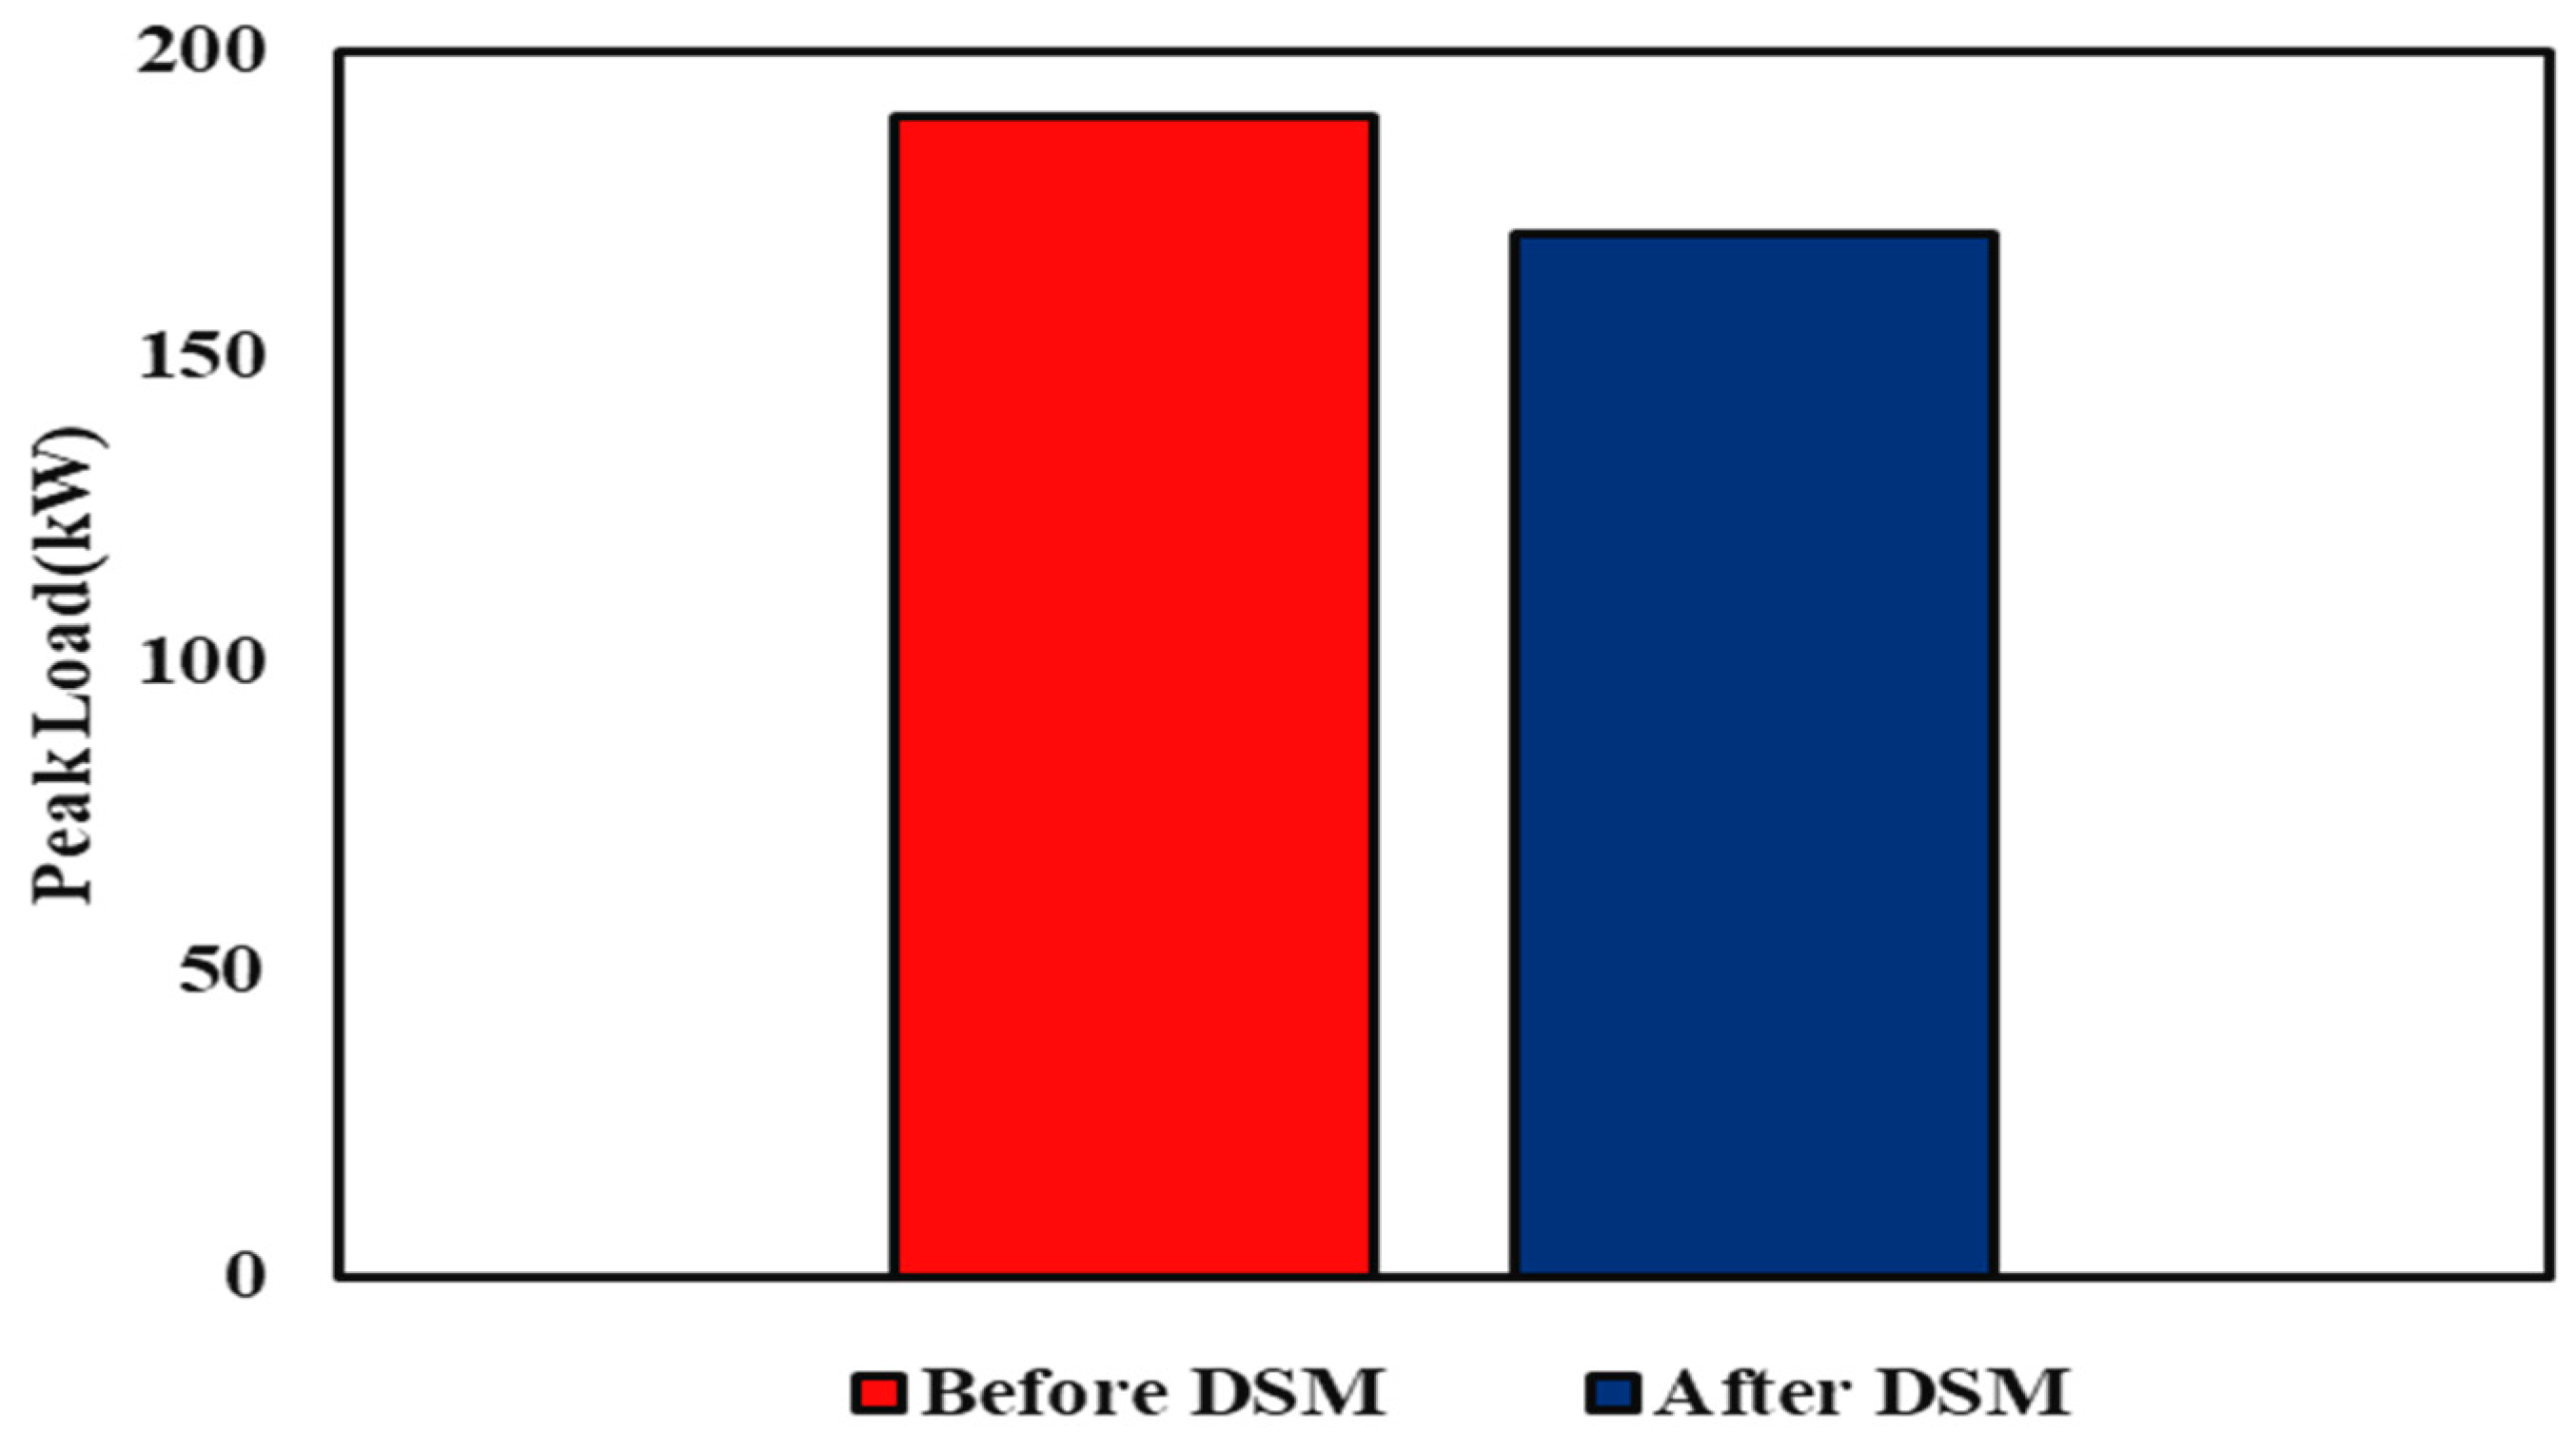
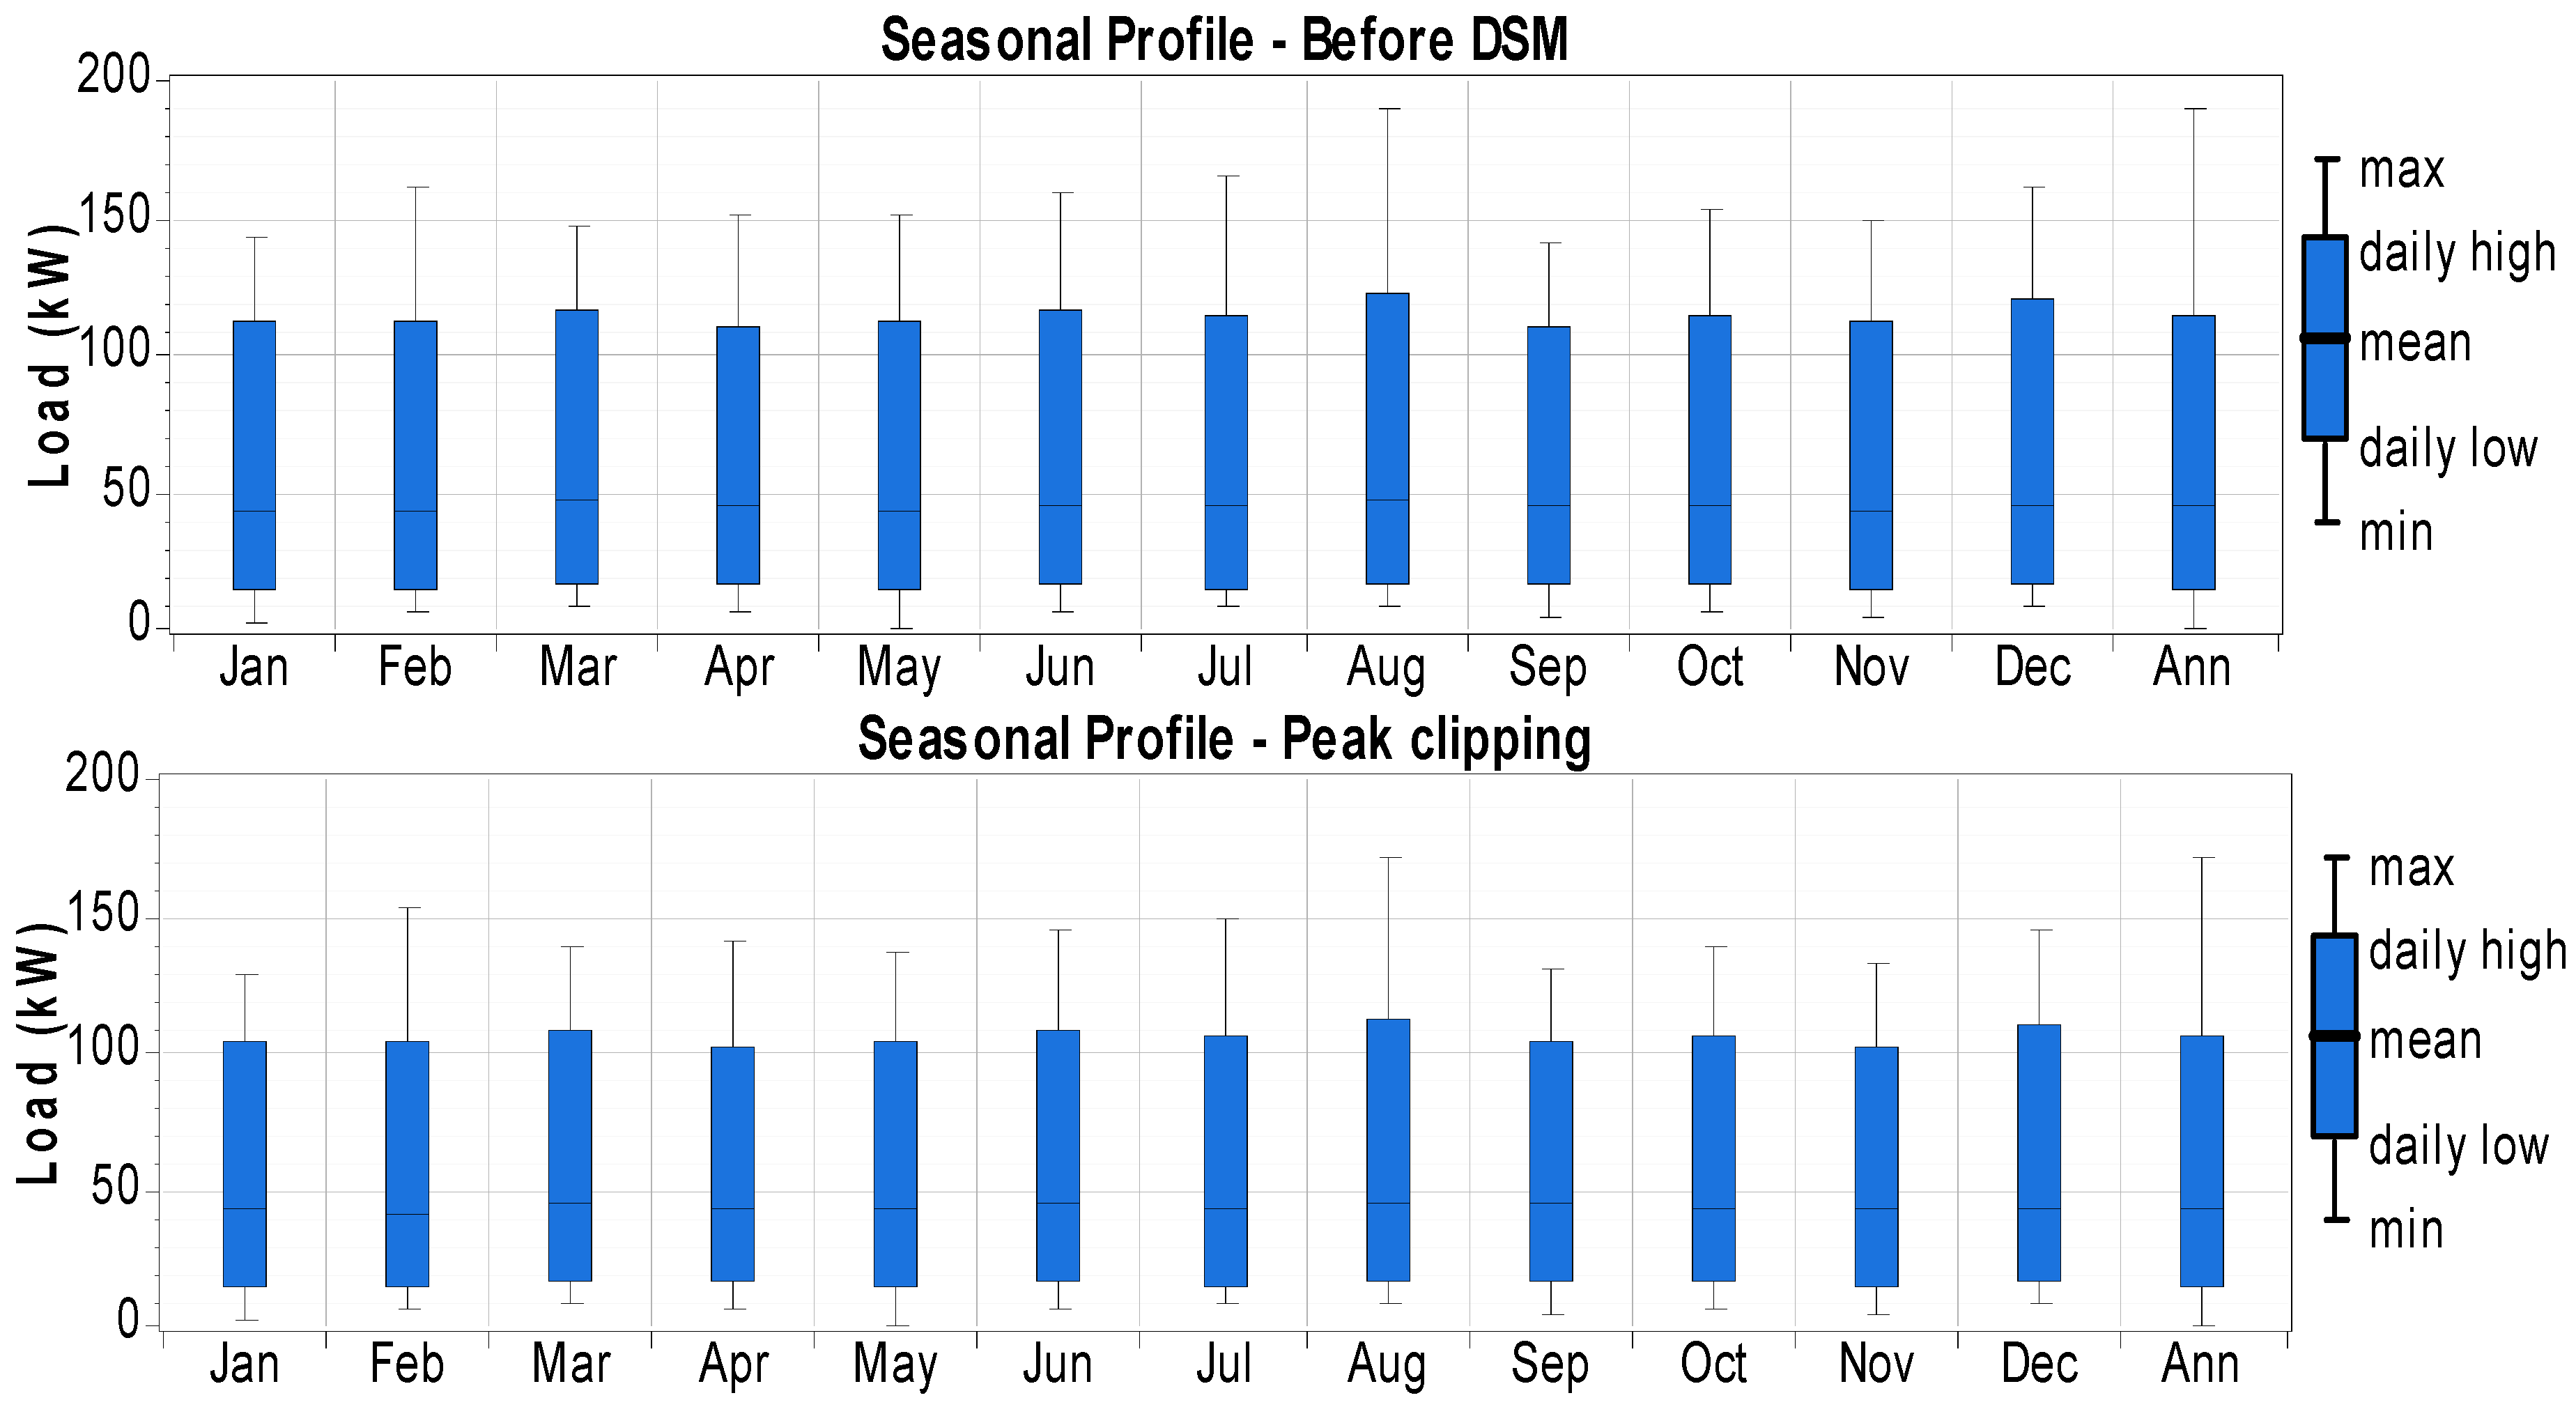
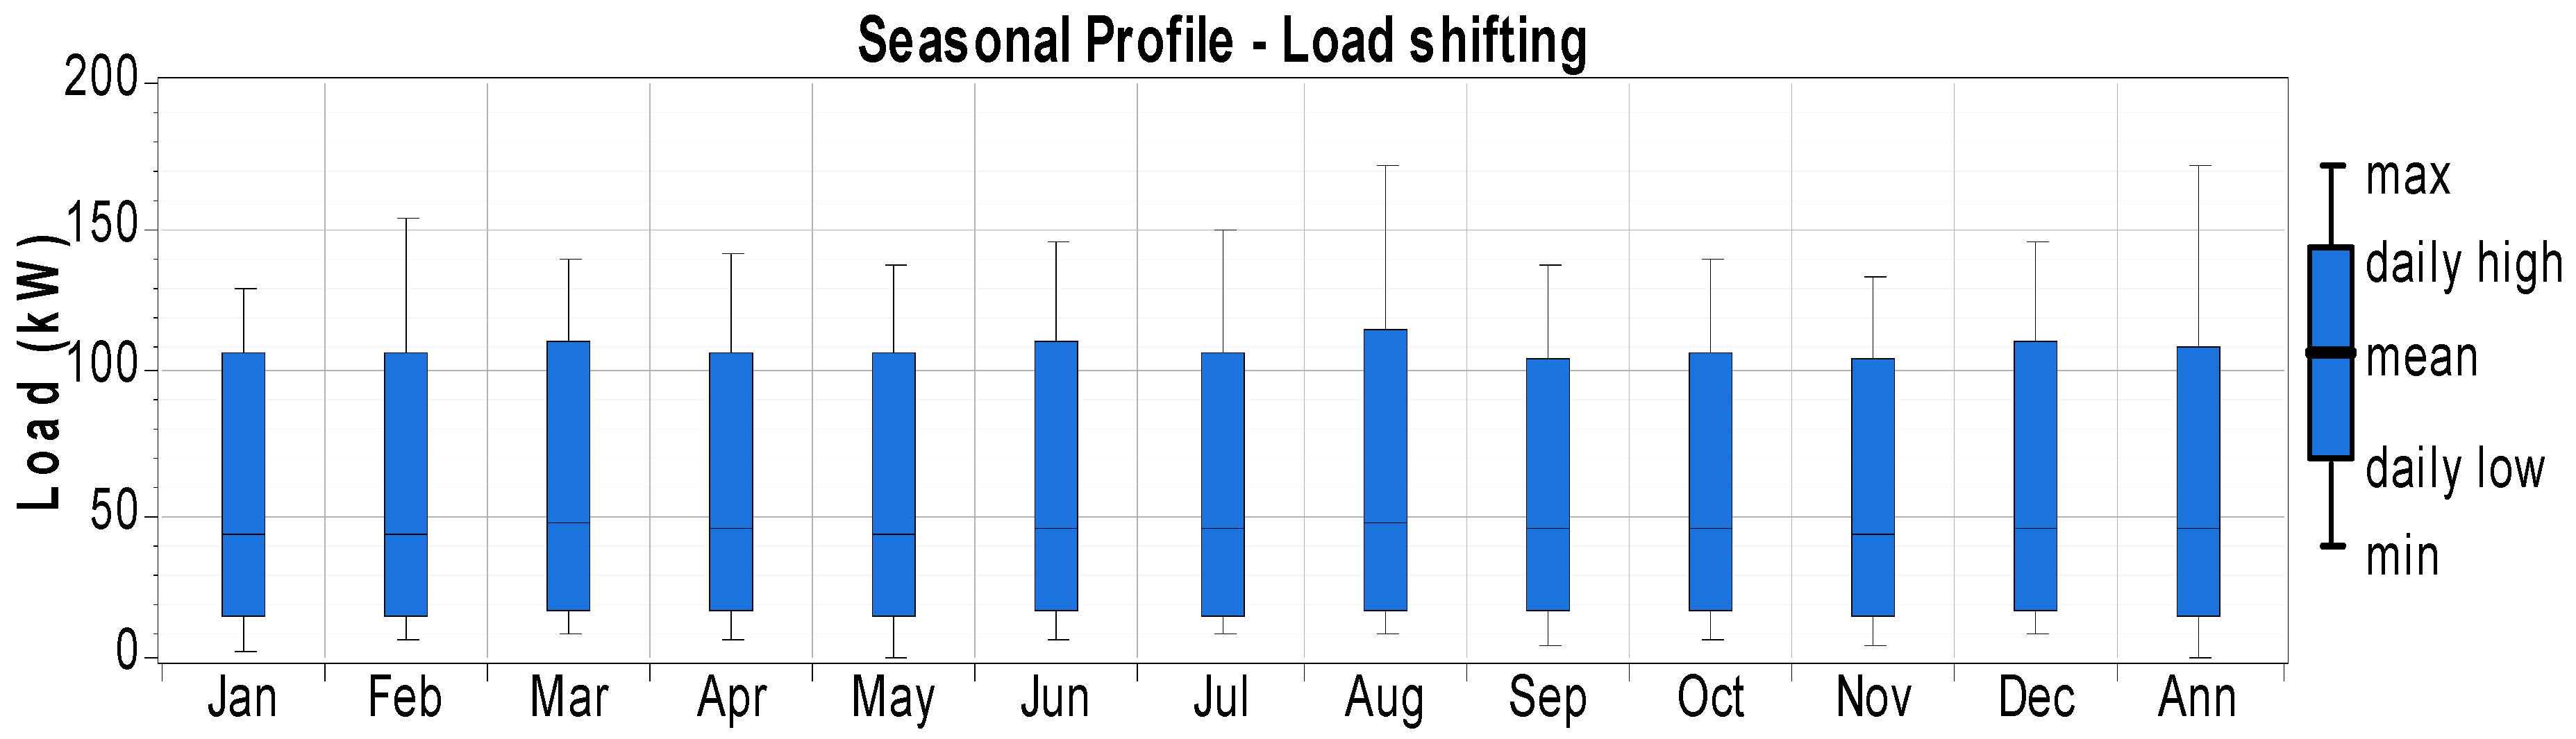
The DSM data response is given to the HOMER tool to calculate the monthly peak load. Figure 6a,b shows the simulation result of the daily load profile improvement in peak clipping and load shifting DSM approaches. The following observations are taken as follows: first, the maximum demand is reduced during peak hours, so that demand charges are definitely reduced, and also the load factor of the system is significantly increased; second, the utility will reschedule its investments (installing the new power source) to meet the load requirements. On top of that, it stimulates the user to consume less power during peak hours. The obtained monthly peak load for both methods is reduced from 189 kW to 170 kW (approximately 10%), around 19 kW for the same amount of daily load utilization (about 1060 kWh/d), which reduces the electricity charge approximately by $95 per month (Figure 7). Seasonal profiles for monthly peak loads for a year, both before and after DSM (peak clipping and load shifting), are obtained using the HOMER tool, which clearly shows that the measured demands of the reduction in peak demand for each month of the year did not exceed the mean values. Thus, a DSM approach is justified, which will lead to a significant reduction in the cost of electricity energy bills per year.
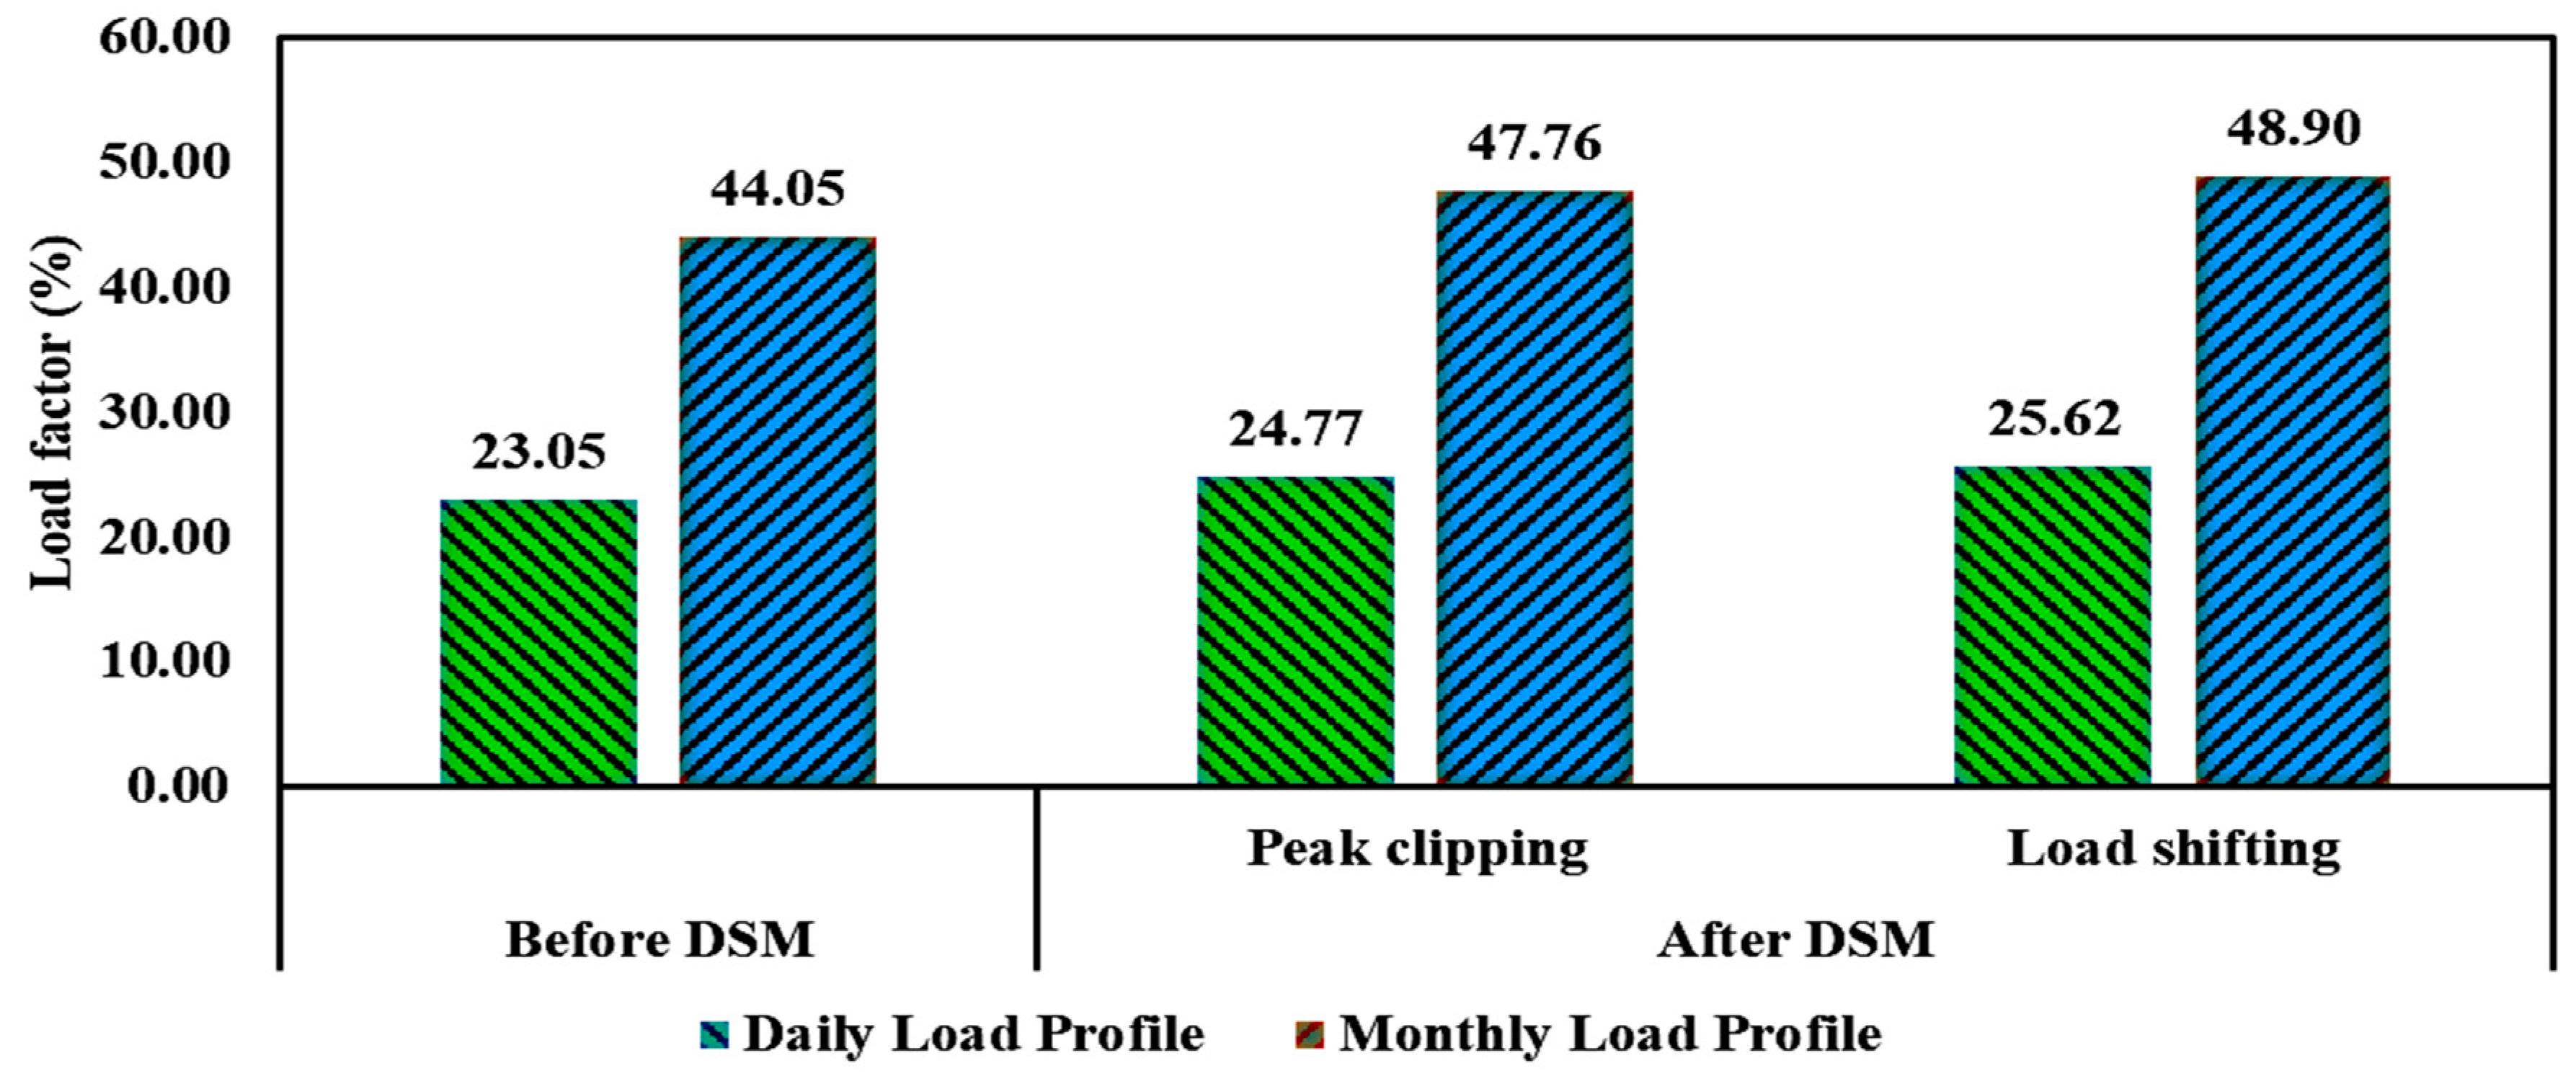
The flattening of the load profiles not only reduced the maximum demand, but also improved the load factor. The improvement of the load factor of the profile enables better use of the energy of the system. The load factor (LF) is obtained through average load and the maximum load in a given time period and is reported in Equation (7). The higher value of LF indicates that the load uses the electric system more efficiently.
The average load can be calculated using Equation (4). The load factor is obtained through daily and monthly load profile curves of the existing energy system, before and after the DSM approach, and is compared in Figure 8 and Figure 9. Table 7 shows that the average load demand is 44, and the peak demand is 90.92 kW for the daily load profile. Consequently, the load factor is increased by about 1.5%, taking into account the daily load profile and by 3.8% for the monthly load profile [57,58,59,60,61]. It is confirmed that increasing the load factor enhances the energy efficiency measures on campus.
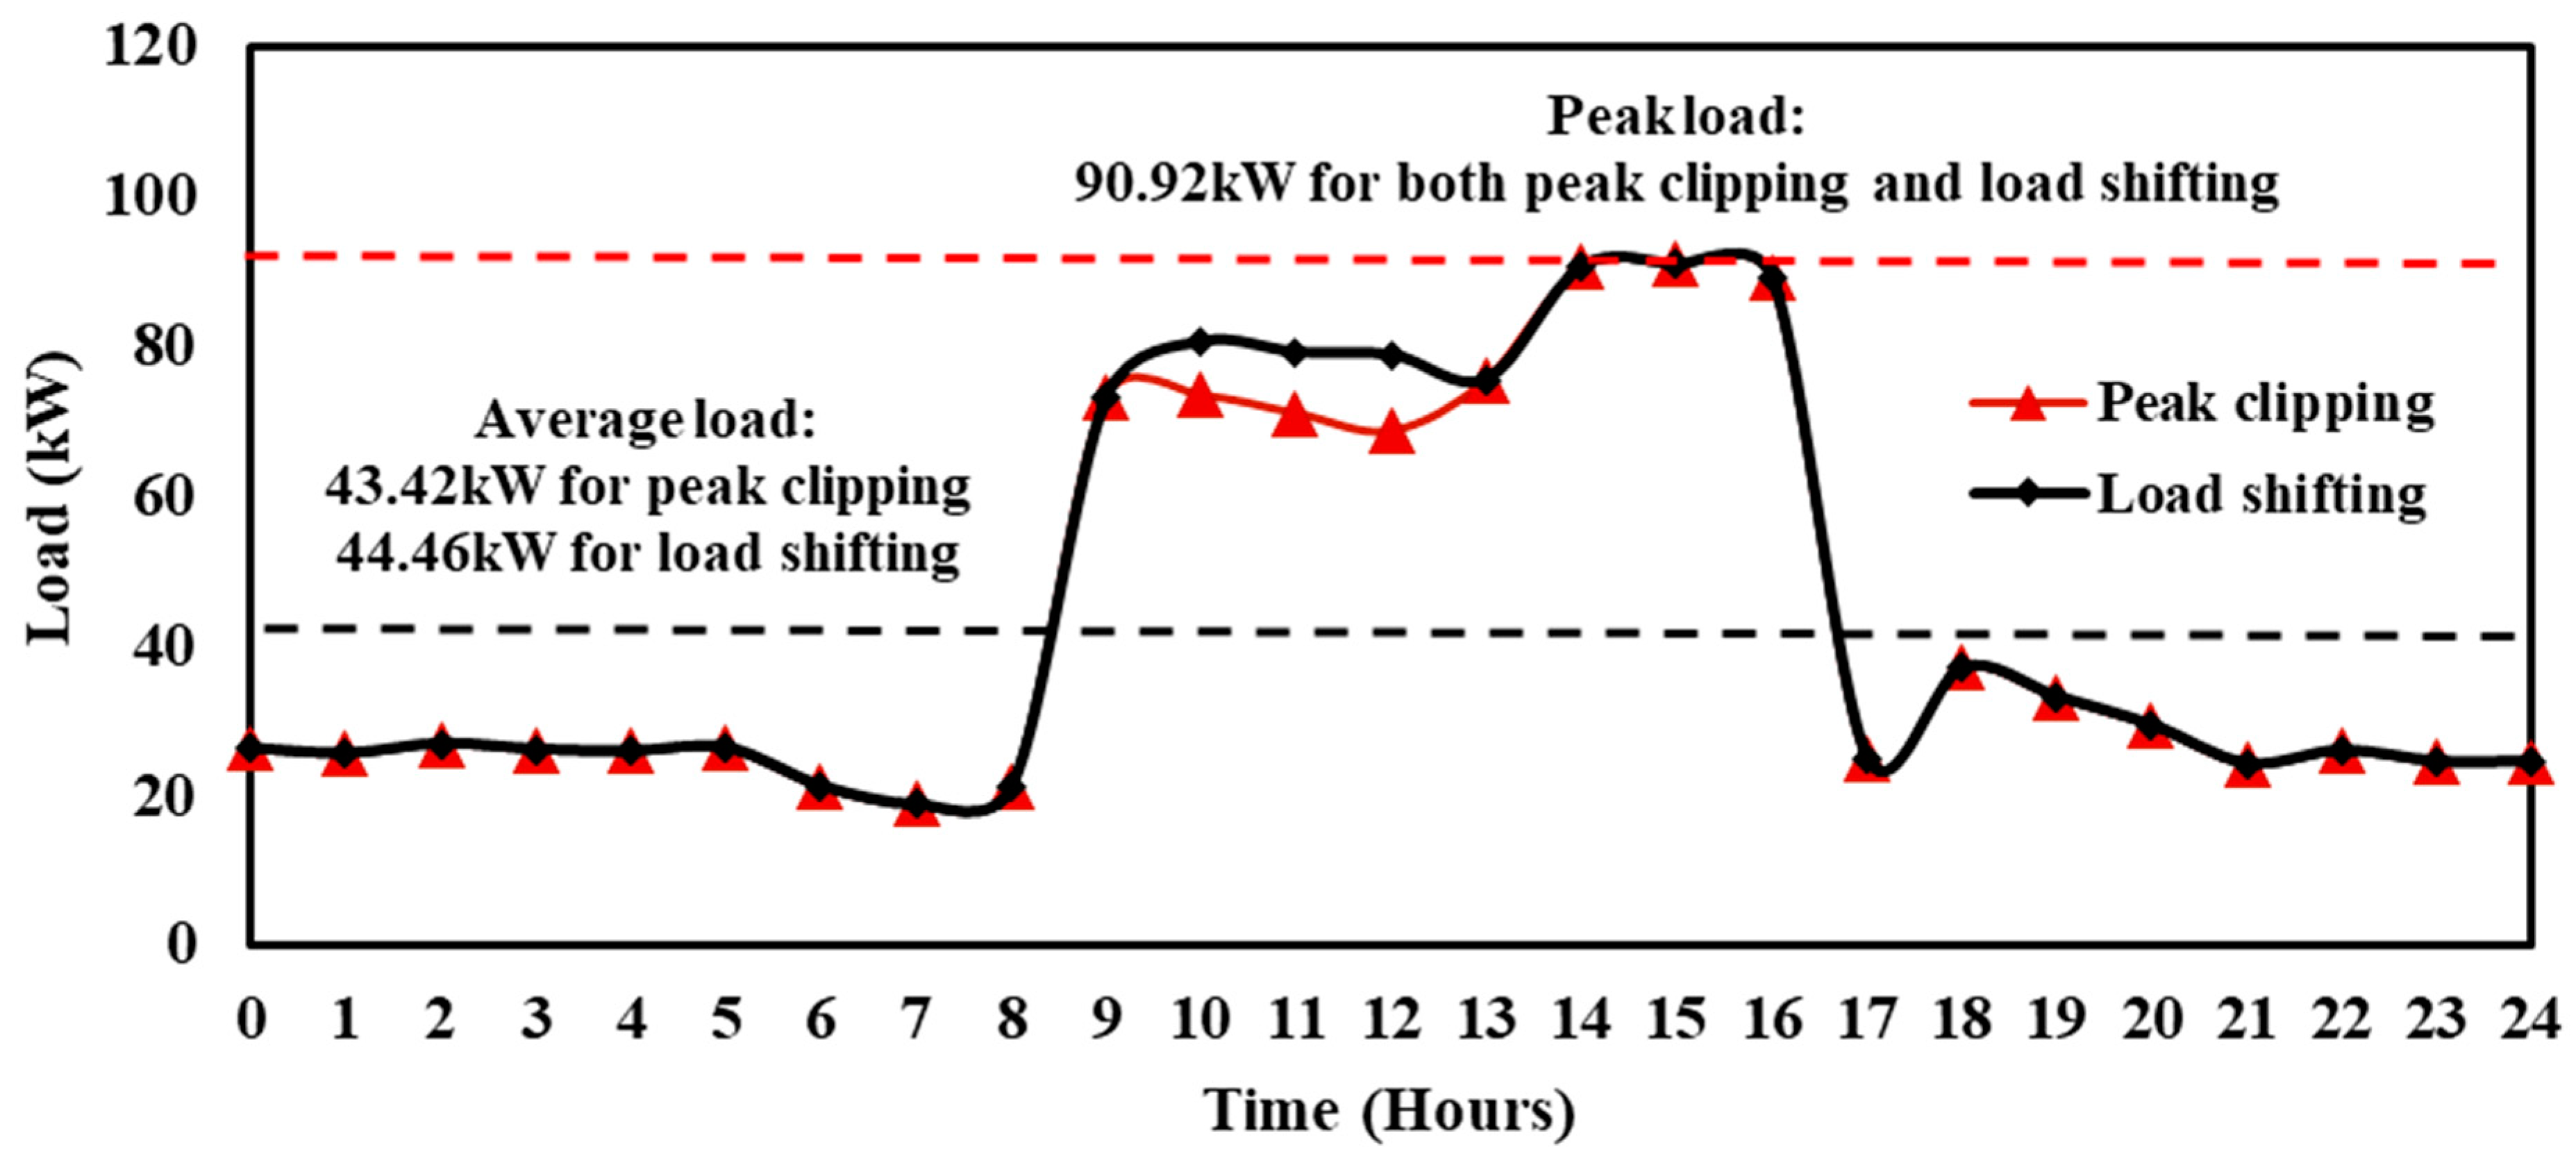
Furthermore, Figure 10 shows a comparison of the DSM approaches in the campus’ daily load curve. It is observed that the peak load is 90.92 kW, and the average loads of peak clipping and load shifting approaches are 43.42 kW and 44.46 kW, respectively. It clearly shows that the load shifting DSM approach gives a slightly better result as compared to the peak clipping technique while maintaining a satisfactory level of reliability. This change can be monitored by measurement and verification techniques in buildings [62].
It should be noted that the maximum demand period occurs roughly in 8–12% of the load profile and consumes approximately 8% more than the normal value of the total power of the system. Hence, installing a new power plant to satisfy this requirement is too expensive. The DSM approach was an effective solution to this issue. In the annual cost comparison of the existing energy system before and after implementing the DSM approach, approximately $1140 was saved per year on the electricity bill.
The overall benefits provided by DSM in the institute included an economic and technical point of view—avoiding the capital cost for installing a new power plant to meet out the maximum demand, efficient utilization of devices during peak hours, low-cost energy during energy consumption in off-peak periods, reduced electricity bill cost, up-gradation of the existing system, as well as improved system flexibility and balance.
5. Conclusions
In India, energy extraction from resources is insufficient to meet the current load demand; in this situation, the impact of DSM on the distribution network is analyzed. In this work, our DSM analysis was performed using peak clipping and load shifting technique in the case study location (ACGCET Campus, India) power utilization network. Using this approach, the load pattern was modified by clipping or changing shiftable load from peak time to non-peak time with a simple solver. Further, these DSM approaches’ benefits are no need for smart metering, information, and communication infrastructure, the less complexity of system operation, and minimum cost of implementation. This case study strategy has reduced the peak load demand and demand charges, which are performed using the HOMER simulation tool. At this campus, peak demand was reduced from 210 KVA to 190 KVA, or approximately 20 KVA, after implementing the DSM technique. By the energy supplier’s standards, the maximum demand charge is $5 per KVA, resulting in a reduction in the demand fee per month of approximately $95. In this investigation, several benefits can be obtained. Moreover, the objectives achieved with the proposed work are listed below:
- (i)
- Reduced the institute’s annual electricity consumption by 10% by sorting out the peaks shaved into the annual energy consumption;
- (ii)
- The approximate cost saved from the maximum demand is $95 per month (for annual cost saved is the cost of the demand charge in $/kW * Energy saved * 12 = $1140);
- (iii)
- The load factor of the energy network of the institute is increased up to 1.5% per day and 3.5% per month;
- (iv)
- Indirectly, greenhouse gas emissions (CO2) are reduced due to the shaving of peak demand energy. It is around 207.48 kg per annum (0.91 kg/kWh × 228 kWh) in India considering its Power Grid emission factor.
DSM analysis in the institutional building contributes to the sustainability of the active power distribution network rather than new plant facilities. The satisfactory simulation results confirmed that it might be executed in real-time on the campus. In general, the DSM approach improved the reliability and financial performance of the electrical power system network of the similar campus/network; the most significant points that were studied in this paper are highlighted as follows:
- (i)
- Encourage better energy management practices for the demand scheduling procedures that target the peak demand reduction in a public educational institution;
- (ii)
- This work is not only related to the maximum load, but also the average load and energy. These results are more sensible and a comprehensive reflection of DSM impacts on-campus that strengthen positive energy use behaviors;
- (iii)
- This analysis provides a direct way to learn the implications of the load factor;
- (iv)
- Save the demand charge bill amount, resources, and environmental damage by avoiding unnecessary over-investment in the peak load generating capacity power plant by the electricity sector.
Author Contributions
Conceptualization, R.D.; data curation, R.D. and M.B.; formal analysis, R.D. and T.S.B.; funding acquisition, B.N. and T.S.B.; project administration, M.B. and B.N.; investigation, R.D., M.B., and T.S.B.; methodology, R.D. and M.B.; resources, R.D., T.S.B., and B.N.; software, R.D.; supervision, B.N. and T.S.B.; writing—original draft, R.D. and M.B.; writing—review & editing, T.S.B. and B.N. All authors have read and agreed to the published version of the manuscript.
Funding
This research received no external funding.
Institutional Review Board Statement
Not applicable.
Informed Consent Statement
Not applicable.
Acknowledgments
The authors are also thankful to the World Bank-sponsored Technical Education Quality Improvement Program (TEQIP)—Government of India, Institute of ACGCET, Tamilnadu, India, have all supported to complete this research work.
Conflicts of Interest
The authors declare no conflict of interest.The funders had no role in the design of the study; in the collection, analyses, or interpretation of data; in the writing of the manuscript, or in the decision to publish the results.
References
- Babu, T.S.; Vasudevan, K.R.; Ramachandaramurthy, V.K.; Sani, S.B.; CheMud, S.; Lajim, R.M. A Comprehensive Review of Hybrid Energy Storage Systems: Converter Topologies, Control Strategies and Future Prospects. IEEE Access 2020, 8, 148702–148721. [Google Scholar] [CrossRef]
- Barbarelli, S.; Florio, G.; Zupone, G.L.; Scornaienchi, N.M. First techno-economic evaluation of array configuration of self-balancing tidal kinetic turbines. Renew. Energy 2018, 129, 183–200. [Google Scholar] [CrossRef]
- Kinhekar, N.; Padhy, N.P.; Gupta, H.O. Demand side management for residential consumers. In Proceedings of the 2013 IEEE Power & Energy Society General Meeting, Vancouver, BC, Canada, 21–25 July 2013; pp. 1–15. [Google Scholar]
- Energy Conservation Act. Ministry of Power, New Delhi, India. 2017. Available online: http://www.powermin.nic.in/acts_notofication/energy_conservation_act/index.html (accessed on 2 September 2020).
- Load Generation Balance Report. Central Electricity Authority, Ministry of Power, Government of India. 2019–2020. Available online: http://www.cea.nic.in/report.html (accessed on 20 August 2020).
- Harish, V.; Kumar, A. Demand side management in India: Action plan, policies and regulations. Renew. Sustain. Energy Rev. 2014, 33, 613–624. [Google Scholar] [CrossRef]
- Barbarelli, S.; Florio, G.; Scornaienchi, N. Developing of a small power turbine recovering energy from low enthalpy steams or waste gases: Design, building and experimental measurements. Therm. Sci. Eng. Prog. 2018, 6, 346–354. [Google Scholar] [CrossRef]
- Piras, G.; Pini, F.; Garcia, D.A. Correlations of PM10 concentrations in urban areas with vehicle fleet development, rain precipitation and diesel fuel sales. Atmos. Pollut. Res. 2019, 10, 1165–1179. [Google Scholar] [CrossRef]
- Groppi, D.; Astiaso Garcia, D.; Lo Basso, G.; De Santoli, L. Synergy between smart energy systems simulation tools for greening small mediterranean islands. Renew. Energy 2019, 135, 515–524. [Google Scholar] [CrossRef]
- United Nations Industrial Development Organization. Supply Side Management—Module 13. Sustainable Energy Regulation and Policy Making for Africa. Available online: http://africa-toolkit.reeep.org/modules/Module13.pdf (accessed on 23 July 2020).
- Mancini, F.; Nardecchia, F.; Groppi, D.; Ruperto, F.; Romeo, C. Indoor Environmental Quality Analysis for Optimizing Energy Consumptions Varying Air Ventilation Rates. Sustainability 2020, 12, 482. [Google Scholar] [CrossRef] [Green Version]
- Kirschen, D.S. Demand-side view of electricity markets. IEEE Trans. Power Syst. 2003, 18, 520–527. [Google Scholar] [CrossRef] [Green Version]
- Esther, B.P.; Kumar, K.S. A survey on residential Demand Side Management architecture, approaches, optimization models and methods. Renew. Sustain. Energy Rev. 2016, 59, 342–351. [Google Scholar] [CrossRef]
- Behrangrad, M. A review of demand side management business models in the electricity market. Renew. Sustain. Energy Rev. 2015, 47, 270–283. [Google Scholar] [CrossRef]
- Vardakas, J.S.; Zorba, N.; Verikoukis, C.V. A survey on demand response programs in smart grids: Pricing methods and optimization algorithms. IEEE Commun. Surv. Tutor. 2015, 17, 152–178. [Google Scholar] [CrossRef]
- Ming, Z.; Song, X.; Mingjuan, M.; Lingyun, L.; Min, C.; Yuejin, W. Historical review of demand side management in China: Management content, operation mode, results assessment and relative incentives. Renew. Sustain. Energy Rev. 2013, 25, 470–482. [Google Scholar] [CrossRef]
- Wang, Q.; Zhang, C.; Ding, Y.; Xydis, G.; Wang, J.; Østergaard, J. Review of real-time electricity markets for integrating distributed energy resources and demand response. Appl. Energy 2015, 138, 695–706. [Google Scholar] [CrossRef]
- Alasseri, R.; Tripathi, A.; Rao, T.J.; Sreekanth, K. A review on implementation strategies for demand side management (DSM) in Kuwait through incentive-based demand response programs. Renew. Sustain. Energy Rev. 2017, 77, 617–635. [Google Scholar] [CrossRef]
- Zehir, M.A.; Batman, A.; Bagriyanik, M. Review and comparison of demand response options for more effective use of renewable energy at consumer level. Renew. Sustain. Energy Rev. 2016, 56, 631–642. [Google Scholar] [CrossRef]
- Jabir, H.J.; Teh, J.; Ishak, D.; Abunima, H. Impacts of Demand-Side Management on Electrical Power Systems: A Review. Energies 2018, 11, 190. [Google Scholar] [CrossRef] [Green Version]
- Torriti, J. Peak Energy Demand and Demand Side Response, 1st ed.; Routledge: New York, NY, USA, 2016. [Google Scholar] [CrossRef]
- Newsham, G.R.; Bowker, B.G. The effect of utility time-varying pricing and load control strategies on residential summer peak electricity use: A review. Energy Policy 2010, 38, 3289–3296. [Google Scholar] [CrossRef] [Green Version]
- Khan, I. Energy-saving behaviour as a demand-side management strategy in the developing world: The case of Bangladesh. Int. J. Energy Environ. Eng. 2019, 10, 493–510. [Google Scholar] [CrossRef] [Green Version]
- Gilbert, B.; Graff Zivin, J. Dynamic Salience with Intermittent Billing: Evidence from Smart Electricity Meters. 2013. Available online: http://www.nber.org/papers/w19510 (accessed on 22 October 2018).
- Allcott, H.; Rogers, T. The Short-Run and Long-Run Effects of Behavioral Interventions: Experimental Evidence from Energy Conservation. Am. Econ. Rev. 2014, 104, 3003–3037. [Google Scholar] [CrossRef] [Green Version]
- Asensio, O.I.; Delmas, M.A. The dynamics of behavior change: Evidence from energy conservation. J. Econ. Behav. Organ. 2016, 126, 196–212. [Google Scholar] [CrossRef] [Green Version]
- Tronchin, L.; Manfren, M.; Tagliabue, L.C. Optimization of building energy performance by means of multi-scale analysis—Lessons learned from case studies. Sustain. Cities Soc. 2016, 27, 296–306. [Google Scholar] [CrossRef]
- Khripko, D.; Morioka, S.; Evans, S.; Hesselbach, J.; De Carvalho, M. Demand Side Management within Industry: A Case Study for Sustainable Business Models. Procedia Manuf. 2017, 8, 270–277. [Google Scholar] [CrossRef]
- Apajalahti, E.-L.; Lovio, R.; Heiskanen, E. From demand side management (DSM) to energy efficiency services: A Finnish case study. Energy Policy 2015, 81, 76–85. [Google Scholar] [CrossRef]
- Mancini, F.; Romano, S.; Lo Basso, G.; Cimaglia, J.; de Santoli, L. How the Italian Residential Sector Could Contribute to Load Flexibility in Demand Response Activities: A Methodology for Residential Clustering and Developing a Flexibility Strategy. Energies 2020, 13, 3359. [Google Scholar] [CrossRef]
- Manfren, M.; Nastasi, B.; Tronchin, L. Linking Design and Operation Phase Energy Performance Analysis through Regression-Based Approaches. Front. Energy Res. 2020, 8, 288. [Google Scholar] [CrossRef]
- Li, D.; Chiu, W.-Y.; Sun, H. Demand Side Management in Microgrid Control Systems. In Microgrid; Butterworth-Heinemann: Oxford, UK, 2017; pp. 203–230. [Google Scholar] [CrossRef]
- Jabir, H.J.; Teh, J.; Ishak, D.; Abunima, H. Impact of Demand-Side Management on the Reliability of Generation Systems. Energies 2018, 11, 2155. [Google Scholar] [CrossRef] [Green Version]
- Nolan, S.; O’Malley, M. Challenges and barriers to demand response deployment and evaluation. Appl. Energy 2015, 152, 1–10. [Google Scholar] [CrossRef]
- Lu, R.; Hong, S.H.; Zhang, X. A dynamic pricing demand response algorithm for smart grid: Reinforcement learning approach. Appl. Energy 2018, 220, 220–230. [Google Scholar] [CrossRef]
- Sharifi, R.; Fathi, S.H.; Vahidinasab, V. A review on Demand side tools in electricity market. Renew. Sustain. Energy Rev. 2017, 72, 565–572. [Google Scholar] [CrossRef]
- Guzman, C.; Cardenas, A.; Agbossou, K. Local Estimation of Critical and Off-Peak Periods for Grid-Friendly Flexible Load Management. IEEE Syst. J. 2020, 14, 4262–4271. [Google Scholar] [CrossRef]
- Syafrudin, M.; Abd, H.A.R. Demand control & monitoring system as the potential of energy saving. In Proceedings of the 2014 IEEE Student Conference on Research and Development, Batu Ferringhi, Malaysia, 16–17 December 2014; pp. 1–6. [Google Scholar]
- Tenaga Nasional Berhad, Electricity Pricing, and Tariff. 2014. Available online: https://www.tnb.com.my/commercial-industrial/maximum-demand (accessed on 20 August 2020).
- Homer Energy, NREL. Available online: http://www.homerenergy.com/ (accessed on 7 September 2020).
- Tamil Nadu Generation and Distribution Corporation Limited(TANGEDCO). Electricity Service Number: 059094600008. Available online: https://www.tnebnet.org/awp/login (accessed on 7 September 2020).
- Tamil Nadu Generation and Distribution Corporation Limited Revised Tariff rates from 12.12.2014 Ordered in TNERC Tariff Order Dated 11.12.2014 Subsidized Rate (Payable by the Consumer). Available online: https://www.tangedco.gov.in/linkpdf/Tariff%20payable%20by%20consumer(12.12.2014).pdf (accessed on 1 September 2020).
- Tamil Nadu Electricity Regulatory Commission, Determination of Tariff for Generation and Distribution Manual, T.P.No.1 of 2013 Order Dated: 20-06-2013. Available online: https://www.tangedco.gov.in/linkpdf/Tariff1.pdf (accessed on 1 September 2020).
- Salama, M.M.; Saied, E.M.; Mahmoud, H.M.; Abdelhadi, H.A. Residential Loads and Application of Demand Side Management (DSM) Techniques; Benha University: Cairo, Egypt, 2013. [Google Scholar]
- Barbarelli, S.; Amelio, M.; Florio, G.; Scornaienchi, N. Procedure Selecting Pumps Running as Turbines in Micro Hydro Plants. Energy Procedia 2017, 126, 549–556. [Google Scholar] [CrossRef]
- Mazzoni, S.; Rajoo, S.; Romagnoli, A. A boil-off gas utilization for improved performance of heavy duty gas turbines in combined cycle. Proc. Inst. Mech. Eng. Part A J. Power Energy 2019, 233, 96–110. [Google Scholar] [CrossRef]
- Groppi, D.; Garcia, D.A.; Basso, G.L.; Cumo, F.; De Santoli, L. Analysing economic and environmental sustainability related to the use of battery and hydrogen energy storages for increasing the energy independence of small islands. Energy Convers. Manag. 2018, 177, 64–76. [Google Scholar] [CrossRef]
- Cerri, G.; Chennaoui, L.; Giovannelli, A.; Mazzoni, S. Expander models for a generic 300 MW F class gas turbine for IGCC. In Proceedings of the ASME Turbo Expo 2014: Turbine Technical Conference and Exposition, Dusseldorf, Germany, 16–20 June 2014. [Google Scholar]
- Javor, D.; Janjic, A. Application of demand side management techniques in successive optimization procedures. Commun. Dependabil. Qual. Manag. 2016, 19, 40–51. [Google Scholar]
- Vishnupriyan, J.; Manoharan, P.S. Demand side management approach to rural electrification of different climate zones in Indian state of Tamil Nadu. Energy 2017, 138, 799–815. [Google Scholar] [CrossRef]
- Chauhan, A.; Saini, R.P. Techno-economic optimization based approach for energy management of a stand-alone integrated renewable energy system for remote areas of India. Energy 2016, 94, 138–156. [Google Scholar] [CrossRef]
- Kurnik, C.W.; Stern, F.; Spencer, J. Peak Demand and Time-Differentiated Energy Savings Cross-Cutting Protocol. The Uniform Methods Project: Methods for Determining Energy Efficiency Savings for Specific Measures (No. NREL/SR-7A40-68566); National Renewable Energy Lab. (NREL): Golden, CO, USA, 2017. [Google Scholar]
- HOMER Energy. Getting Started Guide for Homer Legacy (Version 2.68); Homer Energy and National Renewable Energy Laboratory: Golden, CO, USA, 2011; Available online: https://www.gn-sec.net/content/getting-started-guide-homer-legacy-version-268 (accessed on 2 September 2020).
- HOMER 2.28 Help Manual. 2015. Available online: https://www.homerenergy.com/pdf/HOMER2_2.8_HelpManual.pdf (accessed on 20 August 2020).
- Montani, P.D.B.; da Luz, L.T.O.; Thomé, B.A.; Bento, R.G.; Nepomuceno, L.E.R.; Bernardon, D.P.; Canha, L.N. Intelligent Energy Management in Public Institutions. In Proceedings of the 2019 IEEE PES Innovative Smart Grid Technologies Conference-Latin America (ISGT Latin America), Gramado, Brazil, 15–18 September 2019; pp. 1–5. [Google Scholar]
- Abdul, C.; Mohammed, E.L.; Kiptoo, M.K.; Tomonobu, S.; Paras, M.; Shantanu, C. An Economic Analysis of Demand Side ManagementConsidering Interruptible Load and RenewableEnergy Integration: A Case Study of Freetown Sierra Leone. Sustainability 2019, 11, 2828. [Google Scholar]
- Mancini, F.; Lo Basso, G.; De Santoli, L. Energy Use in Residential Buildings: Impact of Building Automation Control Systems on Energy Performance and Flexibility. Energies 2019, 12, 2896. [Google Scholar] [CrossRef] [Green Version]
- Loganthurai, P.; Rajasekaran, V.; Gnanambal, K. Evolutionary algorithm based optimum scheduling of processing unitsin rice industry to reduce peak demand. Energy 2016, 107, 419–430. [Google Scholar] [CrossRef]
- Kathiresan, A.C.; PandiaRajan, J.; Sivaprakash, A.; Babu, T.S.; Islam, M.R. An Adaptive Feed-Forward Phase Locked Loop for Grid Synchronization of Renewable Energy Systems under Wide Frequency Deviations. Sustainability 2020, 17, 7048. [Google Scholar] [CrossRef]
- Kovács, A. On the Computational Complexity of Tariff Optimization for Demand Response Management. IEEE Trans. Power Syst. 2018, 33, 3204–3206. [Google Scholar] [CrossRef] [Green Version]
- Nawaz, A.; Khadim, G.; Khan, I.; Jan, K.U.; Li, H.; Khan, S.A.; Zahid, W. An Intelligent Integrated Approach for Efficient Demand Side Management with Forecaster and Advanced Metering Infrastructure Frameworks in Smart Grid. IEEE Access 2020, 8, 132551–132581. [Google Scholar] [CrossRef]
- Manfren, M.; Nastasi, B. Parametric Performance Analysis and Energy Model Calibration Workflow Integration—A Scalable Approach for Buildings. Energies 2020, 13, 621. [Google Scholar] [CrossRef] [Green Version]
Figure 1.
Present Indian Energy scenario: power generation and peak demand deficit from 2009–2021 as per the Central Electricity Authority (CEA).
Figure 1.
Present Indian Energy scenario: power generation and peak demand deficit from 2009–2021 as per the Central Electricity Authority (CEA).

Figure 2.
Average daily load profile of the case study area.

Figure 3.
Load assumption for demand-side management (DSM).

Figure 4.
Peak clipping in daily load profile.

Figure 5.
Load shifting in daily load profile.

Figure 6.
Daily Load Profile before and after DSM using HOMER.

Figure 7.
Monthly maximum demand reduction using Hybrid Optimization of Multiple Energy Resources (HOMER).
Figure 7.
Monthly maximum demand reduction using Hybrid Optimization of Multiple Energy Resources (HOMER).

Figure 8.
Seasonal profile before and after DSM using HOMER.


Figure 9.
Comparison of load factor—before and after DSM from daily and monthly load profile curve.

Figure 10.
Comparison of DSM approaches in daily load profile curve.


Table 1.
Courses and Infrastructure details of the campus.
| UG Programs | PG Programs | Blocks | Classrooms | Staff Rooms | Laboratories |
|---|---|---|---|---|---|
| 5 | 7 | 21 | 42 | 45 | 40 |
Table 2.
Power consumption of the primary, permanent, and shiftable load.
| Load Types | Power in kW |
|---|---|
| Primary | 10.032 |
| Permanent | 31.194 |
| Shiftable load | 147.274 |
Table 3.
End-user priority for shiftable loads.
| Shiftable Loads | Priority |
|---|---|
| Laboratories | I |
| Air-conditioner | II |
| Water pump | III |
Table 4.
End-user priority for Laboratories.
| Departments | Laboratories | Priority |
|---|---|---|
| All departments | Computer Lab | I |
| CSE | Graphics and Multimedia Lab | II |
| Mechanical | Mechatronics Lab | III |
| CAD lab | IV | |
| EEE | Electrical Machines and Drives lab | V |
Table 5.
Twenty-five kilowatt load—peak clipped in the afternoon session.
| Time (Hours) | Load (kW) | |||
|---|---|---|---|---|
| From | To | Before DSM | After DSM | Difference |
| 14 | 15 | 95.7 | 90.7 | 5 |
| 15 | 16 | 100.922 | 90.922 | 10 |
| 16 | 17 | 99.212 | 89.212 | 10 |
| Total | 25 | |||
Table 6.
Peak clipped 25 kW load shifted from afternoon to morning.
| Time (Hours) | Load (kW) | |||
|---|---|---|---|---|
| From | To | Before DSM | After DSM | Difference |
| 10 | 11 | 73.607 | 80.607 | −7 |
| 11 | 12 | 71.2 | 79.2 | −8 |
| 12 | 13 | 68.849 | 78.849 | −10 |
| Total | −25 | |||
Table 7.
Comparison of average load, peak load, and electricity bill (EB) reduction–before and after DSM.
Table 7.
Comparison of average load, peak load, and electricity bill (EB) reduction–before and after DSM.
| Description | Average Load (kW) | Peak Load (kW) | EB Bill (Dollar) | ||||
|---|---|---|---|---|---|---|---|
| Working Day | Monthly | Working Day | Monthly | Monthly | Annual | ||
| Before DSM | 44.46 | 32,405 | 100.92 | 189 | 945 | 11,340 | |
| After DSM | Peak clipping | 43.42 | 31,330 | 90.92 | 170 | 850 | 10,200 |
| Load shifting | 44.46 | 32,405 | 90.92 | 170 | 850 | 10,200 | |
Publisher’s Note: MDPI stays neutral with regard to jurisdictional claims in published maps and institutional affiliations. |
© 2021 by the authors. Licensee MDPI, Basel, Switzerland. This article is an open access article distributed under the terms and conditions of the Creative Commons Attribution (CC BY) license (http://creativecommons.org/licenses/by/4.0/).
Share and Cite
MDPI and ACS Style
Dharani, R.; Balasubramonian, M.; Babu, T.S.; Nastasi, B. Load Shifting and Peak Clipping for Reducing Energy Consumption in an Indian University Campus. Energies 2021, 14, 558. https://0-doi-org.brum.beds.ac.uk/10.3390/en14030558
AMA Style
Dharani R, Balasubramonian M, Babu TS, Nastasi B. Load Shifting and Peak Clipping for Reducing Energy Consumption in an Indian University Campus. Energies. 2021; 14(3):558. https://0-doi-org.brum.beds.ac.uk/10.3390/en14030558
Chicago/Turabian StyleDharani, Rajavelu, Madasamy Balasubramonian, Thanikanti Sudhakar Babu, and Benedetto Nastasi. 2021. "Load Shifting and Peak Clipping for Reducing Energy Consumption in an Indian University Campus" Energies 14, no. 3: 558. https://0-doi-org.brum.beds.ac.uk/10.3390/en14030558
Note that from the first issue of 2016, this journal uses article numbers instead of page numbers. See further details here.