
Selected Aspects of Indoor Climate in a Passive Office Building with a Thermally Activated Building System: A Case Study from Poland


Department of Power Systems and Environmental Protection Facilities, Faculty of Mechanical Engineering and Robotics, AGH University of Science and Technology, Mickiewicza 30, 30-059 Kraków, Poland
Energies 2021, 14(4), 860; https://0-doi-org.brum.beds.ac.uk/10.3390/en14040860
Submission received: 31 December 2020
/
Revised: 30 January 2021
/
Accepted: 2 February 2021
/
Published: 7 February 2021
(This article belongs to the Special Issue Energy Performance and Indoor Climate in Buildings)
Abstract
:Modern buildings with new heating, ventilation and air conditioning (HVAC) systems offer possibility to fit parameters of the indoor environment to the occupants’ requirements. The present paper describes the results of measurements performed in an office room in the first Polish passive commercial office building during four months of normal operation. They were used to calculate parameters describing thermal comfort: vertical air temperature profile, floor surface temperature, predicted mean vote (PMV) and predicted percent of dissatisfied (PPD). Obtained results confirmed good thermal conditions in the analysed room. The average temperature of the floor’s surface varied from 20.6 °C to 26.2 °C. The average vertical air temperature, calculated for working days, was from 22.5 °C to 23.1 °C. The temperature difference between the floor and 5 cm below the ceiling was from −0.9 °C to 6.3 °C. The PMV index varied from 0.52 to 1.50 indicating ‘slightly warm’ sensation, in spite of ‘neutral’ reported by employees. Also measured cooling and heating energy consumption was presented. The performed measurements confirmed the ability of thermally activated building system (TABS) to keep good thermal conditions.
1. Introduction
Rising energy prices in the last three decades forced authorities and buildings owners in Poland towards activities aimed at lower energy consumption. Several efficiency-related law regulations and support schemes have been introduced [1,2,3,4].
In 2008 in Poland the directive on the energy performance of buildings (EPBD) [5] was introduced. This directive treated public authority buildings and buildings frequently visited by the public as exemplary and taking environmental and energy considerations into account. This issue was expanded in the recast of the EPBD from 2010 [6] which encouraged owners and tenants of commercial buildings to ‘exchange information regarding actual energy consumption, in order to ensure that all the data are available to make informed decisions about necessary improvements’.
For this purpose office and other large buildings are of special interest because newly built and modernised public and office buildings offer possibility to apply new energy-efficient HVAC and construction technologies on large scale.
So far, precise definition of passive, low-energy or nearly zero energy buildings (NZEB) has not been introduced in Polish regulations. In 2013 the program of subsidizing loans for the construction of energy-efficient houses was introduced by the National Fund for Environmental Protection and Water Management in 2013 [7], which included definitions of low-energy and passive buildings, based on the calculated annual usable energy for heating and ventilation (EUc.o.) of 40 kWh/m2 and 15 kWh/m2, respectively. EUc.o. should have been calculated in accordance with the monthly or hourly method of the PN-EN ISO 13790 standard [8]. In spite of the fact that this scheme was closed in 2018 the abovementioned definitions are still in use in Poland.
To achieve required level of energy performance low energy and passive buildings require appropriate heating sources and systems. Heat pumps with low temperature water-based embedded surface heating and cooling systems form efficient solutions [9,10,11,12,13,14,15].
Among them thermally activated building systems (TABS) are of special interest because of several positive features as low supplying water temperature, suitable for heat pumps, large areas with evenly distributed heating or cooling heat flux density, low indoor air temperature gradient and high thermal mass [16,17,18]. On the other hand, the latter feature is a source of difficulties in control because of slow time response. TABS also cannot handle moisture and to maintain the required level of air humidity it should be coupled with ventilation system [19,20,21] to obtain required hygrothermal conditions.
As energy-efficient buildings offer good indoor conditions [22] the problem of indoor environment in thermally refurbished and low energy buildings has been discussed by many authors recently. Various indicators were used, i.e., CO2 concentration, relative humidity, air pressure and indoor and outdoor temperature in single family [23] and multifamily buildings [24] or the individual feelings of the residents [25]. The correlation between temperatures of internal air and internal surfaces in relation to human perception of thermal comfort in a multi-family building [26] was presented in the König diagram. Air temperature, ventilation rate, CO2, formaldehyde and total volatile organic compounds (TVOC) concentration in schools were studied in [27] with indication of positive impact of mechanical and hybrid ventilation on air quality [28]. As far as thermal comfort was considered, two kinds of methods were used [29]: the predicted mean vote (PMV) and the predicted percentage dissatisfied (PPD) models given in EN ISO 7730 [30] and EN ISO 7726 [31] or the adaptive comfort model of EN 15251 [32]. They were used in different cases: a regional wooden historic house [33], single family [34], multifamily [35,36] or office buildings [37,38].
Regarding office buildings with TABS, Saelens et al. [39] simulated in TRNSYS energy performance and thermal comfort of TABS in a multi-zone model of an office building. As a comfort parameter they assumed the relative exceeding time of 25 °C of the operative temperature of the south oriented offices during operation hours. The influence of the occupancy rate, shading and switching of the lights was studied. Occupant behaviour influenced the cooling demand and thermal comfort but proper operation solar protection kept TABS to cope with different user behaviour schemes. Operative temperature was also thermal comfort indicator in the study [40] of a single room with TABS as thermal energy storage. Simulations, performed in IDA ICE, showed the ability to maintain required level of comfort by TABS shifting the need to supply supporting electrical heater during low-price periods. Internal air temperature, according to the request of the building owner, as the main criterion of the thermal comfort was used in [41] when designing the control strategy for an office building equipped with a ground source heat pump (GSHP) and TABS.
The influence of a user profile on a performance of a single room in government, commercial, educational buildings with TABS was simulated in TRNSYS in [42]. As comfort criterion the PMV index from −0.5 to 0.5 was chosen. Then the optimum temperature in a room was found at supply water temperature of TABS from 21 °C to 22 °C.
The analysis of monitoring campaigns in the office buildings with TABS was presented in [43]. Based on EN15251 in one building a thermal comfort analysis was performed calculating the number or percentage of occupied hours when PMV or the operative temperature was outside a given range. Overheating never occurred, but operative temperature under the acceptable values of 20 °C and 23 °C appeared in heating and cooling seasons, respectively.
Field tests in an office building with TABS are described in [44]. Measurements were taken for three days involving three combinations of people, dummies and computers as internal gains sources. Maximum operative temperature of 27 °C according EN 15251 was assumed as thermal comfort indicator. Calculated cooling capacity was of 40–50 W/m2.
Zhang et al. [45] carried out 20 tests with different heat loads in a climate chamber with diffuse ventilation and TABS. There were set up two workplaces with two manikins, computers and desk lights. Draught risk, vertical temperature difference, radiant asymmetry were investigated as thermal comfort indexes of ISO 7730. Thermal gradient of air temperature was up to 1.56 °C/m and 0.46 °C without and with diffuse ventilation, respectively.
A case study of indoor air quality and thermal comfort in a low-energy office building with TABS and demand controlled ventilation (DCV) during the summer period was presented in [46]. Air humidity was generally between 30% and 60%. The temperature difference between feet and head was of about 1.0 °C and no risk of local discomfort was reported. For over 90% of the considered period of time quality of the indoor thermal conditions was at class A (PPD < 6%) or class B (PPD < 10%) according to the ISO 7730. Presented measurements confirmed the ability of TABS, shading and ventilation system to maintain required levels of indoor environment quality.
Only a few studies related to energy and indoor environment issues in energy-efficient office buildings in Poland have been shown recently. In [47,48] the NZEB experimental office and educational building with thermally activated building system (TABS) in Kraków (south Poland) was described. In the first study authors experimentally compared the thermal comfort measurement method of PN-EN ISO 7730 with the results obtained by the group of students in office conditions. The second article presented an assessment of thermal comfort in a selected room under different values of the internal air temperature and humidity. Application of underfloor and air heating at the same time enabled to quickly control climate comfort parameters over a wide range of internal temperature and humidity resulting in good thermal conditions.
Sinacka and Szczechowiak [49] presented the 14R4C model to simulate thermal behaviour of an office building with TABS in Poznań (central west Poland). Simulations performed in a spreadsheet based tool revealed that internal heat gains patterns and the temperature of TABS supply water have a significant effect on energy consumption.
Gil et al. [50] conducted an analysis of indoor environment in an energy-efficient building, located in Katowice (south Poland), where heating and cooling are supplied with the use of TABS and the underfloor heating systems (only in the ground floor rooms). The supplying water temperature of TABS varies from 22 °C to 16 °C and from 30 °C to 22 °C during cooling and heating season, respectively. CO2 concentration, air temperature, air flow rate and relative humidity measurements were performed to evaluate indoor climatic conditions. Measurements were taken two times during heating season for outdoor temperatures of −9 °C and +1.9 °C. Depending on the location (hall or rooms) indoor air temperature varied from 21.5 °C to 24.5 °C. Authors reported low values of relative humidity: from 14% to 30%. Mean CO2 concentration amounted 982 ppm. Supply airflow velocity varied from 0.10 m/s to 0.40 m/s with 0.21 m/s on average. The average thermal load for the TABS system was of 35.75 W/m2. The analysis also showed that indoor air temperatures in the hall and offices were comparable, with differences up to 1 °C.
This review shows that in the dominant part of case studies measurements were conducted during relatively shorter summer periods with the cooling mode. In the whole year field tests only PMV and operative temperature were analysed. There is a lack of analyses in heating and cooling periods, including not only indoor air temperature, but its vertical gradient and humidity or comfort zone, as well.
This paper describes measurements and analyses of the comfort-related issues in the selected room in a commercial passive office building located in Katowice (south Poland). Thermally activated building system (TABS) is the main heating and cooling system. It is supported by air handling units with additional heating and cooling coils. Implemented examples of TABS are very little known in Poland and hence exploitation results from such systems are very desirable to be presented. The research covered the period of four months during its normal use, allowing verification of thermal conditions in a studied room during hot, cold and transient atmospheric conditions. It included vertical profile of the internal air temperature, floor temperature, predicted mean vote (PMV) and predicted percentage of dissatisfied (PPD) index. Also selected energy performance aspects of TABS were presented.
2. Materials and Methods
2.1. Case Object
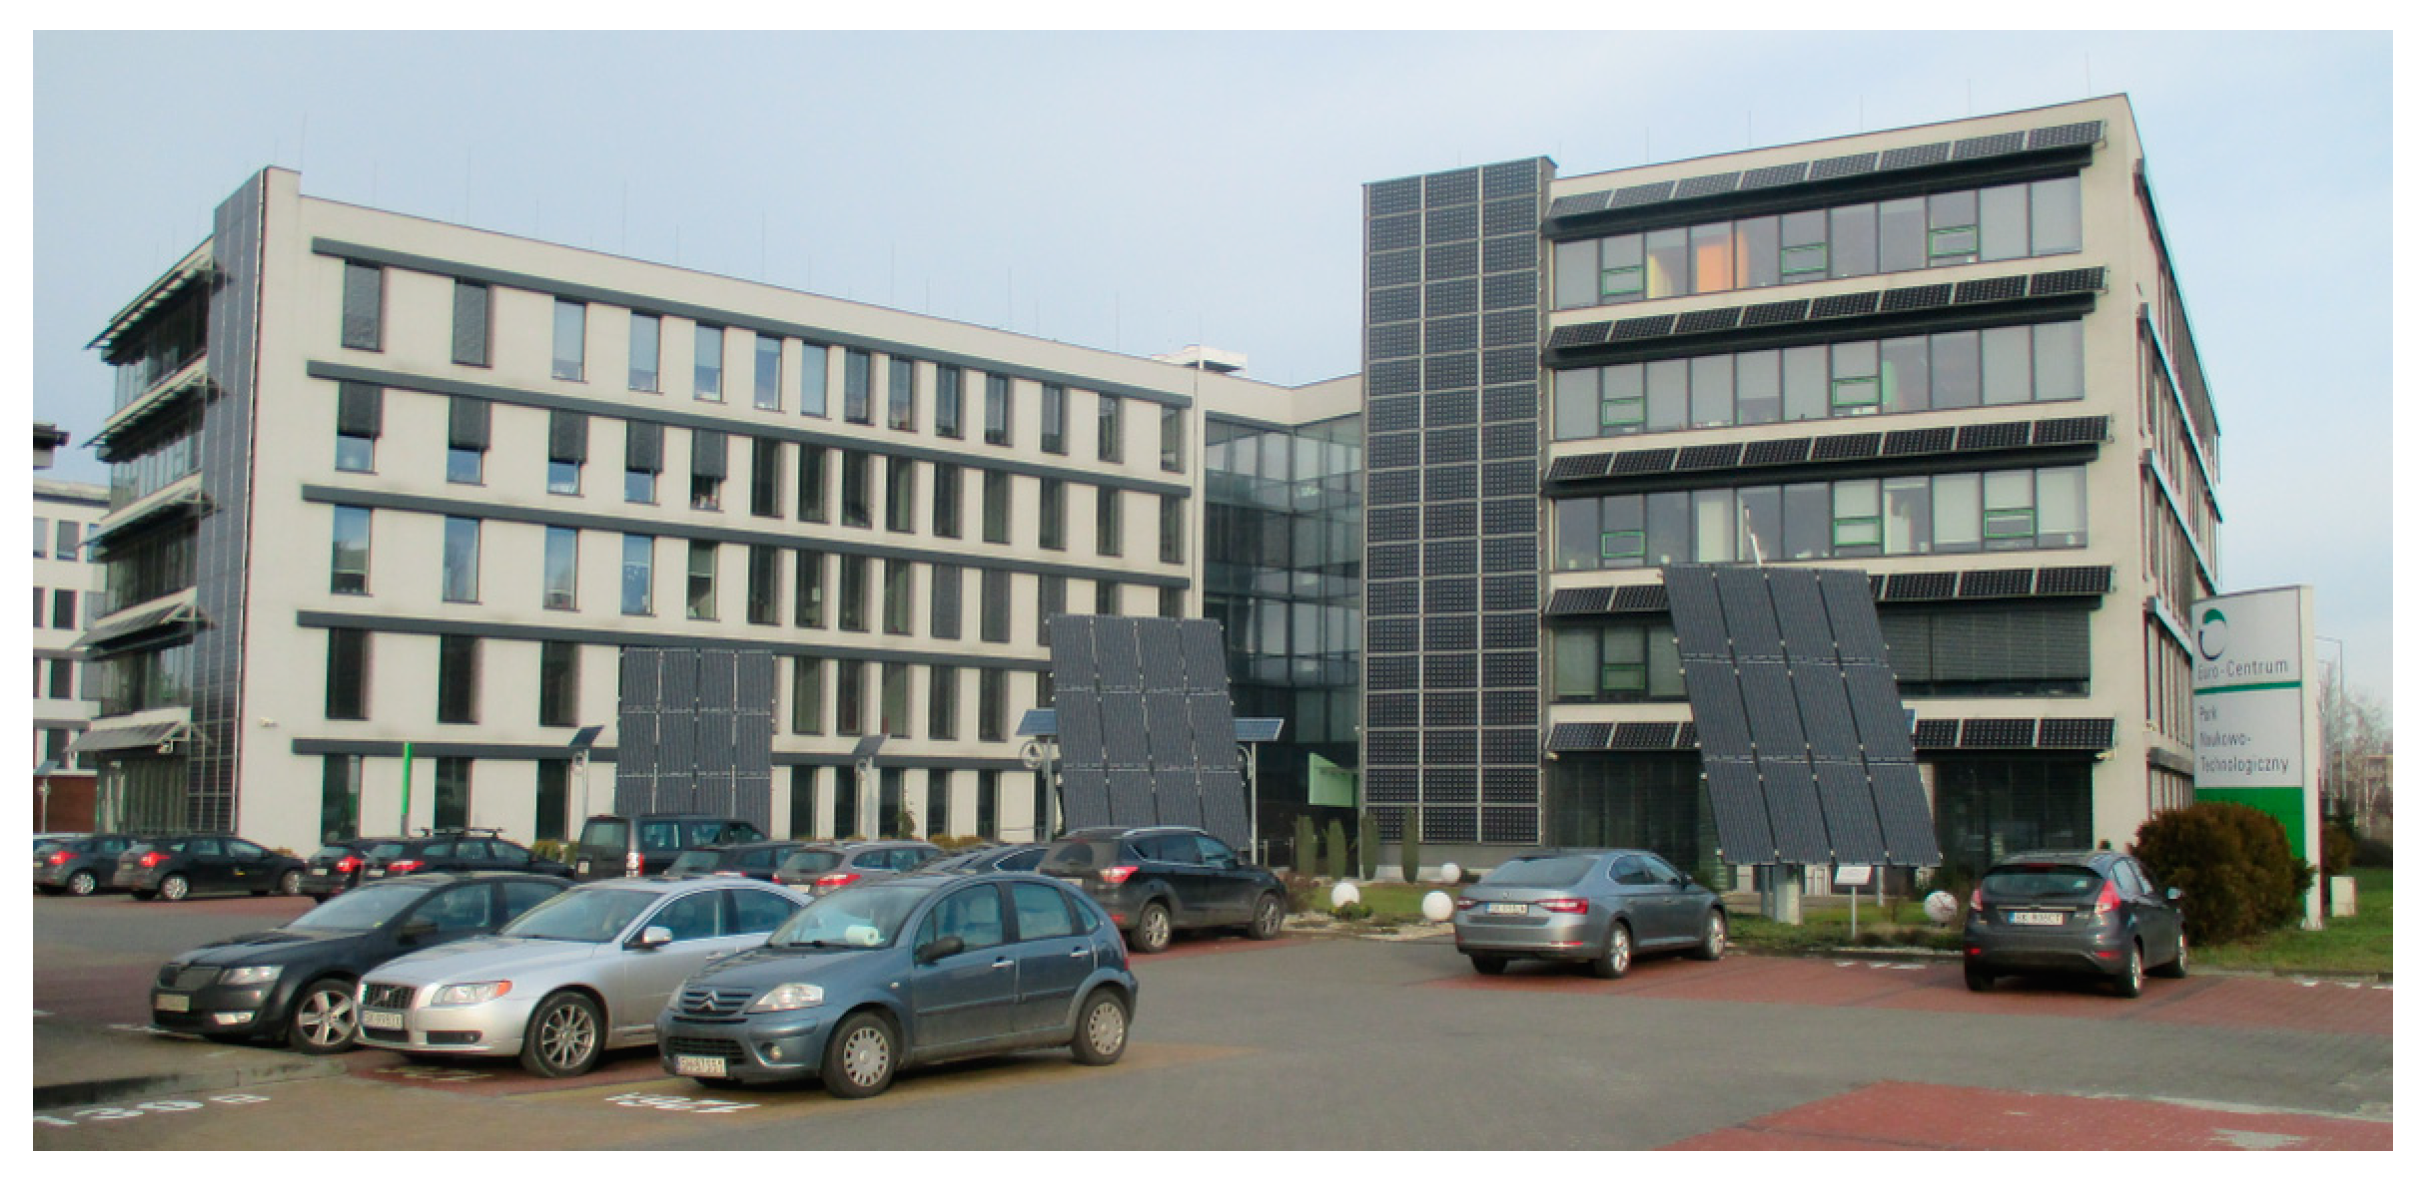
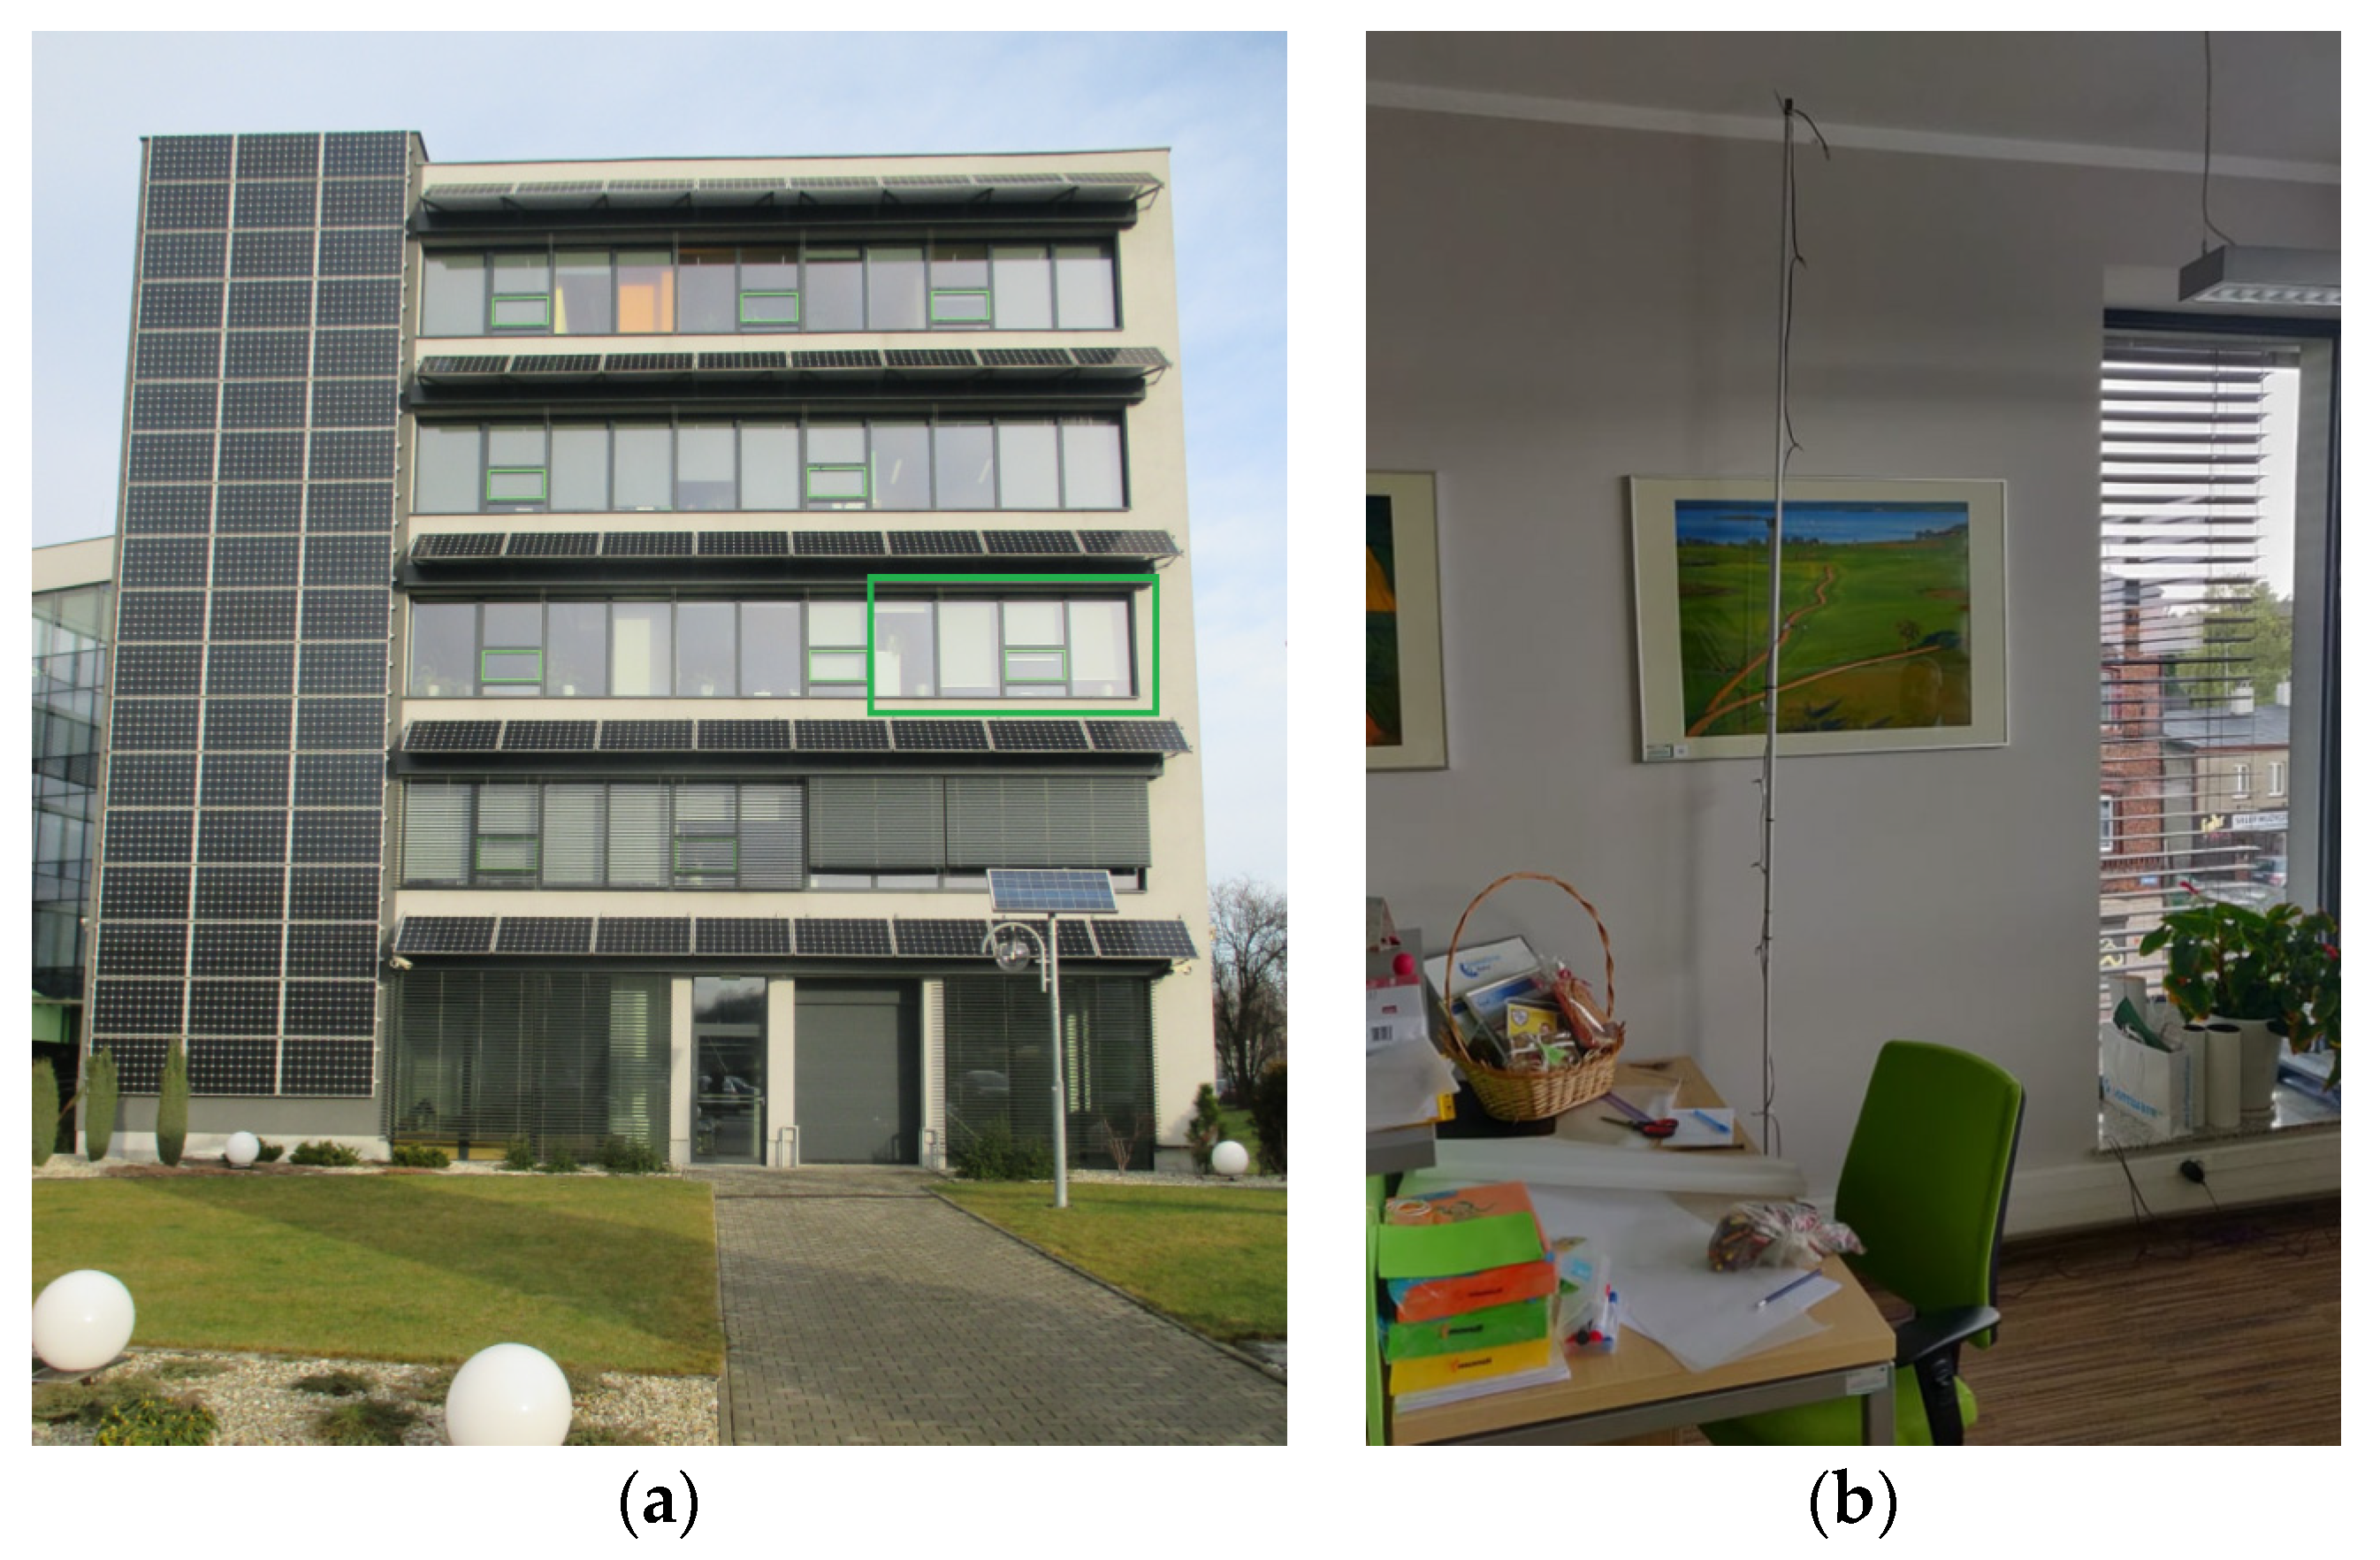
The considered object is the five-storey office building (Figure 1), built in the passive standard, located in Katowice (south Poland). It has the total area of 8100 m2 and the usable area of 7500 m2. The design annual energy demand for space heating is 15 kWh/m2.
The building has reinforced concrete structure, in a column-slab system, based on a foundation slab. The external walls are insulated with 30-cm thick EPS100 polystyrene. Office rooms are located around the perimeter of the building and the passageways are arranged in an atrial layout, i.e., with an internal courtyard (atrium) and additionally with glazing in the centre of the building [51]. Triple glazed windows have thermal transmittance U = 0.7 W/m2K. Facade shutters allows reduction of solar irradiance entering an interior of the building and protect it against overheating. It also reduces discrepancies between radiant and air temperature improving indoor comfort [52].
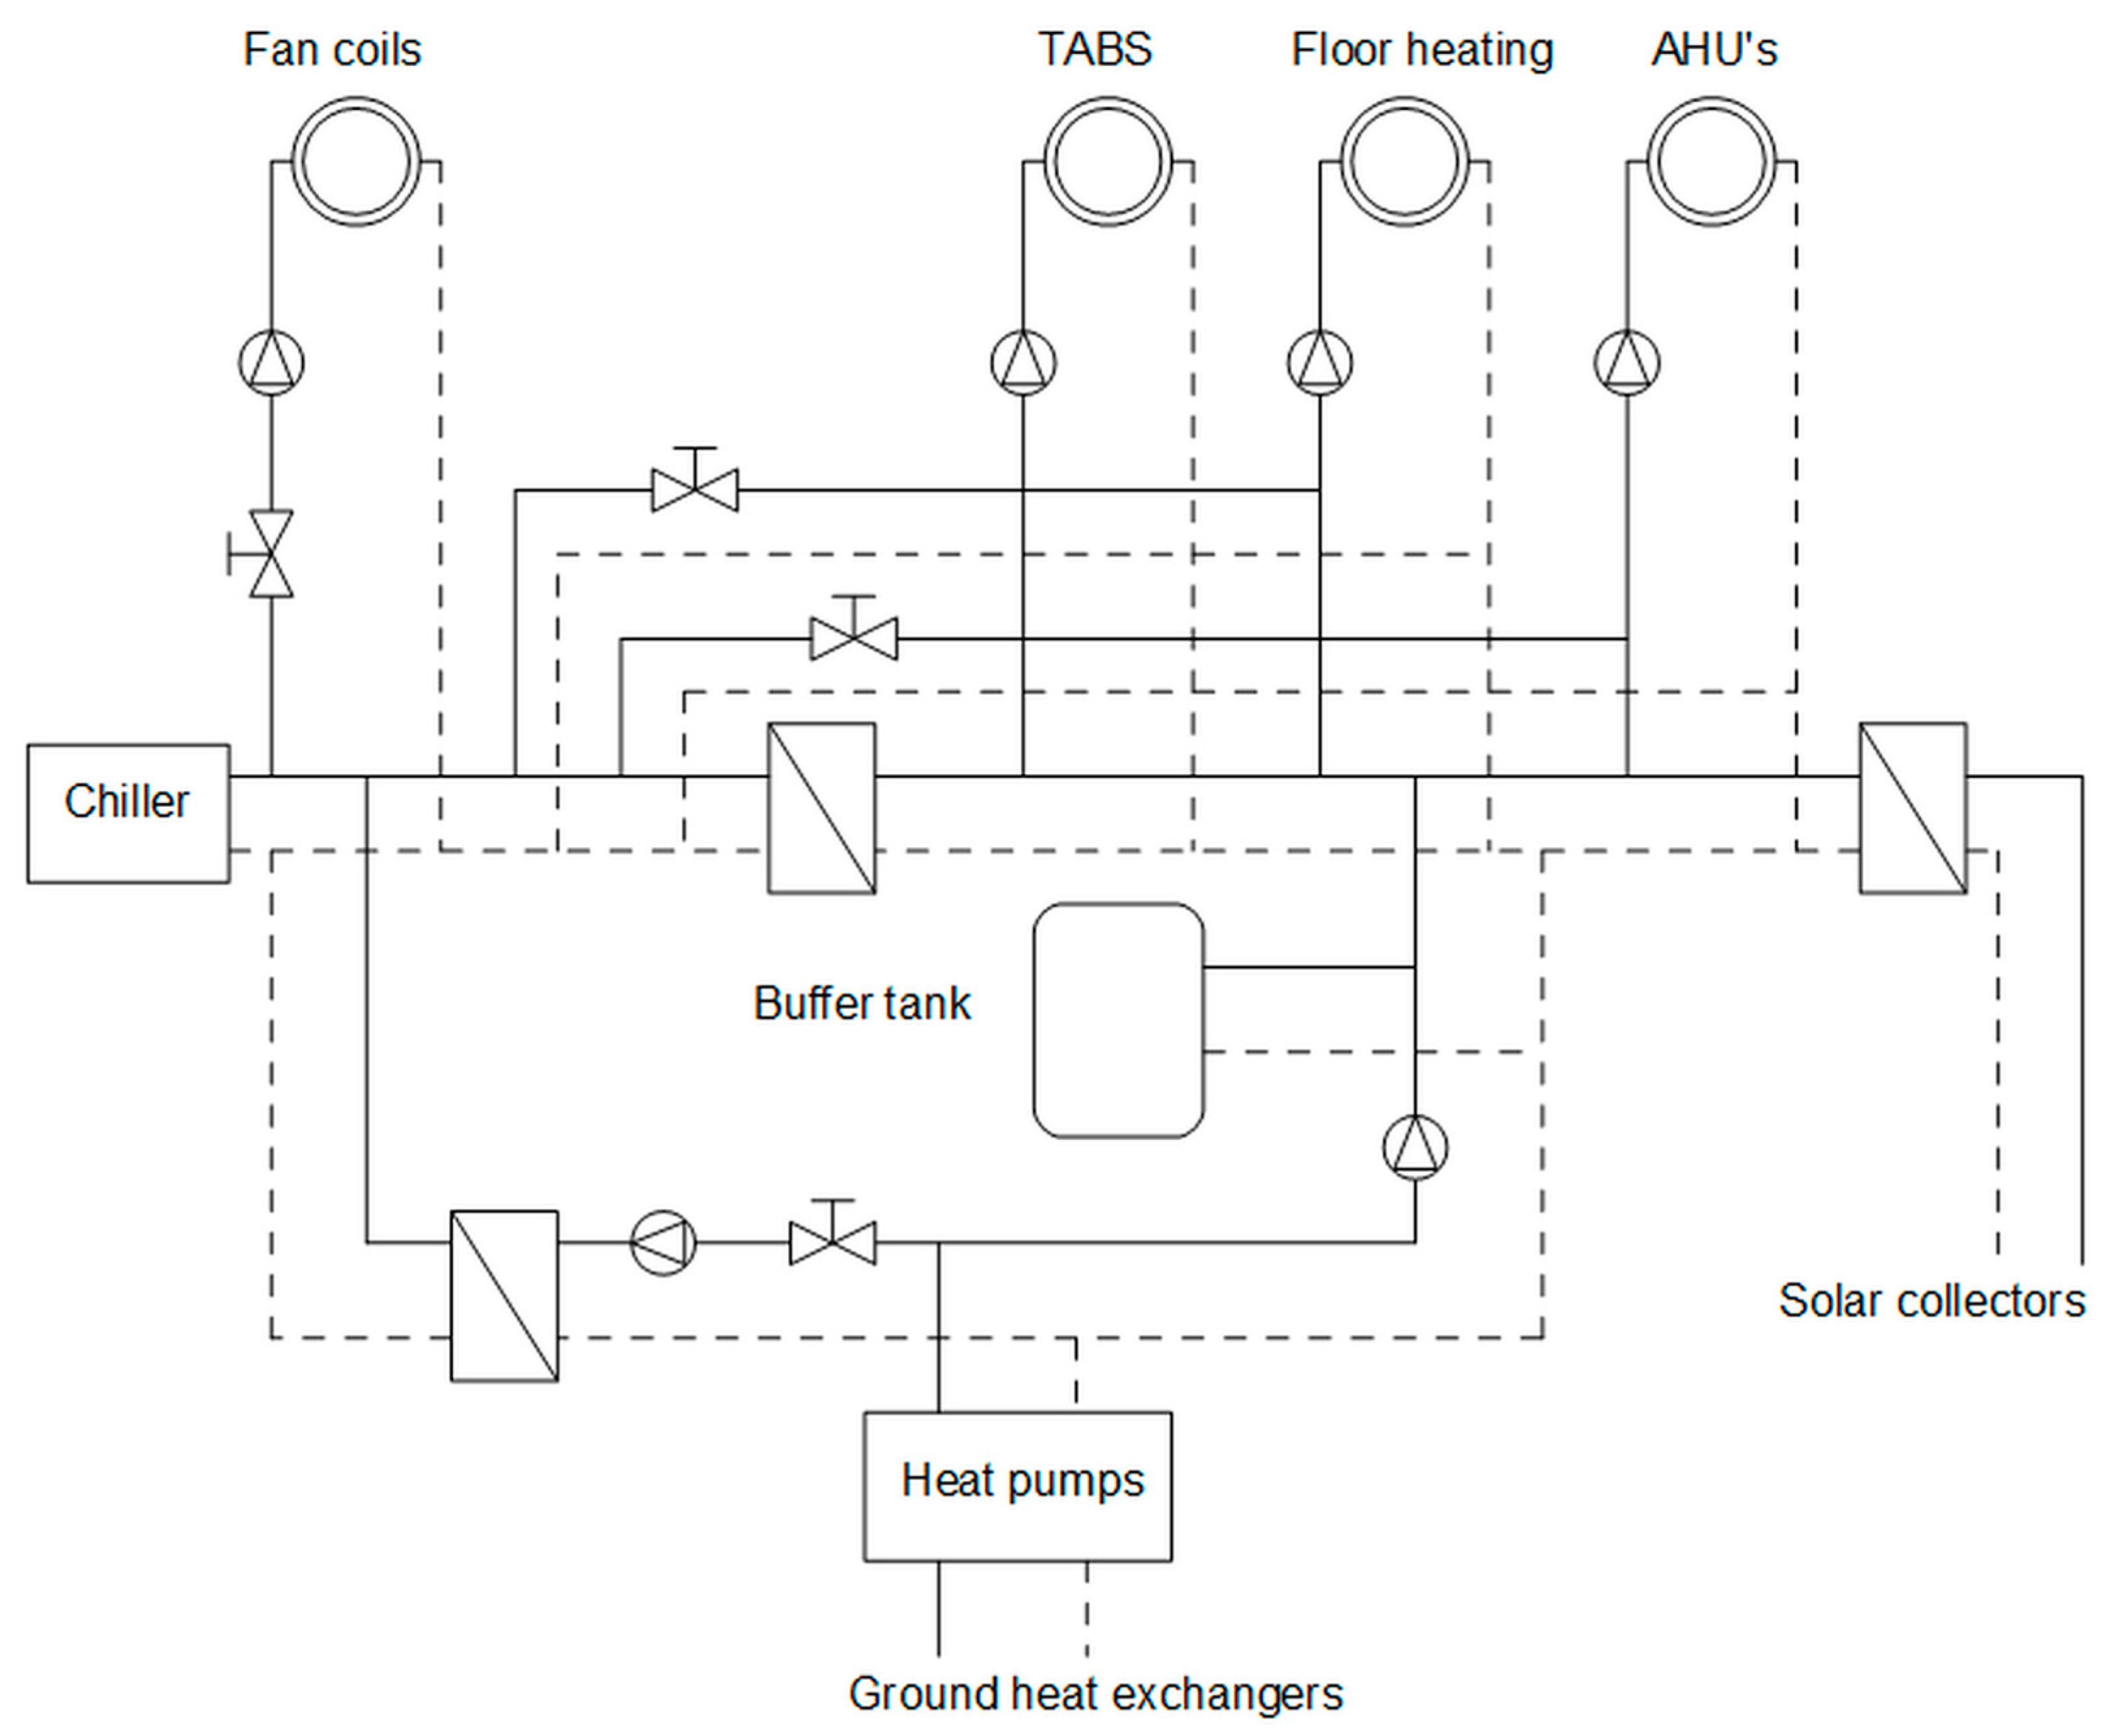
Thermally activated building system (TABS) provides heating and cooling. Double-meander TABS modules with the total area of 4500 m2 were used. Additionally underfloor heating was used on the ground floor (1870 m2). These systems are supplied from the cascade-connected three two-compressor heat pumps with the total heating and cooling capacity of 244 kW and 187 kW, respectively [53]. They supply TABS and underfloor circuit (only in the basement) of design heating and cooling capacity of 137 kW and 167 kW, respectively. Heat pumps also deliver heat and cold to heating and cooling coils in all AHUs in the building. Two additional chillers work as peak cooling source. Maximum design heating capacity of heating coils: 94 kW, cooling capacity of cooling coils: 271 kW. Hydraulic scheme of the HVAC system is presented in Figure 2.
Mechanical ventilation with recuperation provides fresh air to the building. Five air handling units (AHUs), one per each storey, were used. Four of them, serving office rooms, conference rooms and social rooms, are equipped with rotary heat exchangers and one, mainly for sanitary facilities and utility rooms, is with cross-flow exchanger [54,55]. The building management system (BMS) integrates management of installations and controls the operating parameters of individual devices. Parameters measured in different points of the building can be viewed and analysed in view of the proper operation, fault detection, efficiency analyses, etc.
2.2. Measurements
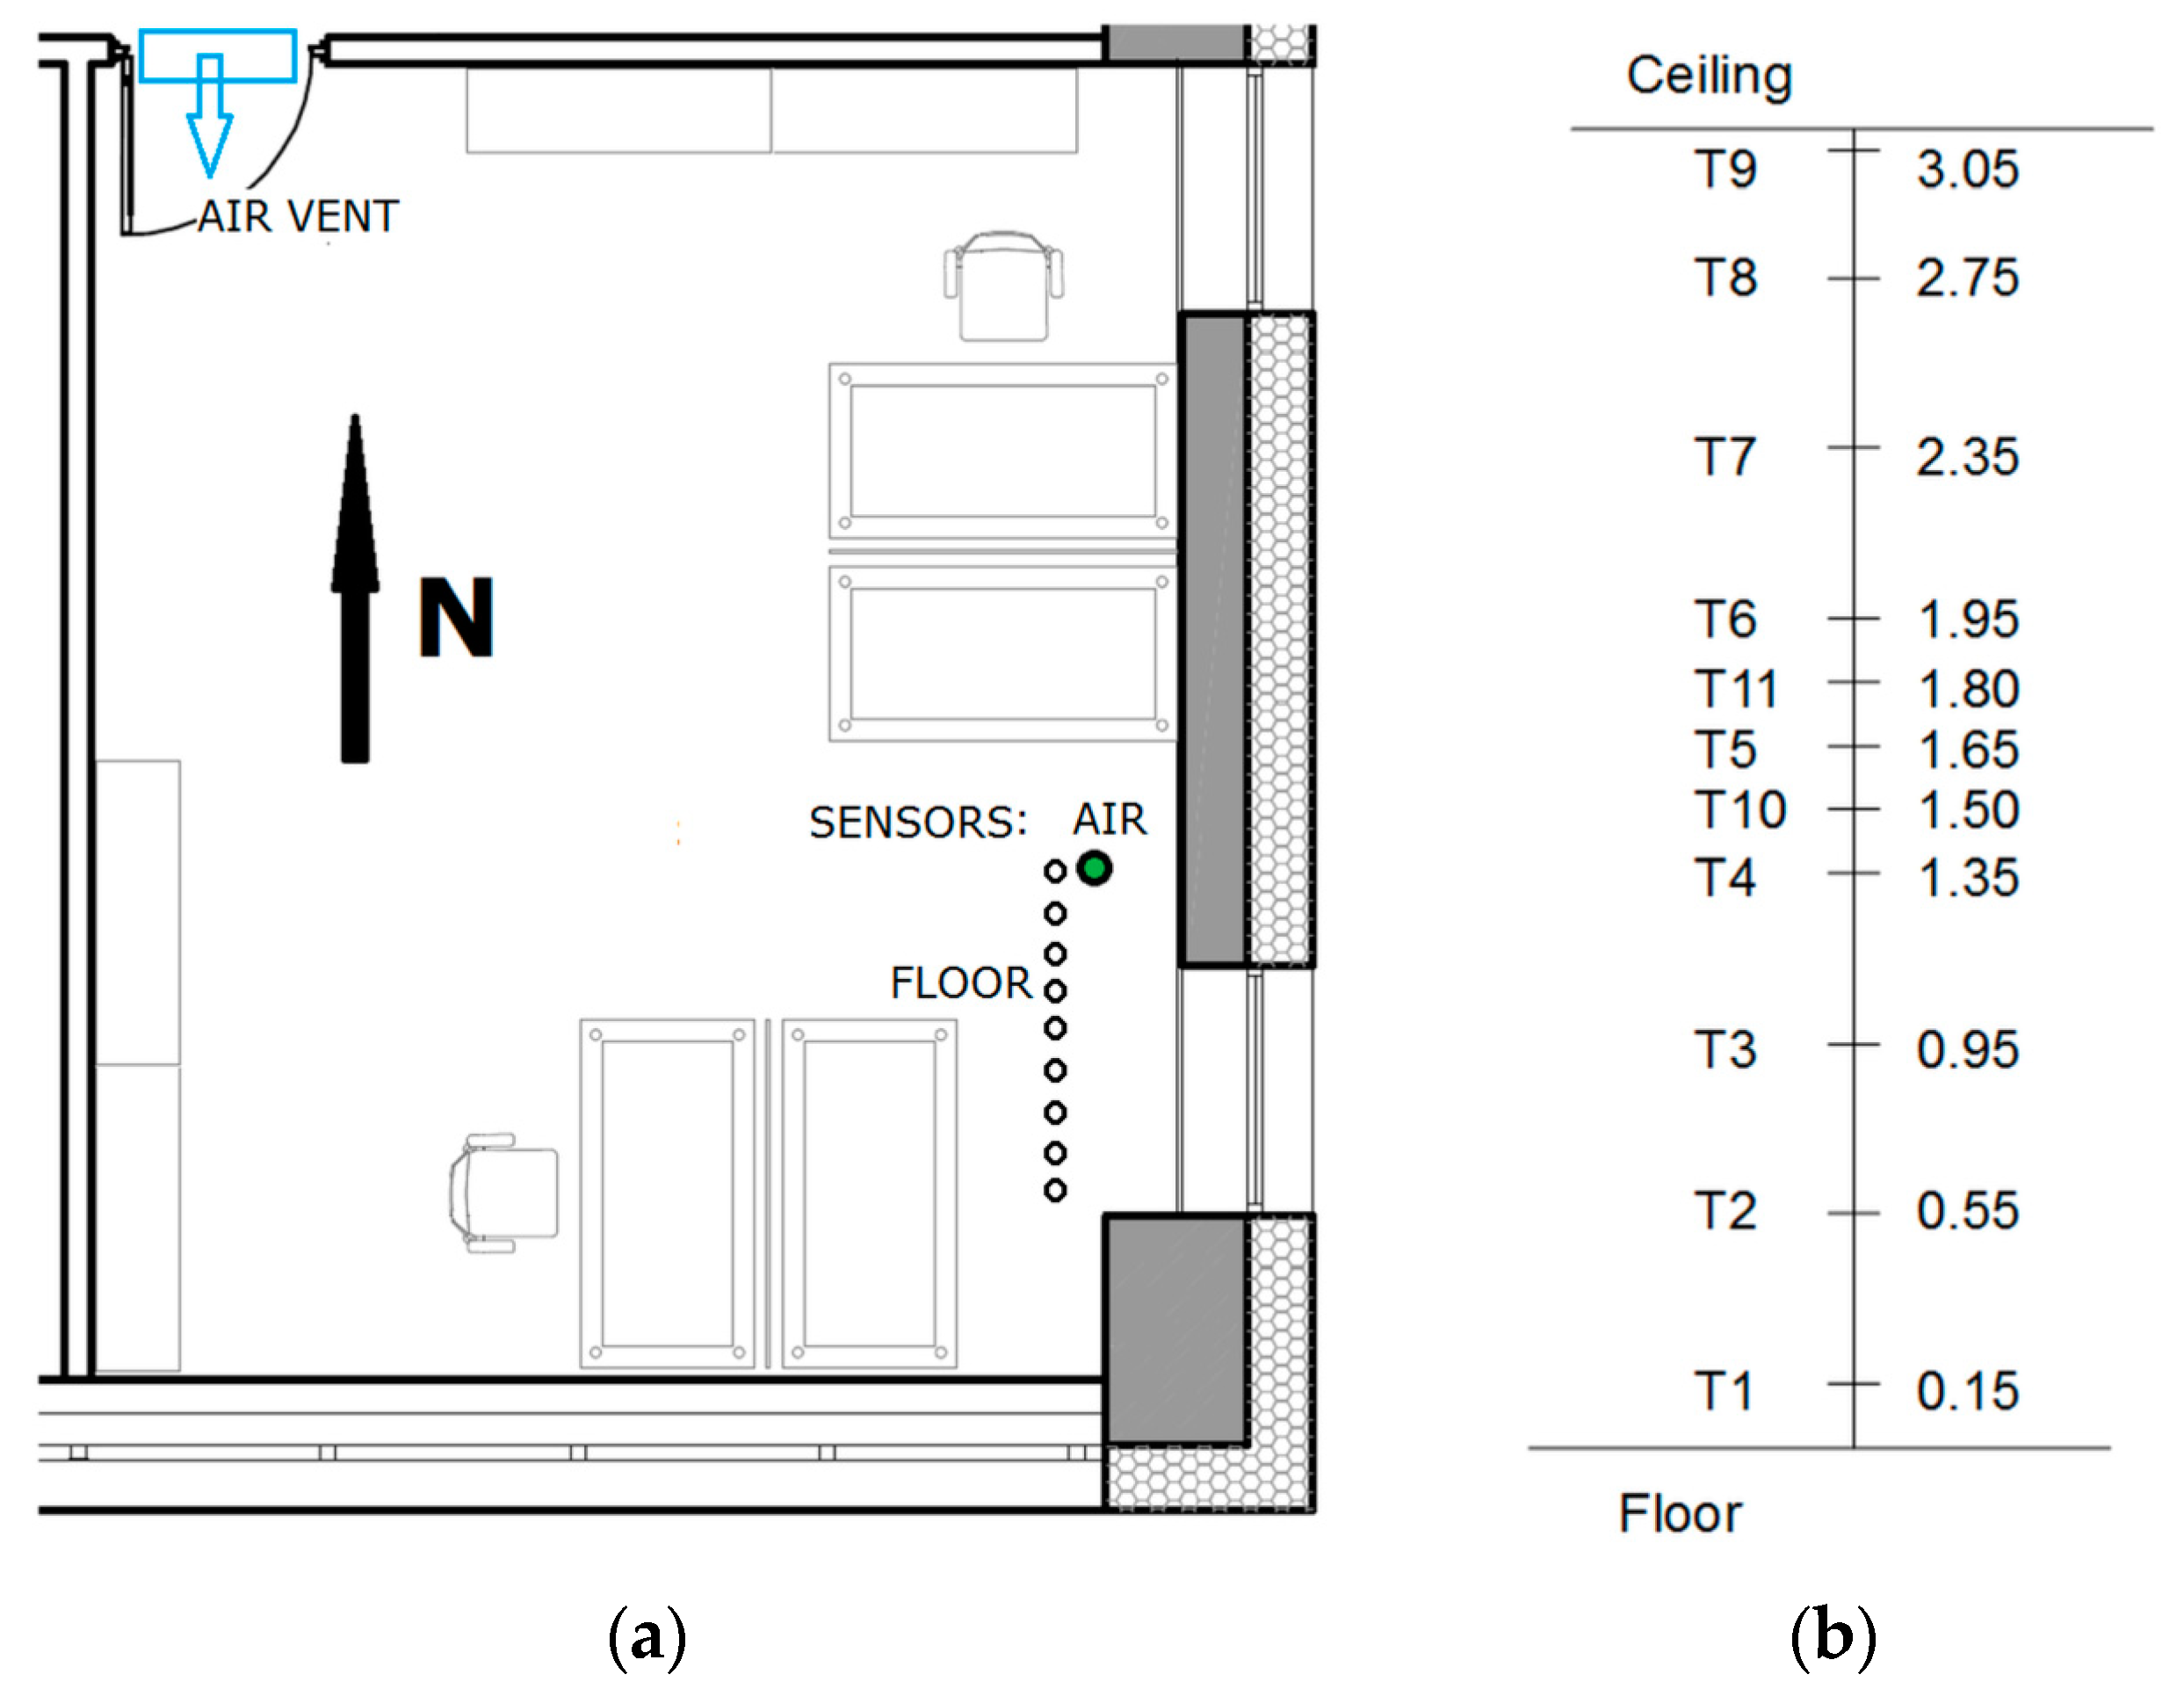
An office room, located in the south-east corner on the second floor of the building (Figure 3a), was chosen for the research. It has floor area of 29.19 m2 and height of 3.10 m (Figure 4a). There are two office workplaces in this room occupied from Monday to Friday from 8:00 to 16:00.
The most important research assumption was to perform research during normal everyday use of the room not disturbing the work of those employed there, but close to the workplaces, which resulted in the sensors placement at the position marked in Figure 3a. This position was not representative for the whole room but, excluding zones with airflow-thermal disturbances [56,57] can be the base of a reliable analysis.
The second limitation was that the measurement system had to be relatively simple, not taking up much space and not requiring long cable connections. Hence, simple 1-wire system based on the Atmega 644PA processor was used. The results were saved on the SD card every 15 min. The same time step is used by the building management system (BMS) of the considered object.
Two variables were measured. The first one was the relative humidity measured by the DHT11 sensor [58]. Air temperature was measured by DS18B20 temperature sensors [59]. Both these sensors are commonly used in different scientific research [60,61,62] mainly because of the easy connection of many measuring points into one bus, good accuracy and low cost [63]. The same sensors were also used to measure floor temperature. Figure 4b shows an arrangement of nine temperature sensors, mounted between the floor and ceiling, and their height above a floor surface. Sensors measured the air temperature. For this purpose each of them was inserted into low emissivity (ε ≈ 0.10) polished steel tube to minimise the impact of radiative heat transfer.
There were no professional globe radiant temperature sensors used. This variable was measured by two DS18B20 sensors, marked 10 and 11, working without any additional shell because their plastic TO−92 packages were covered with high-emissivity (ε ≈ 0.96) coat of black paint. This seems to be a crude method, but it was somehow forced by the external conditions. For example, the study of Walikewitz et al. [64] showed that the deviations between the different methods of obtaining mean radiant temperature in indoor environments are negligible. They noticed the largest disparities between air and radiant temperatures in the rooms with window walls facing southeast and southwest, but in the building considered here this effect is reduced by the external roller shutters showed in Figure 3a.
Additional nine sensors measured floor temperature. They were mounted on a carpet covering the floor. A silicone thermal conductive paste has been placed between the floor surface and the sensors to improve the heat conduction.
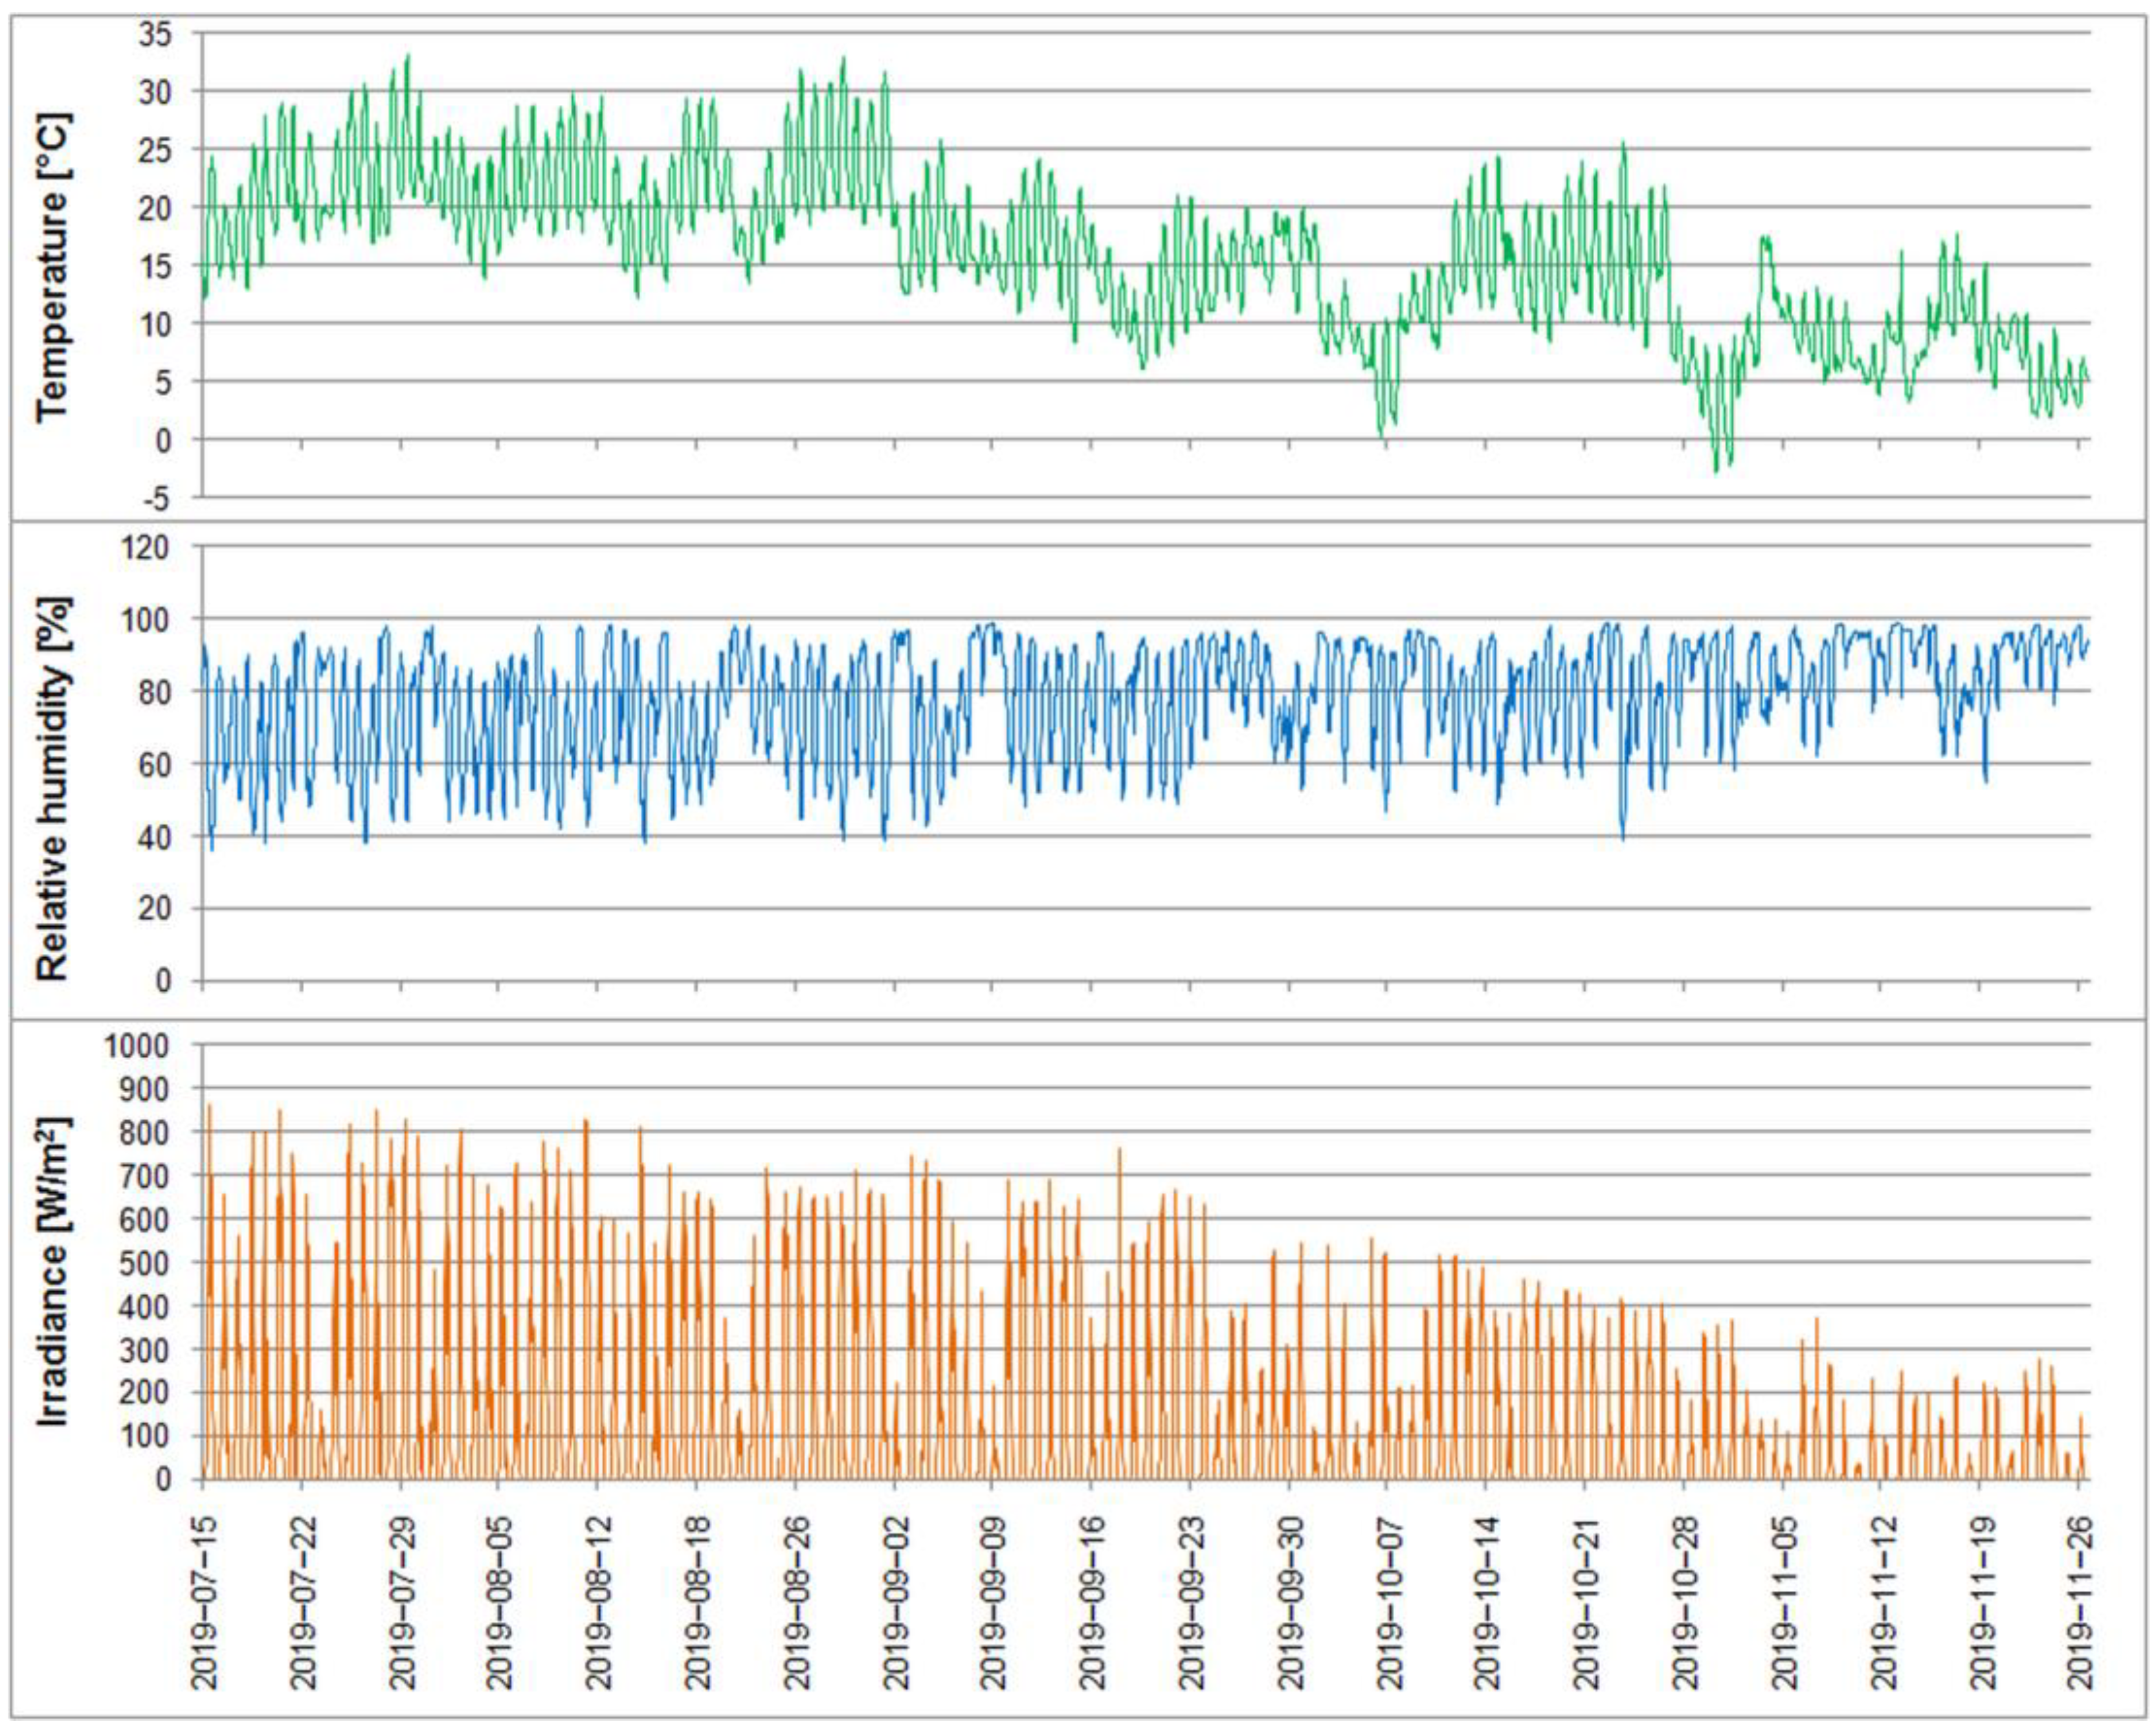
Measurements were conducted from 15 July 2019 to 26 November 2019. This period of time covered cooling (mainly during July and August), heating (in November) and transitional intervals. External air temperature (Figure 5) varied from 33.1 °C at 18:00 on 29.07 to −2.9 °C at 7:00 on 31.10. According to the PN-EN 12831 standard [65,66,67] the design outside air temperature to calculate the design heat load in Katowice is −20 °C.
Relative humidity was from 36% at 17:00 at 15.07 to 99% on 09.09, 23–24.10, 09.11 and 13.11. Daily variation of global horizontal solar irradiance was from 0 to 863 W/m2 (measured at 13:30 on 15.07). Weather data were taken from the meteorological station of the Central Mining Institute [68] located about 6 km north-east from the considered building. The data are saved with 30-min time-step and in all cases are given in legal time.
3. Indoor Environment in the Office Room
3.1. Floor Temperature
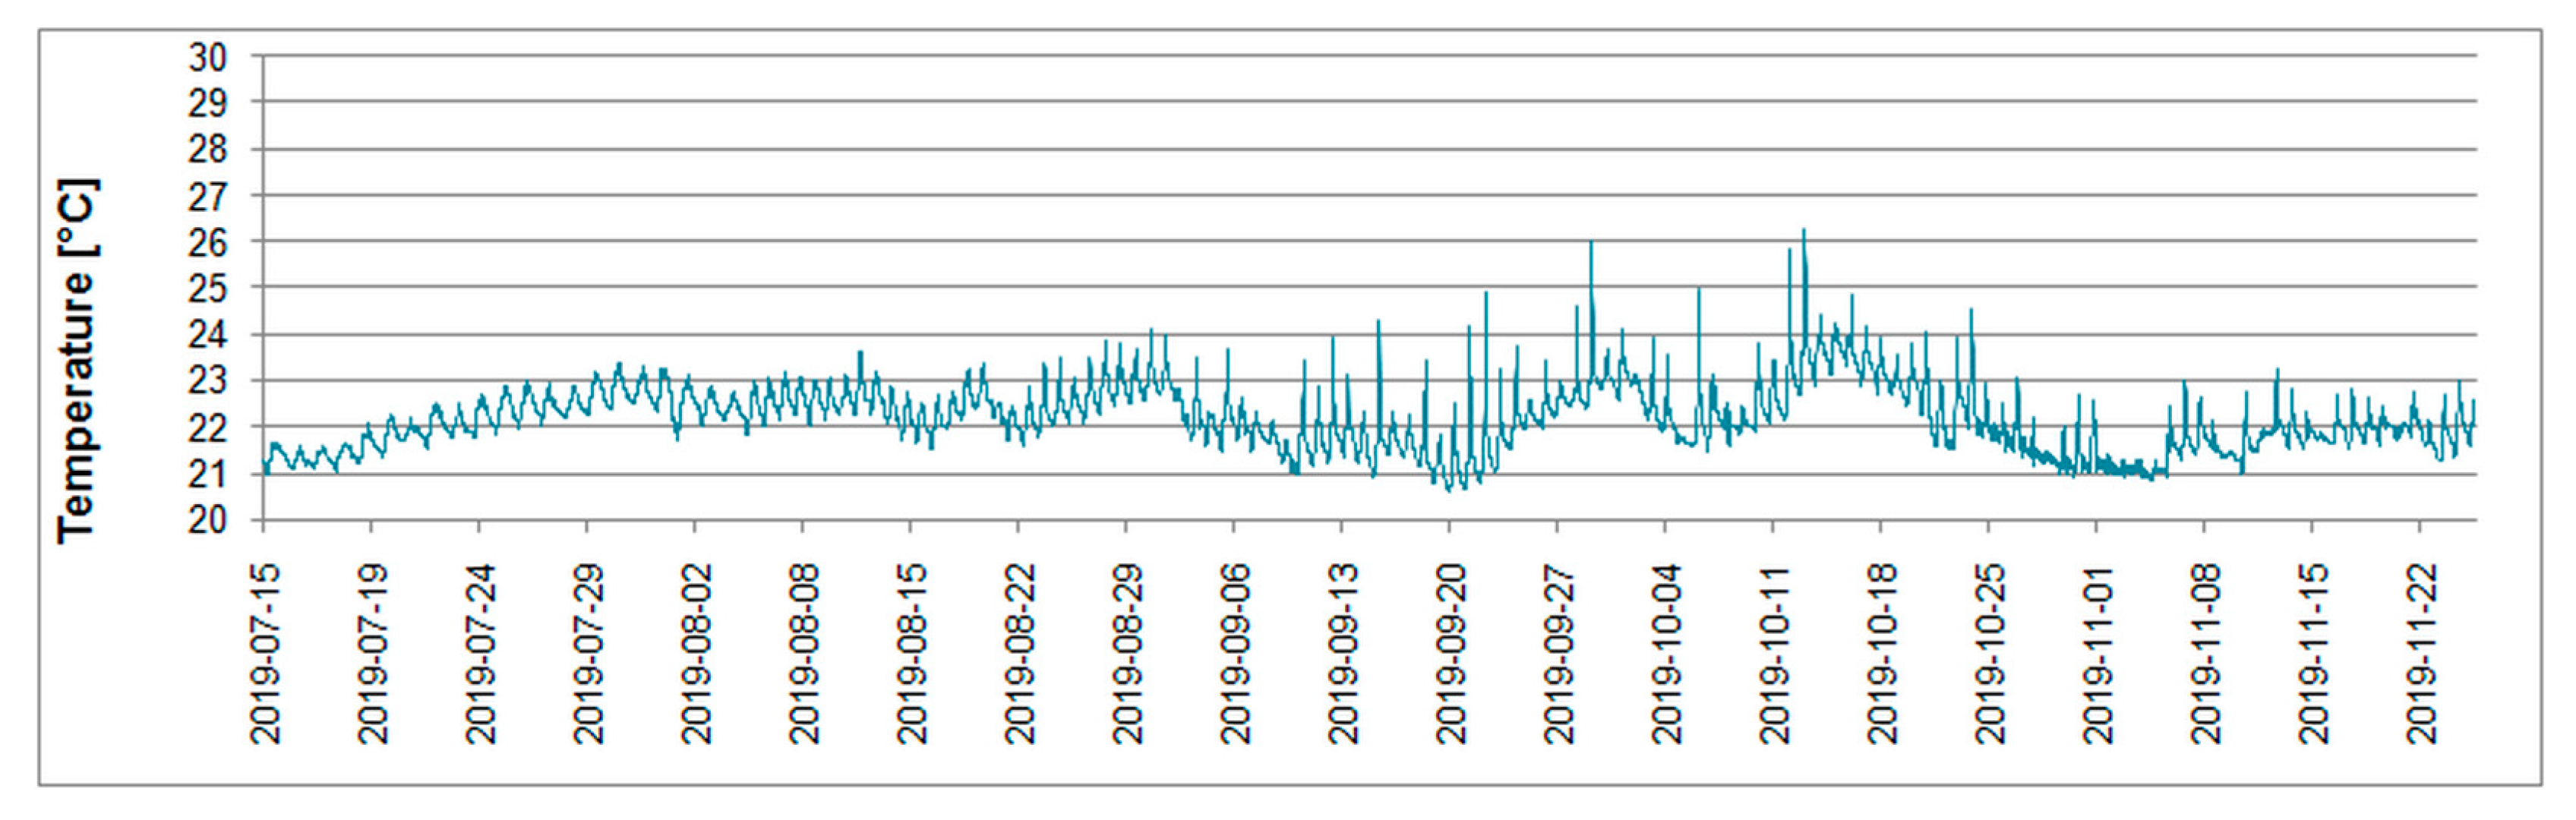
EN-ISO 11855–1 [69] refers to EN-ISO 7730 comfort criteria as design indications for TABS. The maximum floor temperature of 29 °C and minimum of 19 °C is recommended for heating and cooling, respectively. This condition can be checked in Figure 6. More visible variations were noticed in September and October, when the outdoor temperature changed rapidly between day and night (Figure 6). In typically cooling or heating periods its variations were lower.
3.2. Vertical Temperature Profile
Assumptions, described in Section 2.1, and performed measurements were the base for the calculation of the vertical profile of the internal air temperature. This is an important indicator of the thermal environment [70,71] and has been evaluated by several authors recently for different heating and cooling systems as underfloor heating [72], radiant ceiling panel and radiant slab [73], cooling ceiling panels [74,75] and TABS [44,56].
Because of the large amount of the measurement data in the following paragraphs there were presented the most important periods with extreme atmospheric conditions. The hottest and coldest weeks were chosen on the base of the cooling and heating degree minutes [76] and these were 26.08–1.09 and 20.11–26.11, for the base temperatures of 22 °C and 15.5 °C [77,78] respectively. The transitional week between 20.10 and 26.10 was chosen on the base of the greatest daily differences between maximum and minimum outdoor temperature.
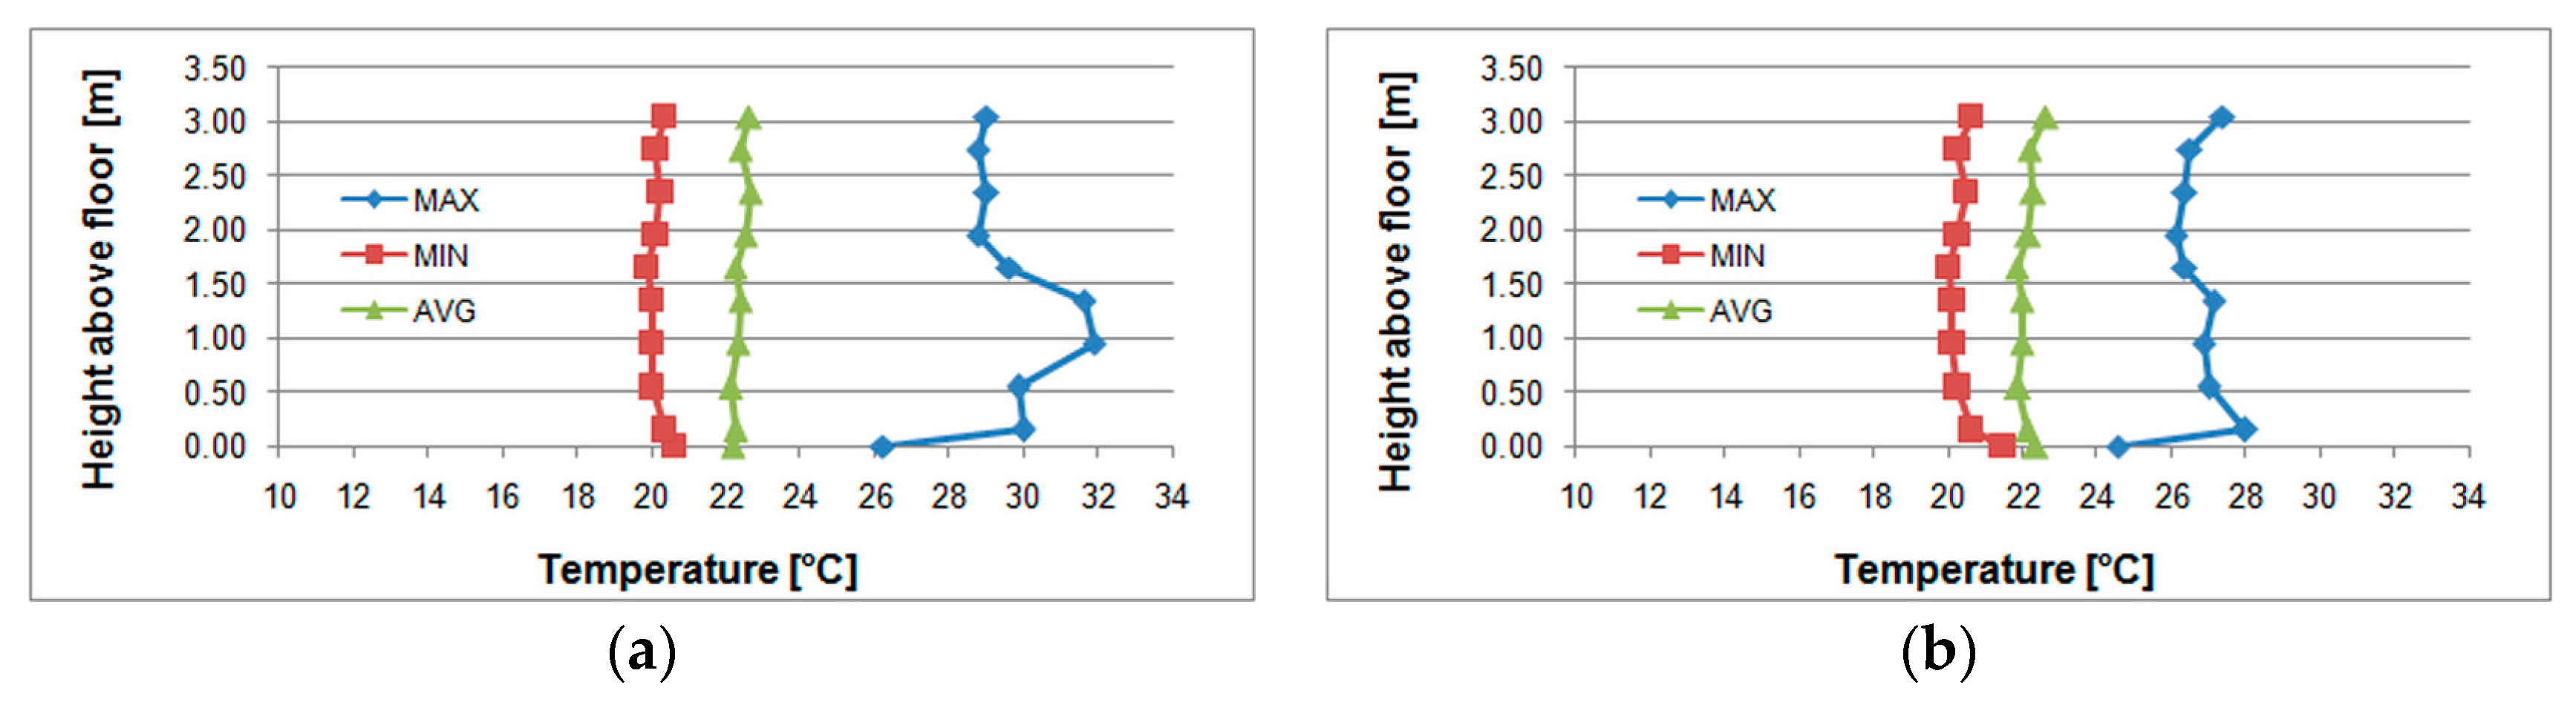
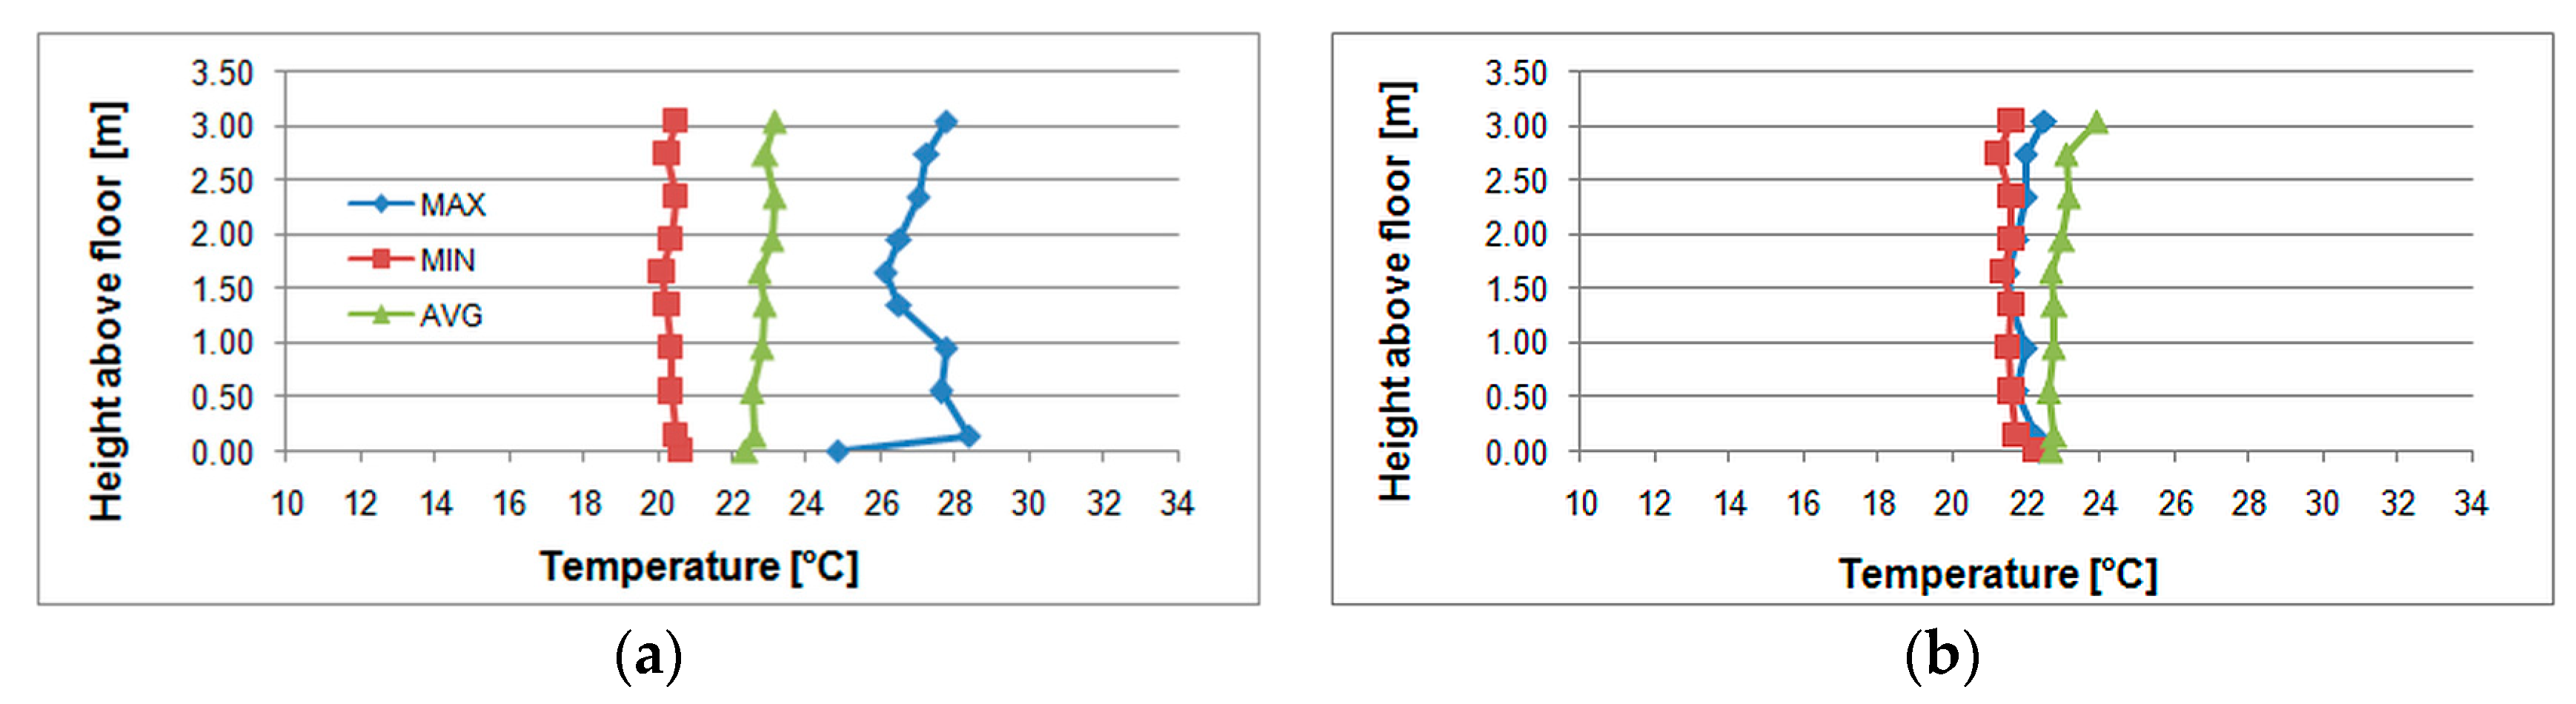
Assuming sensors positions as in Figure 3b and including floor temperature the minimum, maximum and average values of temperatures recorded by all sensors in four characteristic periods were computed. They are presented in Figure 7 and Figure 8. In all cases the minimum and average temperatures were very stable and varied within very narrow ranges. For example, the average temperature was from 19.9 °C to 20.6 °C, from 20.0 °C to 21.5 °C, from 21.4 °C to 22.1 °C and from 20.6 °C to 21.2 °C for the consecutive periods. Only the maximum values were significantly greater than the others.
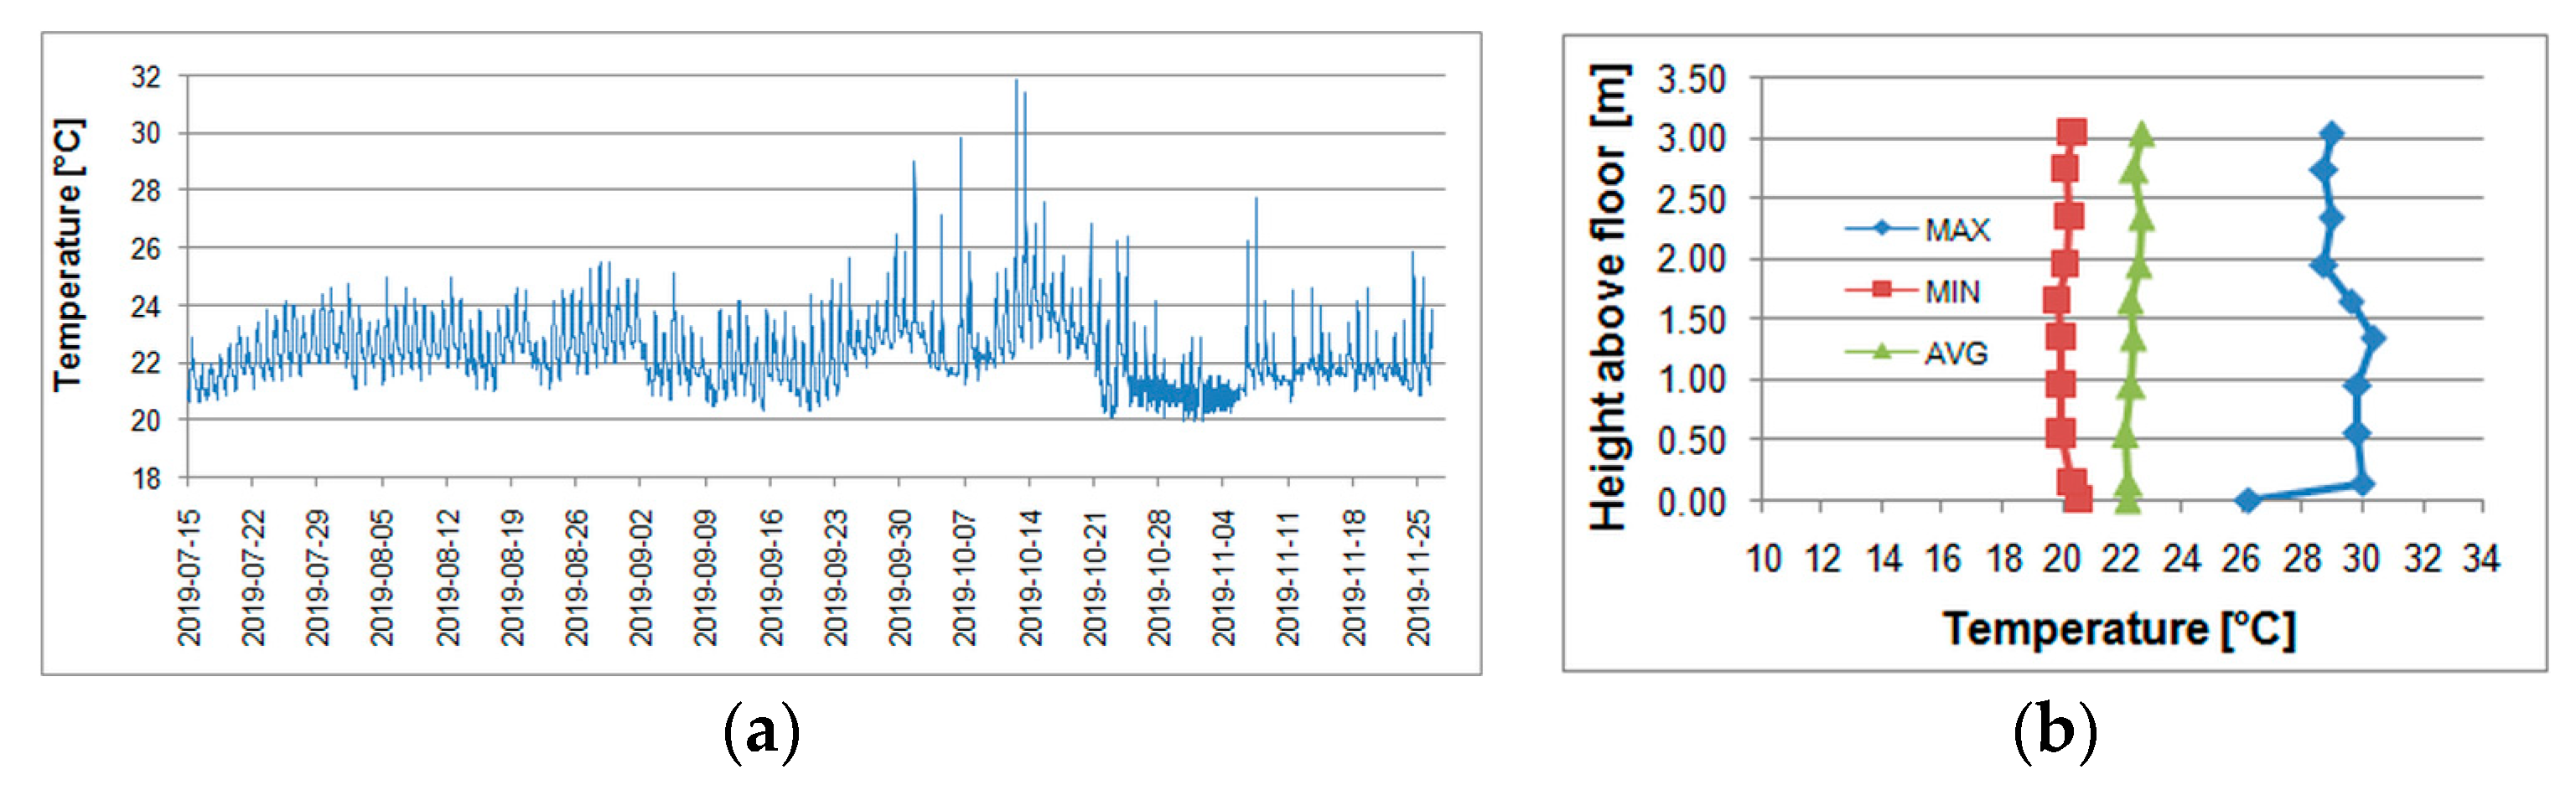
Comparison of Figure 7a with Figure 8a shows that the maximum temperature, recorded by the T3 sensor, was not during the hottest week. To solve this problem thorough analysis of the measurement data was performed. It revealed that it turned out that values above 30 °C appeared only four times (Figure 9a): 31.87 °C and 31.50 °C at 16:15 and at 16:30 on 12 October 2019 (Saturday), respectively and 31.37 °C and 31.00 °C at 16:15 and at 16:30 on 13 October 2019 (Sunday), respectively. Similar situation took place in the case of the T4 temperature sensor. These sudden instantaneous increases in values measured by the T3 and T4 sensors appeared in weekends, when the ventilation system and active external shading was switched by employees into ‘manual’ mode and hence was at stable position during the whole weekend. Excluding interruptions in the measurement equipment indicates solar irradiance entering the room through large area south-oriented windows as the most possible source of these unexpected values. Omitting abovementioned points gives profile of the indoor air temperature presented in Figure 9b.
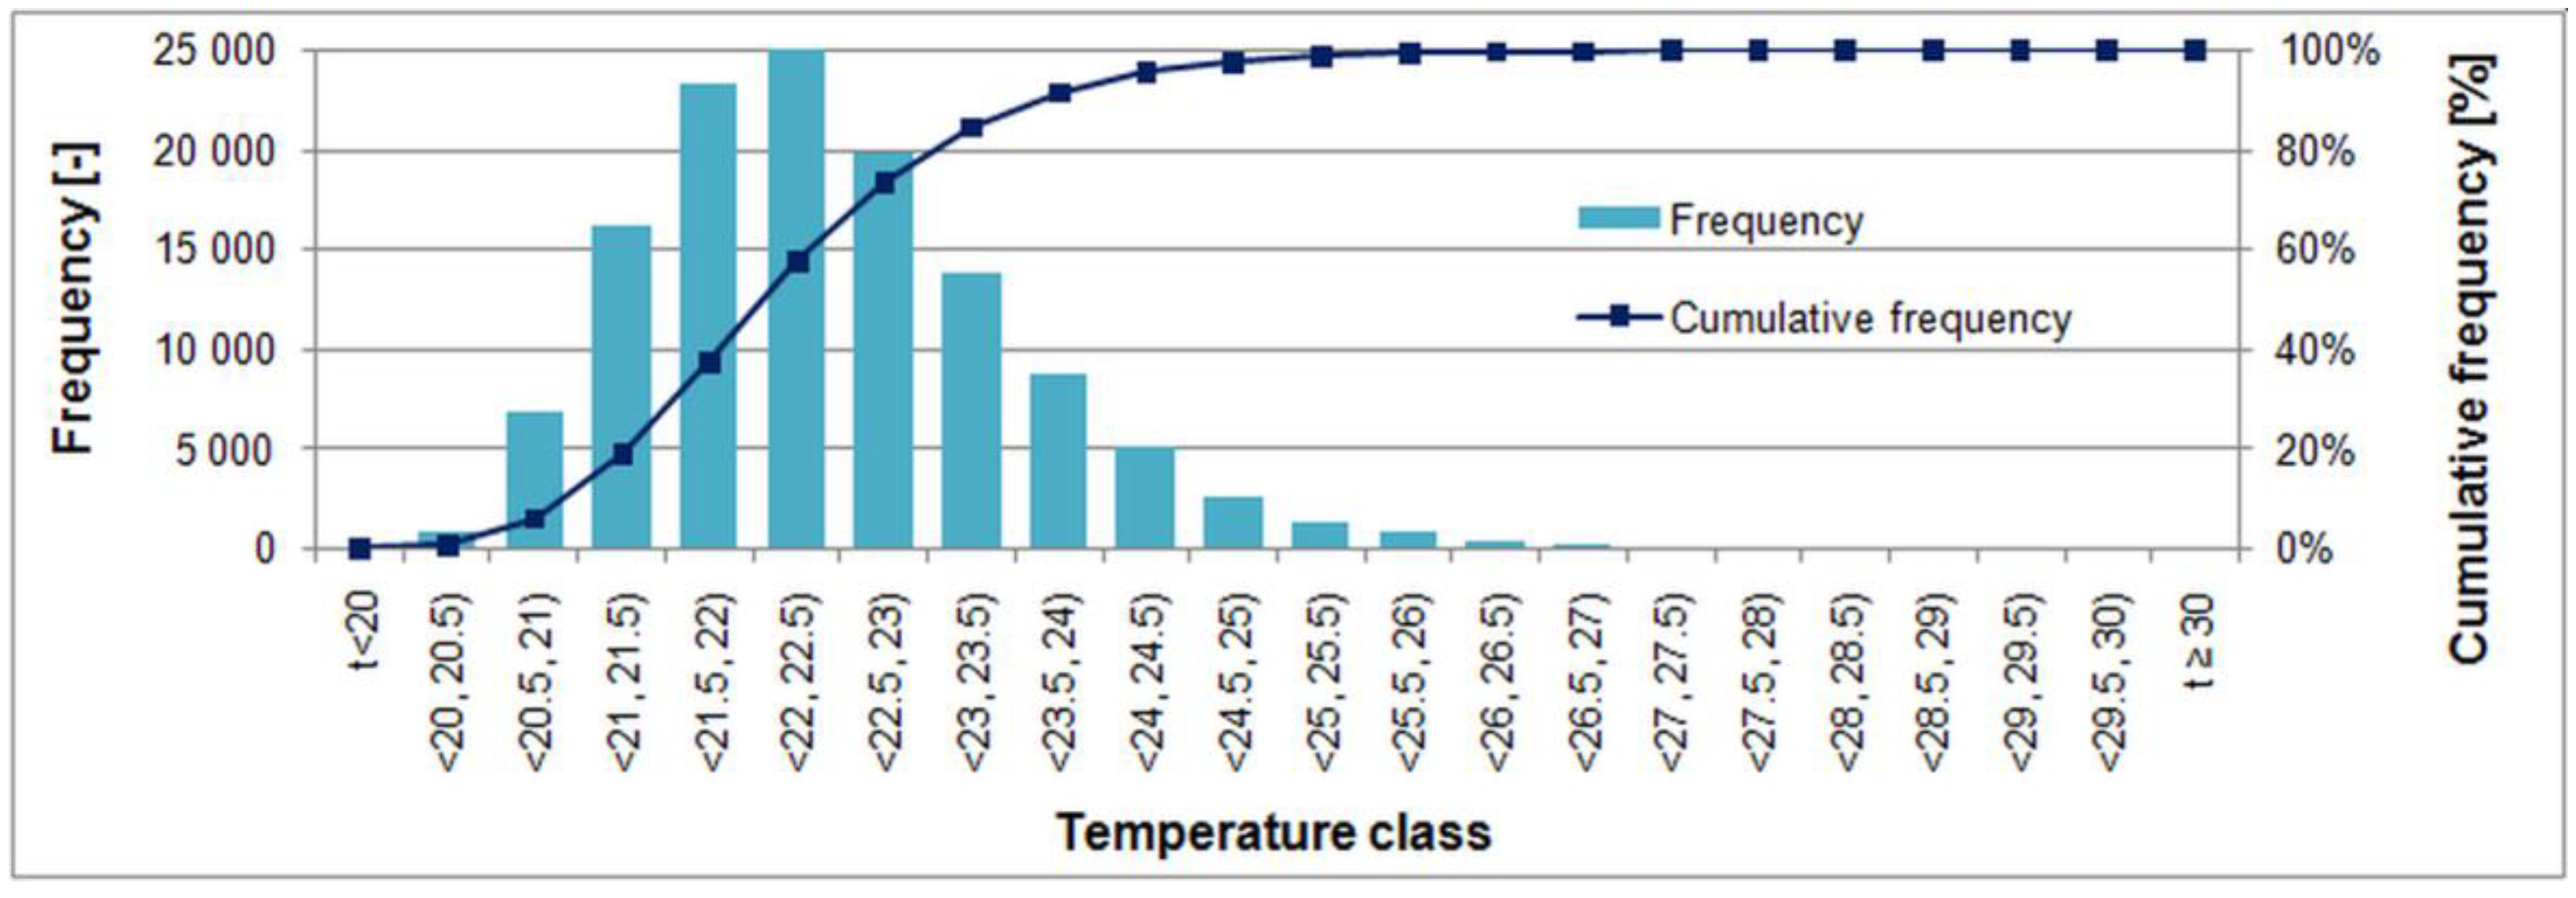
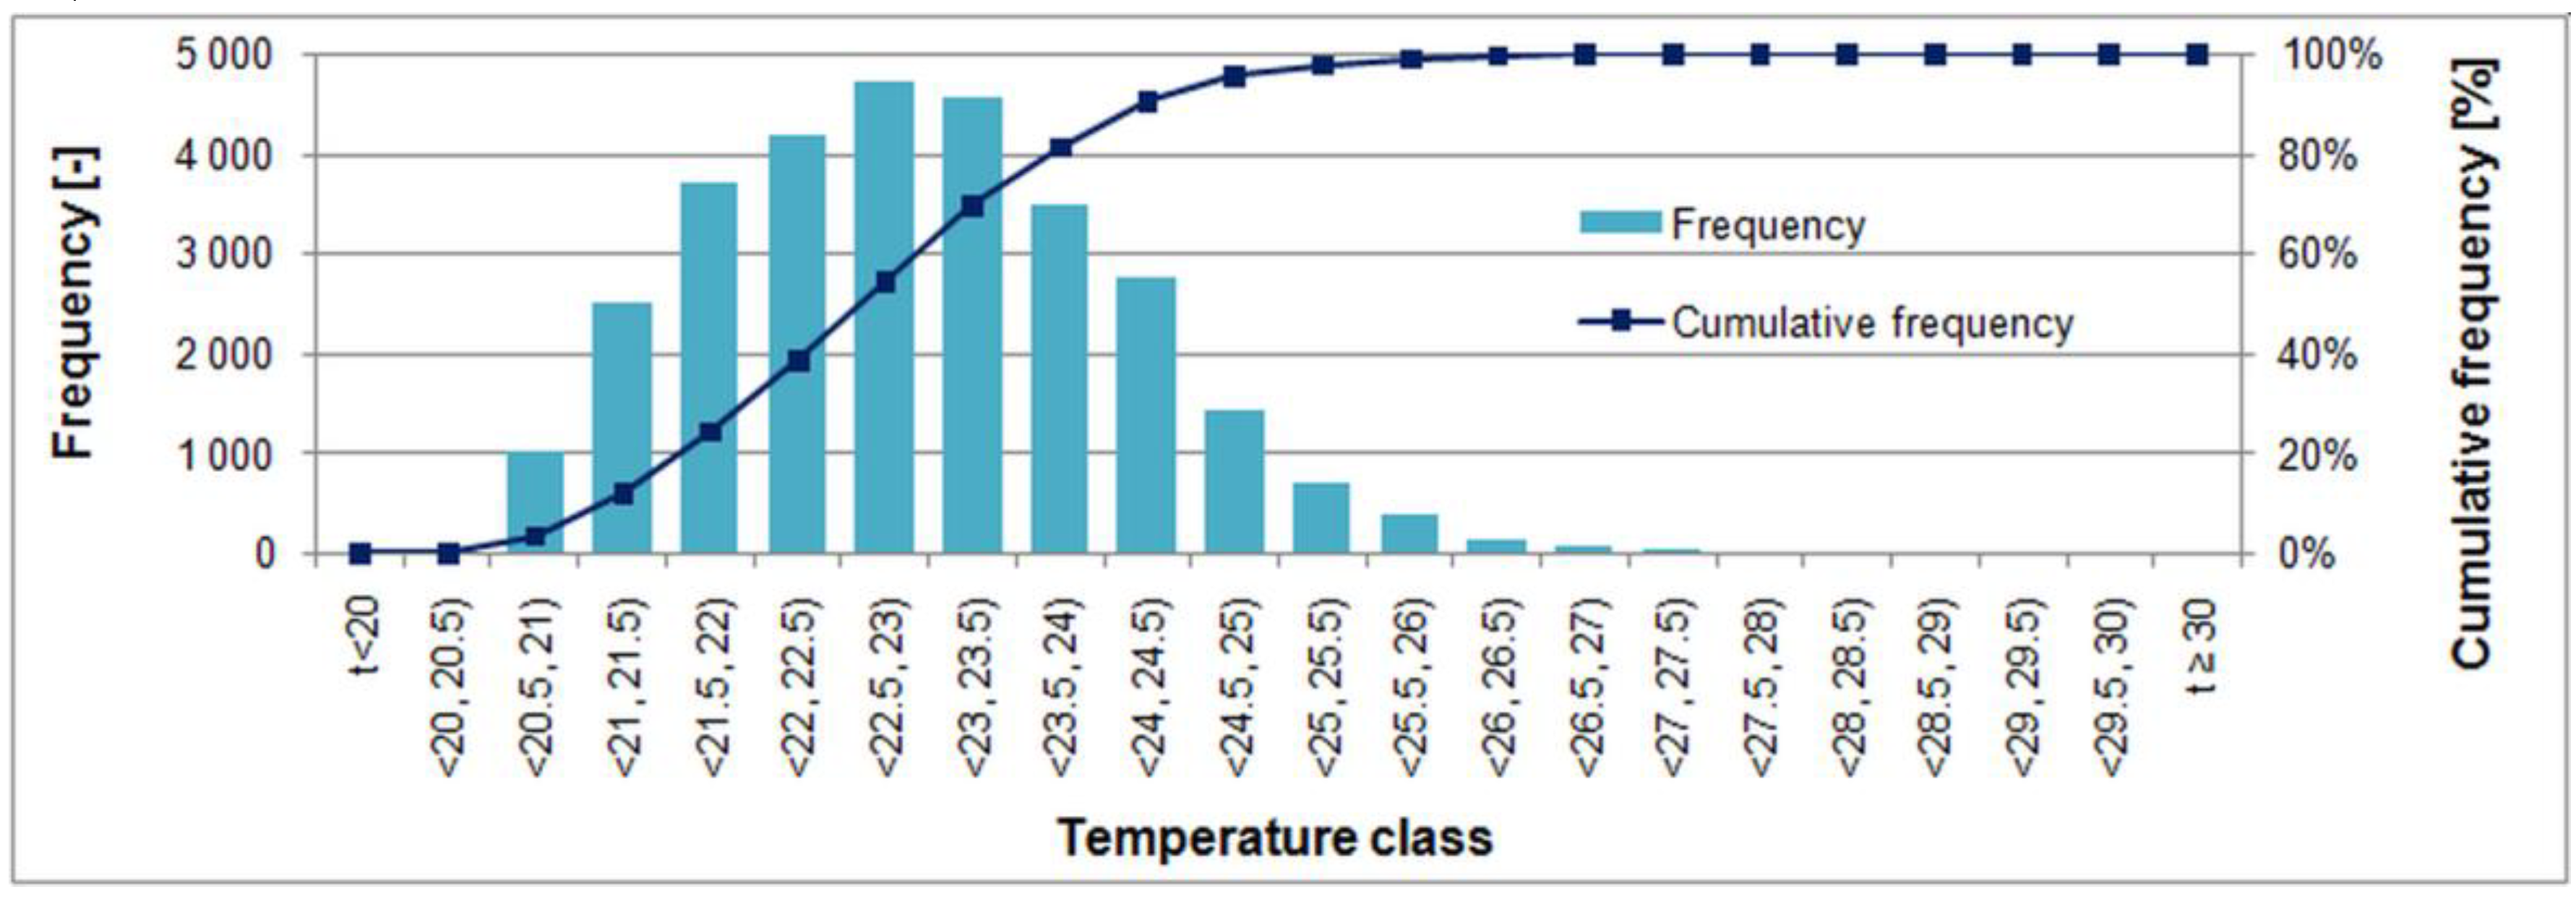
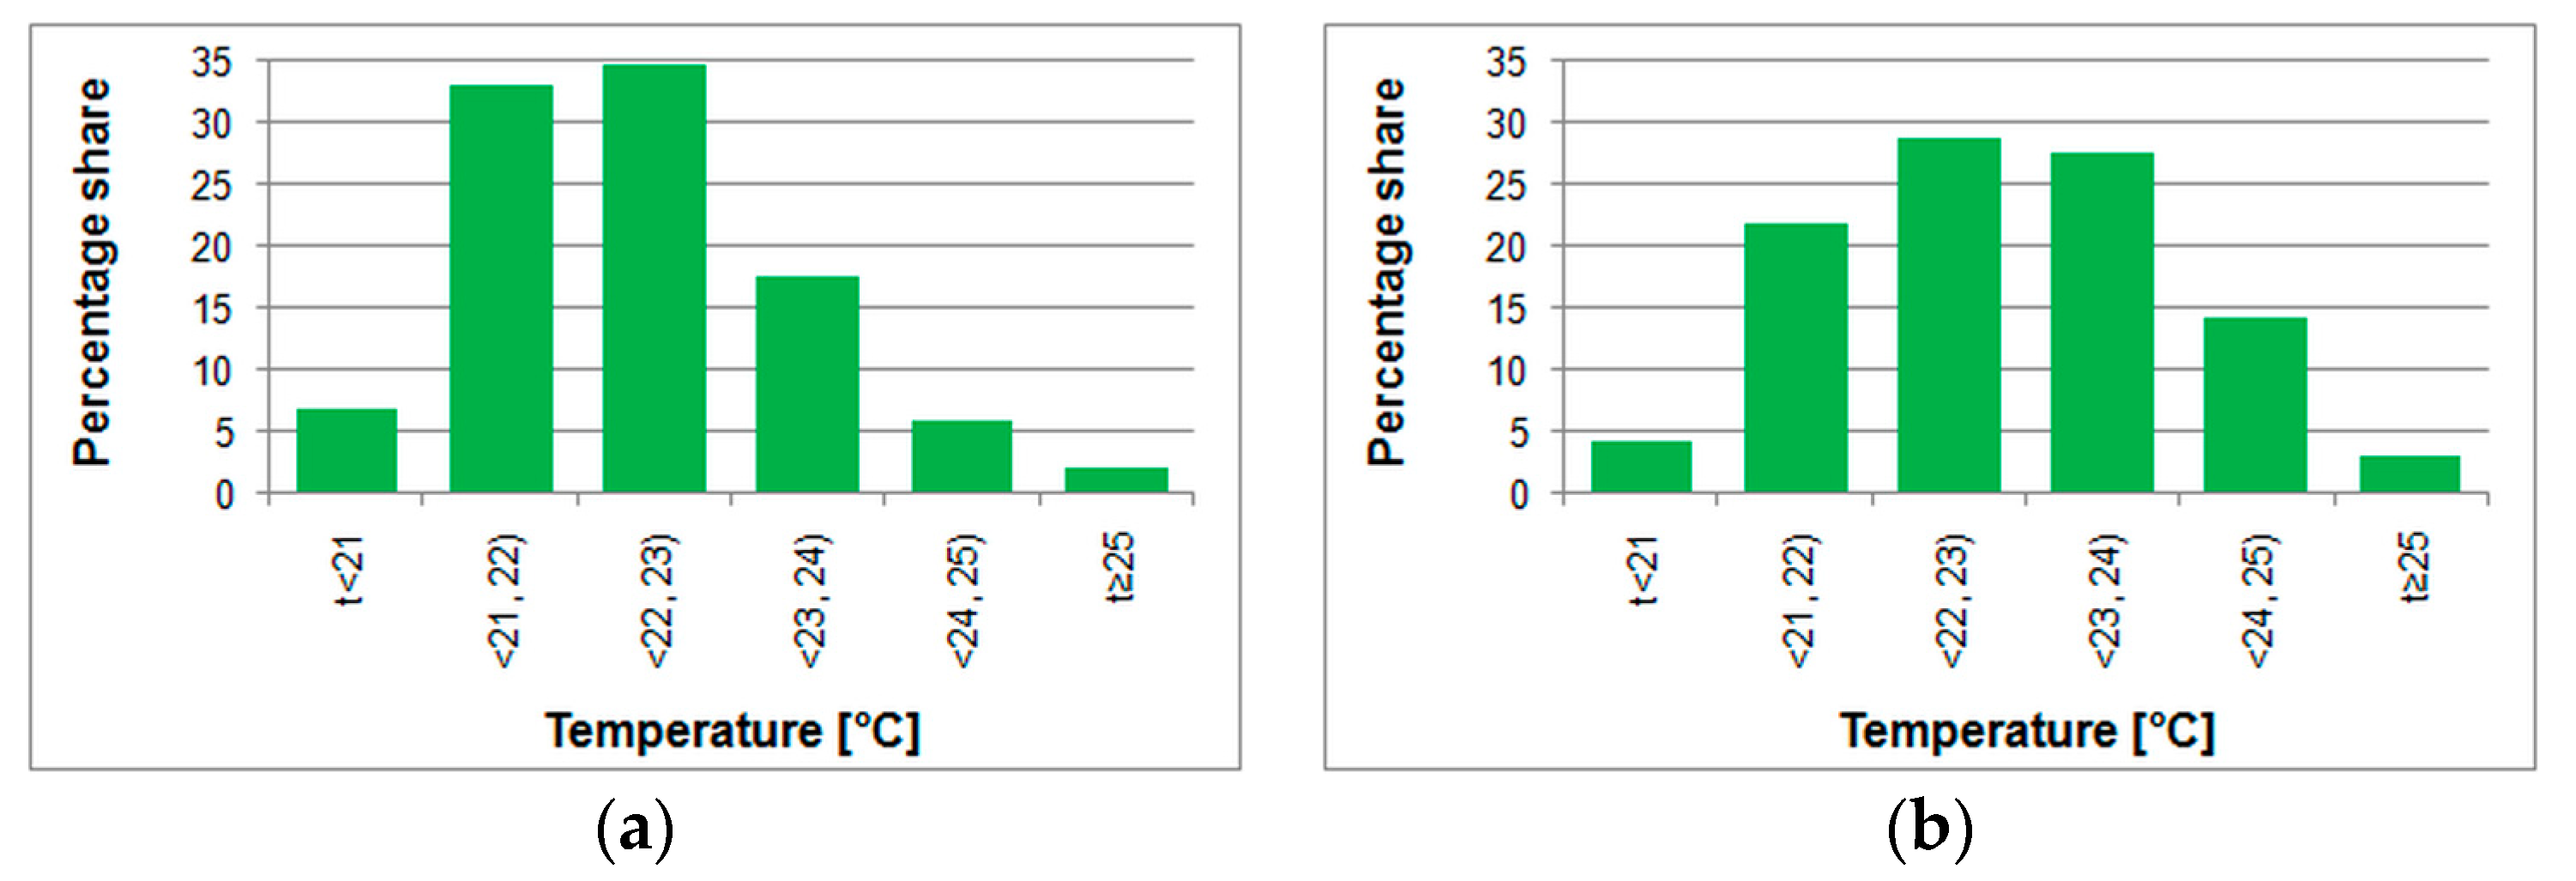
However, this is not the proper analysis method as the resulting image is incomplete. Better way is to describe variance of measured variable by a histogram [79]. In the considered case, values from sensors T1-T9 were gathered and divided into temperature classes 0.5 °C wide (Figure 10). Temperatures within the range from 20 °C to 25 °C covered 97.6% of the whole period.
But this analysis also covered unoccupied periods. In the considered buildings the TABS system works permanently and is supported during working periods by mechanical ventilation with heat recovery [55]. This irregular operation of the HVAC system affects internal thermal conditions.
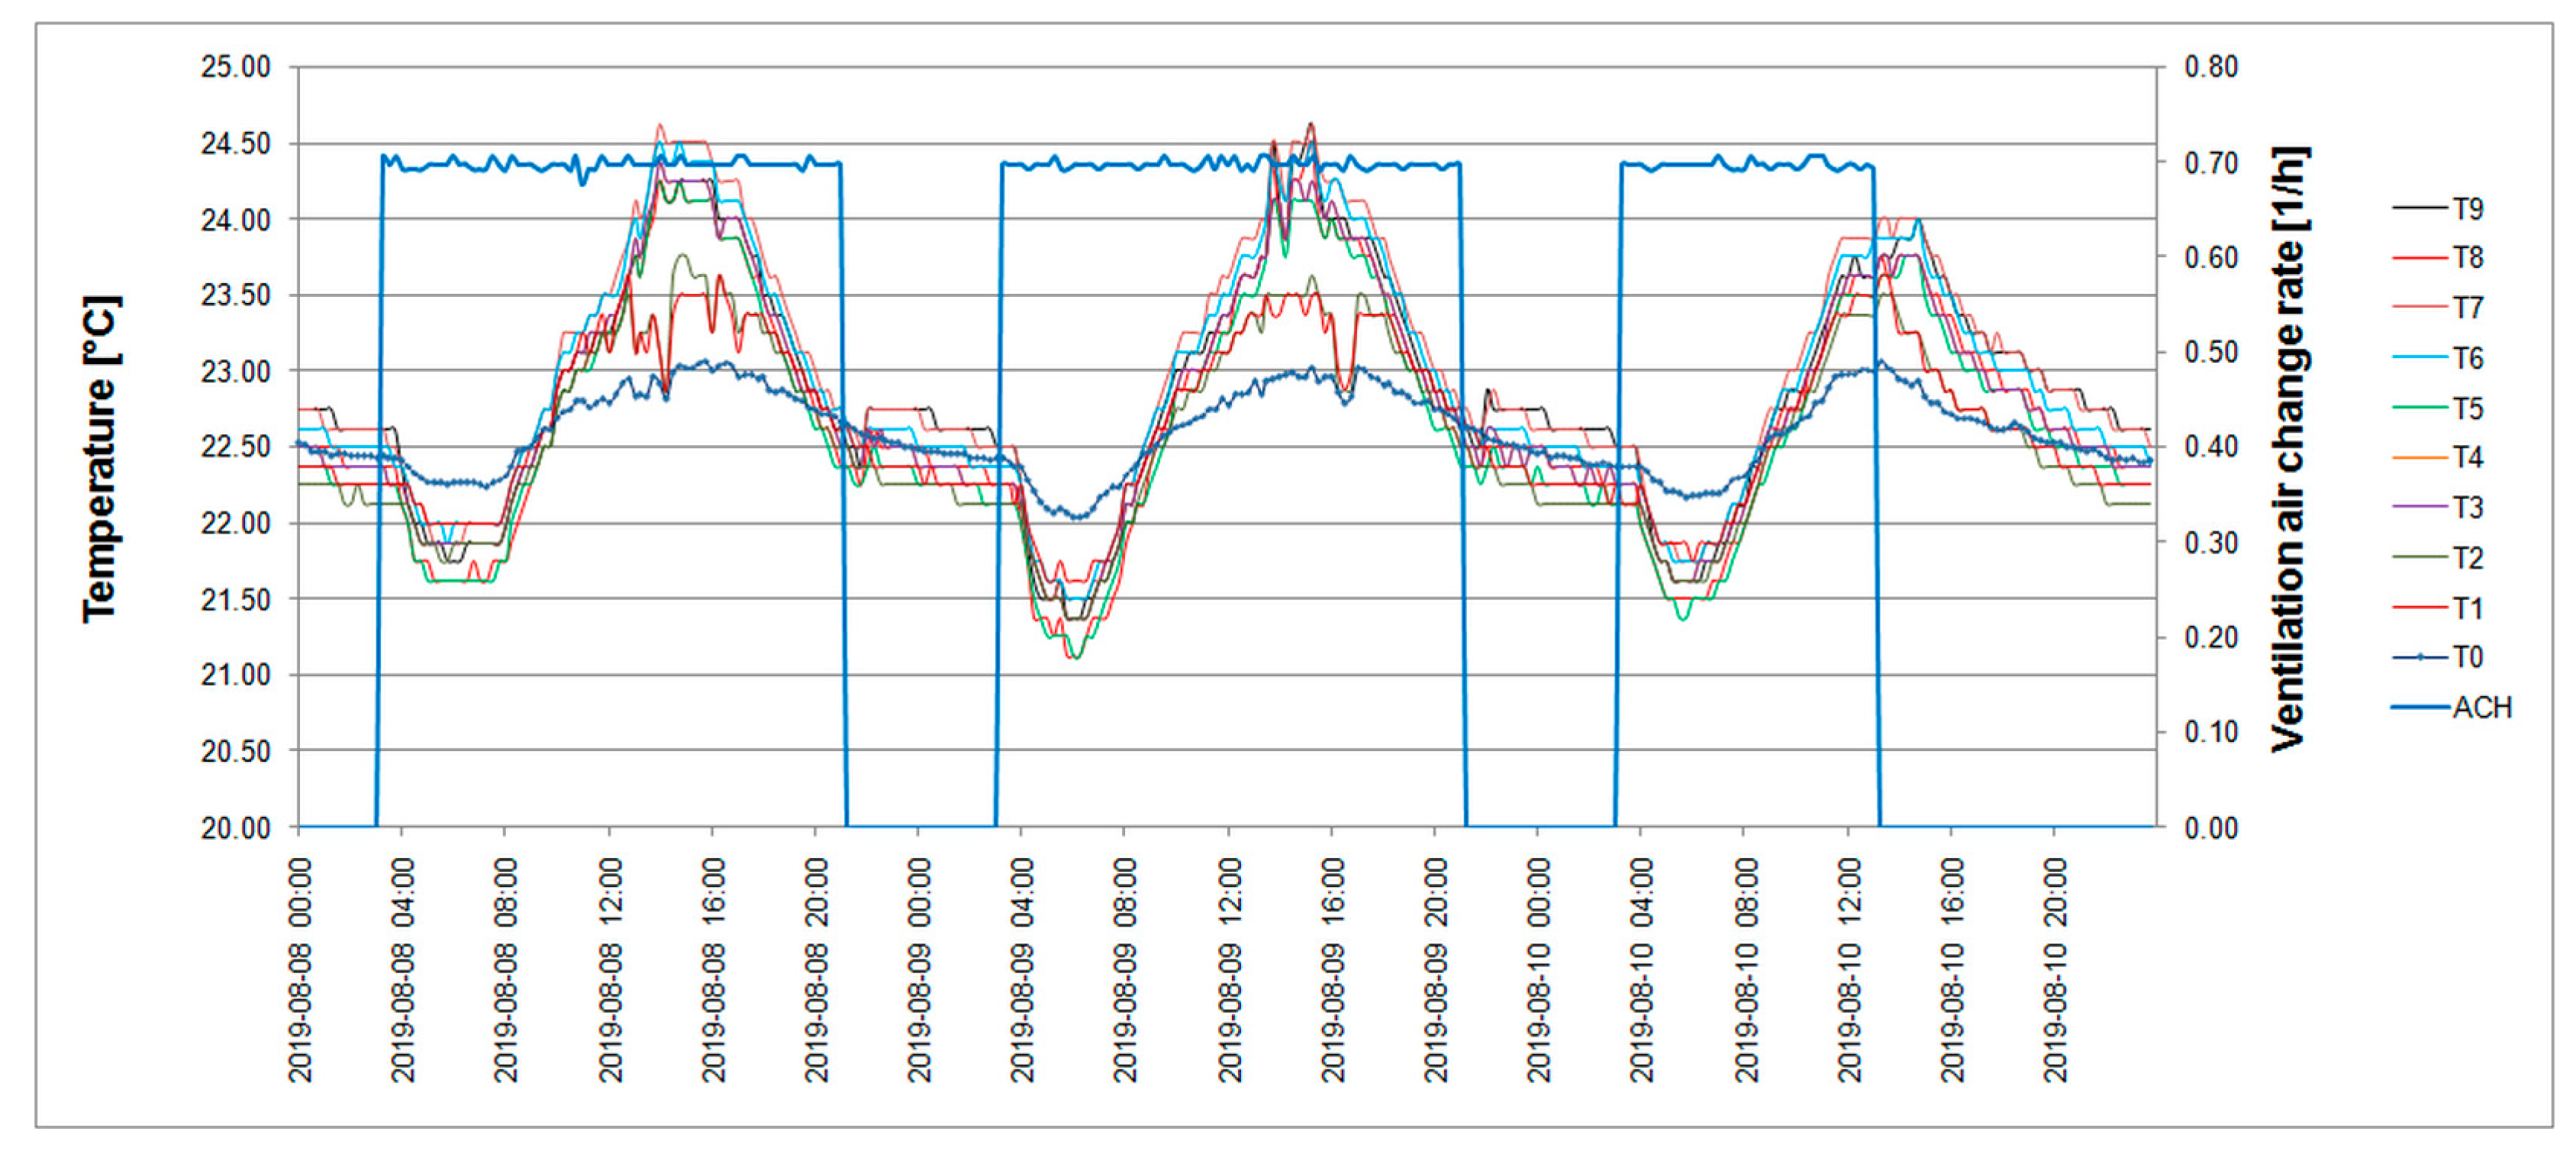
Figure 11 presents air and floor temperatures and ventilation air change rate in the room during three typical days, from 08 August 2019 (Thursday) to 10 August 2019 (Saturday). The ventilation system in the building operates according to constant schedule. On working days ventilation is switched on only during working hours of offices plus 2–4 h before and after, depending on the indoor air temperature. On Sundays and holidays when the building is closed ventilation is off. Ventilation air change rate (ACH) was determined on the base of the airflow rate measured by the BMS in the air handling unit and on the technical design of the ventilation system for this building.
The most stable was the floor temperature T0. The most visible variation was observed in case of the T9 temperature, near the ceiling, but in absolute terms it was not great: from about 21.5 °C to 24.5 °C. At the beginning of the working day (at 8:00) this temperature exceeded 22 °C.
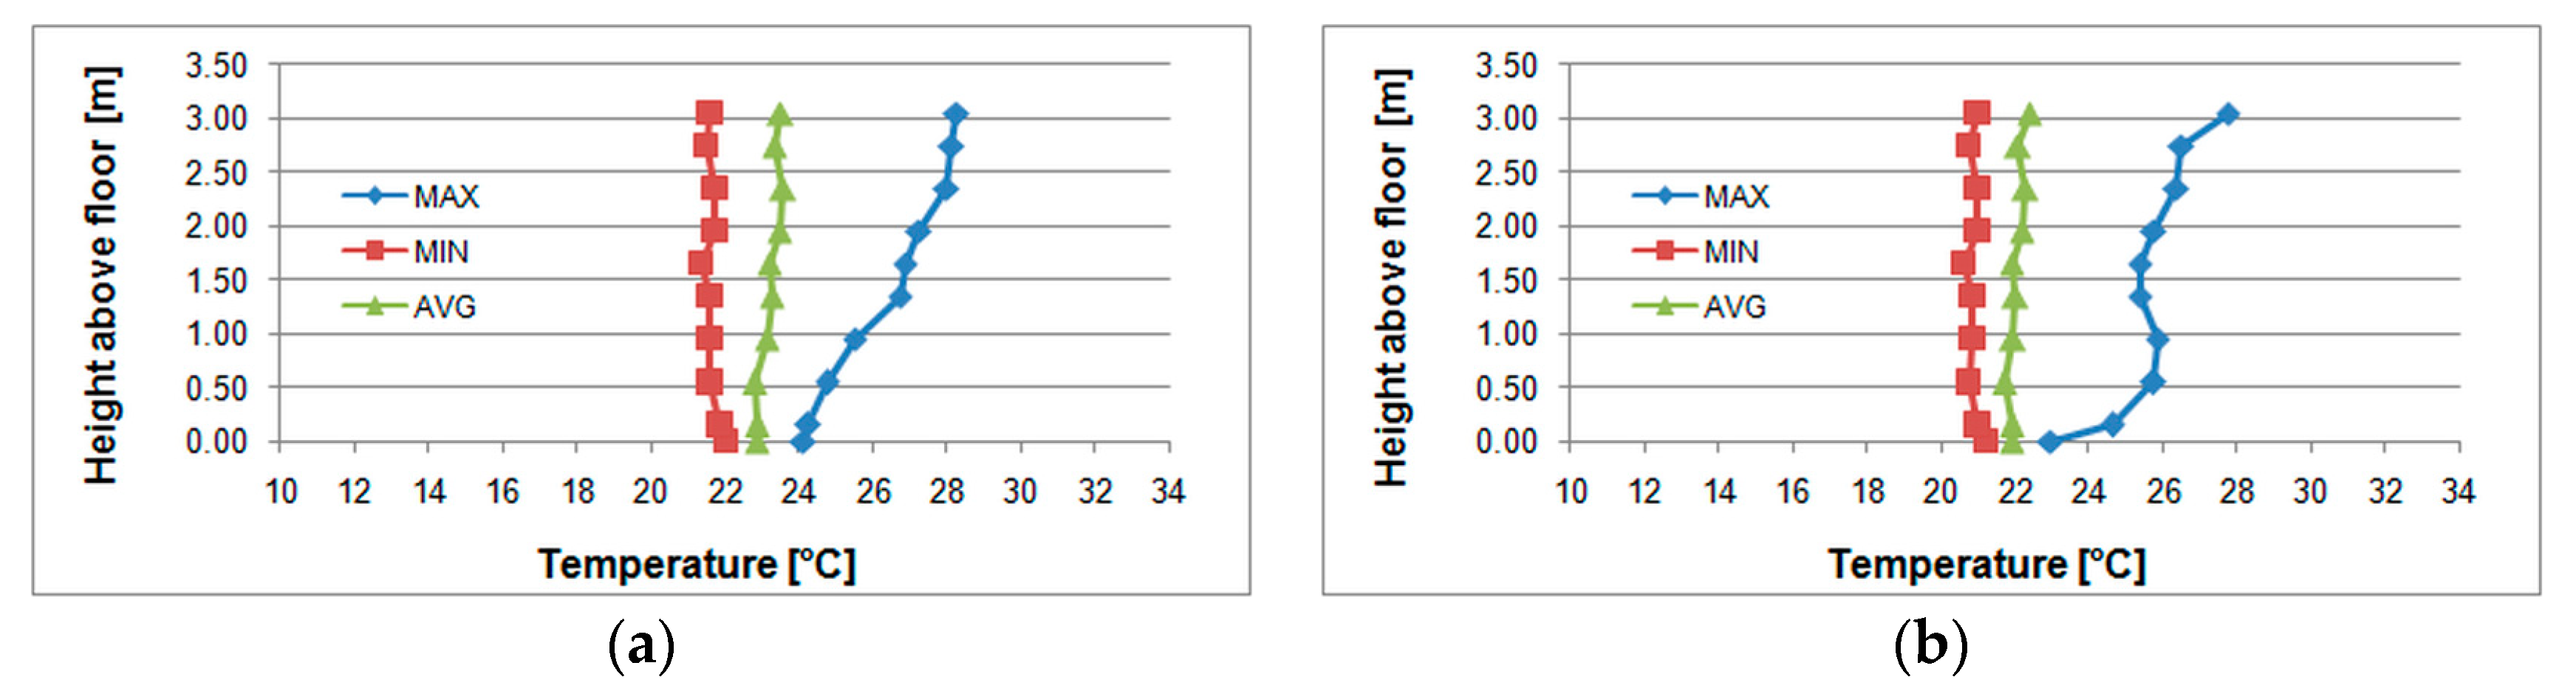
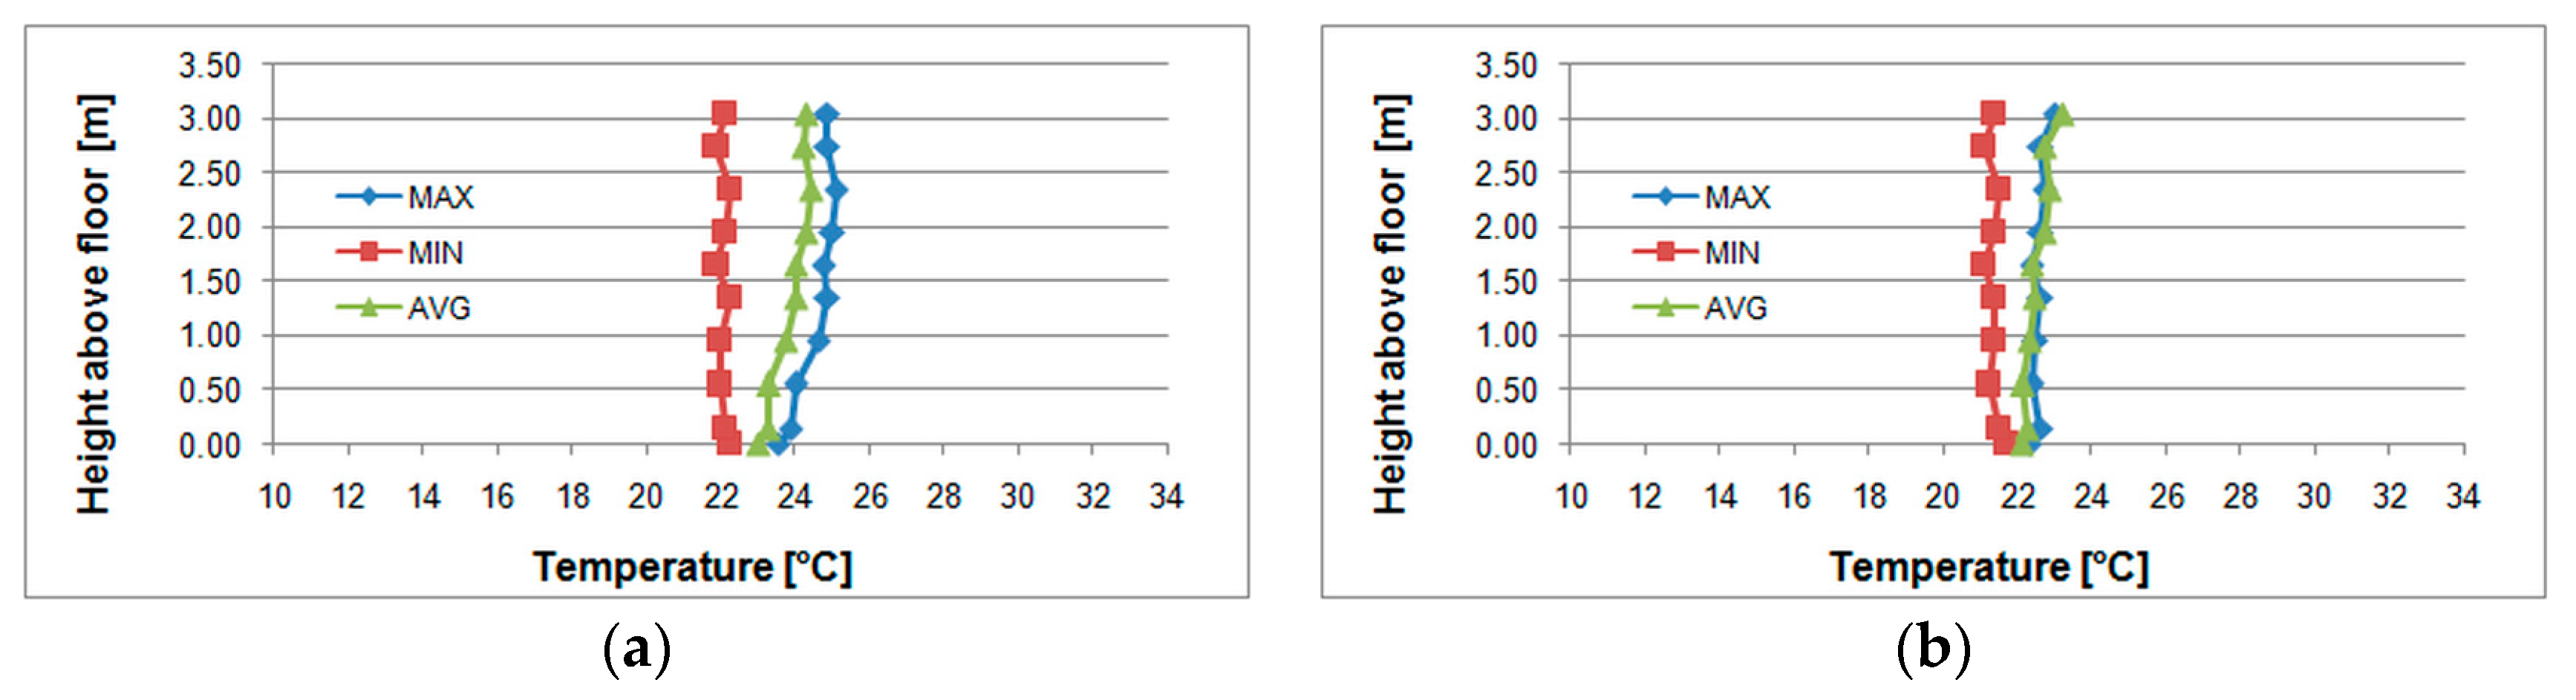
Considering only working hours the vertical air temperature profile for the four analysed characteristic periods is shown in Figure 12 and Figure 13. Comparing the results with the previously presented, a significant improvement is visible.
As in the previous case, the maximum temperatures were not observed during the hottest week. The histogram for working hours (Figure 14) showed that temperature within the range from 20 °C to 25 °C covered 95.5% of all working hours. Extending this range to 26 °C gave 99.1%.
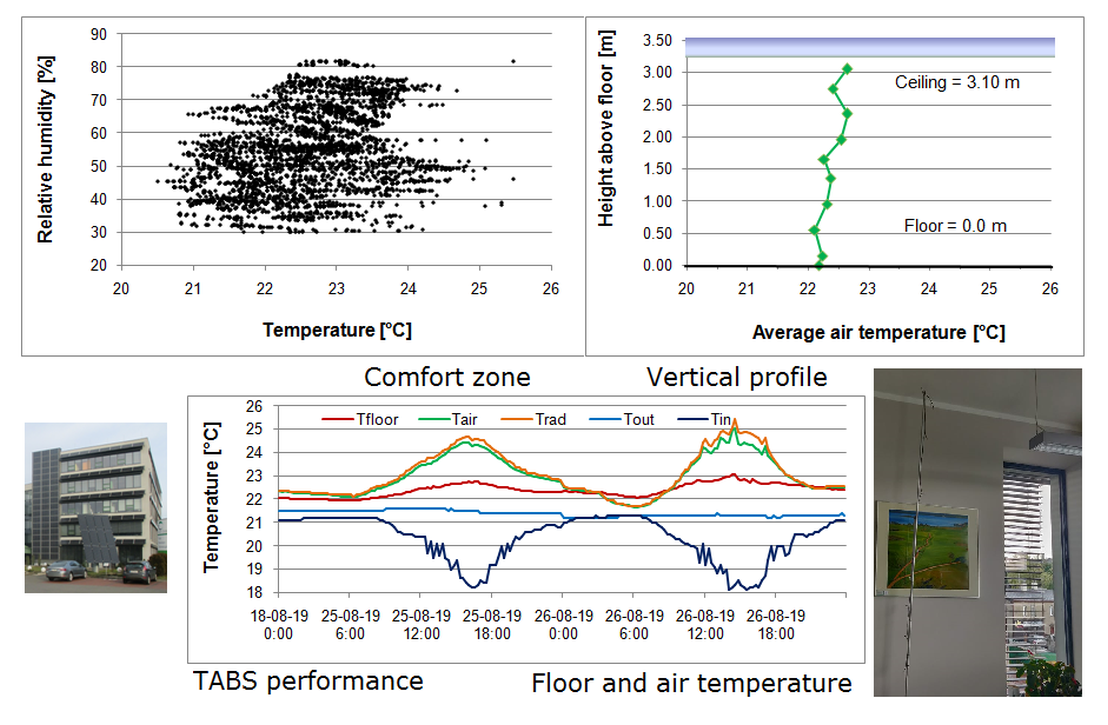
The average internal air temperature was of 21.8 °C and 22.9 °C for all and working days, respectively. Taking as reference the average for the whole period the average temperature stratification was 0.83 K. In order to estimate the variability of the measured air temperature value in the examined profile from its average values, its histograms were determined for all days and working days (Figure 15). Temperature from 21 °C to 24 °C had dominant share of 85.3% and 78.3% in the first and second case, respectively. Values outside this range are in the minority and have low impact on average vertical profile shown in Figure 7, Figure 8, Figure 12 and Figure 13.
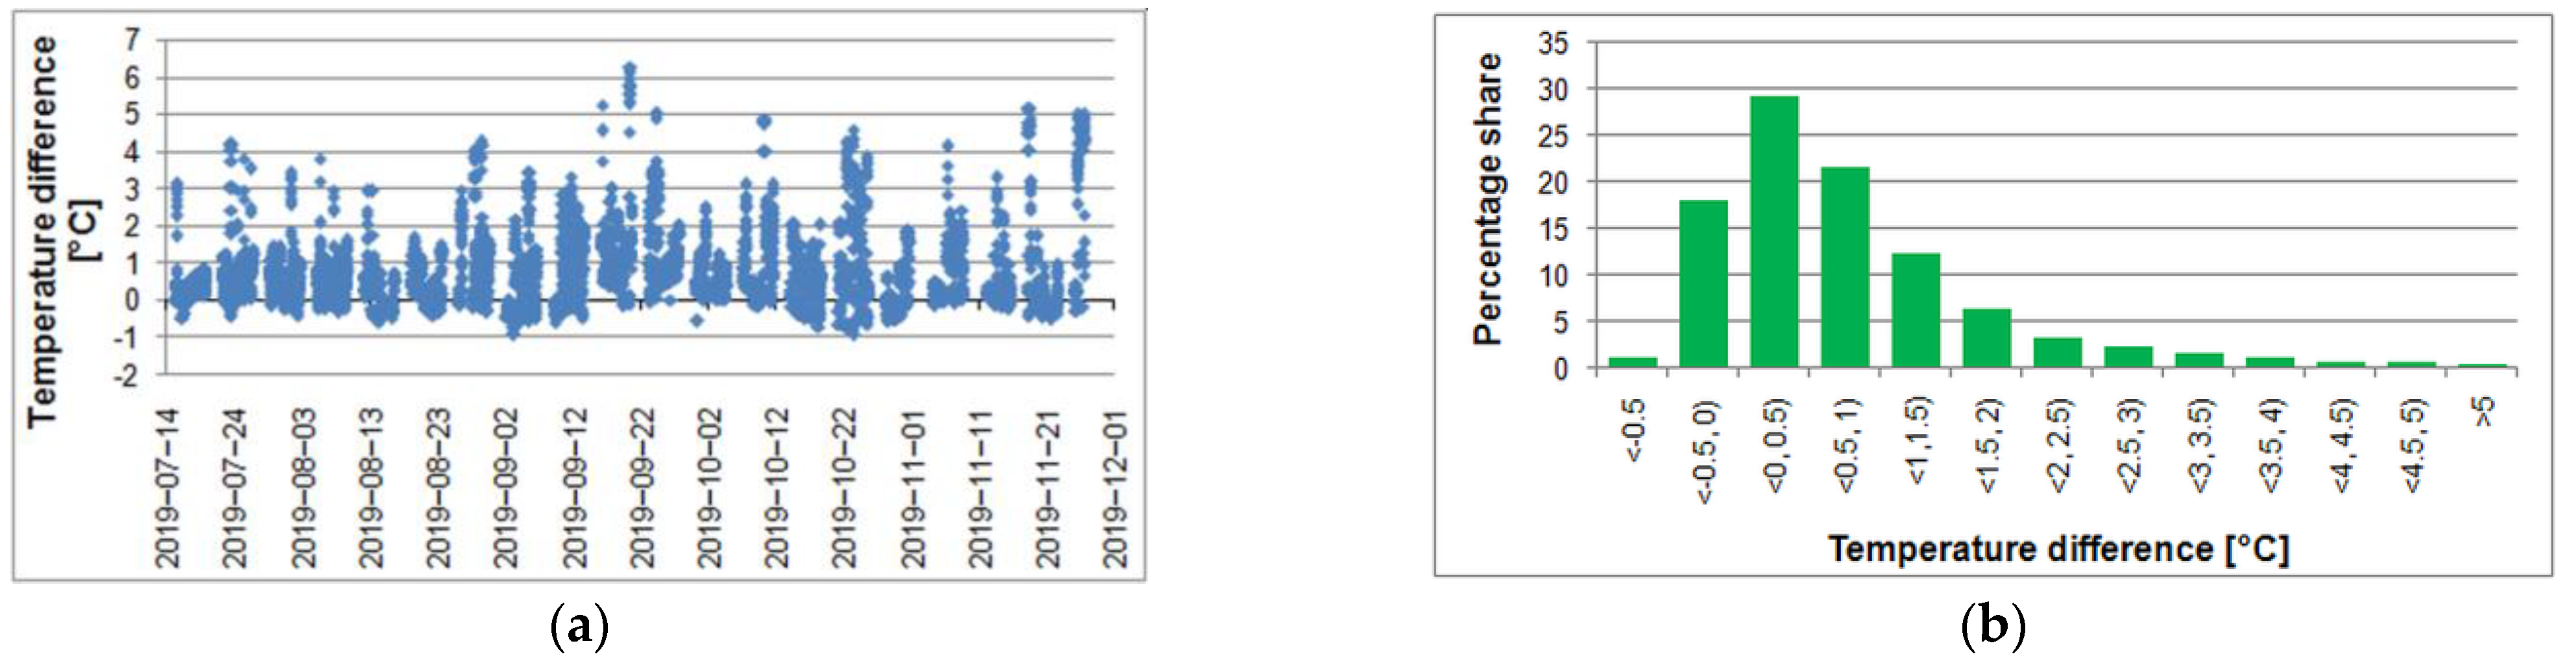
These figures prove the important feature of radiant heating and cooling systems which is the uniform temperature profile from a floor to a ceiling, typical for the TABS systems [34]. The difference between T9 and T0 temperatures during the analysed period (working hours only) was from −0.93 °C to 6.28 °C (Figure 16a). Dominating share (Figure 16b) had values between −0.5 °C and 1.5 °C (81.6%).
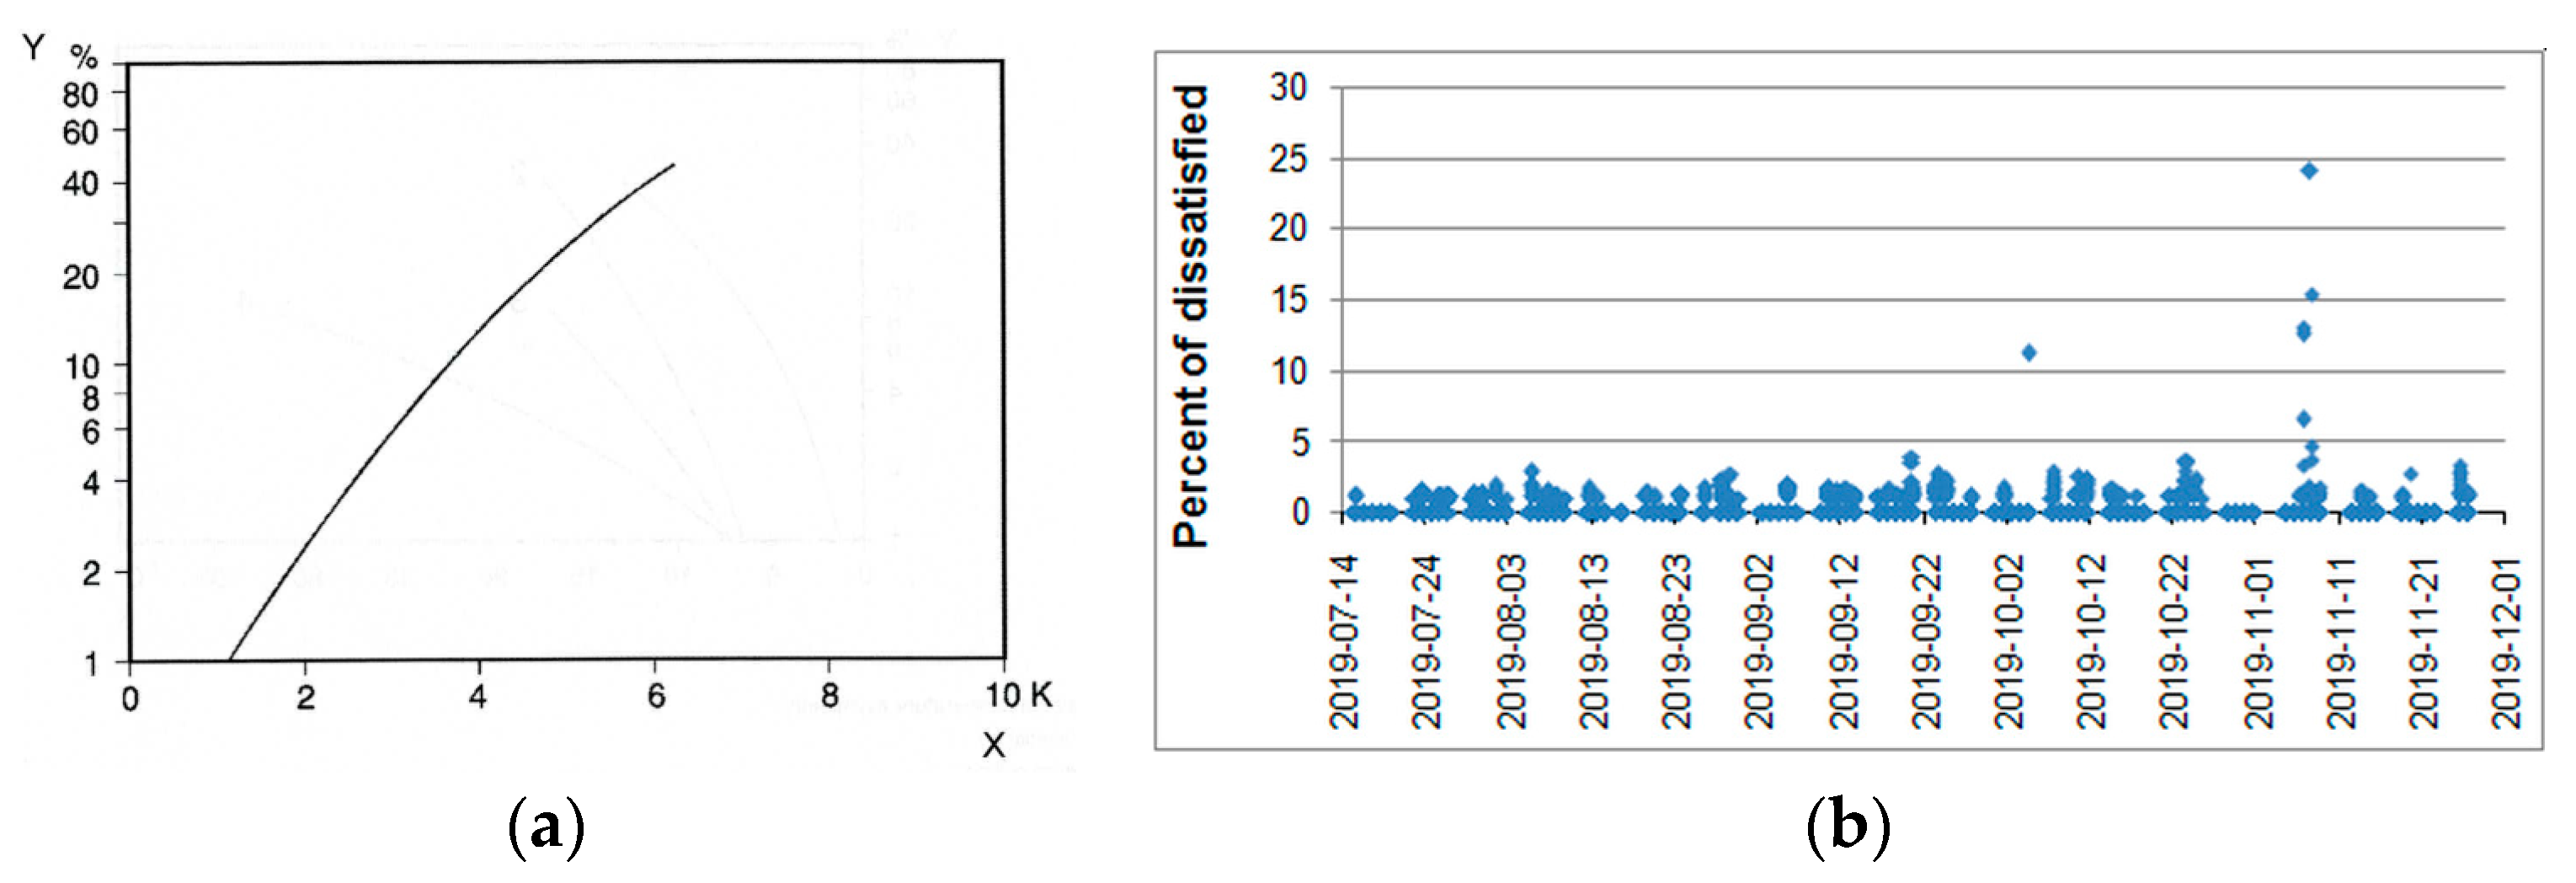
The EN-ISO 11855–1 [46] standard, dedicated to design, dimensioning, installation and control of embedded radiant heating and cooling systems, presents comfort criteria (Figure 17a) based on the vertical air temperature difference (X) between the height of the head (1.1 m) and the feet (0.1 m) for sitting position. The resulting is percent of dissatisfied (Y).
Here the closest values at 0.95 m (T3) and 0.15 m (T1) were available (Figure 4b) and they varied from 20.6 °C to 24.8 °C and from 20.4 °C to 27.8 °C, respectively. Their difference was from −1.8 °C to 2.9 °C. In five samples it was between 3 °C and 4.9 °C which resulted in the calculated percent of dissatisfied over 10%. Its maximum value of 24% was at 13:30 on 7 November 2019 when the T3 reached 27.75 °C. But it could be probably due to the error or temporary disruption, because the readings from the previous and next time-steps were of 23.50 °C and 27.12 °C, respectively. The same explanation can be referred to several other points over 10%, presented in Figure 17b, which means they can be treated as errors.
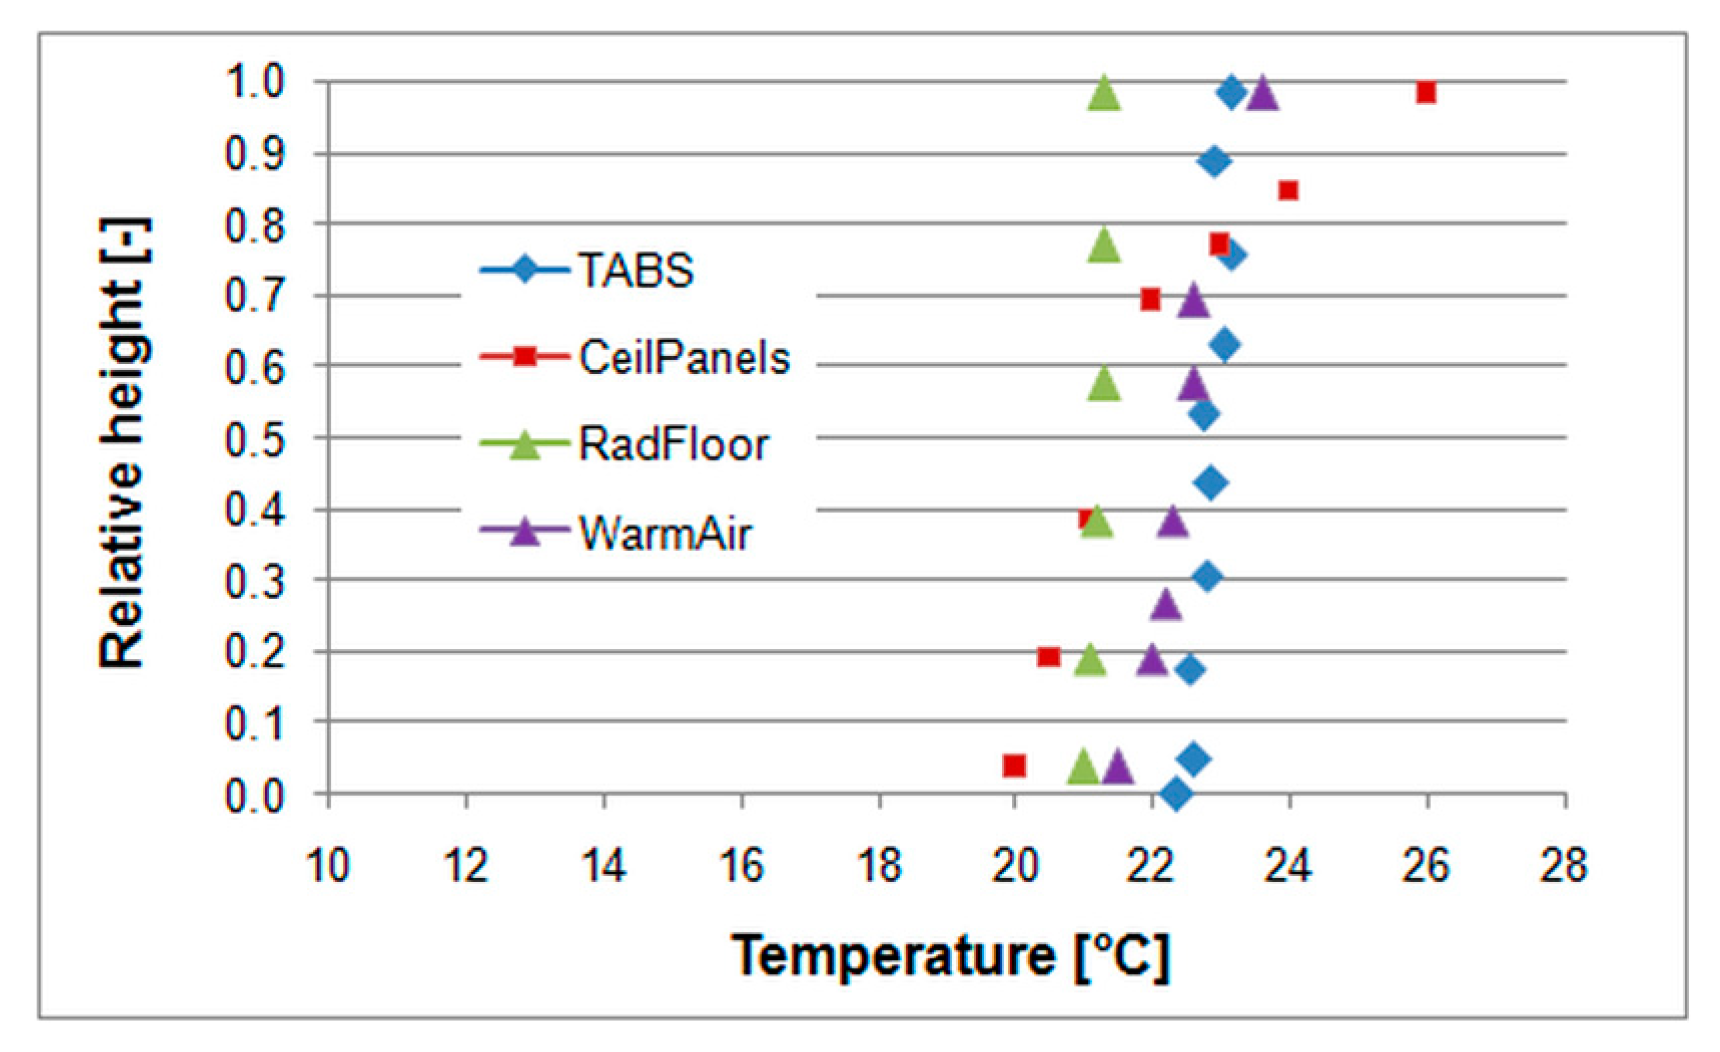
Positive aspects of TABS can be emphasised on the background of other solutions. Such comparison for the selected systems was presented by [80] and is shown in Figure 18. In addition, average profile for TABS during workdays was also given. Relative height of 0 and 1 means floor and ceiling level, respectively.
Several authors also presented results of simulations and measurement results for various heating and cooling system. Temperature profile measured in a room with floor heating and typical water radiators was presented in [81]. Maximum air temperature difference during floor heating was lower than 0.51 °C. Vertical temperature gradient less than 1 °C/m in a test room with cooled ceiling was measured in [82]. In [79] energy performance of a small size office building equipped different heating and cooling systems was simulated for various European climates. The frequency of the occurrence of operative temperature from 20.5 °C to 24.0 °C and from 23.5 °C to 26.0 °C in winter and summer season, respectively, was considered. It was 99.4% and 100%, 98.7% and 100%, 99.4% and 90.0%, 98.6% and 99.3% for the air, fan coil, radiant floor and radiant ceiling, respectively. Air temperature distribution in a living room with floor heating was simulated and measured in [72]. Difference between air temperature between floor and ceiling was lower than 1 °C. Floor temperature was 3 °C higher.
Simulation of thermal performance of a single room with TABS was shown in [83]. Diurnal variation of operative temperature was up to 6 °C. Simulations and measurements of the TABS system combined with free-hanging acoustic ceiling units were presented in [56]. For different coverage ratios temperature gradient was under 0.5 °C/m up to height of 1.7 m and of 3.5 m for horizontal and vertical panels, respectively. In the office room with TABS air temperature changed less than 1 °C up to height of 2.70 m. Ceiling temperature was lower at least 2 °C in all cases [44].
Vertical temperature profile for diffuse ceiling ventilation integrated with a radiant ceiling system was analysed in [57]. The largest difference along height occurred in moderate season and was below 2 °C. The air temperature stratification in the cooling mode measured in the office room with radiant ceiling panel system and the radiant slab system was up to 1.7 K and 3.4, respectively [73]. That study also summarises the results of air temperature stratification in various studies related to radiant heating and cooling systems.
3.3. Internal Air Temperature and Relative Humidity
Leusden and Freymark [84,85] have developed the chart showing perception of thermal comfort in relation to air temperature and relative humidity. There are three comfort zones, namely ‘comfortable’ and ‘still comfortable’ and not comfortable including ‘too dry’ and ‘too moist’ conditions. Measurement results from the considered room are shown in Figure 19.
Most of the results belong to the ‘still comfortable’ zone. Some of them are outside of it in the ‘too moist’ area and they were identified as that from the heating period. Occurrence of these values may be explained by humidity of external air (see Figure 5) and operation of air handling unit with rotary heat exchanger [37].
3.4. Thermal Comfort According to EN ISO 7730
Thermal comfort in buildings is the subject of a number of standards. Two most common are the ASHRAE 55 and ISO 7730, both based on extensive research under laboratory conditions involving the use of specialised measuring equipment. In the absence of such equipment, the obtained results may not be reliable. However, careful application of simplified computational methods and comparisons with other tests conducted in similar environmental conditions may be the basis for the elaboration of the obtained measurement data.
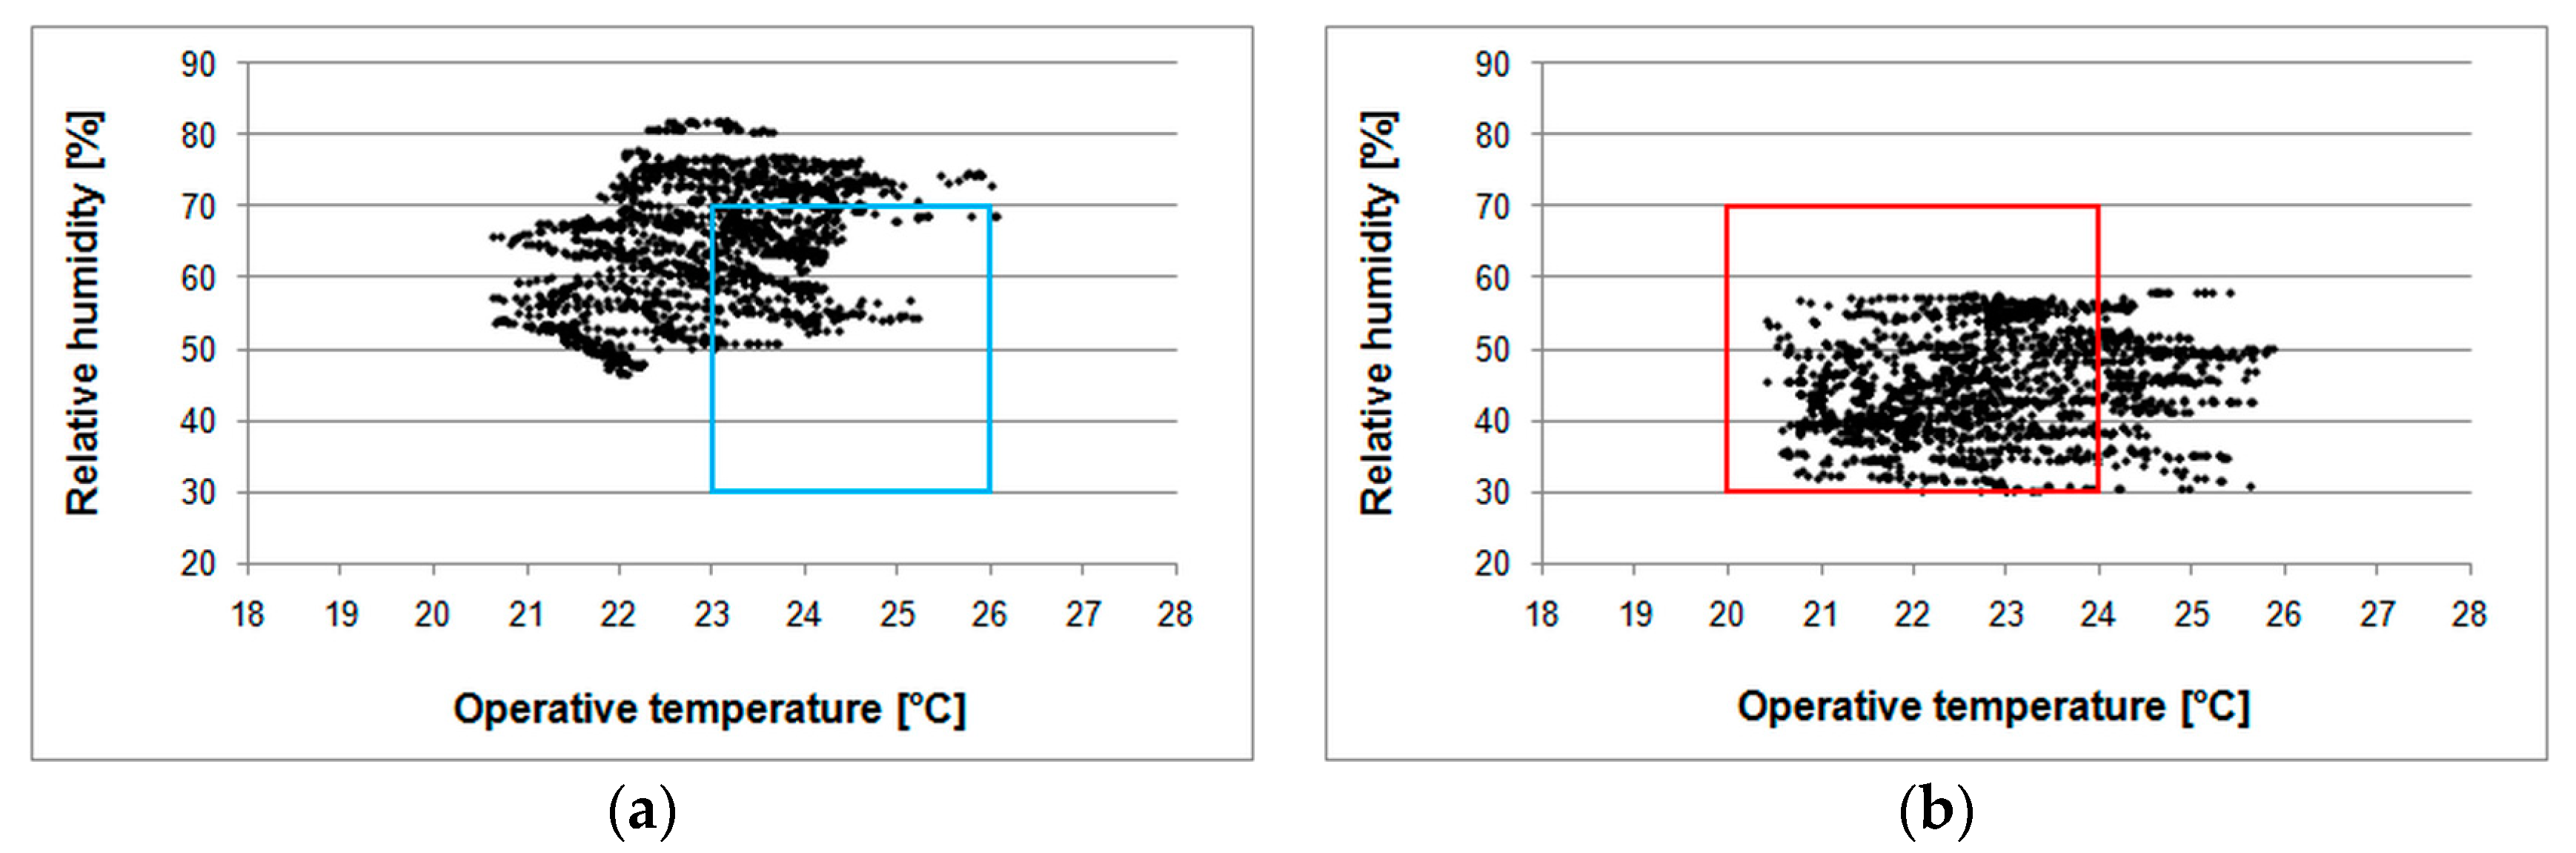
The EN-ISO 7730 standard gives recommended indoor conditions for which thermal comfort is achieved. For light, mainly sedentary activity, they include relative humidity from 30% to 70% and operative temperature from 20 °C to 24 °C or from 23 °C to 26 °C for the heating (winter conditions) and cooling (summer conditions) period, respectively. However, in Polish climatic conditions six thermal seasons of the year are distinguished [86] on the basis of the average daily air temperature, as follows: below 0 °C (winter), from 0 °C to 5 °C (early spring), from 5 °C to 15 °C (spring), over 15 °C (summer), from 15 °C to 5 °C (autumn), from 5 °C to 0 °C (early winter) and below 0 °C in winter.
To fits standard’s indications the measurement period was divided into summer, with mean daily air temperature over 15 °C and winter, covering remaining data. Hence, the data are presented in Figure 20b as for winter cover outdoor temperatures below 15 °C (autumn and winter). This is a crude simplification, but forced by the provisions of the standard. However, the reference ranges can be treated as rather more informative than decisive when the existing system modernisation is considered. Several authors have noticed recently that recommended temperature or humidity values can be modified [87,88,89].
To obtain operative temperature mean radiant temperature radiant temperature had to be included. It was measured by the sensors 10 and 11 (Figure 4b). The difference between T10 and T11 was from −0.63 °C to 0.63 °C. The mean value of T10 and T11 average for the whole period was 22.92 °C. Its instantaneous measured values differed from mean air temperature and mean floor temperature from −0.85 °C to 0.92 °C and from −3.90 °C to 2.48 °C, respectively. Regarding comments presented in [64,90,91,92] operative temperature was calculated as average of air and radiant components [93,94].
During the measurements persons working in the considered room reported mainly ‘neutral sensation’. Also ‘slightly cool’ was reported, but only at the beginning of the working days (between 8:00 and 9:00). They also felt too low air humidity during the heating season. These outcomes are reflected in the results shown in Figure 20.
3.5. PMV and PPD
The EN-ISO 7730 standard uses the thermal comfort model of Fanger [30,95,96,97,98,99] assuming that people feel comfortable when the internal heat production in the body is equal to the loss of heat to the environment. Solution of this thermal balance at given thermal and environmental conditions results in calculation of two empirical comfort indexes. These are the predicted mean vote (PMV) and the predicted percentage of dissatisfied (PPD). This model is recommended for application in mechanically ventilated buildings [46]. The Matlab application of that model, presented by Cowie [98], was used.
To calculate the PMV index several additional parameters had to be established first on the base of the aforementioned conditions. The metabolism for the light sitting office work is M = 70W/m2 per person. Mechanical work W = 0. The clothing insulation, Icl = 0.36 clo, 0.48 clo and 0.73 clo, for the summer (till 2.09), transient (from 3.09 to 28.10) and cold (from 29.10) periods, respectively. Because employees did not report any problems with draughts, ventilation air velocity va = 0.10 m/s (still air).
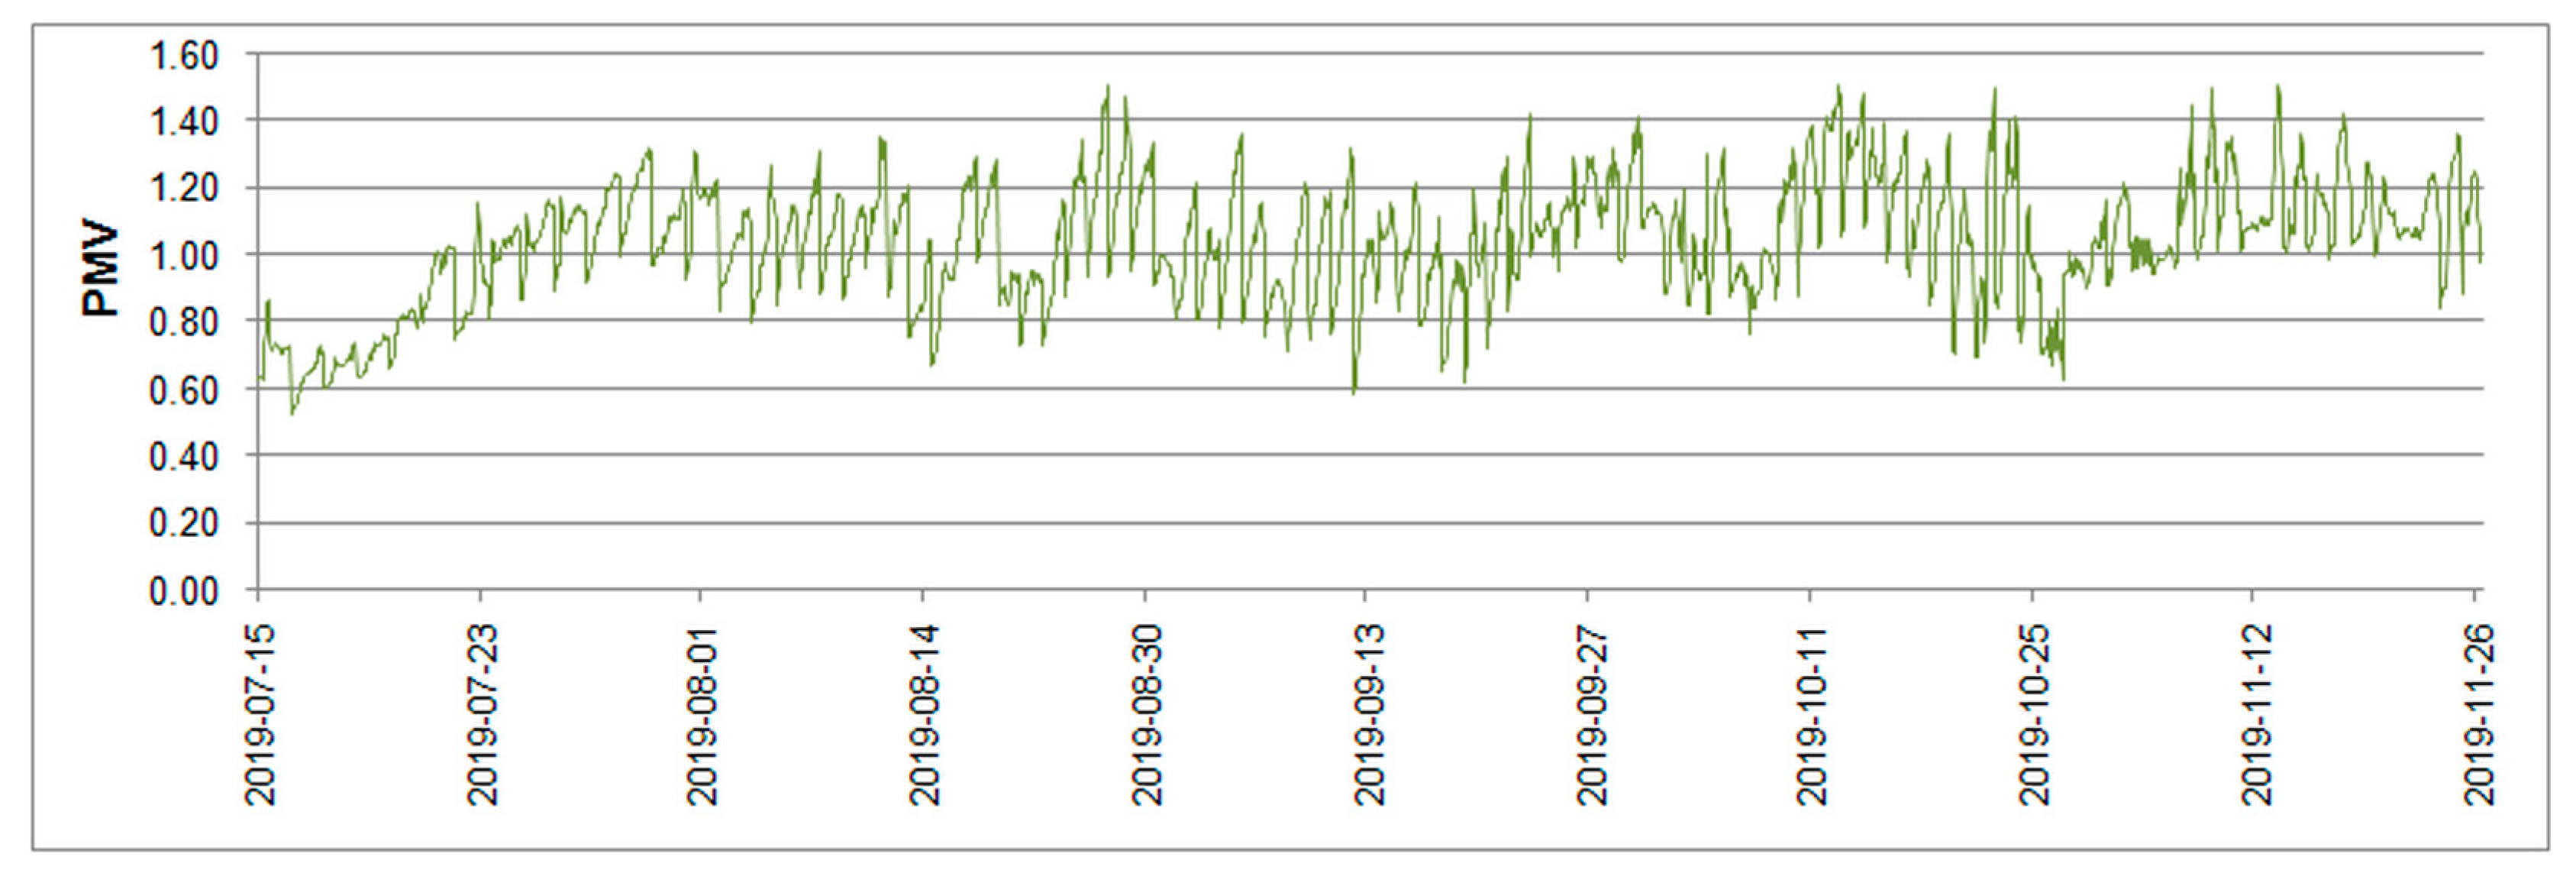
PMV varied (Figure 21) from 0.52 (16.07.19 at 8:00) to 1.50 (28.08.19 at 16:00, 14.10.19 at 15:00) indicating ‘slightly warm’ sensation. During measurements persons working in the considered room reported mainly ‘neutral’ sensation” (PMV < 0.5). Also ‘slightly cool’ (PMV < −1) was reported, but only at the beginning of the working days (between 8:00 and 9:00). They also felt too low air humidity during the heating season.
Precise estimation of PMV requires specialised equipment and special attention to the main sources of uncertainties [100] influencing final results, mainly radiant temperature and air velocity. Regardless of this, the results show good thermal comfort conditions.
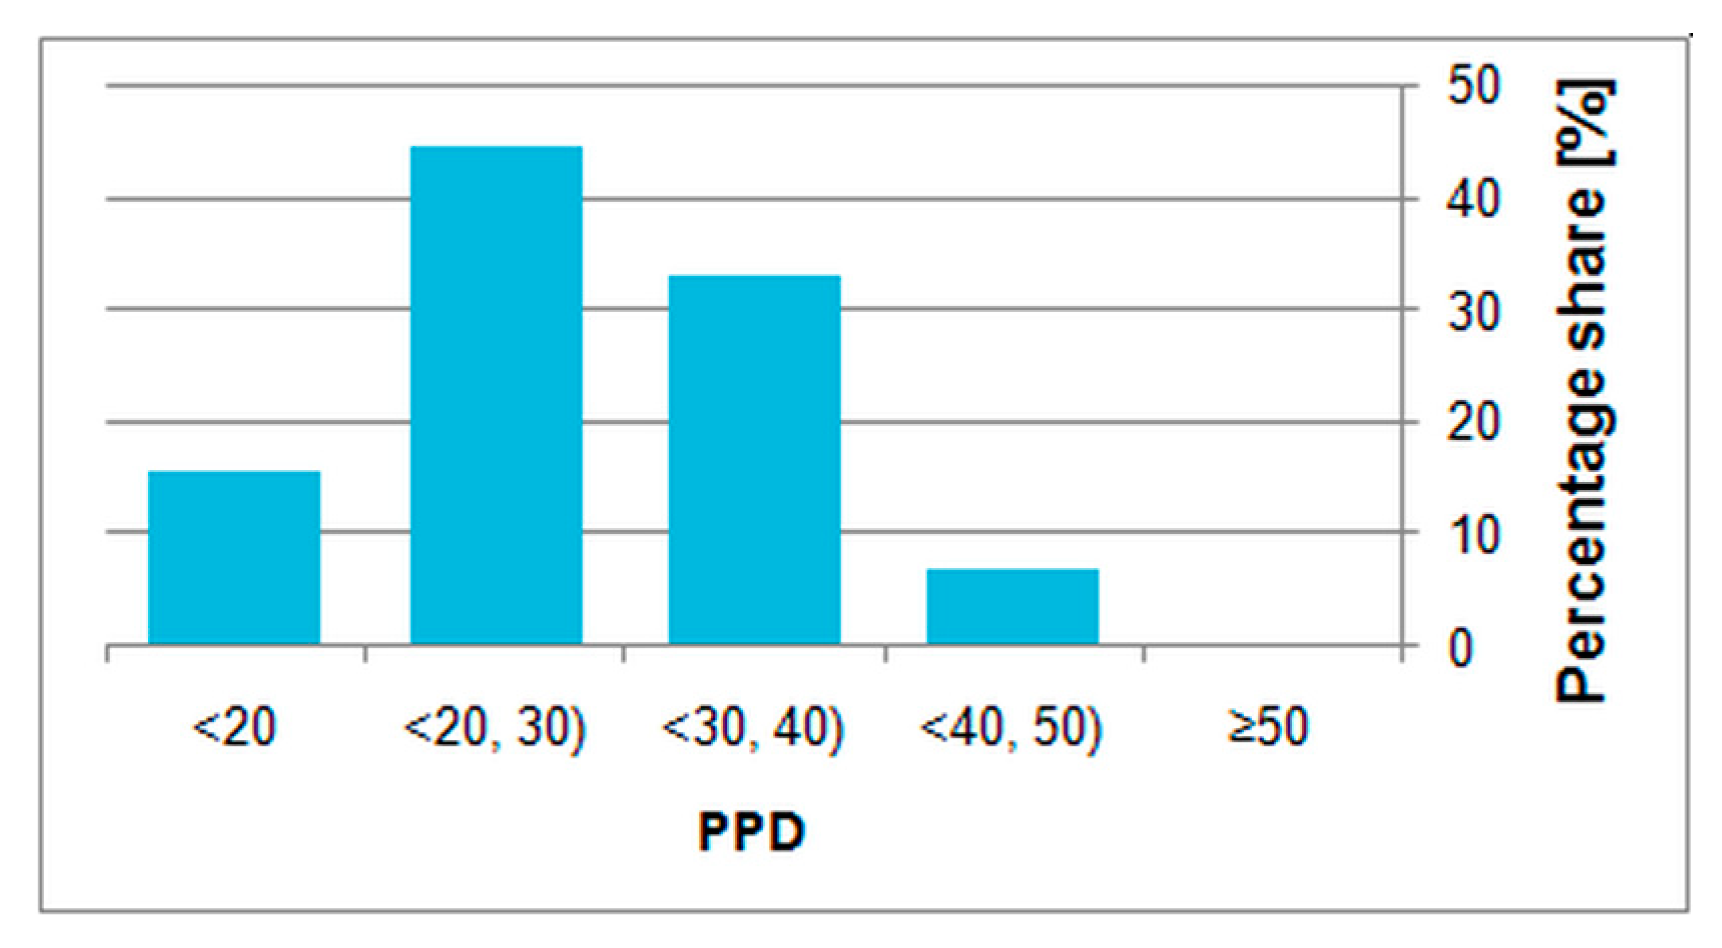
For the PPD index values for subsequent measurement steps there could be derived cumulative graph of the percentage share of dissatisfied with the hygrothermal conditions in a given time step (Figure 22). Dominating share of 60.1% had PPD below 30%.
4. Thermal Performance of the TABS
The embedded radiant heating and cooling system in the described building consists of four active ceilings and one underfloor heating system. They are supplied from ground source heat pumps. In this section the operation of part of this system, namely the floor of the considered room, is analysed. This limitation is justified by the similar nature of the use of all rooms in the building.
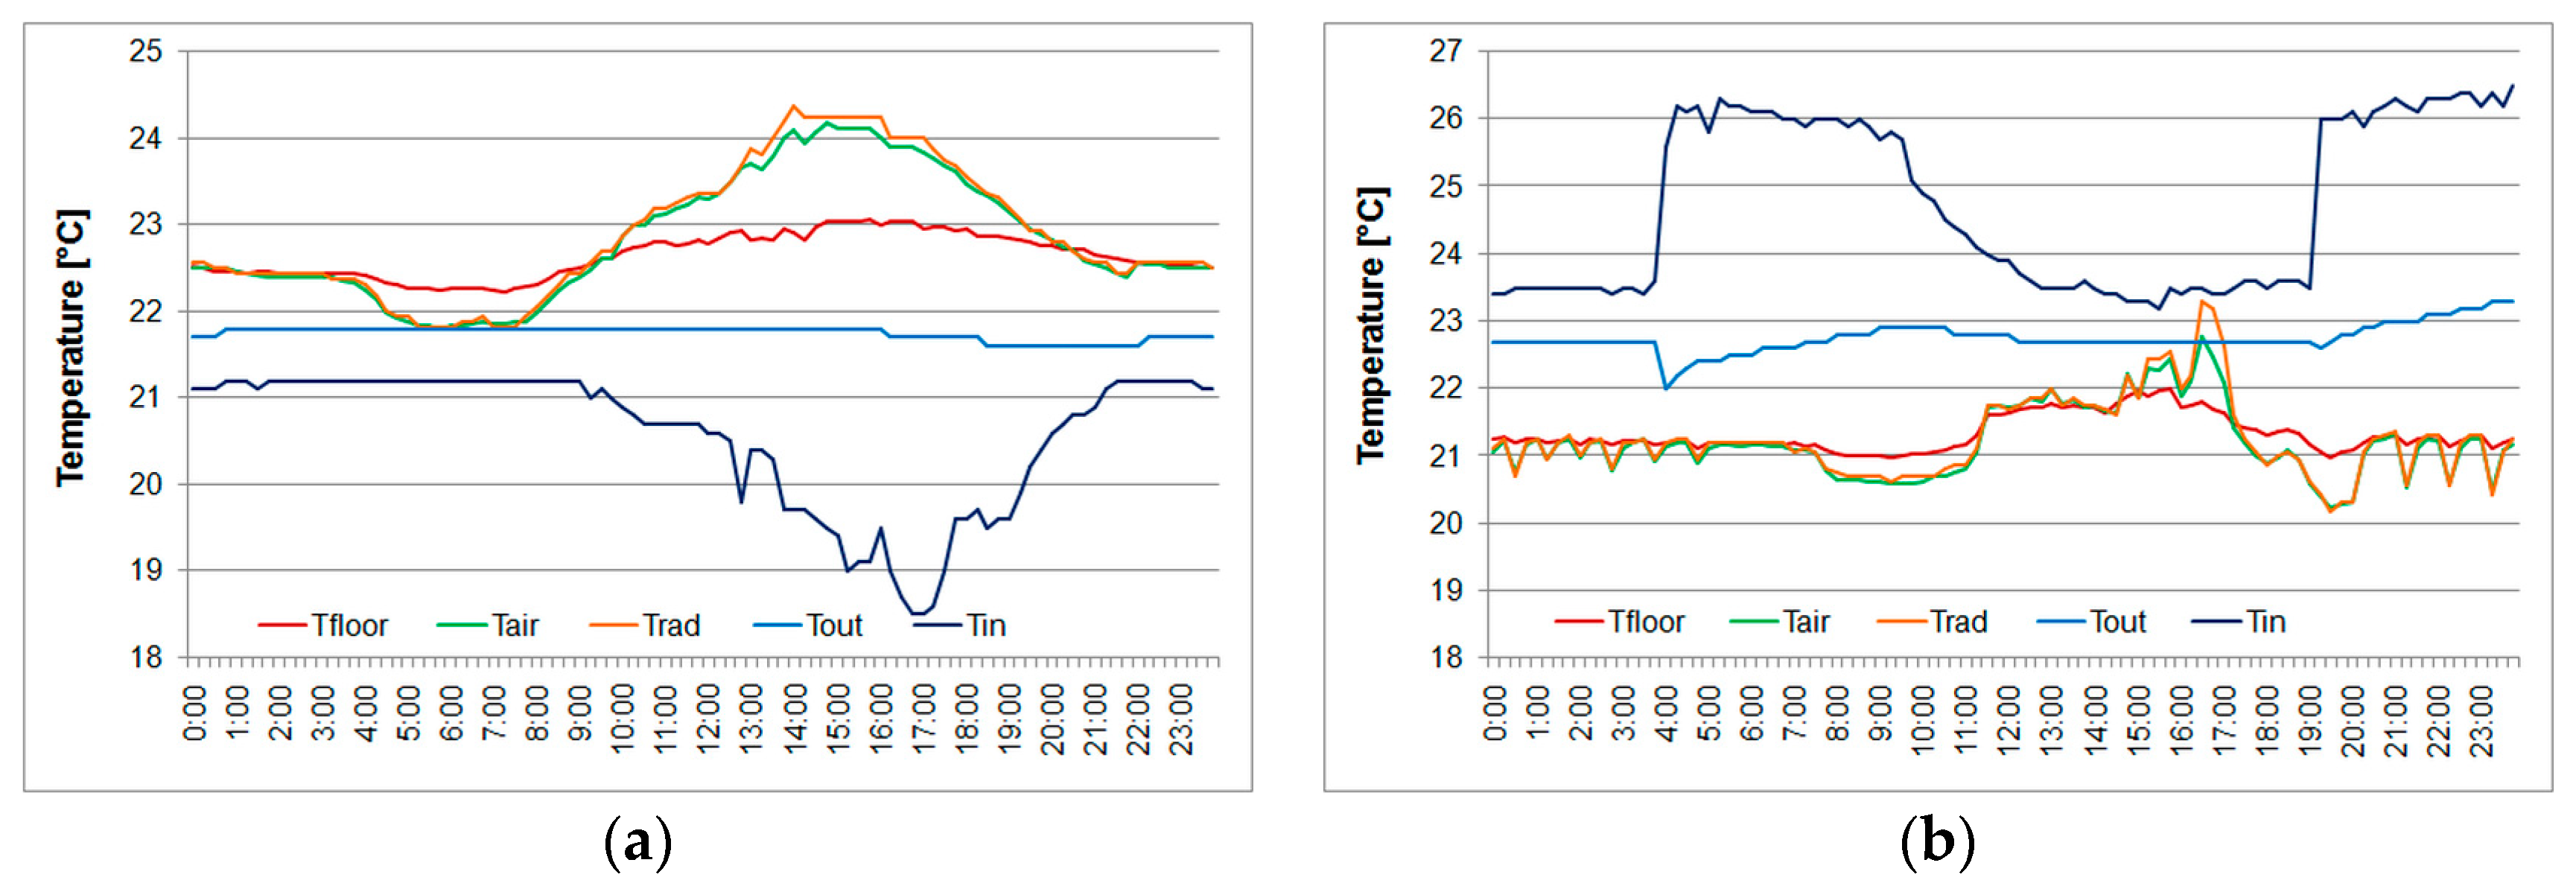
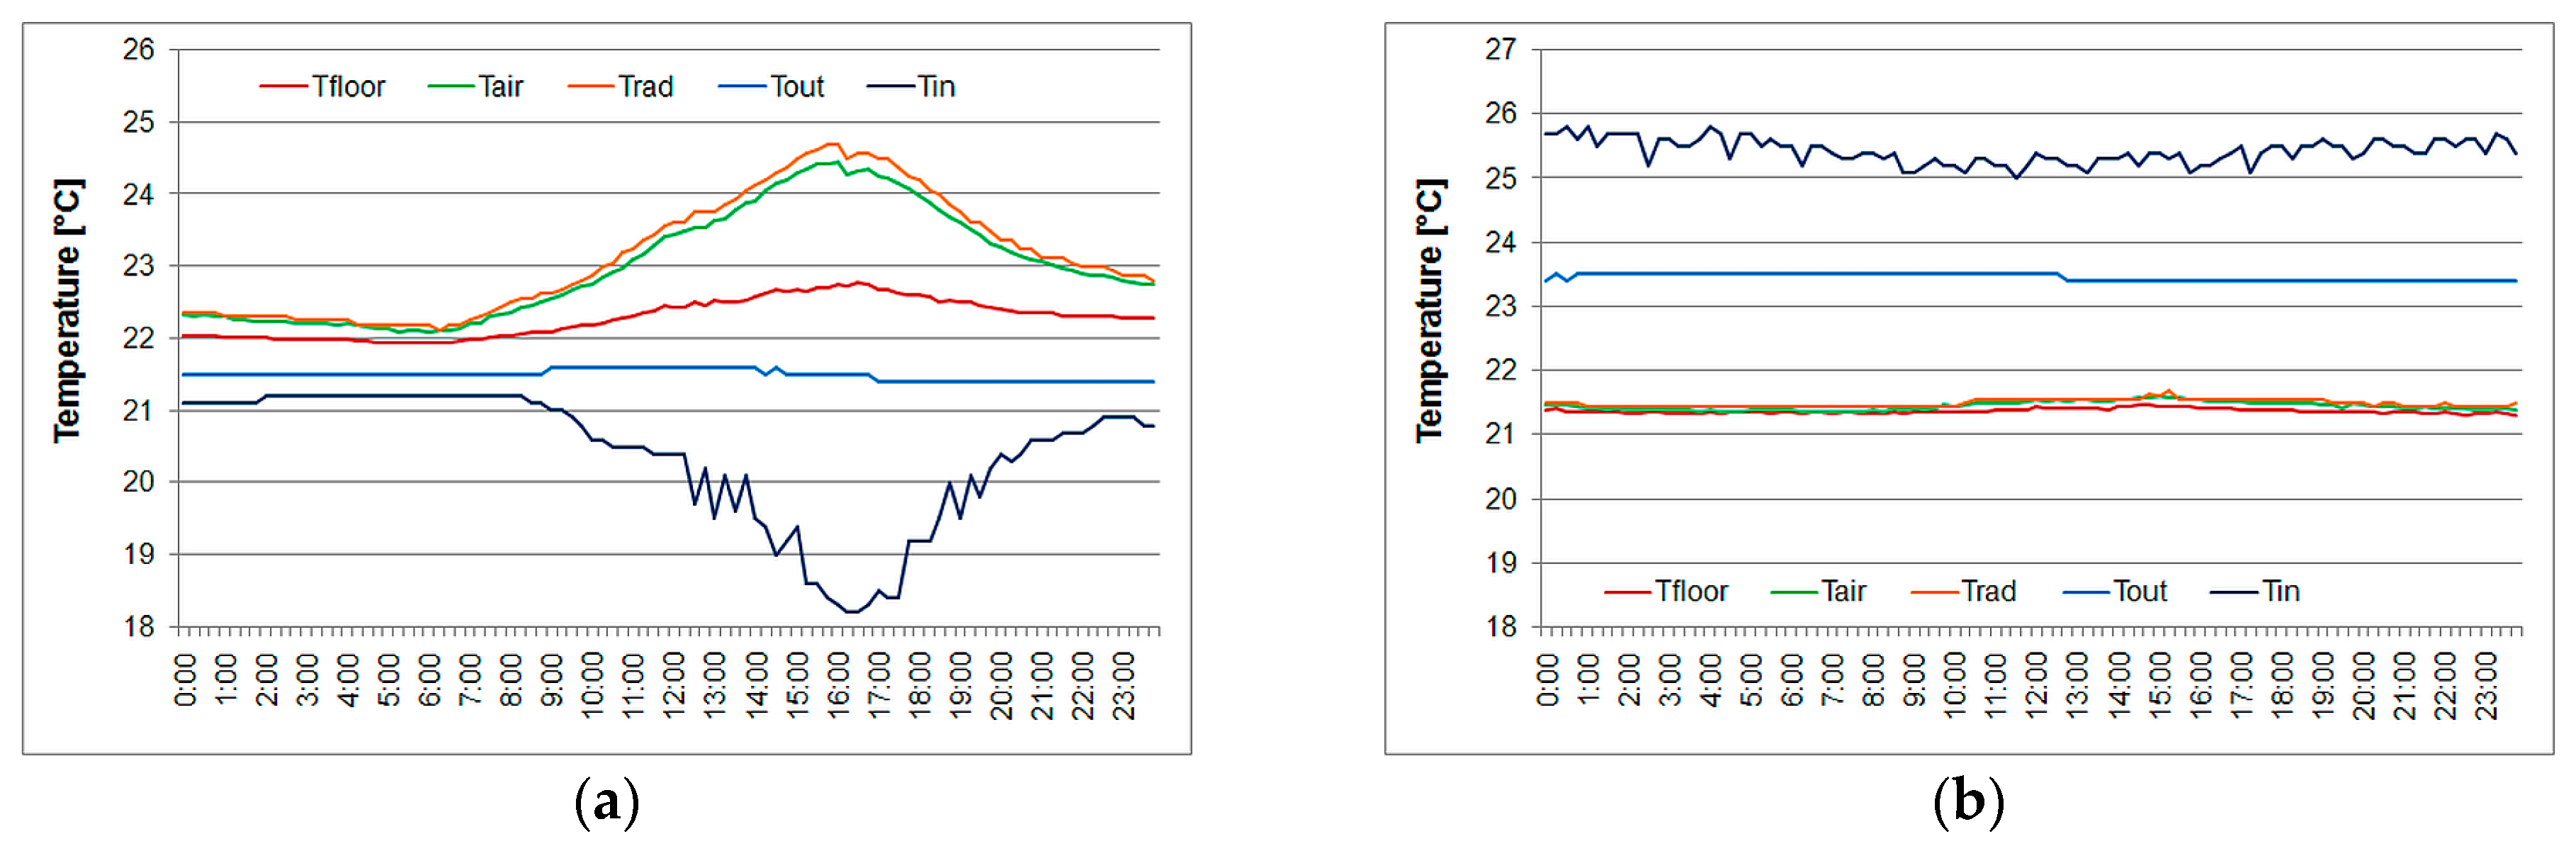
The work of TABS influences the feelings of people staying in the analysed room. To illustrate this issue operation of TABS is represented by waveforms of characteristic temperatures in the cooling and heating mode during working days (Figure 23) and holidays (Figure 24).
During the cooling period at the beginning of a working day air temperature is stable (Figure 23a). It begins to decrease when the ventilation is on and fresh outdoor air starts to cool down the indoor air [55]. This situation changes with office opening hour when internal heat gains occur from occupants and equipment resulting in rising indoor air temperature. These gains are removed by TABS due to decreasing inlet water temperature. Because of high time constants of TABS [101,102] in relation to conventional systems [103,104], this process is delayed in time and this is an important issue for designers of control systems [105,106]. Holiday situation is similar (Figure 23a) but ventilation is off and therefore the initial drop of air temperature does not occur. The increase of air temperature is forced only by solar radiation entering the room.
During the heating season inlet water temperature is raised before opening hours (Figure 23b) simultaneously with turning on the ventilation. After several hours temperature of the TABS structure rises and heating power (inlet water temperature) can be reduced. Along with internal gains it is sufficient to maintain indoor air temperature within required level. During holidays (Figure 24b) the situation is quite simple because there is no ventilation. Solar irradiance is low and heating power is stable.
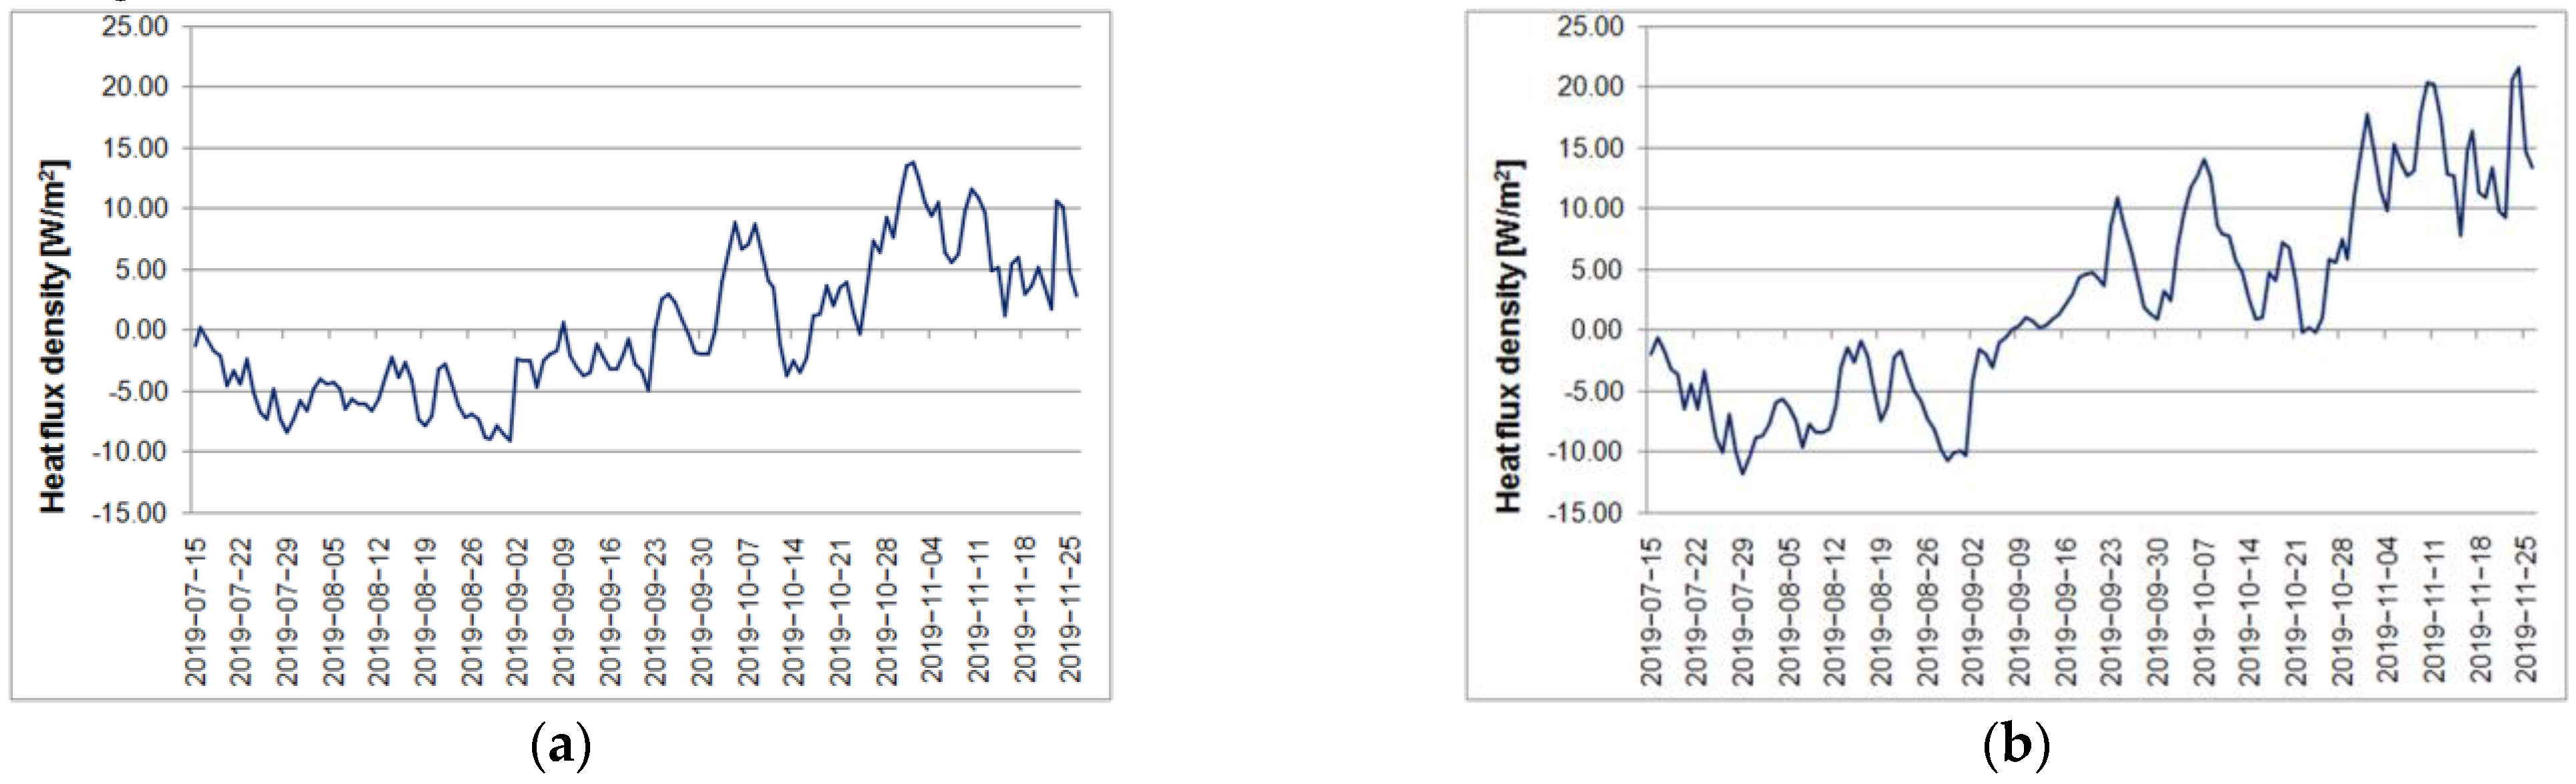
Another important variable, from the point of indoor environment, is heat flux exchanged with the room through the floor. The EN-ISO 11855–2 standard [107] describes the ‘general resistance method’ to calculate the steady state heat flows into the adjacent spaces. That method is based on the equivalent resistances between the supply (inlet) water temperature and the considered space, below or above the given TABS.
The measurement data were at first averaged in daily intervals and then used as inputs to the aforementioned method. Obtained results are presented in Figure 25.
Regardless of the simplicity of the applied method, the obtained results indicate compliance with the design assumptions. According to them, heat flux density in the upwards direction (from the floor to the interior of the room) was 14.2 W/m2 at the floor temperature of 21.8 °C in the cooling mode and 16.0 W/m2 at the floor temperature of 21.5 °C in the heating mode.
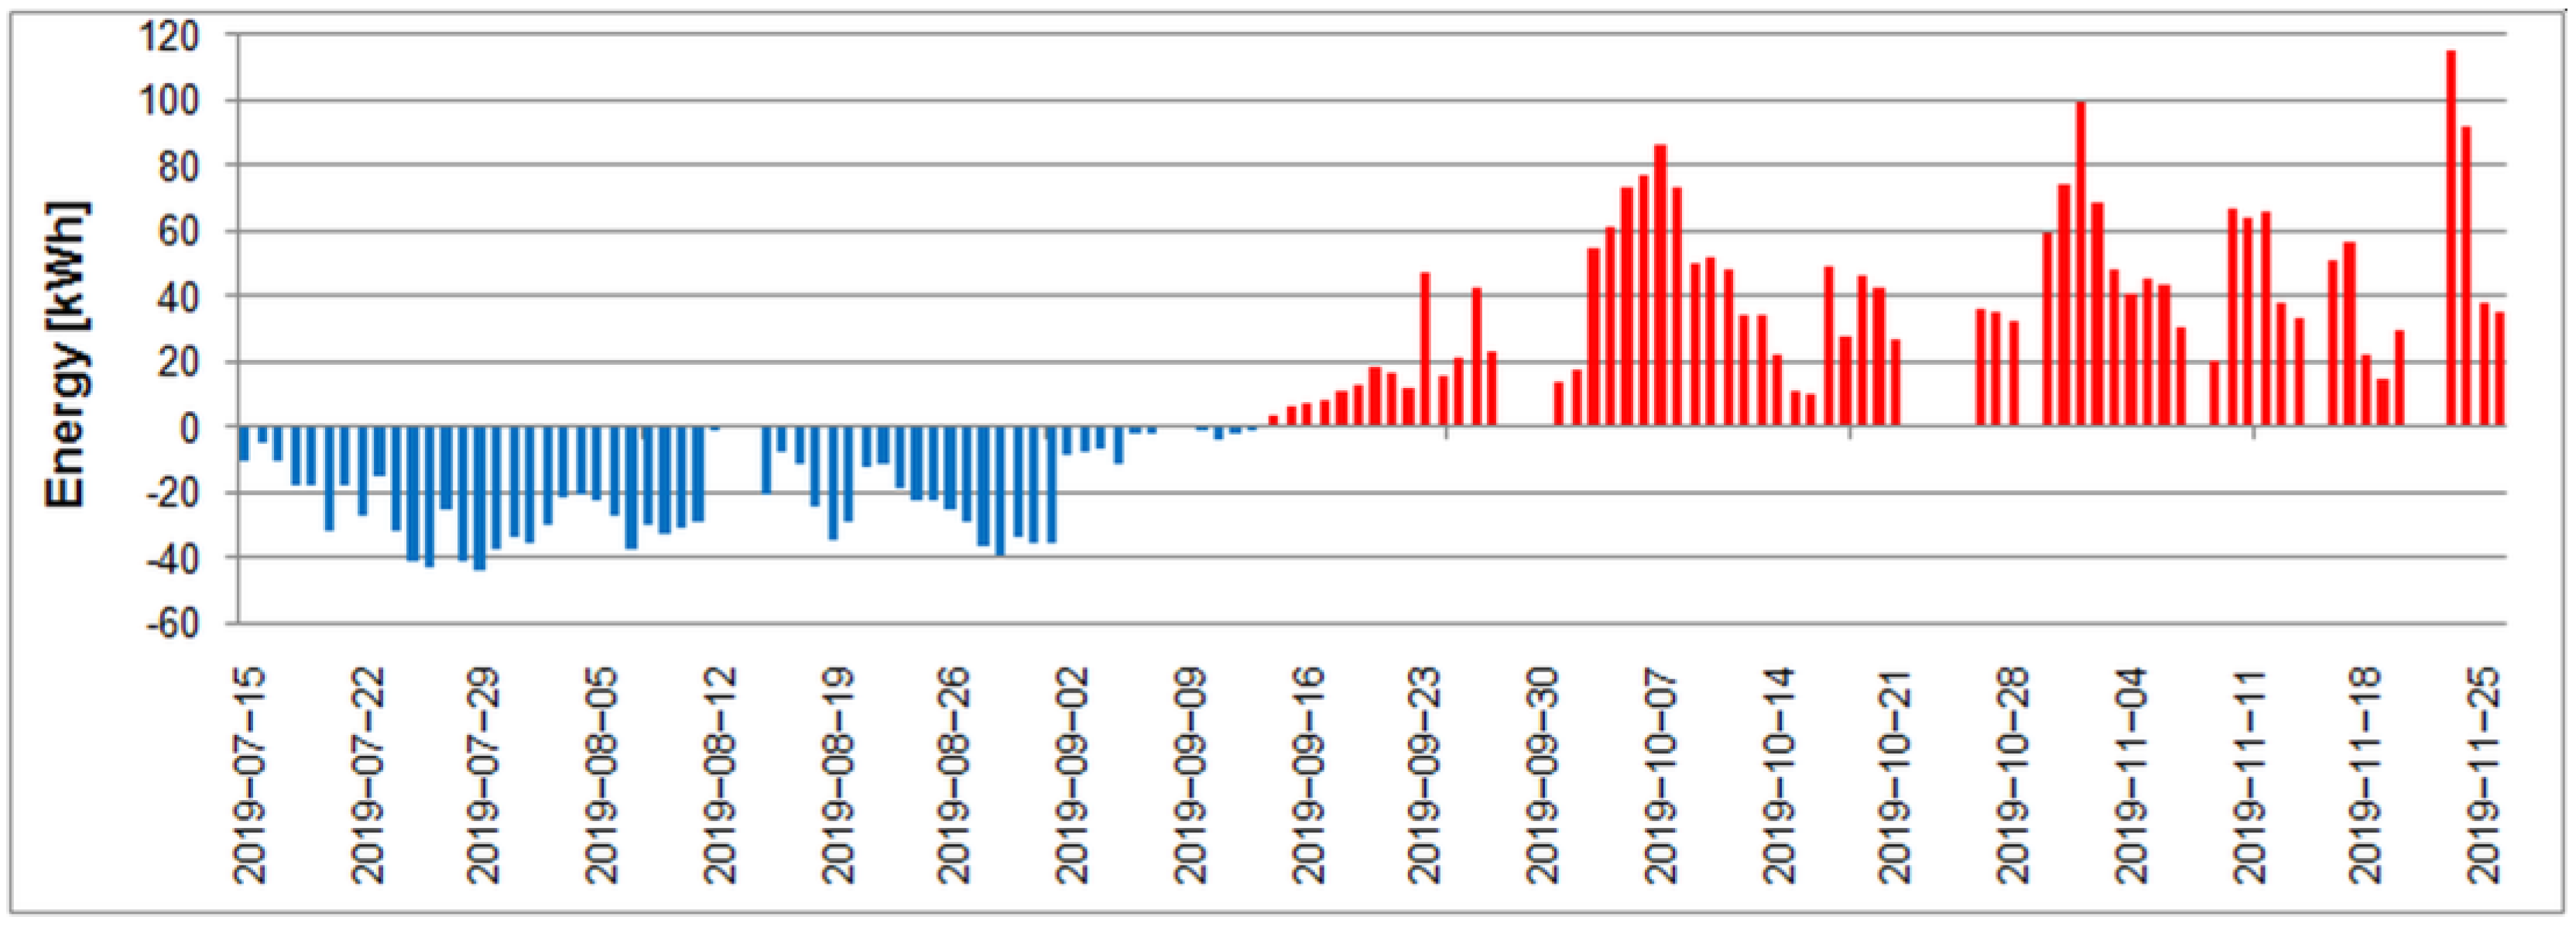
Comparison of Figure 25a,b shows that average heat flux density from TABS to the room was less than that to an adjacent space on the lower storey. In the considered case it was so, because there are mainly technical rooms and laboratories with lower indoor temperature under the tested room. The second factor is the structure of TABS—uncovered ceiling and thermal resistance of floor cover. Thus, taking pipe level axis as reference level, thermal resistance of floor upwards this level is greater than thermal resistance downwards. This problem was discussed in detail in [108]. To assess thermal performance of TABS different methods and indicators can be used [109,110]. But from the point of view of a building’s owner, administrator or user the most important is energy consumption required to maintain certain level of indoor comfort. Analysed room is within the same hydraulic circuit with several others with total area of 244 m2. Figure 26 shows daily cooling and heating energy for measured by heat meter in this circuit. The total cooling and heating energy exchanged by TABS in the analysed period amounted 1275 kWh and 2500 kWh, respectively.
5. Conclusions
The presented measurements were performed in an office room in the commercial office building during four months of its normal use. The conditions under which the tests were carried out forced the simplification of the measurement system. Also the spatial distribution of the calculated parameters for such a long measurement period could not be obtained.
In spite of the mentioned limitations it was possible to calculate several important parameters describing thermal comfort: vertical air temperature profile, floor surface temperature and percent of dissatisfied during measurement period. The presented results confirmed the ability of implemented TABS and mechanical ventilation systems to maintain good thermal conditions in the considered office.
Floor and internal air temperatures varied within relatively narrow range. Air humidity was reported by the employees to be too low during heating period of low outdoor temperature, but this is a typical problem in water-based surface embedded heating and cooling systems.
The presented results of the have been also discussed with PNT Euro-Centrum Science and Technology Park scientific and administrative authorities and continuation of the research was approved. To improve the quality of the research, attention should also be paid to the main sources of uncertainties influencing the PMV index calculations, mainly radiant temperature and air velocity, very important from the point of view of the building owners and users. The results of tests conducted under normal operation give the best picture of thermal conditions. Thorough analysis of measurement data revealed possible overheating resulting in unnecessary cooling increasing exploitation costs. Therefore, in case of BMS systems data analysis is of practical and theoretical importance.
Funding
This research received no external funding.
Institutional Review Board Statement
Not applicable.
Informed Consent Statement
Not applicable.
Data Availability Statement
Not applicable.
Acknowledgments
Author would like to express its gratitude to Stanisław Grygierczyk, the scientific and environmental coordinator at the Euro-Centrum Science and Technology Park in Katowice, for his support and help in choosing the place of measurements and to Dawid Domżoł for his support in installation and maintenance of the measurement system.
Conflicts of Interest
The author declares no conflict of interest.
References
- Dołęga, W. Selected aspects of national economy energy efficiency. Energy Policy J. 2019, 22, 19–32. [Google Scholar] [CrossRef]
- Kozik, R.; Karasińska—Jaśkowiec, I. Green public procurement—Legal base and instruments supporting sustainable development in the construction industry in Poland. E3S Web Conf. 2016, 00044. [Google Scholar] [CrossRef] [Green Version]
- Ramczyk, M. Legal bases and economic conditions of applying renewable energy resources in construction industry. MATEC Web Conf. 2018, 174, 04004. [Google Scholar] [CrossRef]
- Building Performance Institute Europe (BPIE). Financing Building Energy Performance Improvement in Poland; BPIE: Brussels, Belgium, 2016; Available online: http://bpie.eu/wpcontent/uploads/2016/01/BPIE_Financing-building-energy-in-Poland_EN.pdf (accessed on 4 February 2021).
- The European Parliament and The Council. Directive 2002/91/EC of the European Parliament and of the Council of 16 December 2002 on the energy performance of buildings, 4.1.2003. Off. J. Eur. Communities 2002, L 1, 65–71. [Google Scholar]
- The European Parliament and The Council. Directive 2010/31/EU of the European Parliament and of the Council of 19 May 2010 on the energy performance of buildings (recast), L 153/16. Off. J. Eur. Union 2010, L 153, 13–35. [Google Scholar]
- Deja, B.M.; Tyburski, J. Selected aspects of designing and realization of low energy single-family houses according to the NF15 and NF40 standards. Tech. Sci. 2015, 18, 103–114. Available online: http://uwm.edu.pl/wnt/technicalsc/tech_18_2/deja.pdf (accessed on 5 February 2021).
- PN- EN ISO 13790. Energy Performance of Buildings—Calculation of Energy Use for Space Heating and Coolin; Polish Standardization Committee: Warsaw, Poland, 2008. [Google Scholar]
- Pineau, D.; Rivière, P.; Stabat, P.; Hoang, P.; Archambault, V. Performance analysis of heating systems for low energy houses. Energy Build. 2013, 65, 45–54. [Google Scholar] [CrossRef]
- Martinopoulos, G.; Papakostas, K.T.; Papadopoulos, A.M. Comparative analysis of various heating systems for residential buildings in Mediterranean climate. Energy Build. 2016, 124, 79–87. [Google Scholar] [CrossRef]
- Milwicz, R.; Pasławski, J. Comparative analysis of heating systems in terms of flexibility in sustainable buildings. Procedia Eng. 2017, 82–89. [Google Scholar] [CrossRef]
- Sandvall, A.F.; Ahlgren, E.O.; Ekvall, T. Cost-efficiency of urban heating strategies—Modelling scale effects of low-energy building heat supply. Energy Strategy Rev. 2017, 18, 212–223. [Google Scholar] [CrossRef]
- Kumar, N.M.; Mathew, M. Comparative life-cycle cost and GHG emission analysis of five different water heating systems for residential buildings in Australia. Beni. Suef. Univ. J. Basic Appl. Sci. 2018, 7, 748–751. [Google Scholar] [CrossRef]
- Dec, K.; Broniewicz, E.; Broniewicz, M. The Possibility Analysis of Adapting a Public Building to the Standard of a Building with a Zero Energy Balance. Energies 2020, 13, 6389. [Google Scholar] [CrossRef]
- Vadiee, A.; Dodoo, A.; Jalilzadehazhari, E. Heat Supply Comparison in a Single-Family House with Radiator and Floor Heating Systems. Buildings 2020, 10, 5. [Google Scholar] [CrossRef] [Green Version]
- Romaní, J.; Gracia, A.; Cabeza, L.F. Simulation and control of thermally activated building systems (TABS). Energy Build. 2016, 22–42. [Google Scholar] [CrossRef] [Green Version]
- Chung, W.J.; Park, S.H.; Yeo, M.S.; Kim, K.W. Control of Thermally Activated Building System Considering Zone Load Characteristics. Sustainability 2017, 9, 586. [Google Scholar] [CrossRef] [Green Version]
- Guerrero, M.C.; Sánchez, J.; Álvarez, S.; Tenorio, J.A.; Cabeza, L.F.; Bartolomé, C.; Pavón, M. Evaluation of the behavior of an innovative thermally activated building system (TABS) with PCM for an efficient design. E3S Web Conf. 2019, 111, 1–8. [Google Scholar] [CrossRef] [Green Version]
- Behrendt, B. Possibilities and Limitations of Thermally Activated Building Systems: Simply TABS and a Climate Classification for TABS. Ph.D. Thesis, Technical University of Denmark, Copenhagen, Denmark, 2016. Rapport, No. R-361. Available online: https://orbit.dtu.dk/en/publications/possibilities-and-limitations-of-thermally-activated-building-sys (accessed on 5 February 2021).
- Chung, W.J.; Lim, J. Improved Thermally Activated Building System Design Method Considering Integration of Air Systems. Adv. Civ. Eng. 2018, 4928746. [Google Scholar] [CrossRef]
- Boccardo, L.B.; Kazanci, O.B. Economic comparison of TABS, PCM ceiling panels and all-air systems for cooling offices. Energy Build. 2019, 205, 109527. [Google Scholar] [CrossRef]
- Manfren, M.; Nastasi, B.; Piana, E.; Tronchin, L. On the link between energy performance of building and thermal comfort: An example. AIP Conf. Proc. 2019, 2123, 020066. [Google Scholar] [CrossRef]
- Blaszczok, M.; Baranowski, A. Thermal improvement in residential buildings in view of the indoor air quality—case study for Polish dwelling. Arch. Civ. Eng. Environ. 2018, 11, 121–130. [Google Scholar] [CrossRef] [Green Version]
- Suszanowicz, D.; Pietkun-Greber, I. The effectiveness of various types of ventilation on air quality in multi-family building. Ecol. Chem. Eng. A 2017, 24, 33–41. [Google Scholar] [CrossRef]
- Lis, A. The efficiency of energy saving activities in the process of thermal modernization of multifamily buildings. BoZPE 2019, 8, 107–116. [Google Scholar] [CrossRef]
- Podawca, K.; Pawłat-Zawrzykraj, A.; Dohojda, M. Analysis of the possibilities for improvement of thermal comfort of living quarters located in multi-family large-panel prefabricated buildings. E3S Web Conf. 2018, 44, 00145. [Google Scholar] [CrossRef]
- Sowa, J. Air Quality and Ventilation Rates in Schools in Poland—Requirements, Reality and Possible Improvements. Proceedings: Indoor Air 2002, Monterey, CA, USA. Volume III, pp. 68–73. Available online: https://citeseerx.ist.psu.edu/viewdoc/download?doi=10.1.1.1080.8791&rep=rep1&type=pdf (accessed on 5 February 2021).
- Sowa, J.; Karaś, A. Whole Year Simulation of Natural and Hybrid Ventilation Performance and Estimation Indoor Air Quality for Modernized School Building. Proceedings of Clima 2007 WellBeing Indoors. Available online: http://www.inive.org/members_area/medias/pdf/Inive/clima2007/B06/B06F1566.pdf (accessed on 5 February 2021).
- Albatayneh, A.; Alterman, D.; Page, A.; Moghtaderi, B. The Significance of the Adaptive Thermal Comfort Limits on the Air-Conditioning Loads in a Temperate Climate. Sustainability 2019, 11, 328. [Google Scholar] [CrossRef] [Green Version]
- PN-EN ISO 7730: 2006. Ergonomics of the Thermal Environment—Analytical Determination and Interpretation of Thermal Comfort Using the Calculation of PMV and PPD Indicators and Criteria of Local Thermal Comfort; Polish Standardization Committee: Warsaw, Poland, 2006. [Google Scholar]
- PN-EN ISO 7726: 2001. Ergonomics of the Thermal Environment. Instruments for Measuring Physical Quantities; Polish Standardization Committee: Warsaw, Poland, 2001. [Google Scholar]
- PN-EN 15251:2012. Indoor Environmental Input Parameters for Design and Assessment of Energy Performance of Buildings Addressing Indoor Air Quality, Thermal Environment, Lighting and Acoustics; Polish Committee for Standardization: Warsaw, Poland, 2012. [Google Scholar]
- Fedorczak-Cisak, M.; Kowalska-Koczwara, A.; Nering, K.; Pachla, F.; Radziszewska-Zielina, E.; Sladowski, G.; Tatara, T.; Ziarko, B. Evaluation of the Criteria for Selecting Proposed Variants of Utility Functions in the Adaptation of Historic Regional Architecture. Sustainability 2019, 11, 1094. [Google Scholar] [CrossRef] [Green Version]
- Grygierek, K.; Ferdyn-Grygierek, J. Multi-Objective optimization of Envelope Building with Natural Ventilation. Energies 2018, 11, 1383. [Google Scholar] [CrossRef] [Green Version]
- Nowak-Dzieszko, K.; Rojewska-Warchał, M. Thermal comfort of the individual flats of multi-family panel building. Tech. Trans. Civ. Eng. 2014, 201–206. [Google Scholar] [CrossRef]
- Antczak-Jarząbska, R.; Krzaczek, M. Assessment of Natural Ventilation System for a Typical Residential House in Poland. CEER 2016, 22, 025–044. [Google Scholar] [CrossRef] [Green Version]
- Zygmunt, M.; Gawin, D. Analysis of energy efficiency and thermal comfort for an office building complex located in Poland—a case study. IOP Conf. Ser. Mater. Sci. Eng. 2018, 415, 012023. [Google Scholar] [CrossRef]
- Nowak, K.; Rojewska-Warchał, M. Thermal comfort of office rooms with a large area of glazing. Tech. Trans. Civ. Eng. 2014, 335–342. [Google Scholar] [CrossRef]
- Saelens, D.; Parys, W.; Baetens, R. Energy and comfort performance of thermally activated building systems including occupant behavior. Build. Environ. 2011, 46, 835–848. [Google Scholar] [CrossRef]
- Sigg, F.; Krause, H. Occupant comfort in Nearly Zero Energy Buildings (nZEB) by using the building structure for demand side management (DMS). E3S Web Conf. 2020, 172, 6011. [Google Scholar] [CrossRef]
- Drgoňa, J.; Picard, D.; Helsen, L. Cloud-based implementation of white-box model predictive control for a GEOTABS office building: A field test demonstration. J. Process. Control 2020, 88, 63–77. [Google Scholar] [CrossRef]
- Pałaszyńska, K.; Bandurski, K.; Porowski, M. Energy demand and thermal comfort of HVAC systems with thermally activated building systems as a function of user profile. E3S Web Conf. 2017, 22, 00130. [Google Scholar] [CrossRef] [Green Version]
- Gantiez, C.; Lemort, V.; Hoogmartens, J.; Bockelmann, F.; Kipry, H. Energy and Comfort Performance Analysis of Monitored Thermally Activated Building Systems Combined with Geothermal Heat Pumps. Int. High. Perform. Build. Conf. 2020. Available online: http://docs.lib.purdue.edu/ihpbc/82 (accessed on 5 February 2021).
- Raimondo, D.; Olesen, B.W.; Corgnati, S.P. Field test of a thermal active building system (tabs) in an office building in Denmark. In Proceedings of the 13th Conference of International Building Performance Simulation Association (IBPSA; BS2013), Kogens Lyngby, Denmark, 26–28 August 2013; pp. 2527–2534. [Google Scholar]
- Zhang, C.; Yu, T.; Heiselberg, P.; Pomianowski, M.Z. Experimental Study of an Integrated System with Diffuse Ceiling Ventilation and Thermally Activated Building Constructions. Department of Civil Engineering, Aalborg University DCE Technical Reports No. 182. , 2014. Available online: https://vbn.aau.dk/ws/portalfiles/portal/207597383/Experimental_Study_of_an_Integrated_System_with_Diffuse_Ceiling_Ventilation_and_Thermally_Activated_Building_Constructions.pdf (accessed on 5 February 2021).
- Rey Martínez, F.J.; Chicote, M.A. Villanueva Peñalver, A.; Tejero Gónzalez, A.; Velasco Gómez, E. Indoor air quality and thermal comfort evaluation in a Spanish modern low-energy office with thermally activated building systems. Sci. Technol. Built Environ. 2015, 21, 1091–1099. [Google Scholar] [CrossRef]
- Piasecki, M.; Fedorczak-Cisak, M.; Furtak, M.; Biskupski, J. Experimental Confirmation of the Reliability of Fanger’s Thermal Comfort Model—Case Study of a Near-Zero Energy Building (NZEB) Office Building. Sustainability 2019, 11, 2461. [Google Scholar] [CrossRef] [Green Version]
- Piasecki, M.; Kostyrko, K.; Fedorczak-Cisak, M.; Nowak, K. Air Enthalpy as an IAQ Indicator in Hot and Humid Environment—Experimental Evaluation. Energies 2020, 13, 1481. [Google Scholar] [CrossRef] [Green Version]
- Sinacka, J.; Szczechowiak, E. Heat Flow Modelling in a Building with Thermally Activated Building Systems [in Polish]. District. Heat Heat Vent. 2018, 49, 271–278. [Google Scholar] [CrossRef]
- Gil, S.; Rozpondek, M.; Grychowski, T. The analysis of indoor environment parameters in office buildings. Acta Mech. Slovaca 2012, 16, 74–81. [Google Scholar] [CrossRef]
- Szpytma, M.; Rybka, A. Ecological ideas in Polish architecture—environmental impact. J. Civ. Eng. Environ. Arch. 2016, XXXIII, 321–328. [Google Scholar] [CrossRef] [Green Version]
- Kontes, G.D.; Giannakis, G.I.; Horn, P.; Steiger, S.; Rovas, D.V. Using Thermostats for Indoor Climate Control in Office Buildings: The Effect on Thermal Comfort. Energies 2017, 10, 1368. [Google Scholar] [CrossRef] [Green Version]
- Michalak, P.; Grygierczyk, S. Heat pumps in the passive office building: First exploitation results. District. Heat Heat Vent. 2015, 46, 396–398. (In Polish) [Google Scholar] [CrossRef]
- Michalak, P.; Grygierczyk, S. Temperature efficiency of the heat recovery in an air-handling unit with a rotary heat exchanger. District. Heat Heat Vent. 2018, 49, 183–187. (In Polish) [Google Scholar] [CrossRef]
- Michalak, P.; Grygierczyk, S. Temperature Efficiency of Heat Exchangers in Air Handling Units. J. Mech. Energy Eng. 2019, 3, 267–272. [Google Scholar] [CrossRef] [Green Version]
- Domínguez Lacarte, L.M.; Fan, J. Modelling of a thermally activated building system (TABS) combined with free-hanging acoustic ceiling units using computational fluid dynamics (CFD). Build. Simul. 2018, 11, 315–324. [Google Scholar] [CrossRef] [Green Version]
- Zhang, C.; Kvols Heiselberg, P.; Chen, Q.; Pomianowski, M. Numerical analysis of diffuse ceiling ventilation and its integration with a radiant ceiling system. Build. Simul. 2017, 10, 203–218. [Google Scholar] [CrossRef] [Green Version]
- Digital Relative Humidity & Temperature Sensor DHT11. Aosong Electronics Co., Ltd. Available online: https://www.electronicoscaldas.com/datasheet/DHT11_Aosong.pdf (accessed on 28 December 2020).
- DS18B20 Programmable Resolution 1-Wire Digital Thermometer. Maxim Integrated Products, Inc. Available online: https://datasheets.maximintegrated.com/en/ds/DS18B20.pdf (accessed on 28 December 2020).
- Seidel, D.S.; Field, T.C.; Schinckel, A.P.; Stwalley, C.S.; Stwalley, R.M. Effects of temperature probe orientation on the Purdue hog cooling pad data acquisition. Comput. Electron. Agric. 2020, 175, 105609. [Google Scholar] [CrossRef]
- Nasruddin, A.N.; Tee, B.T.; Mustafah, M.T.; Jasman, M.E.S.M. Ambient data analytic on indoor environment monitoring for office buildings in hot and humid climates. Data Brief 2019, 27, 104534. [Google Scholar] [CrossRef] [PubMed]
- Doolan Fernandes, J.; Carvalho Souza, F.E.; Cipriano Maniçoba, G.G.; Salazar, A.O.; De Paiva, J.A. Wireless Monitoring of Induction Machine Rotor Physical Variables. Sensors 2017, 17, 2660. [Google Scholar] [CrossRef] [Green Version]
- Obando Vega, F.A.; Montoya Ríos, A.P.; Osorio Saraz, J.A.; Vargas Quiroz, L.G.; Alves Damasceno, F. Assessment of black globe thermometers employing various sensors and alternative materials. Agric. For. Meteorol. 2020, 284, 107891. [Google Scholar] [CrossRef]
- Walikewitz, N.; Janicke, B.; Langner, M.; Meier, F.; Endlicher, W. The difference between the mean radiant temperature and the air temperature within indoor environments: A case study during summer conditions. Build. Environ. 2015, 84, 151–161. [Google Scholar] [CrossRef]
- PN EN 12831-1: 2017. Energy Performance of Buildings—Method for Calculation of the Design Heat Load; Polish Committee of Standardisation: Warsaw, Poland, 2017. [Google Scholar]
- Nowak, S. Management of Heat Energy Consumption in Poland For The Purpose of Buildings’ Heating and Preparation Of Useable, Hot Water. Ann. Univ. Apulensis Ser. Oeconomica 2009, 11, 895–901. Available online: http://www.oeconomica.uab.ro/upload/lucrari/1120092/33.pdf (accessed on 5 February 2021).
- Dylewski, R.; Adamczyk, J. The environmental impacts of thermal insulation of buildings including the categories of damage: A Polish case study. J. Clean. Prod. 2016, 137, 878–887. [Google Scholar] [CrossRef]
- GIG Institute Meteo Station. Available online: http://meteo.gig.eu (accessed on 28 December 2020).
- PN-EN ISO 11855-1:2015. Building Environment Design—Design, Dimensioning, Installation and Control of Embedded Radiant Heating and Cooling Systems—Part 1: Definition, Symbols, and Comfort Criteria; Polish Standardization Committee: Warsaw, Poland, 2015. [Google Scholar]
- Potter, S.E.; Underwood, C.P. SE Potter and CP Underwood, A modelling method for conjugate heat transfer and fluid flow in building spaces. Build. Serv. Eng. Res. Technol. 2004, 25, 111. [Google Scholar] [CrossRef]
- Lastovets, N.; Kosonen, R.; Mustakallio, P.; Jokisalo, J.; Li, A. Modelling of room air temperature profile with displacement ventilation. Int. J. Vent. 2020, 19, 112–126. [Google Scholar] [CrossRef]
- Gao, R.; Li, A.; Zhang, O.; Zhang, H. Comparison of indoor air temperatures of different under-floor heating pipe layouts. Energy Convers. Manag. 2011, 52, 1295–1304. [Google Scholar] [CrossRef]
- Jia, H.; Pang, X.; Haves, P. Experimentally-determined characteristics of radiant systems for office buildings. Appl. Energy 2018, 221, 41–54. [Google Scholar] [CrossRef] [Green Version]
- Novoselac, A.; Burley, B.J.; Srebric, J. New Convection Correlations for Cooled Ceiling Panels in Room with Mixed and Stratified Airflow. HVAC&R Res. 2006, 12, 279–294. [Google Scholar] [CrossRef]
- Shin, M.S.; Rhee, K.N.; Park, S.H.; Yeo, M.S.; Kim, K.W. Enhancement of cooling capacity through open-type installation of cooling radiant ceiling panel systems. Build. Environ. 2019, 148, 417–432. [Google Scholar] [CrossRef]
- Fikru, M.G.; Gautier, L. The impact of weather variation on energy consumption in residential houses. Appl. Energy 2015, 144, 19–30. [Google Scholar] [CrossRef]
- Spinoni, J.; Vogt, J.; Barbosa, P. European degree-day climatologies and trends for the period 1951–2011. Int. J. Climatol. 2015, 35, 25–36. [Google Scholar] [CrossRef] [Green Version]
- Heating and Cooling Degree Days, European Environment Agency. Available online: https://www.eea.europa.eu/data-and-maps/indicators/heating-degree-days-2 (accessed on 28 December 2020).
- Fabrizio, E.; Corgnati, S.P.; Causone, F.; Filippi, M. Numerical comparison between energy and comfort performances of radiant heating and cooling systems versus air systems. HVAC&R Res. 2012, 18, 692–708. [Google Scholar] [CrossRef]
- Olesen, B. Radiant floor heating in theory and practice. ASHRAE J. 2002, 44, 19–26. [Google Scholar]
- Hasan, A.; Kurnitski, J.; Jokiranta, K. A combined low temperature water heating system consisting of radiators and floor heating. Energy Build. 2009, 41, 470–479. [Google Scholar] [CrossRef]
- Catalina, T.; Virgone, J.; Kuznik, F. CFD and experimentation study in a test room equipped with a cooling ceiling. Build. Environ. 2009, 44, 1740–1750. [Google Scholar] [CrossRef]
- Leo Samuel, D.G.; Shiva Nagendra, S.M.; Maiya, M.P. A sensitivity analysis of the design parameters for thermal comfort of thermally activated building system. Sådhanå 2019, 44, 48. [Google Scholar] [CrossRef] [Green Version]
- Klein, O.; Schlenger, J. Basics Room Conditioning; Birkhäuser Verlag: Basel, Switerland, 2008. [Google Scholar]
- Dalheimer, M. Energiemanagement für Mietwohnungen mit Open-Source Smart Metern (EMOS), Fraunhofer IRB Verlag, Stuttgart. 2015. Available online: https://www.irbnet.de/daten/rswb/15109001837.pdf (accessed on 5 February 2021).
- Czernecki, B.; Miętus, M. The thermal seasons variability in Poland, 1951–2010. Theor. Appl. Climatol. 2017, 127, 481–493. [Google Scholar] [CrossRef] [Green Version]
- Li, P.; Parkinson, T.; Brager, G.; Schiavon, S.; Cheung, T.C.T.; Froese, T. A data-driven approach to defining acceptable temperature ranges in buildings. Build. Environ. 2019, 153, 302–312. [Google Scholar] [CrossRef] [Green Version]
- Baharum, M.A.; Surat, M.; Tawil, N.M.; Che-Ani, A.I. Modern Housing Tranquillity in Malaysia from the Aspect of Thermal Comfort for Humid Hot Climate Zone. E3S Web Conf. 2014, 01008. [Google Scholar] [CrossRef] [Green Version]
- Shaharon, M.N.; Jalaludin, J. Thermal Comfort Assessment-A Study Toward Workers’ Satisfaction in a Low Energy Office Building. Am. J. Appl. Sci. 2012, 9, 1037–1045. [Google Scholar] [CrossRef] [Green Version]
- Lai, A.; Maing, M.; Ng, E. Observational studies of mean radiant temperature across different outdoor spaces under shaded conditions in densely built environment. Build. Environ. 2017, 114, 397–409. [Google Scholar] [CrossRef]
- Guo, H.; Teitelbaum, E.; Houchois, N.; Bozlar, M.; Meggers, F. Revisiting the use of globe thermometers to estimate radiant temperature in studies of heating and ventilation. Energy Build. 2018, 180, 83–94. [Google Scholar] [CrossRef]
- D’Orazio, M.; Maracchini, G. An experimental investigation on the indoor hygrothermal environment of a reinforced-EPS based temporary housing solution. Energy Build. 2019, 204, 109500. [Google Scholar] [CrossRef]
- Ramakrishnan, S.; Wang, X.; Sanjayan, J.; Wilson, J. Thermal performance of buildings integrated with phase change, materials to reduce heat stress risks during extreme heatwave events. Appl. Energy 2017, 194, 410–421. [Google Scholar] [CrossRef]
- Ioannou, A.; Itard, L.; Agarwal, T. In-situ real time measurements of thermal comfort and comparison with the adaptive comfort theory in dutch residential dwellings. Energy Build. 2018, 170, 229–241. [Google Scholar] [CrossRef]
- Khatoon, S.; Kim, M.-H. Thermal Comfort in the Passenger Compartment Using a 3-D Numerical Analysis and Comparison with Fanger’s Comfort Models. Energies 2020, 13, 690. [Google Scholar] [CrossRef] [Green Version]
- Lee, J.-H.; Kim, Y.-K.; Kim, K.-S.; Kim, S. Estimating Clothing Thermal Insulation Using an Infrared Camera. Sensors 2016, 16, 341. [Google Scholar] [CrossRef] [Green Version]
- Palladino, D.; Nardi, I.; Buratti, C. Artificial Neural Network for the Thermal Comfort Index Prediction: Development of a New Simplified Algorithm. Energies 2020, 13, 4500. [Google Scholar] [CrossRef]
- Cowie, A.R. Numerical Optimisation of Building Thermal and Energy Performance in Hospitals. The University of Leeds, 2017. Available online: https://core.ac.uk/download/pdf/80689144.pdf (accessed on 5 February 2021).
- Grassi, B.; Piana, E.A.; Beretta, G.P.; Pilotelli, M. Dynamic Approach to Evaluate the Effect of Reducing District Heating Temperature on Indoor Thermal Comfort. Energies 2021, 14, 25. [Google Scholar] [CrossRef]
- D’Ambrosio Alfano, F.R.; Olesen, B.W.; Palella, B.I.; Pepe, D.; Riccio, G. Fifty Years of PMV Model: Reliability, Implementation and Design of Software for Its Calculation. Atmosphere 2020, 11, 49. [Google Scholar] [CrossRef] [Green Version]
- Ning, B.; Schiavon, S.; Bauman, F.S. A novel classification scheme for design and control of radiant system based on thermal response time. Energy Build. 2017, 137, 38–45. [Google Scholar] [CrossRef] [Green Version]
- Rhee, K.N.; Olesen, B.W.; Kim, K.W. Ten questions about radiant heating and cooling systems. Build. Environ. 2017, 112, 367–381. [Google Scholar] [CrossRef] [Green Version]
- Feng, J.D.; Schiavon, S.; Bauman, F. Cooling load differences between radiant and air systems. Energy Build. 2013, 65, 310–321. [Google Scholar] [CrossRef] [Green Version]
- Oravec, J.; Šikula, O.; Krajčík, M.; Arıcıc, M.; Mohapl, M. A comparative study on the applicability of six radiant floor, wall, and ceiling heating systems based on thermal performance analysis. J. Build. Eng. 2021, 36, 102133. [Google Scholar] [CrossRef]
- Gwerder, M.; Tödtli, J.; Lehmann, B.; Dorer, V.; Güntensperger, W.; Renggli, F. Control of thermally activated building systems (TABS) in intermittent operation with pulse width modulation. Appl. Energy 2009, 86, 1606–1616. [Google Scholar] [CrossRef]
- De Wit, A.K.; Wisse, C.J. Hydronic circuit topologies for thermally activated building systems—design questions and case study. Energy Build. 2012, 52, 56–67. [Google Scholar] [CrossRef]
- PN-EN ISO 11855-2:2015. Building Environment Design—Design, Dimensioning, Installation and Control of Embedded Radiant Heating and Cooling Systems—Part 2: Determination of the Design Heating and Cooling Capacity; Polish Standardization Committee: Warsaw, Poland, 2015. [Google Scholar]
- Sourbron, M. Dynamic Thermal Behaviour of Buildings with Concrete Core Activation. Ph.D. Thesis, Katholieke Universiteit Leuven—Faculty of Engineering, Leuven, Belgium, 2012. Available online: https://limo.libis.be/primo-explore/fulldisplay?docid=LIRIAS1672631&context=L&vid=Lirias&search_scope=Lirias&tab=default_tab&lang=en_US&fromSitemap=1 (accessed on 5 February 2021).
- Krajčík, M.; Šikula, O. The possibilities and limitations of using radiant wall cooling in new and retrofitted existing buildings. Appl. Therm. Eng. 2020, 164, 114490. [Google Scholar] [CrossRef]
- Krajčík, M.; Šikula, O. Heat storage efficiency and effective thermal output: Indicators of thermal response and output of radiant heating and cooling systems. Energy Build. 2020, 229, 110524. [Google Scholar] [CrossRef]
Figure 1.
View of the considered building.

Figure 2.
Hydraulic diagram of the heating, ventilation and air conditioning (HVAC) system in the building.
Figure 2.
Hydraulic diagram of the heating, ventilation and air conditioning (HVAC) system in the building.

Figure 3.
The test-room: (a) its location (green border); (b) internal view—sensors during assembling.
Figure 3.
The test-room: (a) its location (green border); (b) internal view—sensors during assembling.

Figure 4.
(a) Layout of the room; (b) layout of the temperature sensors. On the right—height above the floor (in meters).
Figure 4.
(a) Layout of the room; (b) layout of the temperature sensors. On the right—height above the floor (in meters).

Figure 5.
External air temperature, relative humidity and global horizontal irradiance during the measurement period.
Figure 5.
External air temperature, relative humidity and global horizontal irradiance during the measurement period.

Figure 6.
Floor temperature during the whole measurement period.

Figure 7.
Vertical profile of internal air temperature: (a) during the whole measurement period; (b) during the transitional week.
Figure 7.
Vertical profile of internal air temperature: (a) during the whole measurement period; (b) during the transitional week.

Figure 8.
Vertical profile of internal air temperature: (a) during the hottest week; (b) during the coldest week.
Figure 8.
Vertical profile of internal air temperature: (a) during the hottest week; (b) during the coldest week.

Figure 9.
(a) Temperature T3; (b) vertical profile of air temperature without 8 points with t > 30 °C.
Figure 9.
(a) Temperature T3; (b) vertical profile of air temperature without 8 points with t > 30 °C.

Figure 10.
Internal air temperaure distribution during the whole measurement period.

Figure 11.
Ventilation, internal air temperature and working hours in the building.

Figure 12.
Vertical profile of the internal air temperature for the working hours: (a) during the whole measurement period; (b) during the transitional week.
Figure 12.
Vertical profile of the internal air temperature for the working hours: (a) during the whole measurement period; (b) during the transitional week.

Figure 13.
Vertical profile of the internal air temperature for the working hours: (a) during the hottest week; (b) during the coldest week.
Figure 13.
Vertical profile of the internal air temperature for the working hours: (a) during the hottest week; (b) during the coldest week.

Figure 14.
Internal air temperature distribution during working hours.

Figure 15.
Average air temperature histograms: (a) all days; (b) working days only.

Figure 16.
(a) Difference between temperatures T9 and T0; (b) percentage share of T9-T0 differences.
Figure 16.
(a) Difference between temperatures T9 and T0; (b) percentage share of T9-T0 differences.

Figure 17.
(a) Local thermal discomfort caused by vertical air temperature difference [19]; (b) calculated percent of dissatisfied during measurement period.
Figure 17.
(a) Local thermal discomfort caused by vertical air temperature difference [19]; (b) calculated percent of dissatisfied during measurement period.

Figure 18.
Air temperature profiles for different heating systems [80] and TABS.
Figure 18.
Air temperature profiles for different heating systems [80] and TABS.

Figure 19.
Internal air temperature and relative humidity against the comfort zones of Leusden and Freymark.
Figure 19.
Internal air temperature and relative humidity against the comfort zones of Leusden and Freymark.

Figure 20.
Operative temperature and air humidity against thermal comfort zones of EN ISO 7730: (a) for the cooling period (blue border); (b) for the heating period (red border).
Figure 20.
Operative temperature and air humidity against thermal comfort zones of EN ISO 7730: (a) for the cooling period (blue border); (b) for the heating period (red border).

Figure 21.
PMV index.

Figure 22.
Cumulative share of the PPD index.

Figure 23.
Measured floor (Tfloor), air (Tair), radiative (Trad), outlet water (Tout) and inlet water (Tin) temperatures on working days: (a) 8 August 2019; (b) 30 October 2019.
Figure 23.
Measured floor (Tfloor), air (Tair), radiative (Trad), outlet water (Tout) and inlet water (Tin) temperatures on working days: (a) 8 August 2019; (b) 30 October 2019.

Figure 24.
Measured floor (Tfloor), air (Tair), radiative (Trad), outlet water (Tout) and inlet water (Tin) temperatures on holidays: (a) 4 August 2019; (b) 10 November 2019.
Figure 24.
Measured floor (Tfloor), air (Tair), radiative (Trad), outlet water (Tout) and inlet water (Tin) temperatures on holidays: (a) 4 August 2019; (b) 10 November 2019.

Figure 25.
Calculated steady state heat flux density from the considered TABS: (a) upwards to the adjacent room; (b) downwards to the space below the TABS.
Figure 25.
Calculated steady state heat flux density from the considered TABS: (a) upwards to the adjacent room; (b) downwards to the space below the TABS.

Figure 26.
Daily cooling and heating energy in the analysed period.

Publisher’s Note: MDPI stays neutral with regard to jurisdictional claims in published maps and institutional affiliations. |
© 2021 by the author. Licensee MDPI, Basel, Switzerland. This article is an open access article distributed under the terms and conditions of the Creative Commons Attribution (CC BY) license (http://creativecommons.org/licenses/by/4.0/).
Share and Cite
MDPI and ACS Style
Michalak, P. Selected Aspects of Indoor Climate in a Passive Office Building with a Thermally Activated Building System: A Case Study from Poland. Energies 2021, 14, 860. https://0-doi-org.brum.beds.ac.uk/10.3390/en14040860
AMA Style
Michalak P. Selected Aspects of Indoor Climate in a Passive Office Building with a Thermally Activated Building System: A Case Study from Poland. Energies. 2021; 14(4):860. https://0-doi-org.brum.beds.ac.uk/10.3390/en14040860
Chicago/Turabian StyleMichalak, Piotr. 2021. "Selected Aspects of Indoor Climate in a Passive Office Building with a Thermally Activated Building System: A Case Study from Poland" Energies 14, no. 4: 860. https://0-doi-org.brum.beds.ac.uk/10.3390/en14040860
Note that from the first issue of 2016, this journal uses article numbers instead of page numbers. See further details here.